gait studies of normal and hallux valgus...
TRANSCRIPT

GAIT STUDIES OF NORMAL AND HALLUX VALGUS
AFFECTED INDIVIDUALS
A Thesis submitted in the
Partial fulfillment for the requirement for
the degree of
Bachelor of Technology
in
Biomedical Engineering
by
UTSAV HANSARIA
110BM0449
Under the supervision of
Dr. A. THIRUGNANAM
DEPARTMENT OF BIOTECHNOLOGY AND MEDICAL ENGINEERING
NATIONAL INSTITUTE OF TECHNOLOGY ROURKELA ROURKELA, ODISHA,
769008 INDIA
December 2014

i
Department of Biotechnology and Medical Engineering
National Institute of Technology Rourkela, Odisha-769008
CERTIFICATE
This is to certify that the thesis entitled “Gait analysis of normal and hallux valgus affected
individuals” is a record of bonafide work done by UTSAV HANSARIA (110BM0449) which is
submitted for partial fulfilment of the requirements for the degree of Bachelor of Technology
(B.Tech) in Biomedical Engineering at National Institute of Technology, Rourkela. To the best
of my knowledge, the matter embodied in the thesis has not been submitted to any other
University/Institute for the award of any Degree or Diploma.
Place: NIT Rourkela Dr. A. Thirugnanam (Supervisor) Date: Assistant Professor
Biotechnology and Medical Engineering
National Institute of Technology,
Rourkela
Odisha-769 008 (India)

ii
Acknowledgement
Successful completion of this thesis is the result of continuous guidance and assistance from
many people, faculty and friends and I am extremely fortunate to have received their help along
the completion of the project.
I owe my profound gratitude and respect to my project supervisor, Prof. A. Thirugnanam,
Department of Biotechnology and Medical Engineering, NIT Rourkela for his invaluable
academic support and professional guidance, regular encouragement and motivation at various
stages of this project.
I place on record my sincere gratitude to Prof. Krishna Pramanik, Head of Department,
Department of Biotechnology and Medical Engineering, NIT Rourkela for her constant
encouragement.
I would like to thank Ms. Tejinder Kaur, Ms. Reshmi Dey, Mr. Shreeshan Jena, Ms.
Chandrika Kumari, Mr. Krishna Kumar Ramajayam, Mr. Kiran Yellappa Vajanthri, Ms.
Sharmila Durairaj, Ms. Pranjali Nanda, Mr. Kumar Prabhu Kalyan, Mr, Umakanta
Nayak and all the volunteers who helped me to complete my project work.
I would also thank my Institution and my faculty members without whom this project would
have been a distant reality. I also extend my thanks to my family, friends, and well-wishers.
Place: NIT Rourkela Utsav Hansaria
Date: 110BM0449
Biotechnology and Medical Engineering
National Institute of Technology
Rourkela-769 008, Odisha (India)

iii
TABLE OF CONTENTS
LIST OF FIGURES ....................................................................................................................... iv
ABSTRACT .....................................................................................................................................v
CHAPTER 1: INTRODUCTION ....................................................................................................1
1.1 OVERVIEW…………………………………………………………………..2
1.2 FORCE PLATE……………………………………………………………….3
1.3 COMMON GAIT PARAMETERS…………………………………………..4
1.3.1 GROUND REACTION FORCE
1.3.2 CENTER OF PRESSURE
1.3.3 CO-EFFICIENT OF FRICTION
1.4 MOMENT OF FORCE…………………………………………………….....6
1.5 MUSCULAR ACTIVITY………………………………………………….…7
1.6 THE METATARSO-PHALLANGEAL JOINT……………………….……..9
1.7 HALLUX VALGUS…………………………………………………………10
CHAPTER 2: LITERATURE REVIEW………………………………………………….……..12
CHAPTER 3: MATERIALS AND METHODS………………………………………………...14
3.1 FORCE PLATE…………………………………………………………………15
3.2 DATA AQUISITION BOARD…………………………………………………15
3.3 BIOWARE SOFTWARE……………………………………………………….15
3.4 GOVERNNG EQUATIONS…………………………………………………...16
CHAPTER 4: RESULTS AND DISCUSSION…………………………………………………18
4.1 GROUND REACTION FORCE………………………………………………...19
4.2 CENTER OF PRESSURE………………………………………………………22
4.3 CO-EFFICIENT OF FRICTION………………………………………………..24
4.4 SUGGESTED REMEDIES……………………………………………………..26
CONCLUSION………………………………………………………………………………….28
REFERENCES………………………………………………………………………………… 30
iv
LIST OF FIGURES
Figure No. Figure Caption Page No.
1. The different phases of a gait cycle. 2
2. Kistler multiaxial force plate (9260AA6) 3
3. Center of pressure in a human when (a) standing on left leg,
(b) Standing on both legs,(c)standing on right leg 5
4. Graph showing the trajectory of co-efficient of static and kinetic
friction. 6
5. Schematic showing the moment of force. 6
6. Graph showing the percentage of maximum force produced by the
muscles at different lengths. 7
7. Graph of force produced by a muscle against the velocity of the muscle
shortening. 8
8. Metatarso-phalangeal joint at (a) 00, (b) 200 , (c)the first metatarsal has
moved down and to the rear (plantar-flexed) to allow flexure of the
1st MPJ beyond 200 . 9
9. Hallux Valgus affected foot. 10
10. The graphs for ground reaction force (z) of the volunteers. 20
11. The graphs for ground reaction force (y) of the volunteers. 20
12. A graph showing the ideal waveform of the GRF of the anterior and
posterior direction (Fy). 21
13. The graphs for center of pressure (x) of the volunteers 22
14. The graphs of center of pressure (y) of the volunteers. 23
15. The graphs of co-efficient of friction (y) of the volunteers. 24 16. The graphs of co-efficient of friction (y) of the volunteers 25

v
ABSTRACT
This study investigated the gait patterns of volunteers affected by hallux valgus and compares the
results with volunteers free from this or any other foot related deformity. The reason for this
study was to analyze the differences in gait patterns from a strictly biomechanical perspective by
studying the various forces acting on a foot during locomotion and to determine the factors
which play a major role in the gait of hallux valgus affected people. The study also aims to
determine the impact of this deformity on the gait patterns of affected individuals, the chances of
injury, potential for adverse impact of this deformity as the person gets older and available
remedial solutions. The primary action studied was a normal walk executed by the volunteers at
a normal walking speed. The various forces generated by the volunteers were measured using a
Kistler’s force platform and the data generated was stored using a data acquisition board (DAQ).
Further analysis of the graphs obtained was done using the Bioware software. The ground
reaction forces, center of pressure, co-efficient of friction were the parameters which were
analyzed and compared for both sets of individuals. The result of the investigation was that gait
of hallux valgus individual gets altered, with a change in the center of pressure, ground reaction
forces and co-efficient of friction as compared to normal healthy subject. The affected
individuals walk was found to be less balanced and jerky. The people who have this deformity
are most prone to ankle and knee injuries with increased risk of falling as the person gets older
and the deformity is aggravated. The treatments methods available, their impact and after-effects
are also considered. Only surgery is a long term solution and the diagnosis and treatment of the
deformity requires a detailed study into every individual case.
Keywords: gait analysis, force platform, hallux valgus, ground reaction force

1
Chapter 1
Introduction

2
Introduction
1.1 Overview
Walking is the most convenient way to commute short distances. Appropriate muscle force and
free mobility in the joints found in normal individuals increases efficiency in walking. Gait
analysis is primarily the study of human locomotion to determine the impact of any deformity,
disease, accidents or surgery and develop appropriate treatment for the same. A single sequence
of movement/functions of a limb is known as gait cycle, which can also be termed as the
fundamental unit of gait. The gait cycle has essentially two phases: the stance phase and the swing
phase (Fig. 1). The stance phase of a limb is where the limb is in contact with the ground. The
swing phase corresponds to the phase where the limb is advancing in the air [1]. The important
requirements for a person during normal walking are equilibrium (the ability to assume an upright
posture and maintain balance), locomotion (initiating and maintaining rhythmic stepping, and
musculoskeletal integrity-normal functioning of bone, joints and corresponding muscles) and
neurological (control-efficient transfer of messages to and from the nervous system movement of
the body).
Figure 1: Different phases of a gait cycle.

3
1.2 Force plate
Force plates also known as force platforms are designed for use in the field of biomechanics to
measure ground reaction forces, center of pressure, co-efficient of friction and a number of other
parameters in states of rest and motion. A force plate can be described as a metallic plate with
multiple sensors attached to it that produce an electrical output in response to force applied on the
plate. Force plates are available in many different varieties depending on the types of sensors used
to generate the electrical output in response to the force applied on it. For example strain gauge,
capacitive gauge and piezoelectric sensors. The force plate used in this study uses four
piezoelectric sensors at the four corners of the square force plate. The force plates using
piezoelectric sensors are ideal for gait analysis because of the following reasons: (i) piezoelectric
sensors do not require any local power source, (ii) they automatically generate electricity
proportionally in response to mechanical stress, and (iii) they are sturdy; provide overload
protection and long term stability. The output voltage of a piezoelectric sensor is given by
V=Q/C …..Eq(1),
where C represents the capacitance of the element and Q represents the charge induced by the
force F in the direction perpendicular to the electrode surface.
Figure 2: Kistler multiaxial force plate (9260AA6)

4
1.3 Measuring Gait Parameters
1.3.1 Ground Reaction Force (GRF)
Ground Reaction Force is the reactionary force applied by the ground on the body in accordance
with Newton’s 3rd law of motion, “Every action has an equal and opposite reaction”. Till the body
is in contact with the ground, the system experiences a set of continuously varying equal and
opposite action-reaction forces, the reaction force being provided by the ground [2]. The
component of GRF perpendicular to the surface is the normal reaction force. The component of
GRF parallel to the surface is the frictional force. The equation to determine ground reaction force
in the z direction is,
GRF (z) = Ma (z) + Mg ….. Eq(2)
where GRF(z) stands for ground reaction force in the z direction, Mg stands for weight of the
object and Ma(z) stands for moment about the z-axis. Similarly equations exist for ground reaction
forces in the x and y directions.
1.3.2 Center of Pressure (COP)
The center of pressure is defined as the point on a body where the summation of a pressure field
acts, resulting in a force and zero moment about that point [2]. Center of pressure is the line of
action of the applied force which can be measured using the moments and forces measured by a
fixed force plate where a force F is applied at a distance X and Y from the center of the force plate.
The force plate with the help of a combination of four transducers will measure the force in the in
the X,Y and Z directions and also the moments of the forces about the X,Y and Z axes. This
information is sufficient to determine the X and Y positions of the center of pressure as follows:
Xcp = -My/Fz. …..Eq (3)
Where Xcp is center of pressure on the X-axis, My is the moment of force in the y direction and Fz
is the force of the body in the Z-direction.
Ycp = Mx/Fz. ….. Eq (4)
5
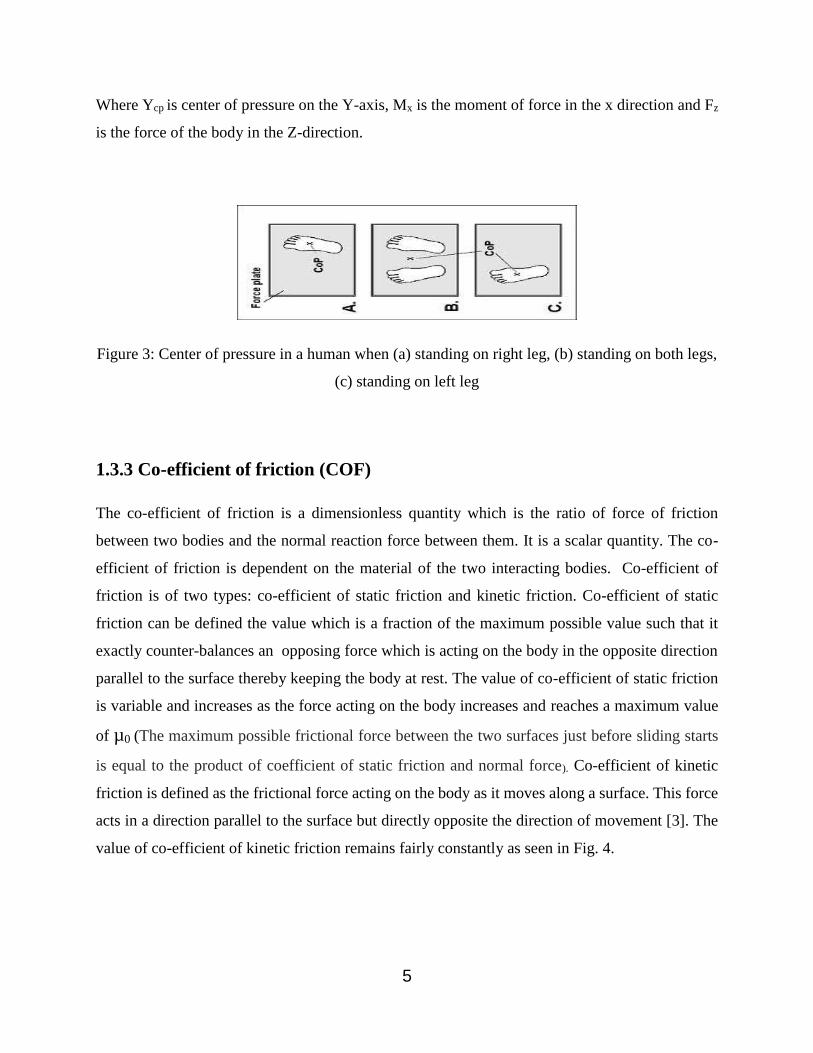
Where Ycp is center of pressure on the Y-axis, Mx is the moment of force in the x direction and Fz
is the force of the body in the Z-direction.
Figure 3: Center of pressure in a human when (a) standing on right leg, (b) standing on both legs,
(c) standing on left leg
1.3.3 Co-efficient of friction (COF)
The co-efficient of friction is a dimensionless quantity which is the ratio of force of friction
between two bodies and the normal reaction force between them. It is a scalar quantity. The co-
efficient of friction is dependent on the material of the two interacting bodies. Co-efficient of
friction is of two types: co-efficient of static friction and kinetic friction. Co-efficient of static
friction can be defined the value which is a fraction of the maximum possible value such that it
exactly counter-balances an opposing force which is acting on the body in the opposite direction
parallel to the surface thereby keeping the body at rest. The value of co-efficient of static friction
is variable and increases as the force acting on the body increases and reaches a maximum value
of µ0 (The maximum possible frictional force between the two surfaces just before sliding starts
is equal to the product of coefficient of static friction and normal force). Co-efficient of kinetic
friction is defined as the frictional force acting on the body as it moves along a surface. This force
acts in a direction parallel to the surface but directly opposite the direction of movement [3]. The
value of co-efficient of kinetic friction remains fairly constantly as seen in Fig. 4.

6
Figure 4: Graph showing the trajectory of co-efficient of static and kinetic friction.
1.4 Moment of force
The tendency of a force to cause a body to rotate about a particular axis is known as the moment
of the force or torque. It is a vector quantity measured in N-m. The magnitude of torque is equal
to the product of force the moment arm where the perpendicular distance between the line of action
of force and the center of moments in known as the moment arm. A clockwise rotation about the
center of moments is taken as positive by convention and an anti-clockwise rotation is given a
negative sign.
. …..Eq (5)
Where τ stands for torque, r stands for the length of the moment arm and F stands for the force
causing the rotational motion.
Figure 5: Schematic showing the moment of force.

7
1.5 Muscular activity
As we walk forward the thigh and hip of the leg in swing phase trail behind, the semi membranosus,
semi tendinosus and biceps femoris muscles which make up the hamstring muscles at the back of
the thigh help in the bending of the knee. The gluteal muscles help in the extension of the hip of
the trailing during a stride. These muscles are worked more by the body while walking on an
incline. Adductor magnus a small muscle at the located at the top of the inner thigh also becomes
active. The force produced by a muscle depends on its length and a graph of the magnitude of force
developed at different muscle contraction levels is shown here in Fig.6.
Fig 6: Graph showing the percentage of maximum force produced by the muscles at different
lengths.
The structural unit of the skeletal muscle is the muscle fiber. Each muscle fiber is a cylindrical cell
1-30 cm in length and 10-100 µm in thickness. They are bundled together in hundreds and
thousands to make one muscle. The muscle fibers are made up of myofibrils which adhere together
by a plasma membrane called the sarcolemma. The contractile unit of a muscle is the sarcomere.
The force generated by a muscle during contraction varies with its length and velocity. The graph
clearly shows that at the maximum and minimum lengths the muscle produces a lower force
compared to an optimal length at which maximum force is produced. The force produced is directly

8
related to the degree of overlap between actin and myosin. Hence, the amount of overlap between
the two filaments is responsible for the magnitude of force produced. At the longer lengths the thin
and the thick filaments do not overlap resulting in formation of minimal number of cross bridges
and low force. At the shorter length the length of the sarcomere gets too short as such the filaments
are unable to slide past one another with ease resulting in a lower force [4]. The relation between
the force produced by a muscle and its instantaneous rate of change of length is shown in Fig. 7.
Fig 7: Graph showing force produced by a muscle against the velocity of the muscle shortening.
The graph was obtained by applying force to a muscle and measuring the velocity of shortening
of its length. When a muscle lifts a weight which is less than its maximum capacity the muscle
shortens. This action is called concentric. If the weight to be lifted decreases then the time taken
for the muscles to contract decreases i.e. the velocity increases. However this lasts until the
maximum contraction velocity is reached where no more force is generated. If the weight to be
lifted is greater than the maximum capacity of the muscle the muscle will be activated but instead
of contracting it will be forced to lengthen. This contraction is called eccentric. Most muscular
injuries occur due to this overloading of the muscles.
The soleus, gastroenemius, plantaris, and tibialis anterior and posterior muscles are engaged as the
foot completes a gait cycle on the floor from heel to toe. As weight of the body is shifted from side

9
to side while walking the quadriceps, tibialis anterior muscle of the lower leg, the gluteus medius
and minimus are also activated [4].
1.6 The metatarsophalangeal joint
The metatarsophalangeal joints (MPJ) are those found in-between the proximal bones and the
metatarsal bones of the toes. The first metatarsophalangeal joint resembles a sliding or hinge joint
i.e. ginglymoarthroidial joint. The first metatarsophalangeal joint is also known as the big toe joint.
Similarly, the fifth metatarsal joint is known as the fifth toe joint. During the functioning of the
forefoot the hallux/big toe dorsiflexes at the 1st MPJ. The head of the first metatarsal bone pivots
against the base of the hallux’s proximal phalanx for the first 200 resembling a hinge joint
movement around its axis, known as the hinge action or the ginglymoidal action. When the foot is
raised at an angle above 200 the first metatarsal bone has to slide against the base of the proximal
phalanx. The head of the metatarsal has to plantarflex and then move backwards before the shaft
of the metatarsal rises further and the foot proceeds towards toe-off [5]. The first
metatarsophalangeal joint is very crucial to movement and as it is a major load-bearing joint any
loss of movement in it causes severe disruption or distortion of biomechanical functions of foot,
mainly locomotion.
Figure 8: Metatarso-phalangeal joint at (a) 00, (b) 200 , (c)the first metatarsal has moved down
and to the rear (plantar-flexed) to allow flexure of the 1st MPJ beyond 200 .

10
1.7 Hallux Valgus:
Hallux valgus (bunions) is a common foot deformity that can result in a lot of pain and can even
restrict locomotion in severe cases. The defining feature of this condition is the inward lateral
deviation of the big-toe, the first metatarsophalangeal (MTP) joint. A deviation of 15-200 upsets
the foot biomechanics and hence is considered abnormal. The deviation of the big toe towards the
smaller baby toe causes a bump to develop on the metatarsophalangeal joint of the big toe
(metatarsal bone) [6]. The symptoms of hallux valgus are irritated skin around the bunion, redness
of the joint, pain while walking and formation of blisters. An X-ray can clearly show the degree
of deformity and also whether there is subluxation of the joint. The deformity can be caused by
prolonged use of tight or ill-fitting shoes or can be congenital [7]. The treatment of the deformity
can be both surgical and non-surgical. The decision to choose either one is dependent on the extent
of the deformity or the discomfort caused. Surgery is generally recommended in cases where pain
is acute and non-surgical procedures are not effective. Low wide fitting shoes with appropriate
padding is a good remedy in most cases accompanied with physiotherapy sessions.
.
Figure 9: Hallux Valgus affected foot.
There is a lack of detailed study on the gait analysis of bunion affected individuals with most
studies focusing on a select area of concern of this condition. The purpose of this study is to
develop a general understanding of the problems affecting individuals affected by hallux valgus

11
by analyzing their gait patterns with the help of a multi-axial force platform and comparing the
results with the gait patterns of a normal healthy individual.

12
Chapter 2
Literature
Review

13
Literature Review Previous Works
Hallux Valgus (HV) can increase the risk of falling by impairing balance in older people. There is
no much information about impact of gait pattern on upper body movements while performing
normal activities like walking and stair ambulation. Data on the tempero-spatial parameters of
head and pelvis during gait and acceleration were obtained in seventy-one people between seventy-
five and ninety-three years old. Adjusting for confounders the study yielded the result that
volunteers with average to extreme extent of hallux valgus show clear signs of reduced step length
and velocity on simple and irregular walking surfaces compared to subjects with hallux valgus of
mild proportions. The study confirms the detrimental impact of hallux valgus on older people
making them vulnerable to falling especially when walking on irregular surfaces [8]. The direct
impact of hallux valgus on mobility was studied in detail in another study. Validated physical
examinations were performed by a trained professional on the volunteers and the data was
recorded. The volunteers were divided into four groups having: i) no HV and no other foot
disorder, ii) no HV but atleast one other foot disorder, iii) HV and atleast one other foot disorder,
iv) HV only. Biomechanical data was obtained for both feet from the volunteers. The posture of
the foot while walking or standing using center of pressure excursion index were calculated. The
study confirmed the alteration of foot loading patterns and pressure profiles and highlighted the
need for further work in the area [9]. Twenty women volunteers were selected as the subject of the
experiment. Their gait pattern data was obtained with the help of magnetic resonance scanner. The
participants simulated their gait movement and image reconstruction was done into virtual bone
datasets. Foot posture was described using parameters such as arch angle, inter-metatarsal angle,
hallux angle. Relative tarsal positional angles were calculated using image sequence which was
registered across gait conditions. The intermetatarsal and hallux angles were found to be greater
with deformity, the change in arch angle is not significant in the groups. Patients undergoing
arthrodesis of the 1st metatarso-phallangeal joint have severe hallux valgus. A study reported the
use of flexible titanium structures along with a titanium staple for immediate protected bearing of
load. The number of patients selected in the study were 156 and the average age was sixty-seven
years. Flexible crossed intermedullary titanium nails were inserted. The incidence of non-union
after arthrodesis was 0.5% and only happened for cases of extreme deformity [10].

14
A sequence of twenty eight subjects with a moderate to extreme hallux valgus deformity and an
intermetatarsal angle of 14° or greater were followed for an average of six years to determine
whether any significant loss of correction occurred after surgery. All subjects were treated with a
proximal metatarsal osteotomy and distal soft tissue procedure. The mean correction of the
intermetatarsal angle was 13.2° (7–20°), and the mean loss of correction after surgery was 1.4°.
The range of correction of the deformity hallux valgus was −2° to 48° with a mean of 26.7° [11].
The average loss of correction was 3.9°. In three cases, the deformity recurred in three other cases,
a hallux varus deformity developed. The surgery success rate was 85%. This study is an indicator
that in most patients affected by hallux valgus with an intermetatarsal angle of 14° or greater, there
is sufficient inherent stability of the first metatarsophallangeal joint such that there is no
requirement for stabilization to obtain a long term result [12].

15
Chapter 3
Materials and
methods

16
Materials and methods 3.1 Force plate
The device used for the study is Kistler’s multi-axial force platform, model number 9260AA6,
Switzerland.
3.2 Data Acquisition Board (DAQ)
The process of sampling signals that measure real world physical conditions and convert these
samples into digital numeric values which can be interpreted and manipulated using a computer is
known as data acquisition. The components of DAQ/DAS are sensors which can convert electrical
signals (physical parameters), signal conditioning circuitry to convert the sensor’s signals into a
form that can be converted to digital values. ADC’s which can convert these conditioned sensor
signals into digitized values. The device used is the DAQ system for Kistler’s multi-axial force
platform, type 5691, Switzerland.
3.3 BioWare software
The software is available for biomechanical applications provide by the Kistler group. BioWare is
the interface for signal conditioning, data acquisition and force plate data analysis, A/D board and
cabling. This software is used for gait analysis, sports training, ergonomics, neurology and general
biomechanical research.
Volunteer1: The subject is suffering from Hallux Valgus.
Volunteer 2: The subject is free from Hallux Valgus or any other foot-related deformity.
Clearance for the project was obtained from the Institute Ethical Committee. The subjects were
informed about the procedure and scope of the study and their consent was obtained.
The volunteers were instructed to walk on the 60 cm x 55cm Kistler’s force platform at normal
walking pace in a 10 second window. In the interest of obtaining greater sample data the volunteers
were instructed to walk in repeated cycles for 10 seconds on the force platform. The ground
reaction forces, center of pressure, co-efficient of friction and torque profiles have been analyzed.
The governing equations fundamental in finding the result are as follows:
17
The experiment was conducted using two volunteers. Volunteer 1 suffers from Hallux Valgus
whereas volunteer 2 is completely free from this or any other foot-related deformity. The
volunteers were instructed to walk at self-selected normal walking pace on a Kistler’s force
platform in a 10 second window. Since walking involves an alternating sequence of single and
double phase gait pattern, the volunteers were instructed to walk in repeating cycles during the 10
seconds. The data was recorded and saved. The volunteers performed the experiment under
standard conditions on a level surface.
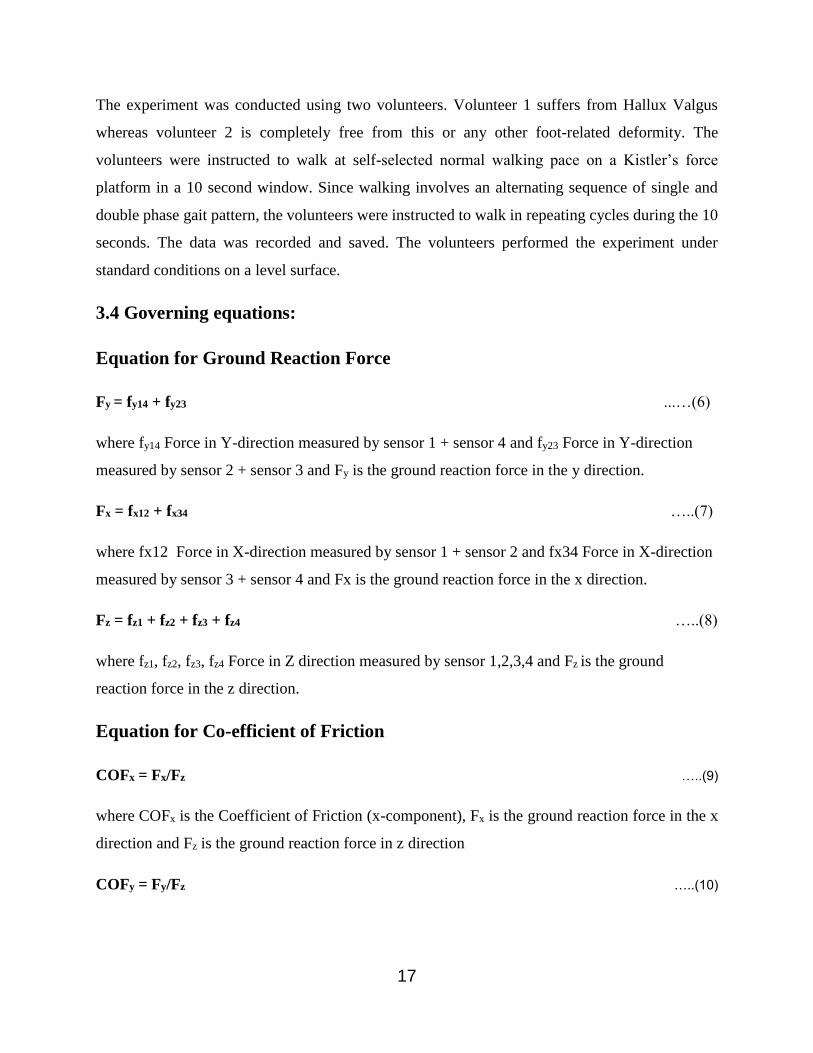
3.4 Governing equations:
Equation for Ground Reaction Force
Fy = fy14 + fy23 ...…(6)
where fy14 Force in Y-direction measured by sensor 1 + sensor 4 and fy23 Force in Y-direction
measured by sensor 2 + sensor 3 and Fy is the ground reaction force in the y direction.
Fx = fx12 + fx34 …..(7)
where fx12 Force in X-direction measured by sensor 1 + sensor 2 and fx34 Force in X-direction
measured by sensor 3 + sensor 4 and Fx is the ground reaction force in the x direction.
Fz = fz1 + fz2 + fz3 + fz4 …..(8)
where fz1, fz2, fz3, fz4 Force in Z direction measured by sensor 1,2,3,4 and Fz is the ground
reaction force in the z direction.
Equation for Co-efficient of Friction
COFx = Fx/Fz …..(9)
where COFx is the Coefficient of Friction (x-component), Fx is the ground reaction force in the x
direction and Fz is the ground reaction force in z direction
COFy = Fy/Fz …..(10)

18
where COFy is the Coefficient of Friction (y-component), Fy is the ground reaction force in the x
direction and Fz is the ground reaction force in z direction.
Equation for Center of Pressure
ax = -My' / Fz …..(11)
where ax is X-Coordinate of force application point (COP), My' is the plate moment about top plate
surface and Fz is the ground reaction force in z direction.
ay = Mx' / Fz …..(12)
where ay is Y-Coordinate of force application point (COP), Mx' is the plate moment about top plate
surface and Fz is the ground reaction force in z direction.

19
Chapter 4
Results and
Discussion

20
The objective was to analyze the difference in the walking patterns of the two volunteers by
studying their ground reaction forces in the X, Y and Z directions. Previous studies on this subject
lacking a clean gait curve indicated that hallux valgus hinders smooth uniform locomotion in the
affected individual. The impact of the deformity increases with age and results in instability in
walking pattern and risk of falling in older people specially when walking on irregular surfaces.
Further analysis of this deformity will be continued in subsequent experiments taking into account
other important gait parameters such as co-efficient of friction, center of pressure and moment of
force around ankle. However the basic experiment will remain the same, a volunteer executing a
predetermined number of gait cycles on a Kistler’s force plate during a period of 10 seconds. The
data being recorded and stored in the system with the help of Bioware software, the DAQ (Data
Acquisition Board) and studied in detail for further analysis.
4.1 Ground Reaction Force
The graph of the ground reaction force (GRF) vs time for the volunteer (Fig. 10) in the Z- direction
(Fz) clearly shows the difference in walking patterns. Volunteer 2 has an expected two peak output
but for volunteer 1, the reading shows aberration throughout the entire gait cycle (Fig 10). The
anomaly as compared to a healthy gait is observed here. For hallux valgus subject the gait cycle
shows at least three prominent peaks as opposed to two peaks in a standard gait cycle. This third
peak arises due to the phenomenon of impact transient [13]. The result of this is the extended
hallux valgus striking the force plate and the volunteer applying his weight through his deformity.
This trait has been regularly observed among people with this deformity. This effect is magnified
when the person is walking fast. The graphs of the volunteer for GRF in the y-direction (Fy) are
analyzed to check for differences in the gait patterns in the anterior and the posterior direction (Fig.
11). As the body moves forward it also moves up and down. The mass of the body speeds up as it
moves downwards and it slows down as it moves up. At the same time there are accelerations in
the forward and backward direction.

21
Figure 10: The graphs for ground reaction force (z) of the volunteers.
Figure 11: The graphs for ground reaction force (y) of the volunteers.
-100
0
100
200
300
400
500
600
700
800
900
1000
FOR
CE
(N)
TIME(seconds)
Ground Reaction Force (Z-direction)
Hallux Valgus Normal Gait
-150
-100
-50
0
50
100
150
FOR
CE
(N)
time(seconds)
Ground Reaction Force (Y-direction)
Hallux Valgus Normal Gait

22
Fig 12: A graph showing the ideal waveform of the GRF of the anterior and posterior direction
(Fy) [12].
The ideal scenario during the stance phase is that the force is applied to the foot is in the backwards
direction and then in the forward direction in the late stance as the body moves forward with
increasing speed. The graph of GRF in Fy direction for the hallux valgus affected individual shows
the small peak which indicates that the body comes to a momentary halt unlike the normal gait
pattern but instead of accelerating in the forward direction there is another negative peak which
means the body again moves downward [14]. This is an indicator of a jerky gait action of the
hallux valgus affected individual which is a common characteristic of this deformity. This has been
suggested as the reason behind the number of people affected by hallux valgus suffering from
arthritis in old age. This is unlike the waveform obtained from the unaffected individual which
conforms to the pattern expected of a person free from such deformity. The positive and negative
areas of each foot landing in this curve were also studied.. Equal positive and negative areas as
those observed for volunteer 2 indicate a constant walking speed [15]. However the graph of
volunteer 1 shows varying positive and negative areas for each foot landing which means the
individual is not walking at a constant speed.
The lateral and medial analysis of gait pattern is done so as to check and characterize the loading
and unloading patterns and postural balances. The graph of the hallux valgus affected individual
shows that the volunteer takes more time than normal to stabilize. The greater stabilization time
Time
e
Time

23
required shows that the bunion’s affected individual find it difficult to balance and sways a lot
more than a healthy individual.
4.2 Center of Pressure
Figure 13: The graphs of center of pressure of the volunteers
The curve of center of pressure are analyzed to study the balance of the human body in the stable
posture. A body is in mechanical equilibrium when the sum of the internal and external forces and
the torques of the forces acting on the body are equal to zero. The ground reaction force acting on
the plantar surface of the foot and the gravitational forces are the major external forces under
consideration here.
-4
-3
-2
-1
0
1
2
3
Ax
(m)
Time(seconds)
Center of Pressure (COP x)
Hallux Valgus Normal Gait

24
Figure 14: The graphs of center of pressure of the volunteers.
Muscle activations and heartbeats are the internal forces which cause perturbations and constantly
vary even in equilibrium unlike the external forces. When no external force acts on the body these
internal forces may cause the body to sway depending upon the intensity of the perturbations [16].
The center of pressure graphs of volunteer 1 are found to exhibit very high variation along the
medial-lateral (X-axis) direction compared to the anterior-posterior (Y-axis) direction. The center
of pressure graphs of both volunteers show a roughly linear tendency along the Y-axis (Fig 14)
which is an indication of smooth transfer of weight from the heel to the toe, in the forward
direction. The graph of the hallux valgus affected person is not completely linear but the reason
for this might be obtained by looking at the lateral-medial graph more closely.
The graph of center of pressure in the medial-lateral direction is a clearer indicator of the
differences in walking patterns between the volunteers. For volunteer 1 the graph records rapid
changes in the vertical axis which means the person is having difficulty balancing as he puts each
foot forward. Hence volunteer 1 will tend to sway from side to side while walking. This
-6
-4
-2
0
2
4
6
8
Ay
(m)
Time(seconds)
Center of Pressure (COP y)
Hallux Valgus Normal Gait
25
phenomenon is observed to be minimum for graph of volunteer 2. This is a natural outcome since
volunteer 1 is suffering from the deformity. The pattern of walk of the hallux valgus affected
individual is not the most comfortable and constantly puts pressure on his ankles and knees. This
sort of gait pattern can cause bone injuries in ankle and knee joints if continued over a long period
of time and as the person gets older.
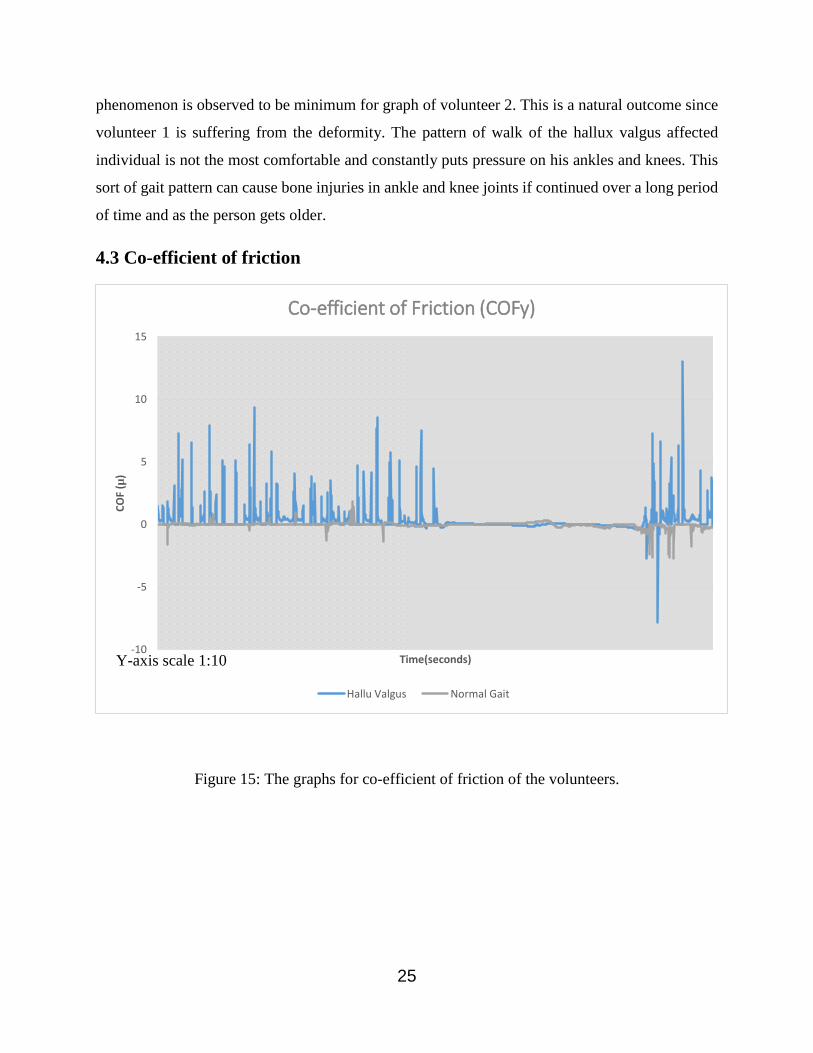
4.3 Co-efficient of friction
Figure 15: The graphs for co-efficient of friction of the volunteers.
-10
-5
0
5
10
15
CO
F (µ
)
Time(seconds)
Co-efficient of Friction (COFy)
Hallu Valgus Normal Gait
Y-axis scale 1:10

26
Figure 16: The graphs for co-efficient of friction of the volunteer.
The pronation and supination of the feet while walking is represented by the curves of co-efficient
of friction. While moving forward the heel has to apply greater frictional force on the ground
compared to that by the toe. During the load acceptance phase, the heel strikes the ground,
overcomes the frictional force and moves forward swiftly to the toe-off phase [17]. This is the
mechanism for a normal gait. The heel pushes on the ground, decelerates the swinging leg applying
resistance to the ground reaction force. For a hallux valgus affected individual the coefficient of
friction is found to be consistently high. This is because of the varying degree and rate of
contraction and relaxation of the muscles which might have become stiff or weak from the
abnormal pressure being put on them by volunteer 1. The value of co-efficient of friction for this
person is found to be around 0.5 or more frequently. This indicates higher friction during
propulsive loading. The lateral side of the foot is pronated as a result of which the ability of the
volunteer to overcome the frictional force is limited [18]. The result is that the hallux valgus
affected person takes longer time to lift his/her foot for moving forward.
-25
-20
-15
-10
-5
0
5
10
15C
OF(
µ)
Time (seconds)
Co-efficient of Friction (COFx)
Hallux Valgus Normal Gait
Y-axis scale 1:10

27
4.4 Suggested Remedies
The permanent treatment of this deformity is possible only through surgery. First x-ray scans ae
done to determine the extent of deformity as mild, moderate, or severe and after taking other factors
into consideration such a age, health, daily activities etc the surgery goes ahead to restore the toe
to a normal position through re-alignment of joints, ligaments, tendons and muscles. The procedure
chosen for mild deformity is bunionectomy where the extended part of the bone is shaved off.
Similar process follows for a moderate case but here the bone is cut closer to the metatarsal bone.
Severe cases require the surgeon to make a cut at the base of the metatarsal bone. The complication
rates vary with the different studies done in this area from 10% to 55% [19]. Non-invasive
treatment involves wearing the right kind of shoe which has sufficient space in the toe-box to
accommodate the deformity. Specially made gel-skinned pads or moleskins provide protection.
Shoe insert help the foot in positioning correctly as it lands on the ground. Cortisone injections
are also recommended for temporary relief from pain but they have some side effects if used
frequently and at concentrated doses.

28
Conclusion

29
Conclusion
The gait analysis of the volunteers yielded the following results. The waveform of the ground
reaction force of hallux valgus affected individual shows a small dorsiflexion moment shortly after
contact. This moment prevents the foot from slapping down during initial contact with the ground.
The walking action is not smooth. The body moves forward in a jerky motion. As the volunteer
moves into the latter half of his stance, a sizeable plantar-flexion moment is generated as main
contributor to the body’s forward progression. Also the affected individual takes more time than
the normal person to stabilize as seen from the graph of GRF in lateral-medial direction. Graphs
of center of pressure also show high variations in the medial-lateral axis as compared to the anterior
posterior direction. This is a clear indicator of difficulty while balancing, every time the volunteer
walks. The graph of co-efficient show a varying rate and degree of contraction and relaxation of
muscles which become stiff or weak from abnormal pressure being put on them. There is higher
friction during propulsive loading and the lateral side of the foot is pronated as a result of which
the ability of the volunteer to overcome the frictional force is limited. Hence a hallux valgus
affected individual walks at a slower pace compared to a normal individual.

30
REFERENCES

31
REFERENCES:
1. Nordin, M. and Frankel V.H., Basic biomechanics of the musculoskeletal system,
Journal of biomechanics vol. 1. 2001: pp. 23-29.
2. Root M.L., Orien W.P., and Weed J.H., Normal and abnormal function of the foot.
Vol. 2. 1977: Clinical Biomechanics Corporation, Los Angeles.
3. Alexander R.M., Energy-saving mechanisms in walking and running. Journal of
Experimental Biology, 1991. 160(1): pp. 55-69.
4. John C.T., Contributions of muscles to mediolateral ground reaction force over a range
of walking speeds. Journal of biomechanics, 2012. 45(14): p. 2438-2443.
5. Kirby K.A., Biomechanics of the normal and abnormal foot. Journal of the
American Podiatric Medical Association, 2000. 90(1): pp. 30-34.
6. Menz H.B and Stephen R. Lord, Gait instability in older perople with hallux valgus,
Foot & Ankle International, June 2005, vol. 26, pp. 483-489.
7. Piirtola M. and Era P., Force platform measurements as predictors of falls among older
people–a review. Journal of Applied Gerontology, 2006. 52(1): pp. 1-16.
8. Galica A.M, Hagedon T.J., Dufour A.B., Hallux valgus and plantar pressure loading:
The Framingham foot study, Vol. 1, 2004, pp. 4-11.
9. Winiarski T., Kucharska S.R., Estimated ground reaction force in normal and
pathological gait. Acta. of Bioengineering & Biomechanics, vol.2, 2009.
10. Barouk, Scarf, L.S., Osteotomy of the first metatarsal in the treatment of Hallux Valgus,
Journal of Foot and Ankle surgery, vol. 2, 1995, pp 171-177.
11. Sharon Dreeben, Roger A.Mann, Advanced Hallux Valgus Deformity: Long-Term
Results Utilizing the Distal Soft Tissue Procedure and Proximal Metatarsal Osteotomy,
Foot and Ankle International, March 1996, vol. 17, pp. 142-144.
12. Hardy R. H. and Clapham J. C.R, Observations on Hallux Valgus, The Bone and Joint
journal, August 1991 vol. 33-B, pp. 376-391.
13. John C.T., Contributions of muscles to mediolateral ground reaction force over a
range of walking speeds. Journal of biomechanics, 2012. 45(14): pp. 2438-2443.
14. Grundy, M., An investigation of the centres of pressure under the foot while walking.
Journal of Bone & Joint Surgery, British Volume, 1975. 57(1): pp. 98-103.

32
15. Cross R., Standing, walking, running, and jumping on a force plate. American Journal
of Physics, 1999. 67(4): p. 304-309.
16. Kay R.M., The effect of preoperative gait analysis on orthopaedic decision making.
Clinical orthopaedics and related research, 2000. 372: pp. 217-222.
17. Hamill, Knutzen J. and Knutzen K.M., Biomechanical basis of human movement.
2006:Lippincott Williams & Wilkins
18. Ward. A., Foot education improves knowledge and satisfaction among patients at high
risk for diabetic foot ulcer. The Diabetes Educator, 1999. 25(4): pp. 560-567.
19. McPoil, Hunt T.G. and Hunt G.C., Evaluation and management of foot and ankle
disorders: present problems and future directions. Journal of Orthopaedic & Sports
Physical Therapy, 1995. 21(6): pp. 381-388