galaxy evolution in compact groups: an infrared perspective
TRANSCRIPT

Noordwijk Oct. 2013 VC
Galaxy Evolution in Compact Groups: an Infrared Perspective
Vassilis Charmandaris
Univ. of Crete & Nat. Obs. Athens, Greece
T. Bitsakis (Univ. of Crete/Caltech), P.N. Appleton, T. Diaz-Santos (Caltech) E. Le Floc’h (CEA/Saclay), G. Magdis (Oxford), E. da Cunha (MPIA)
Papers: Bitsakis et al. 2010 A&A, 517, 75 Bitsakis et al. 2011 A&A, 533, 142 Bitsakis et al. 2013 (in preparation)
UNIV. OF CRETE

Noordwijk Oct. 2013 VC
Galaxies in the Universe: – Field galaxies (Isolated galaxies, ~75% are spirals) – Galaxy clusters (102-104 galaxies, σv~800-1000km/sec, 25% S’s) – Galaxy groups (few to ~10-20 members)
u Loose groups (few galaxies, distances much greater than the sizes of the galaxies, σv~150km/sec)
u Compact groups (few galaxies, distances similar to the sizes of galaxies - similar to the centers of rich clusters, σv~250km/sec, 43% S’s)
Ample evidence across nearly all wavelengths prove that the proximity to companions and/or the gravitational potential of a cluster affect the star formation rate and morphological evolution of galaxies.
– Ram pressure striping in clusters – Tidal interactions of close pairs in groups – Minor merging of dwarf galaxies in groups
No detailed study of the group environment including infrared data has been performed until recently.
Motivation

Noordwijk Oct. 2013 VC
The Compact Group Sample
Hickson Compact Groups (100 groups, 451 galaxies) Definition:
– At least 3 galaxies within 3mags of the brightest one – The angular diameter with no additional galaxies around a group is at
least 3 times the angular size of the group. – Group surface brightness µe < 26 mag arcsec-2
Basic properties: – 31% E’s and 43% S’s (Hickson 1982) – 43% display bridges, tails etc (Mendes de Oliveira et al. 1994) – Indication of interactions in HI maps (Verdes-Montenegro et al. 2001) – 40% host AGN into their nucleus (Shimada 2000; Martinez et al. 2010) – FIR excess & warmer Far-IR colors? (Hickson 1989; Sulentic et al. 1992)
Tidal interactions (strong & minor) occur between the group members

Noordwijk Oct. 2013 VC
The expanded SDSS Group Sample
Sloan Compact Group sample (2218 groups, 9713 galaxies) q Obtain UV (GALEX), near-IR (2MASS) and mid-IR (WISE) for all galaxies:
q The sensitivities (in AB mags) and angular resolutions are:

Noordwijk Oct. 2013 VC
q Increase in the number of groups/galaxies by a factor of 50. q Median redshift of the SDSS sample (1770 groups) z=0.091 (~400 Mpc) q Median redshift of the HCG sample (32 groups) z=0.022 (~95 Mpc)
Comparison of SDSS & HCGs

Noordwijk Oct. 2013 VC
q Field Galaxies – SINGS (75 field galaxies cover a wide range in Hubble type and
luminosities it only contain 4 early-type galaxies) – 9 isolated field elliptical galaxies of Temi et al. (2004) – Local Volume Legacy survey (258 galaxies within a volume of 11Mpc)
q Interacting pairs – 35 nearby early-stage interacting pairs (Smith et al. 2007)
q Field and Group-Cluster galaxies – 1994 field and group-cluster galaxies selected by cross-correlating SDSS
DR4 with GALEX GR3 (Haines et al. 2008)
Comparison samples

Noordwijk Oct. 2013 VC
UV (GALEX/NUV) Optical (SDSS true color) Near-IR (Palomar J)
3.6µm (Spitzer/IRAC) mid-IR (Spitzer/MIPS24) 8µm (Spitzer/IRAC)
Example: HCG79

Noordwijk Oct. 2013 VC
q We use the theoretical model of da Cunha et al. (2008) (MAGPHYS) to fit the theoretical SEDs of the galaxies => need of UV and IR data
q We collected GALEX FUV/NUV, B, R, SDSS(ugriz), JHKs, Spitzer IRAC (3.6, 4.5, 5.8 & 8.0µm) /MIPS24, IRAS 60/100µm, Akari FIS (65, 90, 140 & 160µm)
q Sample of 32 HCGs (135 galaxies) q Herschel PACS & SPIRE data for 28 HCGs (120 galaxies) q Using the model we estimate Mstellar, SFRs, sSFRs, LIR, Av
λobs [μm]
Sample Selection & SED fitting

Noordwijk Oct. 2013 VC
Infrared Imagery of HCG16
Spitzer/IRAC PACS/160µm
Atomic Hydrogen in red – SPIRE 250µm in green
Noordwijk Oct. 2013 VC
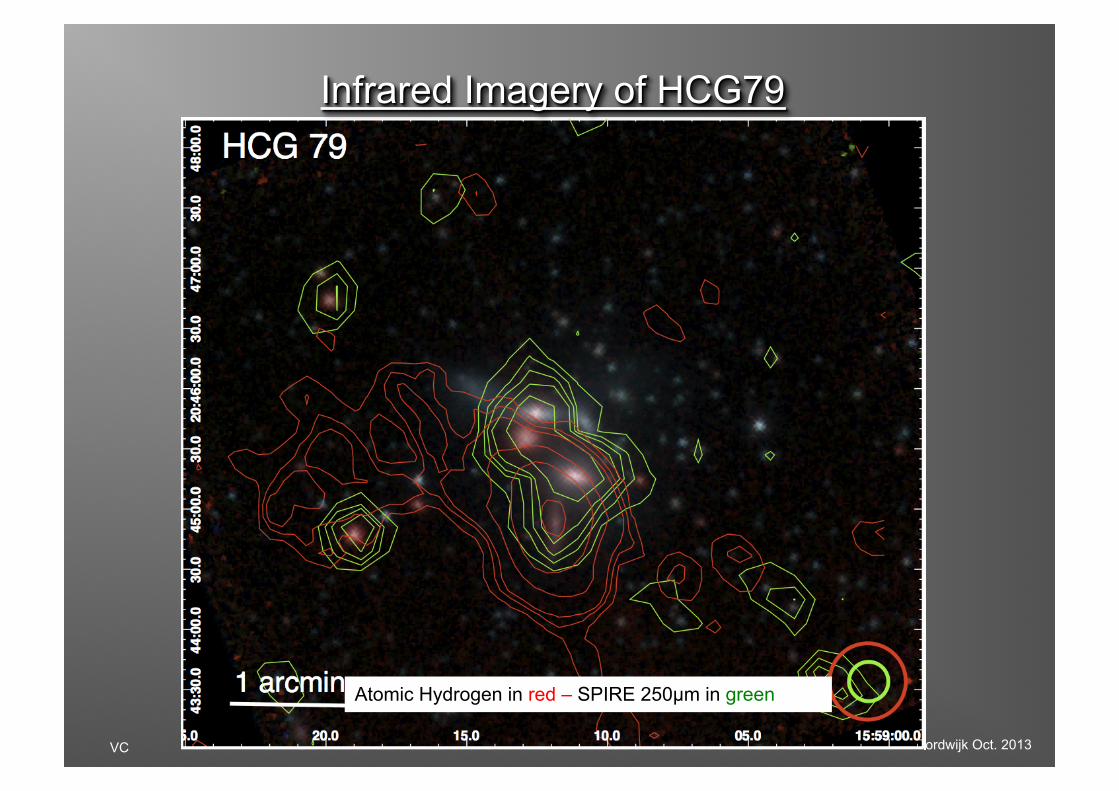
Infrared Imagery of HCG79
Atomic Hydrogen in red – SPIRE 250µm in green

Noordwijk Oct. 2013 VC
Infrared Imagery of HCG92
Atomic Hydrogen in red – SPIRE 250µm in green

Noordwijk Oct. 2013 VC
Importance of far-IR data
Mstar SFR sSFR Tdust Mdust LIR
Herschel

Noordwijk Oct. 2013 VC
q The stellar mass of late-type galaxies is similar to the one in early-types q some early-type galaxies display high SFRs, and few late-types show low SFR q some S’s with low sSFRs, and 8 early-types with sSFRs comparable to E’s q A few (8) early-type galaxies have high AV’s
Mstellar
SFR
sSFR
AV
Physical Properties of HCG galaxies

Noordwijk Oct. 2013 VC
q Verdes-Montenegro et al. (2001) classified the groups based on their HI gas content – Phase 1: HI is located in the galaxy disks – Phase 2: 40-70% is in the disks and the rest has been stripped out – Phase 3: Almost all the HI gas has been stripped out of galaxies
q We classify the groups as dynamically “young” if at least 75% of their
galaxies are late-types, and as dynamically “old” if the fraction of their spiral galaxies is less than this (Bitsakis et al. 2010;2011)
– In dynamically “young” the nearest neighbor is at 37kpc and while in “old” groups the nearest neighbor is closer (26kpc)
– Dynamically “young” groups have σv~132km/sec while “old” have σv~408km/sec – In dynamically “young” groups the median total stellar mass is 1010Msolar while in
dynamically “old” is 1011Msolar
q There is a global agreement between the two methods for 12 out of 14 groups we have in common
Evolutional state of HCGs

Noordwijk Oct. 2013 VC
q The specific SFRs of late-type galaxies in “young” HCGs are similar to interacting pairs and field galaxies
q The specific SFRs of late-type in “old” groups are 3 times lower =>The galaxies had time to consume gas and increase their stellar mass
Late-type Galaxies in HCGs

Noordwijk Oct. 2013 VC
q Compare our HCG sample with a field & a cluster galaxy samples of Haines et al. (2008) q Field galaxies are mostly star-forming (>60%), while cluster galaxies are mostly
passively evolving (>50%) q HCGs are mostly passively evolving. Most galaxies within “green valley”
Star forming
Passively evolving
UV-optical colors I (comparison sample)

Noordwijk Oct. 2013 VC
q Based on a KS test we find no statistically significant difference in the NUV-r colors distribution of the early- and late-type group galaxies hosting AGN, compared to the whole sample.
UV-optical colors II - AGNs

Noordwijk Oct. 2013 VC
Blue cloud
Green valley Red sequence
q In dynamically “young” groups, 40% late-type galaxies are within the “green valley”, probably because of the extinction
q In dynamically “old” groups, 65% of late-type galaxies are located within the “green valley”, because of dust extinction, old stellar population, gas stripping
UV-optical colors III - HCGs (observed)

Noordwijk Oct. 2013 VC
q We can use the Hα line EW in the SDSS spectra to classify the galaxies as late-type (spirals, starbursts of Irregular) if EW(Hα) >2Angstrom, and early-type if EW(Hα)<2.
q Compare this with morphology measurements (sersic index) of Simard et al. (2011) and set the threshold to n=3.3, to obtain ~80% consistency. Apply this thresshold to all galaxies in the sample. We find 73% of groups as dynamically old and 27% as young. (69% and 31% in HGC)
Morphological Classifications of SDSS groups

Noordwijk Oct. 2013 VC
q The separation of early- and late-type in the NUV-r color space as a function of their dynamical state is also very similar to the one we found for the HCG sample.
UV and Optical colors (II)
Blue cloud
Green valley Red sequence

Noordwijk Oct. 2013 VC
q Intragroup dust is not detected directly in the PACS, SPIRE maps q Unlikely dust to be clumpy.
Diffuse Cold Dust in the IGM (1) q We calculate the “synthetic” IRAS 60/100µm flux densities of each HCG and
compare them with the observed ones (Allam et al. 1996) q We find four groups with over 3σ difference in the presence of excess
60/100µm flux, evidence of intragroup dust.

Noordwijk Oct. 2013 VC
Diffuse Cold Dust in the IGM (2) q Estimating the dust mass is uncertain due to strong dependence on T and β
HCG16

Noordwijk Oct. 2013 VC
q The classification of the evolutionary state of compact groups according to the fraction of late-type members appears to be physical and in agreement with previous classifications.
q In dynamically “young” groups the late-type galaxies have similar SF properties and colors with field and early stage interacting pair spirals.
q In dynamically “old” groups the late-type galaxies display lower sSFRs and redder UV-optical colors since multiple past interactions increased their stellar mass and stripped gas out of their disks. On the other hand, 25% of the early-type galaxies in these groups display bluer colors and enhanced SFRs possibly due to gas accretion from other group member as well as merging of dwarf companions
q No evidence of AGN feedback in the groups.
q Evidence of cold but diffuse dust in the intragroup medium (~10% of total dust)
We conclude that the group environment accelerates the formation of stars into galaxies. Early-on galaxies display similar SF properties to those of early-stage interacting pair galaxies. However, as the time evolves, multiple interactions have as a result to increase the stellar mass of late type galaxies and as a consequence to decrease their sSFR.
Conclusions