galileo probe battery system - nasa€¢ galileo probe was the first spacecraft to enter and measure...
TRANSCRIPT
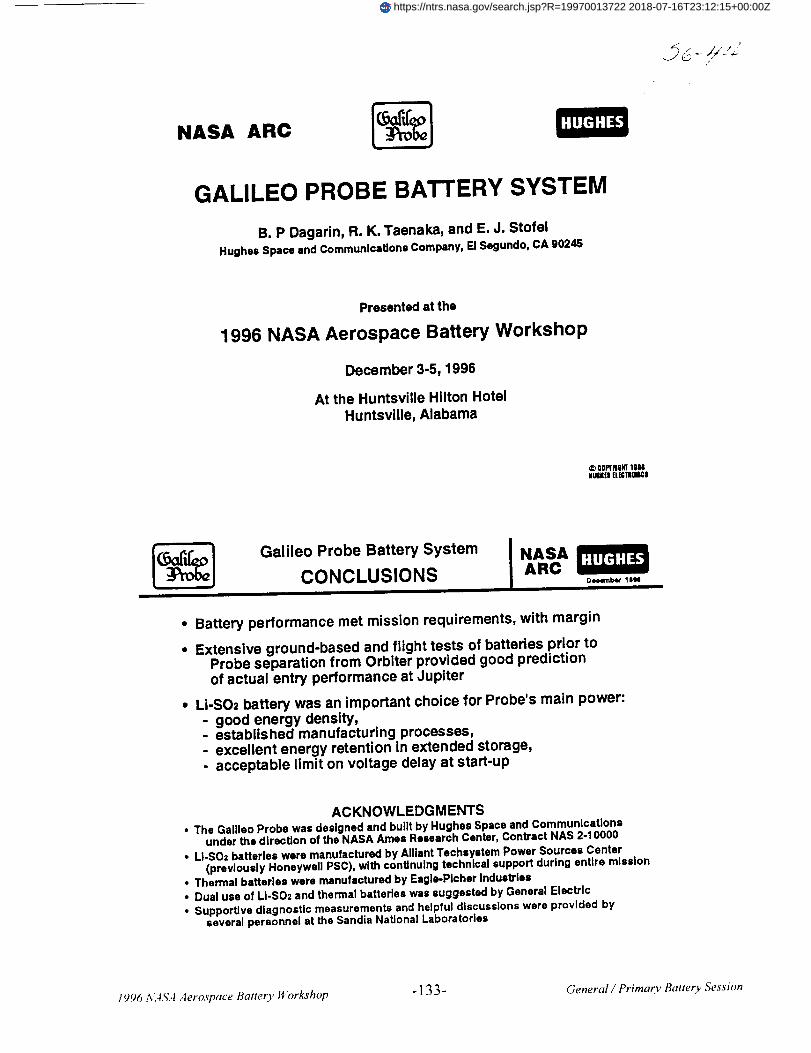
NASA ARC
GALILEO PROBE BATTERY SYSTEM
B. P Dagarin, R. K. Taenaka, and E. J. StofelHughes Space and Communications Company, El Segundo, CA 90245
Presented at the
1996 NASA Aerospace Battery Workshop
December 3-5, 1996
At the Huntsville Hilton Hotel
Huntsville, Alabama
_' COP'LN0_ 1006N_0|! [L[|TIOIICI
Galileo Probe Battery System
CONCLUSIONSNASAARC
HUGHES
• Battery performance met mission requirements, with margin
• Extensive ground-based and flight tests of batteries prior toProbe separation from Orbiter provided good predictionof actual entry performance at Jupiter
• Li-SO= battery was an important choice for Probe's main power:- good energy density,- established manufacturing processes,- excellent energy retention in extended storage,- acceptable limit on voltage delay at start-up
ACKNOWLEDGMENTS• The Galileo Probe was designed and built by Hughes Space and Communications
under the direction of the NASA Ames Research Center, Contract NAS 2-10000
• LI-SO2 batteries were manufactured by Alliant Techsystem Power Sources Center(previously Honeywell PSC), with continuing technical support during entire mission
• Thermal batteries were manufactured by Eagle-Picher Industries• Dual use of LI-SO2 and thermal batteries was suggested by General Electric
• Supportive diagnostic measurements and helpful discussions were provided byseveral personnel at the Sandia National Laboratories
/ 996 A,_4S,,I Aerospace Battery Workshop - ] 3 3- General / Primary Battery Session
https://ntrs.nasa.gov/search.jsp?R=19970013722 2018-07-16T23:12:15+00:00Z

Galileo Probe Battery System NASAGALILEO PROBE MISSION ARCI_membet lille
ii
• Galileo Probe was the first spacecraft to enter and measurean outer planet atmosphere
• There was a 6-hour pro-entry and entry operation in addition tothe l-hour atmospheric descent on the main parachute
• 6 sclence Instruments measured various atmospheric parameters
• Data was telemetered to the Orbiter spacecraft, which laterrelayed the data to Earth (In non-real time)
1977 -1979-81 -
1982-86 -1981-88 -
1989(oct) -
SCHEDULE
Program approved by CongressFabrication of principal Probe hardwareNASA made several revisions to launch schedule
Multiple rebuilds of Li-SO2 batteriesLaunch by Shuttle, with Probe attached to Orbiter
1989-95 - Cruise, via Venus+Earth+Earth Gravity Assist (VEEGA)
1995(Jul) - Probe separated from Orbiter, for trajectory divergence1995(Dec) - Jupiter Encounter
The Galileo Probe required an internal source of electrical power. The source was required to remain
quiescent for several years with minimum loss of stored energy, then be activated to drive the scientific
instruments and the radio transmitter for a few hours as the Probe approached and then entered the Jovian
atmosphere. Primary batteries were ideal for this application.
The Li/SO 2 batteries were built by Honeywell Power Sources Center, in Horsham, Pennsylvania
(recently renamed Alliant Techsystems). Because the Galileo Program was very ambitious, several times
during its development the launch schedule was postponed. Most of these were due to difficulties in provid-
ing an adequate launch vehicle for the mission. None of these delays were ever due to any problems with thebatteries--nevertheless, with each Program delay new Li/SO2 batteries were fabricated so that the freshest
possible units would be available for the revised launch schedule. Thus, battery manufacturing and testing
was repeated several times at Alliant. The ftrst acceptable flight units were from manufacturing Lot 3, the
final units, as used for the actual Galileo flight, were from Lot 10. While most of the intervening lots
demonstrated adequate performance during their respective lot qualification tests, it is interesting to note that
Lots 3 and 10 showed the best performance. The commonalty between these two great lots was the fact that
their electrolyte was mixed by hand rather than by a mechanized batch mixer that was common to the inter-
vening lots.
The thermal batteries were built by Eagle Picher Industries in Joplin, Missouri. Development of thesehad included a redesign of the header insulation. The batteries of manufacturing Lot 6 passed all qualifica-
tion tests well. Because of the Galileo Program delays, there were recertification tests run on samples ofthese thermal batteries, but these tests showed that there was no need to rebuild fresher batteries.
1996 NASA Aerospace Battery Workshop - 134- General / Primary Battery Session

Fly-by Gaspara Asteroid
Fly-by
_i, ¢-Jul '95: Probe /
\ \ \ Release /"_ \ \ /- Dec '95: Arrival/
_.X /" at Jupiter_
The VEEGA mission was devised by JPL in 1986 as an alternate to the originally planned direct route
to Jupiter. That direct route had to be abandoned after the required Centaur upper stage was declared unsuit-
able for use with any future Shuttle launch--it was deemed to be potentially too dangerous by the commit-
tee that conducted the in-depth NASA safety review that had followed the disastrous launch attempt of the
Challenger Shuttle in January 1986. Upon the acceptance of the VEEGA alternative, the transit time from
Earth to Jupiter escalated from the 2 years that had been planned for the Centaur driven direct transit to a
6 year VEEGA journey following a circuitous route of approximately 2.4 billion miles.
The tripling of the transit duration was a real concern to the battery engineers--there were insufficient
data available at that time to assure that Li/SO2 batteries would remain fully viable for such a long dura-
tion. We initiated a life-time assessment study at Sandia National Laboratories (SNL) under the direction of
Dr. Sam Levy, using representative sample cells subjected to a variety of elevated temperatures. That
comprehensive and enlightening study is documented in SNL Report No. SAND88-2218.UC-94C. The
shelf life changes found by the SNL work indicated a worse case loss of no more than 0.04 Ah/yr, assum-
ing a 6 year temperature of 0°C, the temperature expected for the VEEGA transit. This was considerably
more optimistic than the 0.2 Ah/yr assumption that had been used until that time. This represented a
substantial reduction in the estimate of the battery capacity loss, giving the battery engineers and the Probe
Program Office a great deal of confidence in the stability of our primary power system.
1996 NASA Aerospace Battery WorLshop - 135- General / Primary Battery Session

8 As Probe approached Jupiter, .. LI-SO2 battery turned on, Dy nmsr," "- -,,_, 6 hr before Juplter encounter ....,.
Probe arrived st Jupiter, al_
Hlgh-G.deceJeretlon , .,.../i_,"as emlospnem. : :'." - -.WaS encounl[ereo " - -.
(at E + 0 rain) " " -
Pilot parachute deployed "-.(E+1.8mln)
DEPLOYMENTSEQUENCE
OF THEGALILEO PROBE
FOR ENTRYINTO THEJOVIAN
ATMOSPHERE
NASAARC
Decmmber ltN
Aft cover removed'',(E+I .g mln)
Main parachute deployed ',(E+1.9 rain) _ \\_11//
,,Heat shield dropped off,
•::::: (E+2.1 re|n) ;::l ......... ,:._,...,.• .... , , - ....... ::,: - _,...,_
, ..., "-.,.Telemetr of d _ "• . _ y ate, _'-r'_, _......... :.':._ _.., ... tJ3roughatmosphere <C":_-:n.... "::_..3._::: to the Orbiter '_ _ V ..... ,
:":............ G-........._:>:_.._: ..... ,.......... , "_ ._._.\.!.....:_ _..... .. ,., ,",:. _.........._.,.
":""'_'_ "_"';?;'.i:.-::":_, _ ......."--.-_'-"_
'':'::_"_""""_'"'_"_ _"i_:'".. ""'_: Probe mission terminate .r__'"'"'•.) ( E._I rain) :_,.-('.I_::_,.j?JV " _'''
Y &
The Probe was separated from the Orbiter near midnight on July 12, 1995. The Probe was released on
a ballistic trajectory toward its target zone on Jupiter at 6.57 deg + 0.5 deg north latitude near the night-day
terminator with an entry flight path angle of -8.6 deg + 1.4 deg. We were well within the tolerance on
both parameters.
Before Probe release, the modest power requirements of the Probe had been supplied by the attached
Orbiter through an umbilical cord. After release, all Probe power was supplied by its on-board batteries. For
the subsequent 5 month Coast phase the only significant electrical load was the on-board clock, set to
awaken the Probe's electronics 6 hours prior to Encounter. The clock was set just before Probe release. It
ran from only battery Module 3, leaving the other two modules undisturbed. The 5 month wake-up
occurred with precision_within 18 seconds of the nominal time even though a tolerance of 8.6 minutes
would have been permiaed.
The Probe functioned flawlessly throughout the Coast and the Pre-Entry Periods. All of the Coast and
the fLrst 5.5 hours of the Pre-Entry period were single string operations. Initial turn-on, at Entry-6 hr, was
the time at which the three battery modules underwent their battery clean-up (or depassivation) of thelithium anodes.
At the atmospheric Encounter, the Probe survived entry deceleration and its heating very nicely but was
53 seconds late in deploying the main parachute. This was due to a harness wiring error_the thermal and
Li/SO2 batteries satisfied all their Entry deployment functions properly.
The parachute controlled Descent phase operated well, with the Li/S02 batteries providing all required
power. The Probe achieved a depth equivalent to 24 bars pressure before we lost our RF link due to extreme
temperature and pressure on the RF transmitter. This Probe performance exceeded our core mission require-
ment, which had been merely to reach at least 10 bars.
1996 NASA Aerospace Battery Workshop - 13 6- General / Primary Battery Session

NASAARC_loeml=er 1011$
LOCATION OF THEBATTERIESWITHIN THE
GALILEO PROBEDESCENT MODULE
Diameter of Descent Module
= 32 Inches
Note:
The Descent Module was launched
within Its Entry Heat Shield, whichhad external dimensions of:
I In.
Total Weight of Probe = 747 lb.(Deeclmt Module end Heat Shield)
3 LI-SO,Battery Modules
(Mounted on SPIU end DCP)
Thermal Batteries(Behind LRD, NEP, and ASI)
_ Forward direction
The descent module was designed and built by Hughes Space and Communication Company. A major
subcontractor was the General Electric Re-Entry Systems Division (now part of Lockheed-Martin) who
designed and built the deceleration subsystems, i.e., the heatshields, separation mechanisms, and the
parachutes.
The descent module was designed to be as compact as possible to minimize the size and therefore the
weight of the surrounding heat shield. The electronics and all other components therein were very densely
packaged. The mechanical design of the battery modules provided a conformal shape to match the limited
space. It also provided mechanical ruggedness to survive Entry deceleration along with thermal isolation
during discharge to protect sensitive surrounding electronics.
The Probe's science instrument compliment and principle investigators are:
Neutral Mass Spectrometer: Hasso Niemann, NASA-GSFC
Helium Abundance Detector: Ulf von Zahn, Univ. of Rostock, Ktihlungsborn, Germany
Atmospheric Structures Instrument: Mvin Seiff, San Jose State Unix'. Foundation, San Jose, CA
Nephelometer: Boris Ragent, San Jose State Univ. Foundation, San Jose, CA
Net Flux Radiometer: Larry Sromovsky, Univ. of Wisconsin, Madison, W1
Lightening & Radio Emissions Detector: Louis Lanzerotti. Lucent Labs., Murray Hill. NJ
Energetic Particle Instrument: Harold Fischer, Univ. of Kiel. Kiel, Germany
Doppler Wind Experiment: David Atkinson, Univ. of Idaho, Moscow. ID
The science instrument package weighed 66 lb, 24% of the 278 lb descent module.
The three Li/SO 2 modules weighed a total of 16.5 lb, 6% of the total desccnt modulc. Each of these
battery modules was 2.8 in. by 3.5 in. by 14.0 in.
1996 NA,%I Aerospace Battery Workshop - 13 7- General / Primary Batter y Session

NASA HUGHESARC
Do,oo_mhlr 1NIl
SCHEMATICCIRCUIT OF
GALILEO PROBELi-SO2 BATTERY
3 modules Inparallel for theProbe battery
13 cells In seriesin each module
Bypass diodeacross each cell
--<_o- Indicatu
series and parallelredundant switch
-o,,'o.-'o- Indicates
series 0nlyredundant switch
To voltage telemetry G-Switchcircuits for: Module #3 -J--
Module sl _Module 01 P
ilta
M .l. Mot.l.T
MainBus
Loads
CoastTimer
se
PyroBus
The Probe power subsystem was a simple but well planned design with careful effort put forth to
assure that the Li/SO2 battery modules were provided the utmost protection from detrimental effects of any
inadvertent single part failure. Special attention was given to circuit failures that might prevent any module
from being coupled to the mission loads under command or that might inadvertently drain any battery
module prior to the Probe's arrival at Jupiter. The above schematic battery circuit shows locations of key
redundant series+parallel switches.
The modules were also designed with internal by-pass diodes across each cell so as to prevent the loss
of a complete module if any one of its constituent cells would have failed due to an open circuit, an abnor-
mal capacit:/loss, or by any other means.
Each module was equipped with two sets of electrical connectors: a power connector and a test/by-pass
connector. The latter permitted fusing, as a safety precaution, during all ground-based system tests.
Furthermore, whenever the by-pass fused plugs were physically removed, the modules became disarmed so
that it was impossible to discharge any of them even if a power switch had been closed inadvertently during
any test operation. As final preparation before launch, at the launch site, the fused by-pass plugs were
removed; and hard wired plugs substituted. After that time, the three module power connectors provided
direct access, without fusing, to the above indicated switches leading to the Probe's power bus.
Just prior to launch, as well as multiple times during the preceding ground tests, we measured the wire
harness between the modules and the power relays under applied system voltage to verify that any current
leakage was less than 150 hA. This low leakage requirement was especially important for assuring that any
external battery drain during the 6 year transit from Earth to Jupiter would be negligible.
1996 NASA Aerospace Battery Workshop - 1 3 8- General / Primary Battery Session

Galileo Probe Battery System
THERMAL BATTERYi
NASAARC
Deoembor 111115i
Used as the energy source to firethe large, staging pyrotechnics forrelease of heat shield and parachute
Two independent thermal batteries onProbe, each with two electrically parallelcell stacks, thus providing redundancy
Each thermal battery activated by firingits internal squibs (two, for redundancy)using energy from LI-SO2 battery
Ca and CaCrO4 Electrodes
KCI+LICI Eutectic ElectrolyteZr+BaCrO4 Thermal Paper
Storage Temperature = Room
Activation Temperature > 400 C(above the melting temperature of KCI+LICI)
Battery Voltage = 37 V (open circuit)
Current requirements:
6 pulses, ranging from 5.3 A to 15.9 A,each 22 ms Jnduration, distributedsequentially within an Interval of 13 s
Negative PositiveTerminal Terminal
D
= Squ.!bs (2). Ac.tlv.atlon
mr mermal Mon,[oractivation
', I _14 Cells---- In series
-.£....,.T_.
I4 Ceilsin series
m
1-.... - =
Hermetically Sealed Container
The Ca/CaCrO4 thermal batteries were used for the sole purpose of supplying the few large current
pulses required for firing the pyrotechnic pressure cartridges that jettisoned the heat shields and deployed the
parachute. The use of these supplemental, single purpose batteries avoided placing large pulses on the main
power bus which could otherwse have had a deleterious impact on the Probe's command sequencer.
The two miniature squibs within each thermal battery were redundant, fired sequentially from an 8-cell
tap on each of the three 13-cell Li/SO2 modules. The later three modules operated in parallel, for redun-
dancy. The demand for the pulsed power to activate the large cartridges occurred within an interval of less
than a minute, so thermal batteries were the logical choice for this application. They remained hot. and
therefore active, for longer than was necessary to satisfy the pulsed current requirements.
Systems development tests demonstrated that a small, resistive load connected continuously across the
activated thermal batteries aided the maintenance of their voltage stability during the pulsed load demands.
The thermal batteries had more than enough capacity to supply that small continuous load as well as the
large pulses.
The performance of the thermal batteries during the actual descent of the Probe into the Jovian atmo-
sphere was not monitored directly--their rise in voltage and their all important current pulses would have
been too rapid to have been recorded at the low data rate that had been allocated for monitoring functions
within the Probe. However, from our analysis of the overall flight data we can deduce that the thermal
batteries performed their required function, releasing the heat shield and parachute upon demand.
1996 NASA Aerospace Battery Workshop - 13 9- General / Primary Battery Session

Galileo Probe Battery System I NASAFLIGHT & LABORATORY DATA ARC °.._,.._HUGHES
FLIGHT DATA OF BUS VOLTAGE COMPARED WITH LABORATORY TESTOF SIMILAR BATTERY SYSTEM DURING 7 hr MISSION SEQUENCE FDAT
_- Clean-up sequence • 75 _ for 0.016 e; 600 _ for 0.10 s; 11.$6_ for 10 s; 1.44 A for 10 =, for teat• \ • 0.35Afortost ,_-,-1.52Ato=_ 1.4SAfllght <- 0.$ A for test -> ,Batteryi---_;/ 0,44 A for flight l'l'_j I 8,6 A fU_lht <- -> 4.5 A fll_lht ='1 ],oed =
40 _: ..... ,_ < <, < <,< <,< <,< <, - •
=- i _ _ _ _ ¢4 N o_ _i _ ,e _ <PyroPulm, fortest
_4 * xxxX
xxxxxxXxXXXX xI I ' ' ' ' ' I
.w!
20[--------4'; ......Clean {0 1 2 3 4 5pul_P_eP----- Time (hr)(beforeentry)
n._lf I I I I ,A
o lo =0 3o 40 so-, - Time (mln)
X X X Data from Right, 7 Dec 1095 LatteronW)-
Right Descent Antecedent Test (FDAT), Feb 1996, at ATS,using 3 parallel Lot 10 modulo= after multi-year aging
| I
60 70 8(im
To say that we were pleased with the performance of our Li/S02 battery modules on December 7,
1995, would be an understatement. They performed precisely as predicted.
The solid line in the above graph represents the performance of three similar battery modules in a
real-time laboratory simulation of the 6-hour Pre-entry and the hour of Descent. This was the concluding
portion of the Flight Descent Antecedent Test (FDAT), a test executed to simulate total flight performance
in real time as closely as practical and thereby provide a useful tool for predicting flight performance. The
test modules were from the same manufacturing lot as the flight modules. Their temperature was controlled
meticulously the entire time after manufacture to mimic the temperature history of the flight modules
during the Launch, Cruise, Coast, Pre-entry, and Descent phases of the Probe's mission. The Coast phase
simulation lasted 155 days, including a simulated clock load. The FDAT was completed on February 21,
1995_in sufficient time before the Probe's release from the Orbiter (July '95) to permit analysis of the
FDAT data and to consider their systems operational implications.
Our two voltage data points from the Pre-entry flight time matched the FDAT predictions very well.
The first flight point is a little low, as expected because the flight load was slightly larger than the FDAT
load at the equivalent time. On the other hand, the Descent voltage profile from flight was slightly higher
than that from the FDAT, due to both lighter loads in flight and a higher temperature beginning at
Entry+30 minutes. The jump in flight voltage at = Entry+47 minutes was due to the loss of RF String B
and the resultant decrease in bus loads of 4.1 A.
We believe that the flight Li/SO 2 battery had sufficient remaining energy to have lasted, even if full
load had been maintained, to reach our predicted battery operation duration of Entry+76 minutes.
1996 NASA Aerospace Battery Workshop - 140- General/Primary Batter); Session

Oa,,,ooProbe a,,er,S,s,emI"'"FLIGHT& LABORATORY DATA ARCDe.tuber INQ
i
FLIGHT DATA OF BUS VOLTAGE COMPARED WITH LABORATORY TESTS'--OF4 SIMILAR BATTERIES DURING THEIR 7 hr MISSION SEQUENCE LOAD TESTS
_" Clean-up sequence = 75 .(1 for 0.015 a; 600 ._ for 0.10 e; 9.66 _ for 10 s; 1.44 A for 10 s, for test
• \ , 0.35 A for test >,_---r-1.52 A l_st; 1.45 A flight <- 9.6 A for tsst -> _, BatteryI----_.. '0.44 A for fli_lht I_,, 8.6 A flight'<- -> 4.S A flight J't Leeds
4o-----'/ ..... _" '_ <' _ ,_"_ ,c'< _',c <' " '
- "- xxxx
_.!
20---_ ...... i_ ,, ,,, , , , , , ,Clean I0 1 2 3 4 S 610 10 20 30 40 50 60 70 8(•"u_es J'-----'-- T!me (hr) _,_ Time (mln)P' (balore ontPy) X X X Data h'om Right, 7 EN¢ 199S _elmr ontryJ
Descent Antecedent Test, Feb 1995, with multi-year aged Lot 10
...... Reel Time Qualification Test, Aug 1988, with $-month aged Lot 10
-k---+- Accelerated Time Qualification Test, Mar 1988, artificially aged Lot 10
• - - Aged Modulo Eval,,-tlon, Dec 1987, with mural-year aged Lot3
35
o 30>
m 25
T1_s inw_resting graph compares the fl_ght data with the resu]ts of several preceding laboratory hat/cry
tests. The solid line is for the FDAT, our best ground simulation of flight conditions, as explained with the
preceding graph. The line with the slanted stripe pattern is the Real Time Lot 10 Qualification Test,
completed 6 months following manufacturing. It had a real time simulation of the 5 month Coast interval.
However, the preceding simulation of the 5.5 year Cruise phase was highly accelerated_a 1.1 All
discharge (over 4.5 hr) of each of the three module to approximate the capacity loss estimated for 5.5 years
of quiescent storage. The line with periodic crosses depicts the result of the even faster Accelerated Lot 10
Qualification Test wherein a 60 hr, 6.0 Ah discharge of only Module 3 was used to simulate capacity loss
for all modules for both the Cruise and the Coast phases. The dotted line is the result of testing Lot 3
modules which had been quiescently stored for several years as an approximation for the Cruise phase (but
without the precise temperature control used for the Lot 10 FDAT). Following this Cruise approximation,
the Lot 3 modules had a real time, 5 month Coast simulation with the standard clock load. No accelerated
loads had been applied to those Lot 3 modules prior to the discharge depicted in the above graph.
One can clearly see the difference in voltage response (to the 9.6 A ground test simulation of the
Descent load) between the Real Time and the Accelerated Lot 10 Qualification Tests. This difference was
common to every lot for which their testing had included both versions of time simulations. This provides
a clear justification for real-time system level testing for this electrochemical system. This 7 to 8 minute
difference in time to reach the 27 V lower limit for satisfactory systems operation is significant for its
importance to the mission performance prediction, as it represents 10% of the critical Descent portion of the
mission.
1996 NA,%I Aerospace Batter), Workshop - 141 - General / t'rimarv Batter), Session

NASAARCHUGHES
leQQ
MODULECURRENTSFOR FINAL
PART OF THELABORATORY
FLIGHT DESCENTANTECEDENT
TEST( in February, 1995 )
Total Battery Current
"I 1.S2 A >: 9.60 A
MODULE _=s
DISCHARGE _=oFOR FINAL ..PART OF THE .=15
LABORATORY _ loFLIGHT DESCENT = s_
ANTECEDENT '=TEST
( In February, 1995 )
Totld Battery Current
i 0.35 A. > 1.52 A > Jl
S.0 S.S II.0 .... 6.$ 7.0 .... 7.1
Time (h). from turn-On for: O mMod 1; Z_ =Mod'2; _ =Mod 3; O =Bull
9.JO A
These two graphs illustrate the efficiency of our Probe battery system in terms of sharing current as
well as delivering ALl capacity. The top graph depicts how Module 1 and Module 2 supplied most of the
current during the 9.6 A Descent phase of the FDAT simulated mission. Module 3 had already expended
more than half of its capacity supporting the clock during the real-time 155-day Coast phase, yet during the
Descent phase even that module was still able to contribute all of its remaining energy to the common bus.
The Descent phase of this FDAT concluded when each of three modules simultaneously reached the same
limit in their capacity, as can be seen by comparing the delivered Ah results in the lower graph. This was
the expected result, arising from the parallel design of the three-module battery.
The CrSSs-over (i.e., the wave pattern in the top graph) of the currents that were supplied individually
by Module 1 and Module 2 during Descent was a pattern noted throughout the several discharge tests at
Honeywell (Alliant) and was also seen the during systems test on the Probe. We believe this also occurred
in flight (but individual module currents were not monitored in flight)---it answers the question of why the
temperatures (which were monitored in flight) of the two modules differed in their rate of change.
Module 2's flight temperature initially rose at the faster rate but then slowed down. Module 1 at f_rst rose
slowly but ended with a more rapid rate. By the end of the 60 minutes of available flight Descent data, both
modules had arrived at similar temperatures, indicating by that time they had supplied equal amounts of
integrated Ah during their respective discharges, another aspect of the expected response for modules
connected in parallel.
1996 NASA Aerospace Battery Workshop - ]42- General/Primary Battery Session

1996 NASA Aerospace Battery Workshop - 143- General / Primary Battery Session

1996A_4S,4 Aerospace Batter), Wor]c_hop