gaming and lodging primer€¦ · gaming & lodging primer . m o r g a n s t a n l e y r e s e a...
TRANSCRIPT

Gaming & Lodging Primer M O R G A N S T A N L E Y R E S E A R C H North America Morgan Stanley & Co. LLC Thomas Allen [email protected] 212 761 3356
Mark Savino [email protected] 212 761 8576
Chaodan Zheng [email protected] 212 761 8215
May 9, 2017
Morgan Stanley does and seeks to do business with companies covered in Morgan Stanley Research. As a result, investors should be aware that the firm may have a conflict of interest that could affect the objectivity of Morgan Stanley Research. Investors should consider Morgan Stanley Research as only a single factor in making their investment decision.
For analyst certification and other important disclosures, refer to the Disclosure Section, located at the end of this report.
Stock recommendations and disclosures in this report are as of May 9, 2017; stock prices as of May 8, 2017, unless otherwise noted.
Image Source: Shutterstock
May 9, 2017 10:42 PM GMT

M O R G A N S T A N L E Y R E S E A R C H
1
Gaming & Lodging May 9, 2017
Gaming
Image Source: Shutterstock
M O R G A N S T A N L E Y R E S E A R C H
2
Gaming & Lodging May 9, 2017
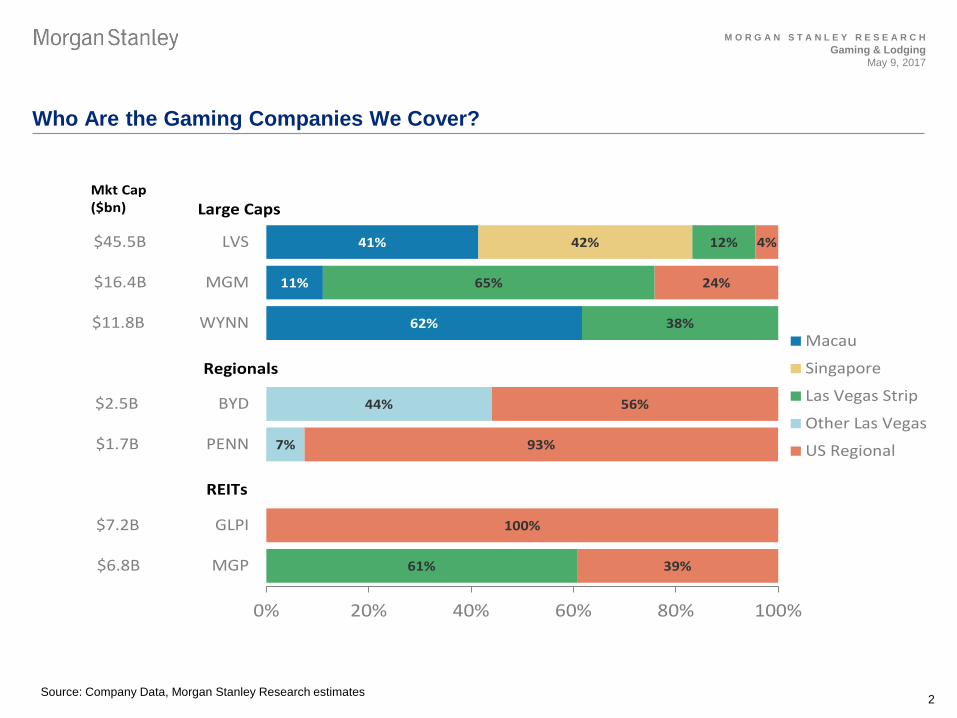
Who Are the Gaming Companies We Cover?
Source: Company Data, Morgan Stanley Research estimates
62%
11%
41% 42%
61%
38%
65%
12%
7%
44%
39%
100%
93%
56%
24%
4%
0% 20% 40% 60% 80% 100%
$6.8B MGP
$7.2B GLPI
$1.7B PENN
$2.5B BYD
$11.8B WYNN
$16.4B MGM
$45.5B LVS
Macau
Singapore
Las Vegas Strip
Other Las Vegas
US Regional
Mkt Cap($bn) Large Caps
Regionals
REITs

M O R G A N S T A N L E Y R E S E A R C H
3
Gaming & Lodging May 9, 2017
Ratings / Theses
• WYNN (OW) Outperformance driven by Macau strength, and greater market share, supported by new property opened Aug ‘16
• MGM (OW) Continued Vegas momentum, strong performance in Macau, an improving balance sheet, and attractive valuation
• BYD (OW) Regional gaming inflection, driven by acceleration in consumer spending, improving LV locals, and expense mgmt.
• LVS (EW) Well positioned LT, but most exposed to competition in Macau; also risk from potential slowdown in Singapore
• PENN (EW) Regional gaming inflection, but don’t own real estate and relative valuation less attractive than BYD, competitive risk
• GLPI (EW) High dividend yield; acquisitive growth opportunity; Risks: tenant concentration and interest rates
• MGP (EW) High dividend yield; unique acquisition opp through MGM ownership; Risks: tenant concentration and interest rates
M O R G A N S T A N L E Y R E S E A R C H
4
Gaming & Lodging May 9, 2017
Macau
Companies Impacted: US Coverage LVS MGM WYNN
HK Coverage* Galaxy Entertainment (0027.HK) Melco Resorts & Entertainment (MLCO.O) SJM Holdings(0880.HK) Sands China (1928.HK) MGM China Holdings (2282.HK) Wynn Macau (1128.HK)
* Covered by Morgan Stanley analyst Praveen Choudhary

M O R G A N S T A N L E Y R E S E A R C H
5
Gaming & Lodging May 9, 2017
What is Macau? A Special Administrative Region (SAR) of China, similar to Hong Kong
Source: Magellan Geographix, Morgan Stanley Research
M O R G A N S T A N L E Y R E S E A R C H
6
Gaming & Lodging May 9, 2017
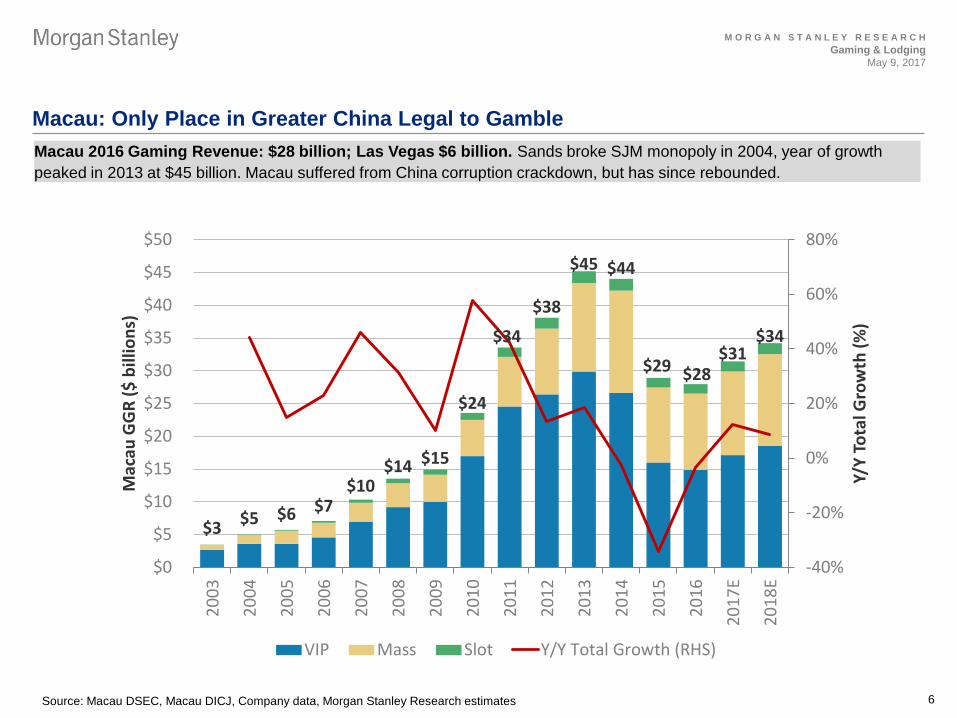
Macau: Only Place in Greater China Legal to Gamble Macau 2016 Gaming Revenue: $28 billion; Las Vegas $6 billion. Sands broke SJM monopoly in 2004, year of growth peaked in 2013 at $45 billion. Macau suffered from China corruption crackdown, but has since rebounded.
Source: Macau DSEC, Macau DICJ, Company data, Morgan Stanley Research estimates
$3 $5 $6 $7 $10
$14 $15
$24
$34
$38
$45 $44
$29 $28 $31
$34
-40%
-20%
0%
20%
40%
60%
80%
$0
$5
$10
$15
$20
$25
$30
$35
$40
$45
$5020
03
2004
2005
2006
2007
2008
2009
2010
2011
2012
2013
2014
2015
2016
2017
E
2018
E
Y/Y
Tota
l Gro
wth
(%)
Mac
au G
GR
($ b
illio
ns)
VIP Mass Slot Y/Y Total Growth (RHS)

M O R G A N S T A N L E Y R E S E A R C H
7
Gaming & Lodging May 9, 2017
Macau: Market is >90% Gaming. Within Gaming, Two Sub-segments, VIP and Mass
Source: Macau DSEC, Macau DICJ, Company data, Morgan Stanley Research estimates
LT structural bull case focuses on growth in the mass market, recent trends have VIP growing faster than mass VIP Market Mass Market
Number of tables: ~1,600
2016 win/table/day: ~$25,500
2016 growth: -7%
Margins: 10-15%
Top 5 VIP Properties (based on 2016 gross revenue) Galaxy Cotai (Galaxy) Wynn Macau (WYNN) City of Dreams (MPEL) MGM Macau (MGM) Grand Lisboa (SJM)
Number of tables: ~4,850
2016 win/table/day: ~$6,500
2016 growth: +1%
Margins: ~40%
Top 5 Mass Properties (based on 2016 gross revenue) Galaxy Cotai (Galaxy) Venetian Macau (LVS) City of Dreams (MPEL) Sands Cotai Central (LVS) MGM Grand (MGM)
$1 $1 $2 $2 $3 $4 $4 $6$8
$10$14
$16
$11 $12 $13 $14
$0
$5
$10
$15
$20
$25
$30
$35
2003
2004
2005
2006
2007
2008
2009
2010
2011
2012
2013
2014
2015
2016
2017
E20
18E
Mac
au G
GR
($ b
illio
ns)
Mass
$3 $4 $4 $5$7
$9 $10
$17
$25$26
$30$27
$16 $15$17 $19
$0
$5
$10
$15
$20
$25
$30
$35
2003
2004
2005
2006
2007
2008
2009
2010
2011
2012
2013
2014
2015
2016
2017
E20
18E
Mac
au G
GR
($ b
illio
ns)
VIP

M O R G A N S T A N L E Y R E S E A R C H
8
Gaming & Lodging May 9, 2017
Macau Drivers / Headwinds
Fundamental drivers 1. China macro / sentiment 2. Hotel room / gaming capacity – significant new supply opened / opening in 2015-2018
3. Infrastructure improvement – Ferry terminal expansion (May 2017), high speed train (2019), rail extension to Hengqin (2018 for the first phase), and Macau-Zhuhai-HK car bridge (2H18)
4. Junket liquidity and availability of capital
Regulatory Risk
1. Anti-corruption campaign – Intensity likely peaked and has re-based the market
2. Cutback of China capital outflows / UnionPay card usage – Illegal devices were banned end of June 2014; Pawn shops were removed from casino floors in December 2014; ATM withdrawal limits enforced in December 2016; Ongoing risk of pawn shop monitoring and/or further restrictions
3. Transit visa restrictions – Tightened in late 2014, but have since been relaxed
4. Smoking ban – Partial ban effective Jan 1, 2013; Full ban on mass floors on Oct 6, 2014; Full smoking ban (including VIP areas) effective January 1, 2019 (but lounges allowed)
5. License renewal beyond 2020/22
6. Table cap – # of tables capped at ~6,500, growing at 3%. New Cotai projects have receive 100 incremental tables initially and an extra 25 in year 2 and year 3.
Liquidity Risk 1. Regulatory crackdown, increasing regulations, junket thefts, and weaker China macro trends all hurt junket liquidity
2. Limited visibility on junkets’ balance sheets and velocity of payment 3. Junkets have consolidated, where the largest 3 have 80% of market share
Competition 1. New supply could result in more competitive promotional environment 2. Potential competitive impact from casinos in Australia, Taiwan, Korea, Cambodia, and
Philippines

M O R G A N S T A N L E Y R E S E A R C H
9
Gaming & Lodging May 9, 2017
Macau: Spend per Visitor vs. Visitation
Source: Macau DSEC, Macau DICJ, Company data, Morgan Stanley Research estimates
Visitation long-term driver, spend per visitor more meaningful short-term driver
Macau Visitation Trends
11.9
16.718.7
22.0
26.8
22.921.8
25.028.0 28.1 29.3
31.5 30.7 31.0
0
5
10
15
20
25
30
35
2003
2004
2005
2006
2007
2008
2009
2010
2011
2012
2013
2014
2015
2016
Visi
tors
to M
acau
(in
mill
ions
)
Mainland China Visitors Non-Chinese Visitors
Macau Spend/Visitor Trends
• In 2015 (weakest year), visitation dropped 3% while spend/visitor declined 33%
• YTD, visitation +6% and spend/visitor +7%
• Mainland Chinese 66% of Macau visitors, Hong Kong 21%
• 41% of visitors are same-day
• 39% of visitors stay at a hotel
-40%
-30%
-20%
-10%
0%
10%
20%
30%
40%
50%
60%
2004
2005
2006
2007
2008
2009
2010
2011
2012
2013
2014
2015
2016
y/y
Gro
wth
in S
pend
per
Vis
itor (
%) Mass Spend/Visitor
Total Spend/Visitor

M O R G A N S T A N L E Y R E S E A R C H
10
Gaming & Lodging May 9, 2017
Macau: Significant Supply Recently Opened/Opening
Source: Macau DSEC, Macau DICJ, Company data, Morgan Stanley Research estimates *Note excludes smaller properties like The XIII and Macau Legend
There are currently 36 casinos in Macau. 2 additional sizeable properties opened in 2016 (Wynn Palace and the Parisian), 2 more are expected to open up between now and 2018. These properties will generate a 14% increase in 4/5 star hotel rooms in the market. *
Current Macau PropertiesProperty Operator Tables Rooms LocationSands Macau LVS 274 289 PeninsulaVenetian Macau LVS 626 2,900 CotaiFour Seasons LVS 100 379 CotaiSands Cotai Central LVS 503 5,800 CotaiParisian LVS 404 3,000 CotaiWynn Macau WYNN 441 1,010 PeninsulaWynn Palace WYNN 333 1,706 CotaiMGM Macau MGM 421 582 PeninsulaAltira MPEL 129 216 TaipaCity of Dreams MPEL 495 1,461 CotaiStudio City MPEL 195 1,600 CotaiTaipa Square Casino MPEL 46 356 TaipaRio Casino Galaxy - Satellite 80 450 PeninsulaWaldo Casino Galaxy - Satellite 35 162 PeninsulaPresidente Casino Galaxy - Satellite 15 265 PeninsulaBroadway Galaxy 38 320 CotaiGalaxy StarWorld Galaxy 250 509 PeninsulaGalaxy Cotai (Phase I & II) Galaxy 750 2,250 CotaiCasino Lisboa SJM 172 1,000 PeninsulaGrand Lisboa SJM 407 413 PeninsulaOceanus Casino SJM 180 110 PeninsulaCasa Real Casino SJM - Satellite 48 381 PeninsulaGrandview Casino SJM - Satellite 20 425 TaipaPharoah's Palace Casino SJM - Satellite 123 439 PeninsulaKam Pek Casino SJM - Satellite 24 - PeninsulaGolden Dragon Casino SJM - Satellite 85 483 PeninsulaGreek Mythology Casino SJM - Satellite - 554 TaipaEmperor Palace Casino SJM - Satellite 77 320 PeninsulaFortuna Casino SJM - Satellite 58 342 PeninsulaPonte 16 SJM - Satellite 109 408 PeninsulaMacau Jockey Club Casino SJM - Satellite 4 404 TaipaL'Arc Macau SJM - Satellite 170 301 PeninsulaDiamond Casino SJM - Satellite 33 NA PeninsulaCasino Babylon SJM - Satellite 23 516 PeninsulaJimei Casino SJM - Satellite 47 416 PeninsulaCasino Lan Kwai Fong SJM - Satellite 84 162 Peninsula
New Target CostProperties Opening ($mm) RoomsGalaxy Macau Phase 2 5/27/2015 $2,065 1,400MPEL Studio City 10/27/2015 2,300 1,600Wynn Palace 8/22/2016 4,100 1,700Sands Parisian 9/13/2016 3,000 3,000MGM Cotai 4Q17 3,300 1,500SJM Lisboa Palace 2H18 3,871 2,000

M O R G A N S T A N L E Y R E S E A R C H
11
Gaming & Lodging May 9, 2017
Macau Debate #1: What is the True Underlying Demand for Macau? Gaming Revenue Penetration by Country Macau Visitor Penetration by Region
Source: Company data, Morgan Stanley Research estimates. Note: Visitor penetration based on percentage of urban population that visited Macau in 2015.
0.5%0.8%0.8%0.8%1.0%1.0%1.0%1.0%1.0%1.1%1.1%1.2%1.4%1.4%1.6%1.8%1.9%2.0%
2.3%2.4%2.4%2.6%
3.6%12.1%
13.1%
0% 2% 4% 6% 8% 10% 12% 14%
ShandongAnhuiHebei
Inner MongoliaTianjinHenan
SichuanShaanxiJiangsu
LiaoningShanxi
HeilongjiangChongqing
JilinZhejiang
BeijingJiangxiHubei
HunanShanghaiGuangxi
ChinaFujian
GuangdongLas Vegas
$745 $259 $222 $108 $102 $102 $36 $12
1.01%
0.35%
0.63%
0.33%
0.19% 0.19%0.12%
0.25%
0.00%
0.20%
0.40%
0.60%
0.80%
1.00%
1.20%
$0
$100
$200
$300
$400
$500
$600
$700
$800
Australia US Italy Spain Sweden UK MacauMass
MacauTotal
Gaming Revenue / Adult Mass Mkt Rev as % of GDP
TOTAL DEVELOPED MARKET AVERAGE = 0.39%

M O R G A N S T A N L E Y R E S E A R C H
12
Gaming & Lodging May 9, 2017
Macau Debate #2: Will Expansion Drive Stronger Market Growth?
Source: Nevada Gaming Control Board, Morgan Stanley Research
We look to the expansion of Las Vegas as a precedent…
Three major supply waves in Las Vegas all resulted in an acceleration of market growth (12% CAGR during these periods vs. Las Vegas long-term 4% CAGR)
Margins came under pressure as promotional spending ramped, but impact proved to be temporary
Las Vegas Strip($ in millions) 1993 1994 . . . 1999 2000 . . . 2004 2005 2006Gaming Revenue $2,897 $3,485 $4,489 $4,806 $5,334 $6,036 $6,689
y/y growth 10.3% 20.3% 17.7% 7.1% 12.0% 13.2% 10.8%
Room Supply (avg) 81,288 87,307 114,830 122,282 130,993 132,345 132,896y/y growth 6.0% 7.4% 7.0% 6.5% 1.8% 1.0% 0.4%
Positions (avg) 58,314 63,142 74,291 75,419 72,800 73,535 71,067y/y growth 9.5% 8.3% 10.2% 1.5% -2.0% 1.0% -3.4%
Visitation 23.5 28.2 33.8 35.8 37.4 38.6 38.9y/y growth 7.5% 19.9% 10.5% 6.0% 5.2% 3.2% 0.9%
Win / Positon / Day $136 $151 $166 $175 $201 $225 $258y/y growth 0.8% 11.1% 6.8% 5.5% 14.3% 12.0% 14.7%
Win / Visitor $123 $124 $133 $134 $143 $156 $172y/y growth 2.7% 0.3% 6.6% 1.0% 6.4% 9.7% 9.9%
Win / Room / Day $98 $109 $107 $108 $112 $125 $138y/y growth 4.1% 12.0% 10.1% 0.5% 9.9% 12.0% 10.4%
Hotel Occupancy 92.6% 92.6% 92.1% 92.5% 92.0% 91.8% 93.2%y/y growth 4.3% 0.0% 2.0% 0.4% 2.7% -0.2% 1.5%

M O R G A N S T A N L E Y R E S E A R C H
13
Gaming & Lodging May 9, 2017
Macau Debate #3: What Will the Chinese Economy and Government Do?

M O R G A N S T A N L E Y R E S E A R C H
14
Gaming & Lodging May 9, 2017
Las Vegas
Companies Impacted: MGM
WYNN LVS CZR (not covered)

M O R G A N S T A N L E Y R E S E A R C H
15
Gaming & Lodging May 9, 2017
Las Vegas: Understanding the Revenue Mix
Source: Company data, Morgan Stanley Research estimates
The Las Vegas market has become significantly less dependent on gaming over the last ~40 years
60%
35%
13%
29%
25%
24%
2%15%
0%
10%
20%
30%
40%
50%
60%
70%
80%
90%
100%
1970 2016
Las Vegas Strip Revenue Mix
Gaming Rooms Food & Beverage Other
M O R G A N S T A N L E Y R E S E A R C H
16
Gaming & Lodging May 9, 2017
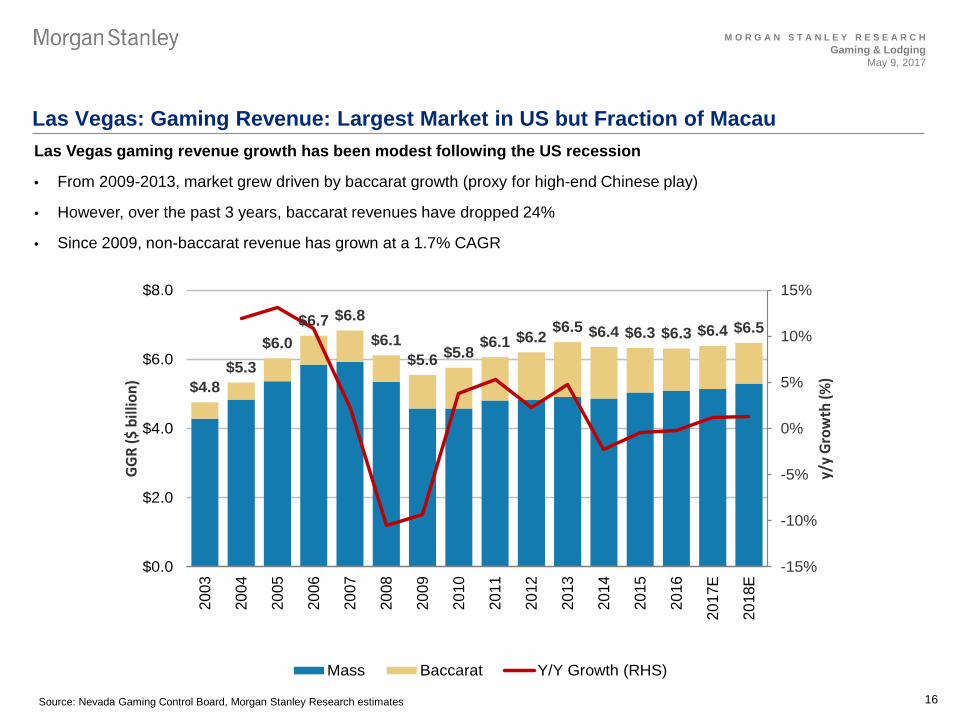
Las Vegas: Gaming Revenue: Largest Market in US but Fraction of Macau Las Vegas gaming revenue growth has been modest following the US recession
• From 2009-2013, market grew driven by baccarat growth (proxy for high-end Chinese play)
• However, over the past 3 years, baccarat revenues have dropped 24%
• Since 2009, non-baccarat revenue has grown at a 1.7% CAGR
Source: Nevada Gaming Control Board, Morgan Stanley Research estimates
$4.8$5.3
$6.0$6.7 $6.8
$6.1$5.6 $5.8 $6.1 $6.2 $6.5 $6.4 $6.3 $6.3 $6.4 $6.5
-15%
-10%
-5%
0%
5%
10%
15%
$0.0
$2.0
$4.0
$6.0
$8.0
2003
2004
2005
2006
2007
2008
2009
2010
2011
2012
2013
2014
2015
2016
2017
E
2018
E
y/y
Grow
th (%
)
GGR
($ b
illio
n)
Mass Baccarat Y/Y Growth (RHS)

M O R G A N S T A N L E Y R E S E A R C H
17
Gaming & Lodging May 9, 2017
Las Vegas: Room Revenue: Lack of Supply Growth Should Drive Strong RevPAR Growth
-2%
-1%
0%
1%
2%
3%
4%
5%
6%
7%
2008 2009 2010 2011 2012 2013 2014 2015 2016
Vegas Supply Growth US Supply Growth
Source: Company data, Thomson Reuters, STR, Morgan Stanley Research
Oversupply
Undersupply

M O R G A N S T A N L E Y R E S E A R C H
18
Gaming & Lodging May 9, 2017
Las Vegas: More Room to Grow
Source: Company data, LVCVA, Morgan Stanley Research
• In 2016, overall US hotel RevPAR was +24% above prior peak
• Average Vegas RevPAR was still -6% below prior peak
• However, given the lack of recent supply growth, Vegas RevPAR growth in 2016 was +8%, outperforming US +3%
3%
8%
0%
1%
2%
3%
4%
5%
6%
7%
8%
US Vegas
2016
Rev
PAR
Gro
wth
(%)
$66
$119
$81
$112
$0$20$40$60$80
$100$120$140$160$180$200
US Vegas US Vegas
Aver
age
RevP
AR ($
)
Prior Peak - 2007 2016
(6)% below prior peak
+24% above prior peak

M O R G A N S T A N L E Y R E S E A R C H
19
Gaming & Lodging May 9, 2017
US Regionals
Companies Impacted: BYD PENN PNK (not covered) ISLE (not covered) MCRI (not covered)
CHDN (not covered) ERI (not covered) RRR (not covered) NYNY (not covered)
M O R G A N S T A N L E Y R E S E A R C H
20
Gaming & Lodging May 9, 2017
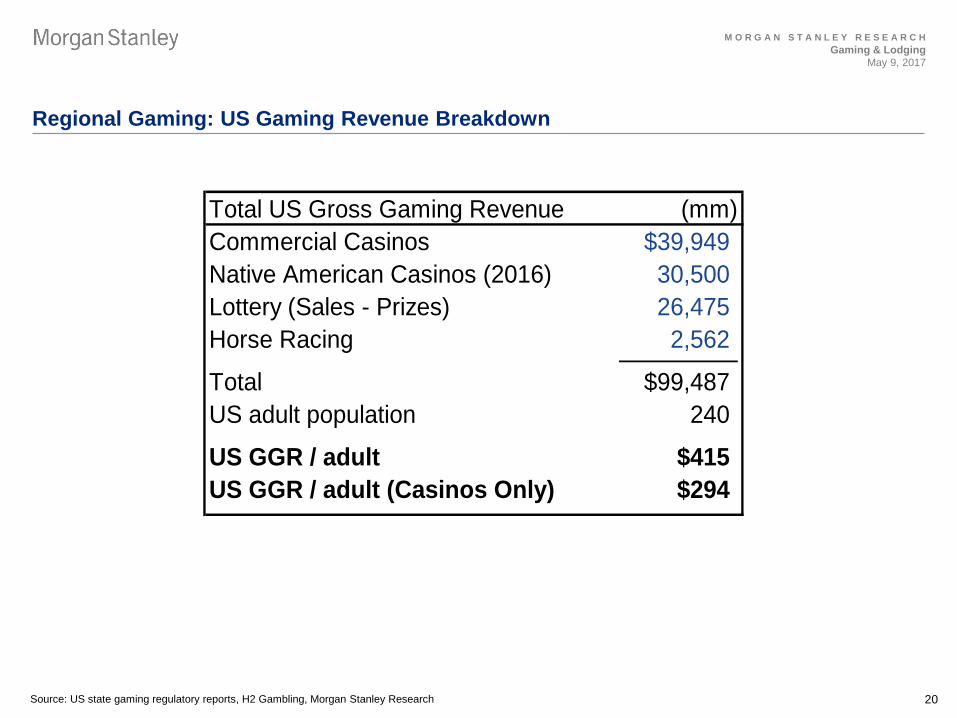
Regional Gaming: US Gaming Revenue Breakdown
Source: US state gaming regulatory reports, H2 Gambling, Morgan Stanley Research
Total US Gross Gaming Revenue (mm)Commercial Casinos $39,949Native American Casinos (2016) 30,500Lottery (Sales - Prizes) 26,475Horse Racing 2,562 Total $99,487US adult population 240
US GGR / adult $415US GGR / adult (Casinos Only) $294

M O R G A N S T A N L E Y R E S E A R C H
21
Gaming & Lodging May 9, 2017
Regional Gaming: Commercial / Tribal Casino Landscape
Source: US state gaming regulatory reports, Morgan Stanley Research

M O R G A N S T A N L E Y R E S E A R C H
22
Gaming & Lodging May 9, 2017
Regional Gaming: US Regional Gaming a Growth Industry until 2008
Source: BEA, BLS, US state gaming regulatory reports, Morgan Stanley Research
-5%
0%
5%
10%
15%
20%
25%
$0
$5
$10
$15
$20
$25
$30
$35
1971
1972
1973
1974
1975
1976
1977
1978
1979
1980
1981
1982
1983
1984
1985
1986
1987
1988
1989
1990
1991
1992
1993
1994
1995
1996
1997
1998
1999
2000
2001
2002
2003
2004
2005
2006
2007
2008
2009
2010
2011
2012
2013
2014
2015
2016
US Commercial Casino Revenue (ex-NV) Clark County, NV US Real GDP Growth
2008-2016CAGR: +0.2%
2008-2016CAGR: -0.1%

M O R G A N S T A N L E Y R E S E A R C H
23
Gaming & Lodging May 9, 2017
REIT Opportunity
Companies Impacted: GLPI MGP

M O R G A N S T A N L E Y R E S E A R C H
24
Gaming & Lodging May 9, 2017
Regional Gaming Roll-up Opportunity
Source: State Gaming Regulators; Morgan Stanley Research
Bottom-up analysis suggest $1.7B of acquirable EBITDA in US Regional Gaming Bottom-up Market Opportunity 2015 2015Property Revenue State Parent RevenueDover Downs $152 DE $152Delaware Park 160 DE 160Prairie Meadows 183 IA 183Riverside Casino 84 IA 84Rivers (Des Plaines) 425 IL Rush Street / ClairvestGrand Victoria Elgin 171 IL MGM (50%)Indiana Grand 227 IN New Centaur / ClairvestHoosier Park 186 IN New Centaur / ClairvestTropicana Evansville 121 IN TPCAMajestic Star 89 IN 89Golden Nugget LC 249 LA Landry'sEldorado Resort 140 LA 140Margaritaville 142 LA 142Plainridge Park 159 MA PENN 159Maryland Live 630 MD CordishMotorcity 464 MI 464Greektown 330 MI Rock GamingBorgata 696 NJ BYD / MGM 696Trump Taj Mahal 180 NJ 180Tropicana 280 NJ TPCAGolden Nugget 200 NJ Landry'sResorts 162 NJ 162Horseshoe Cleveland 213 OH CZR / Rock GamingHorseshoe Cincinnati 197 OH CZR / Rock GamingThistle Downs 108 OH 108Scioto Downs 145 OH 145Hard Rock Rocksino 210 OH 210Miami Valley Gaming 124 OH 124Parx 523 PA Greenwood GamingSands Bethlehem 514 PA LVS 514The Rivers 348 PA Rush StreetMohegan Sun (Pocono Downs) 265 PA 265Sugarhouse 269 PA Rush StreetMount Airy - Pocono 186 PA 186Presque Isle Downs 131 PA 131Valley Forge 113 PA 113Twin River Casino 552 RI 552Mountaineer Park 165 WV 165Wheeling Downs 94 WV Delaware NorthCZR Las Vegas Properties 3,030 NV CZR 3,030CZR Regional Properties 3,378 Multiple CZR 3,378ISLE Properties 662 Multiple ISLE 662BYD Properties 1,036 Multiple BYD 1,036 Total Casino Revenue ($mm) $17,693 $13,231
EBITDA Margins 25% 25%Total EBITDA Opportunity $4,423 $3,308
Rent Coverage 2.0x 2.0x
Total Sold EBITDA Opportunity $2,212 Excl. unlikely sellers $1,654

M O R G A N S T A N L E Y R E S E A R C H
25
Gaming & Lodging May 9, 2017
Top Gaming Pick: WYNN ($130 Price Target)
Source: Thomson Reuters, Morgan Stanley Research estimates
• Best positioned to capitalize on Macau strength and incremental demand driven by its new property, Wynn Palace, that opened on 8/22/16.
• Despite Wynn Palace’s weak opening, Street only assuming 0.2% Macau market share gain from 4Q16 to 2018. First property took 370bps of share. Data suggesting share upside
• Wynn’s properties have a proven track record of slow starts leading to outperformance, and performance has begun to improve
• Stock is trading at 14x/12x our 2018e/2019e EBITDA compared to its LT average multiple of 14x. The stock remains attractive on a relative basis as well, trading at a ~1x discount to LVS in 2018 and a ~2.5x discount in 2019, despite historically trading at a 1x premium.
• Future properties in Boston and Las Vegas create a multi-year growth story
• Bull case of $212 would be achievable if WYNN can match its prior ability to drive meaningful fair share premiums and expand the market.
$1,233
$1,458$1,572
$1,947$2,082
$0
$500
$1,000
$1,500
$2,000
$2,500
2016 2017E 2018E 2019E 2020E
WYNN Consolidated EBITDA
Las Vegas Wynn Macau Wynn Palace Boston

M O R G A N S T A N L E Y R E S E A R C H
26
Gaming & Lodging May 9, 2017
Lodging
Image Source: Shutterstock

M O R G A N S T A N L E Y R E S E A R C H
27
Gaming & Lodging May 9, 2017
Ratings / Theses • MAR (OW) EBITDA growth to surpass peers, driven by synergies from Starwood acq. and unit growth
• HLT (OW) Leading unit growth and asset-light should drive stable earnings growth, buy back ~5% stock/year
• CHH (OW) Stable franchise fee stream, more immune to Airbnb threat than peers given lower –tier positioning
• STAY (EW) Dominant position in niche extended stay segment, renovation story; however, greater Airbnb risk
• LQ (EW) Underpenetrated brand; however, commoditized product and high oil mkt exposure
• H (EW) Strong M+F unit growth but asset-heavy translates into larger impact from muted RevPAR growth
C-Corps
REITs
• HST (EW) Scale / liquidity historically led to a higher multiple. Attractive div yield offset by RevPAR risk
• LHO (EW) High quality, independent hotels deserve premium multiple. High div yield offset by RevPAR risk
• XHR (EW) Mgmt has a proven track record of putting together attractive portfolios, high Houston exposure risk
• SHO (UW) Current premium multiple from renovation tailwinds; see greater RevPAR risk from broad portfolio
• DRH (UW) Current premium multiple at risk from broader RevPAR slowdown
M O R G A N S T A N L E Y R E S E A R C H
28
Gaming & Lodging May 9, 2017
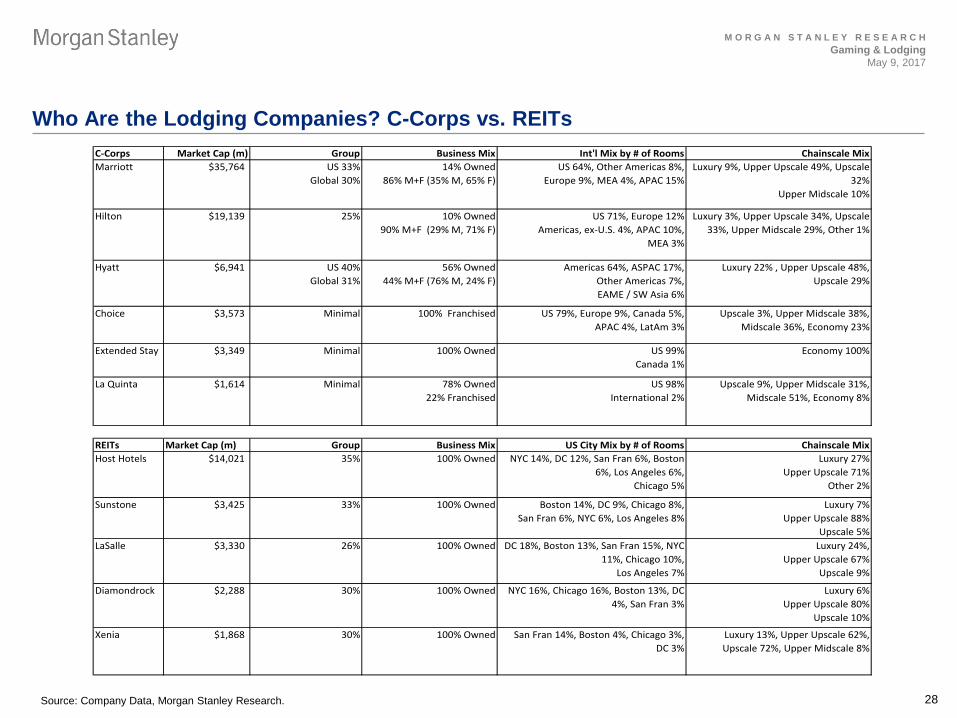
Who Are the Lodging Companies? C-Corps vs. REITs
Source: Company Data, Morgan Stanley Research.
C-Corps Market Cap (m) Group Business Mix Int'l Mix by # of Rooms Chainscale MixMarriott $35,764 US 33%
Global 30%14% Owned
86% M+F (35% M, 65% F)US 64%, Other Americas 8%,
Europe 9%, MEA 4%, APAC 15%Luxury 9%, Upper Upscale 49%, Upscale
32%Upper Midscale 10%
Hilton $19,139 25% 10% Owned90% M+F (29% M, 71% F)
US 71%, Europe 12%Americas, ex-U.S. 4%, APAC 10%,
MEA 3%
Luxury 3%, Upper Upscale 34%, Upscale 33%, Upper Midscale 29%, Other 1%
Hyatt $6,941 US 40%Global 31%
56% Owned44% M+F (76% M, 24% F)
Americas 64%, ASPAC 17%, Other Americas 7%, EAME / SW Asia 6%
Luxury 22% , Upper Upscale 48%, Upscale 29%
Choice $3,573 Minimal 100% Franchised US 79%, Europe 9%, Canada 5%, APAC 4%, LatAm 3%
Upscale 3%, Upper Midscale 38%, Midscale 36%, Economy 23%
Extended Stay $3,349 Minimal 100% Owned US 99%Canada 1%
Economy 100%
La Quinta $1,614 Minimal 78% Owned22% Franchised
US 98%International 2%
Upscale 9%, Upper Midscale 31%, Midscale 51%, Economy 8%
REITs Market Cap (m) Group Business Mix US City Mix by # of Rooms Chainscale MixHost Hotels $14,021 35% 100% Owned NYC 14%, DC 12%, San Fran 6%, Boston
6%, Los Angeles 6%, Chicago 5%
Luxury 27%Upper Upscale 71%
Other 2%
Sunstone $3,425 33% 100% Owned Boston 14%, DC 9%, Chicago 8%, San Fran 6%, NYC 6%, Los Angeles 8%
Luxury 7%Upper Upscale 88%
Upscale 5%LaSalle $3,330 26% 100% Owned DC 18%, Boston 13%, San Fran 15%, NYC
11%, Chicago 10%, Los Angeles 7%
Luxury 24%,Upper Upscale 67%
Upscale 9%
Diamondrock $2,288 30% 100% Owned NYC 16%, Chicago 16%, Boston 13%, DC 4%, San Fran 3%
Luxury 6%Upper Upscale 80%
Upscale 10%
Xenia $1,868 30% 100% Owned San Fran 14%, Boston 4%, Chicago 3%, DC 3%
Luxury 13%, Upper Upscale 62%, Upscale 72%, Upper Midscale 8%

M O R G A N S T A N L E Y R E S E A R C H
29
Gaming & Lodging May 9, 2017
What’s The Dynamic Between Owners / Managers / Franchisers
Owners - Typically REITs or private investment vehicles - Large brand companies still own / lease some hotels but have been moving
away from the model because most cyclical / less scale advantage - Neither REITs nor C-corps are currently building new hotels, rely on
developers - Most operating leverage (attractive in an upcycle)
Managers - Manager runs hotel - Operating costs paid back by owner so runs through P&L as revenue offset
by similar cost - Manager earns base fee of ~2% (in Emerging Markets) or 3% (in US /
Europe) of hotel revenues - Also earns incentive management fees (IMF) of 10% of profit (in Emerging
Markets) or 20-25% of profit in US / Europe (but after surpass owners’ priority of ~10% of invested capital)
Franchisers
- Earns fee of ~5% of room revenue only (not incurred on Food & Beverage and other revenue)
M O R G A N S T A N L E Y R E S E A R C H
30
Gaming & Lodging May 9, 2017
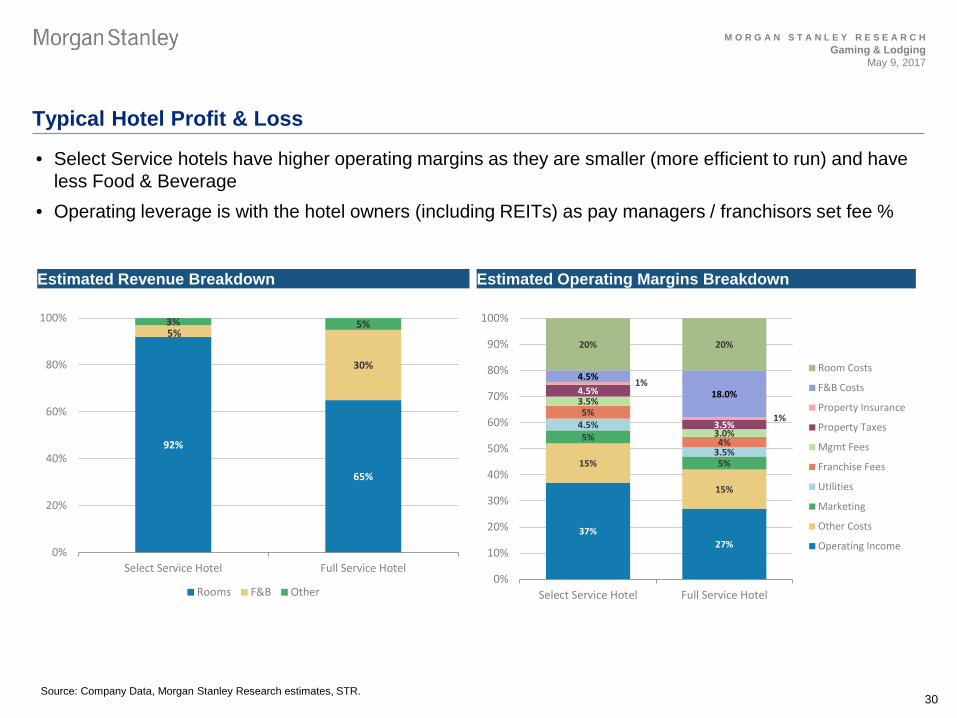
Typical Hotel Profit & Loss
Source: Company Data, Morgan Stanley Research estimates, STR.
92%
65%
5%
30%
3% 5%
0%
20%
40%
60%
80%
100%
Select Service Hotel Full Service Hotel
Rooms F&B Other
• Select Service hotels have higher operating margins as they are smaller (more efficient to run) and have less Food & Beverage
• Operating leverage is with the hotel owners (including REITs) as pay managers / franchisors set fee %
Estimated Revenue Breakdown Estimated Operating Margins Breakdown
37%27%
15%
15%
5%
5%
4.5%
3.5%
5%
4%
3.5%
3.0%
4.5%
3.5%
1%
1%
4.5%
18.0%
20% 20%
0%
10%
20%
30%
40%
50%
60%
70%
80%
90%
100%
Select Service Hotel Full Service Hotel
Room Costs
F&B Costs
Property Insurance
Property Taxes
Mgmt Fees
Franchise Fees
Utilities
Marketing
Other Costs
Operating Income
M O R G A N S T A N L E Y R E S E A R C H
31
Gaming & Lodging May 9, 2017
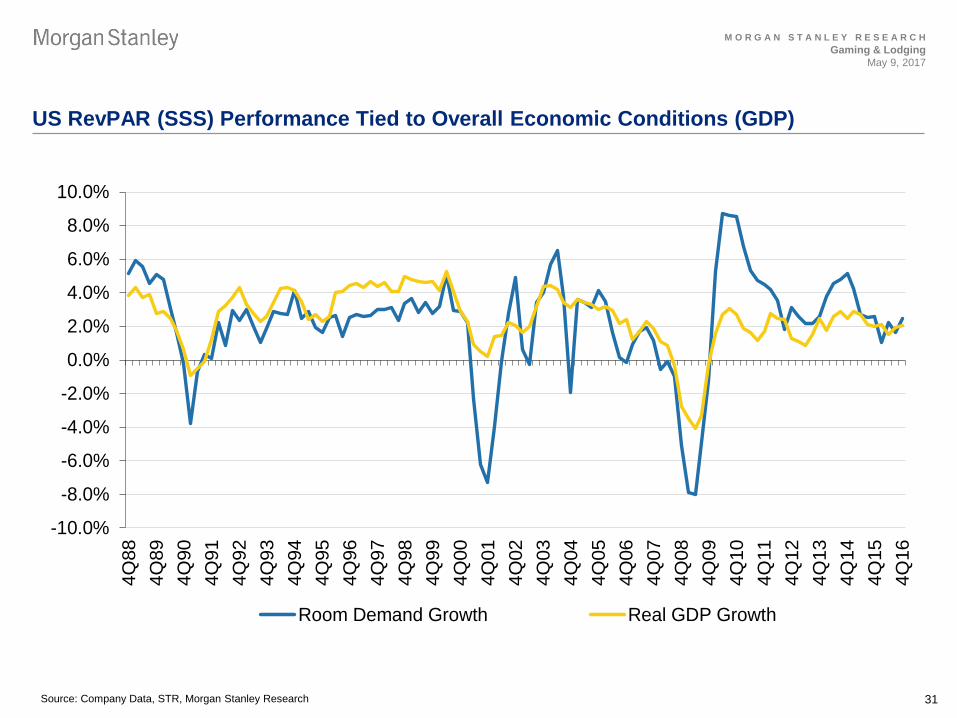
US RevPAR (SSS) Performance Tied to Overall Economic Conditions (GDP)
-10.0%
-8.0%
-6.0%
-4.0%
-2.0%
0.0%
2.0%
4.0%
6.0%
8.0%
10.0%
4Q88
4Q89
4Q90
4Q91
4Q92
4Q93
4Q94
4Q95
4Q96
4Q97
4Q98
4Q99
4Q00
4Q01
4Q02
4Q03
4Q04
4Q05
4Q06
4Q07
4Q08
4Q09
4Q10
4Q11
4Q12
4Q13
4Q14
4Q15
4Q16
Room Demand Growth Real GDP Growth
Source: Company Data, STR, Morgan Stanley Research

M O R G A N S T A N L E Y R E S E A R C H
32
Gaming & Lodging May 9, 2017
Lodging: Stocks Have Typically Outperformed when RevPAR Accelerates
Source: Thomson Reuters , Morgan Stanley Research estimates
-20%
-15%
-10%
-5%
0%
5%
10%
15%
20%
-60%
-40%
-20%
0%
20%
40%
60%19
9619
9719
9819
9920
0020
0120
0220
0320
0420
0520
0620
0720
0820
0920
1020
1120
1220
1320
1420
1520
16Y
TD
US
Rev
PAR
Gro
wth
Lodg
ing
Stoc
ks P
erf.
vs. S
&P
US RevPAR Growth Lodging Stocks vs. S&P 500

M O R G A N S T A N L E Y R E S E A R C H
33
Gaming & Lodging May 9, 2017
Key Debate #1: RevPAR growth outlook? Macro tailwinds vs. structural headwinds
Source: Company Data, STR, Morgan Stanley Research
• We expect structural headwinds to RevPAR growth to be partially offset by macro tailwinds resulting in +2%/0% for 2017e/2018e
3.2%
2.0%
0.5%
0.9%
-0.8%
0.8%
-0.4%
-0.9%-0.3%
-0.5%
-0.5%
-0.4%
-0.6%
-1.5%
-0.5%
0.5%
1.5%
2.5%
3.5%
2016RevPAR
Supply Airbnb OTAPricing
War
CorpTravelRates
Macro 2017ERevPAR
Supply Airbnb OTAPricing
War
CorpTravelRates
Macro 2018ERevPAR
M O R G A N S T A N L E Y R E S E A R C H
34
Gaming & Lodging May 9, 2017
Key Debate #2: Threat of Airbnb
12% 12%
18%
16%
19%18%
25%23%
0%
5%
10%
15%
20%
25%
30%
Leisure Travelers Business Travelers
Airbnb Use (Among Travelers) 2015
2016E
2016A
2017E
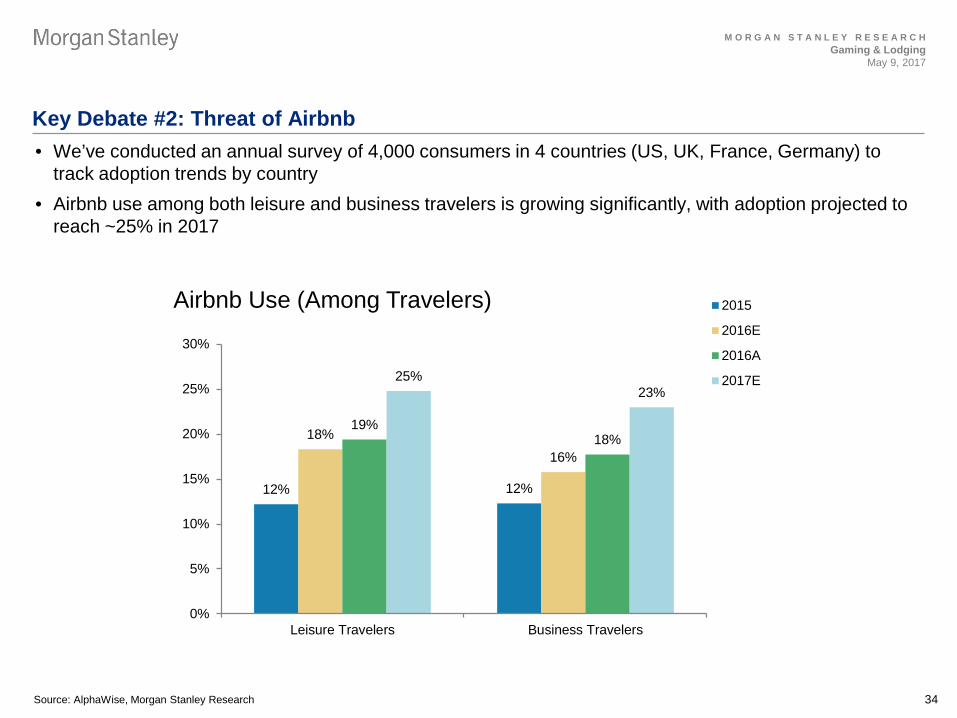
• We’ve conducted an annual survey of 4,000 consumers in 4 countries (US, UK, France, Germany) to track adoption trends by country
• Airbnb use among both leisure and business travelers is growing significantly, with adoption projected to reach ~25% in 2017
Source: AlphaWise, Morgan Stanley Research
M O R G A N S T A N L E Y R E S E A R C H
35
Gaming & Lodging May 9, 2017
Threat of Airbnb
41%35% 33%
29%
19%22% 20%
5% 4%
49%
37%35%
26%22% 22% 20%
4% 2%0%
10%
20%
30%
40%
50%
60%
70%
80%
Traditionalhotel
Bed &Breakfast
Friends/family Extended stayhotel
Vacationrental site
OtherVacationRentals
Corporateapartment
Other I would nothave taken
this trip if notfor Airbnb
Accommodation Alternatives that Airbnb Replaced (Among Airbnb Total Users Past 12 Months)
2015
2016
+888bp +212bp +176bp -265bp +322bp -6bp -11bp -117bp -108bp
Source: AlphaWise, Morgan Stanley Research
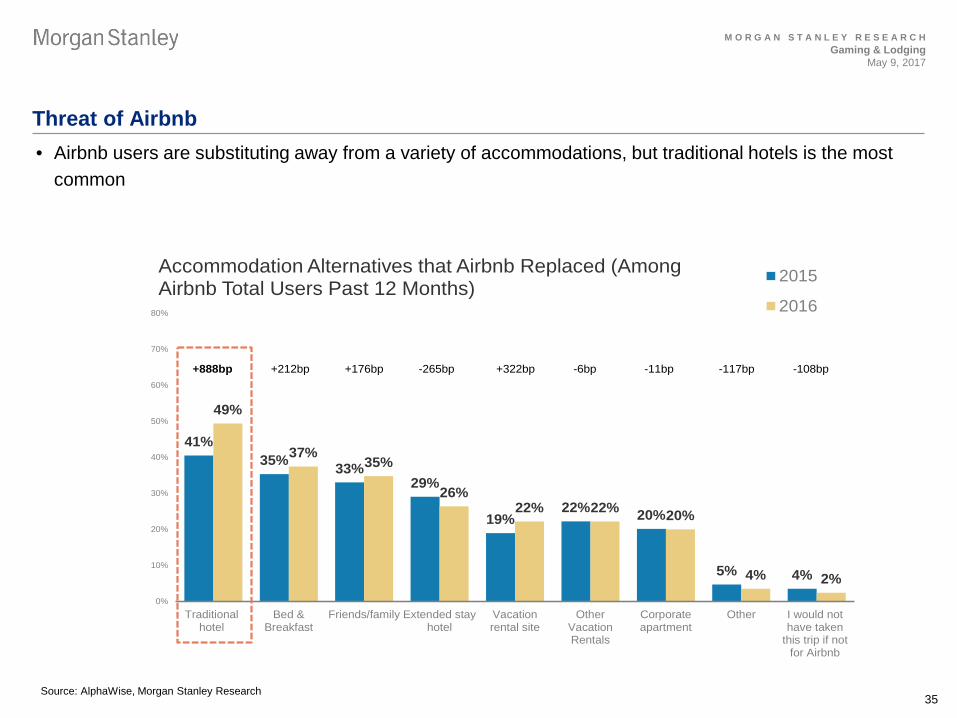
• Airbnb users are substituting away from a variety of accommodations, but traditional hotels is the most common

M O R G A N S T A N L E Y R E S E A R C H
36
Gaming & Lodging May 9, 2017
Threat of Airbnb
Source: AlphaWise, Morgan Stanley Research estimates
• Substitution away from traditional hotels for Airbnb stays has softened occupancy, resulting in a compounding effect on rate and RevPAR
M O R G A N S T A N L E Y R E S E A R C H
37
Gaming & Lodging May 9, 2017
Key Debate #3: Threat of OTAs
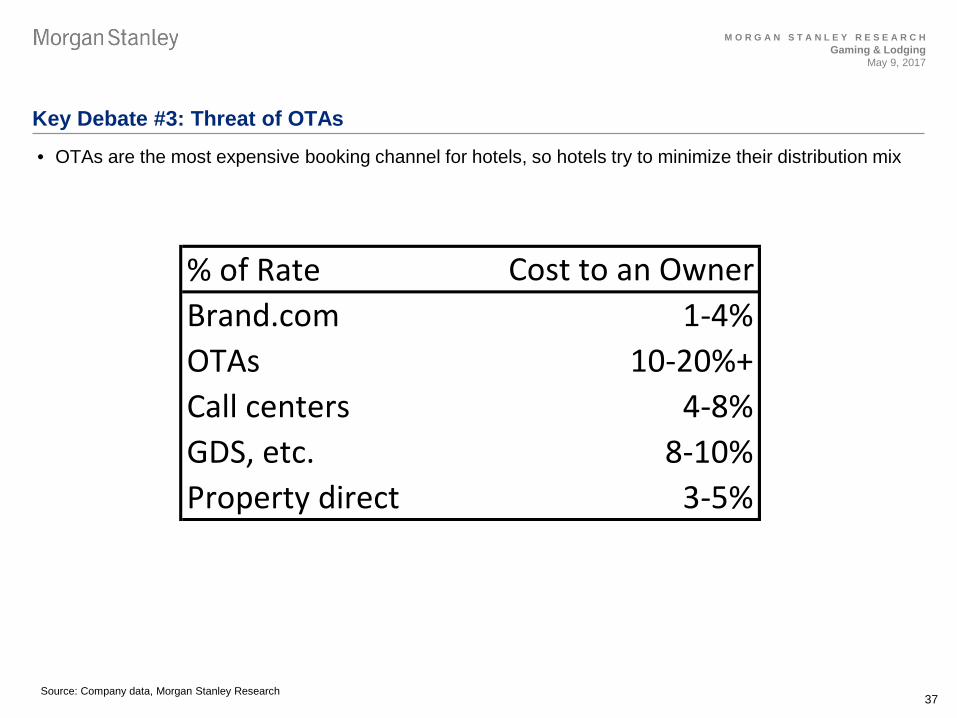
% of Rate Cost to an OwnerBrand.com 1-4%OTAs 10-20%+Call centers 4-8%GDS, etc. 8-10%Property direct 3-5%
Source: Company data, Morgan Stanley Research
• OTAs are the most expensive booking channel for hotels, so hotels try to minimize their distribution mix

M O R G A N S T A N L E Y R E S E A R C H
38
Gaming & Lodging May 9, 2017
Threat of OTAs
Source: Company Data, Morgan Stanley Research estimates, STR.
• OTAs continue to gain share of distribution
15%16%
18%19%
20%22%
24%
0%
20%
40%
60%
80%
100%
120%
140%
0%
5%
10%
15%
20%
25%
2009 2010 2011 2012 2013 2014 2015
OTA
Pen
etra
tion
(%)
OTA Penetration (%) US RevPAR vs. Prior Peak

M O R G A N S T A N L E Y R E S E A R C H
39
Gaming & Lodging May 9, 2017
Threat of OTAs
Source: Company data, Phocuswright’s Search, Shop, Buy: The New Digital Funnel (Aug 2015), Morgan Stanley Research
5%8%
18%20%
23%28%
30%33%
37%45%
0% 5% 10% 15% 20% 25% 30% 35% 40% 45% 50%
I couldn't find what I wanted to book anywhere elseI like their mobile app
Provider websites typically have the best pricesI trust the brand
It's easier to change/cancel my bookingI prefer the airline or hotel handling my payment directly
The website is easy to useBooking directly with an airline or hotel is easier
I am used to booking travel this wayI am a member of that hotel or airline's loyalty/rewards program
Reasons why US travelers book direct
Reasons why US travelers book through OTAs
5%9%
10%17%
27%30%
32%36%
38%52%
0% 10% 20% 30% 40% 50% 60%
I couldn't find what I wanted to book anywhere elseI am a member of their loyalty/rewards program
I like their mobile appIt's easier to change/cancel my booking
OTAs typically have the best pricesIt is easy to book all of your travel in one place
The website had the most selectionI trust the brand
I am used to booking travel this wayThe website is easy to use

M O R G A N S T A N L E Y R E S E A R C H
40
Gaming & Lodging May 9, 2017
Threat of OTAs: Largest hotel brands have built loyalty programs to combat
100 100
60
45
0
20
40
60
80
100
120
IHG Marriott Hilton Expedia
Mem
bers
(m)
Source: Company data, Morgan Stanley Research

M O R G A N S T A N L E Y R E S E A R C H
41
Gaming & Lodging May 9, 2017
Key Debate #4: Supply Risk
Source: STR, Morgan Stanley Research estimates
• US returning to long-term average growth of 2.0% in 2017
• Major cities seeing much higher growth
-1.4%
-0.1%
0.8% 0.9% 0.9% 0.9% 1.1% 1.3% 1.4% 1.4% 1.5%1.8% 1.8% 1.9%
2.2% 2.2% 2.4% 2.5% 2.7%
3.4%3.7% 3.8%
4.2%
5.1%5.7%
-2%
-1%
0%
1%
2%
3%
4%
5%
6%
7%
Nor
folk
/Virg
inia
Bea
ch, V
A
Los A
ngel
es/L
ong
Beac
h, C
A
Tam
pa/S
t Pet
ersb
urg,
FL
San
Fran
cisc
o/Sa
n M
ateo
, CA
St L
ouis,
MO
-IL
Phoe
nix,
AZ
Orla
ndo,
FL
Was
hing
ton,
DC-
MD-
VA
Phila
delp
hia,
PA-
NJ
San
Dieg
o, C
A
Atla
nta,
GA
Detr
oit,
MI
Chic
ago,
IL
Oah
u Is
land
, HI
Dalla
s, T
X
Nas
hvill
e, T
N
Seat
tle, W
A
New
Orle
ans,
LA
Anah
eim
/San
ta A
na, C
A
Bost
on, M
A
Denv
er, C
O
Min
neap
olis/
St P
aul,
MN
-WI
Mia
mi/H
iale
ah, F
L
New
Yor
k, N
Y
Hous
ton,
TX
2016
Sup
ply
Gro
wth
(%)
2016 Supply Growth 2016 Avg US Supply Growth
M O R G A N S T A N L E Y R E S E A R C H
42
Gaming & Lodging May 9, 2017
Supply Risk: Compression Nights in Top 25 Markets Declined 17% in 2016
Source: Company Data, STR, Morgan Stanley Research.
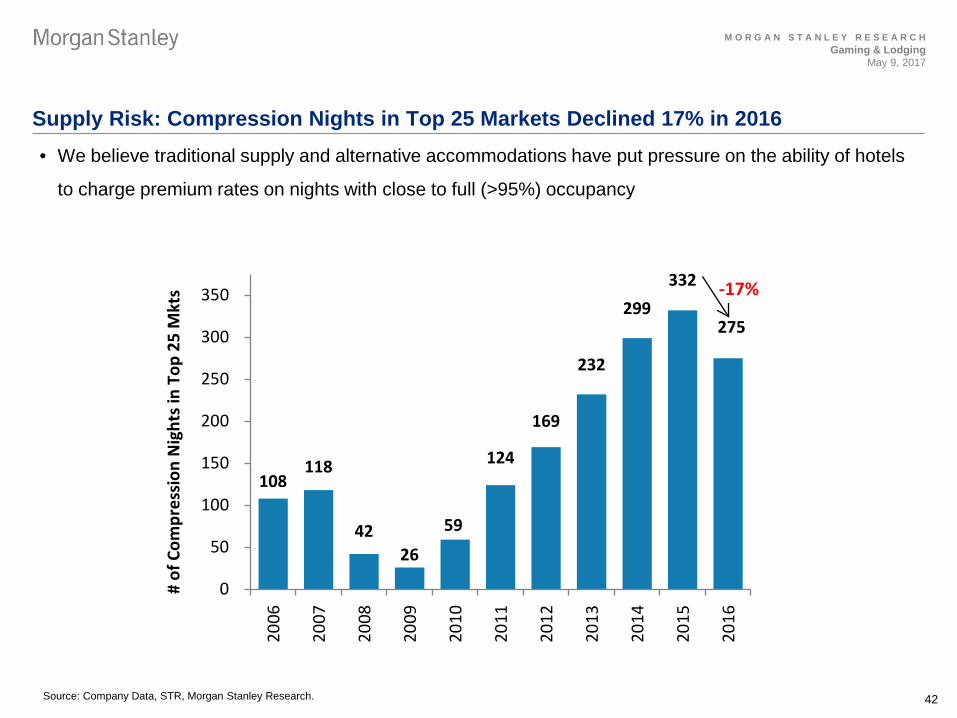
• We believe traditional supply and alternative accommodations have put pressure on the ability of hotels
to charge premium rates on nights with close to full (>95%) occupancy
108 118
42 26
59
124
169
232
299 332
275
0
50
100
150
200
250
300
35020
06
2007
2008
2009
2010
2011
2012
2013
2014
2015
2016
# of
Com
pres
sion
Nig
hts i
n To
p 25
Mkt
s -17%
M O R G A N S T A N L E Y R E S E A R C H
43
Gaming & Lodging May 9, 2017
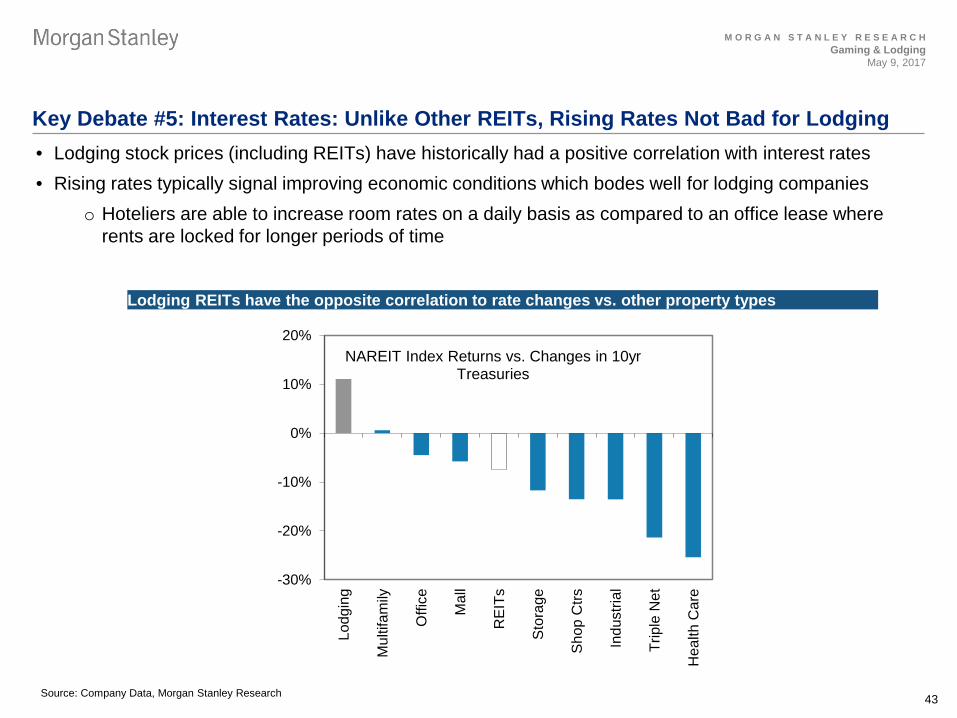
Key Debate #5: Interest Rates: Unlike Other REITs, Rising Rates Not Bad for Lodging
Source: Company Data, Morgan Stanley Research
-30%
-20%
-10%
0%
10%
20%Lo
dgin
g
Mul
tifam
ily
Offi
ce
Mal
l
RE
ITs
Sto
rage
Sho
p C
trs
Indu
stria
l
Trip
le N
et
Hea
lth C
are
NAREIT Index Returns vs. Changes in 10yr Treasuries
• Lodging stock prices (including REITs) have historically had a positive correlation with interest rates • Rising rates typically signal improving economic conditions which bodes well for lodging companies
o Hoteliers are able to increase room rates on a daily basis as compared to an office lease where rents are locked for longer periods of time
Lodging REITs have the opposite correlation to rate changes vs. other property types
M O R G A N S T A N L E Y R E S E A R C H
44
Gaming & Lodging May 9, 2017
M O R G A N S T A N L E Y R E S E A R C H
44
APPENDIX

M O R G A N S T A N L E Y R E S E A R C H
45
Gaming & Lodging May 9, 2017
Gaming Comps Table
Source: Thomson Reuters; Morgan Stanley Research estimates, except for non-covered companies (NC), which are consensus estimates. (1) Based on consensus estimates compiled by Thomson Reuters. (2) Estimates provided by Praveen Choudhary, Morgan Stanley’s Gaming analyst in Hong Kong. (3) Adjusted for proportional share of partially-owned assets. For valuation methodology and risks associated with any price targets, ratings or recommendations referenced in this research report, please contact the Client Support Team as follows: US/Canada +1 800 303-2495; Hong Kong +852 2848-5999; Latin America +1 718 754-5444 (U.S.); London +44 (0)20-7425-8169; Singapore +65 6834-6860; Sydney +61 (0)2-9770-1505; Tokyo +81 (0)3-5424-4349. Alternatively you may contact your investment representative or Morgan Stanley Research at 1585 Broadway, (Attention: Research Management), New York, NY 10036 USA.
(US$MM except per-share data) DailyPrice Price % to Mkt. Ent. Vol. EBITDA EPS EV / EBITDA3 P/E3 Operating FCF Yield3
5/8/17 Rating Target PT Shares Cap. Value ($MM) 2016 2017E 2018E 2016 2017E 2018E 2016 2017E 2018E 2016 2017E 2018E 2016 2017E 2018E
Large-Cap OperatorsMGM Resorts Int'l $30.42 OW $33 9% 578 $17,583 $29,115 218.9 $2,390 $2,879 $3,204 $1.14 $1.42 $1.67 12.9x 11.3x 10.0x 26.6x 21.5x 18.3x 7% 6% 8%Wynn Resorts $120.20 OW 133 11% 102 12,221 19,893 332.7 1,136 1,525 1,673 3.54 4.11 4.99 19.4x 14.7x 13.6x 33.9x 29.3x 24.1x 5% 7% 7%Las Vegas Sands 57.20 EW 58 2% 795 45,474 52,941 229.5 3,822 4,223 4,374 3.58 2.55 2.36 16.3x 14.8x 14.3x 16.0x 22.4x 24.3x 7% 5% 6% Average 16.2x 13.6x 12.7x 25.5x 24.4x 22.2x 6% 6% 7% Small-Cap Operators Boyd Gaming $24.45 OW $23 -6% 113 $2,766 $5,771 31.7 $629 $559 $613 $0.98 $1.12 $1.32 10.3x 8.9x 8.0x 24.9x 21.8x 18.5x 14% 11% 11%Penn National 18.63 EW 18 -2% 91 1,694 6,354 24.8 844 870 901 1.16 0.83 1.12 7.5x 7.2x 7.0x 16.1x 22.6x 16.7x 15% 13% 13%Red Rock Resorts 22.51 NC NA NA 142 3,199 5,054 12.4 N/A 466 526 1.03 1.19 1.40 10.8x 9.6x 9.1x 21.9x 18.9x 16.1x NA NA NAPinnacle Ent.1 20.97 NC NA NA 56 1,183 4,574 13.2 654 698 716 (7.79) 0.67 0.86 7.0x 6.5x 6.4x NM 31.2x 24.4x NA NA NA Average 8.9x 8.1x 7.6x 21.0x 23.6x 18.9x 14% 12% 12% Total Operators Average 12.0x 10.5x 9.8x 23.2x 23.9x 20.3x 10% 8% 9% Equipment SuppliersInt'l Game Tech $21.62 NC NA NA 197 4,262 12,646 24.8 2,049 1,705 1,764 2.33 2.11 2.29 6.2x 7.4x 7.2x 9.3x 10.2x 9.4x NA NA NAScientific Games 22.55 NC NA NA 86 1,937 10,291 20.9 1,104 1,177 1,231 (4.05) (2.50) (0.93) 9.3x 8.7x 8.4x NM NM NM NA NA NA
Average 9.3x 8.7x 8.4x NM NM NM NA NA NA
Triple Net Lease REITsMGM Growth Prop $28.27 EW $27 -6% 243 $6,872 $10,063 18.0 NA $638 $656 NA $1.94 $1.98 NA 15.8x 15.3x 14.5x 14.6x 14.3x NA 7% 7%Gaming & Leisure Prop 35.28 EW 35 -1% 211 $7,448 $12,040 39.3 872 883 893 3.11 3.17 3.18 13.9x 13.6x 13.5x 11.3x 11.1x 11.1x 9% 9% 9%
Asian SubsidiariesWynn Macau2 $2.05 OW $2.6 29% 5,187 10,655 14,580 31.3 698 864 1,006 0.07 0.07 0.10 20.9x 16.9x 14.5x 27.6x 28.6x 20.5x NA NA NASands China2 4.44 EW 4.6 5% 8,071 $35,823 $40,029 76.7 2,008 2,254 2,302 0.17 0.18 0.18 19.9x 17.8x 17.4x 26.6x 24.9x 24.1x NA NA NAMGM China2 2.23 EW 2.1 -5% 3,800 8,483 10,355 11.8 473 547 687 0.09 0.06 0.08 21.9x 18.9x 15.1x 26.2x 35.2x 28.1x NA NA NA
Asian GamingGalaxy Ent.2 $5.15 OW $6.45 25% 4,293 22,130 20,720 82.4 1,221 1,264 1,307 0.16 0.16 0.18 17.0x 16.4x 15.9x 32.8x 31.9x 29.0x NA NA NAMelco Crown Ent2 21.46 OW 25.0 16% 542 11,639 14,135 83.0 959 1,044 1,079 0.43 0.46 0.43 14.7x 13.5x 13.1x 50.4x 47.2x 49.3x NA NA NAGenting SIngapore2 0.77 EW 0.73 -5% 12,085 9,274 6,289 15.7 539 699 751 0.01 0.02 0.03 11.7x 9.0x 8.4x 65.3x 33.8x 28.8x NA NA NASJM2 0.91 UW 0.93 2% 5,661 5,135 3,856 11.9 414 370 462 0.05 0.04 0.02 9.3x 10.4x 8.3x 19.0x 21.1x 40.9x NA NA NA
Average 15.7x 14.3x 13.0x 36.7x 32.4x 33.4x NA NA NA OnlineAmaya CAD 24.41 NC NA NA 199 4,856 6,992 9.7913 524 565 NA 1.88 2.05 NA 13.3x 12.4x NA 13.0x 11.9x NA NA NA NAPaddy Power Betfair 98.00 OW £101 3% 86 8,428 8,483 11.5 383 478 550 3.03 3.94 4.66 22.1x 17.8x 15.3x 32.4x 24.9x 21.0x 5% 6% 6%OPAP EUR 9 EW £9 -3% 319 2,948 2,918 4.8147 307 315 336 0.52 0.54 0.58 9.5x 9.3x 8.7x 17.7x 17.3x 15.9x NA NA NAKindred Group SEK 92.55 EW SEK 100 8% 232 21,495 21,504 83.5 1,093 1,355 NA 3.65 4.44 NA 19.7x 15.9x NA 25.3x NA NA 4% NA NAPlaytech 943p OW 1350p 43% 335 3,156 2,942 1,309.0 258 307 341 0.60 0.72 0.80 10.1x 8.9x NA 13.8x 12.2x NA 8% 10% NA
Average 15.0x 12.8x NA 20.5x 16.6x 18.4x 6% NA NA

M O R G A N S T A N L E Y R E S E A R C H
46
Gaming & Lodging May 9, 2017
Historical Adjusted EV/EBITDA Multiples
Source: Thomson Reuters, Morgan Stanley Research
LVS MGM
US Regionals WYNN
8.0x
10.0x
12.0x
14.0x
16.0x
18.0x
20.0x
Apr
-10
Oct
-10
Apr
-11
Oct
-11
Apr
-12
Oct
-12
Apr
-13
Oct
-13
Apr
-14
Oct
-14
Apr
-15
Oct
-15
Apr
-16
Oct
-16
Apr
-17
1 Standard Deviation Market Cap Avg Historical Multiple
12.3x
13.9x14.5x
15.5x
9.0x
11.0x
13.0x
15.0x
17.0x
Apr
-12
Oct
-12
Apr
-13
Oct
-13
Apr
-14
Oct
-14
Apr
-15
Oct
-15
Apr
-16
Oct
-16
Apr
-17
1 Standard Deviation EV/EBITDA Multiple Avg Historical Multiple
12.2x
13.6x14.2x14.9x
5.0x
6.0x
7.0x
8.0x
9.0x
10.0x
Jan-
11
Jun-
11
Nov
-11
Apr
-12
Sep
-12
Feb-
13
Jul-1
3
Dec
-13
May
-14
Oct
-14
Mar
-15
Aug
-15
Jan-
16
Jun-
16
Nov
-16
Apr
-17
PENN BYD
9.1x
7.4x
9.0x
9.5x
10.0x
10.5x
11.0x
11.5x
12.0x
12.5x
13.0x
13.5x
14.0x
Apr
-12
Oct
-12
Apr
-13
Oct
-13
Apr
-14
Oct
-14
Apr
-15
Oct
-15
Apr
-16
Oct
-16
Apr
-17
1 Standard Deviation EV/EBITDA Multiple Avg Historical Multiple
10.2x
11.3x
10.8x
12.4x
M O R G A N S T A N L E Y R E S E A R C H
47
Gaming & Lodging May 9, 2017
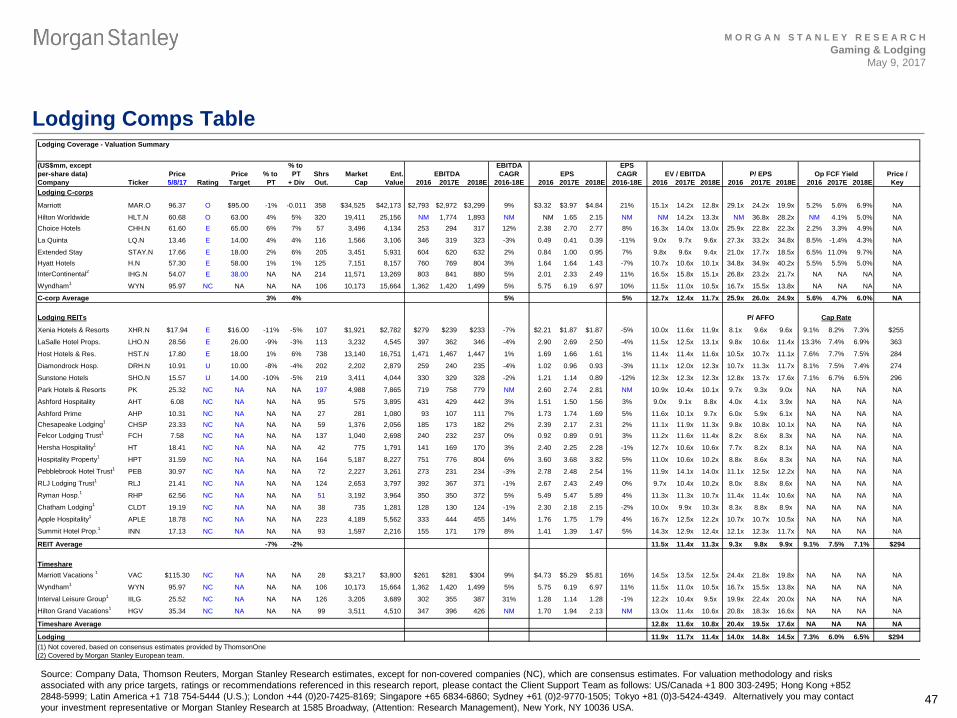
Lodging Comps Table
Source: Company Data, Thomson Reuters, Morgan Stanley Research estimates, except for non-covered companies (NC), which are consensus estimates. For valuation methodology and risks associated with any price targets, ratings or recommendations referenced in this research report, please contact the Client Support Team as follows: US/Canada +1 800 303-2495; Hong Kong +852 2848-5999; Latin America +1 718 754-5444 (U.S.); London +44 (0)20-7425-8169; Singapore +65 6834-6860; Sydney +61 (0)2-9770-1505; Tokyo +81 (0)3-5424-4349. Alternatively you may contact your investment representative or Morgan Stanley Research at 1585 Broadway, (Attention: Research Management), New York, NY 10036 USA.
Lodging Coverage - Valuation Summary
(US$mm, except % to EBITDA EPSper-share data) Price Price % to PT Shrs Market Ent. EBITDA CAGR EPS CAGR EV / EBITDA P/ EPS Op FCF Yield Price /Company Ticker 5/8/17 Rating Target PT + Div Out. Cap Value 2016 2017E 2018E 2016-18E 2016 2017E 2018E 2016-18E 2016 2017E 2018E 2016 2017E 2018E 2016 2017E 2018E KeyLodging C-corps
Marriott MAR.O 96.37 O $95.00 -1% -0.011 358 $34,525 $42,173 $2,793 $2,972 $3,299 9% $3.32 $3.97 $4.84 21% 15.1x 14.2x 12.8x 29.1x 24.2x 19.9x 5.2% 5.6% 6.9% NA
Hilton Worldwide HLT.N 60.68 O 63.00 4% 5% 320 19,411 25,156 NM 1,774 1,893 NM NM 1.65 2.15 NM NM 14.2x 13.3x NM 36.8x 28.2x NM 4.1% 5.0% NAChoice Hotels CHH.N 61.60 E 65.00 6% 7% 57 3,496 4,134 253 294 317 12% 2.38 2.70 2.77 8% 16.3x 14.0x 13.0x 25.9x 22.8x 22.3x 2.2% 3.3% 4.9% NA
La Quinta LQ.N 13.46 E 14.00 4% 4% 116 1,566 3,106 346 319 323 -3% 0.49 0.41 0.39 -11% 9.0x 9.7x 9.6x 27.3x 33.2x 34.8x 8.5% -1.4% 4.3% NA
Extended Stay STAY.N 17.66 E 18.00 2% 6% 205 3,451 5,931 604 620 632 2% 0.84 1.00 0.95 7% 9.8x 9.6x 9.4x 21.0x 17.7x 18.5x 6.5% 11.0% 9.7% NAHyatt Hotels H.N 57.30 E 58.00 1% 1% 125 7,151 8,157 760 769 804 3% 1.64 1.64 1.43 -7% 10.7x 10.6x 10.1x 34.8x 34.9x 40.2x 5.5% 5.5% 5.0% NAInterContinental2 IHG.N 54.07 E 38.00 NA NA 214 11,571 13,269 803 841 880 5% 2.01 2.33 2.49 11% 16.5x 15.8x 15.1x 26.8x 23.2x 21.7x NA NA NA NA
Wyndham1 WYN 95.97 NC NA NA NA 106 10,173 15,664 1,362 1,420 1,499 5% 5.75 6.19 6.97 10% 11.5x 11.0x 10.5x 16.7x 15.5x 13.8x NA NA NA NA
C-corp Average 3% 4% 5% 5% 12.7x 12.4x 11.7x 25.9x 26.0x 24.9x 5.6% 4.7% 6.0% NA
Lodging REITs P/ AFFO Cap Rate
Xenia Hotels & Resorts XHR.N $17.94 E $16.00 -11% -5% 107 $1,921 $2,782 $279 $239 $233 -7% $2.21 $1.87 $1.87 -5% 10.0x 11.6x 11.9x 8.1x 9.6x 9.6x 9.1% 8.2% 7.3% $255
LaSalle Hotel Props. LHO.N 28.56 E 26.00 -9% -3% 113 3,232 4,545 397 362 346 -4% 2.90 2.69 2.50 -4% 11.5x 12.5x 13.1x 9.8x 10.6x 11.4x 13.3% 7.4% 6.9% 363
Host Hotels & Res. HST.N 17.80 E 18.00 1% 6% 738 13,140 16,751 1,471 1,467 1,447 1% 1.69 1.66 1.61 1% 11.4x 11.4x 11.6x 10.5x 10.7x 11.1x 7.6% 7.7% 7.5% 284
Diamondrock Hosp. DRH.N 10.91 U 10.00 -8% -4% 202 2,202 2,879 259 240 235 -4% 1.02 0.96 0.93 -3% 11.1x 12.0x 12.3x 10.7x 11.3x 11.7x 8.1% 7.5% 7.4% 274
Sunstone Hotels SHO.N 15.57 U 14.00 -10% -5% 219 3,411 4,044 330 329 328 -2% 1.21 1.14 0.89 -12% 12.3x 12.3x 12.3x 12.8x 13.7x 17.6x 7.1% 6.7% 6.5% 296
Park Hotels & Resorts PK 25.32 NC NA NA NA 197 4,988 7,865 719 758 779 NM 2.60 2.74 2.81 NM 10.9x 10.4x 10.1x 9.7x 9.3x 9.0x NA NA NA NA
Ashford Hospitality AHT 6.08 NC NA NA NA 95 575 3,895 431 429 442 3% 1.51 1.50 1.56 3% 9.0x 9.1x 8.8x 4.0x 4.1x 3.9x NA NA NA NA
Ashford Prime AHP 10.31 NC NA NA NA 27 281 1,080 93 107 111 7% 1.73 1.74 1.69 5% 11.6x 10.1x 9.7x 6.0x 5.9x 6.1x NA NA NA NAChesapeake Lodging1 CHSP 23.33 NC NA NA NA 59 1,376 2,056 185 173 182 2% 2.39 2.17 2.31 2% 11.1x 11.9x 11.3x 9.8x 10.8x 10.1x NA NA NA NAFelcor Lodging Trust1 FCH 7.58 NC NA NA NA 137 1,040 2,698 240 232 237 0% 0.92 0.89 0.91 3% 11.2x 11.6x 11.4x 8.2x 8.6x 8.3x NA NA NA NA
Hersha Hospitality1 HT 18.41 NC NA NA NA 42 775 1,791 141 169 170 3% 2.40 2.25 2.28 -1% 12.7x 10.6x 10.6x 7.7x 8.2x 8.1x NA NA NA NA
Hospitality Property1 HPT 31.59 NC NA NA NA 164 5,187 8,227 751 776 804 6% 3.60 3.68 3.82 5% 11.0x 10.6x 10.2x 8.8x 8.6x 8.3x NA NA NA NA
Pebblebrook Hotel Trust1 PEB 30.97 NC NA NA NA 72 2,227 3,261 273 231 234 -3% 2.78 2.48 2.54 1% 11.9x 14.1x 14.0x 11.1x 12.5x 12.2x NA NA NA NA
RLJ Lodging Trust1 RLJ 21.41 NC NA NA NA 124 2,653 3,797 392 367 371 -1% 2.67 2.43 2.49 0% 9.7x 10.4x 10.2x 8.0x 8.8x 8.6x NA NA NA NA
Ryman Hosp.1 RHP 62.56 NC NA NA NA 51 3,192 3,964 350 350 372 5% 5.49 5.47 5.89 4% 11.3x 11.3x 10.7x 11.4x 11.4x 10.6x NA NA NA NA
Chatham Lodging1 CLDT 19.19 NC NA NA NA 38 735 1,281 128 130 124 -1% 2.30 2.18 2.15 -2% 10.0x 9.9x 10.3x 8.3x 8.8x 8.9x NA NA NA NA
Apple Hospitality1 APLE 18.78 NC NA NA NA 223 4,189 5,562 333 444 455 14% 1.76 1.75 1.79 4% 16.7x 12.5x 12.2x 10.7x 10.7x 10.5x NA NA NA NA
Summit Hotel Prop.1 INN 17.13 NC NA NA NA 93 1,597 2,216 155 171 179 8% 1.41 1.39 1.47 5% 14.3x 12.9x 12.4x 12.1x 12.3x 11.7x NA NA NA NA
REIT Average -7% -2% 11.5x 11.4x 11.3x 9.3x 9.8x 9.9x 9.1% 7.5% 7.1% $294
TimeshareMarriott Vacations 1 VAC $115.30 NC NA NA NA 28 $3,217 $3,800 $261 $281 $304 9% $4.73 $5.29 $5.81 16% 14.5x 13.5x 12.5x 24.4x 21.8x 19.8x NA NA NA NA
Wyndham1 WYN 95.97 NC NA NA NA 106 10,173 15,664 1,362 1,420 1,499 5% 5.75 6.19 6.97 11% 11.5x 11.0x 10.5x 16.7x 15.5x 13.8x NA NA NA NA
Interval Leisure Group1 IILG 25.52 NC NA NA NA 126 3,205 3,689 302 355 387 31% 1.28 1.14 1.28 -1% 12.2x 10.4x 9.5x 19.9x 22.4x 20.0x NA NA NA NA
Hilton Grand Vacations1 HGV 35.34 NC NA NA NA 99 3,511 4,510 347 396 426 NM 1.70 1.94 2.13 NM 13.0x 11.4x 10.6x 20.8x 18.3x 16.6x NA NA NA NA
Timeshare Average 12.8x 11.6x 10.8x 20.4x 19.5x 17.6x NA NA NA NA
Lodging 11.9x 11.7x 11.4x 14.0x 14.8x 14.5x 7.3% 6.0% 6.5% $294(1) Not covered, based on consensus estimates provided by ThomsonOne(2) Covered by Morgan Stanley European team.

M O R G A N S T A N L E Y R E S E A R C H
48
Gaming & Lodging May 9, 2017
Historical EV / EBITDA Multiples – Lodging C-Corps Average 11x
Source: Company Data, Morgan Stanley Research estimates
6.0x
8.0x
10.0x
12.0x
14.0x
16.0x
18.0x
Jan-
03
Jul-0
3
Jan-
04
Jul-0
4
Jan-
05
Jul-0
5
Jan-
06
Jul-0
6
Jan-
07
Jul-0
7
Jan-
08
Jul-0
8
Jan-
09
Jul-0
9
Jan-
10
Jul-1
0
Jan-
11
Jul-1
1
Jan-
12
Jul-1
2
Jan-
13
Jul-1
3
Jan-
14
Jul-1
4
Jan-
15
Jul-1
5
Jan-
16
Jul-1
6
Jan-
17
Average 11.7x

M O R G A N S T A N L E Y R E S E A R C H
49
Gaming & Lodging May 9, 2017
Historical EV / EBITDA Multiples – Lodging REITs Average 11x
Source: Company Data, Morgan Stanley Research estimates
6.0x
8.0x
10.0x
12.0x
14.0x
16.0x
18.0x
Jan-
03
Jul-0
3
Jan-
04
Jul-0
4
Jan-
05
Jul-0
5
Jan-
06
Jul-0
6
Jan-
07
Jul-0
7
Jan-
08
Jul-0
8
Jan-
09
Jul-0
9
Jan-
10
Jul-1
0
Jan-
11
Jul-1
1
Jan-
12
Jul-1
2
Jan-
13
Jul-1
3
Jan-
14
Jul-1
4
Jan-
15
Jul-1
5
Jan-
16
Jul-1
6
Jan-
17
Average 11.5x
M O R G A N S T A N L E Y R E S E A R C H
50
Gaming & Lodging May 9, 2017
M O R G A N S T A N L E Y R E S E A R C H
50
DISCLOSURES

M O R G A N S T A N L E Y R E S E A R C H
51
Gaming & Lodging May 9, 2017
Disclosures The information and opinions in Morgan Stanley Research were prepared by Morgan Stanley & Co. LLC, and/or Morgan Stanley C.T.V.M. S.A., and/or Morgan Stanley Mexico, Casa de Bolsa, S.A. de C.V., and/or Morgan Stanley Canada Limited. As used in this disclosure section, "Morgan Stanley" includes Morgan Stanley & Co. LLC, Morgan Stanley C.T.V.M. S.A., Morgan Stanley Mexico, Casa de Bolsa, S.A. de C.V., Morgan Stanley Canada Limited and their affiliates as necessary. For important disclosures, stock price charts and equity rating histories regarding companies that are the subject of this report, please see the Morgan Stanley Research Disclosure Website at www.morganstanley.com/researchdisclosures, or contact your investment representative or Morgan Stanley Research at 1585 Broadway, (Attention: Research Management), New York, NY, 10036 USA. For valuation methodology and risks associated with any recommendation, rating or price target referenced in this research report, please contact the Client Support Team as follows: US/Canada +1 800 303-2495; Hong Kong +852 2848-5999; Latin America +1 718 754-5444 (U.S.); London +44 (0)20-7425-8169; Singapore +65 6834-6860; Sydney +61 (0)2-9770-1505; Tokyo +81 (0)3-6836-9000. Alternatively you may contact your investment representative or Morgan Stanley Research at 1585 Broadway, (Attention: Research Management), New York, NY 10036 USA. Analyst Certification The following analysts hereby certify that their views about the companies and their securities discussed in this report are accurately expressed and that they have not received and will not receive direct or indirect compensation in exchange for expressing specific recommendations or views in this report: Thomas Allen; Mark Savino; Chaodan Zheng. Unless otherwise stated, the individuals listed on the cover page of this report are research analysts. Global Research Conflict Management Policy Morgan Stanley Research has been published in accordance with our conflict management policy, which is available at www.morganstanley.com/institutional/research/conflictpolicies. Important US Regulatory Disclosures on Subject Companies As of April 28, 2017, Morgan Stanley beneficially owned 1% or more of a class of common equity securities of the following companies covered in Morgan Stanley Research: DiamondRock Hospitality Co, Hilton Worldwide Holdings Inc, Host Hotels & Resorts, Inc., Hyatt Hotels Corporation, La Quinta Holdings Inc, LaSalle Hotel Properties, Marriott International Inc., Xenia Hotels & Resorts Inc. Within the last 12 months, Morgan Stanley managed or co-managed a public offering (or 144A offering) of securities of Hilton Worldwide Holdings Inc, MGM Growth Properties LLC, MGM Resorts International, Wynn Resorts, Limited. Within the last 12 months, Morgan Stanley has received compensation for investment banking services from Extended Stay America Inc, Hilton Worldwide Holdings Inc, MGM Growth Properties LLC, MGM Resorts International, Penn National Gaming, Inc., Wynn Resorts, Limited. In the next 3 months, Morgan Stanley expects to receive or intends to seek compensation for investment banking services from Boyd Gaming Corporation, Choice Hotels International Inc, DiamondRock Hospitality Co, Extended Stay America Inc, Gaming and Leisure Properties Inc, Hilton Worldwide Holdings Inc, Host Hotels & Resorts, Inc., Hyatt Hotels Corporation, La Quinta Holdings Inc, Las Vegas Sands Corp., LaSalle Hotel Properties, Marriott International Inc., MGM Growth Properties LLC, MGM Resorts International, Penn National Gaming, Inc., Sunstone Hotel Investors Inc, Wynn Resorts, Limited, Xenia Hotels & Resorts Inc. Within the last 12 months, Morgan Stanley has received compensation for products and services other than investment banking services from Hilton Worldwide Holdings Inc, Hyatt Hotels Corporation, La Quinta Holdings Inc, Las Vegas Sands Corp., Marriott International Inc., MGM Resorts International, Penn National Gaming, Inc., Wynn Resorts, Limited, Xenia Hotels & Resorts Inc. Within the last 12 months, Morgan Stanley has provided or is providing investment banking services to, or has an investment banking client relationship with, the following company: Boyd Gaming Corporation, Choice Hotels International Inc, DiamondRock Hospitality Co, Extended Stay America Inc, Gaming and Leisure Properties Inc, Hilton Worldwide Holdings Inc, Host Hotels & Resorts, Inc., Hyatt Hotels Corporation, La Quinta Holdings Inc, Las Vegas Sands Corp., LaSalle Hotel Properties, Marriott International Inc., MGM Growth Properties LLC, MGM Resorts International, Penn National Gaming, Inc., Sunstone Hotel Investors Inc, Wynn Resorts, Limited, Xenia Hotels & Resorts Inc. Within the last 12 months, Morgan Stanley has either provided or is providing non-investment banking, securities-related services to and/or in the past has entered into an agreement to provide services or has a client relationship with the following company: Hilton Worldwide Holdings Inc, Hyatt Hotels Corporation, La Quinta Holdings Inc, Las Vegas Sands Corp., Marriott International Inc., MGM Resorts International, Penn National Gaming, Inc., Wynn Resorts, Limited, Xenia Hotels & Resorts Inc. Morgan Stanley & Co. LLC makes a market in the securities of Boyd Gaming Corporation, Choice Hotels International Inc, DiamondRock Hospitality Co, Extended Stay America Inc, Gaming and Leisure Properties Inc, Hilton Worldwide Holdings Inc, Host Hotels & Resorts, Inc., Hyatt Hotels Corporation, La Quinta Holdings Inc, Las Vegas Sands Corp., LaSalle Hotel Properties, Marriott International Inc., MGM Growth Properties LLC, MGM Resorts International, Penn National Gaming, Inc., Sunstone Hotel Investors Inc, Wynn Resorts, Limited, Xenia Hotels & Resorts Inc.

M O R G A N S T A N L E Y R E S E A R C H
52
Gaming & Lodging May 9, 2017
Disclosures The equity research analysts or strategists principally responsible for the preparation of Morgan Stanley Research have received compensation based upon various factors, including quality of research, investor client feedback, stock picking, competitive factors, firm revenues and overall investment banking revenues. Equity Research analysts' or strategists' compensation is not linked to investment banking or capital markets transactions performed by Morgan Stanley or the profitability or revenues of particular trading desks. Morgan Stanley and its affiliates do business that relates to companies/instruments covered in Morgan Stanley Research, including market making, providing liquidity, fund management, commercial banking, extension of credit, investment services and investment banking. Morgan Stanley sells to and buys from customers the securities/instruments of companies covered in Morgan Stanley Research on a principal basis. Morgan Stanley may have a position in the debt of the Company or instruments discussed in this report. Morgan Stanley trades or may trade as principal in the debt securities (or in related derivatives) that are the subject of the debt research report. Certain disclosures listed above are also for compliance with applicable regulations in non-US jurisdictions. STOCK RATINGS Morgan Stanley uses a relative rating system using terms such as Overweight, Equal-weight, Not-Rated or Underweight (see definitions below). Morgan Stanley does not assign ratings of Buy, Hold or Sell to the stocks we cover. Overweight, Equal-weight, Not-Rated and Underweight are not the equivalent of buy, hold and sell. Investors should carefully read the definitions of all ratings used in Morgan Stanley Research. In addition, since Morgan Stanley Research contains more complete information concerning the analyst's views, investors should carefully read Morgan Stanley Research, in its entirety, and not infer the contents from the rating alone. In any case, ratings (or research) should not be used or relied upon as investment advice. An investor's decision to buy or sell a stock should depend on individual circumstances (such as the investor's existing holdings) and other considerations. Global Stock Ratings Distribution (as of April 30, 2017) The Stock Ratings described below apply to Morgan Stanley's Fundamental Equity Research and do not apply to Debt Research produced by the Firm. For disclosure purposes only (in accordance with NASD and NYSE requirements), we include the category headings of Buy, Hold, and Sell alongside our ratings of Overweight, Equal-weight, Not-Rated and Underweight. Morgan Stanley does not assign ratings of Buy, Hold or Sell to the stocks we cover. Overweight, Equal-weight, Not-Rated and Underweight are not the equivalent of buy, hold, and sell but represent recommended relative weightings (see definitions below). To satisfy regulatory requirements, we correspond Overweight, our most positive stock rating, with a buy recommendation; we correspond Equal-weight and Not-Rated to hold and Underweight to sell recommendations, respectively. Data include common stock and ADRs currently assigned ratings. Investment Banking Clients are companies from whom Morgan Stanley received investment banking compensation in the last 12 months. Analyst Stock Ratings Overweight (O). The stock's total return is expected to exceed the average total return of the analyst's industry (or industry team's) coverage universe, on a risk-adjusted basis, over the next 12-18 months. Equal-weight (E). The stock's total return is expected to be in line with the average total return of the analyst's industry (or industry team's) coverage universe, on a risk-adjusted basis, over the next 12-18 months.

M O R G A N S T A N L E Y R E S E A R C H
53
Gaming & Lodging May 9, 2017
Disclosures Not-Rated (NR). Currently the analyst does not have adequate conviction about the stock's total return relative to the average total return of the analyst's industry (or industry team's) coverage universe, on a risk-adjusted basis, over the next 12-18 months. Underweight (U). The stock's total return is expected to be below the average total return of the analyst's industry (or industry team's) coverage universe, on a risk-adjusted basis, over the next 12-18 months. Unless otherwise specified, the time frame for price targets included in Morgan Stanley Research is 12 to 18 months. Analyst Industry Views Attractive (A): The analyst expects the performance of his or her industry coverage universe over the next 12-18 months to be attractive vs. the relevant broad market benchmark, as indicated below. In-Line (I): The analyst expects the performance of his or her industry coverage universe over the next 12-18 months to be in line with the relevant broad market benchmark, as indicated below. Cautious (C): The analyst views the performance of his or her industry coverage universe over the next 12-18 months with caution vs. the relevant broad market benchmark, as indicated below. Benchmarks for each region are as follows: North America - S&P 500; Latin America - relevant MSCI country index or MSCI Latin America Index; Europe - MSCI Europe; Japan - TOPIX; Asia - relevant MSCI country index or MSCI sub-regional index or MSCI AC Asia Pacific ex Japan Index. Important Disclosures for Morgan Stanley Smith Barney LLC Customers Important disclosures regarding the relationship between the companies that are the subject of Morgan Stanley Research and Morgan Stanley Smith Barney LLC or Morgan Stanley or any of their affiliates, are available on the Morgan Stanley Wealth Management disclosure website at www.morganstanley.com/online/researchdisclosures. For Morgan Stanley specific disclosures, you may refer to www.morganstanley.com/researchdisclosures. Each Morgan Stanley Equity Research report is reviewed and approved on behalf of Morgan Stanley Smith Barney LLC. This review and approval is conducted by the same person who reviews the Equity Research report on behalf of Morgan Stanley. This could create a conflict of interest. Other Important Disclosures Morgan Stanley & Co. International PLC and its affiliates have a significant financial interest in the debt securities of Boyd Gaming Corporation, Extended Stay America Inc, Host Hotels & Resorts, Inc., Marriott International Inc., MGM Resorts International. Morgan Stanley Research policy is to update research reports as and when the Research Analyst and Research Management deem appropriate, based on developments with the issuer, the sector, or the market that may have a material impact on the research views or opinions stated therein. In addition, certain Research publications are intended to be updated on a regular periodic basis (weekly/monthly/quarterly/annual) and will ordinarily be updated with that frequency, unless the Research Analyst and Research Management determine that a different publication schedule is appropriate based on current conditions. Morgan Stanley is not acting as a municipal advisor and the opinions or views contained herein are not intended to be, and do not constitute, advice within the meaning of Section 975 of the Dodd-Frank Wall Street Reform and Consumer Protection Act. Morgan Stanley produces an equity research product called a "Tactical Idea." Views contained in a "Tactical Idea" on a particular stock may be contrary to the recommendations or views expressed in research on the same stock. This may be the result of differing time horizons, methodologies, market events, or other factors. For all research available on a particular stock, please contact your sales representative or go to Matrix at http://www.morganstanley.com/matrix. Morgan Stanley Research is provided to our clients through our proprietary research portal on Matrix and also distributed electronically by Morgan Stanley to clients. Certain, but not all, Morgan Stanley Research products are also made available to clients through third-party vendors or redistributed to clients through alternate electronic means as a convenience. For access to all available Morgan Stanley Research, please contact your sales representative or go to Matrix at http://www.morganstanley.com/matrix. Any access and/or use of Morgan Stanley Research is subject to Morgan Stanley's Terms of Use (http://www.morganstanley.com/terms.html). By accessing and/or using Morgan Stanley Research, you are indicating that you have read and agree to be bound by our Terms of Use (http://www.morganstanley.com/terms.html). In addition you consent to Morgan Stanley processing your personal data and using cookies in accordance with our Privacy Policy and our Global Cookies Policy (http://www.morganstanley.com/privacy_pledge.html), including for the purposes of setting your preferences and to collect readership data so that we can deliver better and more personalized service and products to you. To find out more information about how Morgan Stanley processes personal data, how we use cookies and how to reject cookies see our Privacy Policy and our Global Cookies Policy (http://www.morganstanley.com/privacy_pledge.html). If you do not agree to our Terms of Use and/or if you do not wish to provide your consent to Morgan Stanley processing your personal data or using cookies please do not access our research.
M O R G A N S T A N L E Y R E S E A R C H
54
Gaming & Lodging May 9, 2017
Disclosures Morgan Stanley Research does not provide individually tailored investment advice. Morgan Stanley Research has been prepared without regard to the circumstances and objectives of those who receive it. Morgan Stanley recommends that investors independently evaluate particular investments and strategies, and encourages investors to seek the advice of a financial adviser. The appropriateness of an investment or strategy will depend on an investor's circumstances and objectives. The securities, instruments, or strategies discussed in Morgan Stanley Research may not be suitable for all investors, and certain investors may not be eligible to purchase or participate in some or all of them. Morgan Stanley Research is not an offer to buy or sell or the solicitation of an offer to buy or sell any security/instrument or to participate in any particular trading strategy. The value of and income from your investments may vary because of changes in interest rates, foreign exchange rates, default rates, prepayment rates, securities/instruments prices, market indexes, operational or financial conditions of companies or other factors. There may be time limitations on the exercise of options or other rights in securities/instruments transactions. Past performance is not necessarily a guide to future performance. Estimates of future performance are based on assumptions that may not be realized. If provided, and unless otherwise stated, the closing price on the cover page is that of the primary exchange for the subject company's securities/instruments. The fixed income research analysts, strategists or economists principally responsible for the preparation of Morgan Stanley Research have received compensation based upon various factors, including quality, accuracy and value of research, firm profitability or revenues (which include fixed income trading and capital markets profitability or revenues), client feedback and competitive factors. Fixed Income Research analysts', strategists' or economists' compensation is not linked to investment banking or capital markets transactions performed by Morgan Stanley or the profitability or revenues of particular trading desks. The "Important US Regulatory Disclosures on Subject Companies" section in Morgan Stanley Research lists all companies mentioned where Morgan Stanley owns 1% or more of a class of common equity securities of the companies. For all other companies mentioned in Morgan Stanley Research, Morgan Stanley may have an investment of less than 1% in securities/instruments or derivatives of securities/instruments of companies and may trade them in ways different from those discussed in Morgan Stanley Research. Employees of Morgan Stanley not involved in the preparation of Morgan Stanley Research may have investments in securities/instruments or derivatives of securities/instruments of companies mentioned and may trade them in ways different from those discussed in Morgan Stanley Research. Derivatives may be issued by Morgan Stanley or associated persons. With the exception of information regarding Morgan Stanley, Morgan Stanley Research is based on public information. Morgan Stanley makes every effort to use reliable, comprehensive information, but we make no representation that it is accurate or complete. We have no obligation to tell you when opinions or information in Morgan Stanley Research change apart from when we intend to discontinue equity research coverage of a subject company. Facts and views presented in Morgan Stanley Research have not been reviewed by, and may not reflect information known to, professionals in other Morgan Stanley business areas, including investment banking personnel. Morgan Stanley Research personnel may participate in company events such as site visits and are generally prohibited from accepting payment by the company of associated expenses unless pre-approved by authorized members of Research management. Morgan Stanley may make investment decisions that are inconsistent with the recommendations or views in this report. To our readers based in Taiwan or trading in Taiwan securities/instruments: Information on securities/instruments that trade in Taiwan is distributed by Morgan Stanley Taiwan Limited ("MSTL"). Such information is for your reference only. The reader should independently evaluate the investment risks and is solely responsible for their investment decisions. Morgan Stanley Research may not be distributed to the public media or quoted or used by the public media without the express written consent of Morgan Stanley. Any non-customer reader within the scope of Article 7-1 of the Taiwan Stock Exchange Recommendation Regulations accessing and/or receiving Morgan Stanley Research is not permitted to provide Morgan Stanley Research to any third party (including but not limited to related parties, affiliated companies and any other third parties) or engage in any activities regarding Morgan Stanley Research which may create or give the appearance of creating a conflict of interest. Information on securities/instruments that do not trade in Taiwan is for informational purposes only and is not to be construed as a recommendation or a solicitation to trade in such securities/instruments. MSTL may not execute transactions for clients in these securities/instruments. Morgan Stanley is not incorporated under PRC law and the research in relation to this report is conducted outside the PRC. Morgan Stanley Research does not constitute an offer to sell or the solicitation of an offer to buy any securities in the PRC. PRC investors shall have the relevant qualifications to invest in such securities and shall be responsible for obtaining all relevant approvals, licenses, verifications and/or registrations from the relevant governmental authorities themselves. Neither this report nor any part of it is intended as, or shall constitute, provision of any consultancy or advisory service of securities investment as defined under PRC law. Such information is provided for your reference only. Morgan Stanley Research is disseminated in Brazil by Morgan Stanley C.T.V.M. S.A.; in Mexico by Morgan Stanley México, Casa de Bolsa, S.A. de C.V which is regulated by Comision Nacional Bancaria y de Valores. Paseo de los Tamarindos 90, Torre 1, Col. Bosques de las Lomas Floor 29, 05120 Mexico City; in Japan by Morgan Stanley MUFG Securities Co., Ltd. and, for Commodities related research reports only, Morgan Stanley Capital Group Japan Co., Ltd; in Hong Kong by Morgan Stanley Asia Limited (which accepts responsibility for its contents) and by Morgan Stanley Asia International Limited, Hong Kong Branch; in Singapore by Morgan Stanley Asia (Singapore) Pte. (Registration number 199206298Z) and/or Morgan Stanley Asia (Singapore) Securities Pte Ltd (Registration number 200008434H), regulated by the Monetary Authority of Singapore (which accepts legal responsibility for its contents and should be contacted with respect to any matters arising from, or in connection with, Morgan Stanley Research) and by Morgan Stanley Asia International Limited, Singapore Branch

M O R G A N S T A N L E Y R E S E A R C H
55
Gaming & Lodging May 9, 2017
Disclosures (Registration number T11FC0207F); in Australia to "wholesale clients" within the meaning of the Australian Corporations Act by Morgan Stanley Australia Limited A.B.N. 67 003 734 576, holder of Australian financial services license No. 233742, which accepts responsibility for its contents; in Australia to "wholesale clients" and "retail clients" within the meaning of the Australian Corporations Act by Morgan Stanley Wealth Management Australia Pty Ltd (A.B.N. 19 009 145 555, holder of Australian financial services license No. 240813, which accepts responsibility for its contents; in Korea by Morgan Stanley & Co International plc, Seoul Branch; in India by Morgan Stanley India Company Private Limited; in Indonesia by PT. Morgan Stanley Sekuritas Indonesia; in Canada by Morgan Stanley Canada Limited, which has approved of and takes responsibility for its contents in Canada; in Germany by Morgan Stanley Bank AG, Frankfurt am Main and Morgan Stanley Private Wealth Management Limited, Niederlassung Deutschland, regulated by Bundesanstalt fuer Finanzdienstleistungsaufsicht (BaFin); in Spain by Morgan Stanley, S.V., S.A., a Morgan Stanley group company, which is supervised by the Spanish Securities Markets Commission (CNMV) and states that Morgan Stanley Research has been written and distributed in accordance with the rules of conduct applicable to financial research as established under Spanish regulations; in the US by Morgan Stanley & Co. LLC, which accepts responsibility for its contents. Morgan Stanley & Co. International plc, authorized by the Prudential Regulatory Authority and regulated by the Financial Conduct Authority and the Prudential Regulatory Authority, disseminates in the UK research that it has prepared, and approves solely for the purposes of section 21 of the Financial Services and Markets Act 2000, research which has been prepared by any of its affiliates. RMB Morgan Stanley Proprietary Limited is a member of the JSE Limited and regulated by the Financial Services Board in South Africa. RMB Morgan Stanley Proprietary Limited is a joint venture owned equally by Morgan Stanley International Holdings Inc. and RMB Investment Advisory (Proprietary) Limited, which is wholly owned by FirstRand Limited. The information in Morgan Stanley Research is being disseminated by Morgan Stanley Saudi Arabia, regulated by the Capital Market Authority in the Kingdom of Saudi Arabia , and is directed at Sophisticated investors only. Morgan Stanley Hong Kong Securities Limited is the liquidity provider/market maker for securities of Las Vegas Sands Corp. listed on the Stock Exchange of Hong Kong Limited. An updated list can be found on HKEx website: http://www.hkex.com.hk. The information in Morgan Stanley Research is being communicated by Morgan Stanley & Co. International plc (DIFC Branch), regulated by the Dubai Financial Services Authority (the DFSA), and is directed at Professional Clients only, as defined by the DFSA. The financial products or financial services to which this research relates will only be made available to a customer who we are satisfied meets the regulatory criteria to be a Professional Client. The information in Morgan Stanley Research is being communicated by Morgan Stanley & Co. International plc (QFC Branch), regulated by the Qatar Financial Centre Regulatory Authority (the QFCRA), and is directed at business customers and market counterparties only and is not intended for Retail Customers as defined by the QFCRA. As required by the Capital Markets Board of Turkey, investment information, comments and recommendations stated here, are not within the scope of investment advisory activity. Investment advisory service is provided exclusively to persons based on their risk and income preferences by the authorized firms. Comments and recommendations stated here are general in nature. These opinions may not fit to your financial status, risk and return preferences. For this reason, to make an investment decision by relying solely to this information stated here may not bring about outcomes that fit your expectations. The trademarks and service marks contained in Morgan Stanley Research are the property of their respective owners. Third-party data providers make no warranties or representations relating to the accuracy, completeness, or timeliness of the data they provide and shall not have liability for any damages relating to such data. The Global Industry Classification Standard (GICS) was developed by and is the exclusive property of MSCI and S&P. Morgan Stanley Research, or any portion thereof may not be reprinted, sold or redistributed without the written consent of Morgan Stanley.

M O R G A N S T A N L E Y R E S E A R C H
56
Gaming & Lodging May 9, 2017
© 2017 Morgan Stanley
The Americas
1585 Broadway New York, NY 10036-8293 United States Tel: +1 (1) 212 761 4000
Europe
20 Bank Street, Canary Wharf London E14 4AD United Kingdom Tel: +44 (0) 20 7 425 8000
Japan
1-9-7 Otemachi, Chiyoda-ku Tokyo 100-8104 Japan Tel: +81 (0) 3 6836 5000
Asia/Pacific
1 Austin Road West Kowloon Hong Kong Tel: +852 2848 5200