gao-06-80, older workers: labor can help · pdf fileare as of the labor m rket are likely to...
TRANSCRIPT

United States Government Accountability Office
GAO Report to Congressional Committees
OLDER WORKERS
Labor Can Help Employers and Employees Plan Better for the Future
December 2005
GAO-06-80

What GAO FoundWhy GAO Did This Study
HighlightsAccountability Integrity Reliability
December 2005
OLDER WORKERS
Labor Can Help Employers and Employees Plan Better for the Future
Highlights of GAO-06-80, a report to congressional committees
All areas of the labor market are likely to be affected by the aging of the workforce. Like workers in general, a majority of older workers are employed in professional, management, service, office and administrative support, and sales occupations. However, employers in every occupation face the likelihood that a greater percentage of their workforce will be nearing retirement age. Potential skill gaps from impending retirements and a slowdown in the growth of the labor supply may make older workers a resource of growing importance. Focus group participants without a college degree cited health, finances, and layoffs most often as factors constraining the timing of their retirement and work decisions. Participants without such constraints, most often cited lifestyle and work perceptions as the factors driving their decisions. Also, despite survey findings showing that many older workers wish to gradually reduce their hours, overall, focus group participants indicated they either were not aware of options for continued work after retirement or that their current or former employer did nothing to retain them. Many saw barriers to future employment, including their own limited skills and perceived age bias. While some employers are making an effort to hire and retain older workers, such as offering flexible work arrangements, most have not yet made these efforts a priority. We found some examples of programs targeted toward older workers, and many employers express a willingness to initiate practices to retain older workers. However, most surveyed employers do not implement these practices widely. In addition, only about one-third of participants in a roundtable discussion of employers concerned about the aging workforce indicated that they provided a specific plan or program to recruit or retain older workers. Employers cite a number of barriers to offering more opportunities, such as federal pension regulations.
Percentage of Workforce Aged 55 and Older, 1970-2000 and Projected 2010-2050
0
5
10
15
20
25
30
205020402030202020102000199019801970
Percentage
Historical Projected
Demographic changes pose serious challenges for employers, the economy, and older Americans. As the baby boomers near traditional retirement ages, the loss of experienced workers could have adverse effects on productivity and economic growth. Also, many older Americans face less-secure retirements due to rising health care costs, pension coverage changes, and fiscal pressures on the nation’s retirement programs. Due to the growing importance of workers aged 55 or older, GAO examined: (1) areas of the labor market affected by the aging of the workforce; (2) factors that influence the timing of retirement; and (3) what employers are doing to hire and retain older workers.
What GAO Recommends
GAO recommends that the Secretary of Labor design a comprehensive and highly visible public awareness campaign as a way to help employers and employees plan better for the future and by so doing, bridge the gap between employer and employee needs. The campaign should involve other relevant agencies and target employer organizations and groups that interact with employees and, ultimately, encourage employers to find ways to retain and recruit older workers, and assist older workers in finding opportunities for continued work. The Department of Labor generally agreed with our findings and recommendation.
United States Government Accountability Office
Source: Mitra Toossi, “A Century of Change: the U.S. Labor Force, 1950-2050,” Monthly Labor Review, May 2002.
www.gao.gov/cgi-bin/getrpt?GAO-06-80. To view the full product, including the scope and methodology, click on the link above. For more information, contact Barbara D. Bovbjerg at (202) 512-7215 or [email protected].

Contents
Letter 1
Results in Brief 2Background 4 All Parts of the Labor Market Will Be Affected by the Aging of the
Workforce 14 Health, Finances, Lay-offs, and Perceptions about Lifestyle and
Work Are the Primary Factors Influencing the Timing of Older Workers’ Retirement and Work Decisions 19
While Some Employers Make a Special Effort to Hire and Retain Older Workers, Most Do Not 26
Conclusions 30 Recommendation for Executive Action 32 Agency Comments and Our Evaluation 33
Appendix I Objectives, Scope, and Methodology 36
Appendix II Comments from the Department of Labor 39
Appendix III Occupational Categories 41
Appendix IV Focus Group Moderator’s Guides 43
Appendix V Employer Participant List for Roundtable Discussion
on Older Workers 52
Appendix VI GAO Contact and Staff Acknowledgments 54
Tables
Table 1: Stress and Physical Requirements of Work by Occupation, 2002 19
Page i GAO-06-80 Older Workers
Table 2: Focus Group Participant Statements on the Importance of Finances 22
Figures
Figure 1: Life Expectancy at Age 65, 1970-2000 and Projected 2001-2020 5
Figure 2: U.S. Labor Force Growth Through 2080 7 Figure 3: U.S. Elderly Dependency Ratio, 1950-2000 and Projected
2005-2050 8 Figure 4: Percentage of Workforce Aged 55 and Older, 1970-2000
and Projected 2010-2050 9 Figure 5: Older Workers (Aged 55 to 74) as a Share of the Total
Workforce (Aged 25 to 74) in each Occupational Category (Historical and Extrapolated Data) 16
Figure 6: Number of Workers Aged 55-74 by Occupation (Historical and Extrapolated Data) 17
Abbreviations
ADEA Age Discrimination in Employment Act BLS Bureau of Labor Statistics CPS Current Population Survey CRS Congressional Research Service DB defined benefit DC defined contribution DROP Deferred Retirement Option Plan EBSA Employee Benefits Security Administration ETA Employment and Training Administration HRS Health and Retirement Study IRS Internal Revenue Service OPM Office of Personnel Management SSA Social Security Administration
This is a work of the U.S. government and is not subject to copyright protection in the United States. It may be reproduced and distributed in its entirety without further permission from GAO. However, because this work may contain copyrighted images or other material, permission from the copyright holder may be necessary if you wish to reproduce this material separately.
Page ii GAO-06-80 Older Workers

United States Government Accountability Office
Washington, DC 20548
December 5, 2005
Congressional Committees
In the coming decades, the combination of increasing life expectancy and declining birth rates is expected to reduce the number of workers per retiree, a trend that will strain the finances of national pension and health programs and may affect productivity and economic growth. In addition, the impending retirement of the baby boom generation and slower labor force growth will result in the loss of many experienced workers and possible skill gaps in certain occupations. At the same time, many older workers face the possibility of less secure retirements. While longer life spans have increased the number of years individuals spend in retirement, pension plans have increasingly shifted financial and longevity risk to individuals and health care costs have risen rapidly. In addition, the increasing ratio of the elderly to younger workers will place added pressure on public benefits such as Social Security and Medicare, both of which face long-term financial problems. Though the oldest baby boomers have not yet reached retirement age, new public policies may be necessary to address the economic challenges these demographic changes present.
As we reported previously, these problems could be mitigated with policies that remove disincentives to work for older Americans and allow those who want to work to continue doing so either by delaying retirement or retiring only partially.1 Working later in life could help minimize job vacancies and skill losses, increase personal retirement savings, and ease fiscal pressures on Social Security and Medicare through increased tax revenues. Yet most American workers take Social Security retirement benefits at age 62, and little has been done to encourage those who can and want to work later in life to do so.
We have prepared this report under the Comptroller General’s authority to assist Congress in addressing these issues. As it may prove helpful in the deliberations of committees with jurisdiction over aging and workforce issues, we have addressed this report to each of these committees.
1GAO, Older Workers: Demographic Trends Pose Challenges for Employers and Workers, GAO-02-85 (Washington, D.C.: November 2001).
Page 1 GAO-06-80 Older Workers

Due to the growing importance of older workers to the labor force, the economy, and the future health of U.S. retirement programs, we examined: (1) which areas of the labor market will be most affected by the aging of the workforce; (2) the factors that most influence the timing of older workers’ retirement; and (3) what employers are doing to hire and retain older workers.
To find out which areas of the labor market will be most affected by the aging of the workforce, we developed a method of analyzing Current Population Survey data from the Bureau of Labor Statistics (BLS) that allowed us to perform a 10-year extrapolation of employment by age and occupation. To identify the factors that most influence the timing of older workers’ retirement, we conducted 16 focus groups in four cities across the country. In each city, we grouped participants, aged 55 to 70, into four categories according to their education and work status; in addition, Washington, D.C., participants were screened to include only current and former federal employees. We also analyzed data from the Health and Retirement Study (HRS), a national survey of older Americans produced by the University of Michigan, to better understand their decisions and circumstances regarding work and retirement. To identify what employers are doing to hire and retain older workers, we reviewed the findings of several surveys of employers, some with generalizeable samples and some of selected employers. With the assistance of the Department of Labor’s Employment and Training Administration, we facilitated a roundtable discussion of employers’ concerns and strategies for their workforces. We conducted our work between October 2004 and October 2005 according to generally accepted government auditing standards. For additional information on our methodology, see appendix I.
All areas of the labor market employ workers nearing traditional retirement age and are likely to be affected by the aging of the workforce. Almost 80 percent of older workers, those between the ages of 55 and 74, are employed in professional, management, service, office and administrative support, and sales occupations; these occupations make up approximately 76 percent of the total workforce aged 25 to 74. By 2014, the number of older workers in each of these occupations is projected to grow considerably—some, such as professional occupations, may grow by as much as 41 percent. Employers in every occupation face the likelihood that a greater percentage of their workforce will be nearing retirement age, and that impending retirements will result in the loss of a significant number of experienced workers in a short period of time. Given these potential skill gaps and a slowdown in the growth of the labor supply,
Results in Brief
Page 2 GAO-06-80 Older Workers
older workers may become a resource of growing importance to employers.
Based on focus group discussions, participants without a college degree most often cited health, finances, and lay-offs as the most important factors constraining the timing of their retirement and work decisions. Some of these older workers indicated they were forced to retire either due to health problems or because they were laid off. Others stated they have no choice about when to work and retire because their finances dictate that they remain employed. For participants with a choice about work and retirement decisions, work and lifestyle perceptions were the most often cited factors that motivated the timing of their work and retirement choices. For example, both college graduates and non-college graduates who were satisfied with their workplaces were more likely to say they will work indefinitely, while those who said that they are not valued were more likely to say they would retire. Also, lifestyle considerations were important to many older workers with a college degree. For example, some older workers said that the desire to have flexibility and control over their time influenced their retirement decisions. Similarly, the HRS national survey data indicate that just over 60 percent of full-time workers age 55 or older express a desire to gradually reduce their hours at their current jobs. However, individuals in our focus groups generally did not see opportunities to do that with their current employers, and they did not perceive that their current or former employers sought to retain them. In addition, many saw general barriers to future employment such as outdated or limited skills on their part, age discrimination by employers, and employment opportunities limited to lower skilled, lower paid jobs.
While some employers are making an effort to hire and retain older workers, most have not yet made targeting older workers a priority. Certain employers have special programs in which they recruit older workers. For example, the Home Depot has a partnership with AARP to actively recruit older workers for full-time, part-time, and seasonal work. We also found examples of employers who were making an effort to retain certain older workers already on staff. Employers participating in a roundtable discussion on the aging workforce reported using a number of practices to hire and retain older workers, such as flexible or reduced hours, mentoring, and training. Some studies have found that, while a fairly large number of employers think that phased or partial retirement is important, a much smaller number have actually implemented such policies. Nonetheless, surveyed employers indicated a willingness to initiate practices to retain certain older workers. About 73 percent of
Page 3 GAO-06-80 Older Workers

employers in a study by Cornell University said they would allow partial retirement, though they had no written policy for doing so. In addition, only about one-third of the 16 employer roundtable participants indicated that they provided a specific plan or program to recruit or retain older workers, despite agreeing that the aging workforce was an important issue for the future. Employers cite a number of factors for not offering more opportunities, such as the constraints of federal pension regulations.
This report contains a recommendation to the Secretary of Labor to design a comprehensive and highly visible public awareness campaign as a way to help employers and employees plan better for the future and by so doing, bridge the gap between employer and employee needs. In designing the campaign, the Department of Labor (Labor) should involve other relevant agencies with regulatory jurisdiction or a clear policy interest. We provided a draft of this report to the Department of Labor, the Internal Revenue Service (IRS), the Office of Personnel Management (OPM), and the Social Security Administration (SSA) for comment. Officials from the Department of Labor provided written comments (see app. II), and generally agreed with our findings and the recommendation. In response to their comments, which highlighted actions that the Department has already taken, we clarified our recommendation to include other federal agencies in the development of a public awareness campaign. OPM and SSA provided no written comments on the draft, while Labor and the IRS provided us with technical comments, which we have incorporated into the report as appropriate.
Significant demographic changes in the United States, such as the aging of the baby boom generation (those born between 1946 and 1964), increased life expectancy, and falling fertility rates pose serious challenges for individuals, employers, and the economy. As the baby boom generation retires, employers face the loss of experienced workers and their skills and an expected slowdown in the growth of the labor supply, which could have adverse effects on productivity and economic growth. At the same time, many older Americans face a less secure retirement as the increasing number of elderly relative to younger workers will place added pressure on Social Security and Medicare, both of which face long-term financial problems.
In the 21st century, older Americans are expected to make up a larger share of the U.S. population, live longer, and spend more years in retirement than previous generations. The baby boom generation is fast
Background
Demographic changes
Page 4 GAO-06-80 Older Workers

approaching retirement age. The oldest baby boomers will start to turn age 65 in 2011, just 6 years from now, and in just 3 years, they will become eligible for Social Security benefits.2 The share of the U.S. population age 65 and older is projected to increase from 15.6 percent in 2000 to almost 24.2 percent in 2030. In addition, life expectancy is increasing. The average number of years that men who reach age 65 are expected to live has increased from just over 13 in 1970 to 16 in 2005, and is projected to increase to 17 by 2020. Women have experienced a similar rise—from 17 years in 1970 to over 19 years in 2005. By 2020, women who reach age 65 will be expected to live another 20 years. (See fig. 1.)
Figure 1: Life Expectancy at Age 65, 1970-2000 and Projected 2001-2020
2The age of eligibility for early Social Security retirement benefits is 62.
Page 5 GAO-06-80 Older Workers

While life expectancy has increased, labor force participation rates of older Americans only began to increase slightly in recent years. As a result, individuals are generally spending more years in retirement. The average male worker spent 18 years in retirement in 2003, up from less than 12 years in 1950.
In addition to these factors, falling fertility rates are contributing to the increasing share of the elderly population and a slowing in the growth of the labor force. In the 1960s, the fertility rate was an average of three children per woman.3 Since the 1970s, the fertility rate has hovered around two children per woman, meaning fewer future workers are being born to replace retirees. Also contributing to the slowing in the growth of the labor force is the leveling off of women’s labor force participation rate. While women’s share of the labor force increased dramatically between 1950 and 2000—from 30 percent to 47 percent—their share of the labor force is projected to remain at around 48 percent over the next 50 years. By 2025 labor force growth is expected to be less than a fifth of what it is today.4 (See fig. 2.)
3The fertility rate is defined as the total number of children born per 1,000 women aged 15 to 44 years.
4Although a lower fertility rate contributes to the increased share of retirees in the population, the increased participation of women in the workforce has helped to reduce the number of retirees per worker. Some researchers have hypothesized that a rising fertility rate would correspond to a decline in the labor force participation of women.
Page 6 GAO-06-80 Older Workers
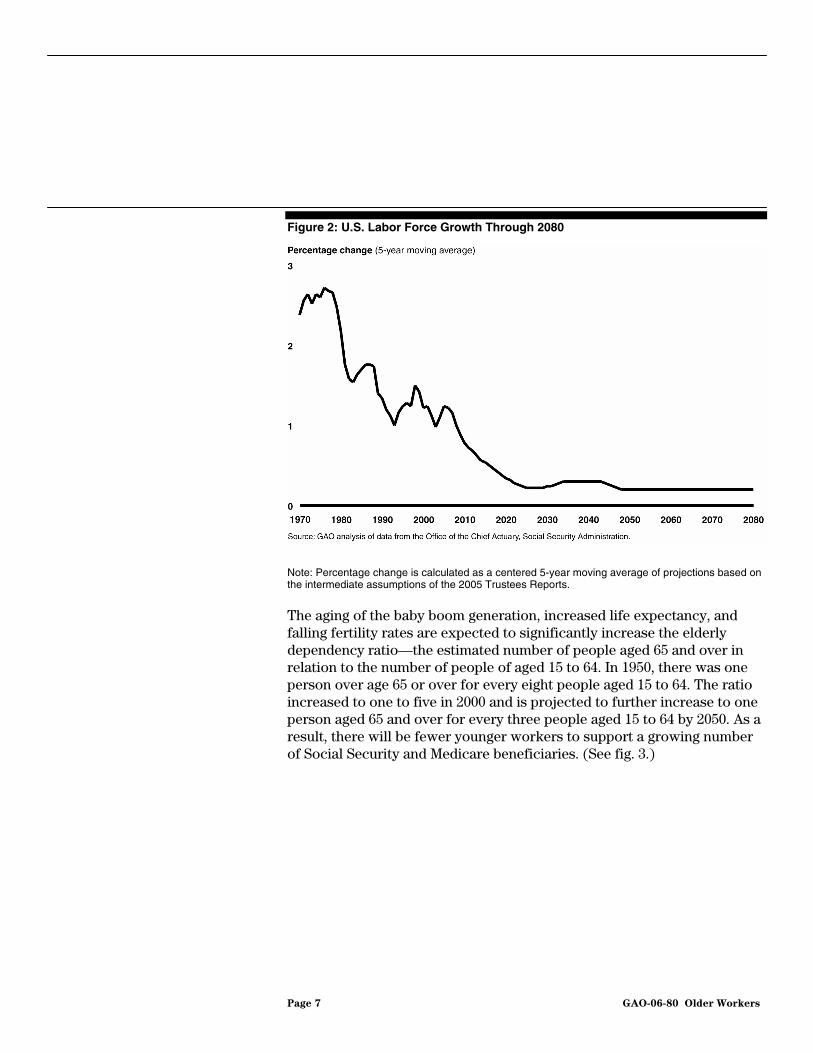
Figure 2: U.S. Labor Force Growth Through 2080
Note: Percentage change is calculated as a centered 5-year moving average of projections based on the intermediate assumptions of the 2005 Trustees Reports.
The aging of the baby boom generation, increased life expectancy, and falling fertility rates are expected to significantly increase the elderly dependency ratio—the estimated number of people aged 65 and over in relation to the number of people of aged 15 to 64. In 1950, there was one person over age 65 or over for every eight people aged 15 to 64. The ratio increased to one to five in 2000 and is projected to further increase to one person aged 65 and over for every three people aged 15 to 64 by 2050. As a result, there will be fewer younger workers to support a growing number of Social Security and Medicare beneficiaries. (See fig. 3.)
Page 7 GAO-06-80 Older Workers

Figure 3: U.S. Elderly Dependency Ratio, 1950-2000 and Projected 2005-2050
Note: The elderly dependency ratio is the ratio of the population aged 65 years or over to the population aged 15 to 64. Data for 2005 through 2050 are projected.
The aging of the population also has potential implications for the nation’s economy. If labor force growth continues to slow as projected, fewer workers will be available to produce goods and services. Without a major increase in productivity or higher than projected immigration, low labor force growth will lead to slower growth in the economy and slower growth of federal revenues. These circumstances in turn will accentuate the overall pressure on the federal budget, which will be encumbered with increased claims for benefits for seniors such as Medicare and Social Security, while relatively fewer workers are paying into the benefits systems.
An additional concern is the possible loss of many experienced workers as the baby boomers retire. In the next 10 years, as workers near retirement age, those aged 55 and over will make up a larger proportion of the workforce. (See fig. 4.)
Page 8 GAO-06-80 Older Workers

Figure 4: Percentage of Workforce Aged 55 and Older, 1970-2000 and Projected 2010-2050
Some research has indicated that the impending retirements of the baby boom generation and the decline in the growth of the labor supply could affect certain industries and occupations more than others.5 These trends could create gaps in skilled worker and managerial occupations, leading to further adverse effects on productivity and economic growth.
These demographic changes and their economic and financial implications are not unique to the United States. Other countries are also confronting the economic and labor force effects of aging populations. In fact, the challenges arising from these demographic shifts will be less pronounced in the United States than in several other high-income nations, such as Japan, Italy, and Sweden. In prior work, we found that Japan, Sweden, and the United Kingdom had enacted retirement policy reforms that included
5Arlene Dohm, “Gauging the Labor Force Effects of Retiring Baby-Boomers,” Monthly
Labor Review, July 2000; GAO-02-85.
Page 9 GAO-06-80 Older Workers

incentives for older workers to extend their working lives.6 At the same time, these countries were also seeking policies that would reduce barriers to employment for older workers.
Changes in Retirement Security
As they are expected to live longer and spend more years in retirement, older Americans today face several challenges that contribute to the growing insecurity of retirement income. First, while more older Americans are working, many claim Social Security benefits when they first become eligible and many more claim them prior to reaching the full retirement age, resulting in lower monthly payments.7 Data from the Social Security Administration show that in 2002 a majority of people (56.1 percent) elected to start benefits at the early retirement age of 62, thus receiving over a 20 percent reduction in monthly benefits.
Second, workers bear greater risk and responsibility for their retirement savings than in the past. About half of U.S. workers do not have a pension plan through their employer, and those who do are less likely than in the past to be covered by defined benefit (DB) plans, which pay a specified amount per month. Employers have increasingly shifted from traditional DB to defined contribution (DC) plans, such as 401(k)s, which are based on contributions to and investment returns on individuals’ accounts. Compared to DB plans, DC plans place greater responsibility on workers to make prudent investment decisions and to manage longevity risk. According to data from the Employee Benefits Security Administration (EBSA), the number of participants in DB plans in the United States increased by about 12 percent, while the number of participants in DC plans more than tripled from 1978 to 1997.8 One study found almost 58 percent of families participating in an employment-based retirement
6GAO, Older Workers: Policies of Other Nations to Increase Labor Force Participation, GAO-03-307 (Washington, D.C.: Feb. 13, 2003).
7The full eligibility age (or normal retirement age) for Social Security benefits is being raised from 65 to 67 from 2000 to 2022. When the full eligibility age was 65, the benefit reduction for taking benefits at age 62 was 20 percent. When the age increase to 67 is fully implemented, the reduction will be 30 percent. The reduction in monthly payments for claiming early Social Security retirement benefits takes account of the longer period of time over which benefits will be paid.
8EBSA data also indicates that the number of defined benefit plans declined by 54 percent from 1978 to 1997.
Page 10 GAO-06-80 Older Workers
plan had only a DC retirement plan in 2001, up from about 37 percent in 1992.9
Furthermore, rising health care costs have made health insurance and anticipated medical expenses increasingly important issues for older Americans. A long-term decline in the percentage of employers offering retiree health coverage has leveled off in recent years, but retirees face an increasing share of costs, eligibility restrictions, and benefit changes that contribute to an overall erosion in the value and availability of coverage.10 A recent study estimated that the percentage of after-tax income spent on health care will almost double for older married couples and singles by 2030.11 People with lower incomes will be the most adversely affected. The study projected that by 2030, those in the bottom 20 percent of the income distribution would spend more than 50 percent of their after-tax income on insurance premiums and health care expenses, an increase of 30 percentage points from 2000.
Another implication of the changes in demographics, the shift to more employee-driven pension plans, and rising health care costs is that retirees may be more dependent upon public benefits such as Social Security and Medicare than their predecessors. As older Americans face less secure retirements, many may need additional income from continued employment.
Partial Retirement If older Americans remain in the labor force longer at least on a part-time
basis, it could mitigate some of the economic pressures on Social Security as well as supplement individual retirement incomes and help finance health care. Researchers have noted that partial or phased retirement options could encourage more older workers to stay in the workforce longer. “Partial retirement,” like “retirement,” may mean different things to different people. Some people consider themselves retired when they are no longer working for pay, while others who continue to work may
9Craig Copeland, “Individual Account Retirement Plans: An Analysis of the 2001 Survey of Consumer Finances,” Employee Benefit Research Institute, Issue Brief No. 259, July 2003.
10GAO, Retiree Health Benefits: Options for Employment-Based Prescription Drug
Benefits under the Medicare Modernization Act, GAO-05-205 (Washington, D.C.: Feb. 2005).
11Richard W. Johnson and Rudolph G. Penner, “Will Health Care Costs Erode Retirement Security?” Issue in Brief, Center for Retirement Research at Boston College, (2004) No. 23.
Page 11 GAO-06-80 Older Workers

consider themselves retired if they have reduced hours, changed jobs, or are collecting some type of retirement benefit. For the purposes of this report, we generally consider a person to be partially retired if they classified themselves as partially or fully retired but were still working for pay on a part-time basis. A partial retiree may transition directly from full- to part-time work at either a current or a new job, or may return to work after full retirement. Phased retirement refers specifically to employees who reduce their hours at their existing (previously full-time) job.12
According to the Health and Retirement Study (HRS), about 20 percent of older Americans who were working full-time in 1992 became partially retired at some point by 2002. On average, partial retirees reduced their work hours from full-time employment by half, about 22.5 hours a week. Most partial retirees report that they have a pension plan from a current or previous employer. About 47 percent have a DB pension plan, 41 percent have a DC plan, 11 percent have a hybrid plan, and 16 percent have no pension plan. However, almost 62 percent of partial retirees do not have employer-provided health insurance from their current or previous employer.
Research indicates that current pension regulations may be a barrier to partial retirement. Regulations under the Internal Revenue Code of 1986 (the Code) currently prohibit “in-service” distributions from DB pension plans until the employee attains the plan’s normal retirement age.13 Older workers who want to partially retire after their plan’s early retirement age, but before the normal retirement age, will not be able to access their pension benefit if they continue working for the same employer. However, they may legally access their pension benefit if they leave their employer to work part-time with a new employer. Some employers report that some employees will officially retire and begin receiving pension income and
12While we refer to phased retirement as any reduction in hours at an existing job, it should be noted that proposed IRS regulations, 69 Fed. Reg. 65108 (2004), refer to a “bona fide phased retirement program” as one that is a written, employer-adopted program under which employees may begin working fewer hours and receiving phased retirement benefits on or after a specified retirement date.
13In-service distributions refer to the receipt of pension benefits while the participant is still employed with the employer that sponsored the pension plan. Individuals with DC pensions are able to access their pension benefits once they have attained age 59 ½ regardless of their work status.
Page 12 GAO-06-80 Older Workers

then return to work after a certain period of time, but this practice does not appear to be widespread.14
The IRS proposed regulations in November 2004 to allow for partial in-service distributions of DB pensions.15 These proposed regulations may alleviate the barriers to partial retirement posed by current pension regulations. The new regulations would permit eligible older workers who reduce their hours by at least 20 percent to receive a pro-rated portion of their pension benefits. The arrangements would need to be voluntary and in writing. Employer representatives who provided feedback to the IRS at a hearing in March 2005 indicated that the proposed regulations are a step in the right direction, though some felt that they would be too administratively burdensome.
Concerns about permitting in-service distributions have been outlined by the Congressional Research Service (CRS). They note that the effect of in-service distributions on total lifetime work hours is unknown. By allowing in-service distributions, some older workers may stay in the workforce longer and increase total lifetime work hours. However, other older workers may choose to reduce their hours when they would have otherwise continued working full-time until reaching their plan’s normal retirement age, which could reduce their total lifetime work hours. In addition, CRS notes that some observers believe permitting in-service distributions would make the pension benefit become a tax-subsidized wage supplement.16 At this writing, the IRS has not yet issued final regulations.
Age discrimination and uncertainty about legal protections against age discrimination may also affect older workers’ employment opportunities. Employees and job applicants aged 40 and over are legally protected from age discrimination by the Age Discrimination in Employment Act (ADEA). The ADEA applies to the following terms, conditions, or privileges of employment: hiring, firing, promotion, lay-off, compensation, benefits, job
14Proposed IRS regulations concerning phased retirement programs (discussed below) do not address when a full retirement occurs and do not endorse a prearranged termination and rehire as constituting a full retirement. “Distributions From a Pension Plan Under a Phased Retirement Program,” 69 Fed. Reg. 65108 (2004).
15Ibid.
16Patrick Purcell, “Older Workers: Employment and Retirement Trends,” Congressional
Research Service Report for Congress, Sept. 14, 2005.
Page 13 GAO-06-80 Older Workers
assignments, and training. The breadth and impact of the ADEA continues to develop under case law by the courts in interpreting key provisions.17 Some experts have noted that, because of this, employers are unsure of how the law might apply to phased retirement programs and are reluctant to expose themselves to such legal uncertainty.
In our 2001 report that described these demographic and legal challenges, we recommended that the Secretary of Labor convene an inter-agency task force to develop legislative and regulatory proposals addressing the issues raised by the aging of the labor force.18 To date this recommendation has not been implemented.19 However, recent legislation introduced in Congress includes a provision to create such a task force.20
The aging of the workforce will affect all parts of the labor market. Older workers are distributed throughout the economy and employers are likely to be affected as their workers near traditional retirement ages. By 2014, the number of older workers in each major occupational category is expected to increase considerably, especially in white-collar and service occupations. As the proportion of older workers increases, their employers face the loss of a significant number of workers with institutional knowledge and skills to retirement over a short period of time. Given the potential loss of skills and the expected slower growth in the labor supply, older workers may become an increasingly important resource for employers.
All Parts of the Labor Market Will Be Affected by the Aging of the Workforce
17A recent Supreme Court ruling on the ADEA held that employees are allowed to make “disparate impact” claims under ADEA, meaning that employees do not have to prove intentional discrimination by the employer. Smith v. City of Jackson, Miss., 125 S. Ct. 1536 (2005). Another recent ruling held that employers are allowed to favor older workers over younger workers even if the younger workers are age 40 and over and, thus, are in ADEA’s protected class. Therefore, a benefit geared toward relatively older workers, such as partial or phased retirement, would likely not be considered discriminatory toward relatively younger workers who are age 40 and over. General Dynamics Land Systems v. Clines, 540 U.S. 581 (2004).
18GAO-02-85.
19In November 2004, the Department of Labor’s Employment and Training Administration (ETA) did form an intra-agency taskforce, composed of DOL staff only, focused on the issues and concerns of the older worker population.
20See Older Worker Opportunity Act (S. 1826).
Page 14 GAO-06-80 Older Workers
Like the workforce as a whole, the majority of workers ages 55 to 74 are employed in white-collar and service occupations.21 Data from the BLS indicate that, in 2004, almost 80 percent of older workers fell into these categories, which include professional, management, service, office and administrative support, and sales occupations; these occupations also make up approximately 76 percent of the total workforce aged 25 to 74. In particular, professional and related occupations, which include lawyers, teachers, and scientists, employ the largest number of older workers— 4.5 million or 21 percent of older workers. Blue-collar occupations employ a smaller number of older workers than white-collar occupations.22 Among blue-collar occupations, production and transportation and material moving occupations employ the most older workers. These occupations each employ about 1.3 million older workers. For more information on the types of jobs in each major occupational category, see appendix III.
Older Workers Are Distributed Throughout the Workforce and the Number of Older Workers Will Grow in Every Occupational Category
Based on our extrapolations using data from the BLS, the proportion of the workforce represented by older workers is expected to increase in every occupational category.23 The share of total employment comprised of older workers is expected to be largest in white-collar occupations, as shown in figure 5. From 2004 to 2014, the proportion of white-collar employment made up of older workers is expected to increase from 19 percent to 23 percent. Over the same period, the share of employment in service and blue-collar occupations comprised of older workers also is expected to increase. Although some occupations may have a smaller number of older workers, they may still be significantly affected by the aging of the workforce because older workers make up a considerable
21The workforce refers to employment of the total civilian population aged 16 and older. We define white-collar occupations to include the following BLS occupational categories: management, business and financial operations; professional and related; sales and related; and office and administrative support. Blue-collar occupations include the following BLS categories: farming, fishing, and forestry; construction and extraction; installation, maintenance, and repair; production; and transportation and material moving (for more information on occupational categories see app. III). Occupational data includes both public and private sector employment.
22In prior work we found that the movement away from blue-collar work is more pronounced among older workers. See: GAO-02-85, 14.
23We define older workers as those between the ages of 55 to 74 for purposes of our extrapolations. Labor force participation rates are considerably lower in the age 65 to 74 group compared to the age 55 to 64 group. However, recently, labor force participation rates among workers aged 65 to 74 have been rising and are projected to continue rising as the population ages.
Page 15 GAO-06-80 Older Workers

share of their workforce. For example, by 2014, approximately 25 percent of farming, fishing, and forestry occupations will consist of older workers.
Figure 5: Older Workers (Aged 55 to 74) as a Share of the Total Workforce (Aged 25 to 74) in each Occupational Category (Historical and Extrapolated Data)
Note: Data for 2014 are based on GAO extrapolations.
Similarly, by 2014, the number of older workers in each major occupational category is expected to increase considerably, especially in white-collar and service occupations. In earlier work in 2001, our employment projections to 2008 also indicated that the largest change in the number of older workers is expected to be in white-collar occupations.24 Among the different occupations, the number of older workers in professional occupations is expected to increase the most—from almost 4.5 million in 2004 to more than 6.3 million in 2014, a growth rate of about 41 percent. See figure 6.
24GAO-02-85, 14.
Page 16 GAO-06-80 Older Workers

Figure 6: Number of Workers Aged 55-74 by Occupation (Historical and Extrapolated Data)
Note: Data for 2014 are based on GAO extrapolations.
Management, business, and financial operations occupations employ the second largest number of older workers, and employment in this area is expected to grow by 35 percent, to almost 5.3 million in 2014. The number of older workers in farming, fishing, and forestry occupations is expected to grow the most, almost 68 percent in the 10-year period; however, these occupations in aggregate account for less than 1 percent of total employment of older workers.
At the industry level, the public sector, including federal, state, and local governments, also employs a relatively large number of older workers and faces the possibility of many retirements in the near future. According to data from the BLS, almost 21 percent of the nation’s 3.2 million federal workers were aged 55 or older in 2004. At the state and local government level, slightly more than 19 percent of workers, out of a workforce of 16.7 million, were aged 55 or older. The public sector has a greater share
Page 17 GAO-06-80 Older Workers
of older workers compared to private industries in aggregate, where the share of workers aged 55 and over was 14 percent, or about 15.1 million older workers in 2004.
Employers of Older Workers May Face Skill Losses and Many Job Vacancies
As the proportion of older workers increases in each occupational category, employers face the possibility that the impending retirement of the baby boom generation will result in losses of institutional knowledge and create many job vacancies over a short time period. For example, employers in white-collar management, business, and financial operations occupations are expected to have the greatest share of their workforce consist of older workers. According to our extrapolations using BLS data, by 2014, older workers could make up 26 percent of employment in these occupations. Given older workers’ skills and the fact that there may be relatively fewer younger workers available to take their places, older workers may become an increasingly important resource for employers.
With significant numbers of experienced, skilled older workers poised to retire and an expected slowdown in the growth of the labor supply, employers may need to retain or recruit older workers. This may, however, be complicated by the nature of the jobs and older workers’ preferences. Data from the HRS indicates that while occupations that tend to employ the most older workers are less likely to be physically demanding, they are more likely to entail considerable stress. (See table 1.) According to the HRS, almost 66 percent of workers in managerial occupations and 63 percent of workers in professional occupations report that their jobs involve much stress all or most of the time, which is higher than reported for the other major occupational categories. Survey data from the AARP indicate that not having too much stress is an important consideration for post-retirement work for the vast majority of pre-retirees and working retirees.25 The degree of physical effort required by a job will also be a consideration for employers as the workforce ages, particularly for blue-collar and service occupations that employ a large percentage of older workers. While relatively few workers in white-collar occupations indicate that their jobs are physically demanding, the majority of workers in many blue-collar and service occupations report that their jobs often involve considerable physical effort. For example, about 52 percent of
25S. Kathi Brown, “Staying Ahead of the Curve 2003: The AARP Working in Retirement Study,” AARP, (2003) 7.
Page 18 GAO-06-80 Older Workers

those employed in service occupations said that their job requires much physical effort all or most of the time.
Table 1: Stress and Physical Requirements of Work by Occupation, 2002
Occupation
Percent reporting that job involves much stress all or
most of the time
Percent reporting that job involves much physical
effort all or most of the time
White-collar:
Managerial 65.5 12.7
Professional 62.9 17.9
Sales 54.4 24.5
Clerical, administrative support 55.6 15.6
Services 43.2 51.6
Blue-collar:
Farming, forestry, and fishing 46.6 63.4
Mechanics and repair 55.1 53.4
Construction and extraction 42.5 66.2
Precision production 47.8 46.9
Operators 46.0 51.8
Source: GAO analysis of 2002 HRS data.
Note: Occupational categories in the HRS are not exactly the same as in the BLS and Current Population Survey (CPS) data. BLS and CPS occupational categories were reclassified in 2003.
Focus group participants without a college degree most often indicated that the timing of their work and retirement decisions was constrained by health, finances, and lay-offs. “Health” was the most often cited factor for these participants, who reported that they had no choice but to retire or limit work when they did because of health problems, while others reported felt they had to continue working to earn more money, and still others were laid off. For participants with a choice about work and retirement decisions, work and lifestyle perceptions were the most often cited factors that motivated the timing of their work and retirement choices. For example, both college graduates and non-college graduates who were satisfied with their workplaces were more likely to say they will work indefinitely, while those who said that their work environments have changed or that they are not valued were more likely to say they would retire. Also, lifestyle considerations were important to many older workers
Health, Finances, Lay-offs, and Perceptions about Lifestyle and Work Are the Primary Factors Influencing the Timing of Older Workers’ Retirement and Work Decisions
Page 19 GAO-06-80 Older Workers
with a college degree. For example, some older workers said that the desire to have flexibility and control over their time influenced their retirement decisions. Across all the groups, few saw opportunities to gradually or partially retire with their current or former employer, and few felt that their current employer would offer them incentives to continue working later in life. In discussing obstacles to working later in life, participants across groups most often cited lack of demand for their skills and age discrimination in the workplace; many also felt that their employment options were limited to lower paid, lower skilled jobs.
Health, Finances, and Lay-offs May Dictate When Some Older Workers Work and Retire
Health was the most-often cited constraint on work and retirement decisions by participants without college degrees. Participants without college degrees cited health as a constraint more often than college-educated participants. Among participants in all the focus groups, many indicated they had no choice but to retire or limit work when health problems made them unable to work. For example, some participants said that they would not be able to get a new job because their health situation prevented it; others found that they could not stay at their current job.
Relatively few participants in each focus group indicated that they were compelled to work to acquire health insurance. The fact that at least 95 percent of focus group participants had health insurance may be an explanation. The rate of insured participants is similar to that of the general population of older Americans. According to the U.S. Census Bureau, of all Americans ages 55 to 64, about 87 percent have some form of health insurance.26
Although few participants stated that health insurance was a major factor in their decisions about work or retirement, some participants were generally concerned about health care. For example, one participant stated, “If you don’t have any health insurance it’s tough out there.” Another was concerned that the cost for their health insurance would be a barrier for employment. “I’m thinking they let me go because of my age, and they don’t have to pay extra insurance, whatever they have to pay.” On
26According to the U.S. Census Bureau, among those aged 55 to 64, approximately 67 percent of coverage was through an employer, 18 percent was through a public program, and 10 percent was through direct purchase. Workers who are 65 or older or are disabled qualify for the federal Medicare insurance program. Carmen DeNavas-Walt, Bernadette D. Proctor, and Cheryl Hill Lee, U.S. Census Bureau, “Income, Poverty, and Health Insurance Coverage in the United States: 2004,” (2005) 74.
Page 20 GAO-06-80 Older Workers

the other hand, others stated that they were desirable employees to prospective employers because they already had health insurance.27
As with health insurance, focus group participants also did not often cite pension rules as a reason for making retirement and work decisions. In fact, much of the discussion on retirement income focused on Social Security rather than on employer-provided DB pension plans, even though at least 49 of the 152 participants were receiving income from DB pension plans.
Some participants, particularly those in groups without college degrees, indicated that they had no choice but to work because they needed the income.28 Focus group participants without a college degree cited issues related to finances when indicating that their choices were constrained more often that those with a college degree. Participants overall listed finances second most often as a constraint. See table 2.
27For workers aged 65 or over federal law requires that employers be the primary health insurer and Medicare becomes a secondary payer. Some people are concerned that the provision stipulating Medicare as a secondary payer creates barriers or at least complicates the continuation of work past age 65. Specific concerns raised are that the provision increases the cost of employing older workers, may prevent a person working for a firm from getting a benefit to which he or she is otherwise entitled, and therefore may be considered a tax on work, at least at those firms offering such health benefits.
28Research has shown that having a college degree is often closely tied to other outcomes such as higher income and better health. According to one national study, in 2004, those over 25 with a college degree on average earn $23,000 more than those without a college degree. Moreover, 93 percent of those with a college degree reported being in “excellent, very good, or good” health, compared to 82 percent of those with a high school diploma. Institute for Higher Education Policy, “The Investment Payoff: A 50-State Analysis of the Public and Private Benefits of Higher Education,” (2005) 7, 13.
Page 21 GAO-06-80 Older Workers

Table 2: Focus Group Participant Statements on the Importance of Finances
I am a taxi driver and I don’t make very much, so I don’t think I’m going to retire, because with Social Security I won’t be able to do it. What makes me happy is I see taxi drivers that are 80 years old, so I guess if I can pass my vision test I can still drive a cab. …I’ve got a 2-year-old and I can probably not retire. I will be working all my life.
The thing that kept me from retiring for a while was that I was worried about the financial aspect of it. The thought of having my income go down so drastically was very frightening to me…It held me back for several years. Now I kick myself that I waited as long as I did.
I wish I had thought about retirement when I was younger. You know, you don’t think about it when you are in your 20s and 30s, and you get close to your 50s and 60s, and all you’ve got is your Social Security. I have got a 401(k), but I can’t retire on that. I can’t see me retiring for another 5, 6, or 7 years.
I have no retirement whatsoever. We got married very young, and we were always one step ahead of being financially in trouble…We have lived on [my husband’s] pension, plus my part-time job…as a teaching assistant. It’s only 30 hours a week; it’s not enough. To be honest, the people around me now who are starting to retire are making me become pretty panic stricken.
I would like to travel, but I don’t know what financial shape we will be in. As it looks right now, I don’t think I am ever going to retire.
Source: GAO focus group with retirees and near retirees.
A recent national survey of workers by Rutgers University and the University of Connecticut reached similar conclusions about the importance of finances. Only 16 percent of respondents age 55 and older believed they would be able to retire from full-time work by age 60.29 Twenty-four percent of all workers reported that they would be working either full-time or part-time because they need income after retirement.30 The study also found that 30 percent of those with no more than a high school education plan to either work full-time or part-time for needed income, compared with 17 percent of college graduates.31
Furthermore, some participants in our retiree focus groups said they were forced into retirement when they lost their jobs, either by being laid off or as several participants stated, “downsized.” Participants who had no college education and were already retired cited being laid off more frequently than did others.
29Scott Reynolds, Neil Ridley, and Carl E. Van Horn, “A Work-Filled Retirement: Workers’ Changing Views on Employment and Leisure,” Work Trends, (2005).
30Ibid, 5.
31Ibid, 6.
Page 22 GAO-06-80 Older Workers
Workplace and Lifestyle Considerations May Influence Work and Retirement Decisions for Some Older Workers
Both working and retired focus group participants who reported that they had a choice about when to work and retire most often said their decisions were influenced by perceptions about their workplace, such as satisfaction or dissatisfaction with the management. Workplace perceptions were cited often both by participants with a college degree and without a college degree. Some participants indicated that they continued to work at their job not solely for income, but because they perceived that their workplace was enjoyable,
I am eligible to retire…my boss, she is a lot of fun. As long as she is [there] maybe 3, 4 or 5 years as of now…I am in a very good position. If I decide to leave, I can leave. If I decide to stay, I would stay.
On the contrary, others left their jobs because they did not enjoy their positions or their relationship with management, rather than because of health constraints or other concerns.
[My reason for retiring] was upper management. We didn’t agree, so that’s really what the big factor was…That’s the only reason that I left, otherwise, I would have stayed until I was 70. I would have worked as long as I could have, as long as my health was good, but they were edging me out.
Similarly, a number of participants indicated that they felt pressure from their employer to leave their jobs. One participant said,
I felt like I was starting to get leaned on….I felt they were pushing me out… And one of the reasons was that one of my supervisors was about 40 and I was 65, and I think he felt more comfortable with a young person because he could talk to that person.
Other participants indicated that they chose to discontinue working or work part-time for lifestyle reasons, such as to have more flexibility and control over their time.
The great thing is I also have the free time to do the things that I want to do. It really is good if you can reach a point where you can afford to work part-time.
Page 23 GAO-06-80 Older Workers

Focus group participants with a college degree more often noted lifestyle considerations as a reason to retire or continue working than those without a college degree. For example, some college graduates indicated that they would like to continue working for enjoyment or to retire to volunteer. One participant commented, “I like to keep my hand in my field. It keeps me cutting edge. I can take it or leave it.”
A recent national survey of workers conducted by Rutgers University and the University of Connecticut supports these findings. The survey found that college graduates are more likely to view their retirement as a time for volunteering or choosing to work part time, whereas 30 percent of those without a college degree believe they will need to continue to work for money.32
Current and former federal workers in our focus groups most often cited perceptions about the workplace as a reason for retiring. Workplace perceptions were cited notably more often by federal participants who said they had a choice about whether to work or retire than similar non-federal participants. For example,
I was a manager…so at that time they had a reorganization. They bring new management in and they made some changes, so it was very stressful. At one point in time when they organized they want you to do more work with less people…They had their own mindset where you didn’t count. It was very stressful. The opportunity [to retire] presented itself and I just took advantage of it.
Few federal focus group participants indicated that they made work and retirement decisions based on financial or health constraints. Additionally, none of the federal retirees indicated that they had been laid off by the federal government, whereas being laid off was cited often by non-federal workers as the reason they stopped working.
32Ibid, 6.
Page 24 GAO-06-80 Older Workers

Among all the focus group participants, few saw opportunities to gradually or partially retire at their current or former employer. Participants in each focus group indicated that they either were not aware of opportunities to continue working after retirement or that their current or former employer did nothing to retain them as workers; differences between groups of college educated and non-college educated participants were not significant. For example, in response to the question, “What opportunity did your employer offer for phased or partial retirement prior to your retirement?” one participant responded, “They showed me the door and that was the end of it.” Some participants indicated that their current or former employers wished that they would retire. In response to a question regarding opportunities at their current employer for phased or partial retirement, one respondent replied, “I think they were glad to get rid of me.” A few participants said that their current or former employers offered them opportunities to gradually or partially retire. For example, one person said, “If you are good at what you do, you can be hired back on a consultant basis.”
Retirement Decisions May Be Influenced by What Older Workers Think Are Viable Options
Similarly, recent research has shown that many older workers do not follow through on their plans to reduce their hours in transition to retirement. One study found that only 35 percent of older Americans who wanted to reduce their hours in the next 2 years, prior to full retirement, followed through on these plans.33 The reason for the difference between these plans and actual behavior is unclear, although one author of the study speculated that workers who want to reduce their hours often must do so by finding another job, which can entail difficulties that may ultimately lead to full retirement. Survey data from the HRS indicates that almost 60 percent of full-time workers aged 55 and over say they would like to gradually reduce their work hours at their current job. But only about 20 percent of HRS respondents who were working full-time in 1992 became partially retired at some point by 2002 and the majority of partial retirees left their full-time employer.
Focus group participants cited what they perceived as their own limited skills and employers’ age discrimination most often as barriers to continued employment. These barriers were not cited more or less often by different groups of participants. When asked what barriers they perceived to continuing to work or finding a new job, some felt that they
33Katherine G. Abraham and Susan N. Houseman, “Work and Retirement Plans among Older Americans,” Upjohn Institute Staff Working Paper No. 04-105, (July 2004) 18.
Page 25 GAO-06-80 Older Workers

lacked technological skills. For example, one participant stated, “I could never go anywhere and work with computers.” Age discrimination was the second most frequently cited obstacle to participants working later in life or finding a new job. Many felt that employers preferred younger workers.
When they see your age, they don’t even give you the courtesy of an answer back. You know what it is, when they see your age they don’t know how capable you are. They just see the age and say I don’t want to mess around with you guys.
Similarly, a national survey found that 40 percent of older workers believe that older workers are treated less fairly than younger workers in the workplace.34
In addition to employment barriers, many focus group participants felt they had limited employment options. A number of participants indicated that their employment options were limited to mostly lower skilled and lower paid jobs. For example, one participant said, “I think there are plenty of jobs, but I think you are going to have to work just as hard as you did for $25 an hour as you do for $5.”
Some employers have actively attempted to recruit and retain older workers. For example, AARP, an advocacy organization for people over 50, partners with select employers to provide opportunities for older workers, and the federal government, one of the country’s largest employers, also offers some opportunities to retain select older workers. Some employers participating in a roundtable discussion on the aging workforce reported using special practices like mentoring opportunities to recruit or retain some older workers.35 However, as we reported in 2001, most employers are not yet engaged in these practices.36 Only about one-third of participants in a roundtable discussion of employers concerned about the aging workforce indicated that their company had established a program designed to recruit or retain older workers. The federal
While Some Employers Make a Special Effort to Hire and Retain Older Workers, Most Do Not
34Reynolds, Ridley, and Van Horn, “A Work-Filled Retirement: Workers’ Changing Views on Employment and Leisure,” 11.
35The U.S. Department of Labor assisted us in assembling a group of employer representatives to discuss the issues raised by the aging of the workforce. See appendix VIII for more information.
36GAO-02-85, 4.
Page 26 GAO-06-80 Older Workers

government also has not made widespread efforts to recruit or retain older employees. Employers have cited a number of factors, such as pension regulations, that discourage or prevent them from offering more opportunities for older workers.
Some Employers Use Special Practices to Recruit and Retain Older Workers
Some employers currently offer older workers incentives to work longer, such as partial retirement. National survey data from HRS indicates this practice is most common in professional and service occupations. In 2002, about 20 percent of partial retirees were employed in professional occupations and 17 percent in service occupations.37 Among service occupations, partial retirees were most often employed in food preparation and personal services occupations, such as child care workers and home care aides.38
In addition to offering some partial retirement opportunities, certain employers have actively attempted to recruit and retain older workers. Many employers believe older workers have certain advantages, such as reliability, institutional knowledge and experience, and a strong work ethic. AARP has established a “Featured Employer” program to encourage its partner companies to recruit and retain older workers. Through this program AARP collaborates with companies that are actively recruiting older workers for full-time, part-time, and seasonal work by providing information on employment opportunities. To date, AARP has entered into partnerships with 13 large companies, which include firms in retail, finance and insurance, health care, and staffing industries.
Employer representatives participating in a roundtable discussion on the aging workforce listed numerous practices they use to recruit or retain older workers. Overall, many participants agreed that flexibility was the key feature necessary to recruit and retain older workers. Specifically,
37In addition, 15 percent of partial retirees were employed in clerical and administrative support occupations; 13 percent were employed in operator occupations; 11 percent were employed in managerial occupations; 11 percent were employed in sales occupations; 6 percent were employed in farming, forestry, and fishing occupations, 3 percent were employed in construction trade and extraction occupations; 2 percent were employed in mechanics and repair occupations; and 2 percent were employed in production occupations.
38However, data show that many partial retirees are no longer working for their career employer, but rather are self-employed. Self-employment is much more prevalent among partial retirees than among full-time workers. According to the HRS, 36 percent of partial retirees were self-employed in 2002 compared to 18 percent of full-time older workers.
Page 27 GAO-06-80 Older Workers

individual employers listed these examples of programs and practices offered to their older employees:
• using older workers as mentors for younger workers;
• offering workers the opportunity to work at different locations so that they might live in different places over the course of a year;
• recruiting older workers at events geared toward seniors;
• launching a Web site and newsletter for older workers already employed by the company;
• using training as a retention tool, with the understanding that employees who are engaged and invested in their work are more likely to remain at their current jobs; and
• respecting some older workers’ desire for less stressful work by allowing former managers to work as staff members. The federal government, one of the country’s largest employers, offers some opportunities to retain select older workers, some of which are part of the opportunities for all workers, such as flexible schedules. Also, some retirees may draw their pension and return to work on a reduced schedule as “re-employed annuitants” or as private contractors,39 but these opportunities are not targeted broadly at older workers and the usage of these options does not appear to be widespread. Similarly, we previously found that state and local governments have addressed teacher shortages by implementing programs, such as a Deferred Retirement Option Plan (DROP), that provide incentives for older employees to remain on the job.40
39Federal governmental plans are not covered by IRS regulations, including restrictions on in-service pension distributions.
40GAO-02-85, 27-28.
Page 28 GAO-06-80 Older Workers

Although many employers indicate a willingness to recruit or retain older workers, most employers are not currently engaged in these practices, as we reported 5 years ago.41 National surveys show that employers are interested in options to accommodate the desire of older workers to reduce their hours or retire partially. One survey from Cornell University indicated that 73 percent of organizations would allow older workers to reduce their hours before retirement, although few have a formal written policy allowing this reduction. In fact, only 36 percent of organizations surveyed that would permit reduced hours actually had an employee do this in the last 3 years.42 Some studies have found that, while a fairly large number of employers think that phased or partial retirement is important, a much smaller number have actually implemented such policies.43 Another study that interviewed selected Fortune 500 company executives found that opportunities are ad hoc.44
Only about one-third of the 13 participants in a roundtable discussion of employers concerned about the aging workforce indicated that their company or organization had established a program designed to recruit or retain older workers, although most indicated a positive view of older workers. These companies generally agreed that the aging workforce was a serious concern for their organization in terms of knowledge loss and job vacancies as older workers retire. Still, some felt that it was only recently that their organization had become aware of the severity of the challenges facing them in the future.
Despite employing a large number of older workers, the federal government has not made significant, widespread efforts to recruit or retain older employees. Although some specific programs and incentives exist to recruit and retain select older workers, representatives of an association of current and retired federal employees felt that the federal government did not wish to keep its older employees in the workforce
Most Employers Are Not Actively Recruiting or Retaining Older Workers despite Indicating a Willingness to Expand Such Practices
41Ibid, 23.
42Robert M. Hutchens, “The Cornell Study of Employer Phased Retirement Policies: A Report on Key Findings” Faculty Publications - Labor Economics, (2003) 3.
43Hewitt Associates LLC, “Employer Approaches to Phased Retirement,” (2003) 1; Laurene Graig and Valerie Pagenlli of Watson Wyatt, “Phased Retirement: Reshaping the End of Work,” Compensation & Benefits Management, 1999, Vol. 16, No. 2; Jessica Collision, SHRM, NOWCC, CED, “Older Workers Survey,” (2003) vii.
44Lynne Morton, Lorrie Foster, and Jeri Sedlar, The Conference Board, “Managing the Mature Workforce: Implications and Best Practices,” (2005) 20.
Page 29 GAO-06-80 Older Workers

longer but rather planned for them to retire and be replaced by younger workers.
Employers, including federal officials, have cited a number of factors that discourage or prevent them from offering more opportunities for older workers. Some employers cite certain federal regulations as a reason for not offering more opportunities for older workers to reduce their hours before retirement, such as regulations prohibiting the distribution of DB pension benefits while the employee is still working for the company. Employers have also stated that pension regulations may force some employees who wish to partially retire to do so at another firm, or to retire and be hired back after a break in service. Furthermore, one national survey showed that many employers perceive that some older workers are resistant to new technology and roundtable participants indicated that some older workers are resistant to change. With regard to federal employees, some experts believe that the process of rehiring retired federal employees is cumbersome and rules that calculate retirement annuities based on the highest 3 years of pay provide federal workers with a disincentive to reduce hours before retirement. Also, some argue that current federal rules encourage federal employees to leave the federal government and seek employment elsewhere in order to collect their pension without an offset in their wages.
Another barrier to offering opportunities for older workers noted at the roundtable was the practice of retiring when eligible for pension, Social Security, or Medicare benefits. Some indicated that defined benefit plans encourage employees to retire when they maximize their pension. However, another participant noted that even a combination of DB and DC plans did not encourage workers to remain working later because retiring around age 65 is traditional. Many employers at the roundtable felt that eligibility for Social Security and Medicare tends to drive workers’ retirements. In fact, many of the employer participants agreed that employees tend to retire in their mid-60s because it has become the norm in the United States. One employer noted “the entire nation has been preconditioned to expect to retire in the mid-60s.” Many of the employers agreed that raising the eligibility age for Social Security and Medicare would be the kind of large-scale change necessary to keep older workers employed later in life.
The impending retirements of millions of older workers pose significant challenges for the economy, employers, and workers. With these retirements, employers may lose older workers’ firm-specific and general
Conclusions
Page 30 GAO-06-80 Older Workers

knowledge and skills, and there may not be enough younger workers in the labor market to replace them. At the same time, older workers themselves may need additional income from employment because they face less secure retirements due in part to rising health care costs and more years spent in retirement.
While many, including GAO, have reported on these trends and their likely consequences, little has been done to address them. Despite evidence indicating the future importance of older Americans to the workforce, few employers have yet implemented widely available programs to recruit or retain older workers. In addition, many older Americans in our focus groups perceive that employers prefer younger workers and prefer to see older workers retire rather than offer them more opportunities to stay or find other work. This perception is at odds with employers’ statements at the roundtable and through surveys indicating their readiness to address issues related to the aging workforce. The disparities between actions, preferences, and communications are a concern as the workforce ages.
With the first baby boomers becoming eligible for Social Security benefits in just 3 years, the time to prepare for these challenges is running out. Both employers and employees have a role to play in addressing the gap between them. Employers could attract and retain older workers by responding to their work and lifestyle preferences. For instance, employers could give older workers more control over their schedules by making greater use of flexible work arrangements such as partial retirement, part-time work, job-sharing, and telecommuting. Additionally, employers could respond to older workers’ perceptions about job stress by adjusting their job responsibilities such as by allowing former managers to switch to support or mentor roles. Also, employers could help their older employees learn new skills by investing more in training, and strengthen internal policies to address concerns about age discrimination. These efforts may also help older workers feel more valued by their employers. For their part, workers who are near traditional retirement age but who need or want to continue working will need to position themselves to take advantage of employment opportunities. For instance, they could learn new skills through either on- or off-the-job training, and adapt to new technologies and changes in the workplace. Additionally, older workers could utilize available resources, such as those provided by advocacy organizations like AARP, and communicate their needs and preferences to employers. Workers also need to assess their financial status in preparation for retirement, in particular the impact of reduced income from earnings, and may need to consider options such as partial or phased retirement.
Page 31 GAO-06-80 Older Workers

While employers and employees must take an active role in addressing the challenges of an aging population, there is also a role for government to help as well. As we recommended previously, we continue to believe an inter-agency task force on older workers, led by the Department of Labor, would help various agencies better align their efforts to remove barriers and create opportunities for older workers.45 Continued coordination of issues related to older workers by government agencies remains important, but the government can and should play a greater role in helping employers and employees prepare for these challenges. In addition to removing barriers and creating opportunities, the government could help bridge the gap between employers and employees.
Enhanced public awareness of demographic trends, their likely consequences, and possible solutions that could help promote both economic growth and retirement security for individuals, could help mitigate the potentially serious implications of the aging of the U.S. labor force, avoid possible knowledge and skill gaps in the future, and help ensure the financial security of older Americans. The Department of Labor has taken sound first steps in this area, including convening an intra-agency task force on older workers and working with business leaders interested in issues concerning the aging workforce. However, these challenges warrant a higher priority and a high-visibility campaign involving a wider group of employers as well as employees. Specifically, we recommend that the Secretary of Labor design a comprehensive and highly visible public awareness campaign as a way to help employers and employees plan better for the future and by so doing, bridge the gap between employer and employee needs. In designing the campaign, the Department of Labor should involve other agencies that have either regulatory jurisdiction or a clear policy interest, such as the Social Security Administration and the Health and Human Services Department’s Administration on Aging. The campaign should target employer organizations and groups that interact with employees and ultimately, would serve to encourage employers to find ways to retain and recruit older workers, and assist employees in creating and finding opportunities for continued work.
Recommendation for Executive Action
45GAO-02-85.
Page 32 GAO-06-80 Older Workers

We provided a draft of this report to the Department of Labor, the Internal Revenue Service, the Office of Personnel Management, and the Social Security Administration for comment. Officials from the Department of Labor provided written comments (see app. II), which generally agreed with our findings and the recommendation. Their comments also highlighted some actions that the Department of Labor has already taken in response to the challenges of an aging workforce. Consequently, we clarified our recommendation to the Department of Labor to include other federal agencies in the development of a public awareness campaign geared to older workers and their current and potential employers. The Office of Personnel Management and the Social Security Administration provided no written comments on the draft. The Department of Labor and the IRS also provided us with technical comments, which we have incorporated into the report as appropriate.
We are sending copies of this report to the Secretary of Labor, the Commissioner of Internal Revenue, the Director of the Office of Personnel Management, the Commissioner of Social Security, appropriate congressional committees, and other interested parties. We will also make copies available to others upon request. In addition, the report will be available at no charge on GAO’s Web site at http://www.gao.gov.
If you or your staff have any questions about this report, please contact me at (202) 512-7215 or at [email protected]. Contact points for our Offices of Congressional Relations and Public Affairs may be found on the last page of this report. GAO staff who made major contributions to this report are listed in appendix VI.
Barbara D. Bovbjerg Director, Education, Workforce, and Income Security Issues
Agency Comments and Our Evaluation
Page 33 GAO-06-80 Older Workers

List of Congressional Committees
The Honorable Charles E. Grassley Chairman The Honorable Max Baucus Ranking Minority Member Committee on Finance United States Senate
The Honorable Michael B. Enzi Chairman The Honorable Edward M. Kennedy Ranking Minority Member Committee on Health, Education, Labor, and Pensions United States Senate
The Honorable Mike Dewine Chairman The Honorable Barbara A. Mikulski Ranking Minority Member Subcommittee on Retirement Security and Aging Committee on Health, Education, Labor, and Pensions United States Senate
The Honorable Gordon H. Smith Chairman The Honorable Herb Kohl Ranking Minority Member Special Committee on Aging United States Senate
The Honorable George Miller Ranking Minority Member Committee on Education and the Workforce House of Representatives
The Honorable William M. Thomas Chairman The Honorable Charles B. Rangel Ranking Minority Member Committee on Ways and Means House of Representatives
Page 34 GAO-06-80 Older Workers

The Honorable Jim McCrery Chairman The Honorable Sander M. Levin Ranking Minority Member Subcommittee on Social Security Committee on Ways and Means House of Representatives
Page 35 GAO-06-80 Older Workers

Appendix I: Objectives, Scope, and
Methodology
Page 36 GAO-06-80 Older Workers
Appendix I: Objectives, Scope, and Methodology
Our objectives were to (1) describe the areas of the labor market that will be most affected by the aging workforce, (2) determine the factors that most influence the timing of workers’ retirement, and (3) examine what employers are doing to hire and retain older workers.
To address the first objective, we extrapolated employment data by occupation and age 10 years into the future. To do this, we obtained data from the Bureau of Labor and Statistics (BLS) describing the number of people employed in different occupations and age groups from 1985 to 2004 based on data from the Current Population Survey. We analyzed these data sets and found each to be reliable for purposes of this study. Occupation categories included: management, business, and financial operations; professional and related; service; sales and related; office and administrative support; farming, fishing, and forestry; construction and extraction; installation, maintenance, and repair; production; and transportation and material moving occupations. Because occupations were categorized differently prior to 2003, we applied conversion factors provided by BLS to convert the pre-2003 data and ensure consistency. Age groups were divided into the following groups: 16-24; 25-34; 35-44; 45-54; 55-64; and 65-74. The number of people employed in each age and occupation category was then averaged in 10-year groups, 1985-1994 and 1995-2004. We then compared the rate of change in employment by cohort between the two time periods for those aged 55-64 and 65-74. Based on the assumption that the rate of change for the two oldest age groups stays the same for the next 10 years, we extrapolated the employment levels of older workers, those aged 55-64 and 65-74, in each occupation in 2014. We applied BLS’s projections of overall employment growth for each occupation and then calculated the share of workers aged 55-74 as a percentage of the workforce aged 25-74 in each occupation in 2014. To better understand their decisions and circumstances regarding work and retirement, we also analyzed data from the Health and Retirement Study (HRS), a national survey of older Americans produced by the University of Michigan. We analyzed this data set and found it to be reliable for purposes of this study. Using data from the HRS and the RAND Corporation supplement to the HRS, we created a definition of partial retirement based on the hours or weeks worked per year and self-reported labor force status. In order to be classified as partially retired, a respondent must report the following: working for pay, working part-time (defined as working fewer than 35 hours a week or fewer than 36 weeks a year), and being either partially or fully retired on the subjective retirement status or employment status questions. Using this definition of partial retirement, we analyzed characteristics of partial retirees, such as whether or not they changed jobs to partially retire, their average

Appendix I: Objectives, Scope, and
Methodology
reduction in work hours, and pension and health insurance coverage. We also examined partial retirement by occupation and self-employment status. In addition, we analyzed data about older workers’ desire to gradually reduce their hours in transition to retirement and the degree of self-reported mental stress and physical activity required by occupation.
To address the second objective, we gathered information from 16 focus groups in four cities across the country: Chicago, Illinois; Phoenix, Arizona; New York, New York; and Washington, D.C. We selected four cities in which to hold focus groups based on geographic diversity and potential for occupational diversity. To gather information from the focus groups, we hired a contractor, IQ Solutions, to screen participants, select sites for the groups, and moderate the groups. In each city, participants were grouped into four categories: (1) retirees with a college degree; (2) retirees with no college degree; (3) older workers with a college degree; and (4) older workers with no college degree. In addition, Washington, D.C., participants were screened to include only current and former federal employees. Each group was comprised of 8 to 10 participants who were age 55 to 70. We prepared a series of questions that the moderator asked about the participants’ decisions regarding work and retirement. Participant responses were recorded on audio tape and transcribed to text by IQ Solutions. To analyze the transcripts, we developed a coding scheme to identify common themes and patterns observed and responses were coded using GAO’s self-developed, internet-based Questionnaire Programming Language software. Each code was reviewed and agreed upon by two analysts to check for coding reliability. Code frequencies were downloaded and analyzed using SAS software.
To address the third objective, we conducted interviews with several experts and reviewed the findings of several surveys of employers conducted by research organizations whose inquiries ranged from broad human capital issues to specific questions about provisions for older workers. We also participated in a roundtable discussion with employers. The roundtable discussion was assembled by the Department of Labor’s Employment and Training Administration (ETA). The 16 participants represented several of ETA’s national business partners as well as other businesses and organizations that the Business Relations Group within ETA works with on workforce development issues, particularly those that have expressed an interest in recruiting and retaining older workers. A GAO moderator asked a series of questions that we developed regarding perceptions, challenges, and actions toward older workers. (See app. V for a list of participants.)
Page 37 GAO-06-80 Older Workers

Appendix I: Objectives, Scope, and
Methodology
We conducted our work between October 2004 and October 2005 in accordance with generally accepted government auditing standards.
Page 38 GAO-06-80 Older Workers

Appendix II: Comments from the Department of Labor
Page 39 GAO-06-80 Older Workers
Appendix II: Comments from the Department of Labor

Appendix II: Comments from the Department of Labor
Page 40 GAO-06-80 Older Workers

Appendix III: Occupational Categories
Major occupational categories: Selected Sub-categories:
Professional and related Computer and mathematical Architecture and engineering Life, physical, and social science Community and social services Legal Education, training, and library Arts, design, entertainment, sports, and media Healthcare practitioner and technical
Service Healthcare support Protective service Food preparation and serving related Building and grounds clearing and maintenance Personal care and service
Management, business, and financial operations Advertising, marketing, promotions, public relations, and sales managers Computer and information system managers Construction managers Education administrators Food service managers Top executives Accountants and auditors Financial analysts and personal financial advisors Loan counselors and officers
Sales and related Cashiers Counter and rental clerks Insurance sales agents Real estate brokers and sales agents Retail salespersons Sales representatives, wholesale, and manufacturing Securities, commodities, and financial services sales agents Travel agents
Office and administrative support Communications equipment operators Computer operators Customer service representatives Data entry and information processing workers Financial clerks Office and administrative support worker supervisors and managers Office clerks, general Postal Service workers Secretaries and administrative assistants
Farming, fishing, and forestry Agricultural workers Fishers and fishing vessel operators Forest, conservation, and logging workers
Appendix III: Occupational Categories
Page 41 GAO-06-80 Older Workers

Appendix III: Occupational Categories
Major occupational categories: Selected Sub-categories:
Construction and extraction Boilermakers Carpenters Operating engineers and other construction equipment operators Construction laborers Electricians Pipelayers, plumbers, pipefitters, and steamfitters Roofers Sheet metal workers
Installation, maintenance, and repair
Electrical and electronic equipment mechanics, installers, and repairers Vehicle and mobile equipment mechanics, installers, and repairers Heating, air-conditioning, and refrigeration mechanics and installers Millwrights Precision instrument and equipment repairers
Production
Assemblers and fabricators Food processing Metal workers and plastic workers Printing occupations Plant and system operators
Transportation and material moving
Air transportation Motor vehicle Rail transportation Water transportation Material moving
Source: U.S. Department of Labor, Bureau of Labor Statistics, Occupational Outlook Handbook, 2004-2005 Edition and Bureau of Labor Statistics, Current Population Survey, Unpublished data, “Table 23. Experienced Labor Force, Employed, and Unemployed (Levels and Rates) by Intermediate Occupation, Sex, Race, Hispanic or Latino Ethnicity, and Age, Annual Average 2004.”
Page 42 GAO-06-80 Older Workers

Appendix IV: Focus Group Moderator’s Guides
Appendix IV: Focus Group Moderator’s Guides
Page 43 GAO-06-80 Older Workers

Appendix IV: Focus Group Moderator’s Guides
Page 44 GAO-06-80 Older Workers

Appendix IV: Focus Group Moderator’s Guides
Page 45 GAO-06-80 Older Workers

Appendix IV: Focus Group Moderator’s Guides
Page 46 GAO-06-80 Older Workers

Appendix IV: Focus Group Moderator’s Guides
Page 47 GAO-06-80 Older Workers

Appendix IV: Focus Group Moderator’s Guides
Page 48 GAO-06-80 Older Workers

Appendix IV: Focus Group Moderator’s Guides
Page 49 GAO-06-80 Older Workers

Appendix IV: Focus Group Moderator’s Guides
Page 50 GAO-06-80 Older Workers

Appendix IV: Focus Group Moderator’s Guides
Page 51 GAO-06-80 Older Workers

Appendix V: Employer
Participant List for Roundtable
Discussion on Older Workers
Appendix V: Employer Participant List for Roundtable Discussion on Older Workers
Debra Kilpatrick
National Program Consultant AARP
Jennifer Tracy
Director of Staffing and College Relations Aramark
Kathy Corcoran
Principal L&OD Consultant Constellation Energy
Barbara Hoenig
Consultant on Mature Workers and Workforce Development CVS
Steve Wing
Director of Government Programs CVS
Sara Freeman-Smith (by phone)
Director, Human Resources First Data
Donna Yurdin
Assistant Vice President, Organizational Effectiveness HCA
Cindy Milburn
Senior Director, Staffing The Home Depot
Terry Hansen
Manager, Public Partnerships IBM
Page 52 GAO-06-80 Older Workers

Appendix V: Employer
Participant List for Roundtable
Discussion on Older Workers
Rick Ohmer
Pension Administrator Johns Hopkins Medicine
Melanie Holmes
Senior Vice President, Business Operations Support Manpower
Andy Chaves
Manager, Youth Programs, Talent Management Marriott
Brooke Hirschfelder
Work/Life and Diversity Program Manager MetLife
Sue Roselle
Staffing Manager Toys R Us
Jan Magill
Senior Program Officer, Center for Workforce Preparation U.S. Chamber of Commerce
Eileen Bove
Director of Human Resources Universal Health Services
Page 53 GAO-06-80 Older Workers

Appendix VI :
St
GAO Contact and
aff Acknowledgments
Page 54 GAO-06-80
Appendix VI : GAO Contact and Staff Acknowledgments
GAO Contact Barbara D. Bovbjerg, Director (202) 512-7215
In addition to the contact named above, Alicia Cackley, Assistant Director; Mindy Bowman; Anna Bonelli; Sharon Hermes; Kristy Kennedy; Luann Moy; Lynn Musser; Nhi Nguyen; Corinna Nicolaou; Jay Smale; Roger Thomas; and Rachael Valliere made significant contributions to this report.
Older Workers
Acknowledgments
(130402)


GAO’s Mission The Government Accountability Office, the audit, evaluation and investigative arm of Congress, exists to support Congress in meeting its constitutional responsibilities and to help improve the performance and accountability of the federal government for the American people. GAO examines the use of public funds; evaluates federal programs and policies; and provides analyses, recommendations, and other assistance to help Congress make informed oversight, policy, and funding decisions. GAO’s commitment to good government is reflected in its core values of accountability, integrity, and reliability.
The fastest and easiest way to obtain copies of GAO documents at no cost is through GAO’s Web site (www.gao.gov). Each weekday, GAO posts newly released reports, testimony, and correspondence on its Web site. To have GAO e-mail you a list of newly posted products every afternoon, go to www.gao.gov and select “Subscribe to Updates.”
The first copy of each printed report is free. Additional copies are $2 each. A check or money order should be made out to the Superintendent of Documents. GAO also accepts VISA and Mastercard. Orders for 100 or more copies mailed to a single address are discounted 25 percent. Orders should be sent to:
U.S. Government Accountability Office 441 G Street NW, Room LM Washington, D.C. 20548
To order by Phone: Voice: (202) 512-6000 TDD: (202) 512-2537 Fax: (202) 512-6061
Contact:
Web site: www.gao.gov/fraudnet/fraudnet.htm E-mail: [email protected] Automated answering system: (800) 424-5454 or (202) 512-7470
Gloria Jarmon, Managing Director, [email protected] (202) 512-4400 U.S. Government Accountability Office, 441 G Street NW, Room 7125 Washington, D.C. 20548
Paul Anderson, Managing Director, [email protected] (202) 512-4800 U.S. Government Accountability Office, 441 G Street NW, Room 7149 Washington, D.C. 20548
Obtaining Copies of GAO Reports and Testimony
Order by Mail or Phone
To Report Fraud, Waste, and Abuse in Federal Programs
Congressional Relations
Public Affairs
PRINTED ON RECYCLED PAPER