gao-15-77, veterans' reemployment rights: department of
TRANSCRIPT

VETERANS’ REEMPLOYMENT RIGHTS
Department of Labor Has Higher Performance Than the Office of Special Counsel on More Demonstration Project Measures
Report to Congressional Committees
November 2014
GAO-15-77
United States Government Accountability Office

United States Government Accountability Office
Highlights of GAO-15-77, a report to congressional committees
November 2014
VETERANS’ REEMPLOYMENT RIGHTS Department of Labor Has Higher Performance Than the Office of Special Counsel on More Demonstration Project Measures
Why GAO Did This Study USERRA protects the employment and reemployment rights of workers who leave civilian jobs to perform military or other uniformed service. VBA directed DOL and OSC to establish a second demonstration project for investigating and resolving USERRA claims filed against federal agencies. Congress established the demonstration project to facilitate a review of relative agency performance and mandated GAO to report on relative performance across a number of areas specified in the VBA.
This report assesses agencies’ relative performance using VBA performance metrics - case outcomes, customer satisfaction, timeliness, cost, and capacity.
To determine agencies’ relative performance, GAO analyzed agency data on the aforementioned metrics. GAO reviewed VBA requirements and relevant guidance, and interviewed agency officials. In addition, GAO also conducted tests on each agencies’ cost and accounting data to ensure agreed upon cost components were reflected in the totals.
What GAO Recommends
GAO recommends that any agency chosen to investigate USERRA claims continue efforts to collect claimants’ survey satisfaction information, and to consider efforts to increase the survey response rate. DOL agreed with GAO’s recommendations. OSC neither agreed nor disagreed with GAO’s recommendations, and disagreed with GAO’s findings regarding agencies’ relative performance.
What GAO Found Demonstration Project Performance Between August 2011 and August 2014, the Department of Labor (DOL) demonstrated relatively higher performance than the Office of Special Counsel (OSC) on three of five performance metrics in the Veterans’ Benefits Act of 2010 (VBA).The relative performance was influenced—to a varying extent—by a number of factors, such as the investigative approach.
Case Outcomes (as of July 31, 2014): OSC provided relief to about 26 percent and DOL provided relief to about 20 percent of its claimants. DOL resolved 308 (or 97 percent of the 319) Uniformed Services Employment and Reemployment Rights Act (USERRA) cases, and OSC resolved 366 (or 84 percent of the 434) cases it received. OSC received a greater number of cases due to a requirement to investigate 27 cases involving a prohibited personnel practice (PPP) and to the random assignment of cases from servicemembers with odd social security numbers. GAO did not evaluate the appropriateness of agencies’ case outcomes. Although the agencies had 10 months to prepare, OSC officials stated they had limited capacity to investigate and resolve claims during the first six months of the demonstration project. In fiscal years 2013 and 2014, both agencies closed about as many cases as received.
Customer Satisfaction: On a survey sent to claimants and administered by OPM, DOL respondents reported higher average satisfaction on every question than OSC respondents, with pronounced differences in scores on timeliness, access to staff, and overall experience. For example, 66 percent of DOL’s respondents (n=100) were satisfied with overall customer service, whereas 34 percent of OSC’s respondents (n=151) were satisfied. In light of the low survey response rates, GAO conducted additional statistical analyses to control for potential bias and ensure conclusions could be drawn from survey results. Differences in satisfaction between agencies persisted after controlling for variables such as case outcome and timeliness.
Timeliness: DOL’s average investigation time of closed cases was about 41 days and OSC’s was about 151 days. GAO examined factors potentially influencing timeliness, such as OSC’s responsibility to investigate cases involving a PPP, and whether relief was obtained for claimants. GAO found these factors were not primary contributors to OSC’s relatively longer average times. Agencies have different policies for extending case investigation timeframes. Officials from OSC said they allow for open-ended case extensions, whereas DOL does not.
Cost: DOL spent about $1,112 per case, whereas OSC spent about $3,810. The relative difference in agencies’ costs was affected by factors such as the number of hours dedicated to case investigations and pay levels, among others.
Capacity: The agencies demonstrated different capabilities to investigate and resolve cases in areas such as staffing, training, and information technology. For example, DOL had 31 staff investigating USERRA demonstration project, and other nonfederal USERRA or veterans’ preference cases. These DOL investigators had an average annual demonstration project caseload of five. OSC had 7 staff investigating demonstration project cases, with an average annual caseload of 28. GAO could not determine relative performance on agency capacity due to the lack of a specific and comparable metric.
View GAO-15-77. For more information, contact Yvonne D. Jones at (202) 512-2717 or [email protected].

Page i GAO-15-77 Veterans’ Reemployment Rights
Letter 1
Background 4 DOL Has Relatively Higher Performance Than OSC for More
Demonstration Project Performance Measures 8 Customer Satisfaction Can Provide Meaningful Feedback for
Service Improvements 33 Conclusions 35 Recommendations for Executive Action 36 Agency Comments and Our Evaluation 36
Appendix I Objectives, Scope, and Methodology 41
Appendix II USERRA Demonstration Project Customer Satisfaction Survey Administration and Instrument 47
Appendix III Nonresponse and Multivariate Analysis of Customer Satisfaction Data 52
Appendix IV Comments from the Department of Labor 66
Appendix V Comments from the Office of Special Counsel 68
Appendix VI GAO Contact and Staff Acknowledgments 96
Related GAO Products 97
Tables
Table 1: The Office of Special Counsel Resolved a Greater Proportion of Cases in Favor of the Claimant 12
Contents

Page ii GAO-15-77 Veterans’ Reemployment Rights
Table 2: On Average, DOL Received Higher Scores on Claimant Interaction with Staff and Overall Satisfaction with Customer Service and Investigation 17
Table 3: DOL Has More Investigative Staff with Generally Lower Pay Levels While OSC Had Less Investigative Staff with Higher Caseloads 26
Table 4: Survey Response Rates at DOL and OSC 52 Table 5: Case Processing Time for Responders and Non-
Responders, by Agency and Overall 53 Table 6: Discrimination Allegations for Responders and Non-
Responders, by Agency and Overall 54 Table 7: Favorable Outcomes for Responders and Non-
Responders, by Agency and Overall 56 Table 8: Agency Reported Outcome by Respondent Perception of
the Outcome 57 Table 9: Responses to 15 Satisfaction Items on the USERRA
Survey Questionnaire, by Agency 58 Table 10: Odds and Odds Ratios Indicating Differences in
Satisfaction at DOL and OSC before and after Adjusting for Whether the Outcome Was Favorable, Case Processing Time, and Whether Discrimination Was Alleged 60
Table 11: Odds and Odds Ratios Indicating Differences in Satisfaction at DOL and OSC Before and After Adjusting for Whether the Outcome Was Favorable, Case Processing Time, and Whether Discrimination Was Alleged 64
Figures
Figure 1: USERRA Claims Processing under the Demonstration Project 6
Figure 2: Department of Labor Closed About As Many Cases As It Opened 10
Figure 3: Office of Special Counsel Received More Cases Than It Closed During the Early Years but the Gap Narrowed During the Later Years 11
Figure 4: Department of Labor Respondents Were More Likely to Express Satisfaction 15
Figure 5: Department of Labor Respondents Were More Likely to Express Satisfaction 16
Figure 6: Department of Labor Resolved Cases Faster 19
Page iii GAO-15-77 Veterans’ Reemployment Rights
Figure 7: Office of Special Counsel Had a Greater Proportion of Cases Open More Than 90 Days 20
Figure 8: OSC Uses ADR Process to Mediate USERRA Cases to Offer Claimants Additional Resolution Options 31
Figure 9: OPM 2012 Customer Satisfaction Survey Instrument 49

Page iv GAO-15-77 Veterans’ Reemployment Rights
Abbreviations ADR Alternative Dispute Resolution DOD Department of Defense DOL Department of Labor DOL-VETS Department of Labor Veterans’ Employment and
Training Service MSPB Merit Systems Protection Board NVTI National Veterans Training Institute OMB Office of Management and Budget OPM Office of Personnel Management OSC Office of Special Counsel OSC 2000 Office of Special Counsel case tracking system PMF Presidential Management Fellow PPP prohibited personnel practices SSN Social Security number UIMS USERRA Information Management System USERRA Uniformed Services Employment and
Reemployment Rights Act of 1994 VBA Veterans’ Benefits Act of 2010 VBIA Veterans Benefit Improvement Act of 2004
This is a work of the U.S. government and is not subject to copyright protection in the United States. The published product may be reproduced and distributed in its entirety without further permission from GAO. However, because this work may contain copyrighted images or other material, permission from the copyright holder may be necessary if you wish to reproduce this material separately.
Page 1 GAO-15-77 Veterans’ Reemployment Rights
441 G St. N.W. Washington, DC 20548
November 25, 2014
The Honorable Bernie Sanders Chairman The Honorable Richard Burr Ranking Member Committee on Veterans’ Affairs United States Senate
The Honorable Jeff Miller Chairman The Honorable Michael Michaud Ranking Member Committee on Veterans’ Affairs House of Representatives
Over the next 4 to 5 years, more than a million servicemembers are expected to leave the military and transition into civilian life, according to the Department of Defense.1 In making this transition, some servicemembers will face significant challenges reentering the workforce and maintaining employment. Many factors—such as workplace absences due to overseas deployments, translating military skills to civilian job requirements, and employers’ lack of awareness regarding reemployment rights—can contribute to the difficulties servicemembers face when seeking a return to the civilian workforce.
To protect the employment and reemployment rights of federal and nonfederal employees when they leave their civilian employment to perform military or other uniformed service, Congress enacted the Uniformed Services Employment and Reemployment Rights Act of 1994 (USERRA).2 USERRA applies to a wide range of employers, including
1Over each of the next 4 years, the Department of Defense estimates that approximately 170,000 to 185,000 active duty servicemembers will separate from the military and about 60,000 National Guard and Reserve members will be demobilized and deactivated from active duty. GAO, Transitioning Veterans: Improved Oversight Needed to Enhance Implementation of Transition Assistance Program, GAO-14-144 (Washington, D.C.: March 5, 2014). 2In addition to those serving in the armed forces and the Army and Air National Guards (when engaged in active duty for training, inactive duty training, or full-time National Guard

Page 2 GAO-15-77 Veterans’ Reemployment Rights
federal, state, and local governments as well as to private-sector firms. Among other rights, servicemembers who meet the statutory requirements are entitled to reinstatement to the positions they would have held if they had never left their employment (or reinstatement to positions of similar seniority, status, and pay).
As part of the Veterans Benefits Improvement Act of 2004 and the Veterans’ Benefits Act of 2010 (VBA), Congress established two demonstration projects between the Department of Labor (DOL) and the Office of Special Counsel (OSC). The first demonstration project was implemented from February 8, 2005, through December 31, 2007. The second demonstration project was implemented from August 9, 2011, through August 9, 2014.
Claims filed under USERRA from servicemembers have remained relatively steady over time despite ongoing efforts to improve outreach to employers and improve agencies’ training and guidance. Between fiscal years 2008 and 2012, servicemembers filed more than 1,400 employment and reemployment claims each year (in 2013, the number of claims fell to fewer than 1,300). In addition, in fiscal years 2012 and 2013, more than 200 USERRA claims were filed against federal executive agencies.
VBA mandated us to report on the relative performance of DOL and OSC across a number of areas specified in the act. This assessment of the 2011-2014, 36-month demonstration project (1) covers agencies’ relative performance under performance metrics including case outcomes, customer satisfaction, timeliness, cost, and capacity as mandated by VBA; and (2) identifies actions agencies can take to improve satisfaction on customer service.3 To assess agencies’ relative performance, we reviewed the requirements of the demonstration project set forth in VBA and compared final agency performance data on case outcome, timeliness, customer satisfaction, and cost. We also analyzed agency data to provide comparative descriptions of capacity. In conducting our work, we obtained data on case tracking, customer satisfaction, cost, and duty), USERRA covers the commissioned corps of the Public Health Service and other persons designated by the President in time of war or national emergency. Pub. L. No. 103-353, 108 Stat. 3149 (Oct. 13, 1994), codified at 38 U.S.C. §§ 4301-4335. USERRA is the most recent in a series of laws protecting veterans’ employment and reemployment rights going back to the Selective Training and Service Act of 1940. Pub. L. No. 783, 54 Stat. 885, 890 (Sept. 16, 1940). 3Pub. L. No. 111-275, § 105, 124 Stat. 2864, 2868-70 (Oct. 13, 2010).

Page 3 GAO-15-77 Veterans’ Reemployment Rights
capacity from DOL, OSC, and the Office of Personnel Management (OPM) from the beginning of the USERRA demonstration project in August 2011 to July 2014.
To assess case outcomes and timeliness, we reviewed and analyzed data from DOL’s case tracking system (the USERRA Information Management System) and OSC’s case tracking system for demonstration project cases opened between August 9, 2011 and July 31, 2014. To assess customer satisfaction, we reviewed and analyzed data and narrative responses from the USERRA customer satisfaction survey, which was administered by OPM on behalf of both agencies. To assess demonstration project costs, we reviewed and analyzed cost and accounting data from DOL and OSC, including supporting documentation such as the number of hours dedicated to demonstration project cases. We assessed the reliability of data on case outcomes, customer satisfaction, timeliness, and cost, and determined the data we used to evaluate the relative performance of agencies was sufficiently reliable for the purpose of this report.
We reviewed and analyzed information on agencies’ capacity based on factors identified in the VBA mandate such as staffing levels, grade level, training, education, and caseload. We also reviewed DOL’s and OSC’s unique characteristics that enable them to investigate and resolve claims. We interviewed key officials involved with the USERRA demonstration project at DOL and OSC. We also reviewed pertinent reports, guidance, plans, relevant federal laws, directives, and other documents.
To identify actions agencies can take to improve customer service, we analyzed agency customer satisfaction data and compared results to customer service principles and guidance outlined in executive orders and the Office of Management and Budget guidance. We also interviewed agency officials about their views on related procedures and practices that worked well or needed improvement.
We conducted this performance audit from April 2014 to November 2014 in accordance with generally accepted government auditing standards. These standards require that we plan and perform the audit to obtain sufficient, appropriate evidence to provide a reasonable basis for our findings and conclusions based on our audit objectives. We believe the evidence obtained provides a reasonable basis for our findings and conclusions based on our audit objectives.

Page 4 GAO-15-77 Veterans’ Reemployment Rights
Under USERRA, an employee or applicant for employment who believes that his or her USERRA rights have been violated may file a claim with the DOL’s Veterans’ Employment and Training Service (DOL-VETS), which investigates and attempts to resolve the claim. If DOL-VETS cannot resolve the claim and the servicemember is a federal government employee or applicant to a federal agency, DOL is to inform the claimant of the right to have his or her claim referred to OSC for further review and possible OSC representation before the Merit Systems Protection Board (MSPB).4 DOL is also to inform the claimant that he or she may file a claim directly with MSPB.
The Veterans Benefit Improvement Act of 2004 (VBIA) established a demonstration project for the period February 8, 2005, through December 31, 2007, during which OSC was authorized to receive and investigate certain USERRA cases while DOL remained in an investigative role for others.5 In 2007, as mandated by VBIA, we evaluated the demonstration project and made recommendations to DOL to help establish internal controls for case review, claimant notification, and data management.6 Specifically, we found that the data DOL used to track case investigation time and the data DOL and OSC used to track case outcomes were not reliable to monitor, track, and report on the agencies’ performance. Further, we found the data for reporting outcomes were not reliable at either DOL or OSC. This adversely affected Congress’s ability to assess how well federal USERRA claims were being investigated as well as to assess whether changes would be needed in the future.7 To improve the USERRA process, we recommended that the Secretary of Labor develop an internal review mechanism for all unresolved cases before they are closed and claimants are notified. We also recommended establishing internal controls to ensure the accuracy of data entered into DOL’s case
4OSC is an independent investigative and prosecutorial agency with the primary mission of protecting the employment rights of federal employees and applicants for federal employment. 5Pub. L. No. 108-454, §204, 118 Stat. 3598, 3606-08 (Dec. 10, 2004). Under VBIA, the demonstration project was originally scheduled to end on September 30, 2007, but through a series of extensions ran through December 31, 2007. 6See GAO, Military Personnel: Improved Quality Controls Needed over Servicemembers’ Employment Rights Claims at DOL, GAO-07-907 (Washington, D.C.: July 20, 2007). 7GAO-07-907.
Background

Page 5 GAO-15-77 Veterans’ Reemployment Rights
tracking database. DOL agreed with and implemented our recommendations.
Congress passed the VBA which directed DOL and OSC to establish a second demonstration project (36-month duration) for receiving, investigating, and resolving USERRA claims filed against federal executive agencies. Procedures in the second demonstration project were similar to those in the first demonstration project. DOL and OSC each received claims and were authorized to investigate and seek corrective action for those claims.
Specifically, DOL is authorized to investigate and seek corrective action for those claims filed against federal executive agencies if the servicemember’s Social Security number (SSN) ends in an even number. OSC is authorized to investigate and seek corrective action for USERRA claims against federal executive agencies if the servicemember’s SSN ends in an odd number. If a claim does not contain an SSN, DOL will assign a claim number based on the date of the month the claim is received. For example, claims filed on an odd-numbered date will be assigned an odd case number and forwarded to OSC. Claims filed on an even-numbered date will be assigned an even case number and be investigated by DOL. Also, under the demonstration project, OSC is authorized to handle any “mixed claims” in which a claimant files a USERRA claim against a federal executive agency and also brings a related prohibited personnel practice claim. There are 13 prohibited personnel practices (PPP) including discrimination, retaliation, or unauthorized preference or improper advantage.8
VBA mandated us to evaluate how DOL and OSC designed the demonstration project and assess their relative performance during and at the conclusion of the demonstration project. Figure 1 depicts USERRA claims processing under the demonstration project.
85 U.S.C. § 2302.

Page 6 GAO-15-77 Veterans’ Reemployment Rights
Figure 1: USERRA Claims Processing under the Demonstration Project
a If, during initial processing or investigation phase, DOL personnel identify a possible PPP case, DOL and OSC will jointly determine at what point, if at all, the case should be transferred to OSC for investigation.

Page 7 GAO-15-77 Veterans’ Reemployment Rights
Our previous reports on USERRA included recommendations to improve data quality and develop comparable data and processes to facilitate evaluating agency performance. In June 2011, we reported on the methods and procedures that DOL and OSC had agreed to establish for the demonstration project. We recommended that both agencies take a number of steps to ensure a comparable process and collect sufficiently reliable data.9 In response to our recommendations, DOL and OSC entered into an interagency agreement with OPM to establish and regularly administer a customer satisfaction survey.10 The customer satisfaction survey provides comparable information and includes a survey plan and protocols for contacting respondents in line with the recommendation from our demonstration project design assessment. Furthermore, by the start of the demonstration project in August 2011, both agencies established a cost accounting system to collect and track actual time spent investigating demonstration project cases.
In September 2012, we reported an interim assessment of the demonstration project.11 At that time, we reported that both DOL and OSC had established methods and procedures that would allow them to report comparable and reliable performance data for the demonstration project, as required by VBA. We also identified additional actions that agencies could take to improve the quality of the customer satisfaction and cost data. Specifically, we recommended that DOL and OSC take additional steps to increase their customer satisfaction survey response rates and address any potential survey response bias. We also recommended that both agencies establish and document procedures for compiling and reporting the cost data during the demonstration project.
In response to our 2012 recommendations to increase survey response rates and to address potential response bias, the agencies agreed to conduct additional outreach to claimants by providing an initial survey notification, and contracted with OPM to conduct a nonresponse analysis.
9GAO, Veterans’ Reemployment Rights: Steps Needed to Ensure Reliability of DOL and Special Counsel Demonstration Project’s Performance Information, GAO-11-312R (Washington, D.C.: June 10, 2011). 10OPM is acting as survey administrator. 11GAO, Veterans’ Reemployment Rights: Department of Labor and Office of Special Counsel Need to Take Additional Steps to Ensure Demonstration Project Data Integrity, GAO-12-860R (Washington, D.C.: Sept. 10, 2012).

Page 8 GAO-15-77 Veterans’ Reemployment Rights
OPM provided a nonresponse analysis to agencies in April 2013. In response to our recommendation that agencies establish and document procedures for compiling and reporting cost data, DOL provided written instructions to its staff on methods for reporting its time and related costs, developed written procedures for tracking and reporting costs, and implemented a quarterly audit of cost information.
OSC did not implement our recommendation to document procedures for compiling and reporting cost data. Specifically, according to OSC’s USERRA Unit Chief, the agency established, but did not document, procedures for compiling the cost data associated with the demonstration project. OSC officials explained that in lieu of documenting their procedures, they held a training session with staff to discuss the method they use to track and report the time and costs associated with demonstration project cases. However, standards for internal control in the federal government require that internal controls and all transactions and other significant events be clearly documented, and the documentation should be readily available for examination. The documentation should appear in management directives, administrative policies, or operating manuals, and may be in paper or electronic form.
During the demonstration project, DOL resolved more of the cases it received. Between August 9, 2011, and July 31, 2014, DOL received 319 demonstration cases and OSC received 434 cases. Of the cases received, OSC closed 366 cases, or 84 percent. DOL closed 308 cases, or 97 percent. OSC had 68 demonstration project cases remaining open, and DOL had 11 cases remaining open at the end of July 2014.
We identified two factors that may explain why OSC received more demonstration project cases than DOL. One factor is the presence of more odd versus even social security numbers of claimants, and the
DOL Has Relatively Higher Performance Than OSC for More Demonstration Project Performance Measures
OSC Resolved a Greater Proportion of Cases in Favor of the Claimant and DOL Resolved More of the Cases it Received

Page 9 GAO-15-77 Veterans’ Reemployment Rights
second is OSC’s responsibility to investigate and resolved all cases that involve a PPP.12 Most cases were randomly assigned to each agency by using the last digit of the claimant’s SSN. OSC received more cases based on this assignment. In addition, OSC was required to handle all cases that involved a PPP, which contributed to 27 more cases being assigned to OSC. These 27 cases amounted to about 7 percent of OSC’s total claims and 23 percent of the 115 additional cases that OSC received (see table 1).
From fiscal year 2012 to fiscal year 2014, DOL closed about as many cases as it opened, as shown in figure 2. DOL received more than 100 cases during fiscal years 2012 and 2013, and closed about the same number each year. Because the demonstration project began near the end of fiscal year 2011, both agencies received a smaller number of cases during that period. Furthermore, the demonstration project ended about 2 months prior to the end of fiscal year 2014.
12There are 13 prohibited personnel practices including discrimination, retaliation, or unauthorized preference or improper advantage. 5 U.S.C. § 2302.

Page 10 GAO-15-77 Veterans’ Reemployment Rights
Figure 2: Department of Labor Closed About As Many Cases As It Opened
OSC received more cases than it closed in the first two fiscal years of the demonstration project, which included less than 2 months of fiscal year 2011 and all of fiscal year 2012. Agency officials explained the agency had limited capacity to investigate and resolve claims during the first 6 months of the demonstration project. During this time, the agency reported it was hiring new staff, negotiating a reimbursement agreement with DOL, and expanding the capabilities of its USERRA Unit to handle demonstration project cases. As such, according to OSC officials, the agency had a limited capacity to investigate and resolve claims during this time. However, agencies had about 10 months to prepare and assemble the resources required to implement the project. VBA established the requirement for the demonstration project on October 13, 2010 (the date VBA was enacted), and the demonstration project began on August 11, 2011. As shown in figure 3, between the beginning of fiscal year 2013 and the end of July 2014, OSC closed the same number of cases as it received.

Page 11 GAO-15-77 Veterans’ Reemployment Rights
Figure 3: Office of Special Counsel Received More Cases Than It Closed During the Early Years but the Gap Narrowed During the Later Years
Officials from OSC and DOL hold similar views on their investigative role under USERRA and told us they view their roles as that of impartial investigators. Specifically, officials from both agencies told us that their role is to determine if a claim has merit, and if so, to resolve the claim appropriately. Importantly, we did not independently assess the quality of agencies’ case investigations to determine if DOL and OSC arrived at the appropriate case outcomes. As such, we were not able to determine the relative performance of agencies for this measure.
Between August 9, 2011, and July 31, 2014, OSC obtained relief for claimants in about 26 percent, or 94, of its demonstration project cases. DOL obtained relief for claimants in about 20 percent, or 62, of its cases (see table 1). OSC officials told us that their ability to close a greater proportion of cases resulting in relief for claimants is partially attributable to their expertise on federal sector employment matters, the quality of their work, and the composition of their investigative team, which is largely staffed by attorneys. DOL officials told us their goal is to obtain the
OSC Resolved a Greater Proportion of Cases in Favor of the Claimant

Page 12 GAO-15-77 Veterans’ Reemployment Rights
correct case outcome, even if it is not in favor of the claimant. DOL officials also expressed concern that associating higher performance with case outcomes that provide relief for claimants may create an incentive to pursue relief for cases that do not warrant corrective action.
Table 1: The Office of Special Counsel Resolved a Greater Proportion of Cases in Favor of the Claimant
a
Number of Cases Received
Number of Cases Closed
Number of Cases Resolved In Favor of
Claimant
Percent of Cases Resolved In Favor of
Claimant Department of Labor 319 308 62 20.1% Office of Special Counsel 434 366 94 25.7%
Source: GAO analysis of DOL’s USERRA Information Management System and OSC’s case tracking system data. | GAO-15-77 a
The case information presented in table 1 may vary somewhat from information reported in conjunction with our nonresponse analysis reported in appendix III, because the data presented in the table were updated from agencies following our nonresponse analysis. Furthermore, our nonresponse analysis is based on data provided by OPM, rather than case tracking data collected directly from agencies, as shown in this table
We worked with agencies prior to the demonstration project to develop a method to ensure that case outcomes could be described in a consistent manner, and a comparison could be made at the conclusion of the demonstration project. Accordingly, in August 2011, agencies developed a cross-walk of case resolution codes to facilitate a comparison of case outcomes. In our interim report issued in September 2012, we reported case outcomes based on this cross-walk. This final review also relies on the cross-walk for the purpose of comparing agency case outcomes.
DOL and OSC both tracked the disposition of closed cases to determine if cases had been resolved in favor of the claimant, and in some cases, to track the type of corrective action agreed to, or to provide the reason a case was not resolved in favor of the claimant. Specifically, OSC uses the case resolution codes “dispute resolved,” “corrective action,” and “complainant declines corrective action offered” to identify cases resolved in favor of the claimant, whereas DOL uses the resolution codes “claim granted,” “claim settled,” and “merit – not resolved.” A number of case resolution codes, including OSC’s “corrective action declined by claimant” code, were not included in the cross-walk of case resolution codes. Because these codes were not included in the cross-walk, we had to rely on agencies’ determination of whether certain cases were resolved in favor of the claimant. Specifically, OSC’s totals include 3 cases in which corrective action was declined by the claimant, or about 3 percent of the 94 cases the agency resolved in favor of the claimant. DOL’s totals

Page 13 GAO-15-77 Veterans’ Reemployment Rights
include 7 cases that had merit, but which were not resolved, or about 11 percent of the 62 cases the agency resolved in favor of the claimant. According to OSC officials, the code “corrective action declined by claimant” indicates that the agency offered resolution but the claimant declined it. According to DOL officials, the code “merit, not resolved” indicates that the claim was meritorious, but the agency did not offer resolution, or the claimant declined the resolution that was offered.
Agency officials from OSC told us that the relief provided to claimants included, but was not limited to, initial job offers, reinstatement, promotions, restored benefits, accommodations for service-connected disabilities, back pay, USERRA training for federal officials, and systemic changes to agency policies and procedures to better comply with USERRA. For example, OSC officials explained that they investigated a claim by a National Guardsman who worked for the Defense Commissary Agency and claimed he was improperly denied reemployment upon returning from a tour of duty. OSC investigated the claim, determined the claim was valid, and intervened with the agency to identify appropriate corrective action. According to OSC, the agency agreed to reinstate the individual to his former position, restore his benefits and seniority, and provide him with back pay.
Agencies also identified cases that were not resolved in favor of the claimant, and provided a reason, or disposition, to explain why. For example, some cases were not resolved favorably because the claimant withdrew the claim, investigators determined the claim had no merit, there was insufficient evidence to support the claim, or the claimant failed to supply evidence for further action, among other reasons.
DOL received higher scores from respondents than OSC on every question asked on the customer satisfaction survey administered by OPM. However, the response rates of the surveys were low, which can potentially affect the conclusions that can be drawn from the survey. Specifically, 32 percent of claimants responded to DOL’s survey, while 42 percent responded to OSC’s survey. In light of the low survey response rates, we conducted additional statistical analyses to control for potential bias and ensure conclusions could be drawn from survey results. Our analyses revealed that differences in satisfaction scores for each question remained statistically significant and pronounced even after controlling for variables that could affect the claimants’ views of the customer service provided. These variables include case investigation time, whether the claimant indicated that the case was resolved in his or her favor, and
Respondents Reported Greater Customer Satisfaction with DOL

Page 14 GAO-15-77 Veterans’ Reemployment Rights
whether discrimination was alleged by the claimant. For a more detailed explanation of these analyses and their findings, see appendix III.
The differences in scores between the two agencies were especially pronounced on questions relating to timeliness, access to staff, and overall experience. Narrative responses to the survey provided additional detail on aspects of agencies’ USERRA investigations that respondents said were working well, and areas that may require improvement. Select narrative responses are provided throughout this section to highlight certain aspects of agencies’ customer service. More details on the survey’s administration and survey instrument can be found in appendix II.
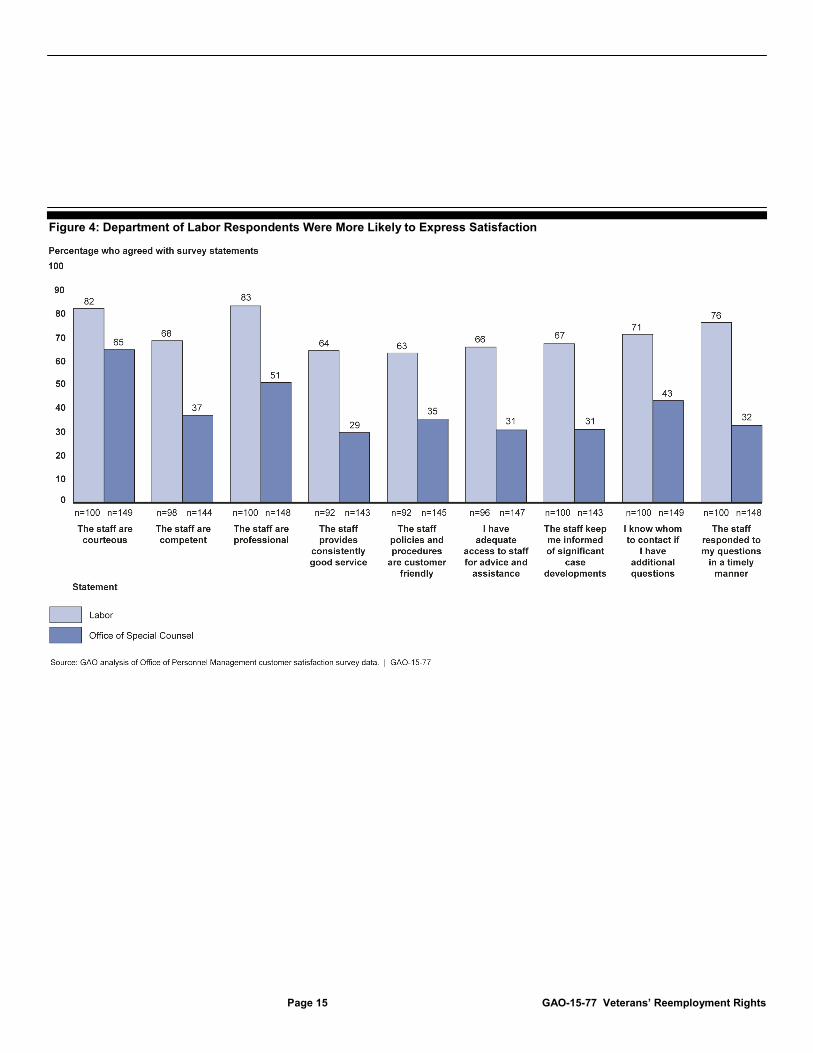
Our analysis found that a higher percentage of DOL respondents agreed with survey statements and expressed satisfaction with DOL’s service than did OSC respondents. Figures 4 and 5 display the percentage of DOL and OSC respondents who expressed satisfaction with various elements of customer service and the case investigation by responding to survey statements.
USERRA Customer Satisfaction Survey: Select
Narrative Responses “[A DOL investigator] provided timely updates in regards to the steps she was taking to determine the disposition of the case.” “[I] would like to be kept informed [by OSC] of what is going on.” Source: OPM survey.
Page 15 GAO-15-77 Veterans’ Reemployment Rights
Figure 4: Department of Labor Respondents Were More Likely to Express Satisfaction

Page 16 GAO-15-77 Veterans’ Reemployment Rights
Figure 5: Department of Labor Respondents Were More Likely to Express Satisfaction
A portion of both DOL respondents and OSC respondents expressed some dissatisfaction with the thoroughness of the investigation, as figure 5 shows. One respondent wanted DOL “to be more proactive and actually contact the individuals that are committing the wrongdoings and getting away with affecting the veterans that want to work.” One OSC respondent wanted OSC to “investigate cases better and conduct interviews before they make their final decisions and not follow by only what the employer says.”
As depicted by the average scores on the customer satisfaction survey, the largest reported difference in satisfaction with customer service between DOL and OSC is agency timeliness and the smallest reported difference in satisfaction with customer service between DOL and OSC is staff courteousness. Survey responses also showed that claimants felt that DOL better kept claimants informed and provided better access to staff, as well as better satisfying claimants in regards to the overall investigation of the claim. Claimants’ responses were coded on a scale of 1 to 5, with 1 representing a “strongly disagree” or “very dissatisfied”
USERRA Customer Satisfaction Survey: Select
Narrative Responses “[The DOL investigator] went above and beyond the call of duty to help me.” “OSC has very dedicated measures and personnel in place offering sound advice and service along every step of the process.” Source: OPM survey.
Page 17 GAO-15-77 Veterans’ Reemployment Rights
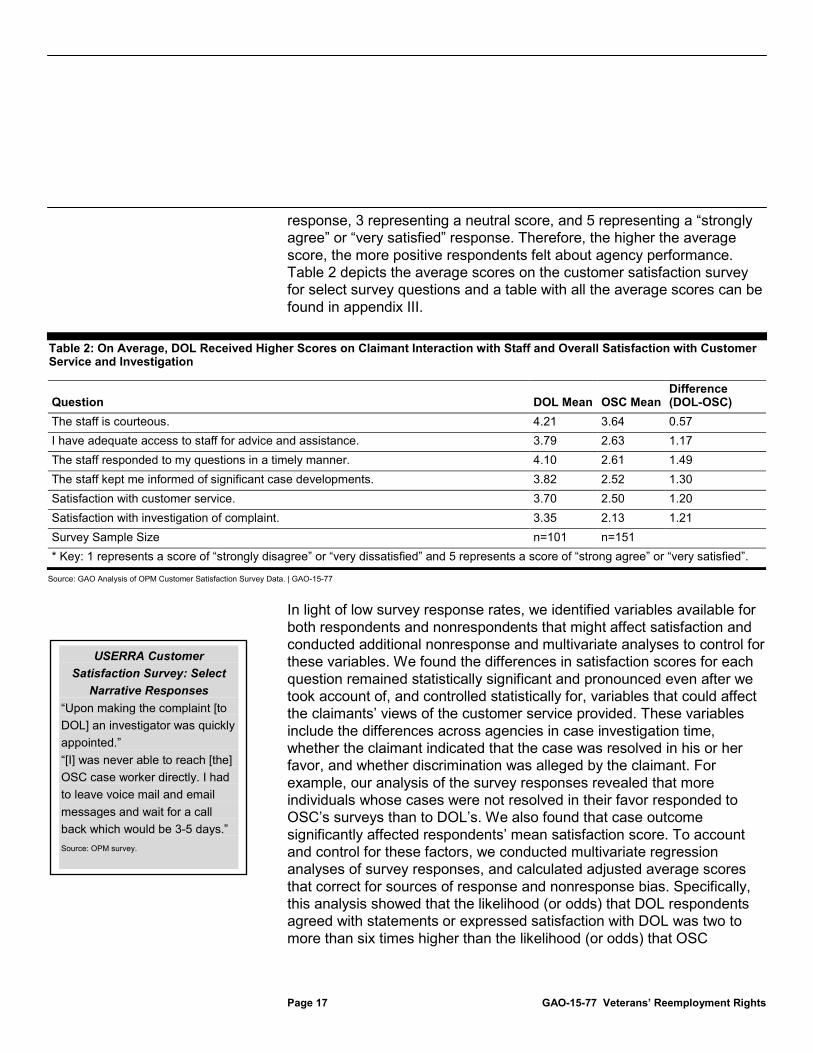
response, 3 representing a neutral score, and 5 representing a “strongly agree” or “very satisfied” response. Therefore, the higher the average score, the more positive respondents felt about agency performance. Table 2 depicts the average scores on the customer satisfaction survey for select survey questions and a table with all the average scores can be found in appendix III.
Table 2: On Average, DOL Received Higher Scores on Claimant Interaction with Staff and Overall Satisfaction with Customer Service and Investigation
Question DOL Mean OSC Mean Difference (DOL-OSC)
The staff is courteous. 4.21 3.64 0.57 I have adequate access to staff for advice and assistance. 3.79 2.63 1.17 The staff responded to my questions in a timely manner. 4.10 2.61 1.49 The staff kept me informed of significant case developments. 3.82 2.52 1.30 Satisfaction with customer service. 3.70 2.50 1.20 Satisfaction with investigation of complaint. 3.35 2.13 1.21 Survey Sample Size n=101 n=151 * Key: 1 represents a score of “strongly disagree” or “very dissatisfied” and 5 represents a score of “strong agree” or “very satisfied”.
Source: GAO Analysis of OPM Customer Satisfaction Survey Data. | GAO-15-77
In light of low survey response rates, we identified variables available for both respondents and nonrespondents that might affect satisfaction and conducted additional nonresponse and multivariate analyses to control for these variables. We found the differences in satisfaction scores for each question remained statistically significant and pronounced even after we took account of, and controlled statistically for, variables that could affect the claimants’ views of the customer service provided. These variables include the differences across agencies in case investigation time, whether the claimant indicated that the case was resolved in his or her favor, and whether discrimination was alleged by the claimant. For example, our analysis of the survey responses revealed that more individuals whose cases were not resolved in their favor responded to OSC’s surveys than to DOL’s. We also found that case outcome significantly affected respondents’ mean satisfaction score. To account and control for these factors, we conducted multivariate regression analyses of survey responses, and calculated adjusted average scores that correct for sources of response and nonresponse bias. Specifically, this analysis showed that the likelihood (or odds) that DOL respondents agreed with statements or expressed satisfaction with DOL was two to more than six times higher than the likelihood (or odds) that OSC
USERRA Customer Satisfaction Survey: Select
Narrative Responses “Upon making the complaint [to DOL] an investigator was quickly appointed.” “[I] was never able to reach [the] OSC case worker directly. I had to leave voice mail and email messages and wait for a call back which would be 3-5 days.” Source: OPM survey.

Page 18 GAO-15-77 Veterans’ Reemployment Rights
respondents agreed with or expressed satisfaction with OSC. For example, the likelihood of DOL claimants agreeing that the agency responded to questions in a timely matter was 6.6 times higher than the likelihood of OSC claimants agreeing that the agency responded to questions in a timely manner. For adjusted customer satisfaction scores, and a more detailed explanation of these analyses and their findings, see appendix III.
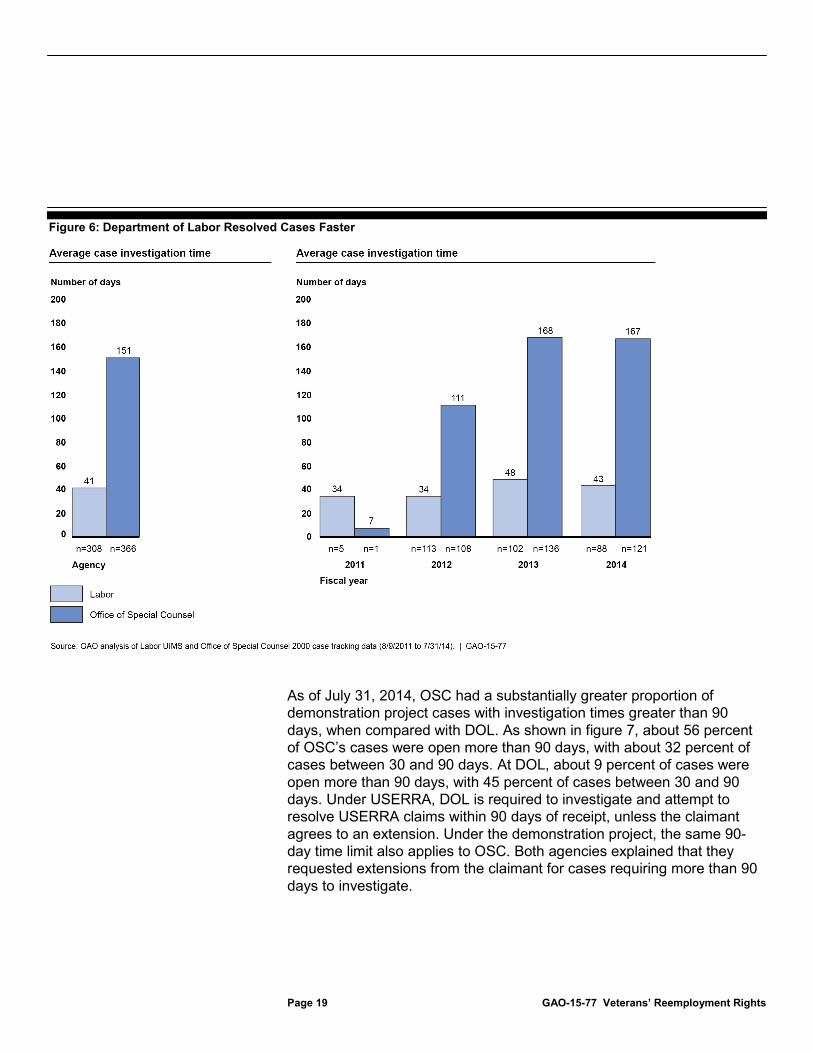
DOL’s average case investigation time was more than three times faster than (or about 27 percent of the time used by) OSC’s case investigation time. As shown in figure 6, between August 9, 2011, and July 31, 2014, DOL’s average investigation time for closed cases was about 41 days, whereas OSC’s average investigation time was about 151 days. Case investigation time varied over time. Both agencies experienced an increase in the average time to investigate cases between fiscal years 2011 and 2013. In fiscal year 2013, DOL’s average investigation time was about 48 days, and OSC’s average investigation time was about 168 days. Between fiscal year 2013 and the end of July 2014, OSC’s average investigation time remained about the same at 167 days, and DOL’s average investigation time fell to about 43 days.
DOL Investigated and Resolved Cases Faster Than OSC
Page 19 GAO-15-77 Veterans’ Reemployment Rights
Figure 6: Department of Labor Resolved Cases Faster
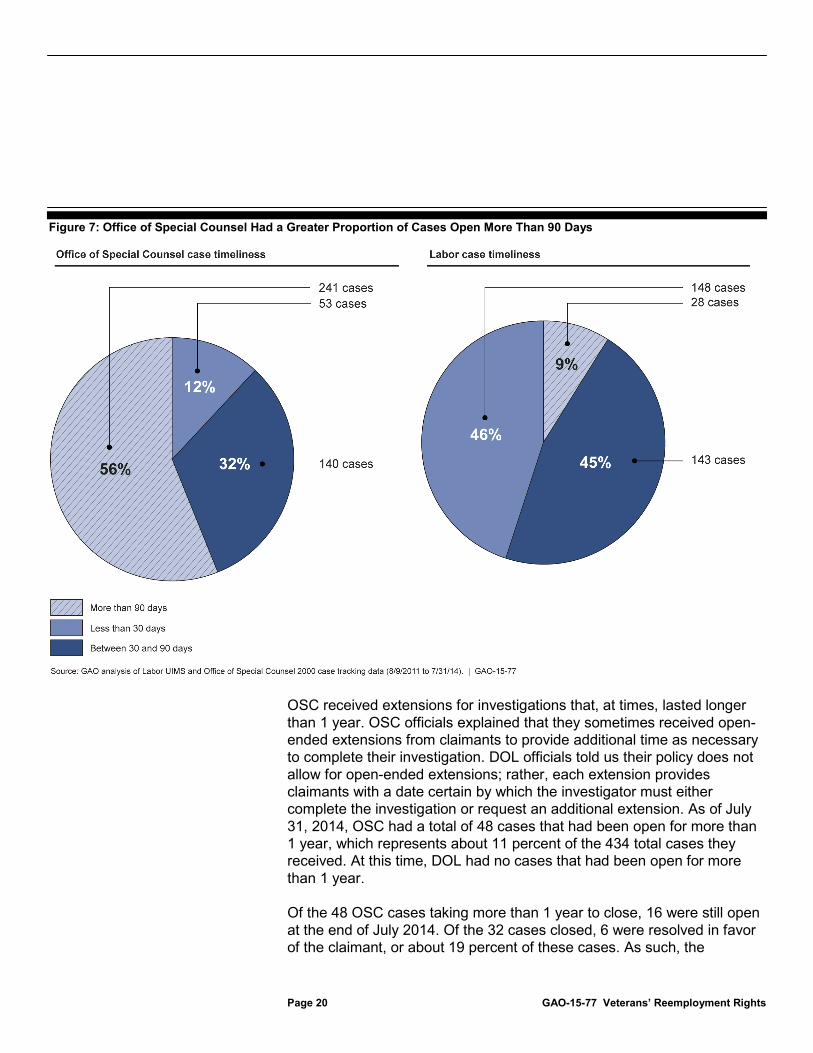
As of July 31, 2014, OSC had a substantially greater proportion of demonstration project cases with investigation times greater than 90 days, when compared with DOL. As shown in figure 7, about 56 percent of OSC’s cases were open more than 90 days, with about 32 percent of cases between 30 and 90 days. At DOL, about 9 percent of cases were open more than 90 days, with 45 percent of cases between 30 and 90 days. Under USERRA, DOL is required to investigate and attempt to resolve USERRA claims within 90 days of receipt, unless the claimant agrees to an extension. Under the demonstration project, the same 90-day time limit also applies to OSC. Both agencies explained that they requested extensions from the claimant for cases requiring more than 90 days to investigate.
Page 20 GAO-15-77 Veterans’ Reemployment Rights
Figure 7: Office of Special Counsel Had a Greater Proportion of Cases Open More Than 90 Days
OSC received extensions for investigations that, at times, lasted longer than 1 year. OSC officials explained that they sometimes received open-ended extensions from claimants to provide additional time as necessary to complete their investigation. DOL officials told us their policy does not allow for open-ended extensions; rather, each extension provides claimants with a date certain by which the investigator must either complete the investigation or request an additional extension. As of July 31, 2014, OSC had a total of 48 cases that had been open for more than 1 year, which represents about 11 percent of the 434 total cases they received. At this time, DOL had no cases that had been open for more than 1 year.
Of the 48 OSC cases taking more than 1 year to close, 16 were still open at the end of July 2014. Of the 32 cases closed, 6 were resolved in favor of the claimant, or about 19 percent of these cases. As such, the

Page 21 GAO-15-77 Veterans’ Reemployment Rights
resolution rates for cases open for more than 1 year, that were resolved in favor of the claimant, are slightly lower than the favorable resolution rates for all of the agency’s demonstration project cases (which was about 26 percent for all closed cases). OSC officials noted that cases open longer than 1 year are often the most complex cases, and therefore take longer to investigate even if they are ultimately not resolved in favor of the claimant.
Factors Potentially Influencing Timeliness. OSC officials provided a few potential explanations for their agency’s relatively longer average case investigation time. For example, OSC officials said that claimants may withdraw their cases and pursue relief on their own at any time. But many prefer that the agency complete its work and attempt to resolve their claim, even if it takes a significant amount of time. Unlike DOL, OSC does not terminate its investigation if the claimant receives representation by private counsel that is also involved in the case. A DOL official told us the agency may terminate these cases if private counsel investigations interfere with their case investigation. OSC and DOL did not collect information that would allow analysis of timeliness for cases where outside counsel was involved. Therefore, we are unable to determine if this was a primary contributor to the agency’s average investigation time.
DOL officials attributed their relatively faster case investigation time to factors such as,
• their institutional structure, which includes staff in field locations that are available to immediately investigate cases across the country;
• the USERRA-specific training provided to staff; • standard operating procedures and related guidance on timely
completion of case investigations; and • the composition of their staff, which includes many veterans who are
dedicated to the agency’s mission to assist servicemembers.
Furthermore, DOL officials said supervisors reinforce the importance of timeliness and closely monitor cases to ensure timely resolution. DOL officials acknowledged that some cases take longer than 90 days to resolve, but these should be exceptions.
As required by VBA, OSC receives all USERRA cases that involve a prohibited personnel practice (PPP). DOL does not handle cases that involve a PPP. OSC officials explained that these cases are often more complex and may take more time to investigate and resolve than other cases because they often involve multiple allegations and can require

Page 22 GAO-15-77 Veterans’ Reemployment Rights
much more extensive fact-finding and legal analysis before a determination or resolution can be reached. To determine if these cases contributed to OSC’s relatively longer case investigation times, we calculated the average case investigation times for cases that included a PPP allegation and compared it to the average case investigation time. We found that during the demonstration project, OSC closed 24 cases involving a PPP allegation, or about 7 percent of all closed cases. The average investigation time for these cases was 201 days, which is about 50 days longer than the average case investigation time for OSC’s demonstration project cases. As such, on average, PPP cases take about 34 percent more time to investigate than the average case. Although these cases do take more time to investigate, due to the relatively small number of PPP cases, and because 50 days falls within the normal variation of case investigation time at OSC, we have concluded that PPP allegations were not a primary contributor to the relatively longer case investigation times between OSC and DOL.
We also considered the potential relationship between case outcome and timeliness. We found that DOL investigations for cases resolved in favor of the claimant took longer to investigate, on average, than cases with an unfavorable outcome; whereas, at OSC, the average case investigation times were about the same. At DOL, the average investigation time for cases that were resolved in favor of the claimant was about 64 days, and for cases not resolved in favor of the claimant was about 35 days (with an average of 41 days for all cases). At OSC, the average investigation time for cases resolved in favor of the claimant was about 150 days, and for cases not resolved in favor of the claimant was about 151 days. While favorable case outcomes are associated with longer case investigation times at DOL, they do not appear to be a contributing factor to case investigation timeliness at OSC.
On average, it cost DOL about three times less (or about 29 percent of the cost) to investigate demonstration project cases than OSC. The relative difference in agencies’ costs was affected by factors such as the number of hours dedicated to case investigations and pay levels, among others. For example, we found that OSC used more than twice the number of staff hours, on average, per case, than DOL. We did not evaluate OSC’s demonstration project costs prior to August 12, 2012, because these cost data were incomplete and we were not able to assess their reliability.
DOL’s Case Investigation Costs Were Lower Than OSC’s

Page 23 GAO-15-77 Veterans’ Reemployment Rights
As we recommended in our preliminary assessment of the demonstration project’s design, DOL and OSC established cost accounting systems by the start of the demonstration project on August 9, 2011, to collect and track actual time spent investigating USERRA demonstration project cases.13 While the cost accounting systems developed at each agency differ somewhat in the way they track time spent, both systems track actual salary, benefits, and indirect cost components by applying an hourly rate that includes those components for each specific employee who works on, and tracks time spent on, demonstration project cases. We conducted tests on each agencies’ cost and accounting data to ensure these cost components were accurately reflected in their total costs. To determine the total cost, agencies multiplied the hourly rate for all personnel who participated in the demonstration project, by the total time spent working on USERRA demonstration project investigations. Agencies also tracked indirect miscellaneous costs, such as shipping, and included these costs to their totals.
OSC was not able to provide us with complete cost information for the demonstration project in time for us to analyze the complete set of data and assess its reliability. On August 12, 2012, OSC changed the methodology it used to track and report costs during the demonstration project to be more consistent with the approach used by DOL. As such, we are not evaluating demonstration project costs at OSC prior to that date, and are only able to report on the cost information that we received, and assessed for reliability.
Between the beginning of the demonstration project on August 9, 2011, and July 31, 2014, DOL investigated 319 claims at a total cost of $354,712. During the period for which we have comparable and reliable data, from August 12, 2012, to August 1, 2014, OSC’s demonstration project costs totaled $1,055,377. Importantly, these totals include costs for both closed and ongoing cases during the periods described. Because 79 demonstration project cases were still open at the end of July, and due to the incomplete information received from OSC, the final cost of the demonstration project was not known at the time of this product’s issuance.
13GAO-11-312R.

Page 24 GAO-15-77 Veterans’ Reemployment Rights
Of the 319 claims investigated by DOL, the agency closed 308. As such, there were 11 demonstration project cases still open. The total cost of $354,712 covers all 308 closed cases, and work completed on the 11 open cases during this period. On average, the agency spent $1,112 on each case investigated during the demonstration project. The agency reported that demonstration project staff dedicated 6,579 hours to investigate demonstration project cases, or about 21 hours for each case received during this period. DOL officials explained that their total cost does not include some costs from support staff, case intake processing, and for managers who assisted, as needed, with some demonstration project activities. DOL officials explained that they did not track these costs because it was not practically feasible, and the agency would have incurred these costs regardless of their participation in the USERRA demonstration project.
To compare agencies, we also linked OSC’s cost information to the number of cases that were opened and closed during the period for which comparable and reliable cost information was available. Between August 12, 2012, and August 1, 2014, OSC opened 277 cases and closed 275 cases. As such, OSC spent about $3,810 for each case that it opened during this period, or about $3,838 for each case that the agency closed during this period. Furthermore, the agency reported that demonstration project staff dedicated 14,864 hours to investigate demonstration project cases, or about 54 hours for each case received during this period. On average, this is more than double the number of hours spent per case, at DOL. The total cost of $1,055,377 covers the investigation costs of all cases worked during this period, and is not necessarily limited by the cases that were opened and closed during this time.
VBA refers to five criteria for consideration when evaluating DOL’s and OSC’s capacity to investigate federal USERRA claims: staffing levels, caseload, training, education, and grade level. In addition, agencies provided their view of other distinguishing characteristics that enhance their ability to effectively and efficiently investigate and resolve USERRA claims. We could not determine relative performance on agency capacity due to the lack of a specific and comparable metric.
Each Agency Demonstrated Differential Capabilities to Investigate and Resolve Cases

Page 25 GAO-15-77 Veterans’ Reemployment Rights
During the demonstration project, DOL had more staff available to investigate cases with lower average USERRA caseloads than OSC. OSC’s investigative staff generally had higher pay levels (or higher pay grades) than DOL. Both agencies’ staff had varying levels of education and experience.
During the demonstration project, DOL had 31 staff investigating demonstration project cases, and other nonfederal USERRA or veterans’ preference cases.14 OSC had 7 staff investigating demonstration project cases.15 According to DOL officials, their investigators have varying levels of education and provided no specific information. Rather, DOL officials suggested that the level of investigators’ experience, can serve as a proxy for education, as will be discussed later. Of OSC’s seven investigators, five are attorneys with Juris Doctor degrees (J.D.), one has a Master’s degree, and one has a Bachelor’s degree. OSC has had additional staff throughout the demonstration project, as well as a part-time Alternative Dispute Resolution (ADR) specialist—also with a J.D. and a Master’s degree in Conflict Analysis and Resolution—from OSC’s ADR unit. OSC also employed six legal interns who were J.D. candidates and two different Presidential Management Fellows (PMF) with J.D.s during the demonstration project. The PMFs were full-time employees and were responsible for investigating cases, whereas some of the interns worked part-time and some worked full-time and provided case intake and research support and were not assigned cases to investigate. On average, these individuals served for periods of 3 to 6 months each.
14DOL is responsible for investigating claims alleging a federal agency failed to apply veterans’ preference in hiring or during a reduction-in-force. 15Six DOL investigators who worked on demonstration project cases are no longer active investigators. In addition, DOL has 81 other investigators—for a total of 106—qualified to investigate USERRA claims and DOL officials told us these investigators were available to conduct demonstration case investigations, as needed. According to OSC, one of the investigators who worked on demonstration project cases is no longer an active OSC investigator.
DOL Has More USERRA Dedicated Staff, While OSC Has More Cases Assigned Per Investigator and Higher Graded Staff

Page 26 GAO-15-77 Veterans’ Reemployment Rights
Table 3: DOL Has More Investigative Staff with Generally Lower Pay Levels While OSC Had Less Investigative Staff with Higher Caseloads
Number of Staff who Investigated Demonstration
Project Cases
General Schedule (GS)
Pay Range
Average Annual
Caseloada
DOL Investigators
b
31 GS12-13 5 OSC Investigators 7 c GS 11-14 28
Source: GAO analysis of DOL and OSC information | GAO-15-77 a The General Schedule classification system is a mechanism for organizing work, notably for the purposes of determining pay, based on a position’s duties, responsibilities, and qualification requirements, among other things. bThese figures represent the average number of cases an investigator would have been assigned over a 12-month period. We calculated weighted averages because the number of staff at both agencies was not always constant and the demonstration project was not ongoing for the entirety of fiscal years 2011 and 2014 c
This number includes a supervisor who also investigated cases. It does not include the part-time ADR specialist who supports the USERRA Unit
DOL’s investigators were assigned an average of about five demonstration cases per investigator per year during the demonstration project. Demonstration project investigators had other responsibilities such as other nonfederal USERRA or veterans’ preference cases, and the average demonstration project caseload varied by year. The average demonstration project caseload at DOL ranged from an average of about seven cases per investigator in 2012 to an average of about four cases in fiscal year 2014. The agency’s investigators did not work solely on demonstration cases during the demonstration project. They were assigned other non-demonstration cases as well, as will be discussed later.
Our analysis of the caseload showed, over the course of the demonstration project, OSC averaged about 28 cases opened per employee each year.16 OSC officials told us each non-supervisory
16OSC did not assign and track their demonstration case assignments in a way that enabled them to report the exact number of cases assigned per investigator per fiscal year. So, we calculated the number of cases opened per OSC USERRA Unit investigator or attorney as a proxy. These figures were calculated by using case tracking data to identify the number of cases assigned to OSC over time, alongside corresponding employment data, to determine the number of investigators employed during specific time periods. According to OSC officials, OSC’s USERRA Unit Chief and one other employee did not regularly receive cases to investigate, but were assigned cases on an ad hoc basis. We included these two employees in our calculations because they did receive cases to investigate.
Page 27 GAO-15-77 Veterans’ Reemployment Rights
USERRA Unit investigator or attorney generally has between 10 and 20 open cases on his or her docket at any given time, and that the number per fiscal year fluctuates based on the complexity and timing of each case. When the demonstration project began, OSC had four attorneys staffed to its USERRA Unit to investigate and resolve cases, including the Unit Chief. Beginning in the spring of 2012, OSC began hiring other investigators and temporary staff to help with the caseload. OSC’s average caseload ranged from an average of 39 cases per attorney per year during part of fiscal years 2011 and 2012 to 20 cases per attorney per year during part of fiscal year 2012.17 Similar to the DOL investigators, OSC investigators had additional responsibilities during the demonstration project.
DOL investigators receive formal USERRA-specific training as well as training on conducting investigations, according to DOL officials. The investigators must complete an online training and a 2-week class at the National Veterans Training Institute (NVTI) before investigating cases, and have additional training and professional development opportunities. The online training class has four components and NVTI focuses on USERRA basic training and investigation training. Specifically, investigators are trained on USERRA and its regulations, claim processing, determining eligibility for USERRA, USERRA remedies, contacting employers and claimants, negotiation skills and techniques, investigations and evidence, resolution conferences, negotiations, interviewing methods and techniques, types of respondents, credibility of witnesses/witness statements, and confidentiality and ethics. In addition, DOL investigators receive on-the-job mentoring and shadowing prior to independently investigating cases. According to DOL officials, additional training opportunities are contingent on the training budget. Some investigators took DOL investigative training while also participating in external training classes through organizations such as the Army Inspector General School.
OSC does not have a formal USERRA training program for its staff because, according to OSC officials, a majority of the current USERRA staff has experience from the previous demonstration project. However,
17These caseload averages represent the average caseload if the staffing levels had remained constant for the entire fiscal year. However, because OSC had temporary staff and other staff who came and left the USERRA Unit, we were unable to calculate the exact average caseload per fiscal year.
DOL and OSC Staff Received Case Investigation and Resolution Training

Page 28 GAO-15-77 Veterans’ Reemployment Rights
many USERRA Unit staff received formal training on ADR techniques for USERRA investigations. Specifically, OSC’s ADR Unit conducted training on mediation, conflict resolution, beginning negotiation, and advanced negotiation that was attended by USERRA Unit staff. To help employees understand the documentation needed to perform case investigations, OSC provides its new USERRA employees with several training materials, including a PowerPoint slide presentation, a sample correspondence, copies of relevant laws and regulations, and a series of written training modules that include fact sheets, flow charts, common scenarios, and questions and answers on USERRA law. According to OSC officials, these training materials are given to new employees to use for background information and to reference when performing casework, and are periodically updated to reflect recent court decisions and legislative changes. The USERRA Unit Chief and other experienced members also provided on-the-job training and mentoring to interns, PMFs, and a law clerk during the demonstration project. The USERRA Unit also has a number of training modules that cover different common scenarios that the USERRA Unit staff can access. These modules are periodically updated as new cases come up and during an annual review of USERRA-related cases.
DOL has been investigating USERRA claims since the USERRA law was passed in 1994, and its investigators have experience investigating these claims. Among all of DOL’s current investigators, 41 percent have less than 5 years of experience, 41 percent have 5 to 10 years of experience, and 19 percent have more than 10 years of experience at the agency.18 The investigators who worked on demonstration project cases had an average of 8.9 years of experience.
In addition to the relatively large demonstration project staff at DOL, investigators also investigate numerous claims annually. The 31 investigators who worked on demonstration cases were assigned an average of about 15 USERRA cases (demonstration and non-demonstration) per investigator per year during the time they were employed by DOL. Overall, all current DOL investigators have been assigned an average of about 11 USERRA cases per year since 1996
18As mentioned previously, DOL has 106 investigators that can investigate USERRA claims.
DOL Has More Investigators with More Experience and Information Technology Infrastructure Benefitting USERRA Investigations

Page 29 GAO-15-77 Veterans’ Reemployment Rights
when the agency began tracking these claims.19 According to DOL, its larger pool of investigators is a benefit because USERRA work will not be affected due to individual staff availability or turnover. There will be other DOL investigators who can step in to perform the USERRA work as needed.
DOL said the agency is investing in its USERRA Information Management System electronic case tracking database through upgrades that will enhance its capabilities and transform the case tracking database into a case management system. According to DOL officials, the upgrades to the database will better protect the personally identifiable information in the case files, allow for better oversight of case investigations, and increase the efficiency of case processing. DOL plans on making this investment regardless of the results of the demonstration project because federal USERRA cases only represented about 20 percent of all USERRA cases over the past 2 years.
DOL has an online system called the elaws advisor that assists potential USERRA claimants. The elaws advisor has a logic and decision tree function that asks claimants questions and provides information on USERRA to enable potential claimants to decide if they think their claim is valid and provides claimants information on how to file a claim. According to DOL officials, this online system has reduced the number of phone calls received, improved communication, and enabled claimants to more easily submit claims.
OSC Alternative Dispute Resolution. According to OSC officials, in September 2012, OSC updated its mediation process after conversations with stakeholders, agency counsel, and servicemember organizations, including the Employer Support of Guard and Reserve and now uses a mediation-based ADR program to help claimants and agencies resolve USERRA claims. According to OSC officials, the program follows the requirements of the Administrative Dispute Resolution Act of 1996 for conducting federal agency mediations.20 OSC designed and implemented a USERRA-focused ADR program to provide additional resolution process options (such as mediation) for servicemembers who filed
19DOL has investigated USERRA cases since the law’s 1994 inception, as well as investigating prior cases under the predecessor Veterans’ Reemployment Rights Act. 20Pub. L. No. 104-320 , 110 Stat. 3870 (Oct. 19, 1996).
OSC Uses Alternative Dispute Resolution to Facilitate Resolution and Has Additional Responsibility to Represent Claimants

Page 30 GAO-15-77 Veterans’ Reemployment Rights
USERRA claims and the agencies against whom the claim is filed. The ADR process is voluntary, but if parties agree to use it, OSC mediators bring them together in a confidential, nonadversarial environment to find a mutually satisfactory resolution to the dispute.
As such, the ADR process relies heavily on mediation, a process through which a neutral third party works with the disputing parties to open lines of communication, explore interests, and, through this process, find a mutually satisfactory resolution to the dispute. OSC officials told us the ADR process gives servicemembers the opportunity to resolve their claims with more carefully tailored results that may better meet their needs than strict legal remedies. OSC officials explained that it uses a small number of core mediators who have a combined 50 years of experience, education, and training in dispute resolution who are generally not USERRA Unit employees. Figure 8 shows OSC’s ADR and case investigation process.

Page 31 GAO-15-77 Veterans’ Reemployment Rights
Figure 8: OSC Uses ADR Process to Mediate USERRA Cases to Offer Claimants Additional Resolution Options
According to agency officials, since September 2012, OSC has used the ADR process for 19 demonstration cases, settling 17 of the 19 cases, or 89 percent. Some of the settlements have resulted in systemic changes in agencies’ policies and procedures that will impact other servicemembers, such as a change to a form for a federal agency so that “extended absence” forms now include a category for extended absence to perform military service, which OSC believes will better ensure that servicemembers receive their full USERRA entitlements following service.
OSC’s Legal Experience. Furthermore, OSC officials attribute their ability to handle USERRA claims to their expertise on the federal

Page 32 GAO-15-77 Veterans’ Reemployment Rights
workforce and federal personnel law; training and experience in investigating, resolving, and litigating federal employment claims, including USERRA and PPPs; well-established relationships with federal agencies; and an expanded ADR program. OSC also has the responsibility of deciding whether or not to represent a claimant before the Merit Systems Protection Board (MSPB). OSC officials told us that OSC has had this responsibility since 1994 and has successfully resolved dozens of these cases without litigation in USERRA cases before MSPB.
Three of the five attorneys in the USERRA Unit have between 3 and 7 years of experience handling the USERRA cases referred from DOL and deciding whether or not to offer claimants representation in front of MSPB, according to OSC officials. In addition, five of the seven employees who worked on current demonstration project cases also worked on cases received during the prior demonstration project from 2005 to 2008.
OSC IT Infrastructure. OSC officials also stated that they are investing in updates to their primary case tracking database, OSC 2000, and are developing a system whereby all case files will be retained digitally. This will reduce waste and make the assignment of cases more efficient. OSC officials noted that they updated OSC’s official website to include a complaint dashboard where prospective claimants can select the type of claim they would like to file with a brief description of the type of violation each claim is—USERRA or the other types of cases OSC investigates. OSC officials told us they also added functionality on their website enabling prospective claimants to file claims online.
OSC Received Reimbursement from DOL for Demonstration Project Costs. In January 2012, DOL and OSC entered into an interagency agreement that provided OSC with reimbursement for demonstration project costs. This agreement was signed more than a year after Congress passed VBA and about 5 months after the start of the demonstration project. This agreement was based on a similar interagency agreement that was negotiated in 2005 during the first USERRA demonstration project. According to agency officials, the reimbursement rates were based on the rates agreed to in 2005 and adjusted upward for inflation. DOL reimbursed OSC between $3,184 and $3,379 per demonstration case it closed depending on the fiscal year the case was referred to OSC.

Page 33 GAO-15-77 Veterans’ Reemployment Rights
DOL and OSC no longer receive feedback on customer satisfaction now that the demonstration project has ended. During the demonstration project, OPM administered the customer satisfaction survey, analyzed the survey data annually, and provided each agency the quantitative data results and qualitative comments respondents provided. Both agencies have reported gaining insights on improving service to claimants based on information provided through the survey. For example, both agencies used information collected from survey respondents and survey analysis provided by OPM to make incremental improvements in their USERRA demonstration project operations. Specifically, DOL officials told us that they used survey information to improve their communication with claimants. DOL officials said they now engage in more telephone and email interactions with claimants. OSC officials also took actions to improve their customer service based on survey results by providing earlier and more frequent contact with claimants (at least once a month), informing the claimant of the preliminary determination via phone before mailing the determination letter, and establishing a goal to respond to claimant emails and phone calls within 1 business day.
The Office of Management and Budget (OMB) has emphasized the importance of setting customer service standards, regularly soliciting customer feedback, and using the feedback they receive to improve their services. To this end, OMB established a cross-agency priority goal aimed at adopting customer service best practices. According to this priority goal, government programs that directly serve the public can benefit from understanding customer expectations and service needs, and regularly evaluating and improving program effectiveness in meeting those needs. One way to accomplish this is by conducting customer satisfaction surveys and analyzing the results to identify opportunities to improve service.
The customer satisfaction survey for the USERRA demonstration project ceased on July 28, 2014—the survey was created to support the USERRA demonstration project. Neither DOL nor OSC has an ongoing
Customer Satisfaction Can Provide Meaningful Feedback for Service Improvements
Customer Satisfaction Survey Ends

Page 34 GAO-15-77 Veterans’ Reemployment Rights
agreement with OPM to continue administering the customer satisfaction survey for USERRA claimants. Also, neither agency has developed other plans to continue the customer satisfaction survey.
The amount spent on the survey represents slightly more than 5 percent of DOL’s total investigation costs, and about 2 percent of OSC’s investigation costs between August 2012 and August 2014. The cost to administer the customer satisfaction survey was $20,000. As previously discussed, DOL spent $354,712 on investigating demonstration cases and OSC spent more than $1,055,377 on investigating demonstration cases. Agencies used survey results to make adjustments but the survey ended in July 2014. Such a feedback mechanism will provide agencies an opportunity to enhance customer service.
Both agencies had a low response rate to the customer satisfaction survey. As of July 28, 2014, DOL had 101 claimants respond for a response rate of 32 percent and OSC had 151 claimants respond for a response rate of 42 percent.21 Of the 101 DOL respondents, 69 provided narrative comments on the final two questions. Of the 151 OSC respondents, 135 provided narrative comments on the final two questions.
A high response rate increases the likelihood that the survey results reflect the views and characteristics of the target population, whereas a low response rate can be an indicator of potential nonresponse bias, which would be detrimental to the accuracy of the results of a study in a variety of ways. OMB guidance recommends that executive branch agencies should try to achieve the highest practical rates of survey response. Moreover, OMB suggests that when survey response rates are less than 80 percent, agencies conduct a nonresponse analysis to identify potential limitations to the data.
As we recommended in 2012, agencies undertook additional efforts to increase the response rate, included providing claimants with an initial notification of the survey; however, agencies did not pursue other
21Response rates were calculated based on survey information provided by OPM on July 28, 2014. We received updated case information from each agency after this date. As such, there may be a difference when calculating the response rate using the case outcome data presented above, versus the information provided by OPM.
Low Response Rates Limit Agency Efforts to Make Service Improvements

Page 35 GAO-15-77 Veterans’ Reemployment Rights
methods to increase response, such as by contacting respondents over the phone or providing more than two additional follow-up notifications, because they did not want to aggravate claimants with repeated follow-up requests.22
We analyzed agencies relative performance on the five demonstration project metrics outlined in the VBA, including case outcomes, customer satisfaction, timeliness, cost, and capacity. Based on our analysis, DOL demonstrated relatively higher levels of performance than OSC on most of these performance metrics. Specifically, DOL demonstrated higher levels of customer satisfaction and resolved cases in about one-third of the time and for about one-third of the cost, on average; whereas OSC resolved a greater proportion of cases in favor of the claimant. The relative difference in agencies’ costs was affected by factors such as the number of hours dedicated to case investigations and pay levels, among others. However, there are other considerations affecting agency performance, such as differing resource levels, staffing levels and qualifications, and case review and investigative approach. Our report provides Congress with agencies’ relative performance information that may help inform the policy decision on the future responsibilities of the two agencies for the processing of USERRA claims against federal executive agencies.
In response to our past recommendations, DOL and OSC worked together to establish and administer a customer satisfaction survey that solicited feedback on service provided to claimants. The customer satisfaction survey concluded on July 28, 2014, and, although DOL and OSC undertook additional efforts to increase the response rate, the response rate remained low. Agencies do not have plans to administer a customer satisfaction survey in the future. Agencies officials at both agencies told us they benefited from the information collected during the survey, and used survey information to make improvements in their operations to better serve claimants. Without ongoing access to customer satisfaction information, both agencies will be unable to track satisfaction levels over time, and may miss opportunities to receive feedback from servicemembers and make additional improvements to federal USERRA operations in the future.
22 GAO-12-860R.
Conclusions

Page 36 GAO-15-77 Veterans’ Reemployment Rights
We recommend that any federal agency designated to investigate future USERRA claims against federal executive agencies take the following two actions:
• Continue administering a customer satisfaction survey, whether administered by OPM or the agency, so the agency investigating federal USERRA claims can receive consistent feedback and improve service to claimants.
• Undertake efforts to increase the response rate of the customer satisfaction survey if it continues to be administered, so more tenable conclusions can be drawn from its data. Such efforts may include follow-up phone calls to nonrespondents, additional email notifications requesting participation in the survey, or making the survey easier to complete and submit.
We provided a draft of this report to DOL and OSC for review and comment. DOL concurred with our two recommendations and said it is committed to continuous improvement of the USERRA program. DOL comments are reprinted in appendix IV. In response to our recommendations, DOL stated it has plans to continue a customer satisfaction survey for USERRA claimants in fiscal year 2015 and will take steps to maximize response rates. Recognizing the need for continuous improvement, DOL added that the agency invested in an electronic case management system for implementation in fiscal year 2015. DOL also provided technical comments which we incorporated as appropriate.
In its written comments, OSC did not say whether it agreed with our two recommendations and expressed concerns about our characterization of performance data and conclusions. OSC’s comments, including examples of case outcomes, are reprinted in appendix V. OSC also provided technical comments which we incorporated as appropriate.
OSC expressed a concern that we ignored its efforts and successes in securing relief for veterans. OSC characterized the report as containing unreliable data, unsupportable conclusions, and a subjective assessment of relative performance. Our report presents a fair, balanced, and objective portrayal of relative performance between OSC and DOL. We worked with both agencies to develop an approach for collecting and reporting comparable performance data since the beginning of the demonstration project in 2011. Our report acknowledges the complexity of
Recommendations for Executive Action
Agency Comments and Our Evaluation

Page 37 GAO-15-77 Veterans’ Reemployment Rights
assessing relative performance for the performance metrics outlined in VBA. As we report, performance can be affected by factors such as the investigative approaches used by agencies, case type, and other factors. Where appropriate, we have provided additional information or clarification to ensure that the performance information is viewed in the appropriate context.
Our response to the specific points raised by OSC are as follows.
OSC expressed several concerns with our analysis of case outcomes. OSC commented that we diminished and obscured performance information regarding case outcomes. OSC also claimed we abdicated responsibility by not providing a qualitative assessment of case outcomes based on summary case information. Our report provides clear information regarding the number of cases received and closed, as well as the percentage of cases resolved in favor of the claimant. It was not our intention to assess the merits of agencies’ case outcomes. At the beginning of the demonstration project, we made clear to OSC that it would be inappropriate for us to review case files and make an independent determination of the merits of agencies’ case outcomes. Moreover, as previously stated, we worked with agencies prior to the demonstration project to develop a method to ensure that case outcomes could be described in a consistent manner, and a comparison could be made at the conclusion of the demonstration project. While we did not attempt to assess the merits of agencies’ case outcomes, our report provides examples of specific relief claimants received and information on the types of outcomes OSC achieved.
OSC objected to our inclusion of 7 cases from DOL that were decided in favor of the claimant, but did not result in the claimant receiving relief. To address this concern, our report provided additional details to describe our treatment of such cases. We had to rely on agencies’ determination of whether certain cases were resolved in favor of the claimant because certain case outcomes were not included in the cross-walk. Specifically, as we report, OSC’s totals include 3 cases in which corrective action was declined by the claimant, or about 3 percent of the 94 cases the agency resolved in favor of the claimant. DOL’s totals include 7 cases that had merit, but which were not resolved, or about 11 percent of the 62 cases the agency resolved in favor of the claimant. According to OSC officials, the code “corrective action declined by claimant” indicates that the agency offered resolution but the claimant declined it. According to DOL officials, the code “merit, not resolved” indicates that the claim was

Page 38 GAO-15-77 Veterans’ Reemployment Rights
meritorious, but the agency did not offer resolution, or the claimant declined the resolution that was offered.
OSC expressed several concerns with our analysis of agency cost data. OSC stated that the cost information presented is unverifiable. We believe the cost information presented in our report is reliable. We took steps to assure the reasonableness of cost figures reported by agencies. We conducted tests on each agency’s cost and accounting data to ensure appropriate cost components were accurately reflected in their total costs. We independently reviewed supporting documentation and verified that the cost information was reasonable. For more details regarding our analyses and data reliability assessments, see our scope and methodology in appendix I.
OSC stated that DOL’s total costs are incomplete because the total cost and hours reported constitute only about 105 hours per year, per DOL investigator, or about 5 percent of the 2,088 annual hour work schedule. OSC’s statement is based on the false assumption that the 31 DOL investigators who worked on USERRA demonstration project cases, worked on them full time. We have added language to make clear that DOL investigators had other responsibilities. Specifically, we added information explaining that DOL’s investigators also worked on other nonfederal USERRA or veterans’ preference cases. OSC also speculated that the average annual caseload of 15 USERRA demonstration and non-demonstration project cases comprised DOL investigators’ full workload. As we clarified, investigators also worked on veterans’ preference cases, which are not included in this average annual caseload figure. Furthermore, we did not collect information on the time spent on non-demonstration project cases or other duties. Thus, we cannot draw conclusions about the average time, or proportion of time, dedicated to non-demonstration project related work activities.
OSC stated we reported that neither agency tracked the costs of individual cases, and so were unable to report the cost of closed cases. However, we reported the total cost and the average cost for investigating a case during the demonstration project.
OSC stated that, in 2012, we requested that the agency change its methodology for tracking costs to be more consistent with DOL. In 2011, at the beginning of the demonstration project, we recommended that agencies establish comparable methods and procedures for tracking and reporting demonstration project costs. We did not suggest a specific method or approach for agencies to follow, but asked that agencies agree

Page 39 GAO-15-77 Veterans’ Reemployment Rights
to a comparable approach that would facilitate a relative comparison of costs at the conclusion of the demonstration project. Agencies implemented this recommendation, which enabled us to provide comparable cost information for both agencies in this report.
OSC expressed concern that we failed to put the customer satisfaction survey results in the proper context. OSC stated that we did not expand on the limitations and potential biases of the survey data until the end of our report. We recognize the low survey response rate throughout the report and identified the actions we took that enabled us to draw conclusions about the survey. Our analyses revealed that differences in DOL and OSC satisfaction scores for each question remained statistically significant and pronounced even after controlling for variables that could affect the claimants’ views of the customer service provided. However, we made minor adjustments in the Highlights page language to clarify that, due to the low response rate, we undertook additional statistical analyses to control for potential sources of bias.
OSC stated that we failed to include OPM concerns about biases in the survey data. OPM’s conclusions were based on a nonresponse analysis conducted in 2013, and not the final analyses provided in this report. OPM’s analyses did not control for variables that could affect claimants’ views of the services received from each agency.
OSC stated that our decision to report the raw (not adjusted) customer satisfaction survey scores in the body of the report is misleading. OSC said that we reported adjusted scores only in appendix III. We reported on both raw and adjusted scores in our report. Both the actual and adjusted scores demonstrate, with a high degree of confidence, that DOL’s respondents were more satisfied than OSC’s respondents.
We will send copies of this report to the Secretary of Labor and to the Special Counsel, and other interested parties. This report will also be available at no charge on GAO’s website at http://www.gao.gov.

Page 40 GAO-15-77 Veterans’ Reemployment Rights
If you have any questions on this report, please contact me at (202) 512-2717 or [email protected]. Contact points for our offices of Congressional Relations and Public Affairs may be found on the last page of this report. Key contributors to this report are listed in appendix VI.
Yvonne D. Jones Director, Strategic Issues

Appendix I: Objectives, Scope, and Methodology
Page 41 GAO-15-77 Veterans’ Reemployment Rights
The Veterans’ Benefits Act of 2010 (VBA) required us to undertake a final assessment of the demonstration project and provide a report to Congress 90 days after the end of the demonstration project. This report (1) assesses agencies’ relative performance under VBA performance metrics including case outcomes, customer satisfaction, timeliness, cost, and capacity; and (2) identifies actions agencies can take to improve service.
To assess the agencies’ relative performance, we reviewed the demonstration project requirements set forth in VBA and compared final agency data on case outcomes, timeliness, customer satisfaction, and cost. We also reviewed information on agency capacity including staffing levels, grade level, training, education, and caseload. The demonstration project period began on August 9, 2011, and concluded on August 9, 2014; however, to ensure we met the mandated reporting deadline, this report includes data collected through the end of July 2014. We also provided comparative and descriptive explanations of agency capacity.
Case Outcomes and Timeliness. To assess case outcomes and timeliness, we analyzed data from the Department of Labor’s (DOL) case tracking system (the USERRA Information Management System, or UIMS) and the Office of Special Counsel’s (OSC) case tracking system (OSC 2000) for demonstration cases opened between August 9, 2011, and July 31, 2014. We also reviewed relevant agency documents and interviewed DOL and OSC staff. We assessed case tracking data to identify the number of cases received, the number of cases resolved in favor of the claimant, and those not resolved in favor of the claimant. To identify the number of cases received, we removed duplicate and non-unique claims from both agencies, and totaled the number of claims received and resolved each fiscal year. As such, our case totals may vary from the number of cases reported by agencies in prior Uniformed Services Employment and Reemployment Rights Act of 1994 (USERRA) progress reports issued to Congress. To determine the cases resolved in favor of the claimant, we reviewed the agencies’ cross-walk of case outcomes to identify corresponding case closure dispositions and case closure codes. We also interviewed agency officials. DOL uses the resolution codes claim granted, claim settled, and merit - not resolved, to identify cases resolved in favor of claimants. OSC uses the codes dispute resolved, corrective action, and complainant declines corrective action offered. To assess the timeliness of cases, we calculated the average case investigation time for each fiscal year and for all demonstration project cases closed between August 9, 2011, and July 31, 2014. We also calculated the average age of demonstration project cases that were
Appendix I: Objectives, Scope, and Methodology

Appendix I: Objectives, Scope, and Methodology
Page 42 GAO-15-77 Veterans’ Reemployment Rights
open as of July 31, 2014. In addition, we grouped cases into one of three categories based on the investigation processing times for both open and closed cases–cases open less than 30 days, cases open between 30 and 90 days, and cases open more than 90 days. We also considered factors that may have contributed to timeliness of case resolution, such as whether the case was decided in favor of the claimant, and whether the case involved a prohibited personnel practice.
To assess the reliability of agency case tracking data, we reviewed agency documentation on any significant operational or case management changes occurring since our last report, issued in September 2012. We tested the data for missing entries, errors, duplicate entries, and other logic testing. We also reviewed related agency documentation, including our previous reports, and interviewed DOL and OSC staff. We determined that internal controls for the demonstration project had not changed substantially since our past reviews. We generally found low rates of missing data or erroneous dates pertinent to our analysis. For cases in which we found missing information or dates or Social Security numbers out of sequence, we followed up with the agency and, as appropriate, updated our analysis files with corrected information. For example, we found that OSC had received a number of demonstration project cases from claimants who did not provide a Social Security number, and which had an even-numbered opening date. According to the demonstration project procedures agreed to by both agencies, OSC was authorized to accept claims that did not have a corresponding Social Security number, if they were filed on an odd date, whereas, DOL would accept cases filed on even dates. We asked OSC about this discrepancy, and officials there explained that for some cases that did not have a corresponding Social Security number, the agency received claims on an odd numbered day, but did not enter the claim into their case tracking system until the next day. OSC provided us with the correct case opening date for these cases. DOL officials told us they followed the agency’s existing USERRA operations manual during the demonstration project to ensure data reliability and validity, while OSC drafted a data reliability plan specifically for the demonstration project. Based on the collective results of our data reliability assessment, we consider the data elements we assessed in DOL and OSC case tracking databases to be sufficiently reliable for the purposes of evaluating relative performance of DOL and OSC during the demonstration project.
Customer Satisfaction. To assess customer satisfaction, we analyzed data, results, and narrative responses from the USERRA customer satisfaction survey. Surveys were sent by each agency to claimants upon

Appendix I: Objectives, Scope, and Methodology
Page 43 GAO-15-77 Veterans’ Reemployment Rights
resolution of their cases. Survey data were collected independently by the Office of Personnel Management (OPM). The survey data collection ended July 28, 2014, for our reporting purposes. Agencies entered into an agreement with OPM to administer the satisfaction survey and provide interim reports providing customer satisfaction performance information. Because the response rate to the survey was low, we performed additional analyses including multivariate and nonresponse analyses to understand what conclusions could be drawn from the data and which variables might affect the results. For a detailed description of the analyses completed and their findings, see appendix III. We also interviewed agency officials at OSC, DOL, and OPM to gather supporting documentation including the survey instrument and other relevant information to facilitate our analyses of the customer satisfaction survey data. Furthermore, we reviewed relevant documents, such as interim survey reports and the interagency agreement between DOL and OPM for the survey administration, and the statement of work between DOL, OSC, and OPM for survey responsibilities.
We assessed the reliability of the customer satisfaction survey data by testing the data for missing entries and errors, and employing other logic testing. We reviewed OPM documentation and interviewed OPM, DOL, and OSC staff. In addition, OPM described and provided supporting documentation of the procedures it has in place to ensure data reliability and validity, including running checks on the data for completeness. Based on the collective results of our data reliability assessment, we consider data provided by OPM on the customer satisfaction survey to be sufficiently reliable for the purposes of evaluating relative performance of DOL and OSC during the demonstration project.
Agency Costs. To assess demonstration project costs, we reviewed and analyzed cost and accounting data from DOL and OSC, including supporting documentation such as the number of hours dedicated to demonstration project cases. While the cost accounting systems developed at each agency differ somewhat in the way they track time spent, both systems track actual salary, benefits, and indirect cost components by applying an hourly rate that includes those components for each specific employee who works on, and tracks time spent on, demonstration project cases. To determine the total cost, the agencies multiplied the hourly rate for all personnel who participated in the demonstration project by the total time spent working on USERRA demonstration project investigations. We also interviewed DOL and OSC staff responsible for collecting and reporting cost information.

Appendix I: Objectives, Scope, and Methodology
Page 44 GAO-15-77 Veterans’ Reemployment Rights
DOL provided cost and accounting data for the full demonstration project for the period August 9, 2011, to July 31, 2014. OSC provided complete and comparable cost data for the period August 12, 2012, to August 1, 2014, or about 24 months out of the 36-month demonstration project. OSC officials explained that they did not provide complete and comparable cost data prior to August 12, 2012, because the agency changed its process and methods for tracking and reporting data to be more consistent with the process and methods used by DOL. Prior to August 12, 2012, OSC tracked the costs of each case and reported costs of closed cases. After August 12, 2012, OSC began collecting and reporting costs for all demonstration project cases worked, including cases that were still open, and stopped tracking costs on a case-by-case basis. On September 4, 2014, OSC provided us with additional cost information for demonstration project cases that were investigated between May 2012 and August 12, 2012. This data was received about three weeks after the deadline we established for submitting cost and performance information. OSC also provided cost and accounting information for cases that were closed between August 2011 and May 2012. This data was incomplete because it excluded costs incurred for cases that remained open during this period. We did not include these data in our assessment of demonstration project costs because these data were incomplete, or not directly comparable to DOL costs. Thus, we determined we did not have sufficient time to verify the reliability of all of the data prior to our congressionally mandated reporting deadline.
We assessed the reliability of DOL’s and OSC’s USERRA cost accounting systems by testing the data for missing entries and errors, employing other logic testing, reviewing DOL and OSC documentation, and interviewing agency staff. Furthermore, we determined that agencies developed steps for ensuring the reliability of cost data, including developing USERRA operations manuals, providing instructions to staff entering the data, and describing the steps for reviewing the data after entered by staff.
Because OSC did not implement our recommendation to document procedures for compiling and reporting cost information, we also conducted a limited trace-to-file process to determine whether the agency’s reported monthly costs accurately reflected the time and cost reported by employees. Specifically, we identified a random sample of five individual time and cost lines from the master cost and accounting spreadsheet and compared the totals to the agency’s time and cost records for those months. During this assessment, we identified an error in the hourly rate of an employee used to determine demonstration

Appendix I: Objectives, Scope, and Methodology
Page 45 GAO-15-77 Veterans’ Reemployment Rights
project costs. OSC corrected this error and provided us with an updated time and cost spreadsheet. We then conducted a second trace-to-file sample of five randomly chosen individual time and cost lines and determined the data were sufficiently reliable for our purposes.
We also performed a data check on the DOL cost data. We used the annualized cost rates for a number of investigators to manually calculate their total demonstration project costs for, and compared our results to, DOL’s reported total costs for these investigators. Based on this check, we found the data to be sufficiently accurate. Based on the collective results of our data reliability assessment, we consider the DOL and OSC cost accounting data to be sufficiently reliable for the purposes of evaluating relative performance of DOL and OSC during the demonstration project.
Agency Capacity. To describe agencies’ capacity, we analyzed agency data on staff levels, grade levels, training, education, and caseload. We also reviewed agency documentation, and interviewed agency officials about factors impacting agency performance and capacity. To determine the average caseload of DOL investigators who worked on demonstration cases by fiscal year, we divided the number of demonstration cases opened per fiscal year by the number of investigators who worked on demonstration cases during that year. To determine DOL’s overall average caseload per fiscal year for the entire length of the demonstration project, we took the average caseloads for each fiscal year and used them to create a weighted average—weighing each fiscal year by the number of months the demonstration project was ongoing—because demonstration cases were not investigated for the entirety of fiscal years 2011 and 2014. We also calculated the average caseload of all active DOL investigators by 1) dividing the number of cases all active DOL investigators were assigned by the number of years they had been investigating cases to calculate the average caseload of all active investigators and then 2) dividing the sum of the individual investigators’ averages by the total number of active investigators to calculate the overall average caseload for all active DOL investigators.
To determine the average number of cases opened by OSC staff members investigating claims, we calculated the average number of cases opened per staff member for each period of time that had a stable amount of staff. Specifically, each time a new staff member was hired or a staff member left OSC, we created a new time period to better capture the number of cases opened per staff member. Finally, we used these nine averages to create a weighted average based on the number of

Appendix I: Objectives, Scope, and Methodology
Page 46 GAO-15-77 Veterans’ Reemployment Rights
months in the time period to calculate the average number of cases opened per staff member investigating claims at OSC. In addition, we reviewed agency documentation and testimonial evidence, as well as analyzed agency data, to describe DOL’s and OSC’s staffing levels, training programs on USERRA investigations and general investigation techniques, and the agencies’ views on their unique qualifications to investigate claims.
To identify actions agencies can take to improve service, we analyzed agency customer satisfaction data and compared results to customer service principles and guidance outlined in executive orders, Office of Management and Budget guidance, and the governmentwide performance plan at www.performance.gov. We also interviewed agency officials about their views on related procedures and practices that worked well or needed improvement.
We conducted this performance audit from April 2014 to November 2014 in accordance with generally accepted government auditing standards. These standards require that we plan and perform the audit to obtain sufficient, appropriate evidence to provide a reasonable basis for our findings and conclusions based on our audit objectives. We believe the evidence obtained provides a reasonable basis for our findings and conclusions based on our audit objectives.

Appendix II: USERRA Demonstration Project Customer Satisfaction Survey Administration and Instrument
Page 47 GAO-15-77 Veterans’ Reemployment Rights
The Veterans’ Benefits Act of 2010 includes customer satisfaction as one of five performance metrics to be used to assess the relative performance of the Department of Labor (DOL) and the Office of Special Counsel (OSC) during the Uniformed Services Employment and Reemployment Rights Act of 1994 (USERRA) demonstration project. In response to our previous recommendation, both agencies agreed on the method by which customer satisfaction data would be collected. Specifically, the agencies agreed to administer a customer satisfaction survey, and entered into an interagency agreement with the Office of Personnel Management (OPM) to collect survey data and provide regular reports to agencies with comparative performance information. Furthermore, with cooperation from agencies, OPM developed a survey plan and developed protocols for contacting respondents.1
The customer satisfaction survey was provided to all claimants whose cases were closed between the start of the demonstration project on August 9, 2012, and July 28, 2014. OPM established an end date for collection of survey data of July 28, 2014, for reporting purposes. The customer satisfaction survey was initially sent via an email link on April 19, 2012, 8 months after the start of the demonstration project, to all claimants whose cases had been closed since August 9, 2011. Since then, DOL and OSC have sent the survey on an ongoing basis after cases are closed.
When the survey began in April 2012, DOL and OSC emailed the claimants a link to the customer satisfaction survey, followed by a reminder emailed one week after case resolution. Two weeks following the initial notification, DOL and OSC sent a hard-copy reminder to claimants with the survey link. However, our interim report on the demonstration project found the response rate to the customer satisfaction survey was low for both agencies and recommended that DOL and OSC take actions to increase the response rate.2 In response, beginning on May 20, 2013, both agencies provided claimants with an initial notification that a survey would be provided to them upon
1GAO, Veterans’ Reemployment Rights: Steps Needed to Ensure Reliability of DOL and Special Counsel Demonstration Project’s Performance Information, GAO-11-312R (Washington, D.C.: June 10, 2011). 2GAO, Veterans’ Reemployment Rights: Department of Labor and Office of Special Counsel Need to Take Additional Steps to Ensure Demonstration Project Data Integrity, GAO-12-860R (Washington, D.C.: Sept. 10, 2012).
Appendix II: USERRA Demonstration Project Customer Satisfaction Survey Administration and Instrument

Appendix II: USERRA Demonstration Project Customer Satisfaction Survey Administration and Instrument
Page 48 GAO-15-77 Veterans’ Reemployment Rights
completion of their cases and requesting their participation in the survey. In addition, both agencies sent claimants two follow-up emails.
The survey allows respondents to report their satisfaction regarding several aspects of their experiences with DOL and OSC, as shown in figure 9. The survey included nine statements regarding claimants experience, and provided respondents the option to respond to statements by selecting “strongly disagree,” “disagree,” “neither agree nor disagree,” “agree,” “strongly agree,” or “no basis to judge.” The survey also included four categories for the respondents to express their level of satisfaction with the service provided by selecting “very dissatisfied,” “dissatisfied,” “neither,” “satisfied,” “very satisfied,” and “no basis to judge”; and one question for respondents to express their level of satisfaction with the complaint form used to file USERRA claims. The survey included two open-ended questions allowing respondents to describe what went well and what needed to change about their agency experience. In addition, the survey asked claimants to self report the outcome of their case and their military affiliation. Figure 9 shows the survey instrument OPM used to collect customer satisfaction data.
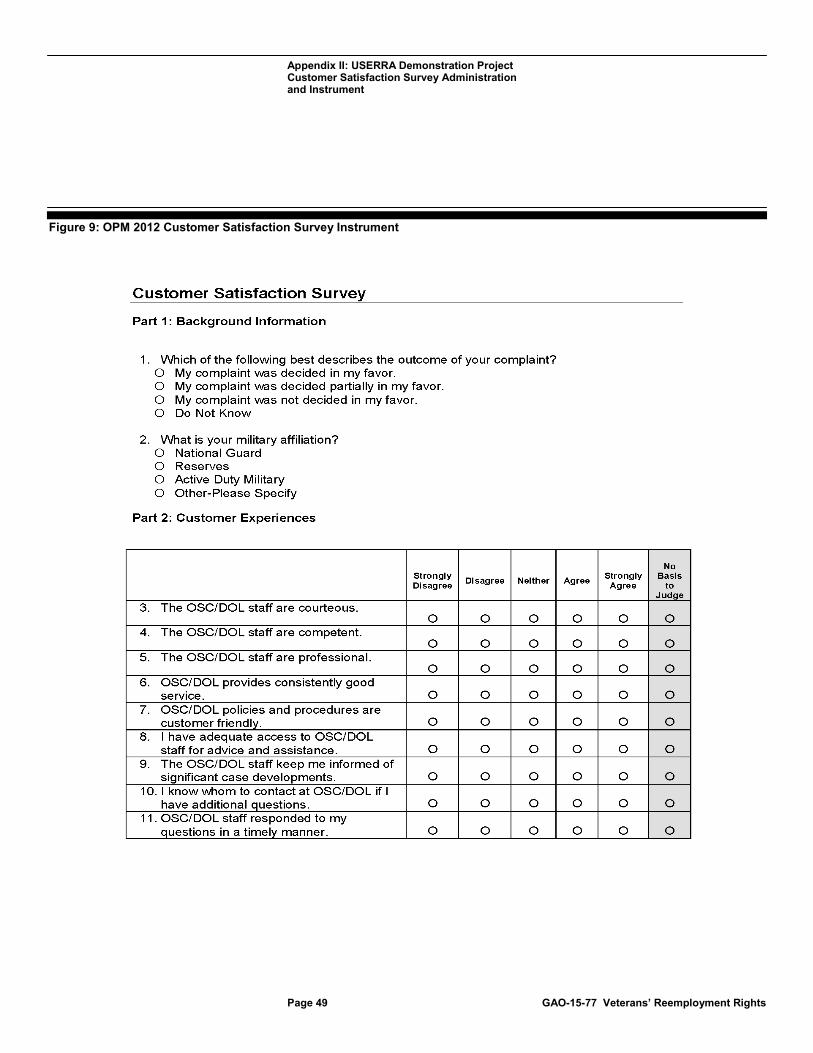
Appendix II: USERRA Demonstration Project Customer Satisfaction Survey Administration and Instrument
Page 49 GAO-15-77 Veterans’ Reemployment Rights
Figure 9: OPM 2012 Customer Satisfaction Survey Instrument

Appendix II: USERRA Demonstration Project Customer Satisfaction Survey Administration and Instrument
Page 50 GAO-15-77 Veterans’ Reemployment Rights
Appendix II: USERRA Demonstration Project Customer Satisfaction Survey Administration and Instrument
Page 51 GAO-15-77 Veterans’ Reemployment Rights
Source: OPM. | GAO-15-77

Appendix III: Nonresponse and Multivariate Analysis of Customer Satisfaction Data
Page 52 GAO-15-77 Veterans’ Reemployment Rights
In light of the low response rates to the customer satisfaction survey, we performed additional analyses including nonresponse and multivariate analyses to understand what conclusions could be drawn from the data and which variables might affect the results. We found pronounced differences in customer satisfaction between the two agencies as indicated by each of the 15 survey questions. In all but one of the questions, differences persist even after taking into account differences in the favorability of the outcomes of the claims, case processing times, and whether discrimination was alleged.
Nonresponse Analysis. Satisfaction with the Uniformed Services Employment and Reemployment Rights Act of 1994 (USERRA) claims process at the Department of Labor (DOL) and the Office of Special Counsel (OSC) is measured by responses from participants to 15 questions on an exit survey which is completed voluntarily and electronically after participants completed the process. Table 4 shows that the overall response rate to the survey was low (37.2 percent) and that the response rate was higher at OSC (41.6 percent) than at DOL (32.2 percent).
Table 4: Survey Response Rates at DOL and OSC
Response Status Agency Non-Responders Responders Total DOL 213 101 314 67.8% 32.2% 100.0% OSC 212 151 363 58.4% 41.6% 100.0% Total 425 252 677 62.8% 37.2% 100.0% L2
Source: GAO analysis of OPM customer satisfaction survey data I GAO-15-77
(Independence) = 6.44 with 1 df, P = .011
The low overall response rate and the significant difference in response rates across the two agencies are potentially troublesome inasmuch as responders and non-responders may differ with respect to their satisfaction with the investigation of their claims or differ on other characteristics that affect satisfaction. To the extent that such differences exist, estimates of the level of satisfaction in the two agencies and the differences in satisfaction between them may be biased. We do not know whether responders and non-responders differ with respect to their satisfaction with the investigation of their claims, since only the
Appendix III: Nonresponse and Multivariate Analysis of Customer Satisfaction Data
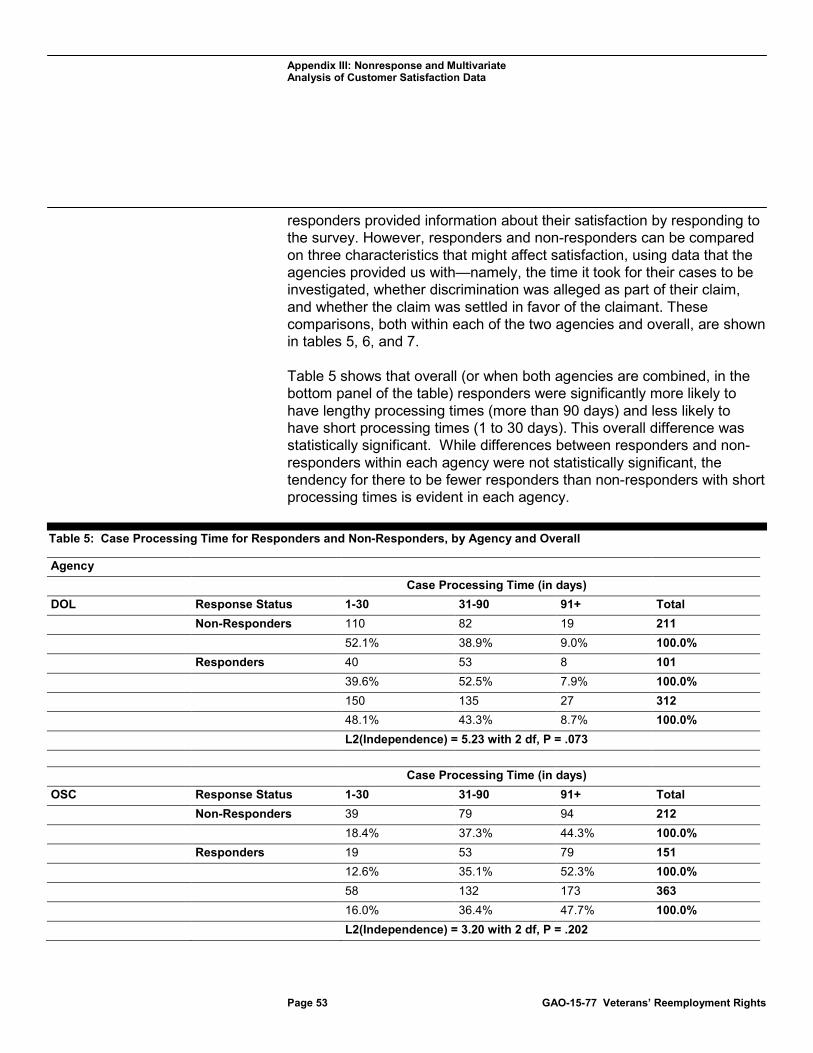
Appendix III: Nonresponse and Multivariate Analysis of Customer Satisfaction Data
Page 53 GAO-15-77 Veterans’ Reemployment Rights
responders provided information about their satisfaction by responding to the survey. However, responders and non-responders can be compared on three characteristics that might affect satisfaction, using data that the agencies provided us with—namely, the time it took for their cases to be investigated, whether discrimination was alleged as part of their claim, and whether the claim was settled in favor of the claimant. These comparisons, both within each of the two agencies and overall, are shown in tables 5, 6, and 7.
Table 5 shows that overall (or when both agencies are combined, in the bottom panel of the table) responders were significantly more likely to have lengthy processing times (more than 90 days) and less likely to have short processing times (1 to 30 days). This overall difference was statistically significant. While differences between responders and non-responders within each agency were not statistically significant, the tendency for there to be fewer responders than non-responders with short processing times is evident in each agency.
Table 5: Case Processing Time for Responders and Non-Responders, by Agency and Overall
Agency Case Processing Time (in days) DOL Response Status 1-30 31-90 91+ Total Non-Responders 110 82 19 211 52.1% 38.9% 9.0% 100.0% Responders 40 53 8 101 39.6% 52.5% 7.9% 100.0% 150 135 27 312 48.1% 43.3% 8.7% 100.0% L2(Independence) = 5.23 with 2 df, P = .073 Case Processing Time (in days) OSC Response Status 1-30 31-90 91+ Total Non-Responders 39 79 94 212 18.4% 37.3% 44.3% 100.0% Responders 19 53 79 151 12.6% 35.1% 52.3% 100.0% 58 132 173 363 16.0% 36.4% 47.7% 100.0% L2(Independence) = 3.20 with 2 df, P = .202

Appendix III: Nonresponse and Multivariate Analysis of Customer Satisfaction Data
Page 54 GAO-15-77 Veterans’ Reemployment Rights
Case Processing Time (in days) Overall Response Status 1-30 31-90 91+ Total Non-Responders 149 161 113 423 35.2% 38.1% 26.7% 100.0% Responders 59 106 87 252 23.4% 42.1% 34.5% 100.0% 208 267 200 675 30.8% 39.6% 29.6% 100.0% L2(Independence) = 11.26 with 2 df, P = .004
Source: GAO analysis of OPM customer satisfaction survey data | GAO-15-77
Table 6 shows that discrimination allegations overall and within each agency did not, strictly speaking, differ significantly between responders and non-responders. But, differences approached significance in each agency (.05 < p < .10) and showed that fewer responders than non-responders had alleged discrimination as part of their claim.
Table 6: Discrimination Allegations for Responders and Non-Responders, by Agency and Overall
Agency
Discrimination Alleged
DOL Response Status No Yes Total Non-Responders 90 121 211 42.7% 57.3% 100.0% Responders 54 47 101 53.5% 46.5% 100.0% Total 144 168 312 46.2% 53.8% 100.0% L2(Independence) = 3.21 with 1 df, P = .073 Discrimination Alleged OSC Response Status No Yes Total Non-Responders 29 183 212 13.7% 86.3% 100.0% Responders 32 119 151 21.2% 78.8% 100.0% Total 61 302 363

Appendix III: Nonresponse and Multivariate Analysis of Customer Satisfaction Data
Page 55 GAO-15-77 Veterans’ Reemployment Rights
16.8% 83.2% 100.0% L2(Independence) = 3.51 with 1 df, P = .061 Overall Discrimination Alleged Response Status No Yes Total Non-Responders 119 304 423 28.1% 71.9% 100.0% Responders 86 166 252 34.1% 65.9% 100.0% Total 205 470 675 30.4% 69.6% 100.0% L2(Independence) = 2.66 with 1 df, P = .103
Source: GAO analysis of OPM customer satisfaction survey data | GAO-15-77
Table 7 shows that overall, and for each survey question, agency responders were significantly more likely than non-responders to have their claims decided in their favor. Because of the very sizable differences here and somewhat smaller differences between responders and non-responders in processing time and discrimination allegations in the analyses of the differences in satisfaction, we used multivariate models to adjust the agency differences for case processing time, whether discrimination was alleged, and whether the outcome was favorable. In those analyses however, we used a survey measure derived from the respondents, rather than the indicator provided by the agency, to indicate whether their claim was decided upon favorably. While the two different indicators are very strongly associated (see table 8) the association is not perfect. We believed it would be more informative to adjust for what respondents thought was the outcome of their claim at the time of the survey rather than what the agency told us was ultimately the outcome.
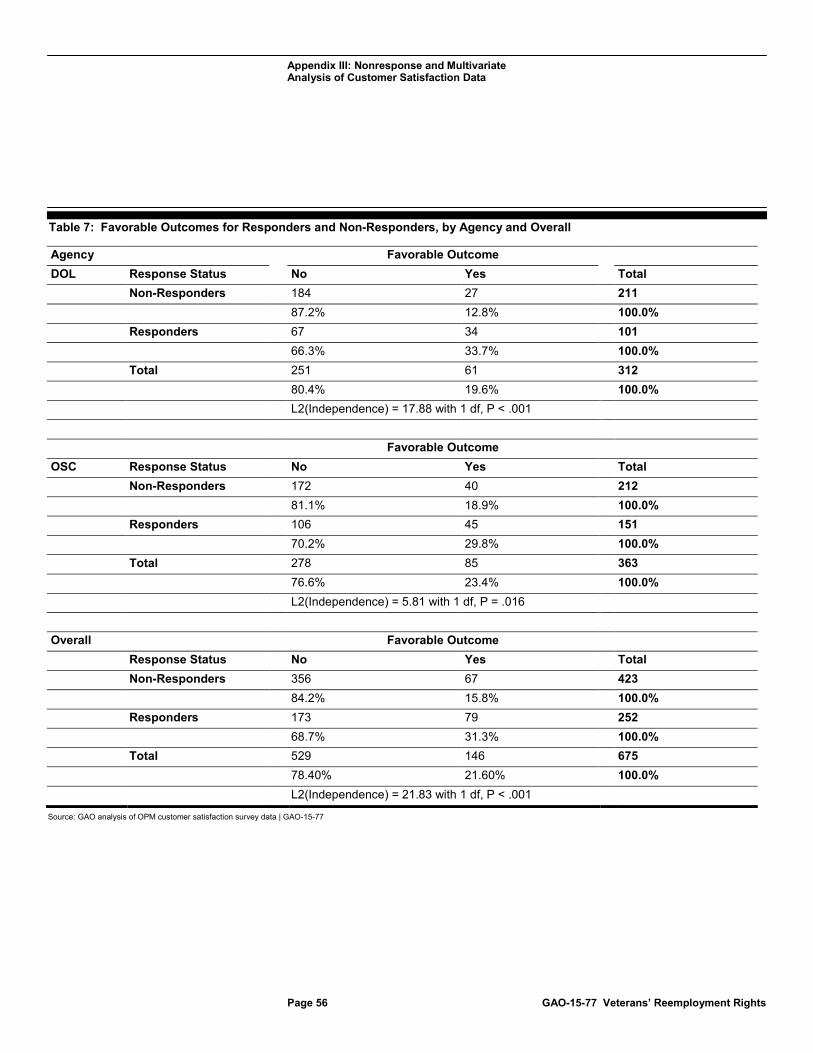
Appendix III: Nonresponse and Multivariate Analysis of Customer Satisfaction Data
Page 56 GAO-15-77 Veterans’ Reemployment Rights
Table 7: Favorable Outcomes for Responders and Non-Responders, by Agency and Overall
Agency Favorable Outcome DOL Response Status No Yes Total Non-Responders 184 27 211 87.2% 12.8% 100.0% Responders 67 34 101 66.3% 33.7% 100.0% Total 251 61 312 80.4% 19.6% 100.0% L2(Independence) = 17.88 with 1 df, P < .001 Favorable Outcome OSC Response Status No Yes Total Non-Responders 172 40 212 81.1% 18.9% 100.0% Responders 106 45 151 70.2% 29.8% 100.0% Total 278 85 363 76.6% 23.4% 100.0% L2(Independence) = 5.81 with 1 df, P = .016 Overall Favorable Outcome Response Status No Yes Total Non-Responders 356 67 423 84.2% 15.8% 100.0% Responders 173 79 252 68.7% 31.3% 100.0% Total 529 146 675 78.40% 21.60% 100.0% L2(Independence) = 21.83 with 1 df, P < .001
Source: GAO analysis of OPM customer satisfaction survey data | GAO-15-77

Appendix III: Nonresponse and Multivariate Analysis of Customer Satisfaction Data
Page 57 GAO-15-77 Veterans’ Reemployment Rights
Table 8. Agency Reported Outcome by Respondent Perception of the Outcome
Respondent Perception of the Outcome
Agency Reported Outcome Total Not Favorable Favorable
Favorable 14 61 75 18.7% 81.3% 100.0%
Don’t Know 46 10 56 82.1% 17.9% 100.0%
Not Favorable 107 6 113 94.7% 5.3% 100.0%
Total 167 77 244 68.4% 31.6% 100.0%
Source: GAO analysis of OPM customer satisfaction survey data | GAO-15-77
Multivariate Analysis. To discern whether there are differences in participants’ satisfaction between the two agencies and whether they persist after taking account of case processing times, whether discrimination was alleged, and whether the outcome of the claim was favorable, we undertook two different analyses. In the first set of analyses we treated responses as if they were interval-ratio measures, scored them from 1 (“strongly disagree” or “very “dissatisfied”) to 5 (“strongly agree” or “very “satisfied”), and averaged the scores across all respondents in each agency for each of the 15 items separately. We then calculated the differences between the two agencies in these average scores across each of the items, and tested the significance of those differences using t-tests (when we estimated raw or unadjusted differences) and F-statistics (when we estimated differences after adjusting, or effectively holding constant, the three aforementioned confounds).1
In the second set of analyses we treated responses as categorical, and because of the small sample size and our desire to look at agency differences before and after adjustment, we collapsed response categories to contrast unfavorable responses (reflecting disagreement or dissatisfaction) with favorable responses (reflecting agreement or
1The adjusted estimates of agency differences and the F-statistics associated with them are from ordinary least-squares (OLS) regression models that regressed the scores on each item for all respondents on agency, and on (one at a time) case processing time, discrimination allegation, and favorability of the outcome.
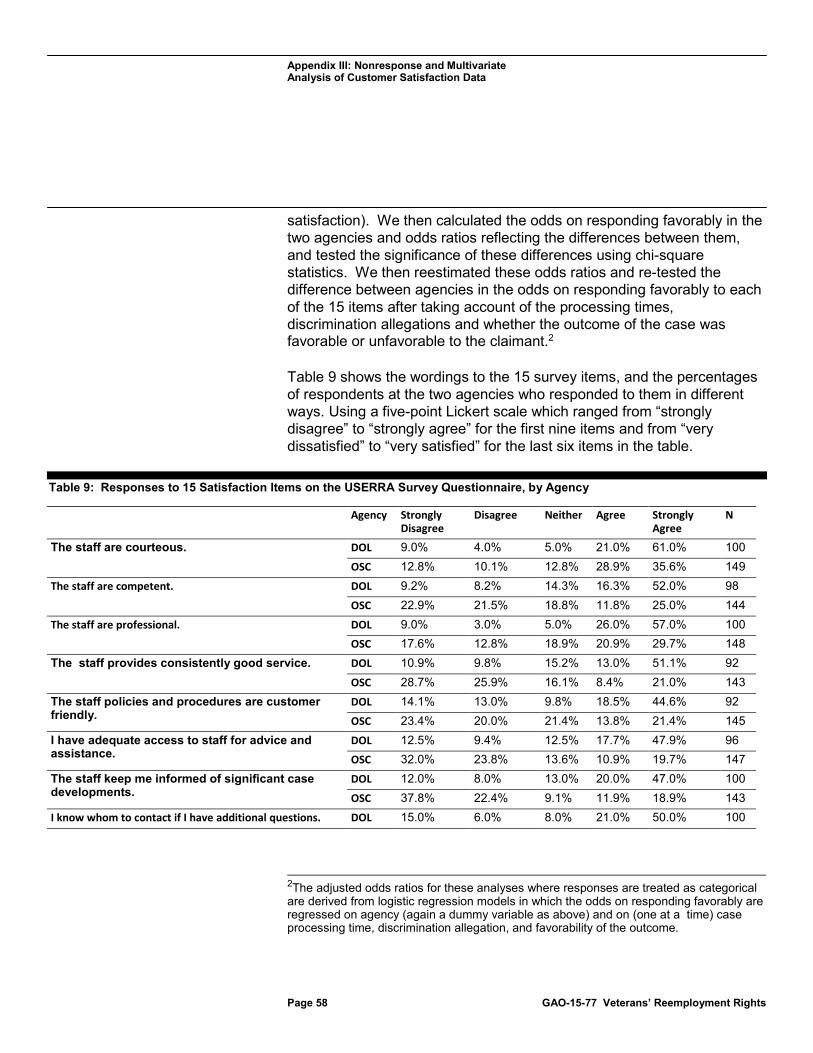
Appendix III: Nonresponse and Multivariate Analysis of Customer Satisfaction Data
Page 58 GAO-15-77 Veterans’ Reemployment Rights
satisfaction). We then calculated the odds on responding favorably in the two agencies and odds ratios reflecting the differences between them, and tested the significance of these differences using chi-square statistics. We then reestimated these odds ratios and re-tested the difference between agencies in the odds on responding favorably to each of the 15 items after taking account of the processing times, discrimination allegations and whether the outcome of the case was favorable or unfavorable to the claimant.2
Table 9 shows the wordings to the 15 survey items, and the percentages of respondents at the two agencies who responded to them in different ways. Using a five-point Lickert scale which ranged from “strongly disagree” to “strongly agree” for the first nine items and from “very dissatisfied” to “very satisfied” for the last six items in the table.
Table 9: Responses to 15 Satisfaction Items on the USERRA Survey Questionnaire, by Agency
Agency Strongly Disagree
Disagree Neither Agree Strongly Agree
N
The staff are courteous. DOL 9.0% 4.0% 5.0% 21.0% 61.0% 100 OSC 12.8% 10.1% 12.8% 28.9% 35.6% 149
The staff are competent. DOL 9.2% 8.2% 14.3% 16.3% 52.0% 98 OSC 22.9% 21.5% 18.8% 11.8% 25.0% 144
The staff are professional. DOL 9.0% 3.0% 5.0% 26.0% 57.0% 100 OSC 17.6% 12.8% 18.9% 20.9% 29.7% 148
The staff provides consistently good service. DOL 10.9% 9.8% 15.2% 13.0% 51.1% 92 OSC 28.7% 25.9% 16.1% 8.4% 21.0% 143
The staff policies and procedures are customer friendly.
DOL 14.1% 13.0% 9.8% 18.5% 44.6% 92 OSC 23.4% 20.0% 21.4% 13.8% 21.4% 145
I have adequate access to staff for advice and assistance.
DOL 12.5% 9.4% 12.5% 17.7% 47.9% 96 OSC 32.0% 23.8% 13.6% 10.9% 19.7% 147
The staff keep me informed of significant case developments.
DOL 12.0% 8.0% 13.0% 20.0% 47.0% 100 OSC 37.8% 22.4% 9.1% 11.9% 18.9% 143
I know whom to contact if I have additional questions. DOL 15.0% 6.0% 8.0% 21.0% 50.0% 100
2The adjusted odds ratios for these analyses where responses are treated as categorical are derived from logistic regression models in which the odds on responding favorably are regressed on agency (again a dummy variable as above) and on (one at a time) case processing time, discrimination allegation, and favorability of the outcome.

Appendix III: Nonresponse and Multivariate Analysis of Customer Satisfaction Data
Page 59 GAO-15-77 Veterans’ Reemployment Rights
OSC 26.8% 19.5% 10.7% 21.5% 21.5% 149 The staff responded to my questions in a timely manner. DOL 11.0% 4.0% 9.0% 16.0% 60.0% 100
OSC 35.1% 20.3% 12.2% 13.5% 18.9% 148 Agency Very
Dissatisfied Dissatisfied Neither Satisfied Very
Satisfied N
Satisfaction with thoroughness of investigation. DOL 22.8% 10.9% 12.0% 12.0% 42.4% 92 OSC 54.7% 15.8% 5.8% 7.9% 15.8% 139
Satisfaction with clarity of written communication DOL 11.3% 6.2% 13.4% 19.6% 49.5% 97 OSC 29.0% 15.2% 16.6% 18.6% 20.7% 145
Satisfaction with clarity of verbal communication DOL 11.3% 4.1% 15.5% 19.6% 49.5% 97 OSC 31.7% 12.7% 15.5% 17.6% 22.5% 142
Satisfaction with customer service DOL 14.0% 7.0% 13.0% 27.0% 39.0% 100 OSC 43.7% 9.9% 12.6% 19.9% 13.9% 151
Satisfaction with investigation of complaint DOL 23.8% 9.9% 10.9% 18.8% 36.6% 101 OSC 55.6% 13.9% 5.3% 11.9% 13.2% 151
Satisfaction with results of investigation DOL 30.7% 11.9% 14.9% 18.8% 23.8% 101 OSC 56.7% 8.7% 9.3% 12.7% 12.7% 150
Source: GAO analysis of OPM customer satisfaction survey data | GAO-15-77
The results of the first set of analyses are shown in table 10. The first column of numbers (N) shown in the table indicates the numbers of respondents to each item in the two agencies. The second column of numbers shows the average or mean response to each item.

Appendix III: Nonresponse and Multivariate Analysis of Customer Satisfaction Data
Page 60 GAO-15-77 Veterans’ Reemployment Rights
Table 10: Odds and Odds Ratios Indicating Differences in Satisfaction at DOL and OSC before and after Adjusting for Whether the Outcome Was Favorable, Case Processing Time, and Whether Discrimination Was Alleged
Differences, Adjusted for
a
Agency N Mean Difference
(Unadjusted) OF CPT DA The staff are courteous.
DOL 100 4.21 0.57 0.46 0.58 0.46 OSC 149 3.64
The staff are competent. DOL 98 3.94 0.99 0.84 0.95 0.90 OSC 144 2.94
The staff are professional. DOL 100 4.19 0.87 0.76 0.89 0.76 OSC 148 3.32
The staff provides consistently good service.
DOL 92 3.84 1.17 1.02 1.00 1.03 OSC 143 2.67
The staff policies and procedures are customer friendly.
DOL 92 3.66 0.77 0.61 0.81 0.68 OSC 145 2.90
I have adequate access to staff for advice and assistance.
DOL 96 3.79 1.17 1.01 1.04 1.09 OSC 147 2.63
The staff keep me informed of significant case developments.
DOL 100 3.82 1.30 1.16 1.22 1.25 OSC 143 2.52
I know whom to contact if I have additional questions.
DOL 100 3.85 0.94 0.82 0.81 0.88 OSC 149 2.91
The staff responded to my questions in a timely manner.
DOL 100 4.10 1.49 1.36 1.25 1.48 OSC 148 2.61
Satisfaction with thoroughness of investigation.
DOL 92 3.40 1.26 0.95 1.14 1.17 OSC 139 2.14
Satisfaction with clarity of written communication
DOL 97 3.90 1.03 0.83 0.97 0.95 OSC 145 2.87
Satisfaction with clarity of verbal communication
DOL 97 3.92 1.05 0.87 0.92 0.94 OSC 142 2.87
Satisfaction with customer service DOL 100 3.70 1.20 1.04 1.02 1.12 OSC 151 2.50
Satisfaction with investigation of complaint
DOL 101 3.35 1.21 1.00 1.06 1.16 OSC 151 2.13
Satisfaction with results of investigation
DOL 101 2.93 0.77 0.52 0.71 0.74 OSC 150 2.16
Source: GAO analysis of OPM customer satisfaction survey data | GAO-15-77 aOF = Whether the Outcome Was Favorable; CPT = Case Processing Time; DA = Whether Discrimination Was Alleged; Shading indicates differences that are statistically significant (P < .05).

Appendix III: Nonresponse and Multivariate Analysis of Customer Satisfaction Data
Page 61 GAO-15-77 Veterans’ Reemployment Rights
The average responses at DOL on all items except the last (satisfaction with the results of the investigation) tended to be favorable, with mean scores above 3.0. This score indicates that respondents neither agreed nor disagreed, or were neither satisfied nor dissatisfied. At OSC, this was true only for only a couple of the 15 items (the staff were courteous and the staff were professional). Moreover, average scores for every one of the 15 items were significantly higher at DOL than at OSC. The differences (shown in the third column of numbers in the table) ranged from roughly half a point to more than a full point.3
The estimates from our multivariate regression models show that these differences remain sizable and significant even after we take into account (1) whether the outcomes of the different claims in the two agencies were decided favorably or unfavorably, (2) the case processing times, and (3) whether discrimination was alleged. So while the average responses on all items were decidedly higher (reflecting greater satisfaction) when cases were decided in the claimant’s favor than when claims were not settled in the claimant’s favor (these analyses are not shown, but are available on request), the differences in satisfaction between agencies were only slightly attenuated when the outcome of the claim was taken into account (or held constant).4 The same was true when the other two factors (case processing times and discrimination allegations) were statistically controlled.
The results of the second set of analyses are shown in table 11. In these analyses, the 15 satisfaction items are treated categorically. The table shows (in the first two columns of numbers) the numbers of respondents in each agency who responded unfavorably (by not agreeing or not expressing satisfaction) and favorably (by agreeing or expressing satisfaction) to each item.5 While it is common to make comparisons across groups (in our case the two agencies) by converting the numbers
3Shading in the table indicates differences which are statistically significant at the .05 level. 4For example, the unadjusted difference between agencies in the mean score on the “staff are courteous” item was 0.57, while the adjusted differences (or differences after taking the outcome of the claim into account) was 0.46. Many of the differences were slightly smaller after adjusting for these different factors, but every one of them remained statistically significant. 5Respondents in the “Not Agree” and “Not Satisfied” categories include both those who disagreed or were dissatisfied and those who were in the “Neither” category.

Appendix III: Nonresponse and Multivariate Analysis of Customer Satisfaction Data
Page 62 GAO-15-77 Veterans’ Reemployment Rights
to percentages and looking at differences in those percentages, we chose instead to calculate odds and to look at their ratios.
Odds are estimated by calculating, for each item in each agency, the number of favorable responses relative to the number of unfavorable responses. For example, with respect to the “staff are courteous” item, the odds on agreeing at DOL were 82/18 = 4.56, while the odds on responding favorably at OSC were 96/53 = 1.81. While less common than percentages or probabilities, these odds have an equally straightforward interpretation. They imply that at DOL there were more than four respondents who agreed the staff were courteous for every one that felt otherwise, while at OSC there were slightly less than two respondents who agreed the staff were courteous for every one that felt otherwise. The ratio of these two odds (in the “odds ratio” column of the table), which for this item is 4.56/1.81 = 2.52, indicates that the odds on agreeing that staff are courteous were more than twice as high at DOL as at OSC.
As can be seen by looking down the “odds ratio” column, the odds on responding favorably are higher at DOL than at OSC for every one of the items, in all cases by at least a factor of two and in some cases by factors of 4 or 6. These sizable differences are in all cases statistically significant and mirror the findings from the first set of analyses. Additionally, and as we also saw in the first analyses, the large differences reflected by these ratios do not go away when we control for differences across agencies in whether claims were settled favorably, in processing times, and whether discrimination was alleged. Under the “Odds Ratio, Adjusted for” heading, the agency ratios are the same odds ratio we see in the column to the left of it. But here, it has been adjusted by taking account of the differences across agencies in whether claims were decided favorably, in case processing times, and in whether discrimination was alleged.6 So even (for example) when we control for or take account of the fact that respondents whose claims were decided favorably were more likely to agree that “staff are courteous,” and even after we allow for whatever differences there are in favorable and unfavorable claims across the two agencies, we find that respondents at DOL were twice as likely as those at OSC to give favorable responses to the item involving “staff are
6Because of the small size of the sample, we controlled for these three different factors one at a time, in different logistic regression models.

Appendix III: Nonresponse and Multivariate Analysis of Customer Satisfaction Data
Page 63 GAO-15-77 Veterans’ Reemployment Rights
courteous.” And, similarly, DOL respondents were more likely to give favorable responses than OSC respondents to every other item, by factors ranging from roughly 2 to more than 6. The only item on which respondents did not differ after adjustment was the final item in the table, pertaining to satisfaction with the results of the investigation. For that item the difference between agencies in respondents expressing satisfaction (odds ratio = 1.84) was not significant after controlling for whether the investigation yielded an outcome that was favorable or unfavorable to the claimant.
In sum, there are very big differences in satisfaction between the two agencies indicated by every one of the 15 items. All but one of the differences persists even after we take account of differences in the two agencies in the favorability of the outcomes of the claims, case processing times, and whether discrimination was alleged. The percentages of satisfied claimants in both agencies may be somewhat biased by the low response rates to the survey. But, our analyses suggest that the differences between agencies, and the lower overall satisfaction among claimants at OSC, do not appear to be accounted for by differences in the outcomes of the claims, or the case processing times, or allegations of discrimination.

Appendix III: Nonresponse and Multivariate Analysis of Customer Satisfaction Data
Page 64 GAO-15-77 Veterans’ Reemployment Rights
Table 11: Odds and Odds Ratios Indicating Differences in Satisfaction at DOL and OSC Before and After Adjusting for Whether the Outcome Was Favorable, Case Processing Time, and Whether Discrimination Was Alleged
Odds Ratio, Adjusted for
Not Agree
a
Agree Total
Odds Odds Ratio OF CPT DA The staff are courteous. DOL 18 82 100 4.56 2.52 2.19 2.60 2.29
OSC 53 96 149 1.81 The staff are competent. DOL 31 67 98 2.16 3.71 3.56 3.95 3.25
OSC 91 53 144 0.58 The staff are professional. DOL 17 83 100 4.88 4.75 4.61 4.89 4.05
OSC 73 75 148 1.03 The staff provides consistently good service.
DOL 33 59 92 1.79 4.30 4.00 3.48 3.67 OSC 101 42 143 0.42
The staff policies and procedures are customer friendly.
DOL 34 58 92 1.71 3.14 2.72 2.99 2.62 OSC 94 51 145 0.54
I have adequate access to staff for advice and assistance.
DOL 33 63 96 1.91 4.33 4.20 3.95 3.84 OSC 102 45 147 0.44
The staff keep me informed of significant case developments.
DOL 33 67 100 2.03 4.57 4.45 4.30 4.28 OSC 99 44 143 0.44
I know whom to contact if I have additional questions.
DOL 29 71 100 2.45 3.25 3.06 2.88 2.82 OSC 85 64 149 0.75
The staff responded to my questions in a timely manner.
DOL 24 76 100 3.17 6.60 6.77 5.24 6.53 OSC 100 48 148 0.48
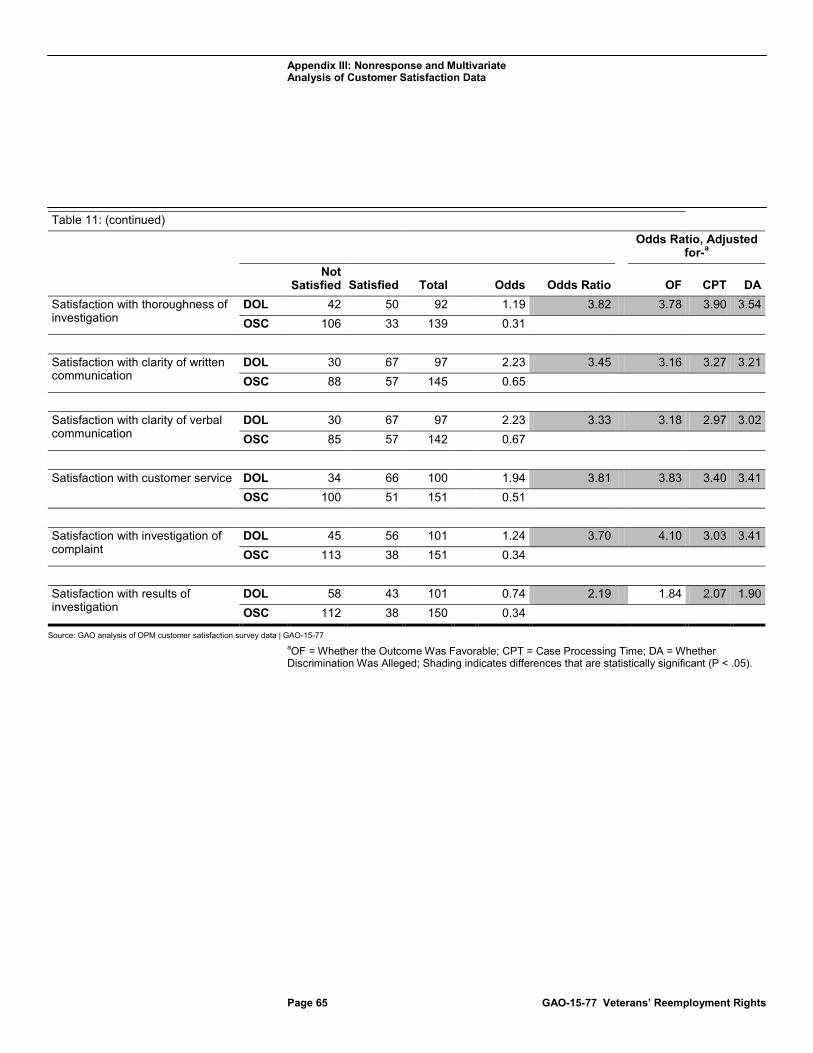
Appendix III: Nonresponse and Multivariate Analysis of Customer Satisfaction Data
Page 65 GAO-15-77 Veterans’ Reemployment Rights
Table 11: (continued)
Odds Ratio, Adjusted for-
a Not
Satisfied Satisfied Total
Odds Odds Ratio OF CPT DA Satisfaction with thoroughness of investigation
DOL 42 50 92 1.19 3.82 3.78 3.90 3.54 OSC 106 33 139 0.31
Satisfaction with clarity of written communication
DOL 30 67 97 2.23 3.45 3.16 3.27 3.21 OSC 88 57 145 0.65
Satisfaction with clarity of verbal communication
DOL 30 67 97 2.23 3.33 3.18 2.97 3.02 OSC 85 57 142 0.67
Satisfaction with customer service DOL 34 66 100 1.94 3.81 3.83 3.40 3.41
OSC 100 51 151 0.51 Satisfaction with investigation of complaint
DOL 45 56 101 1.24 3.70 4.10 3.03 3.41 OSC 113 38 151 0.34
Satisfaction with results of investigation
DOL 58 43 101 0.74 2.19 1.84 2.07 1.90 OSC 112 38 150 0.34
Source: GAO analysis of OPM customer satisfaction survey data | GAO-15-77 a
OF = Whether the Outcome Was Favorable; CPT = Case Processing Time; DA = Whether Discrimination Was Alleged; Shading indicates differences that are statistically significant (P < .05).

Appendix IV: Comments from the Department of Labor
Page 66 GAO-15-77 Veterans’ Reemployment Rights
Appendix IV: Comments from the Department of Labor

Appendix IV: Comments from the Department of Labor
Page 67 GAO-15-77 Veterans’ Reemployment Rights
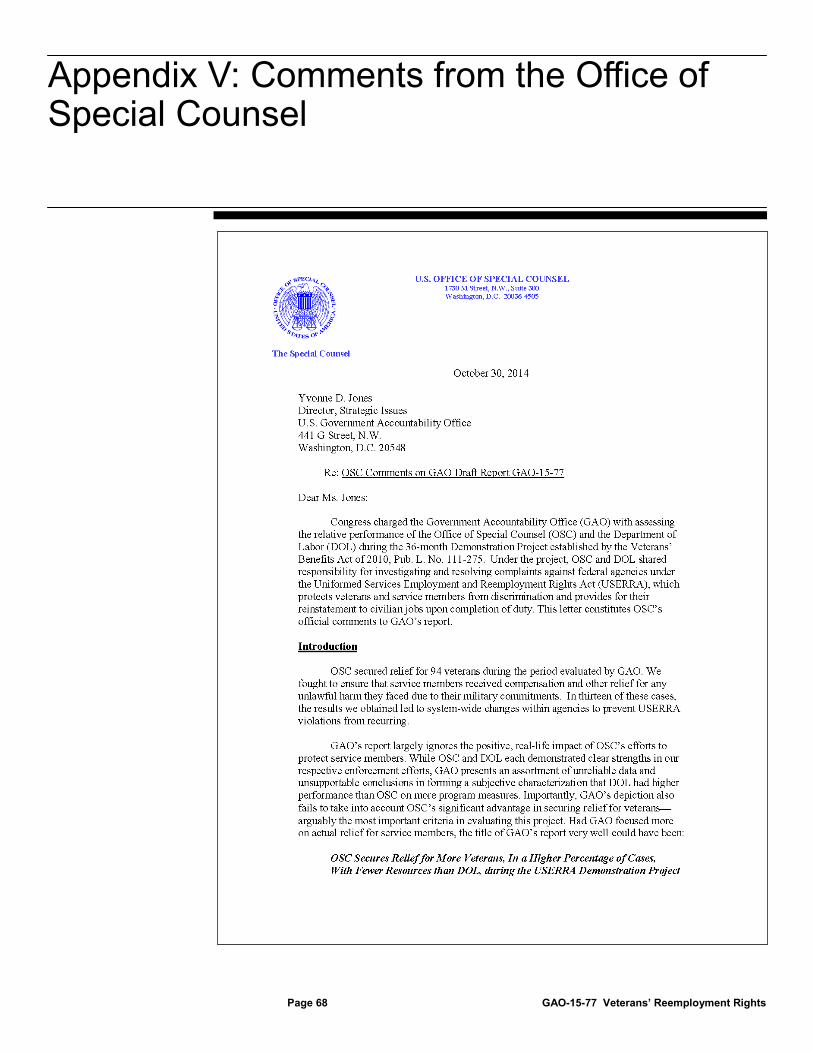
Appendix V: Comments from the Office of Special Counsel
Page 68 GAO-15-77 Veterans’ Reemployment Rights
Appendix V: Comments from the Office of Special Counsel
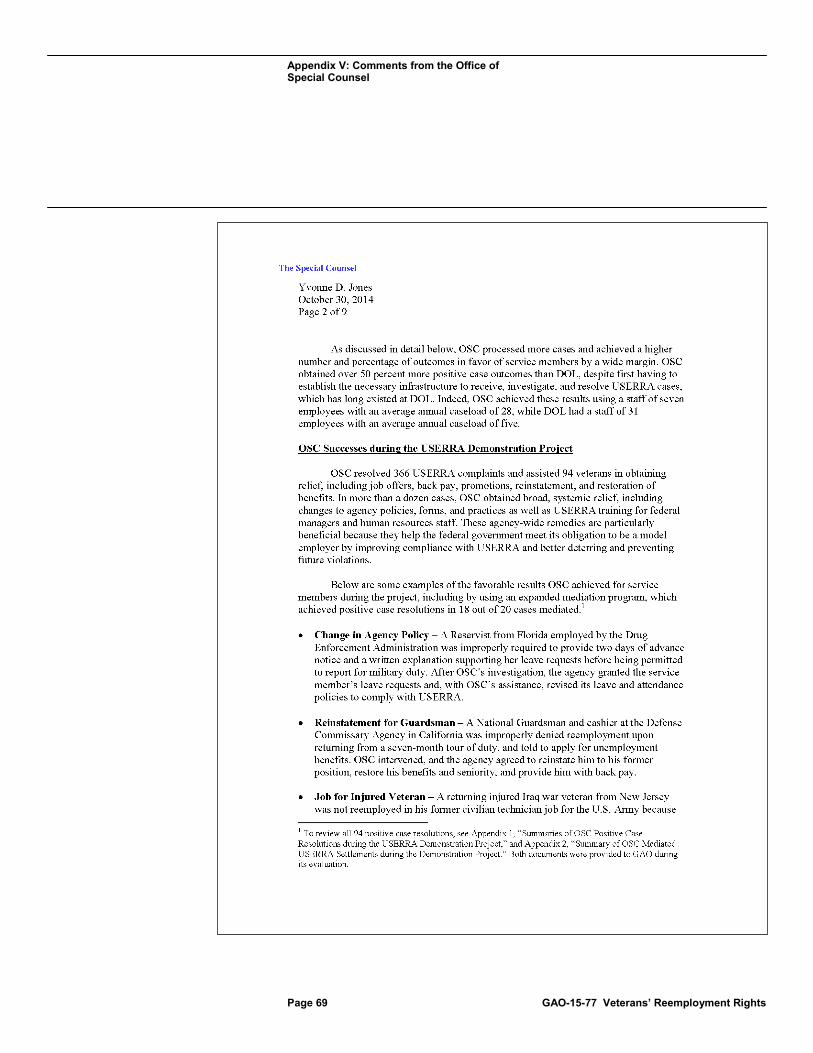
Appendix V: Comments from the Office of Special Counsel
Page 69 GAO-15-77 Veterans’ Reemployment Rights

Appendix V: Comments from the Office of Special Counsel
Page 70 GAO-15-77 Veterans’ Reemployment Rights

Appendix V: Comments from the Office of Special Counsel
Page 71 GAO-15-77 Veterans’ Reemployment Rights

Appendix V: Comments from the Office of Special Counsel
Page 72 GAO-15-77 Veterans’ Reemployment Rights

Appendix V: Comments from the Office of Special Counsel
Page 73 GAO-15-77 Veterans’ Reemployment Rights

Appendix V: Comments from the Office of Special Counsel
Page 74 GAO-15-77 Veterans’ Reemployment Rights

Appendix V: Comments from the Office of Special Counsel
Page 75 GAO-15-77 Veterans’ Reemployment Rights
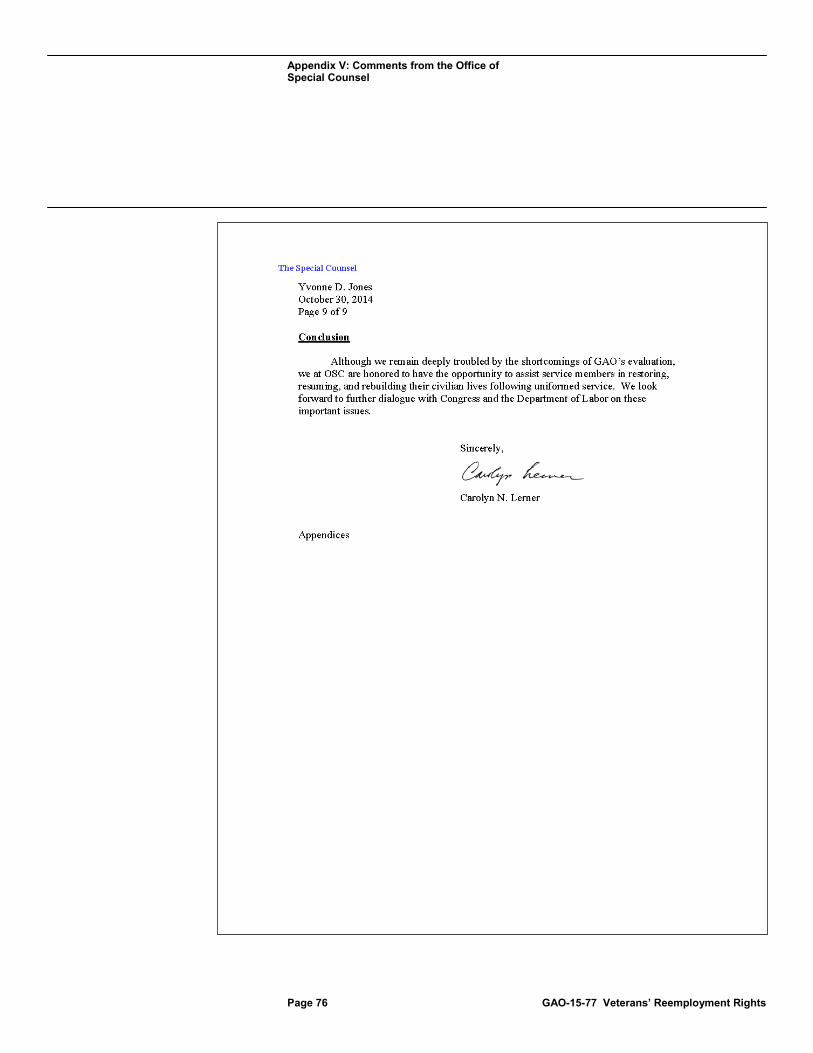
Appendix V: Comments from the Office of Special Counsel
Page 76 GAO-15-77 Veterans’ Reemployment Rights
Appendix V: Comments from the Office of Special Counsel
Page 77 GAO-15-77 Veterans’ Reemployment Rights

Appendix V: Comments from the Office of Special Counsel
Page 78 GAO-15-77 Veterans’ Reemployment Rights
Appendix V: Comments from the Office of Special Counsel
Page 79 GAO-15-77 Veterans’ Reemployment Rights

Appendix V: Comments from the Office of Special Counsel
Page 80 GAO-15-77 Veterans’ Reemployment Rights

Appendix V: Comments from the Office of Special Counsel
Page 81 GAO-15-77 Veterans’ Reemployment Rights

Appendix V: Comments from the Office of Special Counsel
Page 82 GAO-15-77 Veterans’ Reemployment Rights

Appendix V: Comments from the Office of Special Counsel
Page 83 GAO-15-77 Veterans’ Reemployment Rights

Appendix V: Comments from the Office of Special Counsel
Page 84 GAO-15-77 Veterans’ Reemployment Rights
Appendix V: Comments from the Office of Special Counsel
Page 85 GAO-15-77 Veterans’ Reemployment Rights

Appendix V: Comments from the Office of Special Counsel
Page 86 GAO-15-77 Veterans’ Reemployment Rights

Appendix V: Comments from the Office of Special Counsel
Page 87 GAO-15-77 Veterans’ Reemployment Rights

Appendix V: Comments from the Office of Special Counsel
Page 88 GAO-15-77 Veterans’ Reemployment Rights
Appendix V: Comments from the Office of Special Counsel
Page 89 GAO-15-77 Veterans’ Reemployment Rights

Appendix V: Comments from the Office of Special Counsel
Page 90 GAO-15-77 Veterans’ Reemployment Rights

Appendix V: Comments from the Office of Special Counsel
Page 91 GAO-15-77 Veterans’ Reemployment Rights

Appendix V: Comments from the Office of Special Counsel
Page 92 GAO-15-77 Veterans’ Reemployment Rights

Appendix V: Comments from the Office of Special Counsel
Page 93 GAO-15-77 Veterans’ Reemployment Rights

Appendix V: Comments from the Office of Special Counsel
Page 94 GAO-15-77 Veterans’ Reemployment Rights

Appendix V: Comments from the Office of Special Counsel
Page 95 GAO-15-77 Veterans’ Reemployment Rights
Appendix VI: GAO Contact and Staff Acknowledgments
Page 96 GAO-15-77 Veterans’ Reemployment Rights
Yvonne D. Jones at (202) 512-2717 or at [email protected]
In addition to the contact named above, Signora May (Assistant Director); Peter Beck (Analyst in Charge), Dawn Bidne, Karin Fangman, Paul Kinney, Donna Miller, Cynthia Saunders, Douglas Sloane, and Lou V. B. Smith made key contributions to this report.
Appendix VI: GAO Contact and Staff Acknowledgments
GAO Contact
Staff Acknowledgments

Related GAO Products
Page 97 GAO-15-77 Veterans’ Reemployment Rights
Transitioning Veterans: Improved Oversight Needed to Enhance Implementation of Transition Assistance Program. GAO-14-144. Washington, D.C.: March 5, 2014.
Veterans’ Reemployment Rights: Department of Labor and Office of Special Counsel Need to Take Additional Steps to Ensure Demonstration Project Data Integrity. GAO-12-860R. Washington, D.C.: Sept. 10, 2012.
Veterans’ Reemployment Rights: Steps Needed to Ensure Reliability of DOL and Special Counsel Demonstration Project’s Performance Information. GAO-11-312R. Washington, D.C.: June 10, 2011.
Military Personnel: Considerations Related to Extending Demonstration Project on Servicemembers’ Employment Rights Claims. GAO-08-229T. Washington, D.C.: October 31, 2007.
Servicemember Reemployment: Agencies Are Generally Timely in Processing Redress Complaints, but Improvements Needed in Maintaining Data and Reporting. GAO-11-55. Washington, D.C.: October 22, 2010.
Military Personnel: Improvements Needed to Increase Effectiveness of DOD’s Programs to Promote Positive Working Relationships between Reservists and Their Employers. GAO-08-981R. Washington, D.C.: August 15, 2008.
DOD Financial Management: Adjudication of Butterbaugh Claims for the Restoration of Annual Leave or Pay. GAO-08-948R. Washington, D.C.: July 28, 2008.
Military Personnel: Federal Agencies Have Taken Actions to Address Servicemembers’ Employment Rights, but a Single Entity Needs to Maintain Visibility to Improve Focus on Overall Program Results. GAO-08-254T. Washington, D.C.: November 8, 2007.
Military Personnel: Considerations Related to Extending Demonstration Project on Servicemembers’ Employment Rights Claims. GAO-08-229T. Washington, D.C.: October 31, 2007.
Military Personnel: Improved Quality Controls Needed over Servicemembers’ Employment Rights Claims at DOL. GAO-07-907. Washington, D.C.: July 20, 2007.
Related GAO Products

Related GAO Products
Page 98 GAO-15-77 Veterans’ Reemployment Rights
Office of Special Counsel Needs to Follow Structured Life Cycle Management Practices for Its Case Tracking System. GAO-07-318R. Washington, D.C.: February 16, 2007.
Military Personnel: Additional Actions Needed to Improve Oversight of Reserve Employment Issues. GAO-07-259. Washington, D.C.: February 8, 2007.
Military Personnel: Federal Management of Servicemember Employment Rights Can Be Further Improved. GAO-06-60. Washington, D.C.: October 19, 2005.
U.S. Office of Special Counsel’s Role in Enforcing Law to Protect Reemployment Rights of Veterans and Reservists in Federal Employment. GAO-05-74R. Washington, D.C.: October 6, 2004.
(451091)

The Government Accountability Office, the audit, evaluation, and investigative arm of Congress, exists to support Congress in meeting its constitutional responsibilities and to help improve the performance and accountability of the federal government for the American people. GAO examines the use of public funds; evaluates federal programs and policies; and provides analyses, recommendations, and other assistance to help Congress make informed oversight, policy, and funding decisions. GAO’s commitment to good government is reflected in its core values of accountability, integrity, and reliability.
The fastest and easiest way to obtain copies of GAO documents at no cost is through GAO’s website (http://www.gao.gov). Each weekday afternoon, GAO posts on its website newly released reports, testimony, and correspondence. To have GAO e-mail you a list of newly posted products, go to http://www.gao.gov and select “E-mail Updates.”
The price of each GAO publication reflects GAO’s actual cost of production and distribution and depends on the number of pages in the publication and whether the publication is printed in color or black and white. Pricing and ordering information is posted on GAO’s website, http://www.gao.gov/ordering.htm.
Place orders by calling (202) 512-6000, toll free (866) 801-7077, or TDD (202) 512-2537.
Orders may be paid for using American Express, Discover Card, MasterCard, Visa, check, or money order. Call for additional information.
Connect with GAO on Facebook, Flickr, Twitter, and YouTube. Subscribe to our RSS Feeds or E-mail Updates. Listen to our Podcasts . Visit GAO on the web at www.gao.gov.
Contact:
Website: http://www.gao.gov/fraudnet/fraudnet.htm E-mail: [email protected] Automated answering system: (800) 424-5454 or (202) 512-7470
Katherine Siggerud, Managing Director, [email protected], (202) 512-4400, U.S. Government Accountability Office, 441 G Street NW, Room 7125, Washington, DC 20548
Chuck Young, Managing Director, [email protected], (202) 512-4800 U.S. Government Accountability Office, 441 G Street NW, Room 7149 Washington, DC 20548
GAO’s Mission
Obtaining Copies of GAO Reports and Testimony
Order by Phone
Connect with GAO
To Report Fraud, Waste, and Abuse in Federal Programs
Congressional Relations
Public Affairs
Please Print on Recycled Paper.