gao-21-191, accessible version, covid-19: urgent actions
TRANSCRIPT

COVID19
Urgent Actions Needed to Better Ensure an Effective Federal Response Accessible Version
Report to Congressional Committees
December 2020
GAO-21-191
United States Government Accountability Office

Page i GAO-21-191
Contents Letter 1
Highlights 1 Recommendations 11 Introduction 13 Background 18 Executive Summary 22 Closing 43
Appendix I: Enclosures 47
Appendix II: List of Ongoing GAO Work Related to COVID-19, as of November 10, 2020 421
Appendix III: Status of Our Recommendations 426
Appendix IV: Comments from the Department of Health and Human Services 436
Appendix V: Comments from the Department of Housing and Urban Development 442
Appendix VI: Comments from the Internal Revenue Service 445
Appendix VII: Comments from the Department of Labor 449
Appendix VIII: Comments from the Small Business Administration 451
Appendix IX: Comments from the Social Security Administration 453
Appendix X: Comments from the Department of the Treasury 455
Appendix XI: Comments from the Department of Veterans Affairs 458
Appendix XII: Accessible Data 462
Data Tables 462 Agency Comment Letters 533
Contacts 558

Page ii GAO-21-191
Tables
Table 1: COVID-19 Relief Appropriations, Obligations, and Expenditures, as of September 30, 2020 21
Summary of the Provider Relief Fund ($175 billion) Allocations and Disbursements, as of September 30, 2020 75
Strategic National Stockpile Personal Protective Equipment Inventory and Status of Contract Awards 100
Status of Strategic National Stockpile Pharmaceutical Contract Awards and Inventory 102
Strategic National Stockpile Testing Supply Inventory 103 HHS’s Reported Obligations and Expenditures for Testing-Related
COVID-19 Response Activities, as of Oct. 31, 2020 111 Federal Medicaid COVID-19 and Total Expenditures, by State and
Territory, as of October 31, 2020 127 Allocation and Obligation of Supplemental Funding Provided to
the Indian Health Service (IHS) to Address COVID-19 138 Number of COVID-19 Cases Reported by the Department of
Defense, as of September 30, 2020 152 Funds Available for the Department of Defense to Transfer from
the CARES Act Appropriations for the Army and Air National Guards’ Personnel and Operations and Maintenance Accounts 160
Supplemental Appropriations to HHS for COVID-19 Response 166 Department of Health and Human Services (HHS) Reported
Appropriations, Obligations, and Expenditures for COVID-19 Response, by Agency, as of October 31, 2020 168
Department of Health and Human Services (HHS) Reported Allocations, Obligations, and Expenditures for COVID-19 Response, by Selected Key Response Activity, as of October 31, 2020 170
Substance Abuse and Mental Health Services Administration (SAMHSA) COVID-19 Related Grants 194
Department of Health and Human Services’ (HHS) Collaborative Efforts to Respond to Increased Cyberattacks Associated with COVID-19 since March 2020 217
Key Information on Federal Nutrition Assistance Programs during the COVID-19 Pandemic 222
Examples of ACF Guidance and Flexibilities Provided to Help State Child Welfare Agencies Respond to Pandemic Concerns Described by National Organizations 234
Page iii GAO-21-191
Number and Type of Compliance Actions Related to Families First Coronavirus Response Act Paid Leave Provisions, as of September 16, 2020 242
New FFCRA-related Performance Measures for Department of Labor’s Wage and Hour Division 243
Summary of Claims Requested on Filed Quarterly Employment Tax Returns, as of October 29, 2020 244
Groups That Can Expect a Corrected Economic Impact Payment (EIP) in 2020 281
CARES Act Net Operating Loss (NOL) and Alternative Minimum Tax (AMT) Tentative Refund Cases, as of October 19, 2020300
CARES Act Application for Tentative Refund Cases Received via E-fax, by Refund Amount, as of October 19, 2020 301
Funding Amounts and Funding Sources for Coronavirus Food Assistance Program (CFAP) 1 and 2 Direct Payments to Agricultural Producers, as of September 30, 2020 316
Federal Reserve Lending Facilities with CARES Act Funding, as of October 15, 2020 347
Federal Reserve Lending Facilities without CARES Act Funding, as of October 15, 2020 350
Amtrak Expenditure of CARES Act Funds by Grant Program, as of September 30, 2020 358
Allocation of CARES Act Funding for Fishery Participants Made to States, Tribes, and Territories on May 7, 2020 366
Transit Agency Obligations of CARES Act Grant Funds by Expense Category in Urban, Rural, and Tribal Areas, as of September 30, 2020 378
Steps Officials from 22 Transit Agencies Reported Having Taken to Mitigate the Spread of COVID-19 among Passengers and Employees 380
CARES Act Airport Grants by Funding Group 392 Federal Aviation Administration Obligations and Expenditures for
CARES Act Airport Grants, by Funding Group, as of September 30, 2020 393
Figures
Number of Unemployed Workers Permanently Losing Jobs and on Temporary Layoff, January 2019 through October 2020 1
State-Reported Testing Supply Shortages, as of October 2020 2 Types of COVID-19 Testing Approaches 5

Page iv GAO-21-191
Number of Filers and Non-Filers Issued an Economic Impact Payment, as of September 30, 2020 7
Figure 1: Report Enclosures by Topic Area 17 Figure 2: Selected Federal Actions That Congress and the
Administration Have Taken Related to COVID-19, as of November 2020 19
Figure 3: Higher-Than-Expected Weekly Mortality, January to October 2020 23
Figure 4: Number of Unemployed Workers Permanently Losing Jobs and on Temporary Layoff, January 2019 through October 2020 24
Figure 5: Extent of States’ Confidence in Ability to Fulfill Future Requests for Selected Personal Protective Equipment (PPE) 26
Figure 6: State-Reported Supply Shortages for Testing Sites or Laboratories 27
Figure 7: Operation Warp Speed Timeline for a Potential Vaccine Candidate 30
Indicators for Areas of the Economy Supported by the Federal Pandemic Response, July 2020 through October 2020, cumulative change since February 2020 56
Percentage Change in Employment by Sector, February through October 2020 58
Number of Unemployed Workers Permanently Losing Jobs and on Temporary Layoff, January 2019 through October 2020 59
Serious Delinquency Rates on Single-Family Residential Mortgages, January 2019 through August 2020 60
State and Local Government Tax Revenue, First Quarter 2019 through Second Quarter 2020 62
Weekly Confirmed COVID-19 Cases and Deaths among U.S. Nursing Home Residents and Staff, as Reported by Medicare- and Medicaid-Certified Nursing Homes, Weeks Ending May 31, 2020 through October 4, 2020 83
Federal Entities Involved in Management of the Strategic National Stockpile (SNS) Supplies during the COVID-19 Pandemic 97
Primary Use of Pharmaceutical Products the Office of the Assistant Secretary for Preparedness and Response Will Include in the Strategic National Stockpile 101
Contents of One Type of Strategic National Stockpile COVID-19 Vaccination Kit That Supports 100 Vaccinations 105
HHS Definitions and Applicable Requirements, by Type of COVID-19 Testing Approach 112

Page v GAO-21-191
Timeline of Selected Changes to Centers for Disease Control and Prevention (CDC) Testing Guidelines for Asymptomatic Individuals with Known or Suspected Exposure 120
Supplemental Appropriations to HHS for COVID-19 Response and HHS’s Reported Obligations and Expenditures, as of October 31, 2020 167
Cumulative COVID-19-Associated Hospitalization Rates per 100,000 Population from Select Counties in 14 States, Adjusted for Age, by Race and Ethnicity, March 1, 2020 through October 10, 2020 175
COVID-19 Death Rates, by Race and Ethnicity, through October 7, 2020 177
Deaths in 2020 as a Percentage of 2015-2019 Deaths, by Race and Ethnicity, January through October 2020 178
Distribution of COVID-19 Deaths, by Race and Ethnicity and Age Group, through October 14, 2020 181
Centers for Disease Control and Prevention (CDC) Reported Survey Findings Regarding Suicidal Ideation, June 24–30, 2020 189
Centers for Disease Control and Prevention (CDC) Reported Survey Findings Regarding Substance Use, June 24–30, 2020 190
Examples of Personal Protective Equipment 204 Examples of COVID-19 Testing Supplies 205 Extent that States and Territories Fulfilled Requests for Selected
Personal Protective Equipment (PPE) 208 Number of States Reporting 30-day Stockpiles of Selected
Personal Protective Equipment (PPE) 209 Extent of States’ Confidence in Ability to Fulfill Future Requests
for Selected Personal Protective Equipment (PPE) 210 State-Reported Supply Shortages for Testing Sites or
Laboratories 211 States’ Anticipated Supply Shortages for Testing Sites or
Laboratories 212 Status of Supplemental CARES Act Funding for HUD Programs,
as of September 30, 2020 248 Weekly Initial Claims Submitted Nationwide for Regular
Unemployment Insurance (UI) and Pandemic Unemployment Assistance (PUA) Benefits 259
Over-reporting of Individuals Claiming Pandemic Unemployment Assistance (PUA) 263

Page vi GAO-21-191
Number of Filers and Non-Filers Issued an Economic Impact Payment as of September 30, 2020 276
Number of Non-Filers Who Used IRS Non-Filers Tool to File for and Received an Economic Impact Payment 278
Social Security Administration Initial-level Disability Determination Workloads, March 2019 through September 2020 289
Daily Average Number of Social Security Administration Disability Hearings Held, March 20, 2020 through October 16, 2020 291
Obligations and Purchases for Each Round of the U.S. Department of Agriculture’s Farmers to Families Food Box Program, as of September 30, 2020 318
U.S. Department of Agriculture Food Safety and Inspection Service’s Personal Protective Equipment Purchases by Type, Quantity, and Cost, as of September 30, 2020 322
Economic Development Administration Grants Awarded with CARES Act Funds by State and U.S. Territory, as of September 30, 2020 330
Paycheck Protection Program (PPP) Loan Forgiveness Process Time Frames 336
Average Dollar Amount of Economic Injury Disaster Loans Relative to the Total Number of Small Businesses in Each State, as of October 4, 2020 341
Amtrak Ridership Actuals and Forecast, October 2018–September 2021 360
Monthly Disaster Relief Fund Balance, February 2020 through October 2020 384
FEMA Obligations from the Disaster Relief Fund for COVID-19 by State and Territory, as of October 2020 385
COVID-19 Obligations from the Disaster Relief Fund by Program or Activity, as of September 2020 386
Four Federal Agencies Tasked with the Most Mission Assignments 388
Obligations from the Disaster Relief Fund for COVID-19 and the Five Costliest Storms, as of October 2020 389
Contract Obligations in Response to COVID-19 by Federal Agency, as of October 15, 2020 399
Government-wide Contract Obligations Related to COVID-19 by Week, February–October 2020 400
Contract Obligation Amounts for Goods and Services Most Procured in Response to COVID-19, as of October 15, 2020 401

Page vii GAO-21-191
Monthly U.S. Imports of Categories Containing COVID-19-Related Products by Type, January 2019–August 2020 406
Example Timeline for Newly Established COVID-19 Programs’ Reporting of Improper Payment Estimates 418
Accessible Data for Number of Unemployed Workers Permanently Losing Jobs and on Temporary Layoff, January 2019 through October 2020 462
Accessible Data for State-Reported Testing Supply Shortages, as of October 2020 463
Accessible Data for Types of COVID-19 Testing Approaches 464 Accessible Data for Number of Filers and Non-Filers Issued an
Economic Impact Payment, as of September 30, 2020 465 Accessible Data for Figure 2: Selected Federal Actions That
Congress and the Administration Have Taken Related to COVID-19, as of November 2020 467
Accessible Data for Figure 3: Higher-Than-Expected Weekly Mortality, January to October 2020 468
Accessible Data for Figure 4: Number of Unemployed Workers Permanently Losing Jobs and on Temporary Layoff, January 2019 through October 2020 470
Accessible Data for Figure 5: Extent of States’ Confidence in Ability to Fulfill Future Requests for Selected Personal Protective Equipment (PPE) 471
Accessible Data for Figure 6: State-Reported Supply Shortages for Testing Sites or Laboratories 472
Accessible Data for Figure 7: Operation Warp Speed Timeline for a Potential Vaccine Candidate 473
Accessible Data for Indicators for Areas of the Economy Supported by the Federal Pandemic Response, July 2020 through October 2020, cumulative change since February 2020 474
Accessible Data for Percentage Change in Employment by Sector, February through October 2020 475
Accessible Data for Number of Unemployed Workers Permanently Losing Jobs and on Temporary Layoff, January 2019 through October 2020 476
Accessible Data for Serious Delinquency Rates on Single-Family Residential Mortgages, January 2019 through August 2020 477
Accessible Data for State and Local Government Tax Revenue, First Quarter 2019 through Second Quarter 2020 478

Page viii GAO-21-191
Accessible Data for Weekly Confirmed COVID-19 Cases and Deaths among U.S. Nursing Home Residents and Staff, as Reported by Medicare- and Medicaid-Certified Nursing Homes, Weeks Ending May 31, 2020 through October 4, 2020 479
Accessible Data for Federal Entities Involved in Management of the Strategic National Stockpile (SNS) Supplies during the COVID-19 Pandemic 480
Accessible Data for Primary Use of Pharmaceutical Products the Office of the Assistant Secretary for Preparedness and Response Will Include in the Strategic National Stockpile 481
Accessible Data for Contents of One Type of Strategic National Stockpile COVID-19 Vaccination Kit That Supports 100 Vaccinations 482
Accessible Data for HHS Definitions and Applicable Requirements, by Type of COVID-19 Testing Approach 483
Accessible Data for Timeline of Selected Changes to Centers for Disease Control and Prevention (CDC) Testing Guidelines for Asymptomatic Individuals with Known or Suspected Exposure 484
Accessible Data for Supplemental Appropriations to HHS for COVID-19 Response and HHS’s Reported Obligations and Expenditures, as of October 31, 2020 485
Accessible Data for Cumulative COVID-19-Associated Hospitalization Rates per 100,000 Population from Select Counties in 14 States, Adjusted for Age, by Race and Ethnicity, March 1, 2020 through October 10, 2020 486
Accessible Data for COVID-19 Death Rates, by Race and Ethnicity, through October 7, 2020 487
Accessible Data for Deaths in 2020 as a Percentage of 2015-2019 Deaths, by Race and Ethnicity, January through October 2020 488
Accessible Data for Distribution of COVID-19 Deaths, by Race and Ethnicity and Age Group, through October 14, 2020 490
Accessible Data for Centers for Disease Control and Prevention (CDC) Reported Survey Findings Regarding Suicidal Ideation, June 24–30, 2020 491
Accessible Data for Centers for Disease Control and Prevention (CDC) Reported Survey Findings Regarding Substance Use, June 24–30, 2020 492
Accessible Data for Examples of Personal Protective Equipment 493 Accessible Data for Examples of COVID-19 Testing Supplies 494

Page ix GAO-21-191
Accessible Data for Extent that States and Territories Fulfilled Requests for Selected Personal Protective Equipment (PPE) 495
Accessible Data for Number of States Reporting 30-day Stockpiles of Selected Personal Protective Equipment (PPE) 496
Accessible Data for Extent of States’ Confidence in Ability to Fulfill Future Requests for Selected Personal Protective Equipment (PPE) 497
Accessible Data for State-Reported Supply Shortages for Testing Sites or Laboratories 498
Accessible Data for States’ Anticipated Supply Shortages for Testing Sites or Laboratories 499
Accessible Data for Status of Supplemental CARES Act Funding for HUD Programs, as of September 30, 2020 500
Accessible Data for Weekly Initial Claims Submitted Nationwide for Regular Unemployment Insurance (UI) and Pandemic Unemployment Assistance (PUA) Benefits 502
Accessible Data for Over-reporting of Individuals Claiming Pandemic Unemployment Assistance (PUA) 504
Accessible Data for Number of Filers and Non-Filers Issued an Economic Impact Payment as of September 30, 2020 505
Accessible Data for Number of Non-Filers Who Used IRS Non-Filers Tool to File for and Received an Economic Impact Payment 507
Accessible Data for Social Security Administration Initial-level Disability Determination Workloads, March 2019 through September 2020 509
Accessible Data for Daily Average Number of Social Security Administration Disability Hearings Held, March 20, 2020 through October 16, 2020 510
Accessible Data for Obligations and Purchases for Each Round of the U.S. Department of Agriculture’s Farmers to Families Food Box Program, as of September 30, 2020 511
Accessible Data for U.S. Department of Agriculture Food Safety and Inspection Service’s Personal Protective Equipment Purchases by Type, Quantity, and Cost, as of September 30, 2020 512
Accessible Data for Economic Development Administration Grants Awarded with CARES Act Funds by State and U.S. Territory, as of September 30, 2020 513

Page x GAO-21-191
Accessible Data for Paycheck Protection Program (PPP) Loan Forgiveness Process Time Frames 515
Accessible Data for Average Dollar Amount of Economic Injury Disaster Loans Relative to the Total Number of Small Businesses in Each State, as of October 4, 20204 516
Accessible Data for Amtrak Ridership Actuals and Forecast, October 2018–September 2021 518
Accessible Data for Monthly Disaster Relief Fund Balance, February 2020 through October 2020 520
Accessible Data for FEMA Obligations from the Disaster Relief Fund for COVID-19 by State and Territory, as of October 2020 521
Accessible Data for COVID-19 Obligations from the Disaster Relief Fund by Program or Activity, as of September 2020 523
Accessible Data for Four Federal Agencies Tasked with the Most Mission Assignments 524
Accessible Data for Obligations from the Disaster Relief Fund for COVID-19 and the Five Costliest Storms, as of October 2020 525
Accessible Data for Contract Obligations in Response to COVID-19 by Federal Agency, as of October 15, 2020 526
Accessible Data for Government-wide Contract Obligations Related to COVID-19 by Week, February–October 2020 527
Accessible Data for Contract Obligation Amounts for Goods and Services Most Procured in Response to COVID-19, as of October 15, 2020 530
Accessible Data for Monthly U.S. Imports of Categories Containing COVID-19-Related Products by Type, January 2019–August 2020 531
Accessible Data for Example Timeline for Newly Established COVID-19 Programs’ Reporting of Improper Payment Estimates 532
Abbreviations CDC Centers for Disease Control and Prevention CMS Centers for Medicare & Medicaid Services COVID-19 Coronavirus Disease 2019 CRF Coronavirus Relief Fund DHS Department of Homeland Security DOD Department of Defense DOL Department of Labor

Page xi GAO-21-191
DOT Department of Transportation EIP economic impact payment EUA emergency use authorization FDA Food and Drug Administration FEMA Federal Emergency Management Agency GTAS Governmentwide Treasury Account Symbol Adjusted Trial Balance System HHS Department of Health and Human Services HUD Department of Housing and Urban Development IRS Internal Revenue Service NCHS National Center for Health Statistics NIA National Interest Action OMB Office of Management and Budget PPE personal protective equipment PPP Paycheck Protection Program PSP Payroll Support Program SBA Small Business Administration SNS Strategic National Stockpile SSA Social Security Administration SVH state veterans home Treasury Department of the Treasury UI unemployment insurance USDA United States Department of Agriculture VA Department of Veterans Affairs WHO World Health Organization
This is a work of the U.S. government and is not subject to copyright protection in the United States. The published product may be reproduced and distributed in its entirety without further permission from GAO. However, because this work may contain copyrighted images or other material, permission from the copyright holder may be necessary if you wish to reproduce this material separately.

Page 1 GAO-21-191
441 G St. N.W.Washington, DC 20548
Letter
Highlights
What GAO Found
The COVID-19 pandemic has resulted in catastrophic loss of life and substantial damage to the global economy, stability, and security. According to federal data, the U.S. had an average of 116,000 new COVID-19 cases per day from November 1 through November 12, 2020. Between January 2020 and October 2020, at least 237,000 more deaths occurred from all causes, including COVID-19, than would normally be expected, according to data from the Centers for Disease Control and Prevention (CDC).
Further, while the economy has improved since July 2020, many people remain unemployed, including both those temporarily laid off and those who have permanently lost their job (see figure). Also, more households have become seriously delinquent on mortgage payments during the pandemic. In addition, GAO’s review of academic studies suggests the pandemic will likely remain a significant obstacle to more robust economic activity.
Number of Unemployed Workers Permanently Losing Jobs and on Temporary Layoff, January 2019 through October 2020

Letter
Page 2 GAO-21-191
In response to the pandemic and its effects, Congress and the administration have taken a series of actions to protect the health and well-being of Americans. However, as the end of 2020 approaches, urgent actions are needed to help ensure an effective federal response on a range of public health and economic issues.
Medical Supplies
While the Department of Health and Human Services (HHS) and the Federal Emergency Management Agency (FEMA) have made numerous efforts to mitigate supply shortages and expand the medical supply chain, shortages of certain supplies persist. In September 2020, GAO reported that ongoing constraints with the availability of certain types of personal protective equipment (PPE) and testing supplies remain due to a supply chain with limited domestic production and high global demand. In October 2020, GAO surveyed public health and emergency management officials from all states, the District of Columbia, and U.S. territories (hereafter states) and found the following:
· Testing supplies. Most states reported no shortages of swabs or transport media, but about one-third to one-half reported shortages in other types of testing supplies (see figure).
State-Reported Testing Supply Shortages, as of October 2020
GAO surveyed officials in the 50 states; Washington, D.C.; and the five U.S. territories and received responses from 47 of the 56 locations, representing 41 states; Washington, D.C.; and all five territories. Not all states responded to every question.
· PPE. The majority of states that responded were mainly able to fulfill requests for supplies from organizations and entities within

Letter
Page 3 GAO-21-191
their states. However, availability constraints continue with certain PPE, such as nitrile gloves.
· Supplies for future vaccine needs. About one-third of states that responded stated that they were “greatly” or “completely” concerned about having sufficient vaccine-related supplies to administer COVID-19 vaccines. An additional 21 states indicated that they were moderately concerned.
In September 2020, GAO recommended that HHS, in coordination with FEMA, should
· further develop and communicate to stakeholders plans outlining specific actions the federal government will take to help mitigate supply chain shortages for the remainder of the pandemic;
· immediately document roles and responsibilities for supply chain management functions transitioning to HHS, including continued support from other federal partners, to ensure sufficient resources exist to sustain and make the necessary progress in stabilizing the supply chain; and
· devise interim solutions, such as systems and guidance and dissemination of best practices, to help states enhance their ability to track the status of supply requests and plan for supply needs for the remainder of the pandemic response.
HHS and the Department of Homeland Security disagreed with these recommendations, noting, among other things, the work that they had done to manage the medical supply chain and increase supply availability. In November 2020, HHS repeated its disagreement with GAO’s recommendations and noted its efforts to meet the needs of states.
In light of the surge in COVID-19 cases, along with reported shortages, including GAO’s nationwide survey findings, GAO underscores the critical imperative for HHS and FEMA to implement GAO’s September 2020 recommendations.
Vaccines and Therapeutics
In a recent GAO report (GAO-21-207), GAO found that there has been significant federal investment to accelerate vaccine and therapeutic development, such as through Operation Warp Speed, a partnership between the Department of Defense and HHS that aims to accelerate the development, manufacturing, and distribution of COVID-19 vaccines and
Letter
Page 4 GAO-21-191
therapeutics. Separately, Emergency Use Authorizations (EUA), which allow for the emergency use of medical products without Food and Drug Administration (FDA) approval or licensure provided certain statutory criteria are met, have also been used for therapeutics. As of November 9, 2020, FDA had made four therapeutics available to treat COVID-19 through EUAs. In that report, GAO recommended that FDA identify ways to uniformly disclose information from its scientific review of safety and effectiveness data when issuing EUAs for therapeutics and vaccines. By doing so, FDA could help improve the transparency of, and ensure public trust in, its EUA decisions. HHS neither agreed nor disagreed with the recommendation, but said it shared GAO’s goal of transparency.
COVID-19 Testing Guidance
HHS and its component agencies have taken several key actions to document a federal COVID-19 testing strategy and provide testing-related agency guidance. However, this guidance has not always been transparent, raising the risk of confusion and eroding trust in government. In particular, while it is expected that guidance will change as new information about the novel virus evolves, frequent changes to general CDC testing guidelines have not always been communicated with a scientific explanation. GAO recommends that HHS ensure that CDC clearly discloses the scientific rationale for any change to testing guidelines at the time the change is made. HHS concurred with this recommendation.
Letter
Page 5 GAO-21-191
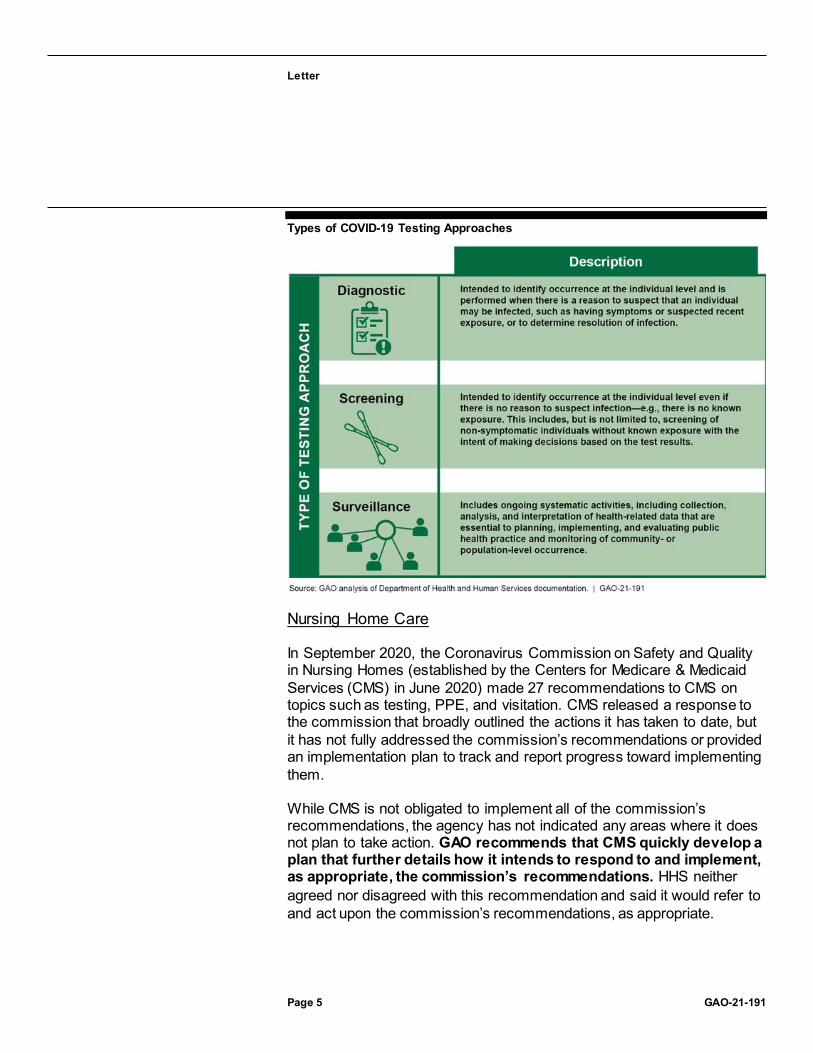
Types of COVID-19 Testing Approaches
Nursing Home Care
In September 2020, the Coronavirus Commission on Safety and Quality in Nursing Homes (established by the Centers for Medicare & Medicaid Services (CMS) in June 2020) made 27 recommendations to CMS on topics such as testing, PPE, and visitation. CMS released a response to the commission that broadly outlined the actions it has taken to date, but it has not fully addressed the commission’s recommendations or provided an implementation plan to track and report progress toward implementing them.
While CMS is not obligated to implement all of the commission’s recommendations, the agency has not indicated any areas where it does not plan to take action. GAO recommends that CMS quickly develop a plan that further details how it intends to respond to and implement, as appropriate, the commission’s recommendations. HHS neither agreed nor disagreed with this recommendation and said it would refer to and act upon the commission’s recommendations, as appropriate.
Letter
Page 6 GAO-21-191
In addition, the Department of Veterans Affairs (VA) partners with state governments to provide nursing home care to more than 20,000 veterans in over 150 state veterans homes. In March 2020, VA instructed its contractor to stop in-person inspections due to concerns about COVID-19. As of September 2020, these inspections had not resumed, leaving veterans at risk of receiving poor quality care. Additionally, VA does not collect timely data on the number of COVID-19 cases and deaths occurring at each state veterans home, hindering its ability to monitor and take steps to mitigate the spread of COVID-19 in these homes. GAO recommends that VA (1) develop a plan to resume inspections of state veterans homes, which may include using in-person, a mix of virtual and in-person, or fully virtual inspections, and (2) collect timely data on COVID-19 cases and deaths in each state veterans home. VA concurred with both recommendations.
Economic Impact Payments
The CARES Act included economic impact payments (EIP) for eligible individuals to address financial stress due to the pandemic. As of September 30, 2020, the Department of the Treasury (Treasury) and the Internal Revenue Service (IRS) had disbursed over 165.8 million payments to individuals, totaling $274.7 billion. According to IRS data, more than 26 million non-filers—individuals who do not normally file a tax return and may be hard to reach—received a payment (see figure). However, everyone that was supposed to receive a payment was not reached. Starting in September 2020, IRS sent notices to nearly 9 million individuals who had not yet received an EIP.

Letter
Page 7 GAO-21-191
Number of Filers and Non-Filers Issued an Economic Impact Payment, as of September 30, 2020
Treasury and IRS officials did not plan to track and analyze the outcomes of their EIP notice mailing effort until 2021. The lack of timely analysis deprives Treasury and IRS of data they could use to assess the effectiveness of their notice strategy and redirect resources as needed to other outreach and communication efforts. GAO recommends that Treasury, in coordination with IRS, should begin tracking and publicly reporting the number of individuals who were mailed an EIP notification letter and filed for and received an EIP, and use that information to inform ongoing outreach and communications efforts. Treasury agreed with this recommendation.
Unemployment Insurance
The CARES Act created three federally funded temporary programs for unemployment insurance (UI) that expanded benefit eligibility and enhanced benefits. In its weekly news releases, the Department of Labor (DOL) publishes the number of weeks of unemployment benefits claimed by individuals in each state during the period and reports the total count as the number of people claiming benefits nationwide. DOL officials told GAO that they have traditionally used this number as a proxy for the number of individuals claiming benefits because they were closely related. However, the number of claims has not been an accurate estimate of the number of individuals claiming benefits during the pandemic because of backlogs in processing a historic volume of claims, among other data issues.
Letter
Page 8 GAO-21-191
Without an accurate accounting of the number of individuals who are relying on these benefits in as close to real time as possible, policymakers may be challenged to respond to the crisis at hand. GAO recommends that DOL (1) revise its weekly news releases to clarify that in the current unemployment environment, the numbers it reports for weeks of unemployment claimed do not accurately estimate the number of unique individuals claiming benefits, and (2) pursue options to report the actual number of distinct individuals claiming benefits, such as by collecting these already available data from states. DOL agreed with the recommendation to revise its weekly news releases, and partially agreed with the recommendation to pursue options to report the actual number of distinct individuals claiming benefits.
Tax Relief for Businesses
To provide liquidity to businesses during the pandemic, the CARES Act included tax measures to help businesses receive cash refunds or other reductions to tax obligations. Some taxpayers need to file an amended income tax return to take advantage of these provisions; at the same time, IRS faces an increase in mail and paper processing delays due to the pandemic, which may delay the timely processing of this paperwork and issuance of these refunds. GAO recommends that IRS update its form instructions to include information on its electronic filing capability for tax year 2019. IRS agreed with this recommendation.
Program Integrity
Although the extent and significance of improper payments associated with COVID-19 relief funds have not yet been determined, the impact of these improper payments, including those that are the result of fraud, could be substantial. For example, numerous individuals are facing federal charges related to attempting to defraud the Paycheck Protection Program (PPP), UI program, or other federal programs, and many more investigations are underway. To address the risk of improper payments due to fraud and other causes, GAO previously recommended the following:
· The Small Business Administration (SBA) should develop and implement plans to identify and respond to risks in the PPP to ensure program integrity, achieve program effectiveness, and address potential fraud.

Letter
Page 9 GAO-21-191
· The Office of Management and Budget (OMB), in consultation with Treasury, should issue timely guidance for auditing new and existing COVID-19-related programs, including Coronavirus Relief Fund payments, as soon as possible. Audits of entities that receive federal funds are critical to the federal government’s ability to help safeguard those funds. Also, Congress should amend the Social Security Act to explicitly allow the Social Security Administration to share its full death data with Treasury for data matching to prevent payments to ineligible individuals.
GAO maintains that implementing these recommendations fully is critically important in order to protect federal funds from improper payments resulting from fraud and other risks.
In this report, GAO also identifies new concerns about the timely reporting of improper payments for COVID-19 programs. The COVID-19 relief laws appropriated over a trillion dollars that may be spent through newly established programs to fund response and recovery efforts, such as SBA’s PPP. However, unlike the supplemental appropriations acts that provided for disaster relief related to the 2017 hurricanes and California wildfires, the COVID-19 relief laws did not require agencies to deem programs receiving these relief funds that expend more than a threshold amount as "susceptible to significant improper payments." In addition, based on OMB guidance, improper payment estimates associated with new COVID-19 programs established in March 2020 may not be reported until November 2022, in some instances. GAO is making two recommendations:
· OMB should develop and issue guidance directing agencies to include COVID-19 relief funding with associated key risks, such as changes to existing program eligibility rules, as part of their improper payment estimation methodologies, especially for existing programs that received COVID-19 relief funding.
· SBA should expeditiously estimate improper payments and report estimates and error rates for PPP due to concerns about the possibility that improper payments, including those resulting from fraudulent activity, could be widespread.
GAO is also suggesting that Congress consider, in any future legislation appropriating COVID-19 relief funds, designating all executive agency programs and activities making more than $100 million in payments from COVID-19 relief funds as “susceptible to significant improper payments.”

Letter
Page 10 GAO-21-191
Aviation Assistance and Preparedness
GAO identified concerns about efforts to monitor CARES Act financial assistance to the aviation sector. Treasury’s Payroll Support Program (PSP) provides $32 billion in payroll support payments and loans to help the aviation industry retain its employees. While recipients have begun submitting required compliance reports, Treasury has not yet finalized a monitoring system to identify and respond to the risk of noncompliance with PSP agreement terms, potentially hindering its ability to detect program misuse in a timely manner. GAO is recommending that Treasury finish developing and implement a compliance monitoring plan that identifies and responds to risks in the PSP. Treasury neither agreed nor disagreed with this recommendation, but committed to reviewing additional measures that may further enhance its compliance monitoring and ensure that PSP funds are used as intended.
In June 2020, GAO suggested that Congress take legislative action to require the Secretary of Transportation to work with relevant agencies, such as HHS, the Department of Homeland Security, and other stakeholders, to develop a national aviation-preparedness plan to limit the spread of communicable disease threats and minimize travel and trade impacts. GAO originally made this recommendation to the Department of Transportation in December 2015. GAO urges Congress to take swift action to require such a plan, without which the U.S. will not be as prepared to minimize and quickly respond to ongoing and future communicable disease events.
Why GAO Did This Study
As of November 12, 2020, the U.S. had over 10.3 million cumulative reported cases of COVID-19 and about 224,000 reported deaths, according to federal agencies. The country also continues to experience serious economic repercussions.
Four relief laws, including the CARES Act, were enacted as of November 2020 to provide appropriations to address the public health and economic threats posed by COVID-19. As of September 30, 2020, of the $2.6 trillion appropriated by these acts, the federal government had obligated a total of $1.8 trillion and expended $1.6 trillion of the COVID-19 relief funds, as reported by federal agencies.

Letter
Page 11 GAO-21-191
The CARES Act included a provision for GAO to report on its ongoing monitoring and oversight efforts related to the COVID-19 pandemic. This report examines the federal government’s continued efforts to respond to and recover from the COVID-19 pandemic.
GAO reviewed data, documents, and guidance from federal agencies about their activities and interviewed federal and state officials. GAO also sent a survey to public health and emergency management officials in the 50 states, Washington, D.C., and the five U.S. territories regarding medical supplies.
What GAO Recommends
GAO is making 11 new recommendations for agencies that are detailed in this Highlights and in the report. GAO is also raising one matter for congressional consideration.
Recommendations Matters for Congressional Consideration
Number Matter 1 To hold agencies accountable and increase transparency, Congress
should consider, in any future legislation appropriating COVID-19 relief funds, designating all executive agency programs and activities making more than $100 million in payments from COVID -19 relief funds as “susceptible to significant improper payments” for purposes of 31 U.S.C. § 3352.
Recommendations for Executive Action
We are making a total of 11 recommendations to federal agencies:

Letter
Page 12 GAO-21-191
Number Agency Recommendation 1 Department of
Health and Human Services
The Secretary of Health and Human Services should ensure that the Director of the Centers for Disease Control and Prevention clearly discloses the scientific rationale for any change to testing guidelines at the time the change is made. (Recommendation 1)
2 Department of Health and Human Services : Centers for Medicare and Medicaid Services
The Administrator of the Centers for Medicare & Medicaid Services should quickly develop a plan that further details how the agency intends to respond to and implement, as appropriate, the 27 recommendations in the final report of the Coronavirus Commission on Safety and Quality in Nursing Homes, which the Centers for Medicare & Medicaid Services released on September 16, 2020. Such a plan should include milestones that allow the agency to track and report on the status of each recommendation; identify actions taken and planned, including areas where the Centers for Medicare & Medicaid Services determined not to take action; and identify areas where the agency could coordinate with other federal and nonfederal entities. (Recommendation 2)
3 Department of Veterans Affairs : Office of the Under Secretary for Health
The Department of Veterans Affairs Under Secretary for Health should develop a plan to ensure inspections of state veterans homes occur during the COVID-19 pandemic—which may include using in-person, a mix of virtual and in-person, or fully virtual inspections. (Recommendation 3)
4 Department of Veterans Affairs : Office of the Under Secretary for Health
The Department of Veterans Affairs Under Secretary for Health should collect timely data on COVID-19 cases and deaths in each state veterans home, which may include using data already collected by the Centers for Medicare & Medicaid Services. (Recommendation 4)
5 Department of the Treasury
The Secretary of the Treasury, in coordination with the Commissioner of Internal Revenue, should begin tracking and publicly reporting the number of individuals who were mailed an economic impact payment notification letter and subsequently filed for and received an economic impact payment, and use that information to inform ongoing outreach and communications efforts. (Recommendation 5)
6 Department of the Treasury : Internal Revenue Service
The Commissioner of Internal Revenue should update the Form 1040-X instructions to include information on the electronic filing capability for tax year 2019. (Recommendation 6)

Letter
Page 13 GAO-21-191
Number Agency Recommendation 7 Department of
Labor The Secretary of Labor should ensure the Office of Unemployment Insurance revises its weekly news releases to clarify that in the current unemployment environment, the numbers it reports for weeks of unemployment claimed do not accurately estimate the number of unique individuals claiming benefits. (Recommendation 7)
8 Department of Labor
The Secretary of Labor should ensure the Office of Unemployment Insurance pursues options to report the actual number of distinct individuals claiming benefits, such as by collecting these already available data from states, starting from January 2020 onward. (Recommendation 8)
9 Executive Office of the President : Office of Management and Budget
The Director of the Office of Management and Budget should develop and issue guidance directing agencies to include COVID-19 relief funding with associated key risks, such as provisions contained in the CARES Act and other relief legislation that potentially increase the risk of improper payments or changes to existing program eligibility rules, as part of their improper payment estimation methodologies. This should especially be required for already existing federal programs that received COVID-19 relief funding. (Recommendation 9)
10 Small Business Administration
The Administrator of the Small Business Administration should expeditiously estimate improper payments and report estimates and error rates for the Paycheck Protection Program due to concerns about the possibility that improper payments, including those resulting from fraudulent activity, could be widespread. (Recommendation 10)
11 Department of the Treasury
The Secretary of the Treasury should finish developing and implement a compliance monitoring plan that identifies and responds to risks in the Payroll Support Program to ensure program integrity and address potential fraud, including the use of funds for purposes other than for the continuation of employee wages, salaries, and benefits. (Recommendation 11)
Introduction Congressional Committees
The Coronavirus Disease 2019 (COVID-19) pandemic has resulted in catastrophic loss of life and substantial damage to the global economy, stability, and security. Worldwide, as of November 12, 2020, there were about 51,548,000 cumulative reported cases and 1,276,000 reported

Letter
Page 14 GAO-21-191
deaths due to COVID-19; within the U.S., there were about 10,314,000 cumulative reported cases and 224,000 reported deaths.1
Following a downward trend in August and early September, the number of COVID-19 cases began to increase again in mid-September. By November 1–12, 2020, reported new COVID-19 cases per day had peaked at about 116,000, on average—higher than at any other previous time. Between October 16 and November 12, 2020, reported COVID-19 cases per day, on average, increased in 49 states and jurisdictions and held steady in three states.2
During this most recent spike in cases, some states have taken measures to prevent their health care systems from being overwhelmed. For example, the Wisconsin Department of Health Services opened an alternate care facility at the Wisconsin State Fair Park near Milwaukee on October 14, 2020. This facility is intended to serve as overflow for hospitals across the state and supports patients who are not severely ill but require continued medical support. In addition, the Acting Secretary of the New Mexico Department of Health issued an order, beginning November 16, 2020, to close non-essential businesses, prohibit indoor or outdoor dining at food and beverage establishments, and restrict
1 Worldwide data from the World Health Organization reflect laboratory-confirmed cases and deaths reported by countries and areas. Data on COVID -19 cases in the U.S. are based on aggregate case reporting to the Centers for Disease Control and Prevention (CDC) and include probable and confirmed cases as reported by states and jurisdictio ns. According to CDC, the actual number of COVID-19 cases is unknown for a variety of reasons, including that people who have been infected may have not been tested or may have not sought medical care. CDC’s National Center for Health Statistics COVID -19 death counts in the U.S. are based on provisional counts from death certificate data, which do not distinguish between laboratory-confirmed and probable COVID-19 deaths. Provisional counts are incomplete due to an average delay of 2 weeks (a range of 1 –8 weeks or longer) for death certificate processing.
2 The 52 states and jurisdictions include all 50 states and the District of Columbia and New York City. COVID-19 case counts for New York City are reported separately from New York State. We defined states as holding steady if they had less than a 1 percent increase or decrease in average daily new cases over the time frame. The average percent change in daily new cases was calculated as the average of the daily rates of change of the 7-day moving average between October 16 and November 12, 2020. CDC COVID Data Tracker data were accessed on November 13, 2020.

Letter
Page 15 GAO-21-191
occupancy at essential retail establishments to the lesser of 25 percent of maximum occupancy or 75 customers, among other restrictions.3
The country also continues to experience serious economic repercussions and turmoil as a result of the pandemic. As of October 2020, there were 11 million unemployed individuals, compared to nearly 5.9 million individuals at the beginning of the calendar year.4
In response to this unprecedented global crisis, Congress and the administration have taken a series of actions to protect the health and well-being of Americans. Notably, in March 2020, Congress passed, and the President signed into law, the CARES Act, which provided over $2 trillion in emergency assistance and health care response for individuals, families, and businesses affected by COVID-19.5
The CARES Act includes a provision for us to conduct monitoring and oversight of the federal government’s efforts to prepare for, respond to, and recover from the COVID-19 pandemic.6 We are to report on, among other things, the effect of the pandemic on public health, the economy, and public and private institutions. To date, we have issued four reports in response to this provision, and made 20 recommendations and raised
3 See New Mexico Department of Health, “Public Health Emergency Order Clarifying that Current Guidance Documents, Advisories, and Emergency Public Heal th Orders Remain in Effect; and Amending Prior Public Health Emergency Orders to Provide Additional Temporary Restrictions Due to COVID-19,” November 13, 2020. Accessed at https://cv.nmhealth.org/public-health-orders-and-executive-orders/ on November 15, 2020.
4 Bureau of Labor Statistics, Unemployment Level (UNEMPLOY), retrieved from FRED, Federal Reserve Bank of St. Louis, accessed November 9, 2020, https://fred.stlouisfed.org/series/UNEMPLOY.
5 Pub. L. No. 116-139, 134 Stat. 281 (2020). As of November 12, 2020, three other relief laws were also enacted in response to the COVID-19 pandemic: the Coronavirus Preparedness and Response Supplemental Appropriations Act, 2020, Pub. L. No. 116-123, 134 Stat. 146; Paycheck Protection Program and Health Care Enhan cement Act, Pub. L. No. 116-139, 134 Stat. 620 (2020); and Families First Coronavirus Response Act, Pub. L. No. 116-127, 134 Stat. 178 (2020). In this report, we refer to these four laws, each of which was enacted as of November 12, 2020, and provides supp lemental appropriations for the COVID-19 response, as “COVID-19 relief laws,” and the supplemental funding appropriated by these laws as “COVID-19 relief funds.”
6 Pub. L. No. 116-136, § 19010, 134 Stat. at 579-81.

Letter
Page 16 GAO-21-191
three matters for congressional consideration to improve the federal government’s response efforts.7
This report examines the federal government’s continued efforts to respond to and recover from the COVID-19 pandemic, and makes 11 new recommendations to federal agencies and raises one new matter for congressional consideration. Areas covered include medical supply shortages, COVID-19 testing, COVID-19 vaccines and therapeutics, nursing home care, assistance to individuals and businesses, and program integrity. This report includes 44 enclosures about a range of federal programs and activities across government, including the status of health care and economic indicators that could help monitor the nation’s response to and recovery from the COVID-19 pandemic, as well as its preparedness for future outbreaks (see app. I). Figure 1 lists these enclosures by topic area and highlights those with recommendations.
7 GAO, COVID-19: Federal Efforts Accelerate Vaccine and Therapeutics Development, but More Clarity Needed, GAO-21-207 (Washington D.C.: Nov. 17, 2020); COVID-19: Federal Efforts Could Be Strengthened by Timely and Concerted Actions, GAO-20-701 (Washington, D.C.: Sept. 21, 2020); COVID-19: Brief Update on Initial Federal Response to the Pandemic, GAO-20-708 (Washington, D.C.: Aug. 31, 2020); and COVID-19: Opportunities to Improve Federal Response and Recovery Efforts, GAO-20-625 (Washington, D.C.: June 25, 2020).

Letter
Page 17 GAO-21-191
Figure 1: Report Enclosures by Topic Area
Given the government-wide scope of this report, we undertook a variety of methodologies to complete our work, including examining a wide range of data sources and conducting interviews with federal and state agencies and other entities.8 We examined federal laws, agency documents and
8 We report on appropriations, obligations, and expenditures of government-wide COVID-19 relief funds, including the six largest spending areas. For this financial data, we requested the funding and spending information for the six largest areas as of October 31, 2020, from the applicable agencies. We did not receive all of the necessary information to include in this report; it will be incorporated into our January report. Therefore, we are reporting the amounts as of September 30, 2020.

Letter
Page 18 GAO-21-191
guidance, and published reports and research papers. In each enclosure we include a summary of the methodology specific to the work conducted.
See appendix II for a list of ongoing GAO work related to COVID-19 and appendix III for the status of recommendations made in our June and September 2020 CARES Act reports and in a November 2020 report on vaccines and therapeutics.
A draft of this report was provided to agencies for comment. Summaries of those comments and our response have been included in each enclosure. General comments provided by agencies are reproduced in appendixes IV–XI.
We conducted this performance audit from May 2020 to November 2020 in accordance with generally accepted government auditing standards. Those standards require that we plan and perform the audit to obtain sufficient, appropriate evidence to provide a reasonable basis for our findings and conclusions based on our audit objectives. We believe the evidence obtained provides a reasonable basis for our findings and conclusions based on our audit objectives.
Background
Timeline of Key Congressional and Administrative Actions
In response to the far-reaching public health and economic crisis, Congress and the administration have taken a series of actions. Figure 2 shows selected federal actions taken from January through November 2020.
Letter
Page 19 GAO-21-191
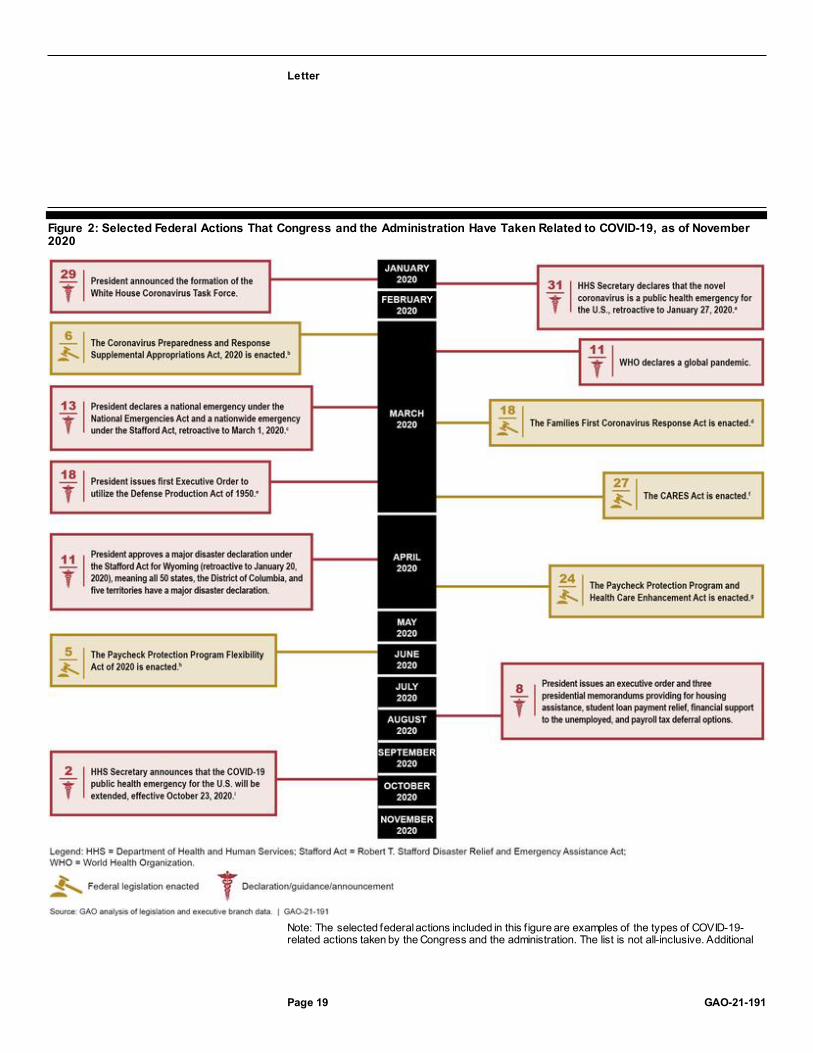
Figure 2: Selected Federal Actions That Congress and the Administration Have Taken Related to COVID-19, as of November 2020
Note: The selected federal actions included in this f igure are examples of the types of COVID-19-related actions taken by the Congress and the administration. The list is not all-inclusive. Additional
Letter
Page 20 GAO-21-191
federal actions, such as the enactment of legislation providing limited and targeted relief to certain individuals and presidential actions authorizing federal support for states and individuals, also occurred during this time frame. aThe Secretary of Health and Human Services may declare a public health emergency if the Secretary determines that (1) a disease or disorder presents a public health emergency or (2) a public health emergency, including signif icant outbreaks of infectious disease or bioterrorist attacks, otherw ise exists. 42 U.S.C. § 247d. bThe Coronavirus Preparedness and Response Supplemental Appropriations Act, 2020 provided $7.8 billion to agencies for health emergency prevention, preparedness, and response activities related to COVID-19, w ith HHS appropriated a majority of the funds. Pub. L. No. 116-123, 134 Stat. 146 (2020). cA declaration under the National Emergencies Act authorizes the President to activate existing emergency authorities in other statutes, and the President must cite the authorities being exercised. 50 U.S.C. § 1621. A governor may request an emergency declaration under the Stafford Act if the situation is of such severity and magnitude that effective response is beyond the capabilities of the state and the affected local governments, and federal assistance is necessary. 42 U.S.C. § 5191. According to the Federal Emergency Management Agency, the President declared a nationw ide emergency pursuant to 42 U.S.C. § 5191(b) to avoid governors needing to request individual emergency declarations. dThe Families First Coronavirus Response Act provided supplemental appropriations for nutrition assistance programs and public health services and authorized the Internal Revenue Service to provide tax credits for paid emergency sick leave and expanded family medical leave that the act requires certain employers to provide. In addition, the act provided states w ith f lexibility to temporarily modify provisions of their unemployment insurance law s and policies related to certain eligibility requirements and provided additional federal f inancial support to the states. Pub. L. No. 116-127, 134 Stat. 178 (2020). eThe Defense Production Act gives the President broad authority to mobilize domestic industry in service of national defense (including programs for certain military activities, homeland security, stockpiling, space, and emergency preparedness activities under the Stafford Act, among other things). 50 U.S.C. § 4501 et seq. fThe CARES Act provided supplemental appropriations for federal agencies to respond to COVID-19. In addition, it also funded various loans, grants, and other forms of assistance for businesses, industries, states, local governments, and hospitals; provided tax rebates for certain individuals; temporarily expanded unemployment benefits; and suspended payments and interest on federal student loans. Pub. L. No. 116-136, 134 Stat 281 (2020). gThe Paycheck Protection Program and Health Care Enhancement Act provided additional appropriations for small business loans, grants to health care providers, and COVID-19 testing. Pub. L. No. 116-139, 134 Stat. 620 (2020). hThe Paycheck Protection Program Flexibility Act of 2020 expanded the amount of time Paycheck Protection Program borrow ers have to use program funds and modif ied several key program components, such as forgiveness eligibility criteria and limits on the use of funds for nonpayroll costs. Pub. L. No. 116-142, 134 Stat. 641. iThe Secretary of Health and Human Services previously announced an extension of the public health emergency on July 23, 2020.
Federal COVID19 Funding and Spending
As of September 30, 2020, about $2.6 trillion had been appropriated to fund response and recovery efforts for—as well as to mitigate the public health, economic, and homeland security effects of—COVID-19.9 As of September 30, 2020, the most recent date for which government-wide 9 An appropriation provides legal authority for federal agencies to incur obligations and make payments out of the U.S. Treasury for specified purposes.

Letter
Page 21 GAO-21-191
information was available at the time of our analysis, the federal government had obligated a total of $1.8 trillion and expended $1.6 trillion of the COVID-19 relief funds as reported by federal agencies to the Department of the Treasury’s (Treasury) Governmentwide Treasury Account Symbol Adjusted Trial Balance System (GTAS).10
The Business Loan Programs, Economic Stabilization and Assistance to Distressed Sectors programs, unemployment insurance, economic impact payments, the Public Health and Social Services Emergency Fund, and the Coronavirus Relief Fund represent $2.2 trillion, or 85 percent, of the total amounts appropriated.11 For these six largest spending areas, agencies reported obligations totaling $1.5 trillion and expenditures totaling $1.4 trillion as of September 30, 2020. Table 1 provides additional details on government-wide COVID-19 relief funds, including the six largest spending areas, appropriations, obligations, and expenditures.12
Table 1: COVID-19 Relief Appropriations, Obligations, and Expenditures, as of September 30, 2020
Major spending area Total appropriationsa ($ billions)
Total obligationsb ($ billions)
Total expendituresb ($ billions)
Business Loan Programs (Small Business Administration)
687.3 540.1 533.7c
Economic Stabilization and Assistance to Distressed Sectors (Department of the Treasury)
500.0 31.8 19.3c
Unemployment Insurance (Department of Labor)
394.3 358.0 345.5
10 An obligation is a definite commitment that creates a legal liability of the U.S. government for the payment of goods and services ordered or receive d, or a legal duty on the part of the U.S. government that could mature into a legal liability by virtue of actions on the part of the other party beyond the control of the U.S. government. An expenditure is the actual spending of money, or an outlay. Expenditures include some estimates, such as estimated subsidy costs for direct loans and loan guarantees. Increased spending in Medicaid is not accounted for in the appropriations provided by the COVID-19 relief laws. Federal agencies use GTAS to report proprietary financial reporting and budgetary execution information to Treasury. Federal agency certified information was obtained from GTAS on November 6, 2020.
11 The Small Business Administration’s Business Loan Program account includes activity for the Paycheck Protection Program and certain loan subsidies.
12 We requested the funding and spending information for the six largest areas as of October 31, 2020, from the applicable agencies. We did not receive all of the necessary information to include in this report; it will be incorporated into our January report. Therefore, we are reporting the amounts as of September 30, 2020.

Letter
Page 22 GAO-21-191
Major spending area Total appropriationsa ($ billions)
Total obligationsb ($ billions)
Total expendituresb ($ billions)
Economic Impact Payments (Department of the Treasury)
282.0 274.7 274.7
Public Health and Social Services Emergency Fund (Department of Health and Human Services)
231.7 141.7 108.1
Coronavirus Relief Fund (Department of the Treasury)
150.0 150.0 149.5
Other Areas 388.3 294.1 191.4 Totald 2,633.6 1,790.4 1,622.1
Source: GAO analysis of data from the Department of the Treasury and applicable agencies. | GAO-21-191 aCOVID-19 relief appropriations reflect amounts appropriated under the Coronavirus Preparedness and Response Supplemental Appropriations Act, 2020, Pub. L. No. 116-123, 134 Stat. 146; Families First Coronavirus Response Act, Pub. L. No. 116-127, 134 Stat. 178 (2020); CARES Act, Pub. L. No. 116-136, 134 Stat. 281 (2020); and Paycheck Protection Program and Health Care Enhancement Act, Pub. L. No. 116-139, 134 Stat. 620 (2020). These data are based on appropriations w arrant information provided by the Department of the Treasury as of September 30, 2020. These amounts could increase in the future for programs with indefinite appropriations, which are appropriations that, at the time of enactment, are for an unspecif ied amount. In addition, this table does not represent transfers of funds that federal agencies may make betw een appropriation accounts or transfers of funds they may make to other agencies. bObligation and expenditure data are based on data reported by applicable agencies. cThese expenditures relate to the loan subsidy costs (the loan’s estimated long-term costs to the United States government). dThe sum of amounts may not agree due to rounding.
Executive Summary
Overview
COVID-19 continues to take a devastating toll on the U.S. According to federal data, the U.S. had about 10,314,000 cumulative reported cases and 224,000 reported deaths as of November 12, 2020. According to data from CDC’s National Center for Health Statistics, at least 237,000 more deaths occurred from all causes (COVID-19 and other causes) than would be normally expected between January and October 2020,

Letter
Page 23 GAO-21-191
highlighting the effect of the pandemic on U.S. mortality (see fig. 3).13
Further, preliminary research suggests that individuals who have had COVID-19, including those who have been hospitalized, may suffer long-term health outcomes, such as heart, brain, or lung abnormalities.
Figure 3: Higher-Than-Expected Weekly Mortality, January to October 2020
Note: The f igure shows the number of deaths from all causes in a given w eek through October 10, 2020, reported in the U.S. that exceeded the upper bound threshold of expected deaths calculated by CDC’s National Center for Health Statistics on the basis of variation in mortality experienced in prior years. See CDC’s National Center for Health Statistics w ebpage on excess deaths for further details on how CDC estimates this upper bound threshold: https://www.cdc.gov/nchs/nvss/vsrr/covid19/excess_deaths.htm, accessed on November 9, 2020. The number of deaths in recent w eeks should be interpreted cautiously as this f igure relies on provisional data that are generally less complete.
While the national economy has improved since July 2020, employment remains substantially lower than before the pandemic. Among the unemployed, the number of individuals on temporary layoff decreased considerably from 18.1 million in April 2020 to 3.2 million in October 2020, but the number of unemployed individuals permanently losing jobs increased from 2.0 million in April 2020 to 3.7 million in October 2020 (see fig. 4). Additionally, our review of academic studies suggests that the
13 On October 20, 2020, CDC released an article in its Morbidity and Mortality Weekly Report that estimated 299,028 more deaths than would be expected between January 26, 2020, and October 3, 2020. According to CDC, two-thirds of those deaths were attributable to COVID-19. While the Morbidity and Mortality Weekly Report reported excess deaths as the difference between observed deaths and the expected number of deaths, we reported a more conservative estimate, the difference between observed deaths and the upper bound (95 percent confidence interval) of the expected deaths. See L.M. Rossen et al., “Excess Deaths Associated with COVID-19—by Age and Race and Ethnicity—United States, January 26–October 3, 2020,” Morbidity and Mortality Weekly Report, vol. 69, no. 42 (2020).

Letter
Page 24 GAO-21-191
pandemic will likely remain a significant obstacle to more robust economic activity. These studies consistently found that a decline in consumer demand related to COVID-19 concerns played a large role in reducing economic activity during the initial stages of the pandemic. We found some evidence based on these studies that economic activity tended to drop more significantly when the number of local COVID-19 cases and deaths increased. Our review of these studies also suggests that the initial reopening of nonessential businesses and lifting of stay-at-home orders likely had only a small effect on economic activity.
Figure 4: Number of Unemployed Workers Permanently Losing Jobs and on Temporary Layoff, January 2019 through October 2020
Note: The total number of w orkers losing jobs excludes individuals w ho completed temporary jobs but w ere not on “temporary layoff,” defined as people w ho have been given a date to return to w ork or w ho expect to return to w ork within 6 months.
To date, we have made 20 recommendations and raised three matters for congressional consideration to improve the federal government’s response efforts.14 Most recently, our November 17, 2020, report on COVID-19 vaccines and therapeutics included a recommendation for the Food and Drug Administration (FDA) to uniformly disclose information from its review of safety and effectiveness data to the public when issuing emergency use authorizations for therapeutics and vaccines.
In this report, we are making 11 new recommendations and raising one matter for congressional consideration to address additional areas where
14 See GAO-20-701, GAO-20-625, and GAO-21-207.
Letter
Page 25 GAO-21-191
significant challenges or risks remain or where the federal government’s response efforts could be improved. Below we provide details on our new and previous recommendations and matters for congressional consideration in areas throughout the federal government.
Medical Supply Shortages
The U.S. continues to face shortages of personal protective equipment (PPE), testing supplies, and other medical supplies needed for the COVID-19 pandemic. In September 2020, we reported on plans by the Department of Health and Human Services (HHS) to restructure the Strategic National Stockpile (SNS), including efforts to build a 90-day supply of certain key items. We also reported on progress HHS has made in meeting its goal of building a 90-day supply to prepare for potential surges in COVID-19 cases, and plans to add some materials, such as testing supplies, that had not been held in the stockpile prior to COVID-19. However, the continued need for supplies by state, tribal, and territorial governments, as well as point-of-care providers, such as nursing homes, combined with continued supply chain constraints may present challenges to HHS in achieving its goal of building a 90-day supply by the end of 2020.
Our October 2020 survey of senior state and territorial health and emergency management officials found that states and territories continue to report limitations in the availability of certain medical supplies, such as nitrile gloves and reagents used for COVID-19 testing. From October 10 through October 21, 2020, we fielded a survey to senior public health and emergency management officials in the 50 states; Washington, D.C.; and the five U.S. territories to gain their perspectives on the availability of PPE, testing, and vaccine administration supplies.15
We received 47 survey responses representing 41 states; Washington, D.C.; and all five territories. Key findings from our nationwide survey are detailed below.
· States are fulfilling PPE requests, but supplies of some PPE remain constrained. The majority of states that responded to our survey received requests for supplies from organizations and entities within their states, and were mainly able to fulfill them. However, availability
15 We also asked about supply availability within the 30 days preceding the survey, as well as projected availability over the 60 days following the survey. The survey also contained questions designed to obtain senior state officials’ perspectives on working with the federal government to meet supply needs.

Letter
Page 26 GAO-21-191
constraints continue with certain PPE, such as nitrile gloves. More than half the states reported having obtained supplies from either the commercial market or the Federal Emergency Management Agency (FEMA) in the past 30 days, indicating that states could not completely fulfill requests from supplies they had on hand. Almost three-quarters of states (34) reported having obtained PPE from FEMA, which indicates challenges in procuring these supplies from the commercial market, as states would only request supplies from FEMA when they were unable to meet their needs through the commercial market. States varied in their level of confidence in their ability to fulfill PPE requests they may receive in the 60 days following the survey. For example, 32 states were greatly or completely confident in their ability to fulfill future requests for face shields and goggles. In contrast, about one-third (17) of states were greatly or completely confident in their ability to fulfill future requests for nitrile gloves; 15 states responded that they were only slightly or not at all confident in their ability to fulfill future requests for nitrile gloves (see fig. 5).
Figure 5: Extent of States’ Confidence in Ability to Fulfill Future Requests for Selected Personal Protective Equipment (PPE)
Note: We sent a survey to senior off icials in the public health and/or emergency management departments of all 50 states; Washington, D.C.; and the U.S. territories (American Samoa, Guam, Commonw ealth of the Northern Mariana Islands, Puerto Rico, and the U.S. Virgin Islands), f ielded

Letter
Page 27 GAO-21-191
from October 10 through October 21, 2020. We received responses from 47 of the 56 locations, representing 41 states, Washington D.C., and all f ive territories. Not all states responded to each survey question. For this survey question, w e asked states the extent to w hich they were confident in their ability to fulf ill requests for selected PPE items in the 60 days follow ing the survey. All 47 states responded for all PPE types listed above except for non-surgical masks (46) and boot covers (45).
· Shortages reported for three of five types of testing supplies. About one-third to one-half of the states that responded to our survey reported shortages in three types of testing supplies at their testing sites or laboratories in the 30 days preceding the survey: reagents (21 states), testing instruments (16 states), and rapid point-of-care tests (24 states) (see fig. 6). Similarly, when asked about testing supply availability for the 60 days following the survey, half the states (22) expected shortages in rapid point-of-care tests, and 20 states expected shortages in reagents. This is consistent with our September 2020 report, where we reported that officials in several states we interviewed identified difficulties in acquiring reagents and test kits from the commercial market.
Figure 6: State-Reported Supply Shortages for Testing Sites or Laboratories
Note: We sent a survey to senior off icials in the public health and/or emergency management departments of all 50 states; Washington, D.C.; and the U.S. territories (American Samoa, Guam, Commonw ealth of the Northern Mariana Islands, Puerto Rico, and the U.S. Virgin Islands); f ielded from October 10 through October 21, 2020. We received responses from 47 of the 56 locations, representing 41 states; Washington, D.C.; and all f ive territories. Not all states responded to each survey question. For this survey question, w e asked states whether testing sites or laboratories had experienced shortages of selected testing supplies in the 30 days preceding the survey. Forty -six states responded for all testing supply types listed above.
· Planning for future COVID-19 vaccine supply needs. Most states (38) responding to our survey expressed concerns about having adequate supplies to distribute and administer a future COVID-19 vaccine. In open-ended responses, senior officials from six states stated that they were specifically concerned about the federal
Letter
Page 28 GAO-21-191
government’s ability to supply needles, given reports of shortages; three of those states also reported challenges maintaining supplies of needles for their states’ flu vaccination efforts.
· Working with the federal government to meet supply needs. In September 2020, we reported that state and other nonfederal partners experienced three types of challenges in working with the federal government to meet supply needs: (1) knowing which federal supplies would arrive and when; (2) confirming the right entities received correct and usable supplies when federal programs delivered them directly to local organizations or entities; and (3) determining how to plan and budget for future supply needs. Our survey results indicate that while most states did not report challenges in knowing which supplies would arrive and when, many states continue to experience other types of challenges. Specifically, a majority of states reported experiencing challenges in tracking supplies that were delivered directly to local points of care (26 states); gaining clarity on the state’s share of the cost for supplies already requested and delivered (27 states); and budgeting for future supply needs (40 states).
Given these ongoing supply challenges and the surge in COVID-19 cases, we underscore the critical imperative of implementing our September 2020 recommendations on medical supply shortages. We recommended that (1) HHS, in coordination with FEMA, further develop and communicate to stakeholders plans outlining specific actions the federal government will take to help mitigate remaining medical supply gaps necessary to respond to the remainder of the pandemic; (2) HHS and FEMA help states enhance their ability to track the status of supply requests and plan for supply needs for the remainder of the pandemic response; and (3) HHS, in coordination with FEMA, document roles and responsibilities for supply chain management functions. In November 2020, HHS repeated its disagreement with our recommendations and noted its efforts to meet the needs of states. We continue to monitor the implementation of our recommendations and review the medical supply chain, including pharmaceuticals, supplies for testing, and the management of the SNS.
COVID19 Testing
Testing supply shortages have contributed to delays in turnaround times for testing results, which can in turn exacerbate outbreaks by allowing COVID-19 to spread undetected. In September 2020, we reported on challenges with testing supply availability, and since then we have
Letter
Page 29 GAO-21-191
identified challenges with federal testing strategy and guidance. HHS agencies have taken several key actions to support testing, including procuring tests for long-term care settings and schools, obtaining stakeholder input, and issuing guidance. For example, CDC, the Centers for Medicare & Medicaid Services (CMS), and FDA have issued guidance to assist health departments, medical providers, nursing homes, schools, workplaces, and laboratories, including for implementing and prioritizing testing.
However, CDC testing guidelines have been changed several times over the course of the pandemic, with little scientific explanation of the rationale behind the changes, raising the risk of confusion and eroding trust in important federal partners. We are recommending that HHS ensure that CDC clearly discloses the scientific rationale for any change to testing guidelines at the time the change is made. HHS concurred with our recommendation.
COVID19 Vaccines and Therapeutics
In September 2020, we recommended that HHS, with support from the Department of Defense (DOD), set a time frame for documenting and sharing a national plan for distributing and administering a COVID-19 vaccine, and ensure that the plan is consistent with project planning best practices and outlined vaccine coordination efforts across federal agencies and nonfederal entities. On September 16, 2020, HHS and DOD released a strategy for the distribution and administration of any COVID-19 vaccine, including guidance to assist state, territorial, and local public health programs and their partners plan and operationalize local vaccination response to COVID-19.16 However, representatives of state and local public health officials and health care providers have identified several areas where federal planning efforts needed additional information and assistance, such as the criteria for vaccine allocation to
16 Department of Health and Human Services, Centers for Disease Control and Prevention, COVID-19 Vaccination Program Interim Playbook for Jurisdiction Operations (Washington, D.C.: Sept. 16, 2020) and Department of Defense and Department of Health and Human Services, From the Factory to the Frontlines: The Operation Warp Speed Strategy for Distributing a Vaccine (Washington, D.C.: Sept. 16, 2020). HHS and DOD subsequently released an updated version of CDC’s COVID-19 Vaccination Program Interim Playbook for Jurisdiction Operations on October 29, 2020. See Department of Health and Human Services, Centers for Disease Control and Prevention, COVID -19 Vaccination Program Interim Playbook for Jurisdiction Operations, version 2.0 (Washington, D.C.: Oct. 29, 2020).

Letter
Page 30 GAO-21-191
state and local jurisdictions and the roles and expectations of states in distributing a COVID-19 vaccine. We continue to examine the federal government’s vaccine distribution planning efforts.
More recently, on November 17, 2020, we reported on efforts to develop, manufacture, and distribute COVID-19 vaccines and therapeutics. 17
These efforts include Operation Warp Speed, a partnership between HHS and DOD that aims to accelerate the development, manufacturing, and distribution of COVID-19 vaccines and therapeutics (see fig. 7). The goal of Operation Warp Speed is to produce 300 million doses of a COVID-19 vaccine, with initial doses available by January 2021. As of October 15, 2020, Operation Warp Speed had publicly announced more than $10 billion in obligations for the development and manufacturing of six COVID-19 vaccine candidates, as well as funds for the development and manufacturing of COVID-19 therapeutics.
Figure 7: Operation Warp Speed Timeline for a Potential Vaccine Candidate
Note: An FDA Authorization for Emergency Use (or Emergency Use Authorization) allow s for emergency use of medical products without FDA approval or licensure during a declared emergency, provided certain statutory criteria are met. See 21 U.S.C. § 360bbb-3.
As of November 9, 2020, FDA had approved one therapeutic—remdesivir—and made four available through Emergency Use Authorizations (EUA)—which allows for emergency use of medical products without FDA approval or licensure, provided certain statutory
17 GAO-21-207.

Letter
Page 31 GAO-21-191
criteria are met. 18 However, the evidence to support FDA’s COVID-19 therapeutic authorization decisions has not always been transparent, in part because FDA does not uniformly disclose its scientific review of safety and effectiveness data for EUAs, as it does for approvals of new drugs and biologics. To improve the transparency of, and ensure public trust in, its EUA decisions, we recommended that FDA identify ways to uniformly disclose information from its scientific review of safety and effectiveness data to the public when issuing EUAs for therapeutics and vaccines, and, if necessary, seek authority to do so. HHS neither agreed nor disagreed with the recommendation, but said it shared GAO’s goal of transparency and would explore approaches to achieve this goal.
While no vaccines were available to prevent COVID-19 at the time of our November 17 report on vaccine development and EUAs, several candidates were under development. On November 20, 2020, Pfizer announced in a press release that it submitted an EUA request for its COVID-19 vaccine candidate. On November 16, Moderna announced in a press release that it also planned to submit an EUA request for its candidate.
In addition, DOD has allocated approximately $1.64 billion from the CARES Act for fiscal years 2020 through 2021 to support medical research and development efforts for COVID-19, including vaccines, diagnostics, and therapeutics, through partnerships between military health system components and various academic and commercial partners. In September 2020, DOD announced that it will support clinical trials for an Operation Warp Speed vaccine candidate at five of its military medical treatment facilities. DOD also has five vaccine development projects, three of which could have applications for the general population but are not candidates of Operation Warp Speed. DOD stated that it is producing thousands of doses of one of these vaccine candidates for availability by the end of 2020. DOD noted that the other vaccine projects
18 Under 21 U.S.C. § 360bbb-3, the Secretary of Health and Human Services may declare that circumstances, prescribed by statute, exist justifying the emergency use of certain medical products. Since March 24, 2020, when the Secretary of Health and Human Services declared that circumstances existed justifying emergency use of drugs and biologics during the COVID-19 pandemic, FDA had issued four EUAs for therapeutics as of November 9, 2020: (1) new use for two existing drugs—chloroquine and hydroxychloroquine—on March 28, 2020, (2) new drug—remdesivir—on May 1, 2020, (3) new biologic—COVID-19 convalescent plasma—on August 23, 2020, and (4) another new biologic—bamlanivimab—on November 9, 2020.
Letter
Page 32 GAO-21-191
are being designed to meet DOD’s operational needs, so that, for example, the vaccines can be stored and used in more austere locations.
Nursing Home Care
The health and safety of the 1.4 million elderly or disabled residents in the nation’s more than 15,000 Medicare- and Medicaid-certified nursing homes—who are often in frail health and living in close proximity to one another—has been a particular concern during the COVID-19 pandemic. According to CDC case reporting data, as of October 4, 2020, these nursing homes had cumulatively reported a total of 252,785 resident and 206,052 staff confirmed cases of COVID-19, along with 59,576 resident and 954 staff deaths as a result of the virus—about 29 percent of the total COVID-19 deaths across the U.S. (208,821 on October 4, as reported by CDC).19
In September 2020, we recommended that HHS, in consultation with CMS and CDC, develop a strategy to capture more complete data on confirmed COVID-19 cases and deaths in nursing homes, and clarify the extent to which nursing homes have reported prior data. As of October 23, 2020, no specific actions had been taken by HHS, although the agency indicated that it continues to consider how to implement this recommendation.
We have identified new concerns related to HHS’s response to recommendations made by the Coronavirus Commission on Safety and Quality in Nursing Homes (which we refer to as the Nursing Home Commission). In June 2020, CMS established the Nursing Home Commission to conduct a comprehensive and independent assessment of the response to the COVID-19 pandemic in nursing homes. In September 2020, the Nursing Home Commission made 27 recommendations on topics such as testing, PPE, and visitation.20
19 These numbers are likely underreported because they do not include data for the 818 nursing homes (about 5.3 percent) that did not report COVID -19 data to CDC for the week ending October 4, 2020, or that submitted data that failed data quality assurance checks. Additionally, as we reported in September 2020, CMS does not require nursing homes to report data prior to May 8, 2020; while some nursing homes may have reported such data, the dataset does not currently identify which reported cases and deaths occurred prior to May 8.
20 MITRE, Coronavirus Commission on Safety and Quality in Nursing Homes: Commission Final Report, PRS Release Number 20-2382, September 2020.

Letter
Page 33 GAO-21-191
CMS released a response to the Nursing Home Commission that broadly outlined the actions it has taken to date as part of its response to the COVID-19 pandemic. However, CMS has not fully addressed the Nursing Home Commission’s recommendations, or provided an implementation plan that would allow it to track and report progress toward implementing them. CMS also stated that some of the recommendations are outside its authority and better addressed by other stakeholders. However, as the lead federal agency for nursing home quality and safety, CMS has an important role in coordinating with federal, state, and other long-term care stakeholders, as specified in multiple Nursing Home Commission recommendations.
To better inform its response, and that of other key stakeholders, to COVID-19 in nursing homes, we are recommending that CMS quickly develop a plan that further details how it intends to respond to and implement, as appropriate, the Nursing Home Commission’s recommendations. The plan should (1) include milestones that allow CMS to track and report on the status of each recommendation; (2) identify actions taken and planned, including areas where CMS determined not to take action; and (3) identify areas where CMS could coordinate with other federal and nonfederal entities. HHS neither agreed nor disagreed with our recommendation, and said it would refer to and act upon the Commission’s recommendations, as appropriate.
Additionally, we have identified shortcomings in the Department of Veterans Affairs (VA) inspections of state veterans homes (SVH), which provide nursing home care to more than 20,000 veterans in over 150 facilities. The health and safety of these veterans has been of particular concern because almost half of all veterans in SVHs are aged 85 or older—the age group at the greatest risk for severe illness from COVID-19, according to CDC data.
In March 2020, VA—the federal agency that conducts routine inspections of all SVHs—instructed its contractor to stop inspections of SVHs, which had been conducted in person, due to concerns about COVID-19; as of September 2020, these inspections had not resumed, leaving veterans at risk of receiving poor quality care. Additionally, VA does not collect timely data on the number of COVID-19 cases and deaths occurring at each SVH, and, as a result, cannot monitor and take steps to mitigate the spread of COVID-19 in SVHs. We are recommending that VA (1) develop a plan to ensure inspections of SVHs occur during the pandemic, which may include using in-person, a mix of virtual and in-person, or fully virtual

Letter
Page 34 GAO-21-191
inspections, and (2) collect timely data on COVID-19 cases and deaths in each SVH. VA concurred with both recommendations.
Assistance to Individuals and Businesses
As the pandemic’s economic effects persist, we have identified actions federal agencies could take to help ensure that financial relief for individuals and businesses provided under the CARES Act reaches eligible recipients.
Specifically, the CARES Act included direct payments, or economic impact payments (EIP), for eligible individuals to address financial stress due to the pandemic—up to $1,200 per eligible individual or $2,400 for individuals filing a joint tax return, plus up to $500 per qualifying child.21
We have made three recommendations related to EIPs. In June 2020, we recommended that the Internal Revenue Service (IRS) consider cost-effective options for notifying ineligible recipients on how to return payments. Treasury and IRS have taken steps to implement this recommendation and are considering further actions. For example, IRS has instructions on its website requesting that individuals voluntarily return by mail the appropriate EIP amount sent to a decedent.
In September 2020, we recommended that Treasury, in coordination with IRS, update and refine estimates of eligible recipients who have yet to file for an EIP and share this information with outreach partners to aid in outreach and communications efforts. Treasury and IRS have taken several actions consistent with our recommendations, such as using tax return information to identify individuals that they may be eligible for an EIP. Starting on September 17, 2020, IRS sent a notice to around 9 million individuals who had not received an EIP. On November 10, 2020, IRS and outreach partners launched a final push to encourage non-filers to register to receive an EIP. However, Treasury and IRS are not monitoring the effectiveness of the outreach notices. Further, Treasury and IRS said that they do not plan to track and analyze the outcomes of their EIP notice-mailing strategy until February or March 2021.
The lack of timely analysis deprives Treasury and IRS of data they could use to assess the effectiveness of their notice strategy, and redirect resources as needed to other outreach and communication efforts. We are recommending that Treasury, in coordination with IRS, begin tracking 21 Pub. L. No. 116-136, § 2201, 134 Stat. at 335–340 (codified at 26 U.S.C. § 6428).
Letter
Page 35 GAO-21-191
and publicly reporting the number of individuals who were mailed an EIP notification letter and subsequently filed for and received an EIP, and use that information to inform ongoing outreach and communications efforts. Treasury agreed with our recommendation.
To provide liquidity to businesses during the pandemic, the CARES Act also included tax measures to help businesses, including sole proprietors, receive cash refunds or other reductions to tax obligations.22 Some taxpayers need to file an amended income tax return to take advantage of these provisions; at the same time, IRS faces an increase in mail and paper processing delays due to the pandemic, which may delay the timely processing of this paperwork and issuance of these refunds. In a draft of this report, we recommended that IRS update its temporary procedures for taxpayers to include information on its new electronic filing capability to enable taxpayers to file amended returns and refund claims more effectively. IRS implemented this recommendation prior to the report’s final issuance. However, IRS form instructions were not updated with the new e-file information. As a result, some taxpayers who go directly to the form instructions may not know about the e-file option. We are recommending that IRS also update its form instructions to include information on its new electronic filing capability. IRS agreed with our recommendation.
Further, the federal government should take additional steps to clarify its reporting of the number of individuals claiming unemployment benefits during the COVID-19 pandemic. The CARES Act created three federally funded temporary programs for unemployment insurance (UI)—a federal-state partnership that provides temporary financial assistance to eligible workers who become unemployed through no fault of their own—that expanded UI benefit eligibility and enhanced benefits. As some of these programs approach their scheduled expiration in December 2020, the UI system continues to experience high numbers of claims as a result of the pandemic.
We found that some of the Department of Labor’s (DOL) reporting has improperly presented UI claims counts as the number of individuals claiming benefits, which has complicated efforts to understand how the size of the population being supported has changed during the pandemic and the potential effects of the expiration of CARES Act UI benefits. Each week, DOL publishes the number of weeks of unemployment benefits
22 Pub. L. No. 116-136, §§ 2301–2306, 134 Stat. at 347–359.

Letter
Page 36 GAO-21-191
claimed by individuals in each state during the period, and reports the total count as the number of people claiming benefits nationwide. However, the number of claims has not been an accurate approximation of the number of individuals claiming benefits during the pandemic because of backlogs in processing a historic volume of claims as well as other data issues.
We are recommending that DOL (1) revise its weekly news releases to clarify that in the current unemployment environment, the numbers it reports for weeks of unemployment claimed do not accurately estimate the number of unique individuals claiming benefits and (2) pursue options to report the actual number of distinct individuals claiming benefits, such as by collecting these already available data from states, starting from January 2020 onward. DOL agreed with our first recommendation and partially agreed with our second recommendation. DOL did not agree with the retroactive reporting of the number of distinct individuals claiming UI benefits, in part because state UI programs may face challenges in implementing any new reporting requirements, particularly retroactively. We maintain that DOL should pursue options to report these data retroactively because they are vital to understanding how many individuals are receiving UI benefits, as well as the size of the population supported by the UI system during the pandemic.
Program Integrity
We continue to identify areas to improve program integrity and reduce the risk of improper payments for programs funded by the COVID-19 relief laws now that federal agencies have obligated and expended about half of the $2.6 trillion appropriated for response and recovery efforts. We previously raised one matter for congressional consideration and made two recommendations to federal agencies to improve oversight of key COVID-19 relief programs and reduce improper payments; to date, these recommendations remain open. We again call attention to these critical areas.
· In June 2020, we urged Congress to amend the Social Security Act to explicitly allow the Social Security Administration (SSA) to share its full death data with Treasury for data matching to prevent payments to ineligible individuals. In June 2020, the Senate passed S. 4104, referred to as the Stopping Improper Payments to Deceased People Act. If enacted, the bill would allow SSA to share these data with Treasury’s Bureau of the Fiscal Service to help prevent making improper payments to deceased individuals.

Letter
Page 37 GAO-21-191
· In June 2020, we recommended that the Small Business Administration (SBA) develop and implement plans to identify and respond to risks in the Paycheck Protection Program (PPP) to ensure program integrity, achieve program effectiveness, and address potential fraud. The CARES Act and the Paycheck Protection Program and Health Care Enhancement Act appropriated a total of $670 billion for PPP under SBA’s 7(a) small business lending program.23 Consistent with our recommendation, SBA told us it has developed oversight plans to review PPP loans, but it has not yet provided requested documentation detailing its plans and how it will implement them, such as documents that would allow us to evaluate the efficacy of the reviews in identifying noncompliance and potential fraud. According to SBA and Treasury, SBA’s loan review process will test loans for compliance with program requirements and evaluate the accuracy of PPP borrowers’ self-certifications.
· In September 2020, we recommended that the Office of Management and Budget (OMB), in consultation with Treasury, issue guidance for auditing new and existing COVID-19-related programs, including Coronavirus Relief Fund (CRF) payments, as soon as possible. The CRF is the largest program established in the four COVID-19 relief laws that provides aid to states, the District of Columbia, localities, tribal governments, and U.S. territories. Audits of entities that receive federal funds, including CRF payments, are critical to the federal government’s ability to help safeguard those funds. OMB said that it planned to issue this guidance in mid-November 2020. Delays in issuing this guidance could adversely affect auditors’ ability to issue consistent and timely reports.
In this report, we also identify new concerns about the timely reporting of improper payments for COVID-19 programs. The COVID-19 relief laws appropriated over a trillion dollars that may be spent through newly established programs to fund response and recovery efforts, such as PPP and UI. While the extent and significance of improper payments associated with these funds has not yet been determined, the impact of improper payments, including those that are the result of fraud, could be substantial. We also have concerns about the possibility that improper
23 See Pub. L. No. 116-136, §§ 1102(b), 1107(a)(1), 1112, 134 Stat. at 293, 301; Pub. L. No. 116-139, § 101(a), 134 Stat. at 620.

Letter
Page 38 GAO-21-191
payments could be widespread based on indications of fraud across these programs. For example:
· Eight individuals pleaded guilty to federal charges of defrauding COVID-19 relief programs—including SBA’s PPP and Economic Injury Disaster Loan program, and DOL’s UI program—from March through September 2020. In one case, an individual pleaded guilty to conspiring to defraud the U.S. by applying for 18 separate PPP loans for four shell companies, falsely claiming, among other things, that the businesses had employees and needed the loans to pay employees’ salaries, thereby fraudulently inducing banks to distribute approximately $1.4 million in loans.
· There are 130 individuals facing federal charges related to attempting to defraud these programs.24
· Numerous fraud-related investigations have been initiated by Offices of Inspector General and other law enforcement agencies.25
According to OMB guidance, agencies should complete a risk assessment to determine susceptibility to significant improper payments after the first 12 months of program operations, and such a determination of susceptibility triggers reporting requirements for the following fiscal year.26 Given the rapid timeline of COVID-19 program-related spending, such time lags in assessing risk and developing corrective actions may result in improper payment issues in COVID-19 programs, including those resulting from fraudulent activities, not being identified or addressed until after most or even all funds are disbursed.
24 A charge is merely an allegation, and all defendants are presumed innocent until proven guilty beyond a reasonable doubt in a court of law.
25 In addition, federal hotlines have received numerous complaints from the public alleging potential fraud involving COVID-19 relief funds. For example, the Inspector General for SBA testified on October 1, 2020, that the hotline operated by his office has received tens of thousands of allegations of wrongdoing. Similarly, from March 13, 2020, through September 30, 2020, our hotline—known as FraudNet—received over an estimated 1,000 complaints related to the CARES Act, many of which involve SBA’s PPP and Economic Injury Disaster Loan program.
26 Office of Management and Budget, Appendix C to OMB Circular A-123, Requirements for Payment Integrity Improvement, OMB Memorandum M-18-20 (Washington, D.C.: June 26, 2018).

Letter
Page 39 GAO-21-191
It is especially important for agencies with large appropriated amounts, such as SBA, to expeditiously estimate their improper payments, identify root causes, and develop corrective actions when there are concerns about the possibility of widespread fraud. It is also important that existing programs that have received significant COVID-19 relief funding and have previously reported high estimated improper payment rates, such as the Medicaid program, develop reliable improper payment estimates and corrective action plans.
In addition, previous supplemental appropriations acts that provided for disaster relief related to the 2017 hurricanes and California wildfires required agencies to deem all programs receiving these relief funds that expended more than $10 million in any one fiscal year as “susceptible to significant improper payments.”27 Agencies were therefore required to report improper payment estimates for such programs without the need to conduct a risk assessment. The COVID-19 relief laws did not contain a similar provision.
To hold agencies accountable and increase transparency, we are suggesting that Congress consider, in any future legislation appropriating COVID-19 relief funds, designating all executive agency programs and activities making more than $100 million in payments from COVID-19 relief funds as “susceptible to significant improper payments.”
We are also making two recommendations: (1) OMB should develop and issue guidance directing agencies to include COVID-19 relief funding with associated key risks, such as provisions contained in the CARES Act and other relief legislation that potentially increase the risk of improper payments or changes to existing program eligibility rules, as part of their improper payment estimation methodologies, especially for existing programs that received COVID-19 funding, and (2) SBA should expeditiously estimate improper payments and report estimates and error rates for PPP due to concerns about the possibility that improper payments, including those resulting from fraudulent activity, could be widespread. OMB and SBA neither agreed nor disagreed with our
27 Supplemental Appropriations for Disas ter Relief Requirements Act, 2017, Pub. L. No. 115-56, div. B, 131 Stat. 1129, 1136 (2017), Additional Supplemental Appropriations for Disaster Relief Requirements Act, 2017, Pub. L. No. 115-72, div. A, 131 Stat. 1224, 1224-1229 (2017), and Further Additional Supplemental Appropriations for Disaster Relief Requirements Act, 2018, Pub. L. No. 115-123, div. B, subdiv. 1, 132 Stat. 64, 65-110 (2018).
Letter
Page 40 GAO-21-191
recommendations. SBA stated that it is planning to conduct improper payment testing for the PPP, but has not finalized its plan.
We also identified concerns about efforts to monitor the financial assistance that the CARES Act authorized Treasury to provide to the aviation sector. Treasury’s Payroll Support Program (PSP) provides $32 billion in payroll support payments and loans to help the aviation industry retain its employees.28 The CARES Act requires PSP recipients to report quarterly to Treasury information on their compliance with PSP agreement terms, which include refraining from involuntary furloughs or reductions in pay rates and benefits until September 30, 2020, and certain share buybacks, dividend payments, and other capital distributions until September 30, 2021, among other conditions.29
However, Treasury has not yet completed its plan and guidance to fully describe how it will monitor recipients’ compliance with the terms of this assistance or to take action if noncompliance is found, potentially hindering Treasury’s ability to detect misuse in a timely manner that allows for remediation, such as the use of PSP funds for purposes other than the continuation of employee wages, salaries, and benefits. To ensure program integrity and address potential fraud, we are recommending that Treasury finish developing and implement a compliance monitoring plan that identifies and responds to risks in PSP. Treasury neither agreed nor disagreed with our recommendation, but committed to reviewing additional measures that may further enhance its compliance monitoring and ensure that PSP funds are used as intended.
Additional Matters for Congress and Agency Recommendations
Beyond these six key areas, we also made recommendations and matters for congressional consideration in other areas throughout the federal government in our June 2020 and September 2020 reports on the federal response to COVID-19.
In June 2020, we urged Congress to take action on areas related to aviation preparedness and Medicaid funding to states.
28 See Pub. L. No. 116-136, § 4112, 134 Stat. at 498.
29 Pub. L. No. 116-136, § 4114(a), 134 Stat. at 499.

Letter
Page 41 GAO-21-191
· To limit the spread of communicable disease threats and minimize travel and trade impacts, we recommended that Congress take legislative action to require the Department of Transportation (DOT) to work with relevant agencies and stakeholders, such as HHS, the Department of Homeland Security (DHS), members of the aviation and public health sectors, and international organizations, to develop a national aviation-preparedness plan. We originally made this recommendation to DOT in December 2015.30
In May 2020, the House of Representatives passed H.R. 6800, referred to as the HEROES Act, which would require DOT, in coordination with HHS, DHS, and other appropriate federal departments and agencies, to develop a national aviation preparedness plan. Most recently, in September 2020, the Senate passed S. 3681, Ensuring Health Safety in the Skies Act of 2020, which would require HHS, DHS, and DOT to form a joint task force on air travel during and after the COVID-19 public health emergency, among other provisions. Also, in October 2020, H.R. 8712, National Aviation Preparedness Plan Act of 2020, was introduced. If enacted, this bill would require DOT, in collaboration with DHS, HHS, and other aviation stakeholders, to develop a national plan to prepare the aviation industry for future communicable disease outbreaks. We again urge Congress to take swift action to require a national aviation-preparedness plan, without which the U.S. will not be as prepared to minimize and quickly respond to ongoing and future communicable disease events.
· To help ensure that federal funding is targeted and timely, we urged Congress to use GAO’s Federal Medical Assistance Percentage formula to determine the timing and increase in Federal Medical Assistance Percentage—which determines the amount of federal Medicaid funding provided to states—for any future changes to the current or any future economic downturn. Our past work has found that during economic downturns—when Medicaid enrollment can rise and state economies weaken—the formula, which is based on each state’s per capita income, does not reflect current state economic conditions. No congressional action has been taken to date.
30 GAO, Air Travel and Communicable Disease: Comprehensive Federal Plan Needed for U.S. Aviation System’s Preparedness, GAO-16-127 (Washington, D.C.: Dec. 16, 2015).

Letter
Page 42 GAO-21-191
In September 2020, we made recommendations to CDC, DOD, and DHS regarding their management and oversight of certain COVID-19 response efforts.
· To ensure the successful implementation of CDC’s COVID-19 Response Health Equity Strategy—which aims to reduce disparities in indicators of COVID-19, among other health equity efforts—we recommended that CDC (1) evaluate whether to require the reporting of race and ethnicity information for COVID-19 data and, if so, seek authority from Congress to do so, (2) involve key stakeholders to ensure the complete and consistent collection of demographic data, and (3) ensure its ability to assess the long-term health outcomes of persons with COVID-19, including by race and ethnicity. In response to our recommendations, CDC stated that the agency is committed to having discussions with stakeholders to assess whether having the authority to require states and jurisdictions to report race and ethnicity information for COVID-19 cases would result in improved reporting. CDC also said that it is developing a plan to monitor the long-term health outcomes of persons with COVID-19 by identifying health care surveillance systems that can electronically report health conditions to state and local health departments. We continue to examine CDC and HHS efforts related to COVID-19 indicators and disparities that exist for various populations.
· To ensure state and local school district officials have clear guidance to make decisions about the safety of school buildings and opening schools for in-person instruction, we recommended that CDC ensure that updates to its guidance on schools’ operating status is cogent, clear, and internally consistent. Since September 2020, CDC has made progress in updating its reopening guidance. However, this recommendation remains open as of November 12, 2020 because the guidance remains inconsistent and unclear in places. We continue to review CDC guidance.
· To ensure HHS component agencies involved in supporting the critical health care infrastructure and systems responding to COVID-19 are protected from cybersecurity threats, we recommended that HHS expedite the implementation of our prior recommendations to address cybersecurity weaknesses at its component agencies. FDA, CMS, and CDC have implemented an additional 54 cybersecurity recommendations since September 2020. This brings the total number of implemented cybersecurity recommendations to 404 (of 434)—a 12 percent increase of

Letter
Page 43 GAO-21-191
corrective actions taken to bolster cybersecurity at these agencies.
· To enhance the visibility and proper tracking of contract actions and associated obligations related to COVID-19, we recommended that DOD and DHS revise the National Interest Action (NIA) code memorandum of agreement to, among other things, obtain input from key federal agencies prior to extending or closing an NIA code. In October 2020, DOD and DHS told us that they planned to review and update the memorandum of agreement by the end of calendar year 2020 to include additional details on practices for communicating with other agencies. We maintain that revising the memorandum of agreement is necessary to ensure consistency and increase transparency on extending and closing NIA codes.
Closing As we approach the end of 2020, the federal government must be agile to address the ongoing and evolving challenges and risks associated with the COVID-19 pandemic. Our recommendations identify new opportunities for the federal government to make midcourse corrections to its efforts by improving the communication of pandemic-related guidance and information, the collection and reporting of key public health and economic data, and the oversight and accountability of CARES Act programs. We will continue to monitor the federal government’s response to the COVID-19 pandemic and identify any needed improvements.
We are sending copies of this report to the appropriate congressional committees, the Director of the Office of Management and Budget, the White House Coronavirus Task Force, and other relevant agencies. In addition, the report is available at no charge on the GAO website at https://www.gao.gov.
If you or your staff have any questions about this report, please contact me at (202) 512-5500 or [email protected]. Questions can also be directed to Kate Siggerud, Chief Operating Officer, at (202) 512-5600; A. Nicole Clowers, Managing Director, Health Care, at (202) 512-7114 or [email protected]; or Orice Williams Brown, Managing Director, Congressional Relations, at (202) 512-4400 or [email protected]. Contact points for our Offices of Congressional Relations and Public Affairs may be found on the last page of this report.

Letter
Page 44 GAO-21-191
Gene L. Dodaro Comptroller General of the United States
Letter
Page 45 GAO-21-191
Congressional Addressees
The Honorable Richard C. Shelby Chairman The Honorable Patrick J. Leahy Vice Chairman Committee on Appropriations United States Senate
The Honorable Lamar Alexander Chairman The Honorable Patty Murray Ranking Member Committee on Health, Education, Labor, and Pensions United States Senate
The Honorable Ron Johnson Chairman The Honorable Gary C. Peters Ranking Member Committee on Homeland Security and Governmental Affairs United States Senate
The Honorable Nita M. Lowey Chairwoman The Honorable Kay Granger Ranking Member Committee on Appropriations House of Representatives
The Honorable Frank Pallone, Jr. Chairman The Honorable Greg Walden Republican Leader Committee on Energy and Commerce House of Representatives
The Honorable Bennie Thompson Chairman The Honorable Mike D. Rogers Ranking Member Committee on Homeland Security House of Representatives

Letter
Page 46 GAO-21-191
The Honorable Carolyn B. Maloney Chairwoman The Honorable James R. Comer Ranking Member Committee on Oversight and Reform House of Representatives

Appendix I: Enclosures
Page 47 GAO-21-191
Appendix I: Enclosures Health Care Indicators
Overview of indicators to help guide federal monitoring of the health system’s response, recovery, and preparedness. In our June and August 2020 reports, we outlined eight health care (and related economic) indicators that could help the federal government monitor the status of the U.S. health system’s response to and recovery from the COVID-19 pandemic, as well as its preparedness for future outbreaks.31 For this report, we obtained input from a selection of five experts that we identified in collaboration with the National Academies of Sciences, Engineering, and Medicine (National Academies) with backgrounds in public health (infectious disease and epidemiology), health systems, and health care costs.
We asked each expert a core set of questions to obtain their input on the indicators we previously reported on and on other indicators that should be monitored in the following broad areas: (1) the effects of the pandemic on population health outcomes; (2) the ability of the public health system to help reduce disease transmission; (3) the capacity of the health care system to provide needed care; and (4) the economic effects of the pandemic on the health care sector. In addition, we asked experts to provide input on any limitations associated with such indicators.
All five experts generally agreed that it is important for the federal government to monitor indicators in the broad areas we identified. They also stated that the eight indicators we had previously reported on generally reflect these broad areas and provided considerations regarding their use, limitations, and interpretation. Experts also identified additional indicators for the federal government to monitor to better understand the broad areas we identified. We provide updates to data on indicators we previously reported on in cases where sufficiently reliable data are
31 The health system indicators we reported on in June and August 2020 include higher than expected deaths, COVID-19 test positivity rate (as a measure of testing sufficiency), contact tracing performance, and intensive care unit (ICU) bed availability. The four related economic indicators we reported on included health care employment, health care services portion of personal consumption expenditures, volume of elective procedures, and hospital operating margins.

Appendix I: Enclosures
Page 48 GAO-21-191
available.32 We plan to continue working with additional experts identified by the National Academies to obtain their input on these and other indicators.
Population health effects of COVID-19. Experts recommended tracking indicators of population health outcomes, including two types of mortality measures. First, three experts told us that tracking the total number of deaths specifically attributed to COVID-19 would help the federal government to better understand the direct effect of the pandemic on mortality. However, two experts noted that the insights provided by this measure are constrained by inconsistencies in how COVID-19 cases are identified and counted across different jurisdictions and at different points in time. To varying degrees, the number of reported COVID-19 deaths is likely to be undercounted.33 In total, the Centers for Disease Control and Prevention’s (CDC) National Center of Health Statistics (NCHS) reported that the number of reported COVID-19 deaths was about 219,000 as of November 6, 2020.34
In addition to monitoring COVID-19 deaths, all the experts we met with also recommended monitoring higher than expected deaths. This is an indicator we describe in our August 2020 report that measures mortality from all causes compared to historical norms; it can be used to address the imperfect reporting of COVID-19 deaths. Three experts explained that the number of higher than expected deaths provides insights into the total effect of the pandemic on population health. Specifically, the indicator measures both the direct effect of the pandemic on mortality (i.e., through COVID-19 deaths whether recognized as such or not) and the indirect effect that includes deaths from causes other than COVID-19. As an example of an indirect effect, one expert explained that the number of
32 We took a number of steps to assess the reliability of these data, including reviewing relevant documentation and reviewing prior GAO work. We found that the data we reported on were sufficiently reliable for our purposes.
33 In addition, mortality data are often incomplete due to delays in the reporting of deaths and there are challenges with correctly categorizing the cause of death. R eporting on provisional COVID-19 mortality data from the Centers for Disease Control and Prevention’s National Center for Health Statistics (NCHS) currently lags by an average of 1–2 weeks with a range of 1–8 weeks. NCHS continuously revises provisional death counts as it receives new and updated death certificate data from the states.
34 These data are based on official death certificates. CDC also reports a COVID -19 death count that includes preliminary deaths reported daily by state, local, and territori al health departments.

Appendix I: Enclosures
Page 49 GAO-21-191
deaths due to chronic conditions such as cardiovascular disease and diabetes may be elevated during this pandemic due to the disruption in access to routine, preventative health care services.35 According to data from CDC’s NCHS, at least 237,000 more deaths occurred from all causes (COVID-19 and other causes) than would be normally expected, between January and October 2020.36
Three experts that we spoke with also emphasized the importance of examining these mortality measures over time and by age, race, and ethnicity to assess the burden of COVID-19 deaths across demographic groups.37 For example, two experts noted that examining mortality indicators in relation to the incidence of COVID-19 infections over time would allow officials to understand what proportion of the population may still be vulnerable to infection and death from COVID-19. The same rate of COVID-19 mortality or higher than expected deaths would be more concerning in areas that had not previously experienced a substantial level of COVID-19 cases.
In addition to mortality, three experts suggested monitoring other indicators of disease burden could be beneficial, such as incidence rates of other conditions (compared to historical norms), because mortality indicators alone do not fully capture the effects of the pandemic on population health. For example, there are certain health conditions (e.g., heart attacks, strokes) that can be tracked readily that may occur at higher rates in the absence of routine care due to the disruptions in the health care system resulting from the pandemic. Furthermore, although data are not yet available, three experts noted that some patients with COVID-19 who survive will experience persistent complications of COVID-19 and should be tracked over time to understand the long-term effects and resulting health conditions.
35 Two experts recognized that while disruptions in the health care system have occurred during the pandemic, an increase in telemedicine services has also occurred.
36 This total represents the number of deaths that exceeded the upp er bound threshold of expected deaths as estimated using CDC’s 95 percent confidence interval. See CDC’s National Center for Health Statistics web page on excess deaths for more details on the approach: https://www.cdc.gov/nchs/nvss/vsrr/covid19/excess_deaths.htm, accessed on November 9, 2020.
37 See our COVID-19 Health Disparities enclosure in this report for more information about our analysis of data that demonstrates racial and ethnic disparities for COVID -19 deaths, hospitalizations, and cases.

Appendix I: Enclosures
Page 50 GAO-21-191
Public health system’s ability to help reduce disease transmission. All experts generally suggested tracking indicators that reflect the ability of the public health system to help reduce disease transmission may be helpful in responding to the pandemic. These indicators include the test positivity rate, contact tracing performance, and COVID-19 testing turnaround time. As we previously reported, the proportion of COVID-19 viral tests in a given population that are positive for infection (the positivity rate) is one indicator of the sufficiency of testing.38 To reduce disease transmission, testing must be sufficient to determine the magnitude of the disease. For example, a higher positivity rate could indicate that not enough testing is being conducted to find and isolate infected individuals before they spread the disease further.
The experts described several limitations associated with the calculation and interpretation of positivity rates39:
· Short-term repeated testing. One expert expressed concerns that some states include the results from repeated testing of the same individuals (e.g., college students) over a short period of time to calculate the positivity rate. This expert explained that including results from successive tests in the calculation of positivity rate in this manner could bias the positivity rate toward a lower point if the individuals tested repeatedly are at lower risk for COVID-19 infection.
· Non-standardized data. Two experts also expressed concerns with how the collection of COVID-19 testing data is not standardized across states. As an example, the experts told us that some states combine viral and antibody tests when collecting testing data.
· Interpretation of test positivity rate. One expert emphasized that the positivity rate should be used as a measure of testing sufficiency and not as an indicator of the prevalence of COVID-19 in a community. The reported rate will be affected by the criteria being used to determine who should be tested, which may not include all who might be at risk. For example, if mainly
38 Viral tests provide data on ongoing infections, while antibody tests provide data on prevalence of past infections.
39 We reported in September 2020 that the Department of Health and Human Services (HHS) continues to have challenges in collecting complete and consistent COVID-19 testing data. (For more information about testing data that would be used to calculate positivity rate, see our Testing Guidance enclosure in this report.)

Appendix I: Enclosures
Page 51 GAO-21-191
symptomatic people are tested, then test positivity rates are expected to overestimate the true community prevalence. The proportion is expected to decline as testing expands to include those that are not infected. This expert noted that states often misinterpret the positivity rate as the percentage of the population that is infected with COVID-19 and use this information as a basis for decisions to impose restrictions to contain COVID-19 (e.g., travel restrictions).
In addition to positivity rate, three experts suggested it might be beneficial to monitor contact tracing performance and COVID-19 test turnaround times to gain further insight into the ability of the public health system to help reduce disease transmission. Contact tracing is a process in which trained public health officials attempt to limit disease transmission by identifying infected individuals, notifying their “contacts”—all the people they may have transmitted the disease to—and asking infected individuals and their contacts to quarantine, if appropriate.
Two experts suggested focusing on outcome measures for contact tracing performance, such as the percent of new COVID-19 cases identified among quarantined contacts (of infected individuals). They noted that such measures reflect how effective contact tracing is in helping to reduce disease transmission.40 However, few states publicly report on such indicators.41
To be most effective, the contacts of infected individuals must be rapidly identified and notified. However, two experts noted significant challenges in doing so. One expert said that some infected individuals may not willingly identify their contacts and as a result, contact tracers are unable to notify them about their risk. Another expert told us that notifying identified contacts in a timely manner is unrealistic in areas with a large number of COVID-19 cases.
40 Ideally, most or all new COVID-19 cases would be identified through contact tracing. For this to occur, nearly all COVID-19 cases need to be found and all contacts need to be identified, quarantined, and tested.
41 As we reported in August 2020, CDC has recently begun collecting data on contact tracing measures as a part of one of its cooperative agreements. CDC officials told us the agency plans to use the measures to ensure that cooperative agreement recipients are making progress toward the goals of the agreement. As of September 30, 2020, CDC has collected data for four of the s ix metrics for one month and begun collecting data for the other two metrics, which are reported on a quarterly basis.

Appendix I: Enclosures
Page 52 GAO-21-191
As for test turnaround times, three of the experts proposed monitoring the number of days from specimen collection to reporting of COVID-19 test result as an additional indicator. This is a telling indicator, two experts noted, because infected individuals may not quarantine quickly enough to prevent ongoing community transmission if test results are delayed, limiting the value of the tests. One expert said this measure will likely have more limited applicability in the future as point-of-care tests, which feature rapid results, become more available at provider offices or for patients to use at home.
Health care system’s capacity to provide needed care. The ability of the nation’s health care system to provide needed care during the pandemic is critical to monitor through indicators, our experts generally agreed. Indicators that assess this ability include the proportion of staffed intensive care unit (ICU) beds available to treat patients, other measures of hospital capacity, and the provision of health services unrelated to COVID-19.
In our August 2020 report, we stated that monitoring ICU bed availability over time offers insight on changes in our health care system’s capacity to care for the sickest patients with COVID-19 (i.e., those that may require respiratory support on a ventilator to survive). We have ongoing work examining the quality of hospital data that hospitals report to the Department of Health and Human Services (HHS).42
Three experts suggested examining ICU bed availability geographically because health care resources vary across areas, such as by state or region. The experts also provided insight into some limitations of ICU bed availability:
· ICU bed classification. Two experts noted that this measure can vary based on how hospitals classify their beds. For example, as demand increases, some hospitals may be able to reclassify for the short term some of their non-ICU beds as ICU beds (given available equipment and staffing). While this allows those hospitals to meet the needs of additional patients, it also makes it challenging to determine the ICU bed capacity of those hospitals.
42 As of July 15, 2020, hospitals are to report data on ICU bed availability and other measures directly to the Department of Health and Human Services’s (HHS) Protect system, or states may submit these data on behalf of hospitals to HHS Protect. For ICU bed availability, hospitals are to include in their reports all staffed ICU beds (including staffed overflow and surge ICU beds).
Appendix I: Enclosures
Page 53 GAO-21-191
· Evolving level of importance. Three experts told us that ICU bed availability may not be as valuable of a measure as it was early on in the pandemic given that a growing number of individuals hospitalized for COVID-19 do not require ICU care.
Given such limitations, the experts said it is important to monitor other indicators of hospital capacity in addition to ICU capacity to obtain a more complete understanding of hospital capacity. For example, experts suggested COVID-19 hospitalization rates and hospital bed availability (including ICU beds) as additional indicators.43 One of these experts told us these indicators provide a more complete picture of hospitals’ capacity to provide necessary care for COVID-19 patients given that many do not require ICU care.
In addition, all five experts stated that the federal government should monitor indicators that reflect the capacity of the health care system to provide necessary services unrelated to COVID-19. For example, two experts suggested it may be beneficial to monitor whether individuals are able to receive care unrelated to COVID-19, including care for acute or chronic conditions, such as heart attacks and cancer treatments, and preventive care, such as vaccines for children and mammograms.
Health care sector economic effects of COVID-19. The five experts told us the indicators we identified in our June and August 2020 reports were appropriate to monitor effects of the pandemic on the health care sector of the economy, including hospital operating margin.44
One expert told us that additional information beyond hospital operating margin is needed to more accurately assess the financial condition of hospitals. Hospital operating margins are calculated with revenues and costs related to patient care and do not include revenue from other sources such as income from investments. Specifically, this expert stated that it is valuable to consider additional measures of hospital finances that include revenue from these other sources.
43 One expert told us that COVID-19 hospitalization rates may also be used to measure the burden of COVID-19 on population health.
44 In addition to hospital operating margin, we also reported on health care employment, health care personal consumption expenditures, and volume of elective procedures across settings in our June and August 2020 reports.See our Economic Indicators enclosure in this report, for data on health care employment and health care personal consumption expenditures.

Appendix I: Enclosures
Page 54 GAO-21-191
The expert explained that larger hospitals often have cash reserves from investments and other sources that are set aside for the purposes of emergencies and such reserves are not reflected in their operating margins. Without considering such reserves, hospital operating margins may indicate that some hospitals are in financial distress when they have adequate financial reserves available to make up for losses in revenue from patient care.
Agency Comments
We provided HHS and the Office of Management and Budget (OMB) with a draft of this enclosure. HHS and OMB did not provide comments on this enclosure.
Contact information: Jessica Farb, 202-512-7114, [email protected]
Related GAO Products
COVID-19: Data Quality and Considerations for Modeling and Analysis. GAO-20-635SP. Washington, D.C.: July 30, 2020.
Science & Tech Spotlight: Contact Tracing Apps. GAO-20-666SP. Washington, D.C.: July 28, 2020.
Economic Indicators
The national economy has improved since July 2020 while key areas of the economy we are monitoring had mixed performance, with a slow recovery and weak conditions in some areas. 45 Indicators of access to credit for investment grade corporations, for example, have returned to levels that were typical prior to the pandemic. However, employment remains substantially lower than before the pandemic and more households have become seriously delinquent on mortgage payments during the pandemic. Our review of academic studies suggests that the
45 We identified a number of economic indicators to facilitate ongoing and consistent monitoring of areas of the economy supported by the federal pandemic response. To the extent that federal pandemic responses are effective, we would expect to see improvements in outcomes related to these indicators. However, while trends in these indicators may be suggestive of the effect of provisions of the COVID -19 relief laws over time, those trends will not on their own provide definitive evidence of effectiveness.

Appendix I: Enclosures
Page 55 GAO-21-191
pandemic will likely remain a significant obstacle to more robust economic activity.
Aggregate economic conditions in the U.S. improved in recent months according to the Federal Reserve Bank of New York’s Weekly Economic Index, which combines high-frequency economic data from a wide range of sources. 46 Nevertheless, the index suggests a large drop in economic activity relative to a year ago. Similarly, U.S. gross domestic product rose at a 33.1 percent annual rate in the third quarter of 2020, but remained 2.9 percent lower than a year ago. As we noted in our June 2020 report, the impact of the pandemic on the economy will reduce federal tax revenues while the fiscal response from the COVID-19 relief laws and heightened demands on federal social programs will increase expenditures. Federal debt held by the public increased from $20.6 trillion in July 2020 to $21 trillion in September 2020—growing at a slower rate but over $3 trillion higher than in February 2020—while 3-month Treasury interest rates fell 2 basis points from 0.13 percent to 0.11 percent between July 2020 and September 2020. 47
Both imports to and exports from the U.S. rose in July and August 2020 as the economy continued to recover. Trade in transportation and travel services in August 2020 continued to be substantially below their levels from a year ago. Travel exports in August 2020, for example, were 77 percent lower than in August 2019. Measures of economic and financial stress in advanced and emerging market economies improved in August and were largely unchanged in September and October.
Indicators of areas of the economy supported by the federal pandemic response saw mixed performance, with slow employment growth and some weakening indicators of state and local government finances (see table).
46 Daniel J. Lewis, Karel Mertens, and Jim Stock, U.S. Economic Activity during the Early Weeks of the SARS-Cov-2 Outbreak, Federal Reserve Bank of New York Staff Report No. 920 (April 2020).
47 A basis point is 1/100th of a percentage point. The 3 -month Treasury interest rate is the constant maturity rate from the Federal Reserve’s H.15 Selected Interest Rates release.
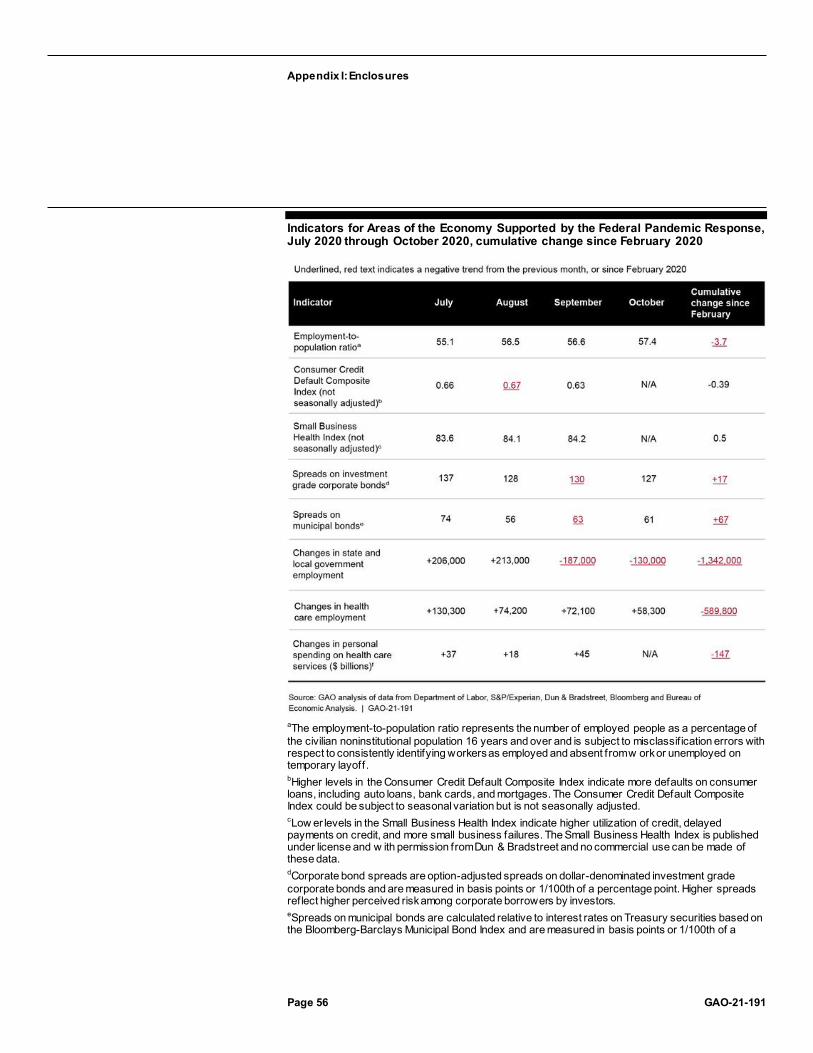
Appendix I: Enclosures
Page 56 GAO-21-191
Indicators for Areas of the Economy Supported by the Federal Pandemic Response, July 2020 through October 2020, cumulative change since February 2020
aThe employment-to-population ratio represents the number of employed people as a percentage of the civilian noninstitutional population 16 years and over and is subject to misclassif ication errors with respect to consistently identifying workers as employed and absent from w ork or unemployed on temporary layoff. bHigher levels in the Consumer Credit Default Composite Index indicate more defaults on consumer loans, including auto loans, bank cards, and mortgages. The Consumer Credit Default Composite Index could be subject to seasonal variation but is not seasonally adjusted. cLow er levels in the Small Business Health Index indicate higher utilization of credit, delayed payments on credit, and more small business failures. The Small Business Health Index is published under license and w ith permission from Dun & Bradstreet and no commercial use can be made of these data. dCorporate bond spreads are option-adjusted spreads on dollar-denominated investment grade corporate bonds and are measured in basis points or 1/100th of a percentage point. Higher spreads reflect higher perceived risk among corporate borrowers by investors. eSpreads on municipal bonds are calculated relative to interest rates on Treasury securities based on the Bloomberg-Barclays Municipal Bond Index and are measured in basis points or 1/100th of a
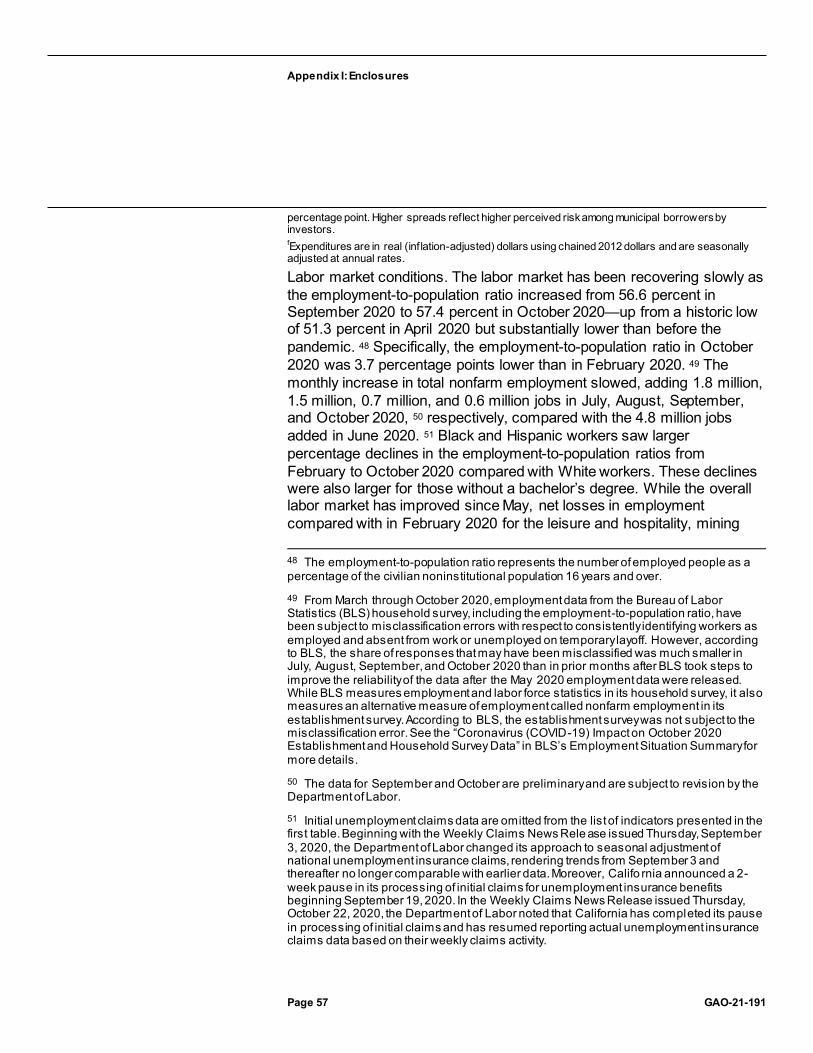
Appendix I: Enclosures
Page 57 GAO-21-191
percentage point. Higher spreads reflect higher perceived risk among municipal borrowers by investors. fExpenditures are in real (inf lation-adjusted) dollars using chained 2012 dollars and are seasonally adjusted at annual rates.
Labor market conditions. The labor market has been recovering slowly as the employment-to-population ratio increased from 56.6 percent in September 2020 to 57.4 percent in October 2020—up from a historic low of 51.3 percent in April 2020 but substantially lower than before the pandemic. 48 Specifically, the employment-to-population ratio in October 2020 was 3.7 percentage points lower than in February 2020. 49 The monthly increase in total nonfarm employment slowed, adding 1.8 million, 1.5 million, 0.7 million, and 0.6 million jobs in July, August, September, and October 2020, 50 respectively, compared with the 4.8 million jobs added in June 2020. 51 Black and Hispanic workers saw larger percentage declines in the employment-to-population ratios from February to October 2020 compared with White workers. These declines were also larger for those without a bachelor’s degree. While the overall labor market has improved since May, net losses in employment compared with in February 2020 for the leisure and hospitality, mining 48 The employment-to-population ratio represents the number of employed people as a percentage of the civilian noninstitutional population 16 years and over.
49 From March through October 2020, employment data from the Bureau of Labor Statistics (BLS) household survey, including the employment-to-population ratio, have been subject to misclassification errors with respect to consistently identifying workers as employed and absent from work or unemployed on temporary layoff. However, according to BLS, the share of responses that may have been misclassified was much smaller in July, August, September, and October 2020 than in prior months after BLS took steps to improve the reliability of the data after the May 2020 employment data were released. While BLS measures employment and labor force statistics in its household survey, it also measures an alternative measure of employment called nonfarm employment in its establishment survey. According to BLS, the establishment survey was not subject to the misclassification error. See the “Coronavirus (COVID-19) Impact on October 2020 Establishment and Household Survey Data” in BLS’s Employment Situation Summary for more details.
50 The data for September and October are preliminary and are subject to revision by the Department of Labor.
51 Initial unemployment claims data are omitted from the list of indicators presented in the first table. Beginning with the Weekly Claims News Rele ase issued Thursday, September 3, 2020, the Department of Labor changed its approach to seasonal adjustment of national unemployment insurance claims, rendering trends from September 3 and thereafter no longer comparable with earlier data. Moreover, Califo rnia announced a 2-week pause in its processing of initial claims for unemployment insurance benefits beginning September 19, 2020. In the Weekly Claims News Release issued Thursday, October 22, 2020, the Department of Labor noted that California has completed its pause in processing of initial claims and has resumed reporting actual unemployment insurance claims data based on their weekly claims activity.

Appendix I: Enclosures
Page 58 GAO-21-191
and logging, and educational services sectors remained substantial (see figure). According to U.S. Bureau of Labor Statistics, employment for the federal government increased in August, reflecting the hiring of temporary 2020 Census workers, and decreased in October, driven by the loss of temporary 2020 Census workers.
Percentage Change in Employment by Sector, February through October 2020
Notes: The data for October are preliminary and are subject to revision by the Department of Labor.
Among the unemployed, the number of individuals on temporary layoff decreased considerably from 18.1 million in April 2020 to 3.2 million in October 2020. However, the number of unemployed individuals permanently losing jobs increased from 2.0 million in April 2020 to 3.7 million in October 2020 (see figure). While workers on temporary layoff expect to return to work, the increase in unemployed workers with permanent job losses could indicate more lasting economic disruption and greater difficulty returning to the labor market.
Appendix I: Enclosures
Page 59 GAO-21-191
Number of Unemployed Workers Permanently Losing Jobs and on Temporary Layoff, January 2019 through October 2020
Note: The total number of w orkers losing jobs excludes individuals w ho completed temporary jobs but w ere not on “temporary layoff,” defined as people w ho have been given a date to return to w ork or w ho expect to return to w ork within 6 months.
Household financial conditions. Serious delinquency rates for single family mortgage loans—loans that are 90 or more days past due or in foreclosure—have increased substantially compared with May 2020 (see figure below), suggesting economic challenges facing homeowners. Serious delinquency rates increased on both conventional loans, specifically those guaranteed by Fannie Mae and Freddie Mac, as well as on loans insured by the Federal Housing Administration (FHA). Increases in delinquencies to some extent reflect borrowers taking advantage of mortgage forbearance provisions of the CARES Act but may also indicate financial challenges facing households. 52 Increases in delinquency rates on FHA loans in particular could indicate that minority and low-income households have experienced more financial hardship since the onset of the pandemic as FHA loans disproportionately serve minority and low-income borrowers. 53
52 The CARES Act provides temporary protections for millions of households against foreclosure and eviction, as well as temporary forbearance on mortgage payments.
53 In fiscal year 2019, for example, 33.6 percent of all FHA purchase and refinance borrowers were minorities and 58.4 percent of FHA forward mortgage borrowers were of low-to-moderate income. U.S. Department of Housing and Urban Development, FHA Annual Management Report Fiscal Year 2019.

Appendix I: Enclosures
Page 60 GAO-21-191
Serious Delinquency Rates on Single-Family Residential Mortgages, January 2019 through August 2020
Note: The serious delinquency rate on conventional loans is calculated based on a w eighted average of serious delinquency rates of conventional loans guaranteed by Fannie Mae and Freddie Mac based on loan counts as of April 2020. Single-family seriously delinquent loans are 3 months or more past due or in the foreclosure process.
The Consumer Credit Default Composite Index—a broad measure of households’ ability to make scheduled payments—improved in September 2020. In addition, subindexes for bank cards and first mortgages improved in September 2020 relative to August 2020, but defaults on auto loans had increased during the same time period. 54
Small business financial and credit conditions. The Small Business Health Index—a broad measure of the financial condition of small businesses
54 The S&P/Experian Consumer Credit Default Composite Index measures the proportion of consumer credit account balances that enter default across auto loans, fi rst and second mortgages, and bank cards each month. Although changes in these indexes over time should provide a general indication of changes in the financial condition of households, forbearance arrangements could affect how delinquencies are reported and therefore the measurement of consumer credit defaults in the near term.

Appendix I: Enclosures
Page 61 GAO-21-191
from Dun & Bradstreet—improved slightly in September 2020. 55 As of September 2020, small businesses in the retail and automotive sectors had deteriorated the most since January 2020, with increases in business failures and growing delinquencies on credit cards driving the changes.
Despite improving financial conditions of small businesses in recent months, more banks have been tightening than loosening underwriting standards on the credit they extend to small businesses through the third quarter of 2020, according to data collected by the Federal Reserve. 56 In addition, more banks have been raising than lowering the premiums they charge small businesses during the same time period. These changes indicate that banks anticipated greater risk associated with making these loans going forward.
Corporate credit market conditions. Spreads on investment grade corporate bonds were largely unchanged in recent months, but remained very close to their prepandemic averages, suggesting that perceived risk among corporate borrowers and access to credit for corporations were similar to levels that were typical during the past few years, prior to the pandemic. 57
State and local government finances. Tax revenue collected by state and local governments in the 2nd quarter of 2020 fell by 20.9 percent relative to the same quarter in 2019, greater than the largest year-over-year decline in state and local tax revenue during the Great Recession, and over 17 percent from the previous quarter (see figure), illustrating the
55 The Small Business Health Index combines information on the timeliness of payments, failure rates, and utilization of credit for a sample of over 10 million active small businesses with fewer than 100 employees. The Small Business Health Index is published under license and permission from Dun & Bradstreet and no commercial use can be made of these data.
56 Survey data from the Senior Loan Officer Opinion Survey, conducted by the Board of Governors of the Federal Reserve System quarterly.
57 Spreads on corporate bonds relative to benchmark interest rates (e.g., Treasury interest rates) measure the premium corporate borrowers must pay to compensate lenders for taking on the risk of loss due to default (risk premium) and for foregoing investments in more liquid assets (liquidity premium). We report spreads on aggregations of dollar-denominated investment grade corporate bonds available via Bloomberg.

Appendix I: Enclosures
Page 62 GAO-21-191
fiscal challenges state and local governments have faced as a result of the COVID-19 pandemic. 58
State and Local Government Tax Revenue, First Quarter 2019 through Second Quarter 2020
Spreads on municipal bonds have improved slightly since July 2020, suggesting that perceived risk among municipal borrowers and access to
58 See Quarterly Summary of State and Local Tax Revenues, Census Bureau. We report year-over-year percentage changes based on nonseasonally adjusted data in order to compare with nonseasonally adjusted data that were available during the Great Recession. We use seasonally adjusted data to compare revenue lost in the second quarter of 2020 relative to data from the previous quarter. State and local governments also faced disruptions in the timing of revenue collections. For example, most states extended their individual income tax filing deadlines to match the federal government’s shift in the deadline for filing federal income tax returns from April 15 to July 15. It is not clear how much of the second quarter decline can be attributed to the delayed tax filing deadline.

Appendix I: Enclosures
Page 63 GAO-21-191
credit for state and local governments have also improved slightly. 59
State and local government employment, a timely measure of fiscal stress facing state and local governments as well as an indicator of the capacity of state and local governments to provide services to the public, increased in August but fell in September and October.
Financial condition of the health care sector. Recovery in health care sector employment continued in October 2020, with over 58,000 jobs added that month. 60 This increase brings the total number of health care jobs regained in the past 6 months to about 988,000, or about 63 percent of the almost 1.6 million jobs lost in March and April 2020 at the start of the COVID-19 pandemic. As of October 2020, health care employment was 4 percent below the February 2020 prepandemic level, with about 590,000 jobs lost.
In May through October 2020, ambulatory health care establishments, such as physicians’ and dentists’ offices, recovered about four-fifths (82 percent) of the more than 1.3 million ambulatory care jobs lost in March and April 2020 and accounted for most of the health care employment gains in October 2020. Hospitals, which lost about 161,000 jobs in April and May 2020, regained almost one-third (31 percent) by October 2020. In contrast, employment in nursing and residential care facilities continued to decline for most of this period. From May through October 2020, these facilities lost about 115,000 jobs, for a total of 238,000 jobs lost since February 2020.
In September 2020, personal consumption expenditures for health care rose for the fifth consecutive month since plummeting in March and April 2020. 61 However, at about $2.1 trillion (annualized), spending remained 6 59 Spreads on municipal bonds relative to benchmark interest rates (e.g., Treasury interest rates) incorporate the favorable tax treatment received by municipal debt and may also reflect any premium state and local borrowers pay to compensate lenders for taking on the risk of loss due to default (risk premium) and for tying up their investment funds for a period of time (liquidity premium). We report spreads calculated based on the Bloomberg Barclays Municipal Bond Index. Spreads are calculated using yield to worst, which results in a conservative—that is, lower—estimate of potential returns on callable bonds.
60 Employment numbers are based on seasonally adjusted data from the Bureau of Labor Statistics Current Employment Statistics Survey of establishments as of November 6, 2020. September and October 2020 data are preliminary.
61 Personal consumption expenditures, a component of the gross domestic product, is the value of goods and services purchased by or on behalf of U.S. residents.

Appendix I: Enclosures
Page 64 GAO-21-191
percent below the February 2020 prepandemic level. 62 While expenditures for outpatient and hospital care began to rebound in May 2020, expenditures for nursing home care have continued to decline every month since April 2020. As of September 2020, expenditures for nursing home care ($141 billion annualized) were 13 percent below February 2020, consistent with persistent job losses in those facilities.
The decline in nursing home care expenditures may reflect reported COVID-19-related deaths among nursing home residents and decreased admissions due to factors including the postponement of nonessential surgeries that require post-acute care and concerns about increased infection risk posed by congregate living facilities. Some individuals in need of rehabilitative or long-term care may have instead opted for home health care, if possible, during this time as personal consumption expenditures for such care have risen every month since May 2020, and in September 2020, at $116 billion (annualized), were 2 percent higher than in February 2020.
Literature on COVID-19 and the economy. To better understand the major drivers of economic activity during the pandemic—including factors that are likely to influence the economic indicators we are monitoring—and the interdependence between the pandemic and the economy, we conducted a review of relevant empirical research. We reviewed research that assessed the potential effect of state and local government mandates, including shelter-in-place orders, and voluntary changes in economic behavior 63 on economic activity during the pandemic. 64
62 Expenditures are in real (inflation-adjusted) dollars using chained (2012) dollars and are seasonally adjusted at annual rates. Expenditure data are from the Bureau of Economic Analysis, as of October 30, 2020.
63 “Voluntary changes” in economic behavior refer to actions taken prior to governm ent mandates or those that individuals would have taken even absent government mandates.
64 We conducted an in-depth review of 20 studies that met our criteria for relevance and methodological rigor. Of those studies, 9 specifically measure demand (e.g., consumer spending on goods and services) or a proxy for demand (e.g., visits to local businesses) and 11 measure mobility in general. We identified a number of data and methodological limitations in the studies we reviewed. For example, data used in these s tudies may only imperfectly measure or capture mobility, the severity of COVID-19, and state and local government policies. Moreover, because of the methods adopted, researchers may have difficulty disentangling any causal relationships that may exist or a ccounting for any spillover effects of state and local government policies. In addition, most of the cited papers had not yet undergone a peer-review process at the time of writing and are subject to revision. Nevertheless, collectively the literature provides useful information on factors influencing the economy during the pandemic.

Appendix I: Enclosures
Page 65 GAO-21-191
While the manner in which the pandemic influences economic activity could change over time, our review of academic studies suggests that the pandemic will likely remain a significant obstacle to more robust economic activity. These studies consistently found that a decline in consumer demand related to concerns about COVID-19 played a large role in reducing economic activity during the initial stages of the pandemic. We found some evidence based on these studies that this reduction was associated with the severity of the pandemic. For example, economic activity tended to drop more significantly when the number of local COVID-19 cases and deaths increased. Finally, our review also suggests that the initial reopening of nonessential businesses and lifting of stay-at-home orders likely had only a small effect on economic activity.
Researchers consistently found that a decline in consumer demand related to concerns about COVID-19 had a significant impact on the economy during the initial stages of the pandemic. Consumers decided to voluntarily postpone or forgo purchases of certain types of goods and services, and reduced visits to businesses, before government stay-at-home mandates 65 went into effect. 66 Similarly, in the studies we reviewed researchers found consistent evidence that the impact of state and local government mandated restrictions further reduced economic
65 Note that closures of nonessential businesses may have gone into effect prior to the stay-at-home mandates in some states. Studies generally use “shelter -in-place” and “stay-at-home” orders interchangeably. In addition to voluntary behavior by consumers, businesses and organizations voluntarily limited, substantially altered, or ceased operations in response to falling demand or in order to reduce the risk of contagion among their employees.
66 Studies analyzing mobility in general–not as a measure of consumer demand–consistently found that the decline in mobility predated the government stay-at-home mandates and government mandated restrictions further reduced mobility already cut back voluntarily by individuals. For example, see James Sears, J. Miguel Villas -Boas, Vasco Villas-Boas, Sofia Berto Villas -Boas, “Are We #Stayinghome to Flatten the Curve?” University of California, Berkeley, Department of Agricultural & Resource Economics, CUDARE Working Papers (2020). See also Hunt Allcott, Levi Boxell, Jacob Conway, Billy Ferguson, Matthew Gentzkow, and Benny Goldman, “Economic and Health Impacts of Social Distancing Policies during the Coronavirus Pandemic,” SSRN working paper (2020).

Appendix I: Enclosures
Page 66 GAO-21-191
activity. 67 For example, using data on foot traffic at individual businesses, one U.S. study found that foot traffic started to drop before the shelter-in-place orders were in place and that shelter-in-place orders further contributed to changes to consumer behavior. 68
Similarly, another U.S. study found that for industries specializing in discretionary goods and services, such as entertainment and restaurants, more than two thirds of the decline in foot traffic was a voluntary response on the part of individuals and was not due to mandated restrictions. 69
One study compared Denmark with Sweden, where both countries were similarly exposed to the pandemic but only Denmark imposed significant restrictions on social and economic activities. The study found that aggregate spending dropped by around 25 percent in Sweden compared with 29 percent in Denmark. 70 Another study found that the drop in restaurant reservations in the U.S. predated the closing of nonessential businesses and that revenues dropped off entirely for Swedish movie
67 There is some evidence that voluntary behavior played a larger role than mandated restrictions in reducing economic activity, based on a number of studies that compared the relative magnitudes of these factors, although the literature does not yet reflect a definitive conclusion on this question. For example, see William Maloney and Temel Taskin, “Determinants of Social Distancing and Economic Activity during Covid -19: A Global View,” Covid Economics, CEPR Press, issue 13 (2020): pp. 157 –177. See also Alexander Bartik, Marianne Bertrand, Feng Lin, Jesse Rothstein and Matt Unrath, “Measuring the Labor Market at the Onset of the COVID-19 Crisis,” NBER Working Paper No. 27613 (2020).
68 Austan Goolsbee and Chad Syverson, “Fear, Lockdown, and Diversion: Comparing Drivers of Pandemic Economic Decline 2020,” NBER Working Paper No. 27432 (2020).
69 Christopher Cronin and William Evans, “Private Precaution and Public Restrictions: What Drives Social Distancing and Industry Foot Traffic in the COVID -19 Era?” NBER Working Paper No. 27531 (2020). Regulations they considered include stay-at-home orders, bans on indoor dining, gatherings of more than 50 people, gyms and entertainment, and public school closures.
70 While the general conclusions from this study are corroborated by U.S.-based studies, social and economic behaviors in response to the pandemic could differ in Denmark and Sweden compared with in the United States. Adam Sheridana, Asger Lau Andersen, Emil Toft Hansen, and Niels Johannesen, “Social Distancing Laws Cause Only Small Losses of Economic Activity during the COVID-19 Pandemic in Scandinavia,” Proceedings of the National Academy of Sciences of the United States of America (PNAS), vol. 117, no. 34, (2020): pp.1-6.

Appendix I: Enclosures
Page 67 GAO-21-191
theaters even though Sweden had no restrictions on nonessential businesses. 71
We found some evidence that falling economic activity in the U.S. was associated with the severity of the pandemic. That is, consumer demand and mobility tended to drop more significantly when the number of local COVID-19 cases and deaths increased. For example, one study found that the first death in a county had a large and statistically significant impact on measures of mobility—typically mobile-phone based measures of how extensively individuals move around—and in most cases, the impact of the first death was larger than the effect of any single policy. 72
Another study found that the decline in consumer visits to businesses was associated with the number of COVID-19 deaths in a county. 73 Finally, using electricity as a proxy for economic activity, one study found that an increase in the number of COVID-19 cases led to a decrease in electricity usage. 74
Studies analyzing consumption and mobility suggest that the initial reopening of nonessential businesses and lifting of stay-at-home orders likely had only a small effect on economic activity. For example, one U.S. study found that consumer spending trended similarly in states that reopened earlier relative to comparable states that reopened later. The authors concluded that governments may have limited capacity to restore economic activity through reopenings, especially if those reopenings are
71 Maloney and Taskin, “Determinants of Social Distancing and Economic Activity during Covid-19: A Global View.”
72 Christopher Cronin and William Evans, “Private Precaution and Public Restrictions: What Drives Social Distancing and Industry Foot Traffic in the COVID -19 Era?” NBER Working Paper No. 27531 (2020). Mobility measures include foot traffic to nonessential retail, essential retail, entertainment, hotel, restaurant, and business services and at home rate. Policies considered include bans on gathering of 50 or more people, restaura nt dine-in bans, bans on the entertainment industry, and public school closures.
73 Goolsbee and Syverson, “Fear, Lockdown, and Diversion: Comparing Drivers of Pandemic Economic Decline 2020.”
74 Sophia Chen, Deniz Igan, Nicola Pierri, and Andrea F. Presbitero, “Tracking the Economic Impact of COVID-19 and Mitigation Policies in Europe and the United States,” IMF Research (2020).
Appendix I: Enclosures
Page 68 GAO-21-191
not interpreted by consumers as a clear signal of reduced health risk. 75
Another U.S. study found that the effect of repealing stay-at-home orders on consumer visits to stores was small. 76 In addition, using real-time customer traffic data to malls in China, one study found that 9 weeks after reopening the economy, mall traffic had only recovered to 64 percent of its level before the outbreak. 77
To better understand how growing economic activity—and attendant social interactions—might influence the pandemic, we also reviewed five studies that examined the relationship between social distancing and the spread of COVID-19. 78 The studies we reviewed highlight some suggestive evidence that increases in social distancing were associated with decreases in the spread of COVID-19. For example, one study of 211 U.S. counties found that a decrease in visits to nonessential businesses was associated with a decrease in overall COVID-19
75 Raj Chetty, John Friedman, Nathaniel Hendren, Michael Stepner, and the Opportunity Insights Team, “The Economic Impacts of COVID-19: Evidence from a New Public Database Built from Private Sector Data,” Working Paper (2020). International Monetary Fund researchers similarly concluded that lifting lockdowns is unlikely to rapidly bring economic activity back to potential if health risks remain. See Francesca Caselli, Francesco Grigoli, Weicheng Lian, and Damiano Sandri, “The Great Lockdown: Dissecting the Economic Effects,” World Economic Outlook Reports, Chapter 2 (2020).
76 Goolsbee and Syverson, “Fear, Lockdown, and Diversion: Comparing Drivers of Pandemic Economic Decline 2020.”
77 Cheng He, Tong Wang, Xiaopeng Luo, Zhenzi Luo, Jiayi Guan, Haojun Gao, Keyan Zhu, Lu Feng, Yuehao Xu, Yuan Cheng, Yu Jeffrey Hu, “Surviving COVID-19: Recovery Curves of Mall Traffic in China,” SSRN Working Paper (2020). Malls in the Hubei province, the epicenter of the Covid-19 in China are excluded.
78 We reviewed five peer-reviewed journal articles of U.S.-based studies, or studies that included U.S.-specific results that we identified in a nonsystematic search of the literature. Social distancing measures included policies enacted or mobility measured by mobile phone data, and COVID spread measures included case and transmission rates. There are several limitations to each of these studies, including potential undercounts of cases due to testing availability, asymptomatic infections, and other limitations (see GAO-20-635SP and GAO-20-701 for a discussion of case and testing data limitations), unmeasured factors that are not accounted for in the analysi s, and accuracy of the mobile phone data and policy enactment information.
Appendix I: Enclosures
Page 69 GAO-21-191
transmission rates. 79 The ways in which economic activity and social interactions might influence the spread of COVID-19 could change over time as public health responses and individual behaviors evolve. Additional research could establish with greater confidence how increasing economic and social activity affect the spread of COVID-19.
Agency Comments
We provided the Department of Commerce (Commerce), the Department of Health and Human Services (HHS), the Department of Housing and Urban Development (HUD), the Department of Labor (Labor), the Department of Treasury (Treasury), the Board of Governors of the Federal Reserve System (Federal Reserve), the Federal Housing Finance Agency (FHFA), and the Office of Management and Budget (OMB) with a draft of this enclosure. FHFA, the Federal Reserve, and Treasury provided technical comments, which we incorporated as appropriate. Commerce, HHS, HUD, Labor, and OMB did not provide comments on this enclosure.
GAO’s Methodology
To identify indicators for monitoring the economy, we reviewed a number of sources, including prior GAO work, releases from federal statistical agencies, data from Fannie Mae and Freddie Mac, information from the Federal Reserve, and relevant federal agencies responsible for the pandemic response and oversight of the health care system, data available on the Bloomberg Terminal, and input from internal GAO experts. We assessed the reliability of the data we intend to use for monitoring and reporting on areas of the economy supported by the federal pandemic response, in particular the COVID-19 relief laws. We took a number of steps to determine the reliability of proposed data sources and indicators, including reviewing relevant documentation, reviewing prior GAO work, and interviewing data providers. Collectively,
79 David Rubin, Jing Huang, Brian T. Fisher, Antonio Gasparrini, Vicky Tam, Lihai Song, XiWang, Jason Kaufman, Kate Fitzpatrick, Arushi Jain, Heather Griffis, Koby Crammer, Jeffrey Morris and Gregory Tasian, “Association of Social Distancing, Population Density, and Temperature with the Instantaneous Reproduction Number of SARS-CoV-2 in Counties Across the United States,” JAMA Network Open, vol. 3, no. 7, e2016099 (2020): pp. 1-12. Decreases in visits to nonessential businesses were measured relative to a 4 -week baseline period from February 10 through March 8, 2020. This study focused on more populous counties that had at least one reported COVID -19 case as of February 25, 2020 and, as such, the findings are not generalizable to smaller, rural counties.

Appendix I: Enclosures
Page 70 GAO-21-191
the indicators were sufficiently reliable to provide a general sense of how these areas of the economy are performing.
For our review of empirical research, we considered studies from COVID-19 economic working paper series published from March 2020 through August 2020, and conducted keyword searches in various databases, including Proquest, EBSCO, Scopus, and DIALOG.80 We started our review of abstracts with over one thousand economic papers related to COVID-19 and selected 59 studies within our scope for further review. We then conducted in-depth reviews and selected empirical academic papers that were retrospective in nature, based on sufficiently reliable data sources and that used rigorous statistical methods. We focused primarily on studies that analyzed the U.S. but also reviewed studies that analyzed countries in Europe and Asia. Ultimately we included 20 studies in our literature review and recorded the studies’ data, methodology, assumptions, key findings, and limitations and used this information to summarize relevant researching findings. We also reviewed five peer reviewed journal articles on the impact of social distancing—U.S.-based studies, or studies that included U.S.-specific results—that we identified in a nonsystematic search of the literature.
Studies included in our literature review
Abouk, R., and B. Heydari. “The Immediate Effect of COVID-19 Policies on Social Distancing Behavior in the United States.” SSRN Working Paper (2020).
Allcott, H., L. Boxell, J. Conway, B. Ferguson, M. Gentzkow, and B. Goldman. “Economic and Health Impacts of Social Distancing Policies during the Coronavirus Pandemic.” SSRN working paper (2020).
Balla-Elliott, D., Z. Cullen, E. Glaeser, M. Luca, and C. Stanton. “Business Reopening Decisions and Demand Forecasts During the COVID-19 Pandemic.” Harvard Business School Working Paper 20-132 (2020).
80 Economic working paper series we considered were from the National Bureau of Economic Research; the Center for Economic and Policy Research; the International Monetary Fund; the IZA Institute of Labor Economics; and the Social Science Research Network. Keywords used include COVID or coronavirus, mobility, reopening, words beginning with “econom,” supply and demand, Google mobility, Apple mobility, Safegraph, and Cuebiq.

Appendix I: Enclosures
Page 71 GAO-21-191
Bartik, A., M. Bertrand, F. Lin, J. Rothstein, and M. Unrath. “Measuring the Labor Market at the Onset of the COVID-19 Crisis.” NBER Working Paper No. 27613 (2020).
Brzezinski, A., G. Deiana, V. Kecht, and D. V. Dijcke. “The COVID-19 Pandemic: Government versus Community Action across the United States.” Covid Economics. CEPR Press. Issue 7 (2020).
Chen, S., D. Igan, N. Pierri, and A. F. Presbitero. “Tracking the Economic Impact of COVID-19 and Mitigation Policies in Europe and the United States.” IMF Research (2020).
Chetty, R., J. Friedman, N. Hendren, M. Stepner, and the Opportunity Insights Team. “The Economic Impacts of COVID-19: Evidence from a New Public Database Built from Private Sector Data.” Working Paper (2020).
Cronin, C., and W. Evans. “Private Precaution and Public Restrictions: What Drives Social Distancing and Industry Foot Traffic in the COVID-19 Era?” NBER Working Paper No. 27531 (2020).
Elenev, V., L. Quintero, A. Rebucci, and E. Simeonova. “Staggered Adoption of Nonpharmaceutical Interventions to Contain COVID-19 across U.S. Counties: Direct and Spillover Effects.” SSRN Working Paper (2020).
Engle, S., J. Stromme, and A. Zhou. “Staying at Home: Mobility Effects of Covid-19.” Covid Economics. CEPR Press. Issue 4 (2020).
Goolsbee, A., and C. Syverson. “Fear, Lockdown, and Diversion: Comparing Drivers of Pandemic Economic Decline 2020.” NBER Working Paper No. 27432 (2020).
Gupta, S., T. Nguyen, F. L. Rojas, S. Raman, B. Lee, A. Bento, K. Simon, and C. Wing. “Tracking Public and Private Responses to the COVID-19 Epidemic: Evidence from State and Local Government Actions.” NBER Working Paper No. 27027 (2020).
Gupta, S., K. Simon, and C. Wing. “Mandated and Voluntary Social Distancing during the COVID-19 Epidemic.” Brookings Papers on Economic Activity. BPEA Conference Drafts (2020).

Appendix I: Enclosures
Page 72 GAO-21-191
He, C., T. Wang, X. Luo, Z. Luo, J. Guan, H. Gao, K. Zhu, L. Feng, Y. Xu, Y. Cheng, and Y. J. Hu. “Surviving COVID-19: Recovery Curves of Mall Traffic in China.” SSRN Working Paper (2020).
Holtz, D., M. Zhao, S. Benzell, C. Cao, M. A. Rahimian, J. Yang, J. Allen, A. Collis, A. Moehring, T. Sowrirajan, D. Ghosh, Y. Zhang, P. S. Dhillon, C. Nicolaides, D. Eckles, and S. Aral. “Interdependence and the Cost of Uncoordinated Responses to COVID-19.” Proceedings of the National Academy of Sciences of the United States of America. (PNAS) (2020).
Maloney, W., and T. Taskin. “Determinants of Social Distancing and Economic Activity during Covid-19: A Global View.” Covid Economics. CEPR Press. Issue 13 (2020): pp. 157 – 177.
Nguyen, T., S. Gupta, M. Andersen, A. Bento, K. Simon, and C. Wing. “Impacts of State Reopening Policy on Human Mobility.” NBER Working Paper No. 27235 (2020).
Porcher, S., and T. Renault. “Social Distancing Beliefs and Human Mobility: Evidence from Twitter.” arXiv: 2008.04826v1 (2020).
Sears, J., J. M. Villas-Boas, V. Villas-Boas, S. B. Villas-Boas. “Are We #Stayinghome to Flatten the Curve?” University of California, Berkeley. Department of Agricultural & Resource Economics. CUDARE Working Papers (2020).
Sheridana, A., A. L. Andersen, E. T. Hansen, and N. Johannesen. “Social Distancing Laws Cause Only Small Losses of Economic Activity during the COVID-19 Pandemic in Scandinavia.” Proceedings of the National Academy of Sciences of the United States of America (PNAS). Vol. 117. No. 34, (2020): pp.1-6.
Contact information: Lawrance L. Evans, Jr., (202) 512-8678, [email protected]
Recent GAO work on COVID-19 data issues
COVID-19: Data Quality and Considerations for Modeling and Analysis. GAO-20-635SP. Washington, D.C.: July 30, 2020.
Appendix I: Enclosures
Page 73 GAO-21-191
Relief for Health Care Providers
To help support health care providers and finance care for COVID-19 patients and underserved populations, the Department of Health and Human Services has disbursed about $101 billion (58 percent) of $175 billion appropriated by COVID-19 relief laws for the Provider Relief Fund, as of September 30, 2020. It also loaned about $106.5 billion to health care providers through a program expanded by the CARES Act.
Entities involved: Department of Health and Human Services, including its Centers for Medicare & Medicaid Services and Health Resources and Services Administration
Key Considerations and Future GAO Work
As the Department of Health and Human Services (HHS) works to get funds to eligible providers, it will continue to be important that robust internal controls are in place to help ensure funds are appropriately disbursed and used, notwithstanding the imperative of a quick federal response to the COVID-19 crisis. We plan to conduct additional work to examine HHS’s efforts to provide assistance to providers.
Background
Provider Relief Fund. To respond to the pandemic, the COVID-19 relief laws appropriated $175 billion to reimburse eligible providers for health-care-related expenses or lost revenues attributable to COVID-19, known as the Provider Relief Fund. Specifically, the CARES Act appropriated $100 billion and the Paycheck Protection Program and Health Care Enhancement Act appropriated an additional $75 billion for the fund.81
The Health Resources and Services Administration (HRSA), within HHS, administers payments from the Provider Relief Fund.
Accelerated and Advance Payments Program. HHS’s Centers for Medicare & Medicaid Services’ (CMS) Accelerated and Advance Payments Program provides loans to providers and suppliers when there is a disruption in claims submission or processing, including during a
81 Pub. L. No. 116-136, div. B, tit. VIII, 134 Stat. 281, 563 (2020); Pub. L. No. 116-139, div. B, tit. I, 134 Stat. 620, 622 (2020).

Appendix I: Enclosures
Page 74 GAO-21-191
public health emergency or a presidentially-declared disaster.82 Section 3719 of the CARES Act authorized the expansion of this program due to the COVID-19 pandemic. Under the expanded program, active Medicare providers and suppliers could apply for loans of up to 100 percent or 125 percent of the Medicare payments they received for a prior 3-month or 6-month period, depending on the type of provider or supplier. On April 26, 2020, CMS announced that provider applications for the Advance Payments Program were discontinued in light of grant payments made available for similar purposes through the Provider Relief Fund. The Accelerated Payments Program was discontinued on October 8, 2020.
Overview of Key Issues
Provider Relief Fund. As of September 30, 2020, HHS had allocated about $145 billion from the Provider Relief Fund, with about $30 billion not yet allocated.83 Of the total allocated ($145 billion), about $101 billion had been disbursed and about $44 billion was yet to be disbursed.84
According to HHS officials, the agency allocated $88 billion for general relief for health care providers and about $56 billion for seven targeted areas. See table below for a summary of Provider Relief Fund allocations and disbursements.
82 The Accelerated Payments Program provides loans to inpatient prospective payment system hospitals, children’s hospitals, cancer hospitals, and critical access hospitals. The Advanced Payments Program provides loans to all other providers and suppliers.
83 HHS uses the term “allocations” to describe the funding amounts it has set aside for particular purposes or for particular types of health care providers.The $145 billion includes the allocation of $0.896 billion for uninsured treatment and $0.142 billion for administration, which are added to the subtotal of general and targeted allocations of $144 billion.
84 The $101 billion includes the disbursement of $0.896 billion for uninsured treatment and $0.009 for administration.

Appendix I: Enclosures
Page 75 GAO-21-191
Summary of the Provider Relief Fund ($175 billion) Allocations and Disbursements, as of September 30, 2020
Description Allocation ($ billions)
Dates of initial disbursement
Disbursement ($ billions)
General distributions: Phase I: Medicare 47.0 April 10, 2020 42.768 General distributions: Phase II: Medicaid and Children’s Health Insurance Program (CHIP) providers
15.0 July 3, 2020 2.249
General distributions: Phase II: dental providers 3.0 July 28, 2020 0.878 General distributions: Phase II: assisted living facilities 3.0 September 25, 2020 0.01 General distributions: Phase III: general distribution 20.0 Subtotal of general distributions 88.0 45.905 Targeted distributions: Rural health care facilities 11.3 May 6, 2020 11.109 Targeted distributions: High-impact hospitals 22.0 May 7, 2020 20.921 Targeted distributions: Skilled nursing facilities 4.9 May 22, 2020 4.772 Targeted distributions: Indian health care providers 0.5 May 29, 2020 0.494 Targeted distributions: Safety net hospitals 13.3 June 12, 2020 13.095 Targeted distributions: Children’s hospitals 1.4 August 20, 2020 0.963 Targeted distributions: Nursing home infection control, quality, and performance
2.5 August 27, 2020 2.469
Subtotal of targeted distributions 55.9 53.823 Subtotal of general and targeted distributions 143.9 99.728 Other: Administration 0.142 0.009 Other: Uninsured treatmenta 0.896 May 15, 2020 0.896 Other: Unallocated funds/uninsured treatmentb 30.1 Total 175.0 100.633
Source: Summary of Health and Human Services funding data. | GAO-21-191 aThe total amount that w ill be allocated for uninsured treatment is unspecif ied. As of September 30, 2020, $0.896 billion had been allocated and disbursed for uninsured treatment. bHealth Resources and Services Administration (HRSA) off icials told us that the amount of unallocated funds/uninsured treatment is available for treatment of the uninsured and for future allocations. HRSA did not specify the amount available for each purpose.
Summary of fund disbursements. As of September 30, 2020, about $101 billion of the approximately $145 billion allocated from the Provider Relief Fund had been disbursed to providers. The amount disbursed was less than the amount allocated because some of the disbursements were in progress and HRSA told us that providers had declined about $5 billion so far from previous disbursements; those funds are available for subsequent allocations. HRSA told us that the returned funds are not reflected in the above table. According to our analysis of information

Appendix I: Enclosures
Page 76 GAO-21-191
provided by HRSA, as of September 30, 2020, HHS had disbursed about $46 billion from general distribution allocations and about $54 billion from the targeted allocations.
Many health systems are structured such that a single health system could be eligible for multiple allocations, such as the rural health disbursement and the skilled nursing disbursements. Consequently, many providers received funds from multiple different allocations. For example, one large health system received payments from 11 of the 13 distribution categories resulting in about $423 million in total payments to this system. A health system in New York received more than $1.2 billion in payments from 8 allocations. Similarly, a community hospital in Indiana received two payments from the general distribution and a rural health distribution which, when combined, amounted to about $5.7 million.
On October 1, 2020, HHS announced it planned to disburse $20 billion in a new general distribution (Phase III) of the Provider Relief Fund. Health care providers eligible to apply for these funds include providers who previously were eligible to receive funding from the Provider Relief Fund, as well as previously ineligible providers, such as those who began practicing in 2020, and an expanded group of behavioral health providers. (See our enclosure on Behavioral Health.) Providers had from October 5, 2020, to November 6, 2020, to apply for the Phase III General Distribution funds.
Provider Relief Fund reporting requirements. According to HRSA guidance issued on October 22, 2020, Provider Relief Fund recipients receiving more than $10,000 will be required to submit documents to substantiate that funds they received were 1) used for increased health care-related expenses or lost revenue attributable to COVID-19 and 2) were not reimbursed from another source.85 Such providers must report use of the funds disbursed in 2020 starting January 15, 2021, with a first reporting deadline on February 15, 2021, and a final deadline of July 31,
85 HRSA initially issued guidance on September 19, 2020, for reporting on the use of Provider Relief Fund distributions. In response to concerns raised, HRSA amende d the reporting instructions on October 22, 2020, to increase flexibility around how providers can apply Provider Relief Fund money toward lost revenues attributable to COVID -19.HRSA told us providers that receive $10,000 or less in the aggregate from the Provider Relief Fund are not required to report. HRSA told us that overall, providers who are subject to the reporting requirement received more than 99 percent of the Provider Relief Fund payments. As of September 21, 2020, about 254,000 providers had received payments of $10,000 or less, for a total of about $730 million. These requirements do not apply to the Nursing Home Infection Control distribution or the Rural Health Clinic Testing distribution.
Appendix I: Enclosures
Page 77 GAO-21-191
2021, for providers who did not fully spend funds prior to December 31, 2020. For all payments received, regardless of the disbursement amount, the provider must abide by the disbursement-specific terms and conditions and be able to meet the Provider Relief Fund reporting requirements that document how the funds were used to meet the Provider Relief Fund statutory mandates. If the provider subsequently determines it cannot meet the terms and conditions for the respective disbursement and/or cannot meet the reporting requirements, the provider must return the funds.
According to the guidance, providers are required to document health care-related expenses attributable to COVID-19 that another source has not reimbursed and is not obligated to reimburse. Payment amounts not fully expended on health care expenses attributable to COVID-19 are then applied to lost revenues, represented as negative changes in year-over-year, actual revenue from patient care-related sources net of health care-related expenses attributable to COVID-19. Recipients may apply Provider Relief Fund payments toward lost revenue, the difference between their 2019 and 2020 actual patient care revenue.
HRSA told us that if a provider received funding but is subsequently identified to be ineligible, such as having been terminated from participation in Medicare, HRSA will send a notification letter (referred to as a Debt Demand letter) to the provider requesting the provider return the Provider Relief Funds. If the provider does not return the funds in response to the Debt Demand letter, then HRSA will refer the debt to the Program Support Center, which has the authority to collect the funds themselves or with the aid of the Department of the Treasury and the Department of Justice.
Accelerated and Advance Payments Program. Under the expanded Accelerated and Advance Payments Program, amended by the CARES Act, CMS made accelerated and advance payments totaling about $106.5 billion as of October 8, 2020. The preponderance of the programs’ loans ($78.4 billion) went to short-stay hospitals. Skilled nursing facilities borrowed $3.2 billion and critical access hospitals, $2.6 billion.86 In total,
86 These figures reflect $100.3 billion in loans that were distributed to providers as of May 8, 2020. See Department of Health and Human Services, Centers for Medicare & Medicaid Services, Medicare Accelerated and Advance Payments State-by-State and by Provider Type, May 8, 2020. On October 8, 2020, CMS announced that it had made additional loans of $6.2 billion, but did not describe the types of providers receiving the new loans. We will follow up on this issue in future work.

Appendix I: Enclosures
Page 78 GAO-21-191
Medicare Part B providers and suppliers received $8.5 billion, about 8 percent of the total amount advanced by CMS. Overall, 25 hospitals or health systems borrowed more than $250 million each. The largest accelerated payment, about $990 million, went to a health care organization based in California.
Initially, recoupment of the accelerated and advance payments, through the offsetting of new Medicare claims, was to begin not more than 120 days after the funds were disbursed and continue for 3 or 8 months, depending on the type of provider or supplier. Thus, recoupment was scheduled to begin in late July 2020. However, the Continuing Appropriations Act, 2021 and Other Extensions Act included a provision that delayed repayment until 1 year after the accelerated or advance payment was made, with recoupment of Medicare payments owed to providers beginning at 25 percent for the first 11 months, and at 50 percent for the following 6 months.87 The provision also allows 29 months from the date of the first payment to a provider or a supplier before requiring the outstanding balance be paid in full.
Agency Comments
We provided HHS and the Office of Management and Budget (OMB) with the draft of this enclosure. HHS provided technical comments on this enclosure, which we incorporated as appropriate. OMB did not provide comments on this enclosure.
GAO’s Methodology
To conduct our work, we examined publicly released HHS information, and obtained information from CMS and HRSA in the form of written responses to questions, documents, and datasets. Our review of the data sources we used provides reasonable assurance of the data’s reliability.
Contact information: James Cosgrove, (202) 512-7114, [email protected]
87 Pub. L. No. 116-159, § 2501, 134 Stat. 709, 733 (2020).

Appendix I: Enclosures
Page 79 GAO-21-191
Nursing Homes
Nursing homes continue to face COVID-19 challenges, including those related to testing, restrictions on nursing home visitors, personal protective equipment shortages, and staffing shortages.
Entities involved: Centers for Disease Control and Prevention and Centers for Medicare & Medicaid Services, both within the Department of Health and Human Services.
Recommendation for Executive Action
We are making the following recommendation to the Administrator of the Centers for Medicare & Medicaid Services:
The Administrator of the Centers for Medicare & Medicaid Services should quickly develop a plan that further details how the agency intends to respond to and implement, as appropriate, the 27 recommendations in the final report of the Coronavirus Commission on Safety and Quality in Nursing Homes, which the Centers for Medicare & Medicaid Services released on September 16, 2020. Such a plan should include milestones that allow the agency to track and report on the status of each recommendation; identify actions taken and planned, including areas where the Centers for Medicare & Medicaid Services determined not to take action; and identify areas where the agency could coordinate with other federal and nonfederal entities.
Key Considerations and Future GAO Work
In September 2020, we recommended that the Secretary of Health and Human Services, in consultation with the Centers for Medicare & Medicaid Services (CMS) and the Centers for Disease Control and Prevention (CDC), develop a strategy to capture more complete data on confirmed COVID-19 cases and deaths in nursing homes retroactively back to January 1, 2020, and to clarify the extent to which nursing homes have reported data before May 8, 2020. We recommended that this strategy to capture more complete data should, to the extent feasible, incorporate information nursing homes previously reported to the CDC or to state or local public health offices.
The Department of Health and Human Services (HHS) partially agreed with this recommendation by noting the value of having complete data,

Appendix I: Enclosures
Page 80 GAO-21-191
but expressed concern about the burden of collecting it. As of October 23, 2020, no specific actions have been taken by HHS, though the department indicated that it continues to consider how to implement this recommendation. We maintain the importance of collecting these data to inform the government’s continued response and recovery, and we believe that HHS could ease the burden by incorporating data previously reported to CDC or to state or local public health offices.
Since September 2020, we have identified new concerns related to the completeness of HHS’s response to the recommendations of the Coronavirus Commission on Safety and Quality in Nursing Homes (which we refer to as the Nursing Home Commission); to CMS’s initiative to provide nursing homes with antigen diagnostic tests for COVID-19, which have been underutilized by nursing homes; and to restrictions on nursing home visitors, which have negatively affected residents’ mental and physical health. In addition, we have ongoing concerns with testing, personal protective equipment (PPE), and staffing shortages in nursing homes that we will continue to examine in future reports. We also have ongoing work on oversight of infection prevention and control and emergency preparedness in nursing homes.
Background
The health and safety of the 1.4 million elderly or disabled residents in the nation’s more than 15,000 Medicare- and Medicaid-certified nursing homes—who are often in frail health and living in close proximity to one another—has been a particular concern during the COVID-19 pandemic.88 CMS, an agency within HHS, is responsible for ensuring that nursing homes meet federal quality standards to participate in the Medicare and Medicaid programs. To monitor compliance with these standards, CMS enters into agreements with state survey agencies in each state government to conduct inspections, including recurring comprehensive standard surveys and as-needed investigations.
Congress appropriated $100 million in the CARES Act for this oversight, and it directed CMS to prioritize the use of funds for nursing home
88 COVID-19 has affected vulnerable populations in other settings beyond nursing homes, including assisted living facilities. However, as the federal role in oversight of nursing homes is more significant than in other settings such as assisted living facilities, the federal response has been more focused on nursing homes.

Appendix I: Enclosures
Page 81 GAO-21-191
facilities in localities with community transmission of COVID-19.89
According to CMS, of this amount, the agency plans to provide state survey agencies approximately $81 million through September 30, 2023, to be used to ensure that all nursing homes receive targeted infection control surveys, among other things.90 According to CMS, it has set aside the remaining $19 million to enhance survey system technology, to fund PPE for federal surveyors, and to implement improvements recommended by the Nursing Home Commission. In addition, HHS announced in May that it would contribute $4.9 billion from the Provider Relief Fund, established with funds provided under the CARES Act, as direct payments to assist nursing homes with responding to COVID-19. In July, HHS announced that it would provide an additional $5 billion from the fund.
In response to the pandemic, HHS, primarily through CMS and CDC, has taken a range of actions to address infection prevention and control in nursing homes, which we reported on in our June and September 2020 reports. These actions include providing guidance and technical assistance to nursing homes to improve infection control practices and shifting to targeted infection control surveys of nursing homes.91
Overview of Key Issues
COVID-19 cases and deaths in nursing homes. According to CDC case-reporting data, as of October 4, 2020, about 91 percent of Medicare- and Medicaid-certified U.S. nursing homes had reported at least one confirmed resident or staff case, and about 46 percent had reported at
89 Pub. L. No. 116-136, div. B, tit. VIII, 134 Stat. 281, 557 (2020).
90 According to CMS, as of August 31, 2020, it has obligated $15 million out of a planned $17 million in fiscal year 2020.
91 Compared to standard surveys, which are comprehensive, targeted infection control surveys use a more streamlined review checklist. According to CMS, this is to minimize the impact on provider activities while ensuring that providers are implementing actions to protect the health and safety of individuals in response to the COVID -19 pandemic.

Appendix I: Enclosures
Page 82 GAO-21-191
least one resident or staff COVID-19 death.92 Also as of October 4, nursing homes had cumulatively reported a total of 252,785 resident and 206,052 staff confirmed cases of COVID-19, along with 59,576 resident and 954 staff deaths as a result of the virus—about 29 percent of the total COVID-19 deaths across the U.S. (208,821 as of October 4, as reported by CDC).
Examining the data over time, for the weeks ending May 31 to October 4, there have been fluctuations in new weekly confirmed cases and deaths, with both decreasing slightly in June, increasing to a peak in the week ending July 26, at 11,872 resident and 11,875 staff confirmed cases, and then gradually decreasing through the end of September.93 (See figure.) Combined nursing home resident and staff deaths from COVID-19, as a percentage of total COVID-19 deaths in the U.S., remained largely unchanged throughout this time period (increasing slightly from about 28 percent on May 31 to about 29 percent on October 4), indicating that the changing weekly COVID-19 death counts in nursing homes paralleled changes in the country as a whole.
92 A confirmed case is defined as having a positive COVID -19 test resulting from a molecular test, a nucleic acid test, or an antigen test, including antigen point of care test results. These numbers are likely underreported because they do not include data for the 818 nursing homes (about 5.3 percent) that did not report COVID -19 data to CDC for the week ending October 4, 2020 or that submitted data that failed data quality assurance checks. Additionally, as we reported in September, CMS does not require nursing homes to report data prior to May 8, 2020; while some nursing homes may have reported such data, the data set does not currently identify which reported cases and deaths occur red prior to May 8. We recommended that the Secretary of Health and Human Services —in consultation with CMS and CDC—develop a strategy to capture more complete data on confirmed COVID-19 cases and deaths in nursing homes retroactively to January 1, 2020.
93 The week ending May 31 is the first single week of data reported to CDC. The only earlier week of data, for the week ending May 24, could potentially include cases and deaths for multiple weeks dating back to January 1, 2020, for those homes which voluntarily reported such data, and is therefore not comparable with data for other weeks.
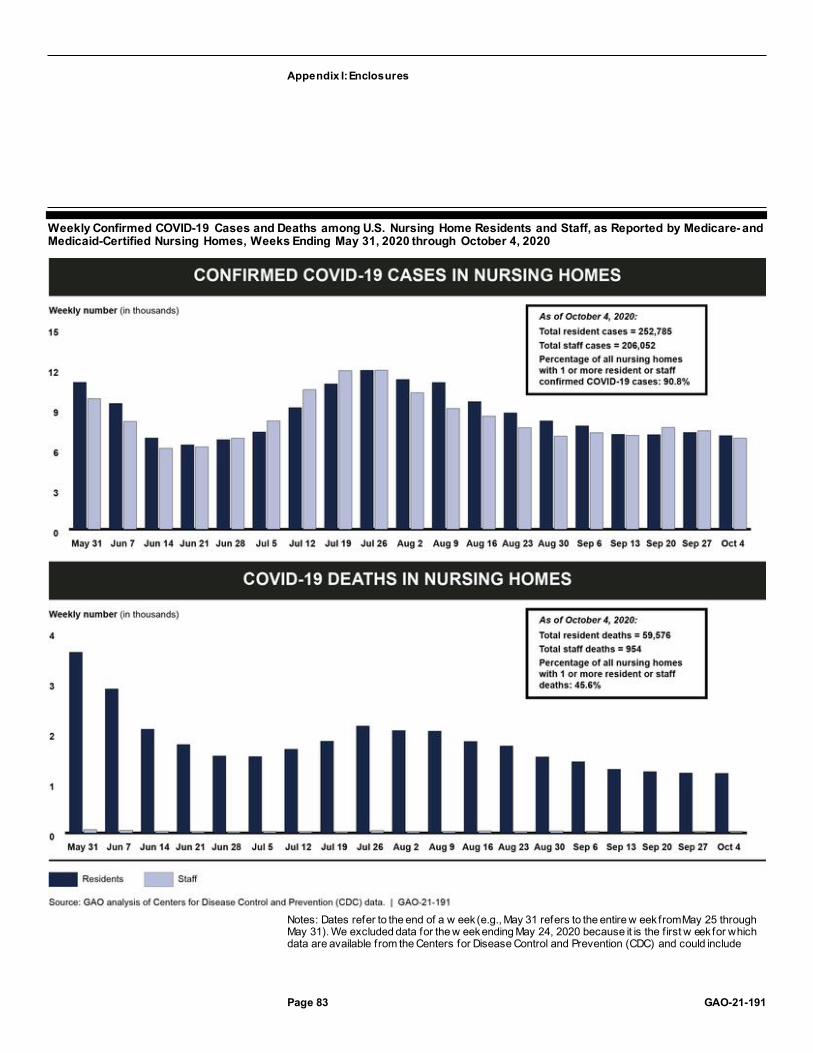
Appendix I: Enclosures
Page 83 GAO-21-191
Weekly Confirmed COVID-19 Cases and Deaths among U.S. Nursing Home Residents and Staff, as Reported by Medicare- and Medicaid-Certified Nursing Homes, Weeks Ending May 31, 2020 through October 4, 2020
Notes: Dates refer to the end of a w eek (e.g., May 31 refers to the entire w eek from May 25 through May 31). We excluded data for the w eek ending May 24, 2020 because it is the f irst w eek for which data are available from the Centers for Disease Control and Prevention (CDC) and could include

Appendix I: Enclosures
Page 84 GAO-21-191
cases and deaths from multiple w eeks dating back to January 1, 2020. Weekly and cumulative case and death counts are likely underreported because they do not include data for the nursing homes that did not report COVID-19 data to CDC for that w eek or from nursing homes that submitted data that failed data quality assurance checks. Additionally, as w e reported in September, the Centers for Medicare & Medicaid Services (CMS) does not require nursing homes to report data prior to May 2020, although nursing homes may do so voluntarily. We recommended that the Secretary of Health and Human Services—in consultation w ith CMS and CDC—develop a strategy to capture more complete data on confirmed COVID-19 cases and deaths in nursing homes retroactively to January 1, 2020.Weekly staff deaths reported for the weeks ending May 31 through October 4 ranged from 19 (w eek ending September 20) to 68 (w eek ending May 31).
Results from required targeted infection control surveys. State survey agencies have been conducting targeted infection control surveys and high-priority complaint investigations in nursing homes rather than traditional comprehensive standard surveys and lower priority complaint investigations since March.94 According to CMS, as of September 30, 2020, 15,351 nursing homes (100 percent) nationwide had received a targeted infection survey or high-priority complaint investigation.
In our review of the survey results, we found that about 5 percent of the nursing homes (742 out of 14,232 homes) receiving targeted infection control surveys or high priority complaint investigations from March 4 through August 31, 2020, had infection control deficiencies.95 Examples of the infection control deficiencies cited included lack of, or incorrect use of, PPE; challenges related to identifying and isolating residents diagnosed with COVID-19; and staffing shortages. About 90 percent of the infection control deficiencies from the targeted infection control surveys were classified by surveyors as not severe, meaning the surveyor determined that residents were not harmed, but the potential for harm existed based on the facility’s practices; nearly all of the remaining deficiencies were classified as presenting immediate jeopardy to resident health or safety. On August 17, CMS authorized traditional comprehensive standard surveys and lower-priority complaint
94 States had until July 31, 2020, to complete the targeted infection surveys in all nursing homes or be subject to corrective action plans and then they had an additional 30 days to complete their surveys to avoid a reduction of their CARES Act supplemental funding. See Department of Health and Human Services, Centers for Medicare & Medicaid Services, COVID-19 Survey Activities, CARES Act Funding, Enhanced Enforcement for Infection Control Deficiencies, and Quality Improvement Activities in Nursing Homes,QSO-20-31-All, (Baltimore, Md.: June 1, 2020).
95 At the time of our review, CMS had posted data on the completion status for targeted infection surveys and high priority complaint investigations by state through October 2, 2020. However, the results of these surveys and complaint investigations were only available through August 31, 2020.

Appendix I: Enclosures
Page 85 GAO-21-191
investigations to resume as soon as state survey agencies have the resources, such as staff and PPE.96
Nursing Home Commission report. In June 2020, CMS announced the establishment of the Nursing Home Commission, consisting of 25 members representing nursing home residents, owners, and administrators; consumer advocates; infectious disease experts; academics; state authorities; and others. The Nursing Home Commission was tasked with conducting a comprehensive and independent assessment of the response to the COVID-19 pandemic in nursing homes and delivering a report to CMS in early fall 2020. CMS has said the purpose of the report is to inform immediate and future responses to COVID-19 in nursing homes. CMS released the Nursing Home Commission’s final report in September 2020, which includes 27 recommendations organized under 10 themes—such as Testing and Screening, Equipment and PPE, and Visitation—that are paired with over 100 specific action steps for CMS.97
CMS released a response to the report broadly outlining the actions that the agency has taken to date as part of its response to the COVID-19 pandemic, but the agency has not provided an implementation plan that would allow it to track and report progress toward the Nursing Home Commission’s recommendations. According to agency officials, the response released on September 16, 2020, represents the majority of the efforts that CMS plans to undertake to address the recommendations. However, as we describe later in this enclosure, CMS has not fully addressed the Nursing Home Commission’s recommendations.
96 See Department of Health and Human Services, Centers for Medicare & Medicaid Services, Enforcement Cases Held During the Prioritization Period and Revised Survey Prioritization,QSO-20-35-ALL, (Baltimore, Md.: Aug. 17, 2020). The August 17 guidance revised survey re-prioritization guidance issued on June 1, which CMS had issued as part of its nursing home reopening strategy. Specifically, the June 1 guidance had authorized state survey agencies to expand beyond conducting targeted infection control surveys and high-priority complaint investigations once a state entered phase 3 —a threshold based on factors including case status in the community and the nursing home, as well as access to testing, PPE, and adequate staffing. See Department of Health and Human Services, Centers for Medicare & Medicaid Services, COVID-19 Survey Activities, CARES Act Funding, Enhanced Enforcement for Infection Control Deficiencies, and Quality Improvement Activities in Nursing Homes, QSO-20-31-ALL, (Baltimore, Md.: June 1, 2020).
97 MITRE, Coronavirus Commission on Safety and Quality in Nursing Homes: Commission Final Report, PRS Release Number 20-2382, September 2020.

Appendix I: Enclosures
Page 86 GAO-21-191
While CMS may not be obligated to implement all of the Commission’s recommendations, the response the agency released does not indicate disagreement with any of the recommendations or indicate areas where the agency does not plan to take action. CMS officials also stated that some of the recommendations are outside of CMS’s authority and would be better addressed by other federal and nonfederal stakeholders. However, as the lead federal agency for nursing home quality and safety, CMS has an important role in coordinating with stakeholders, especially given that the agency established the Nursing Home Commission and that CMS’s role in coordinating with federal, state, and other long-term care stakeholders was directly specified in multiple Nursing Home Commission recommendations.
As we have previously reported, fully implementing agency reform efforts, including efforts to streamline and improve the effectiveness of government operations, requires careful and close management, such as the development of an implementation plan with key milestones and deliverables to track implementation progress.98 Successful reforms require an integrated approach that involves key stakeholders, and it is important for agencies to directly and continuously involve these key stakeholders—such as other federal partners and state and local governments—in the development of reform.
Further, standards for internal control state that management should communicate the necessary quality information externally to achieve the entity’s objectives and address related risks.99 By developing an implementation plan that includes milestones and deliverables, and that tracks and reports the actions taken—including areas where CMS has determined not to take action—on the Nursing Home Commission’s recommendations, CMS could better inform its response, and that of other key stakeholders, to COVID-19 in nursing homes.
Challenges meeting testing requirements. In September 2020, HHS, through CMS, began requiring nursing homes to test all staff and residents for COVID-19 as part of its requirements for the Medicare and
98 GAO, Government Reorganization: Key Questions to Assess Agency Reform Efforts, GAO-18-427 (Washington, D.C.: June 13, 2018).
99 GAO, Standards for Internal Control in the Federal Government, GAO-14-704G (Washington, D.C.: Sept. 10, 2014).

Appendix I: Enclosures
Page 87 GAO-21-191
Medicaid programs.100 According to CDC data, as of October 4, about 52 percent of nursing homes self-reported that they had tested both staff and residents in the prior week, while about 25 percent reported testing staff only and about 3 percent reported testing residents only. The number of nursing homes testing for COVID-19 has increased since the week ending August 16, the first week for which testing data were available, when about 35 percent of nursing homes reported testing both residents and staff in the prior week, about 13 percent reported testing staff only, and about 9 percent reported testing residents only.
For the week ending October 4, about 200 nursing homes (about 1 percent) reported that they would be unable to test all staff or residents within the next week, if needed, due to issues such as a lack of supplies and lack of access to a laboratory. This is an improvement from the week ending August 16, the first week for which testing data were available, when about 1,000 nursing homes (about 7 percent) reported that they would be unable to test all staff within the next week, if needed, and about 900 nursing homes (about 6 percent) reported that they would be unable to test all residents. (For more information on testing for COVID-19, see our COVID-19 Testing Guidance enclosure.)
National provider association officials we interviewed said that some nursing homes were challenged to implement a testing program within the short time frames allowed by the requirements, especially in states that had not previously prioritized testing. Additionally, provider association officials and researchers we interviewed expressed concern about
100 Medicare and Medicaid Programs, Clinical Laboratory Improvement Amendments (CLIA), and Patient Protection and Affordable Care Act; Additional Policy and Regulatory Revisions in Response to the COVID-19 Public Health Emergency; 85 Fed. Reg. 54,820 (Sept. 2, 2020) (to be codified at 42 C.F.R. § 483.30(h)).
CMS later released guidance on these testing requirements, noting that nursing homes should prioritize testing staff and residents with symptoms of COVID -19 first, followed by performing testing of all staff and residents in the case of an outbreak, and finally, routine staff testing based on the degree of community spread, ranging from testing staff once a month in counties with low community spread to twice a w eek in counties with high community spread. On September 29, 2020, CMS announced an update to the methodology for determining the level of community spread, adding consideration of the number of tests performed in a county to the existing consideration of a county’s positivity rate. Department of Health and Human Services, Centers for Medicare & Medicaid Services (CMS), CMS Updates COVID-19 Testing Methodology for Nursing Homes (Baltimore, Md.: Sept. 29, 2020), accessed Oct. 1, 2020, https://www.cms.gov/newsroom/press-releases/cms-updates-covid-19-testing-methodology-nursing-homes.
Appendix I: Enclosures
Page 88 GAO-21-191
nursing homes being able to pay for additional testing supplies after using up supplies provided by the federal government and state governments, with officials noting that routine staff testing is not reimbursed by insurance.
Challenges with utilization of HHS tests and testing instruments. Since July 2020, HHS has procured and distributed antigen diagnostic tests and associated point-of-care (POC) testing instruments to nursing homes in COVID-19 hotspots across the country.101 From July through September, the agency distributed two types of antigen POC testing systems, and, as of September 29, 2020, HHS reported that 13,850 nursing homes had received about 14,000 of these testing instruments and approximately 4.9 million associated tests.102 Then, beginning in September, HHS began to distribute a third type of antigen POC testing system to nursing homes. According to HHS, as of the week ending October 17, 2020, over 5.2 million of these tests had been distributed to nursing homes.
Antigen tests are a new development in nursing homes’ ability to test for COVID-19, as molecular tests were the only diagnostic test available for the first months of the pandemic. The antigen tests provided by HHS can produce results within approximately 15 minutes, which can be significantly faster than waiting for results from molecular tests, which rely on polymerase-chain reaction technology and typically must be processed in a laboratory.103 The ability to receive test results in a timely manner is important so that nursing homes can quickly identify and separate residents and staff infected with COVID-19 and limit the spread 101 Antigen tests are an alternative to molecular tests for diagnosing active COVID -19 infections. See our Testing Guidance enclosure in this report.
102 After the initial distribution of these antigen diagnostic tests and instruments, nursing homes are responsible for procuring additional tests directly from the manufacturer. National provider association officials we interviewed told us that nursing homes have not been able to order additional test supplies for one of the two testing systems, explaining that HHS had purchased the company’s entire stockpile. By the week ending October 4, 2020, about 12 percent of the nursing homes that reported having a POC testing machine were reporting that they did not have enough supplies to test all staff or personnel using their POC testing machine.
103 For example, new CDC data show that, between September 21 and October 4, 2020, about 30 percent of nursing homes reported an average time of betw een 3 and 7 days to receive resident test results (33 percent for staff test results), and another 1 percent reported an average time of more than 7 days for both resident and staff test results. CDC guidance for COVID-19 testing in nursing homes states that results should be reported in 24 hours or less in order to facilitate effective interventions, and the CMS testing requirements recommend using laboratories that can report results within 48 hours.

Appendix I: Enclosures
Page 89 GAO-21-191
of the disease. This is particularly true of identifying asymptomatic carriers of the disease, who may show no symptoms. However, there may also be risks associated with the use of antigen testing; according to the Food and Drug Administration (FDA), antigen tests have a higher chance of false negatives compared to molecular tests.104
While the federally provided antigen diagnostic tests and testing instruments could help address nursing homes’ previously noted challenges obtaining testing supplies and receiving results in a timely manner, CDC data indicate that many nursing homes are not yet utilizing these tests and testing instruments. Specifically, as of the week ending October 4, 2020, about 51 percent of nursing homes had reported to CDC that they had ever used a POC test for residents or staff.105 About 15 percent of nursing homes reported that they did not have a POC testing system available, and about 34 percent reported that they had a POC testing system but had not used it to test residents or staff. During the period for which testing data are available, the number of homes that reported ever having tested using the POC testing system was about half the number that reported any form of testing, indicating that many homes doing testing were still relying on molecular testing.106
As we describe in our Testing Guidance enclosure in this report, some stakeholder groups and an expert we interviewed attributed this to confusion about how to use the new antigen tests, especially with regard to interpreting and reporting the results. See our Testing Guidance enclosure for more information.
Challenges with restrictions on nursing home visitors. From March through September 2020, CMS restricted visitors and non-essential health care personnel in nursing homes, except in certain compassionate
104 FDA states that negative antigen test results may need to be confirmed with a molecular test before making treatment decisions.
105 Testing data are available from CDC beginning with the week ending August 16, 2020. Some nursing homes may have used POC testing prior to CDC beginning its collection of testing data.
106 Between the weeks ending August 16, 2020 and October 4, 2020, when asked about COVID-19 testing in general, about 12,400 nursing homes reported testing residents at least once and about 13,800 reported testing staff at least once. By contrast, when asked about POC tests specifically, only about 5,400 nursing homes reported testing residents and about 7,100 reported testing staff.

Appendix I: Enclosures
Page 90 GAO-21-191
care situations, to reduce the transmission of COVID-19.107 According to national association officials and a researcher we interviewed, this restriction of visitors has limited oversight of facilities through the exclusion of resident advocates, such as family members and ombudsmen, and has negatively affected residents’ mental and physical health.108 The Nursing Home Commission made four recommendations related to visitation, including that CMS streamline and consolidate visitation directives, guidance, and resources and help nursing home staff assess and improve residents’ mental health generally, including after the pandemic.
In response to the Nursing Home Commission’s visitation recommendations, CMS pointed to, among other things, its visitation guidance, which was issued on September 17. This new guidance allows nursing homes to resume visitations depending on the degree of community spread and requires that these visitations be conducted according to a nursing home’s structure and resident needs.109 The guidance provides various ways a nursing home can safely facilitate in-person visitation to address the psychosocial needs of residents. For example, it notes that outdoor visits are preferred due to the reduced risk of transmission, recommends limits on the number of visitors, and recommends that visitors be tested for COVID-19 prior to visiting. Although this guidance generally addresses one of the Nursing Home Commission’s four visitation recommendations, including most of the related action steps, more work remains to address the other three recommendations. Additionally, while allowing visitors in nursing homes
107 End-of-life situations are an example of a compassionate care situation. Department of Health and Human Services, Centers for Medicare & Medicaid Services, Guidance for Infection Control and Prevention of Coronavirus Disease 2019 (COVID -19) in Nursing Homes (REVISED), QSO-20-14-NH (Baltimore, Md.: Mar. 13, 2020). On May 18, 2020, CMS issued reopening recommendations for nursing homes that generally prohibited visitation until the nursing home entered phase 3—a threshold based on factors including case status in the community and the nursing home, as well as access to testing, PPE, and adequate staffing. Department of Health and Human Services, Centers for Medicare & Medicaid Services, Nursing Home Reopening Recommendations for State and Local Officials, QSO-20-30-NH, (Baltimore, Md.: May 18, 2020).
108 CMS guidance states that in-person ombudsmen access should be restricted if there are concerns about infection control and transmission of COVID-19, although the guidance also emphasizes that facilities must facilitate resident communication with ombudsmen (e.g., by phone) in cases where in -person access is restricted.
109 Centers for Medicare & Medicaid Services, Nursing Home Visitation—COVID-19, QSO-20-39-NH, (Baltimore, Md.: Sept. 17, 2020).

Appendix I: Enclosures
Page 91 GAO-21-191
will likely have positive impacts on the mental and physical health of nursing home residents, it raises new challenges in light of existing shortages of testing supplies, PPE, and available staff, all of which are needed to ensure that visits are conducted safely.
PPE challenges persist. The percentage of nursing homes experiencing PPE shortages decreased from when we reported in September, but shortages remain an issue.110 According to data nursing homes self-reported to CDC, as of October 4, about 15 percent of nursing homes (a decrease of 7 percentage points) did not have a one-week supply of at least one of the following: N95 respirators, surgical masks, gloves, eye protection, or gowns.111 Of these, N95 respirators were the most needed, with about 12 percent of nursing homes (a decrease of 5 percentage points) reporting they did not have a one-week supply, followed by surgical gowns (about 9 percent of nursing homes, a decrease of 3 percentage points).
This lack of PPE is particularly challenging because nursing home staff are required to wear adequate PPE when collecting specimens for required resident and staff COVID-19 testing, in addition to having adequate supplies of PPE for ongoing resident care. The Nursing Home Commission made three recommendations related to PPE, including that CMS assume responsibility for a collaborative process—with federal, state, local, tribal, and territorial government partners—to ensure that nursing homes can procure and sustain a 3-month supply of high-quality PPE, and that CMS collaborate with other federal and state agencies to provide additional PPE guidance.112
110 Our September report covered data nursing homes self-reported to CDC as of July 26, 2020.
111 As of October 4, 2020, about 6 percent of nursing homes (a decrease of 2 percentage points) reported that they had no remaining supplies of at least one of these types of PPE.
112 CMS’s response to the report notes that, among other things, the Federal Emergency Management Agency (FEMA) provided 14-day supply shipments to nursing homes beginning in April 2020 and that HHS shipped N95 respirators from the Strategic National Stockpile to nursing homes beginning in August 2020. This consisted of sending a 7 -day supply of N95 respirators to about 3,336 nursing homes. However, one-time shipments of 1- to 2-week supplies of PPE do not meet the Nursing Home Commission’s recommendation that CMS help homes to sustain a 3 -month supply of PPE on an ongoing basis. Additionally, as we reported in September, there were concerns about the quality and usability of the PPE supplied by FEMA. CMS told GAO that PPE acquisition is outside the agency’s purview.
Appendix I: Enclosures
Page 92 GAO-21-191
Staffing challenges persist. The percentage of nursing homes experiencing staffing shortages did not improve from when we reported in September.113 According to data nursing homes self-reported to CDC, as of October 4, about 19 percent of nursing homes had a shortage of aides (an increase of 1 percentage point), about 16 percent had a shortage of nursing staff (unchanged), about 10 percent had a shortage of other staff (an increase of 1 percentage point), and about 2 percent had a shortage of clinical staff (unchanged).114
In addition, required routine testing of staff in nursing homes could exacerbate existing staffing shortages as new cases of COVID-19 are identified and affected staff are unable to work. The Nursing Home Commission made nine recommendations related to the nursing home workforce, including short-term solutions, such as that CMS assess how federal relief funds could be used for hazard pay, and long-term solutions, such as increasing wages for nursing home staff, through Medicare and Medicaid payment reform, to disincentivize staff from working for multiple employers.115
Agency Comments
We provided HHS and the Office of Management and Budget (OMB) with a draft of this enclosure. HHS provided general comments, which are reproduced in Appendix IV. In its comments, HHS neither agreed nor disagreed with our recommendation to quickly develop a plan that further details how the agency intends to respond to and implement, as appropriate, the recommendations in the Nursing Home Commission’s
113 Our September report covered data nursing homes self-reported to CDC as of July 26, 2020.
114 According to CDC, aides include certified nursing assistants, nurse aides, medication aides, and medication technicians; nursing staff include registered nurses, licensed practical nurses, and vocational nurses; clinical staff include physicians, physician assistants, and advanced practice nurses; and other staff include any staff not included in the other three categories, such as cooks, pharmacists, and physical therapists.
115 CMS’s response to the Nursing Home Commission’s report indicated that the agency had taken some actions related to these recommendations. However, according to our analysis, these actions do not fully address the recommendations. For example, the Nursing Home Commission recommended that CMS identify and deploy infection preventionist resources to provide immediate assistance to nursing homes without full -time infection prevention support, prioritizing facilities in COVID-19 hotspots. In response, CMS said that the agency had encouraged collaboration between nursing homes and hospitals to help with infection prevention best practices; while potentially helpful, this action does not directly address the Nursing Home Commission’s concern.

Appendix I: Enclosures
Page 93 GAO-21-191
final report. HHS officials highlighted actions that CMS has taken related to Commission recommendations and said it would refer to and act upon the Commission’s recommendations, as appropriate. We maintain that developing a plan that details how CMS will proceed with remaining recommendations, includes milestones, and demonstrates coordination with other federal and nonfederal stakeholders would improve CMS’s ability to systematically consider the Commission’s recommendations going forward.
HHS also provided technical comments, which we incorporated as appropriate. OMB did not have comments on this enclosure.
GAO’s Methodology
To conduct this work, we reviewed CMS and CDC data, agency guidance, the Nursing Home Commission final report, and other relevant information on HHS’s response to the COVID-19 pandemic. We also spoke to CMS and CDC officials, as well as representatives from national organizations representing nursing homes, residents, and their families, and researchers with experience in nursing home infection control.
In addition, we analyzed CMS data on targeted infection control surveys and complaint investigations conducted in nursing homes, which included data from March 4, 2020 through August 31, 2020, and CDC data on COVID-19 reported by nursing homes for the week ending October 4, 2020.116 We analyzed the CDC data as they were reported by nursing homes to CDC and publicly posted by CMS.
We did not otherwise independently verify the accuracy of the information with these nursing homes. We assessed the reliability of the data sets used in our analyses by checking for missing values and obvious errors and reviewing relevant CMS and CDC documents. We determined the data were sufficiently reliable for the purposes of our reporting objective.
Contact information: John E. Dicken, (202) 512-7114, [email protected]
116 We analyzed the most recent data available on October 15, 2020. The CMS targeted infection control and complaint surveys were accessed on September 30, 2020, from https://www.cms.gov/files/zip/nursing-home-infection-control-surveys.zip. The CDC data on COVID-19 in nursing homes were accessed on October 15, 2020, for the week ending October 4, 2020, from https://data.cms.gov/Covid19-nursing-home-data. For the data on COVID-19 in nursing homes, we analyzed and reported data that had been determined by CDC and CMS to pass quality assurance checks.

Appendix I: Enclosures
Page 94 GAO-21-191
Related GAO Products
Infection Control Deficiencies Were Widespread and Persistent in Nursing Homes Prior to COVID-19 Pandemic. GAO-20-576R. Washington, D.C.: May 20, 2020.
Science & Tech Spotlight: COVID-19 Testing. GAO-20-584SP. Washington, D.C.: May 20, 2020.
Nursing Homes: Better Oversight Needed to Protect Residents from Abuse. GAO-20-259T. Washington, D.C.: November 14, 2019.
Strategic National Stockpile
The Department of Health and Human Services, in conjunction with federal partners, has taken steps to replenish and expand the portfolio of supplies in the Strategic National Stockpile to enable the Department to respond to a potential resurgence of COVID-19 and future public health emergencies.
Entities involved: Department of Defense; the Federal Emergency Management Agency, within the Department of Homeland Security; and the Office of the Assistant Secretary for Health and the Office of the Assistant Secretary for Preparedness and Response, within the Department of Health and Human Services.
Key Considerations and Future GAO Work
In June 2020, we reported that the Administration planned to restructure the Strategic National Stockpile (SNS), overseen by the Department of Health and Human Services’ (HHS) Office of the Assistant Secretary for Preparedness and Response (ASPR), based on lessons learned from recent pandemics, including COVID-19.
In September 2020, we reported on some of these restructuring plans, including efforts to build a 90-day supply of certain key items. We found that ASPR had made progress in meeting the agency’s goal of building a 90-day supply to prepare for potential surges in COVID-19 cases. In addition, we noted then that ASPR planned to add some materials, such as testing supplies, which had not been held in the SNS prior to COVID-19.

Appendix I: Enclosures
Page 95 GAO-21-191
We also previously reported that the Food and Drug Administration had identified shortages of certain supplies, including personal protective equipment (PPE) and testing supplies, many of which the SNS is trying to acquire.117 These shortages are expected to last for the duration of the pandemic, according to the Food and Drug Administration.
The continued need for supplies by state, tribal, and territorial governments, as well as point-of- care providers, such as nursing homes, combined with continued supply chain constraints may present challenges to ASPR in achieving its goal of building a 90-day supply by the end of 2020. ASPR has also begun other efforts to modernize the SNS to better position it to respond to future pandemics, according to agency officials. We will continue to monitor ASPR’s efforts, which are still in the early stages of development.
Background
We previously reported that the nationwide need for critical PPE and other supplies to protect responders and to treat individuals sickened with COVID-19 exceeded the quantity contained in the SNS. In March 2020, ASPR began distributing supplies from the SNS to states and other entities, and within 1 month, the inventory of requested supplies was largely exhausted.118
According to ASPR officials, the SNS was not designed or funded to provide states with supplies at the scale necessary to respond to a nationwide event such as the COVID-19 pandemic. However, in response to lessons learned thus far from the COVID-19 response, ASPR has begun efforts to reassess, replenish, and restructure the SNS. These efforts, referred to as “SNS 2.0: Next Generation,” are intended to create a modernized stockpile that will, among other things, ensure a sufficient reserve of all major items associated with COVID-19-like pandemics on a nationwide scale, according to ASPR’s website and other information regarding its modernization plans.
117 See Food and Drug Administration, Medical Device Shortages During the COVID-19 Public Health Emergency, (Sept. 24, 2020), accessed November 7, 2020, https://www.fda.gov/medical-devices/coronavirus-covid-19-and-medical-devices/medical-device-shortages-during-covid-19-public-health-emergency.
118 The SNS maintains an $8 billion supply of other materials, such as antibiotics, vaccines, antitoxins, and antivirals, according to HHS officials.

Appendix I: Enclosures
Page 96 GAO-21-191
Although overall responsibility for modernizing the SNS belongs to ASPR, multiple federal agencies have contributed to these efforts. (See figure below.)
· The Supply Chain Task Force, now known as the Supply Chain Advisory Group, was one of eight task forces run by the Unified Coordination Group.119 This group was tasked with maximizing the nationwide availability of supplies needed for the COVID-19 response. This included providing advice on how the SNS could better position itself to respond to the ongoing pandemic and future pandemics.
· The Department of Defense (DOD), including through its Joint Acquisition Task Force which became the Defense Assisted Acquisition Cell on September 30, 2020, executed multiple contracts on behalf of ASPR, including for the purchase of supplies to replenish the SNS.120
· The Logistics, Supply Chain, Next Generation SNS Work Group, comprised of representatives from various federal agencies and the White House, was formed to develop and implement objectives and activities that would enable the SNS “to better protect the health and safety of the nation.” One area of focus for this group was determining and acquiring the critical items to hold in the SNS to enable it to respond to the needs of the nation in the event of a fall resurgence of COVID-19.
This work group was also responsible for determining inventory requirements and strategies to meet future surges in demand. Many of the objectives and activities outlined by this Work Group are still in
119 As of June 2020, the Supply Chain Task Force led by a logistics expert on detail from the Department of Defense (DOD) transitioned into the Supply Chain Advisory Group. In contrast to the Supply Chain Task Force, the Advisory Group has an advisory and assistance role, focused on transitioning responsibilities to other federal stakeholders. We refer to the Supply Chain Task Force as the Supply Chain Advisory Group in this enclosure. The Unified Coordination Group is the primary field entity for the federal response. The group integrates diverse federal authorities and capabilities and coordinates federal response and recovery operations. The Unified Coordination Group is jointly led by the Administrator of the Federal Emergency Management Agency (FEMA), the Assistant Secretary for Preparedness and Response, and a representative of the Centers for Disease Control and Prevention.
120 DOD established the Joint Acquisition Task Force on March 25, 2020, to support the acquisition needs of federal agencies in their public health response activities and to provide access to DOD’s acquisition capabilities, tools, and skill sets. On September 30, 2020, DOD created the Defense Assisted Acquisition Cell to provide policy guidance and oversight of future DOD support to interagency partners.

Appendix I: Enclosures
Page 97 GAO-21-191
progress although the Work Group itself no longer exists, according to ASPR officials.
Federal Entities Involved in Management of the Strategic National Stockpile (SNS) Supplies during the COVID-19 Pandemic

Appendix I: Enclosures
Page 98 GAO-21-191
aThe White House Coronavirus Task Force, chaired by the Vice President, is responsible for coordinating a w hole-of-government response to COVID-19. bThe Secretary for Health and Human Services transferred the responsibility for the control and maintenance of the SNS from the Centers for Disease Control and Prevention to the Office of the Assistant Secretary for Preparedness and Response (ASPR) in October 2018. Allocation and distribution of supplies from the SNS at certain times during the COVID-19 pandemic w ere made by the UCG and implemented by ASPR’s Division of the SNS; how ever, ASPR alw ays maintained control of the SNS, according to ASPR and Federal Emergency Management Agency officials. In addition, although the Department of Defense (DOD) made procurements to replenish the SNS and managed the aw arded contracts, ASPR set the procurement requirements and provided funding, according to ASPR and DOD off icials.
The four relief laws enacted to assist the COVID-19 response as of November 1, 2020, appropriated funding for HHS activities including, but not limited to, the SNS.121 As of October 31, 2020, HHS reported it obligated $8.9 billion of the $10.7 billion it planned to use for the SNS to purchase PPE and ventilators for immediate use as well as to replenish SNS inventory, among other purposes, and had expended about $4.1 billion.
Overview of Key Issues
ASPR has made progress toward replenishing and expanding the SNS inventory despite facing challenges due to supply chain constraints. The agency and its federal partners identified the most critical types of supplies needed in the COVID-19 pandemic and developed a 90-day supply target for each type of item. ASPR’s progress in amassing 90 days of supplies varies by item as shortages of certain items—such as nitrile gloves—continue and other challenges affect progress.
ASPR anticipates that it will reach its 90-day supply inventory targets for many items by the end of the year. As ASPR moves towards completion of this immediate goal, it continues to address additional goals such as determining how to best manage the inventory to meet future surges in demand and the agency plans to add other supplies not previously held in the SNS.
Identification and acquisition of critical supplies for the SNS. ASPR and its federal partners determined the SNS needed to acquire a 90-day supply of three categories of critical supplies—PPE, pharmaceuticals, and
121 As of November 1, 2020, the four relief laws enacted to assist the response to COVID-19 were the Coronavirus Preparedness and Response Supplemental Appropriations Act, 2020, Pub. L. No. 116-123, 134 Stat. 146; Families First Coronavirus Response Act, Pub. L. No. 116-127, 134 Stat. 178 (2020); CARES Act, Pub. L. No. 116-136, 134 Stat. 281 (2020); and Paycheck Protection Program and Health Care Enhancement Act, Pub. L. No. 116-139, 134 Stat. 620 (2020).

Appendix I: Enclosures
Page 99 GAO-21-191
testing supplies—based on requests received from states and other entities during the response effort and recommendations from the Supply Chain Advisory Group and the Office of the Assistant Secretary for Health (OASH), within HHS.
Depending on the item, officials with the Supply Chain Advisory Group, the Logistics, Supply Chain Next Generation SNS Work Group, or OASH developed 90-day targets for obtaining the three categories of critical supplies it identified. ASPR officials explained that 90 days is the amount of time manufacturers told them it would take to ramp up production of respiratory devices to meet surges in demand. Thus, having a 90-day supply in the SNS would enable it to serve as a short-term stop-gap buffer until the commercial supply chain can meet demand. ASPR’s progress towards acquiring these critical supplies at the target volume levels varies by item.
PPE. Based on input from the Supply Chain Advisory Group, ASPR decided to build a 90-day inventory of PPE to include the most requested PPE during COVID-19: gloves, N95 respirators, surgical and procedural masks, gowns and coveralls, and eye protection such as face shields, according to federal officials.
In September 2020, ASPR officials reported that with one exception, they had awarded contracts that would enable them to acquire a 90-day inventory of those PPE items by the end of 2020. Some of the contracts included a priority rating, which according to the Defense Production Act, requires a contractor to give preference to these contracts over any other unrated contracts if the contractor cannot meet all required delivery date needs for all contracts.122
In October 2020, ASPR officials told us that ASPR and DOD had awarded about $1.8 billion to acquire a 90-day inventory of PPE (ASPR awarded 13 contracts totaling about $606.8 million and DOD had awarded 29 contracts totaling about $1.2 billion). ASPR officials told us that a contract awarded by DOD for nitrile gloves was not fulfilled because the subcontractor sold them to another entity, but that DOD was continuing to work with the contractor to fill the order. According to ASPR officials, while this did not result in a loss of government funds, ASPR may not meet the 90-day supply target for gloves by the end of the year. ASPR officials told us they will continue to coordinate with DOD to
122 See 50 U.S.C. § 4511.

Appendix I: Enclosures
Page 100 GAO-21-191
acquire gloves, which continue to be in short supply. (See table below for more on the SNS’s inventory, before and during COVID-19, through October 2020.)
Strategic National Stockpile Personal Protective Equipment Inventory and Status of Contract Awards
Personal protective equipment
Status of contract awards as of Oct. 2020
Dec. 2019 inventory on handa
July 2020 inventory on hand
Oct. 2020 inventory on hand
Planned 90-day inventoryb
Gloves awarded some 16.9 million 1 million 2 million 4.5 billion N95 respirators awarded all 12.6 million 38 million 107 million 300 million Surgical or procedural masks
awarded all 30.8 million 8 million 157 million 400 million
Gowns or coveralls awarded all 4.8 million 1.2 million 1 million 265 million Eye protection or face shields
awarded all 5.8 million 1.2 million 19 million 18 million
Legend: ● The Office of the Assistant Secretary for Preparedness and Response (ASPR) off icials noted that they had aw arded all contracts that will enable the Strategic National Stockpile (SNS) to meet the planned 90-day inventory targets. ◒ ASPR off icials noted they had aw arded some, but not all, contracts that w ould enable the SNS to meet the 90-day inventory targets. Source: Officials with the Office of the Assistant Secretary for Preparedness and Response within the Department of Health and Human Services. | GAO-21-191
Note: The SNS continues to deploy supplies in response to requests and to certain health care providers, such as nursing homes. These deployments may affect the ability to reach the SNS inventory targets, according to ASPR off icials. Deployments could also result in some fluctuation in inventory quantities over time. aThe inventory on hand as of December 2019 w as procured in response to the 2009 H1N1 pandemic, according to ASPR off icials. bThe 90-day supply inventory goals w ere established during the COVID-19 pandemic, according to ASPR off icials.
Pharmaceuticals. ASPR and FEMA officials told us that the pandemic called attention to the need for the SNS to have in its inventory sedatives for use with ventilators, and other drugs, such as an antibiotic, not previously contained in the SNS. An initial set of these drugs were identified by the Supply Chain Advisory Group in consultation with various health care stakeholders, according to ASPR and FEMA officials. Later, HHS and the Supply Chain Advisory Group identified additional priority drugs. In total, the SNS is building an inventory of 21 finished pharmaceuticals.
In addition, ASPR plans to include 25 active pharmaceutical ingredients in the SNS inventory, although these products will be stored by the product

Appendix I: Enclosures
Page 101 GAO-21-191
vendor.123 Below (figure) are groups of pharmaceutical products ASPR will include in its 90-day supply inventory based on their primary uses.
Primary Use of Pharmaceutical Products the Office of the Assistant Secretary for Preparedness and Response Will Include in the Strategic National Stockpile
ASPR officials told us the agency awarded all of the contracts needed to supply the SNS with these finished pharmaceuticals, and anticipated acquiring a 90-day supply of these drugs by the end of 2020. In October 2020, ASPR officials told us they had awarded seven contracts totaling $129.1 million for these supplies.
Additionally, according to ASPR officials in October 2020, the agency was evaluating technical proposals received in response to the agency’s solicitation for the production and storage of active pharmaceutical ingredients and planned to award contracts by the end of October 2020. ASPR officials told us that they intend to have an initial quantity of active pharmaceutical ingredients under the control of the SNS by the end of 2020; however, the amounts will be dependent on their availability and cost.124 (See table below for more on the SNS’s contract awards and inventory through October 2020.)
123 An active pharmaceutical ingredient refers to any substance that is intended for incorporation into a finished pharmaceutical and is intended to furnish pharmacological activity or other direct effect in the diagnosis, cure, mitigation, treatment, or prevention of disease, or to affect the structure or any function of the body.
124 We have ongoing work examining overseas manufacturing of critical ph armaceutical products purchased by federal agencies and the extent to which federal efforts exist to overcome barriers to domestic drug manufacturing.

Appendix I: Enclosures
Page 102 GAO-21-191
Status of Strategic National Stockpile Pharmaceutical Contract Awards and Inventory
Pharmaceuticals Dec. 2019 inventory on Hand
Status of contract awards to meet 90-day inventory as of
Oct. 2020
Status of 90-day inventory as of
Oct. 2020a
Finished pharmaceuticals (21 products)
8 of 21 products stocked
completed partially completed
Active pharmaceutical ingredients (25 ingredients)b
0 of 25 ingredients stocked
no contract awards no contract awards
Legend: ● Completed. ◒ Partially completed. ○ No contract aw ards made or no pharmaceutical products acquired. Source: Officials with the Office of the Assistant Secretary for Preparedness and Response (ASPR) within the Department of Health and Human Services. | GAO-21-191
Note: The Strategic National Stockpile is building an inventory of pharmaceutical products in response to the COVID-19 pandemic: it w ill include 21 f inished pharmaceuticals. aThe 90-day supply inventory goals w ere established during COVID-19, according to ASPR off icials. bAn active pharmaceutical ingredient refers to any substance that is intended for incorporation into a f inished pharmaceutical and is intended to furnish pharmacological activity or other direct effect in the diagnosis, cure, mitigation, treatment, or prevention of disease, or to affect the structure or any function of the body.
Testing supplies. HHS’s OASH, which leads federal efforts to support states in their COVID-19 testing plans and directs ASPR officials on the stockpiling of testing supplies, identified the need to build a 90-day supply of nasal swabs, transfer media, and pipette tips (disposable plastic attachments used to uptake and dispense small volumes of liquid) in the SNS. Prior to COVID-19, the SNS did not hold these testing supplies.125
According to an OASH official with responsibility for testing supply
125 The COVID-19 Strategic Testing Plan that HHS issued in May 2020 identified additional testing supplies such as collection tubes and pipettes that the SNS would stockpile; however, an OASH official we spoke with in October 2020 noted changes in these plans. For example, this individual told us that collection tubes and transport media are now packaged together, so there is no longer a need to purchase (and stock) tubes separately in the SNS. Department of Health and Human Services (HHS), Report to Congress: COVID-19 Strategic Testing Plan (May 24, 2020). HHS is required under the Paycheck Protection Program and Health Care Enhancement Act to update the plan every 90 days until funds provided under the act are expended. Pub. L. No. 116-139, div. B, tit. I, 134 Stat. at 626-27. The subsequent testing plan issued in August 2020 did not contain information on the planned SNS inventory of testing supplies but may be included in future plans, according to an OASH official.

Appendix I: Enclosures
Page 103 GAO-21-191
acquisition, additional testing supplies may be added to the SNS in the future.
As of November 2020, ASPR had completed contract awards for some testing supplies. Specifically, at the direction of OASH, ASPR focused on acquiring swabs and transport media to fill states’ needs for these supplies. In November 2020, ASPR officials told us that they had awarded seven contracts and obligated about $122 million for the purchase of nasal swabs and transport media.126 ASPR officials told us they distribute these supplies to states and other entities at the direction of OASH and any surplus is added to the SNS on a weekly basis.
Due to demand for these items, the SNS has been able to accumulate very little of these materials, according to ASPR officials. Because of recent increases in production, an OASH official told us that the SNS is projected to accumulate a 90-day supply of transport media by January 2021 and nasal swabs several months later. In contrast, this official noted the supply of pipette tips does not currently meet demand, so there is no excess supply to add to the SNS at this time. Moreover, this OASH official told us that due to the demand for pipette tips, the agency is currently airlifting this supply into the United States from overseas. Further, the official anticipated demand for pipette tips would continue to outpace supply and noted this anticipated demand indicated the need to stockpile pipette tips in the SNS in the future. (See the table below for more on the SNS’s inventory of testing supplies prior to, and during COVID-19, through October 2020.)
Strategic National Stockpile Testing Supply Inventory
Testing supplies Dec. 2019 inventory on handa
Oct. 2020 inventory on hand
Planned 90-day inventoryb
Nasal swabs N/A 18 million 54 million Transport media N/A 36 million 36 million Pipette Tipsc N/A 0 36 million
Source: Officials with the Office of the Assistant Secretary for Preparedness and Response (ASPR) and the Office of the Assistant Secretary for Health (OASH), within the Department of Health and Human Services, as well as Department of Health and Human Services, Report to Congress: COVID-19 Strategic Testing Plan (May 24, 2020). | GAO-21-191
Note: The Strategic National Stockpile continues to deploy supplies in response to requests and to areas of need such as nursing homes. These deployments may affect the ability to reach the SNS
126 HHS’s Program Support Center, a shared service provider to the federal government that provides acquisition management services, among other things, also obligated about $380 million for the purchase of transport media.
Appendix I: Enclosures
Page 104 GAO-21-191
inventory targets, according to ASPR off icials. Deployments could also result in some fluctuation in inventory quantities over time. aTesting supplies w ere not stocked in the SNS prior to COVID-19. bThe 90-day supply inventory goals w ere established during COVID-19, according to ASPR off icials. cThe supply of pipette tips (disposable plastic attachments used to uptake and dispense small volumes of liquid) does not currently meet demand so there is no excess supply to add to the SNS at this time, according to an OASH off icial w e spoke with in October 2020.
Planned acquisition beyond that identified for the 90-day SNS inventory. In addition to supplies ASPR and its federal partners identified for the 90-day inventory, ASPR intends to include other supplies not previously held in the SNS based on feedback ASPR received from states.127 For example, ASPR officials told us they anticipated that oxygen tubes needed to operate ventilators would be readily available in hospitals and as a result, ASPR did not stockpile them or provide them to states when it distributed ventilators during COVID-19. However, ASPR found that states did not have these tubes and as a result, plans to stock these items in the SNS in the future.
ASPR is also procuring and bundling vaccine supplies into kits in conjunction with DOD in support of Operation Warp Speed.128
Specifically, the SNS is working with the vendor who is performing several tasks such as assembling and storing a total of 6.7 million vaccination kits based on the requirements of any specific vaccine’s administration, since multiple vaccine candidates are in development.129
For example, the vendor will assemble 5.6 million standard vaccination kits containing surgical masks, face shields, needles, and syringes to be distributed along with any COVID-19 vaccine. (See figure below.)
In addition, the vendor will assemble other types of vaccine administration kits based on the requirements for any specific vaccine’s administration, including pediatric populations and vaccines to be distributed in other dosage quantities, according to ASPR officials. In October 2020, ASPR officials told us that ASPR and DOD had awarded $675.2 million for the supplies, kit assembly, storage, and shipment of any COVID-19 vaccine
127 See our related States’ Perspectives on Medical Supplies enclosure in this report for more on state reporting on needs nationwide.
128 Operation Warp Speed is a partnership between DOD and HHS that aims to accelerate the development, manufacturing, and distribution of COVID-19 vaccines and therapeutics. A primary goal is to deliver 300 million doses of a safe and effective vaccine for COVID-19 with initial doses available by January 2021.
129 As of October 15, 2020, Operation Warp Speed, had publicly announced financial support for the development and manufacturing of six vaccine candidates for COVID -19.

Appendix I: Enclosures
Page 105 GAO-21-191
(ASPR awarded four contracts totaling $438.4 million and DOD awarded nine contracts totaling $236.8 million).
Contents of One Type of Strategic National Stockpile COVID-19 Vaccination Kit That Supports 100 Vaccinations
Note: Each standardized kit, as depicted above, contains supplies to administer 100 vaccine doses. In addition to this type of vaccination kit, the Department of Health and Human Services (HHS), through its Strategic National Stockpile, has contracted for the assembly of other kits, such as to administer any vaccine to pediatric populations or for vaccines to be distributed in other dosage quantities, according to HHS off icials.
Challenges in replenishing the SNS inventory. ASPR’s efforts to replenish the SNS inventory are affected by broader medical supply chain issues:
· Delayed delivery to reduce commercial supply constraints. ASPR officials reported that they have delayed delivery of some contracted items to the SNS to enable manufacturers to make them available in the commercial market to alleviate supply constraints. For example,

Appendix I: Enclosures
Page 106 GAO-21-191
ASPR officials told us that they delayed delivery of N95 masks to the SNS to permit these materials to flow to commercial distributors and then to hospitals to support first-line needs.
· Deployment of supplies to areas of need. For example, in August 2020, HHS announced it had released 1.5 million N95 respirators from the SNS for distribution to about 3,336 nursing homes that had less than a 3-day supply.130
· Global competition for supplies. For example, ASPR officials told us that because the expected contract for nitrile gloves was not completed, they anticipated needing to acquire gloves incrementally through multiple contracts. As we previously reported, the speed at which ASPR will be able to build a 90-day supply of PPE will depend on demand that may be affected by an increase in the spread of COVID-19.
We recently reported that HHS and DOD plan to use about $1.6 billion in CARES Act funding to increase domestic production of some critical medical supplies, such as N95 respirators and filter material that is used in the respirators, which may help alleviate some of these supply chain issues.131 We are tracking these efforts and recently reported on their status in our November 2020 report.
Addressing other SNS modernization goals. According to ASPR officials, the agency is taking additional steps to prepare the SNS to respond to future pandemics by further developing the SNS inventory and refining strategies for its management. In May 2020, ASPR solicited feedback from industry and others about the types and amounts of pandemic-related supplies to stockpile.132 In addition, the agency requested feedback on how items could be managed by vendors to enable quicker responses to surges in demand, and ensure quality by, for example, requiring the vendor to perform preventative maintenance so that items are in working condition and deployable in a public health emergency such as COVID-19. For example, according to ASPR officials, although 130 These shipments were to Medicare and Medicaid certified nursing homes only and were intended to provide a 7-day supply of N95 respirators for an entire shift of healthcare workers in that facility.
131 HHS plans to use about $1.3 billion in CARES Act funding it received to expand domestic production of medical supplies and DOD is using $313 million of the $1 billion it received in CARES Act DPA Title III funding for the same purpose. DOD plans to use the remaining $687 million to address defense industrial base issues caused by COVID -19.
132 The NextGen SNS Request for Information was posted to the System for Award Management website (SAM.gov) on May 15, 2020.

Appendix I: Enclosures
Page 107 GAO-21-191
media reports indicated that ventilators deployed from the SNS in response to COVID-19 were inoperable, ASPR found no evidence of this and noted that the SNS has an extensive quality assurance program that ensures that ventilators are maintained in accordance with commercial process standards to prevent such an occurrence.
ASPR received 138 responses to the solicitation that included suggestions for additional items to include in the SNS to prepare for future pandemics. For example, several responses suggested ASPR include shoe and hair covers, disinfectant and sanitizing supplies, pharmaceuticals for use in sedation and treating infections, as well as other items in the SNS. ASPR officials told us that they plan to use these responses to inform the SNS’s strategy for its continuing COVID-19 response and future pandemic responses. In November 2020, ASPR officials told us they had provided a draft document to agency leadership and then to its interagency partners for review. ASPR officials also told us that they plan to finalize the strategy by the end of November 2020.
Agency Comments
We provided a draft of this report to DOD, HHS, the Department of Homeland Security, and the Office of Management and Budget for review and comment. These agencies did not provide comments on this enclosure.
GAO’s Methodology
To understand federal efforts to replenish the SNS, we reviewed information on HHS’s website and solicitation information posted by HHS on the System for Award Management website (SAM.gov). We reviewed responses to the “Nextgen SNS RFI” solicitation as well as contract and interagency agreement information provided to us by ASPR. In addition, we obtained written responses and interviewed officials from HHS and the Supply Chain Advisory Group between July and November 2020 about how they developed and implemented the 90-day supply requirements for the SNS and other past or current activities related to SNS modernization.
Contact information: Mary Denigan-Macauley, (202) 512-7114, [email protected]

Appendix I: Enclosures
Page 108 GAO-21-191
Related GAO Products
Defense Production Act: Opportunities Exist to Increase Transparency and Identify Future Actions to Mitigate Supply Chain Issues. GAO-21-108. Washington, D.C.: November 19, 2020.
COVID-19: Federal Efforts Accelerate Vaccine and Therapeutic Development, but More Transparency Needed on Emergency Use Authorizations. GAO-21-207. Washington, D.C.: November 17, 2020.
COVID19 Testing Guidance
The Department of Health and Human Services and its agencies have taken several key actions to document a testing strategy and provide testing-related agency guidance, but the rationale for changes to testing guidelines has not always been transparent.
Entities involved: The Department of Defense and the Department of Health and Human Services, including its Centers for Disease Control and Prevention, Centers for Medicare & Medicaid Services, Food and Drug Administration, National Institutes of Health, and the Office of the Assistant Secretary for Health
Recommendation for Executive Action
The Secretary of Health and Human Services should ensure that the Director of the Centers for Disease Control and Prevention clearly discloses the scientific rationale for any change to testing guidelines at the time the change is made.
Key Considerations and Future GAO Work
We reported in June 2020 that while the Department of Health and Human Services (HHS) had taken steps to meet the unprecedented need for COVID-19 testing data, those data were incomplete and inconsistent. In September 2020, we reported on challenges with testing supply availability, and recommended that HHS, in coordination with the Federal Emergency Management Agency (FEMA), further develop and communicate to stakeholders plans outlining specific actions the federal government would take to help mitigate remaining medical supply gaps necessary to respond to the remainder of the pandemic—including testing

Appendix I: Enclosures
Page 109 GAO-21-191
supply shortages. For more information, see the States’ Perspectives on Medical Supply Availability enclosure.
Since September 2020, we have identified challenges with federal testing strategy and guidance. HHS agencies have taken several key actions to support testing, including procuring tests for long-term care settings and schools, obtaining stakeholder input, and issuing guidance. However, these agencies face challenges in developing clear guidance to facilitate consistent and appropriate use, and interpretation, of antigen tests and their results, and HHS is taking steps to address these challenges. Furthermore, while it is expected that guidance will change as new information about the novel virus evolves, frequent changes to general CDC testing guidelines were not always communicated with a scientific rationale. Until HHS ensures that CDC clearly discloses the scientific rationale for any changes to its testing guidelines at the time the changes are made, the agency risks creating confusion and eroding trust in important federal partners.
We will continue to conduct work examining HHS and its component agencies’ roles with regard to COVID-19 testing, including the development and authorization of tests, the collection and reporting of testing data, the development of testing guidance, and the availability of testing supplies.
Background
Testing people for COVID-19 and isolating those who test positive are of paramount importance to help control the virus’s spread in the community, according to the Centers for Disease Control and Prevention (CDC), the agency charged with conducting critical science and providing health information to protect the country against health threats like COVID-19. Over the duration of the pandemic, the volume and types of tests to detect the virus that causes COVID-19 have evolved, and new testing technologies have emerged that have implications for use in testing approaches.
Specifically, the Food and Drug Administration (FDA), the agency in charge of regulating medical device products marketed in the United States for use in detecting or diagnosing COVID-19 infections, has issued emergency use authorizations for two types of viral diagnostic tests:

Appendix I: Enclosures
Page 110 GAO-21-191
molecular and antigen tests.133 These tests either require processing with specialized laboratory equipment, or are processed rapidly at the point of care (rapid tests), such as in a clinic, nursing home, or school setting. We previously reported that at times during the pandemic, laboratory capacity, where most molecular tests are processed, has been constrained due to shortages in supplies and equipment, as well as increased demand for tests associated with emerging hotspots in disease transmission, leading to delays in turnaround times for testing results. Because rapid antigen tests do not rely on the use of specialized laboratory equipment and provide quick results at the point of care, they may help alleviate the burden on these facilities.
As the coordinating agency for the federal response to public health and medical emergencies, HHS leads the development and implementation of the federal COVID-19 testing strategy. Under this strategy, states manage their own COVID-19 testing programs with federal support from the Office of the Assistant Secretary for Health (OASH). As of October 20, 2020, HHS had submitted two required strategic testing plans (May and August) to Congress.134 In the latest plan, submitted in August 2020, HHS defined the federal role as setting the overall strategy and requirements, securing the supply chain, securing scarce resources, and providing technical guidance, among other things.
133 Molecular diagnostic viral tests detect the presence of genetic material from SARS -CoV-2, the virus that causes COVID-19. The antigen viral tests detects the presence of a protein that is part of SARS-CoV-2. As of November 3, 2020, FDA had issued emergency use authorizations for 223 molecular tests and 7 antigen tests. In addition, FDA issued emergency use authorizations for 57 serology tests to detect antibodies produced in the bodies of patients who have had COVID-19, known as antibody tests. FDA may issue an emergency use authorization if the agency determines that certain medical products, such as a test, “may be effective” at diagnosing, treating, or preventing a disease, among other criteria. See 21 U.S.C. § 360bbb-3. An emergency use authorization allows tests and other products to be made available in a much shorter time frame than typically would be necessary for approval or clearance, in part because it requires a lo wer level of evidence than the “effectiveness” standard that is required for FDA product approvals and clearances. To approve tests outside of an emergency, FDA determines whether there is reasonable assurance that the tests are safe and effective for thei r intended clinical use or that they otherwise meet the applicable statutory standard.
134 Department of Health and Human Services, Report to Congress: COVID -19 Strategic Testing Plan (May 24, 2020) and Department of Health and Human Services, Report to Congress: COVID-19 Strategic Testing Plan (August 22, 2020). The Paycheck Protection Program and Health Care Enhancement Act requires HHS to update the plan every 90 days until funds provided under the act are expended. Pub. L. No. 116-139, div. B, tit. I, 134 Stat. at 626-27.

Appendix I: Enclosures
Page 111 GAO-21-191
The COVID-19 relief laws appropriated a total of $26.5 billion to HHS to support COVID-19 testing, among other things. HHS reported total testing-related obligations of about $17.3 billion as of October 31, 2020, a majority of which was awarded to states, localities, territories, and tribal organizations, and total expenditures of $3.4 billion.135 According to HHS officials, award recipients draw down funds in accordance with their own jurisdictional policies and practices. In addition, the length of time it will take to spend all federal appropriations allocated for testing is dependent on the progression of the COVID-19 pandemic and its impact within specific geographic locations and on specific populations. See table for HHS-reported obligations and expenditures for testing-related activities.
HHS’s Reported Obligations and Expenditures for Testing-Related COVID-19 Response Activities, as of Oct. 31, 2020
Key activity Obligations ($ billions)
Expenditures ($ billions)
Percentage of obligated amounts
expended, as of Oct. 31, 2020
Support to state, local, territorial, and tribal organizations’ preparedness
13.134 1.769 13
Testing for uninsured 0.669 0.667 100 Testing 3.545 0.981 28 Total 17.348 3.417 20
Source: GAO analysis of Department of Health and Human Services (HHS) information | GAO-21-191
Note: The percentages represent the share of obligated amounts for each key activity that w ere expended as of Oct. 31, 2020.
Overview of Key Issues
HHS has outlined its testing strategy and has taken several key actions to execute its plan. The August HHS Strategic Testing Plan outlines several testing priorities, including rapid hospital diagnosis, protecting vulnerable populations—especially those in long-term care facilities—and supporting 135 According to CDC officials, $10.25 billion in funds appropriated by the Paycheck Protection Program and Health Care Enhancement Act were obligated for awards to states, territories, and local jurisdictions through CDC’s Epidemiology a nd Laboratory Capacity for Prevention and Control of Emerging Infectious Diseases cooperative agreement to help them expand their testing and contact tracing capacity, among other things. In addition, the Indian Health Service (IHS) will provide $750 milli on in funds appropriated by the Paycheck Protection Program and Health Care Enhancement Act to IHS, tribal, and urban Indian Health programs to expand testing capacity and testing -related activities.

Appendix I: Enclosures
Page 112 GAO-21-191
the safe reopening of schools and businesses. The plan notes that targeted testing approaches—such as through diagnostic testing coupled with intermittent surveillance testing—will reduce the spread of COVID-19 when combined with public health mitigation measures. The advantage of these targeted approaches, according to the plan, is to decrease burden on laboratories, which have experienced capacity constraints at times due to supply shortages and other issues. HHS defines three types of COVID-19 testing approaches: diagnostic, screening, and surveillance. (See figure below.)
HHS Definitions and Applicable Requirements, by Type of COVID-19 Testing Approach
Notes: Most laboratories that perform testing on humans are required to meet certain federal requirements under the Clinical Laboratory Improvement Amendments of 1988 (CLIA). Under CLIA, a laboratory is generally defined as a facility that performs testing on materials derived from the human body for the purpose of providing information on the diagnosis, prevention, or treatment of diseases in humans and may include providers, such as nursing homes and physician off ices. 42 C.F.R. § 493.2 (2019).
The August HHS Strategic Testing Plan details several key actions HHS has taken to support COVID-19 testing.
· Investing in tests and test supplies. Federal agencies invested in, procured, and supplied certain rapid tests, as well as test collection

Appendix I: Enclosures
Page 113 GAO-21-191
supplies to states, localities, territories, tribal organizations, and other federal agencies. In addition:
· According to HHS, as of November 4, 2020, the agency reported providing almost 7.4 million Abbott BinaxNOW™ rapid antigen tests to nursing homes (see our related Nursing Homes enclosure), over 2 million to assisted living facilities, about 632,000 to home health and hospice organizations, 450,000 tests to the Indian Health Service, 389,000 tests to historically Black colleges and universities, and almost 120,000 to disaster operations in at least four states.136 HHS and White House officials also announced plans to deliver 100 million more of these tests to states and territories, and as of November 4, 2020, had delivered roughly 42 million of those tests.137 HHS is distributing tests to governors based on population, and has suggested states and territories use them in schools, for first responders, in the event of outbreaks, as well as for screening and surveillance in congregate settings.
· HHS also partnered with the Rockefeller Foundation to provide rapid antigen tests to select cities and states for use in a pilot program designed to identify and share best practices in COVID-19 community screening, with a focus on K-12 schools.
· HHS continues to invest in new testing technologies—including rapid tests and tests with new sampling technologies—through its Rapid Acceleration of Diagnostics (RADx) initiative, led by the National Institutes of Health in collaboration with the Biomedical Advanced Research and Development Authority. Through three rounds of contracts, according to NIH, the initiative is expected to increase nationwide testing capacity by 2.7 million tests before the end of 2020.
136 As we reported in September 2020, and discuss in our Nursing Homes enclosure, HHS also previously provided two rapid antigen tests to over 13,800 nursing homes starting in July, 2020. See also Department of Health and Human Services and COVID -19 Joint Information Center, “Daily Communications Report – October 17, 2020.” In September 2020, CMS began requiring nursing homes to test all staff and residents for COVID-19 as part of its requirements for the Medicare and Medicaid programs. See Medicare and Medicaid Programs, Clinical Laboratory Improvement Amendments (CLIA), and Patient Protection and Affordable Care Act; Additional Policy and Regulatory Revisions in Response to the COVID-19 Public Health Emergency; 85 Fed. Reg. 54,820 (Sept. 2, 2020) (to be codified at 42 C.F.R. § 483.30(h)).
137 White House, “Remarks by President Trump in an Update on the Nation’s Coronavirus Testing Strategy,” accessed September 30, 2020: https://www.whitehouse.gov/briefings-statements/remarks-president-trump-update-nations-coronavirus-testing-strategy/ and Department of Health and Human Services and COVID-19 Joint Information Center, “Daily Communications Report – November 4, 2020.”

Appendix I: Enclosures
Page 114 GAO-21-191
· HHS, in collaboration with the Department of Defense, is funding six domestic production expansion projects for swabs and test kits. Combined, manufacturers are expected to increase their annual domestic production of swabs by almost 953 million and of test kits by 181 million once they reach full rate production in 2021.138 In addition, in October 2020, HHS announced contracts with three additional companies to expand production of certain tests, including some rapid tests.
Seeking regular stakeholder feedback. HHS created the National Testing Implementation Forum, which consists of bi-weekly meetings with a rotating roster of individuals from stakeholder groups, such as laboratory and medical groups for the purpose of information sharing and feedback. The forum commenced in July, and has since covered topics such as the testing supply chain, surveillance and reopening strategies, and engaging minority and underserved communities.
Issuing federal guidance. Over the course of the pandemic, HHS agencies, including CDC, the Centers for Medicare & Medicaid Services (CMS), and FDA, have issued guidance to assist health departments, medical providers, nursing homes, schools, workplaces, and laboratories, for example, in implementing and prioritizing testing.139
Both the May and August Strategic Testing Plans detail the implementation of the White House Testing Blueprint—the formal national strategy, according to HHS.140 Although the May Strategic Testing Plan
138 See GAO, Defense Production Act: Opportunities Exist to Increase Transparency and Identify Future Actions to Mitigate Medical Supply Chain Issues, GAO-21-108 (Washington, D.C.: November 19, 2020).
139 CMS is the HHS component agency that is responsible for ensuring that nursing homes meet federal quality standards in order to participate in the Medicare and Medicaid programs.
140 The White House issued a testing blueprint for states in April that establishes broad roles and principles for states, localities, tribes, the federal government, and the private sector in facilitating expansion of needed testing capacity. White House, Centers for Disease Control and Prevention, and Food and Drug Administration, Testing Blueprint: Opening Up America Again (Apr. 27, 2020).

Appendix I: Enclosures
Page 115 GAO-21-191
was made public, HHS has not made the August plan available to the public.141
Proper use and interpretation of rapid antigen tests poses guidance-related challenges. In keeping with its federal testing strategy, HHS took action to alleviate laboratory constraints by quickly procuring rapid antigen tests and distributing them to certain settings, such as nursing homes and states. However, the interpretation of rapid antigen test results can be complex and provides a challenge for agencies in setting clear guidance on their use and interpretation:
· Lack of user familiarity. As we describe in our Nursing Homes enclosure, nursing homes had previously relied on lab-based, molecular testing. In addition, in suggesting that states use rapid antigen tests to support the opening of K-12 schools, HHS is providing schools with a tool they had likely not used before.
· Higher likelihood of false negative results. Rapid antigen tests carry a higher chance of producing false negatives than do molecular tests, according to the FDA. Negative test results are generally considered “presumptive” and may need to be confirmed with molecular testing in certain situations, such as when a negative result is unexpected given clinical symptoms.142
· Potential for false positive results. CDC guidance notes that false positives are rare, but also notes that clinicians should understand antigen test performance characteristics in order to recognize potentially false positive results, which can occur with any diagnostic test given that no test is 100 percent accurate. False positive results may make up a greater proportion of total positive results in populations where prevalence is low. Some states and nursing homes
141 The Paycheck Protection Program and Health Care Enhancement Act directed the Secretary of HHS to report to various congressional committees on a COVID-19 strategic testing plan 30 days after enactment and every 90 days thereafter. Pub. L. No. 116-139, div. B, tit. I,134 Stat. 620, 626-627 (2020). Congress made public the May Strategic Testing Plan. HHS officials noted that the agency does not publicly issue reports that it is required by law to report to committees of Congress that have jurisdiction over the agency.
142 While the sensitivity of antigen tests tends to be lower than that of molecular tests, the specificity—indicative of the likelihood of producing false positives —tends to be similar.
Appendix I: Enclosures
Page 116 GAO-21-191
have expressed concerns with the frequency with which false positive test results have occurred given the implications for that setting.143
· FDA-indicated use. As of November 4, 2020, FDA has authorized antigen tests for use in individuals suspected of having COVID-19 within a specific number of days since the onset of symptoms—as opposed to use in screening asymptomatic individuals. CLIA-certified laboratories, which can include nursing homes and other settings, are required by CMS regulations to follow the manufacturer’s instructions for use when performing laboratory testing.144 However, HHS has announced that CMS will temporarily exercise enforcement discretion for the duration of the COVID-19 public health emergency for use of antigen tests on asymptomatic individuals. In particular, such testing might occur outside of the authorized indication, such as for routine screening in nursing homes and other settings, HHS has acknowledged.145 In late October, FDA updated its guidance to encourage rapid antigen test developers to conduct clinical validation studies to support their use in asymptomatic individuals, as applicable.146
· Inconsistent data reporting requirements. While HHS requires that all COVID-19 test results be federally reported, including those for rapid antigen tests, some states do not require reporting of antigen test
143 For example, Nevada issued a directive in early October to discontinue the use of antigen tests due to concerns of false positive results with two of the antigen tests provided to nursing homes by HHS. The state subsequently reversed this directive after HHS notified state officials citing the directive as a violation of federal law.
144 See 42 C.F.R. § 493.1252(a) (2019).
145 See Department of Health and Human Services, Guidance for PREP Act Coverage for COVID-19 Screening Tests at Nursing Homes, Assisted-Living Facilities, Long-Term-Care Facilities, and other Congregate Facilities (Washington, D.C.: Aug. 31, 2020).
146 Food and Drug Administration, “Antigen Template for Test Developers,” accessed November 5, 2020: https://www.fda.gov/media/137907/download.

Appendix I: Enclosures
Page 117 GAO-21-191
results.147 In October, 2020, CDC supplemented previous HHS reporting guidance on its website, providing additional detail for the reporting of antigen among other tests, and introduced an option for long term care facilities to report point-of-care test results through the National Healthcare Safety Network.148
Given HHS’s Strategic Testing Plan priority of protecting vulnerable populations, including those in nursing homes, and HHS recommendations for use of rapid antigen tests in other settings such as schools, clear guidance on the use and interpretation of antigen tests is important so that they are used properly and consistently. Several stakeholder groups and two experts we interviewed told us that some nursing homes and other providers have been confused about how to use the new antigen tests, especially with regard to interpreting and reporting the results; for example, some noted that nursing homes may not understand when to seek a confirmatory test.
HHS officials acknowledged the challenges in providing guidance on rapid antigen tests and have taken action to clarify guidance. For example,
· On October 30, 2020, CMS announced the launch of the Nursing Home Resource Center, which will serve as a centralized hub bringing together the latest information, guidance, and data on nursing homes
147 A recent national survey from research organization Kaiser Health also raised the issue of states not accepting antigen test results. Although GAO has not independently confirmed these data, Kaiser Health reported in September that 21 states and D.C. do not report all antigen test results, that 15 states and D.C. do not count positive results from antigen tests as COVID cases, that two states do not require antigen test providers to report results at all, and that five states only require positive antigen results to be reported. Rachana Pradhan, Lauren Weber, and Hannah Recht, “Lack of Antigen Test Reporting Leaves Country ‘Blind to the Pandemic,’” Kaiser Health News (Sept. 16, 2020), accessed Oct. 23, 2020, https://khn.org/news/lack-of-antigen-test-reporting-leaves-country-blind-to-the-pandemic/. An August 5, 2020 update to the Council of State and Territorial Epidemiologists case definition recommended that confirmed and probable cases, including those from antigen tests results, be included in state COVID -19 case counts reported outside the public health agency.
148 Centers for Disease Control and Prevention, “How to Report COVID -19 Laboratory Data,” accessed October 19, 2020: https://www.cdc.gov/coronavirus/2019-ncov/lab/reporting-lab-data.html.

Appendix I: Enclosures
Page 118 GAO-21-191
for facilities, frontline providers, residents and their families, including information on COVID-19 testing.149
· Previously, in August, 2020, CDC provided guidance specific to the use of antigen tests in nursing homes, including a one-page algorithm for the interpretation of antigen test results in nursing homes.
· CDC and FDA issued guidance and updated FAQ in October and November, 2020, including the subject of false positive test results, and CDC updated its testing guidance for schools.150
We noted that, as of October 23, 2020, CMS had numerous relevant guidance documents and, although many linked to other relevant CDC guidance, they do not link directly to the CDC algorithm. Linking to the algorithm is important because it provides clear and concise recommendations to nursing homes on how to interpret antigen test results under various circumstances. CDC officials told us they plan to coordinate with CMS to ensure that the algorithm is included in the future. We will continue to conduct work examining federal guidance related to testing, including those related to rapid antigen testing.
Changes to CDC testing guidelines have not always been communicated in a transparent manner. While it is to be expected that federal guidelines may change as we learn more about the novel virus and its underlying science, CDC testing guidelines have been changed several times over the course of the pandemic, with little scientific explanation of the rationale behind the changes.
Our interviews with provider and stakeholder groups found that frequent changes in guidelines, without transparent rationale, create confusion and erode trust in important federal partners, and interview groups were particularly struck by the lack of rationale provided for an August change made to CDC testing guidelines. In September 2020, we reported that
149 See Centers for Medicare & Medicaid Services, “CMS’ New One-Stop Nursing Home Resource Center Assists Providers, Caregivers, Residents,” accessed November 5, 2020: https://www.cms.gov/newsroom/press-releases/news-alert-october-30-2020.
150 See Centers for Disease Control and Prevention, Considerations for Interpreting Antigen Test Results in Nursing Homes (Atlanta, Ga.: Aug. 21, 2020); Clinical Questions about COVID-19: Questions and Answers (Atlanta, Ga.: Oct. 5, 2020); and, Interim Considerations for Testing for K-12 School Administrators and Public Health Officials (Atlanta, Ga.: Oct. 13, 2020); and Food and Drug Administration, Potential for False Positive Results with Antigen Tests for Rapid Detection of SARS-CoV-2 - Letter to Clinical Laboratory Staff and Health Care Providers (Silver Spring, Md.: Nov. 4, 2020).

Appendix I: Enclosures
Page 119 GAO-21-191
CDC changed its guidelines in late August to de-emphasize the importance of testing asymptomatic individuals who had been exposed to COVID-19, without an explanation for these changes. According to provider and public health stakeholder groups, this change sparked confusion and disagreement from the public health community and others. Further, a number of these groups criticized this change as inconsistent with science.151 Specifically, they noted that this change would limit the ability of public health officials to test, contact trace, and isolate infected individuals, which is important to controlling the spread of the virus, according to CDC.
Almost four weeks after the August change, CDC updated its testing guidelines again to state that asymptomatic individuals with known exposure should be tested. See figure below as an example of selected changes over 4 months to CDC website guidelines for testing of asymptomatic individuals with little information publicly provided to explain the rationale for these changes.
151 Several public health and medical provider groups, including the American Medical Association, Association of American Medical Colleges, National Association of County and City Health Officials, Big Cities Health Coalition, and the Association for State and Territorial Health Officials submitted letters to the agency or issued press releases with concerns about the lack of scientific basis for the August changes to the testing guidelines. Furthermore, the National Academies of Science and Medicine commented on allegations of political interference in the CDC guideline development process. See National Academies of Science and Medicine, “NAS and N AM Presidents Alarmed By Political Interference in Science Amid Pandemic,” accessed October 21, 2020: https://www.nationalacademies.org/news/2020/09/nas-and-nam-presidents-alarmed-by-political-interference-in-science-amid-pandemic.
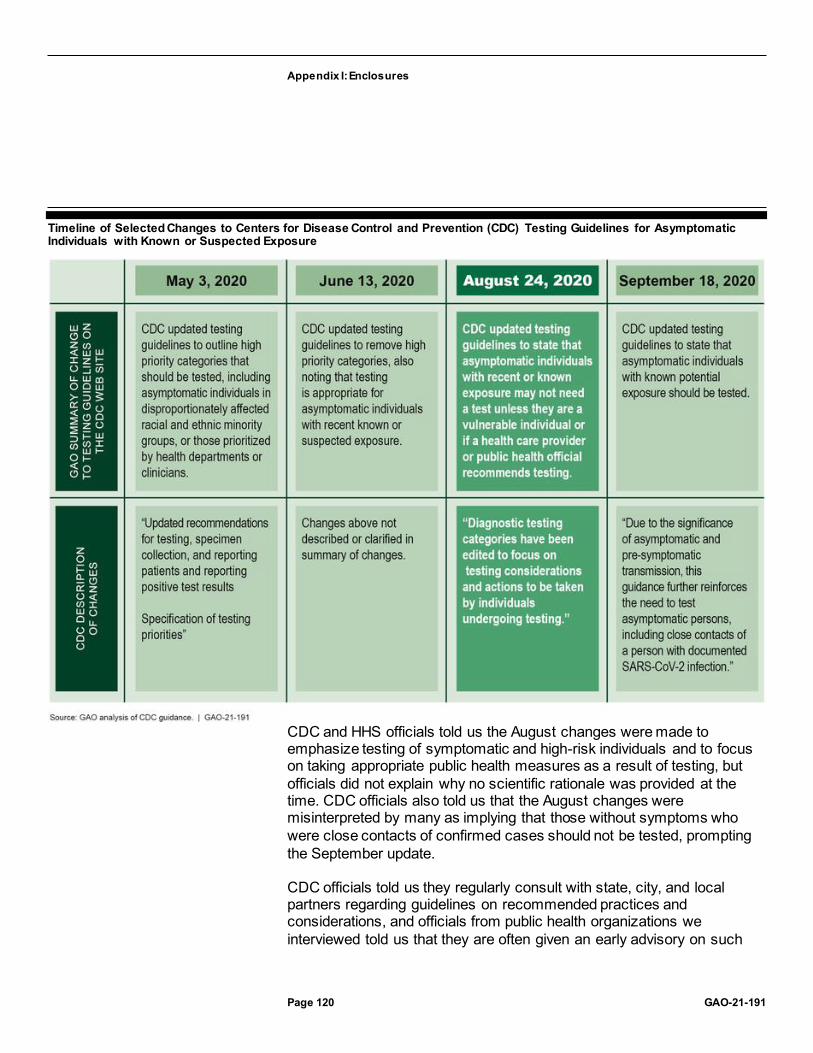
Appendix I: Enclosures
Page 120 GAO-21-191
Timeline of Selected Changes to Centers for Disease Control and Prevention (CDC) Testing Guidelines for Asymptomatic Individuals with Known or Suspected Exposure
CDC and HHS officials told us the August changes were made to emphasize testing of symptomatic and high-risk individuals and to focus on taking appropriate public health measures as a result of testing, but officials did not explain why no scientific rationale was provided at the time. CDC officials also told us that the August changes were misinterpreted by many as implying that those without symptoms who were close contacts of confirmed cases should not be tested, prompting the September update.
CDC officials told us they regularly consult with state, city, and local partners regarding guidelines on recommended practices and considerations, and officials from public health organizations we interviewed told us that they are often given an early advisory on such

Appendix I: Enclosures
Page 121 GAO-21-191
changes to guidelines, and are sometimes invited to provide feedback on forthcoming CDC guidelines. However, according to these organizations, no such advisory was given on the August change and, as a result, they were unable to prepare their members for the change. CDC officials confirmed that stakeholders were not provided with an advisory for the August change and told us that the update was coordinated by HHS and the White House Coronavirus Task Force.
According to stakeholder groups, the lack of transparency regarding these changes, coupled with the inconsistent messaging on several changes in a short time frame, led to confusion and could ultimately hinder consistent application of testing approaches to best control spread of the virus. This lack of transparency in CDC guideline updates is inconsistent with CDC’s Crisis and Emergency Risk Communication Manual, which states that “by fully and clearly explaining your messages and their reasoning, your audiences will be less likely to doubt you.”152
CDC officials told us that the change to testing guidelines in August did not follow the routine agency process, which normally involves stakeholder advisory and consultation. Furthermore, according to CDC officials, HHS and the White House Coronavirus Task Force coordinated the change rather than CDC. Until HHS ensures that CDC clearly discloses the scientific rationale for any changes to its testing guidelines at the time the changes are made, the agency risks creating confusion and eroding trust in important federal partners.
Agency Comments
We provided HHS and the Office of Management and Budget (OMB) with a draft of this enclosure. HHS concurred with our recommendation and provided general comments, which are reproduced in Appendix IV. HHS noted that CDC officials typically consult with scientific stakeholders when issuing guidance and said HHS will continue to evaluate its processes in this area. HHS also provided technical comments on this enclosure, which we incorporated as appropriate. OMB did not provide comments on this enclosure.
152 Centers for Disease Control and Prevention, Crisis and Emergency Risk Communication Manual: Messages and Audience (2018).

Appendix I: Enclosures
Page 122 GAO-21-191
GAO’s Methodology
To conduct this work, we reviewed agency guidance and other documentation, and interviewed HHS agency officials to obtain information on steps taken to implement, communicate, and update federal strategy and other guidance on COVID-19 testing. We also conducted interviews with public health experts and stakeholder groups, including provider groups, to obtain their perspectives on agency guidance and communication with regard to testing. To select interviewees, we identified a variety of groups that were impacted by federal testing strategy and guidance and that had broad geographic representation, in addition to researchers and practitioners with work in public health. In doing so, we identified 17 stakeholder groups; we spoke with 16 of these groups and obtained written comments from one of them. These groups represent, across the country
· over 100,000 state and local public health officials and epidemiologists, as well as public health laboratories;
· national, regional, community, and health system clinical laboratories; · state governors’ offices and staff, as well state education officials and
school administrators; and · a variety of providers, including nursing home practitioners,
physicians, and nurses. We also identified and interviewed five public health experts who had extensive experience in medical science and public policy, including one expert with experience in nursing home infection control. We identified these experts based on our ongoing related work.
Contact information: Mary Denigan-Macauley, (202) 512-7114, [email protected]
Medicaid Spending
The potential exists for two Department of Health and Human Services agencies to issue duplicative or erroneous payments to providers. The department has taken steps to assure payments are correct, but the effectiveness of agency efforts are unknown.
Entities involved: Centers for Medicare & Medicaid Services and the Health Resources and Services Administration, within the Department of Health and Human Services.

Appendix I: Enclosures
Page 123 GAO-21-191
Key Considerations and Future GAO Work
In our September 2020 report, we found the potential for duplicate or erroneous payments for COVID-19 testing of uninsured individuals by the Health Resources and Services Administration (HRSA) and the Centers for Medicare & Medicaid Services (CMS), both within the Department of Health and Human Services (HHS). While HRSA and CMS have implemented controls, the potential for these duplicate payments continue to exist. We will continue to monitor these issues going forward.
Background
Medicaid is one of the nation’s largest sources of funding for health care services for low-income and medically needy individuals, covering an estimated 77 million people and spending approximately $673 billion in fiscal year 2020.153 States and territories administer their Medicaid programs within broad federal rules and according to state plans approved by CMS, which oversees Medicaid at the federal level. The federal government matches states’ spending for Medicaid services according to a statutory formula known as the Federal Medical Assistance Percentage (FMAP).154
The Families First Coronavirus Response Act (FFCRA) provides a temporary increase in the FMAP for all qualifying states and territories.155
FFCRA also created an option for states to provide Medicaid coverage of COVID-19 diagnostic testing and related services to uninsured individuals.156 The FFCRA and the Paycheck Protection Program and Health Care Enhancement Act each appropriated $1 billion to reimburse
153 Department of Health and Human Services, Centers for Medicare and Medicaid Services, 2018 Actuarial Report on the Financial Outlook on Medicaid (Baltimore, Md.).
154 The FMAP is calculated based on each state’s per capita income relative to national per capita income. For the District of Columbia and U.S. territories, the FMAP is set by statute regardless of their per capita incomes. Additionally, federal law specifies a maximum amount, or allotment, for federal contributions to Medicaid spending in U.S. territories, in contrast to the states and the District of Columbia, for which federal Medicaid spending is open-ended.
155 Pub. L. No. 116-127, § 6008, 134 Stat. 178, 208-09 (2020) (“FFCRA”).
156 FFCRA, § 6004(a)(3), 134 Stat. at 205-06.

Appendix I: Enclosures
Page 124 GAO-21-191
providers for conducting COVID-19 testing of uninsured individuals.157
HRSA is responsible for administering these funds and paying providers that submit claims for COVID-19 testing.
Overview of Key Issues
Potential duplicate or erroneous payments for COVID-19 testing. HRSA administers a $2 billion program to pay for COVID-19 testing of uninsured individuals. In addition, CMS has approved 15 states and three territories to make Medicaid payments to providers for COVID-19 testing of uninsured individuals, with the federal government responsible for 100 percent of the cost.158 The Congressional Budget Office estimates that the Medicaid payments for testing of uninsured individuals will total approximately $2 billion in 2020 and 2021.
As of October 28, 2020, HRSA has paid $655 million for COVID-19 testing of uninsured individuals, with a total of $218 million in payments made to providers in the 15 states and two of three territories approved to use 100 percent federal Medicaid funds to pay for testing of uninsured individuals. While state reporting of Medicaid payments for COVID-19 testing is incomplete—an estimated $336,000 in Medicaid payments for COVID-19 testing for uninsured individuals have been reported as of October 31, 2020—CMS officials expect payments to increase in the future.
HRSA is responsible for assuring the payments for COVID-19 testing for uninsured individuals are not made for individuals who have health insurance coverage, including individuals residing in states and territories that cover COVID-19 testing for the uninsured through their Medicaid programs. According to HRSA officials, the program administrator implemented both prospective and retrospective payment controls over the last several months for COVID-19 testing payments for uninsured individuals.
HRSA officials stated these payment controls are dependent on national clearinghouses that compile insurance coverage information from health 157 FFCRA, div. A, tit. V, 134 Stat. at 182; Pub. L. No. 116-139, div. B., tit. I, 134 Stat. 620, 626 (2020).
158 Three states—Alabama, Rhode Island, and Washington—were approved to provide coverage, but subsequently rescinded their coverage. We excluded another state, Montana, because state officials told us they are not implementing coverage. CMS officials noted that Montana has not requested to rescind coverage.

Appendix I: Enclosures
Page 125 GAO-21-191
insurance carriers having Medicaid coverage information. Health care providers and payers may use clearinghouses to check for health insurance coverage for purposes of billing the appropriate payer.
According to CMS and HRSA officials, state Medicaid agencies transmit files with Medicaid coverage and payment information to the national clearinghouses. As such, these prospective checks identify individuals with Medicaid coverage, including coverage of COVID-19 testing for the uninsured, and HRSA will not pay providers that submit claims to HRSA for testing these individuals, according to HRSA officials. A retrospective payment control also checks the national clearinghouses monthly to identify claims for COVID-19 testing for the uninsured for situations in which Medicaid coverage information is now available but was not available at the time the claims were submitted and paid.
The effectiveness of these controls hinges on states reporting coverage and payment information to the clearinghouses. Preliminary data from the states and territories covering COVID-19 testing for uninsured individuals through Medicaid indicate that such reporting is uncertain. Of the 15 states and three territories with approval to cover testing for uninsured individuals through Medicaid, 10 told us that they do not submit files with Medicaid enrollment and payment information for uninsured individuals with COVID-19 testing coverage to the national clearinghouses. Officials from four of these states said they respond to requests from providers or other payers about Medicaid coverage of specific individuals, but do not transmit these data to national clearinghouses. Officials from five other states told us that they do submit Medicaid enrollment and payment information for uninsured individuals with COVID-19 testing coverage to national clearinghouses.
Because HRSA’s payment controls rely on information submitted to those national clearinghouses, we continue to have concerns about the potential for duplicate or erroneous payments and plan to monitor the results of these prospective and retrospective payment controls to assess their effectiveness. As discussed below, however, states have reported limited Medicaid spending for COVID-19 testing for uninsured individuals, as of October 31, 2020.
Medicaid spending. As of October 31, 2020, COVID-19-related federal Medicaid expenditures totaled approximately $23 billion, or 7 percent of

Appendix I: Enclosures
Page 126 GAO-21-191
total federal spending, on Medicaid services for this time period.159 The majority of the COVID-19-related spending is for the 6.2 percent FMAP increase, with about $336,000 for testing payments by the 15 states and three territories approved to cover COVID-19 diagnostic testing and related services to uninsured individuals under their Medicaid plans with a 100 percent federal match.
Based on information we obtained from the 14 states and one of the three territories approved to cover testing for uninsured individuals through Medicaid, the implementation of the coverage has been slow. For example,
· One state that has implemented coverage of COVID-19 testing for the uninsured stated that they have received and paid few claims.
· One state that has reported few COVID-19 testing expenditures noted that having two different payment programs for COVID-19 testing for the uninsured adds a level of complexity to administering the Medicaid coverage and for providers to bill correctly.
The table below summarizes federal Medicaid spending related to the 6.2 percent FMAP increase, COVID-19 expenditures in Medicaid programs approved to cover testing for uninsured individuals, and total Medicaid spending for services as of October 31, 2020.
159 The most recent available payment information is for the second quarter of fiscal year 2020 (January 1, 2020, through March 31, 2020) through the fourth quarter of fiscal year 2020 (July 1, 2020 through October 31, 2020). States can report payments and adjustments to payments up to 2 years after a quarter ends. The increased federal medical assistance percentage (FMAP) is available for Medicaid medical assistance expenditures for which each state’s standard state-specific FMAP rate is used to determine federal funding.
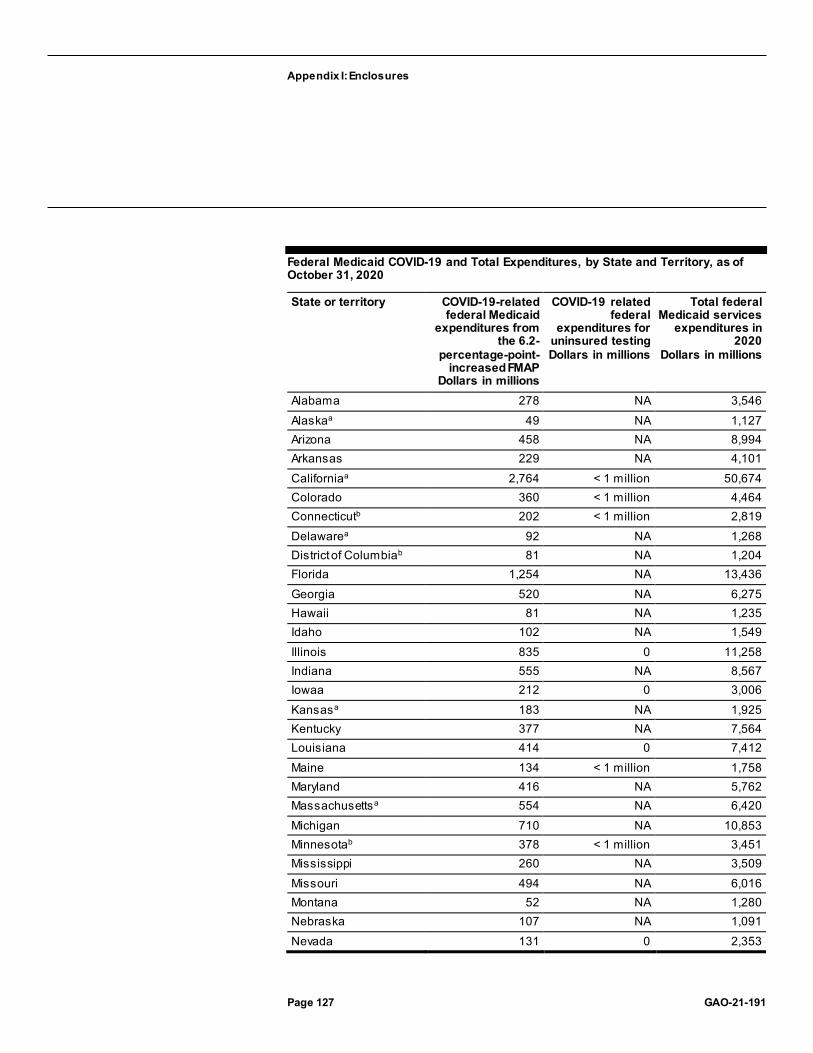
Appendix I: Enclosures
Page 127 GAO-21-191
Federal Medicaid COVID-19 and Total Expenditures, by State and Territory, as of October 31, 2020
State or territory COVID-19-related federal Medicaid
expenditures from the 6.2-
percentage-point-increased FMAP
Dollars in millions
COVID-19 related federal
expenditures for uninsured testing Dollars in millions
Total federal Medicaid services
expenditures in 2020
Dollars in millions
Alabama 278 NA 3,546 Alaskaa 49 NA 1,127 Arizona 458 NA 8,994 Arkansas 229 NA 4,101 Californiaa 2,764 < 1 million 50,674 Colorado 360 < 1 million 4,464 Connecticutb 202 < 1 million 2,819 Delawarea 92 NA 1,268 District of Columbiab 81 NA 1,204 Florida 1,254 NA 13,436 Georgia 520 NA 6,275 Hawaii 81 NA 1,235 Idaho 102 NA 1,549 Illinois 835 0 11,258 Indiana 555 NA 8,567 Iowaa 212 0 3,006 Kansasa 183 NA 1,925 Kentucky 377 NA 7,564 Louisiana 414 0 7,412 Maine 134 < 1 million 1,758 Maryland 416 NA 5,762 Massachusettsa 554 NA 6,420 Michigan 710 NA 10,853 Minnesotab 378 < 1 million 3,451 Mississippi 260 NA 3,509 Missouri 494 NA 6,016 Montana 52 NA 1,280 Nebraska 107 NA 1,091 Nevada 131 0 2,353

Appendix I: Enclosures
Page 128 GAO-21-191
State or territory COVID-19-related federal Medicaid
expenditures from the 6.2-
percentage-point-increased FMAP
Dollars in millions
COVID-19 related federal
expenditures for uninsured testing Dollars in millions
Total federal Medicaid services
expenditures in 2020
Dollars in millions
New Hampshire 89 0 1,119 New Jersey 591 NA 7,716 New Mexico 206 < 1 million 4,083 New York 2,754 NA 35,093 North Carolinaa 489 0 6,023 North Dakota 48 NA 625 Ohioa 610 NA 8,935 Oklahomaa 227 NA 2,855 Oregona 344 NA 6,297 Pennsylvaniab 925 NA 11,405 Rhode Island 101 NA 1,394 South Carolina 310 NA 3,882 South Dakota 41 NA 486 Tennessee 515 NA 5,957 Texas 2,009 NA 22,599 Utah 115 < 1 million 1,858 Vermont 64 NA 797 Virginia 313 NA 4,414 Washingtonb 267 NA 4,254 West Virginiab 104 0 1,774 Wisconsina 431 NA 3,795 Wyoming 26 NA 273 States totalc 22,858 <1 million 318,552 American Samoa 2 NA 31 Guam 4 NA 95 Northern Mariana Islands
2 0 32
Puerto Rico 74 0 1,822 Virgin Islandsb 1 0 31 Territories totalc 83 0 2,011
Legend FMAP = federal medical assistance percentage NA = Not applicable. States that did not provide COVID-19 testing for uninsured individuals as of October 31, 2020. Source: GAO analysis of data from the Centers for Medicare & Medicaid Services. | GAO-21-191.

Appendix I: Enclosures
Page 129 GAO-21-191
Note: Federal Medicaid payments w ere available for the second, third and fourth quarters of f iscal year 2020—January 1, 2020, through October 31, 2020—and do not include expenses for program administration. aEleven states that reported expenditures for the fourth quarter, reported uncertified expenditures. All the states and territories reported certif ied expenditures for the second and third quarters. Certif ied state expenditures have been review ed by states and are certif ied as being Medicaid allow able expenditures. Both certif ied and uncertif ied state expenditures are preliminary, as they are subject to further review and are likely to be updated as states continue to report their expenditures and receive federal matching funds. States can report payments and adjustments to payments up to 2 years after a quarter ends. bSix states and the 1 territory did not report any fourth quarter expenditures as of October 31, 2020. cTotals may not sum exactly due to rounding.
Agency Comments
We provided a draft of this enclosure to HHS and the Office of Management and Budget (OMB) for review and comment. HHS provided technical comments, which we incorporated as appropriate. OMB did not provide comments on this enclosure.
GAO’s Methodology
To conduct this work, we reviewed federal laws, CMS data from its Medicaid expenditure reporting system, HRSA’s publically available data on payments for COVID-19 testing for uninsured individuals, and Congressional Budget Office spending estimates. We also reviewed CMS Medicaid guidance, including requirements for administering the optional COVID-19 testing for the uninsured; and HRSA guidance and requirements for providers to submit claims for COVID-19 testing for uninsured individuals; and our prior work related to Medicaid. We reviewed CMS guidance to states on reporting COVID-19 expenditures through the Medicaid expenditure reporting system and conducted data reliability checks on state reported-expenditure data. We reviewed HRSA documentation and written responses from agency officials regarding HRSA’s payment data. We determined that the CMS and HRSA data were sufficiently reliable for the purpose of this enclosure. We discussed HRSA’s efforts to prevent duplicate or erroneous payments with HRSA officials. We also received information from Medicaid officials in 14 states and 1 territory that have implemented Medicaid coverage for COVID-19 testing for the uninsured to understand how states are implementing this coverage and the extent they share Medicaid coverage and payment information with national insurance clearinghouses. Their views are not generalizable across all states.
Contact information: Carolyn L. Yocom, (202) 512-7114, [email protected]

Appendix I: Enclosures
Page 130 GAO-21-191
Medicare Telehealth Waivers
Telehealth can provide important access for beneficiaries and enable providers to continue delivering services; however, Medicare also needs to be attentive to the risks associated with waivers of telehealth payment requirements. The Centers for Medicare & Medicaid Services needs strong oversight of Medicare telehealth services to prevent fraud, waste, and abuse in light of waivers of key requirements that widely expanded availability of these services.
Entities involved: Centers for Medicare & Medicaid Services, within the Department of Health and Human Services
Key Considerations and Future GAO Work
We reported in June 2020 that careful monitoring is required to prevent potential fraud, waste, abuse, and improper payments that can arise from waiving longstanding requirements and safeguards in the Medicare program in response to the COVID-19 pandemic.160 Officials at the Centers for Medicare & Medicaid Services (CMS) told us that the agency is using existing program integrity practices and has also implemented new program safeguards to prevent improper payments and reduce fraud, waste, and abuse related to telehealth waivers. As we have noted previously when reporting on Medicare program integrity, having safeguards is critical for effective program management. Given stakeholder interest in making some telehealth waivers permanent, CMS needs strong oversight to mitigate these risks as well as guard against potential overutilization of telehealth because of its convenience. For example, increased utilization of telehealth services may result in increased Medicare spending, especially if those services are used to supplement, not just substitute for, in-person visits both during and after the pandemic. We plan to conduct additional work on the effect of telehealth waivers on utilization, access, and quality of care, as well as CMS’s continued oversight of these services.
160 In general, improper payments are payments that should not have been made or were made in the incorrect amount. Fraud involves an intentional act or representation to deceive with the knowledge that the actions or representation could result in gain. The judicial or another adjudicative system determines whether an act is fraud. Waste includes overusing services, such as excessive diagnostic testing. Abuse involves actions inconsistent with acceptable business or medical practices.
Appendix I: Enclosures
Page 131 GAO-21-191
Background
Telehealth services include certain clinical services that are typically furnished in person but are instead provided remotely via telecommunications technologies. By law, Medicare fee-for-service generally only pays for these services under limited circumstances; such as when the patient is located in certain health care settings and certain, mostly rural, geographic locations and the service is performed by certain provider types.161
In response to COVID-19, the Secretary of Health and Human Services declared a public health emergency on January 31, 2020, and the President declared a national emergency on March 13, 2020. These two actions triggered the availability of authority under section 1135 of the Social Security Act to temporarily waive or modify certain requirements of the Medicare program. In addition, Congress passed and the President signed three laws that progressively expanded or clarified the Secretary’s authority to temporarily waive or modify existing Medicare telehealth requirements.162 Using these authorities, the Secretary waived or modified certain telehealth provisions to increase access to services and give providers more flexibility in treating beneficiaries.163 Among other things, the changes
· allow telehealth services to be provided nationwide, rather than in mostly rural locations;
161 In addition to services on the Medicare allowable telehealth services list, such as office visits and office-based psychiatry services that may also be provided in person, Medicare also pays for other types of services furnished commonly using telecommunications technology, including remote evaluation of recorded video or images of patients and virtual check-ins by a physician or non-physician practitioner who can report office visits.
162 Coronavirus Preparedness and Response Supplemental Appropriations Act, 2020, Pub. L. No. 116-123, Div. B, § 102, 134 Stat. 146, 155-157; Families First Coronavirus Response Act, Pub. L. No. 116-127, § 6010, 134 Stat. 178, 210 (2020); CARES Act, Pub. L. No. 116-136, § 3703, 134 Stat. 281, 416 (2020).
163 For more information on all waivers related to COVID-19, see Department of Health and Human Services, Centers for Medicare and Medicaid Services, Physician and Other Clinicians: CMS Flexibilities to Fight COVID-19, Baltimore, Md.: Aug. 20, 2020, accessed August 25, 2020, https://www.cms.gov/files/document/covid-19-physicians-and-practitioners.pdfand Centers for Medicare and Medicaid Services, COVID-19 Emergency Declaration Blanket Waivers for Health Care Providers, Baltimore, Md.: Aug. 20, 2020, accessed August 25, 2020, https://www.cms.gov/fi les/document/summary-covid-19-emergency-declaration-waivers.pdf.

Appendix I: Enclosures
Page 132 GAO-21-191
· allow beneficiaries to receive, and providers to furnish, telehealth services from any setting, including beneficiaries’ and providers’ homes;
· temporarily add more than 135 telehealth services to the list of covered telehealth services, including 11 services that were recently added through an expedited process for approval of new services instead of the normal rulemaking process which required notice and opportunity to comment to stakeholders;
· allow certain services to be furnished using audio-only technology such as telephones, instead of requiring the use of audio and video systems; and expand eligible provider types to include physical therapists, occupational therapists, and speech language pathologists, among others.
To ensure an adequate supply of providers to respond to the pandemic, CMS also waived other program requirements that affect the way providers deliver services, including telehealth services. For example, CMS temporarily removed, when certain conditions are met, Medicare’s requirement that out-of-state practitioners be licensed in the state where they are providing services. CMS also waived certain provider screening requirements, including criminal background checks for newly enrolling home health agencies and opioid treatment programs.
Overview of Key Issues
Increased telehealth utilization. With the new telehealth waivers, utilization of these services sharply increased, according to the Department of Health and Human Services’ (HHS) Office of the Assistant Secretary for Planning and Evaluation (ASPE). For example, weekly telehealth primary care visits increased sharply from about 6,700 in mid-March 2020 (just before the telehealth waivers were issued) to peak at almost 1.3 million in mid-April 2020, while in-person visits precipitously dropped during this time. The spike in telehealth services began leveling off as in-person visits resumed in late April 2020.164
164 See Department of Health and Human Services, Assistant Secretary for Planning and Evaluation (ASPE), Medicare Beneficiary Use of Telehealth Visits: Early Data from the Start of COVID-19 Pandemic. (Washington, D.C.: July 28, 2020), p. 5. ASPE analyzed preliminary Medicare Part B claims data from January through June 3, 2020, available as of June 16. In its analysis, ASPE defined primary care visits to include office visits, preventive and advanced care planning services, but not communications technology-based services such as virtual check-ins.
Appendix I: Enclosures
Page 133 GAO-21-191
Potential for increased overall Medicare utilization and spending. There is broad interest among providers and policymakers in permanently adopting some of these telehealth waivers; however, some experts have cautioned that the convenience of telehealth can increase utilization of services and, therefore, spending. For example, Medicare providers may begin billing for follow-up telephone visits (which they could not bill before) after an in-person visit, or beneficiaries may seek, and providers may bill for, treatment of less serious conditions such as the common cold.
Some studies have shown that telehealth can be additive; for example, a 2017 study of Medicare beneficiaries’ use of telehealth services for mental health concluded that these services added to, rather than substituted for, in-person services.165 ASPE’s analysis also shows stable use of telehealth services at a higher level than prior to the pandemic after in-person services started to resume. This suggests that the increased demand for telehealth may continue even after the pandemic. Since Medicare pays equivalent rates for telehealth as for in-person services, continued utilization of telehealth services can increase total Medicare spending if it results in an overall increase in services—both in-person and telehealth combined.
Potential for improper payments and fraud, waste, and abuse. Expansion of telehealth waivers and the subsequent growth in telehealth utilization have prompted concern among policymakers and researchers about the potential for improper payments, and fraud, waste, and abuse in the Medicare program. Fraud schemes involving telehealth have been previously reported. For example, according to a report issued by the HHS Office of Inspector General and the Department of Justice, in fiscal year 2019, the federal government filed charges relating to a telemedicine and durable medical equipment scheme and a genetic testing scheme involving fraudulent telemedicine companies that together resulted in losses of over $3 billion.166
CMS oversight activities during the pandemic. According to agency officials, CMS continues to utilize existing program integrity tools during
165 Mehrotra, A., H. A. Huskamp, J. Souza, et al. 2017, “Rapid growth in mental health telemedicine use among rural Medicare beneficiaries, wide varia tion across states,” Health Affairs 36, no. 5 (May): 909–917.
166 Department of Health and Human Services and Department of Justice, Health Care Fraud and Abuse Control Program, Annual Report for Fiscal Year 2019 (June 2020), 12.

Appendix I: Enclosures
Page 134 GAO-21-191
the pandemic to prevent improper payments and reduce fraud, waste, and abuse associated with telehealth services. For example, CMS is
· using its Fraud Prevention System to identify inappropriate Medicare claims prior to payment and to flag providers with suspicious billing patterns through post-payment screens; and
· analyzing claims data and engaging in increased collaboration with federal law enforcement agencies to identify and address COVID-19 related fraud schemes.
In addition, according to CMS officials, after temporarily suspending pre- and post-payment medical reviews, CMS has resumed post-payment reviews for claims filed prior to March 1, 2020, and has initiated post-payment review for claims filed thereafter for specific investigative projects. CMS has also resumed normal provider investigation activities that require written communications after temporarily limiting them. CMS is allowing reviews that require in person interactions only with prior CMS approval and consistent with any state and local requirements.
CMS officials further stated that in response to the pandemic the agency has implemented new program integrity activities to mitigate the risks of fraud, waste, and abuse related to telehealth waivers, including:
· closely monitoring billing behaviors in areas particularly prone to fraud;
· conducting stakeholder calls and issuing guidance designed to educate providers on the additional telehealth flexibilities, including how to appropriately bill for telehealth services;
· informing beneficiaries about Medicare coverage of telehealth services through updates to Medicare.gov and the 2021 “Medicare & You” handbook, and using newspapers, email, and social media to educate beneficiaries about available telehealth services.
CMS has stated that it is actively monitoring telehealth services, but that it is too early to fully assess the effectiveness of these efforts. We will continue working with CMS to further evaluate the agency’s program integrity efforts related to telehealth waivers, including review of relevant policies, documentation of the agency’s existing and new program integrity safeguards, and examples of potential improper billing or fraudulent activities uncovered through these efforts.

Appendix I: Enclosures
Page 135 GAO-21-191
Agency Comments
We provided a draft of this enclosure to HHS and the Office of Management and Budget (OMB) for review and comment. HHS provided technical comments on this enclosure, which we incorporated as appropriate. OMB did not have comments on this enclosure.
GAO’s Methodology
We reviewed applicable federal laws and regulations, agency guidance and other materials, and we obtained written answers to questions from CMS officials.
Contact information: Jessica Farb, (202) 512-7114, [email protected]
Indian Health Service
Indian Health Service has obligated $713 million of the $1 billion in supplemental funds directly appropriated to the agency, as of September 30, 2020, to prevent, prepare, and respond to the COVID-19 pandemic.
Entity involved: Indian Health Service, within the Department of Health and Human Services
Key Considerations and Future GAO Work
We plan to monitor Indian Health Service’s (IHS) use of funds provided under COVID-19 relief laws going forward and the agency’s response and recovery efforts to address the pandemic, including the use of telehealth and coordination with other federal agencies. Separately, we also plan to examine disparities in health outcomes related to COVID-19 among different populations, including the American Indian and Alaska Native (AI/AN) population, and the behavioral health impacts of COVID-19.
Background
IHS, an agency within the Department of Health and Human Services (HHS), is charged with providing health care services to more than 2 million AI/AN people who are members or descendants of federally

Appendix I: Enclosures
Page 136 GAO-21-191
recognized tribes.167 IHS provides health care services either directly through a system of facilities, such as hospitals, health clinics, and health stations that it operates; or indirectly through facilities operated by tribes or others.168 In addition, IHS awards contracts and grants to urban Indian organizations that provide health care to AI/AN people residing in urban centers.
As of October 17, 2020, IHS had reported 61,191 confirmed cases of COVID-19, with some tribes experiencing more cases per capita than most U.S. states.169 The COVID-19 relief acts appropriated more than $1 billion in supplemental funding to IHS for its COVID-19 efforts. This includes $64 million appropriated by the Families First Coronavirus Response Act and about $1 billion appropriated by the CARES Act.170 In addition to funds specifically appropriated for IHS, HHS also allocated other COVID-19 relief funding to IHS.171 We previously reported in June 2020 on IHS’s allocation of its supplemental COVID-19 relief funding by program area and activity.
167 Federally recognized tribes have a government-to-government relationship with the United States and are eligible to receive certain protections, services, and benefits by virtue of their status as Indian tribes. The Secretary of the Interior annually publishes in the Federal Register a list of all tribal entities that the Secretary recognizes as Indian tribes. As of January 30, 2020, there were 574 federally recognized tribes. See 85 Fed. Reg. 5462 (Jan. 30, 2020).
168 As of February 2019, IHS, tribes, and tribal organizations operated 46 hospitals and 353 health centers, as well as a range of other health facilities, of which 24 hospitals and 50 health centers were federally operated IHS facilities. IHS also enters into agreements with 41 urban Indian organizations.
169 For more information on the number of reported COVID-19 cases among those IHS serves and its response, see https://www.ihs.gov/coronavirus, accessed October 19, 2020.
170 Pub. L. No. 116-136, div. B, tit. VIII, 134 Stat. 281, 550 (2020); Pub. L. No. 116-127, 134 Stat. 178, 181 (2020).
171 For example, HHS allocated $500 million to IHS, tribal, and Urban Indian facilities from the Provider Relief Fund, established to reimburse eligible health care providers for health care related expenses and lost revenues attributable to coronavirus. See, e.g., Pub. L. No. 116-136, div. B, tit. VIII, 134 Stat. 281, 563 (2020). HHS also allocated $70 million to IHS—$30 million of which went to IHS-operated health programs and $40 million of which went to the IHS National Supply Service Center—from the Coronavirus Preparedness and Response Supplemental Appropriations Act, 2020. In addition, the Paycheck Protection Program and Health Care Enhancement Act appropriated funding specifically for tribes, tribal organizations, Urban Indian Health Programs, and health care service providers to tribes, including $750 million for testing. Pub. L. No. 116 -139, div. B, tit. I, 134 Stat. 620, 624 (2020).

Appendix I: Enclosures
Page 137 GAO-21-191
As of September 30, 2020, IHS had obligated most of its supplemental funding to support IHS-identified priorities related to COVID-19, including prevention, detection, treatment, and recovery. (See table below.)

Appendix I: Enclosures
Page 138 GAO-21-191
Allocation and Obligation of Supplemental Funding Provided to the Indian Health Service (IHS) to Address COVID-19
Purpose Amount allocated
(dollars in millions)
Amount obligated as of
9/30/20 (dollars in
millions) CARES Acta: IHS federal health programs and Tribal Health Programs (THP). Funding allocated using existing distribution methodologies for program increases in hospitals and health clinics, purchased and referred care, alcohol and substance abuse, mental health, community health representatives, and public health nursing funding.
$465 $395
CARES Acta: Purchased and referred care (PRC). Care for medical or dental services provided outside of IHS or tribal health care facilities, allocated using the PRC distribution formula for new PRC funds.
155 117
CARES Acta: Telehealth expansion. To support activities across the IHS, tribal, and urban Indian organization (UIO) health programs.
95 0
CARES Acta: Medical equipment. Included within $125 million transfer limit to IHS facilities account.
74 56
CARES Acta: Electronic health record stabilization and support.
65 0.2
CARES Acta: Urban Indian Organizations. Funding provided through existing contracts under the Indian Health Care Improvement Act as a one-time amount for each UIO plus an additional amount based on each UIO’s urban Indian users.
50 50
CARES Acta: Maintenance and improvements. Included within $125 million transfer limit to IHS facilities account.
41 32
CARES Acta: Unanticipated needs. 30 0 CARES Acta: Epidemiology, surveillance, and coordination. Funding for Tribal Epidemiology Centers and national surveillance coordination at IHS headquarters.
26 12
CARES Acta: Sanitation and potable water. Included within $125 million transfer limit to IHS facilities account.
10 9
CARES Acta: Non-clinical federal staff support. Activities include deep cleaning of office space, equipment for teleworkers, protection for non-clinical staff, and non-clinical staff overtime.
10 0

Appendix I: Enclosures
Page 139 GAO-21-191
Purpose Amount allocated
(dollars in millions)
Amount obligated as of
9/30/20 (dollars in
millions) CARES Acta: Public health support activities. Includes partnerships with key stakeholders to broaden messaging about COVID-19 prevention, response, and recovery in Indian Country.
6 0
CARES Acta: Test kits and materials. Supports acquisition and distribution to IHS, THPs, and UIOs.
5 1
Families First Coronavirus Response Act: COVID-19 testing. For diagnostic tests and related office visits.
64 53
Source: GAO review of IHS information. | GAO-21-191 aThe CARES Act included three provisions guiding IHS’s allocations: (1) A minimum of $450 million for distribution to IHS directly operated programs, tribal health programs, and Urban Indian Organizations; (2) a maximum of $65 million for electronic health record stabilization and support; and (3) any remaining funds to be allocated at the discretion of the IHS Director for COVID-19 response activities, w ith a maximum of $125 million allow ed to be transferred to the IHS facilities account.
Overview of Key Issues
Allocation of funds. In responding to the pandemic, IHS has quickly obligated and expended supplemental funding to health care providers and to address facility, sanitation, and equipment needs; however, certain funds for testing and related activities—appropriated to HHS, but administered by IHS—have taken longer to obligate and expend.
Direct funding distributions. The CARES Act established a minimum amount of $450 million to be distributed directly to IHS operated health programs, tribally operated health programs, and urban Indian organizations. IHS allocated $515 million for this purpose, most of which had been obligated as of September 30, 2020. IHS officials said that the agency’s ability to modify tribal organizations’ contracts under the Indian Self-Determination and Education Assistance Act allowed it to quickly disburse the funds. Overall, $713 million of the $1.096 billion directly appropriated to IHS had been obligated as of September 30, 2020, 90 percent of which has been expended.
Additional costs and improvements. IHS has estimated that billions of dollars are needed to address a backlog of costs related to facility maintenance and improvements, sanitation and potable water projects, and medical equipment needs—all of which make responding to COVID-19 more difficult. In addition to providing funds for health services and

Appendix I: Enclosures
Page 140 GAO-21-191
operations, the CARES Act authorized IHS to transfer up to $125 million of the supplemental appropriation for its Indian Health Services appropriation account to its Indian Health Facilities account. IHS allocated the maximum amount for these purposes.
IHS’s role in testing and related activities. In addition to CARES Act and Families First Coronavirus Response Act funding appropriated to IHS for its COVID-19 response, the agency has a role in disbursing $750 million appropriated to HHS under the Paycheck Protection Program and Health Care Enhancement Act for COVID-19 testing and testing-related activities.172 According to IHS officials, HHS used an Intra-Departmental Delegation of Authority to authorize IHS to provide the funds to IHS and tribal health programs, but the funds retained their identity as HHS appropriated amounts. According to IHS, disbursing the funds in this manner required the agency to execute agreements with each tribe or tribal organization. IHS officials noted that the execution of these bilateral amendments creates a capacity concern for IHS and some tribes, especially smaller tribes and those in hotspots that need to focus on immediate and urgent COVID-19 response activities within their communities.
Telehealth expansion. In June 2020, we reported that IHS allocated $95 million to expand access to telehealth services. IHS officials reported experiencing nearly a twenty-fold increase in telehealth visits through the agency’s primary telehealth platform. Since the April telehealth expansion, usage has increased from about 75 visits per week, on average, to a peak of 1,400 per week, with average use as of October at about 450 visits per week.173 We previously reported on the challenges IHS experienced with the increased use of telehealth services pushing or exceeding the limits of broadband availability in remote and rural areas.
IHS reported that the agency reviewed access to acute care facilities and has identified several facilities with moderate telehealth bandwidth. Officials told us that all IHS facilities have connectivity to support some level of telehealth services; however, the majority of rural patients lack adequate access to service in their homes. IHS noted that the Federal
172 Pub. L. No. 116-139, div. B, tit. I, 134 Stat. 620, 624 (2020).
173 IHS officials noted that this number does not include other telehealth modalities such as care provided over the telephone, which patients use as an alternative to access virtual care in the bandwidth-constrained environments of Indian country.

Appendix I: Enclosures
Page 141 GAO-21-191
Communications Commission (FCC) has provided access opportunities through the COVID-19 Telehealth Program.174 IHS also continues to support tribal applications and reimbursement through the Rural Health Care program within FCC’s Universal Services Fund.175
Federal partnerships. During the pandemic, IHS officials have leveraged federal partnerships with the Department of Veterans Affairs (VA), Veterans Health Administration, and Federal Emergency Management Agency (FEMA). Based on the Secretary of Health and Human Services’s public health emergency declaration, IHS officials reported that VA expanded access to hospital care and medical services in its VA network to non-veteran beneficiaries. For example, agency officials noted that VA provided care to non-veteran patients of a IHS facility that was not able to provide decompression for patients on ventilators. Doing so freed up the IHS facility to treat other critical patients.
Additionally, IHS reported that the agency has worked with FEMA under the President’s emergency declaration. IHS further noted that the agency is working to pursue a formal partnership with the Strategic National Stockpile to receive supplies, medicines, and devices for life-saving care on a short-term basis and tribal governments now have the option to request public assistance from FEMA.
Agency Comments
We provided a draft of this enclosure to HHS and the Office of Management and Budget (OMB) for review and comment. HHS provided technical comments on this enclosure, which we incorporated as appropriate. OMB did not have comments on this enclosure.
174 The CARES Act appropriated $200 million to the FCC to develop a new COVID-19 Telehealth Program to help combat COVID-19 and support efforts of health care providers to provide telehealth services. As of July 8, 2020, the FCC approved $200 million in funding applications to expand telehealth services during the COVID-19 pandemic. Pub. L. No. 116-136, div. B, tit. VIII, 134 Stat. 281, 531 (2020).
175 The FCC designated the Rural Health Care Program, a division of the Universal Service Fund, to provide fiscal support and reduced rates to rural health care providers for telecommunications services and Internet access charges related to the use of telemedicine and telehealth. IHS and tribal health care providers (eligible clinics, hospitals, and others) can take advantage of the program to offset the high cost of their rural telecommunication services.

Appendix I: Enclosures
Page 142 GAO-21-191
GAO’s Methodology
To conduct this work, we reviewed federal laws and agency documents, and received written responses to our questions from agency officials.
Contact information: Jessica Farb, (202) 512-7114, [email protected]
Veterans Health Care
The Department of Veterans Affairs does not have a plan to conduct routine inspections on the quality of care in all state veterans homes, which provide nursing home care, during the COVID-19 pandemic, nor is it collecting timely data on COVID-19 cases and deaths in these nursing home facilities.
Entity involved: Veterans Health Administration, within the Department of Veterans Affairs
Recommendations for Executive Action
The Department of Veterans Affairs Under Secretary for Health should develop a plan to ensure inspections of state veterans homes occur during the COVID-19 pandemic, which may include using in-person, a mix of virtual and in-person, or fully virtual inspections.
The Department of Veterans Affairs Under Secretary for Health should collect timely data on COVID-19 cases and deaths in each state veterans home, which may include using data already collected by the Centers for Medicare & Medicaid Services.
Key Considerations and Future GAO Work
We previously reported shortcomings in the Department of Veterans Affairs’ (VA) inspections of nursing home facilities, including state veterans homes (SVH), and highlighted these concerns in our June 2020 report. Nursing home residents, who often are in frail health and living in close proximity, are at a high risk of being infected with—and dying from—COVID-19, according to the Centers for Disease Control and Prevention (CDC). (See our enclosure on Nursing Homes.)
Because of these known risks, the health and safety of the more than 20,000 residents in 158 SVHs VA reports has been a particular concern.

Appendix I: Enclosures
Page 143 GAO-21-191
For example, according to CDC data, the greatest risk for severe illness from COVID-19 is among those aged 85 or older and almost half of veterans in SVHs are in this age group.
In July 2019, we reported that VA does not require its inspection contractor to identify all failures to meet VA’s quality standards as deficiencies. Instead, SVHs can address issues while the contractor is onsite to avoid being cited for a deficiency on the inspection report. Because VA does not have complete information on deficiencies identified at SVHs, and therefore cannot track this information to help identify trends in quality across these homes, we recommended that VA should require all failures to meet standards to be cited as deficiencies.
VA concurred with this recommendation. In August 2020, VA modified its contract to require its inspection contractor to begin citing all failures to meet standards as deficiencies, according to VA officials. As of October 2020, VA reported it is in the process of revising its policy to reflect this requirement.
We also recommended that VA provide information on the quality of all SVHs that is comparable to the information provided on the other nursing home settings on its website. Although the Centers for Medicare & Medicaid Services (CMS) inspects approximately two-thirds of SVHs (those receiving funding from CMS), VA is the only federal entity that conducts regular inspections on the quality of care in all SVHs.176
Therefore, VA possesses information that is not available elsewhere. VA concurred in principle and as of October 2020, reported it is exploring options for how to implement our recommendation.
In the coming years, VA projects an increase in the number of veterans receiving nursing home care. This makes it particularly important that VA ensure veterans receive quality care. We have ongoing work reviewing VA’s response to the pandemic in community living centers (CLC)—VA -owned and-operated nursing homes. We also plan to examine infection prevention at SVHs, and the quality of care at CLCs.
176 CMS provides oversight for the approximately two-thirds of SVHs that receive Medicare or Medicaid payments. CMS defines the quality standards that approximately 15,500 nursing homes nationwide must meet in order to participate in the Medicare and Medicaid programs. See 42 C.F.R. Part 483, Subpart B. To monitor compliance with these standards, CMS contracts with state survey agencies to conduct inspections of each nursing home not less than once every 15 months.

Appendix I: Enclosures
Page 144 GAO-21-191
Background
VA administers one of the largest health care systems in the U.S. and provides health care to more than 9 million veterans—including more than 39,000 veterans in a variety of nursing home settings. For example, VA partners with state governments, who own and operate SVHs. According to VA, in fiscal year 2019, VA paid SVHs $1.17 billion for an average daily census of 20,072 veterans and projects it will pay $1.7 billion to SVHs in fiscal year 2022.177 Although VA does not exercise any supervision or control over the administration, personnel, maintenance, or operation of any SVH, it conducts annual inspections.178 In addition, VA policy prevents it from making payments to SVHs until it determines that they meet applicable quality standards.179
The CARES Act contains several provisions to assist SVHs in their response to COVID-19.180 Specifically, it waives requirements that SVHs maintain a 90 percent overall occupancy rate and 75 percent veteran occupancy rate, to ensure SVHs continue to receive per diem payments from VA at a time when occupancy rates are declining. VA data show the average number of veterans receiving care in a SVH declined 6 percent between 2019 and 2020. In addition, the CARES Act included $150 million for SVH construction grants to prevent, prepare for, and respond to COVID-19.181
Overview of Key Issues
Routine inspections of SVHs have stopped. In March 2020, VA instructed its contractor to stop routine inspections of SVHs, which had been conducted in person, due to concerns about COVID-19. As of September 177 For SVHs, 80 percent of veterans receive VA’s partial daily rate that covers about one-quarter of their care costs. For example, in fiscal year 2017, VA’s average SVH per diem was $106 for veterans without eligible service -connected disabilities. VA paid the full cost of care for the remaining 20 percent of veterans with service -connected disabilities. In fiscal year 2017, the full rate for these veterans averaged $397 per day.
178 38 U.S.C. § 1742(b).
179 Department of Veterans Affairs, Veterans Health Administration (VHA) Directive 1145.01. Survey Procedures for State Veterans Homes Providing Nursing Home Care and/or Adult Day Health Care. Washington, D.C.
180 Pub. L. No. 116-136, div. B, tit. X, 134 Stat. 281, 584-587 (2020).
181 Pub. L. No. 116-136, 134 Stat. at 584 (2020).

Appendix I: Enclosures
Page 145 GAO-21-191
2020, these inspections had not resumed, and VA issued a stop work order instructing its contractor to halt annual inspections until November 20, 2020. VA policy requires that every SVH be inspected at least annually.182
According to VA, it is exploring options to resume annual inspections of SVHs, such as using a mix of virtual and on-site inspection processes.183
Surges in cases of COVID-19, safety of airline travel, and national contracts for SVH inspections not designed to be conducted virtually are all factors affecting when and how in-person inspections will resume. However, VA does not have a plan for how it will assess these factors to determine how and when to continue annual inspections. If VA—the federal agency that conducts routine inspections on the quality of care for all SVHs—is not conducting these inspections, it cannot ensure the quality of nursing home care provided to veterans. This leaves veterans at risk of receiving poor quality care. Further, VA does not have information on deficiencies at all SVHs and therefore cannot track this information to help identify trends and make any necessary improvements in quality across these homes.
VA officials said that in the absence of routine inspections, VA can initiate a for-cause inspection of a SVH to review specific single or series of incidents, complaints, deficiencies, or events that may jeopardize the health or safety of residents.
According to VA officials and its contractor, from July to September 2020, VA has initiated four for-cause inspections at SVHs, which were conducted in-person.
· One inspection was initiated for concerns related to a COVID-19 outbreak. The contractor found that the facility was in full compliance, and all infection control steps had been taken to prevent the spread of COVID-19.
· The other three inspections were for non-COVID-19 concerns, such as resident falls. The contractor identified deficiencies at one of the three SVHs.
182 See VHA Directive 1145.01.
183 VA’s contractor told us it offered suggestions to VA on how to continue more comprehensive oversight inspections of SVHs during COVID-19, for example by having fewer inspectors on site and conducting record reviews off site, but that VA did not approve these plans.

Appendix I: Enclosures
Page 146 GAO-21-191
Other inspections of long-term care facilities have continued during the pandemic. For example:
· VA has directed CLCs to use a self-assessment process to adapt the inspection process for COVID-19 during the pandemic.
· CMS is using a targeted infection survey or high-priority complaint investigation for the nation’s more than 15,000 Medicare- and Medicaid-certified nursing homes, including approximately two-thirds of SVHs, which continues during the pandemic.184 (See our Nursing Homes enclosure.) However, because approximately one-third of SVHs are not subject to CMS oversight, these SVHs have not been subject to these inspections and, therefore, have had no routine federal inspections during the pandemic.185
COVID-19 guidance. In response to COVID-19, VA has communicated with SVHs on a range of issues. For example:
· noting the steps it took in its CLCs to address COVID-19, including daily assessments of staff and residents for symptoms of COVID-19, limiting the number of visitors, and social distancing procedures;
· recommending SVHs follow guidance from CDC, CMS, and their specific state’s public health department regarding COVID-19 management and prevention;
· expanding telehealth capabilities to reduce COVID-19 exposure risk for veterans at SVHs;
· contacting their respective local VA medical centers for informal coaching on best practices in SVH operations, patient care, and employee safety; and
· requesting VA assistance through VA’s civilian public health response efforts and ensuring SVHs receive per diem payments through the CARES Act waivers, according to officials from the National Association of State Veterans Homes (NASVH). As of October 2020, VA officials told us that it has supported the needs of 86 SVHs—
184 Compared to standard surveys, which are comprehensive, targeted infection control surveys use a more streamlined review checklist. According to CMS, this is to minimize the impact on provider activities while ensuring that providers are implementing actions to protect the health and safety of individuals in response to the COVID -19 pandemic
185 In 2019 (see Related GAO Products), we reported that approximately two -thirds of the 148 SVHs across the country received Medicare or Medicaid payments.

Appendix I: Enclosures
Page 147 GAO-21-191
including obtaining staff, testing, and PPE—in 38 states and the District of Columbia as they respond to COVID-19.186
VA officials said it will continue to provide guidance and assistance to SVHs as requested or needed.
Challenges to using construction grants. NASVH representatives stated that SVHs planned to use the $150 million in additional construction grants provided by the CARES Act to fund a range of projects to help respond to the pandemic, such as building additional rooms to allow for separating residents in quarantine or for PPE storage, and making upgrades like adding in-wall oxygen to rooms. However, NASVH officials said few SVHs were able to use the additional funds because they were made available near the end of the annual VA grant cycle.
In addition, NASVH officials identified concerns in SVHs’ securing the required matching state funding, which could prevent some SVHs from taking advantage of the additional funding.187 Specifically, according to VA and NASVH, there are an estimated 80 pending grant requests with a total estimated federal contribution of nearly $1.2 billion. This includes $500 million for grants with state matching funds to address priorities such as life and safety concerns, and $700 million for grants for which the state needs to find matching funds to receive the federal contribution. VA said the state cost-sharing requirement increases accountability and lowers the risk for fraud and waste.
Tracking COVID-19 cases and deaths. Timely and accurate data on the number of COVID-19 cases and deaths in each SVH is useful for monitoring trends in infection rates, identifying which SVHs have already experienced an outbreak, and overseeing whether SVHs have appropriately and effectively taken steps to prevent and mitigate the spread of COVID-19 to protect residents. For example, CMS requires nursing homes it inspects, which as previously discussed includes approximately two-thirds of SVHs, to submit cases and deaths among residents and staff weekly to CDC. CMS uses this information to track 186 VA’s civilian public health response is one component of its Fourth Mission, which according to VA, is to improve the nation’s preparedness for response to war, terrorism, national emergencies, and natural disasters by developing plans and taking actions to ensure continued service to veterans, as well as support to national, state, and local emergency management; and to public health, safety, and homeland security efforts.
187 38 U.S.C. § 8135(a)(1). VA is generally authorized to pay up to 65 percent of construction costs for SVHs, with states paying the remainder.

Appendix I: Enclosures
Page 148 GAO-21-191
trends and direct targeted response efforts, including COVID-19 testing.188
VA officials told us they use an informal process where each Veterans Integrated Service Network reaches out to SVHs in its jurisdiction bi-monthly to document COVID-19 cases among staff and residents, recovered cases, and deaths. According to VA, it does not collect more timely data because SVHs are not required to report these data to VA. Federal internal control standards state that management should use quality information and externally communicate the necessary information to achieve the entity’s objectives. If VA does not have timely data on the number of COVID-19 cases and deaths occurring at each SVH, and does not share this information with its inspection contractor, then it cannot monitor the spread of COVID-19 in SVHs and take steps to mitigate the spread and protect residents.
Agency Comments
We provided a draft of this enclosure to the Office of Management and Budget (OMB) and VA for review and comment. OMB did not have comments on this enclosure. VA provided technical and general comments on this enclosure, which we incorporated as appropriate. VA’s general comments are reproduced in appendix XI.
VA concurred with our recommendation to develop a plan to ensure that routine inspections of SVHs occur during the COVID-19 pandemic and provided a target completion date of November 2021. We urge VA to move up its targeted completion date, because it cannot ensure the quality of nursing home care provided to veterans in these facilities until it develops a plan to resume these inspections (virtually, in person, or both). Without these inspections, veterans are at risk of receiving poor quality care.
VA concurred in principle with our recommendation to collect timely data on COVID-19 cases and deaths at each SVH. Although VA agreed these data are important to understanding the impact of COVID-19 on veterans 188 In September 2020, we recommended that the Secretary of Health and Human Services, in consultation with CMS and CDC, develop a s trategy to capture more complete data on confirmed COVID-19 cases and deaths in nursing homes retroactively to January 1, 2020, and to clarify the extent to which nursing homes have reported data before May 8, 2020. To the extent feasible, we recommended that this strategy to capture more complete data incorporate information nursing homes previously reported to CDC or to state or local public health offices.

Appendix I: Enclosures
Page 149 GAO-21-191
living in SVHs, it has not required states to report all COVID-19-related deaths at SVHs. VA stated that it would continue to evaluate its voluntary reporting process and provided a target completion date of April 2021. We reiterate the importance of having timely data on COVID-19 cases and deaths at SVHs, because as the country proceeds through the winter months, some experts suggest the number of COVID-19 cases and deaths could increase.
GAO’s Methodology
To conduct this work, we reviewed VA guidance and documents, federal laws, and written responses from VA about its oversight of and support to SVHs during the pandemic. In addition, we interviewed officials from NASVH and VA’s inspection contractor about VA’s response to COVID-19 in SVHs.
Contact information: Debra A. Draper, (202) 512-7114, [email protected]; Sharon Silas, (202) 512-7114, [email protected]
Related GAO Products
VA Health Care: VA Needs to Continue to Strengthen Its Oversight of Quality of State Veterans Homes. GAO-20-697T. Washington, D.C.: July 29, 2020.
VA Nursing Home Care: VA Has Opportunities to Enhance Its Oversight and Provide More Comprehensive Information on Its Website. GAO-19-428. Washington, D.C.: July 3, 2019.
Military Health
The Department of Defense continues to pursue a multipronged approach to protect servicemembers from COVID-19, which includes testing and public health measures, as well as investing about $1.64 billion from the CARES Act for fiscal years 2020 through 2021 toward a variety of medical research and development projects for COVID-19 countermeasures.
Entity involved: Defense Health Agency, within the Department of Defense

Appendix I: Enclosures
Page 150 GAO-21-191
Key Considerations and Future GAO Work
We plan to continue to monitor the Department of Defense’s (DOD) health protection efforts for servicemembers, including COVID-19 testing and ongoing research and development projects as part of the response to and recovery from the COVID-19 pandemic.
Background
Congress appropriated $3.8 billion to DOD’s Defense Health Program to prevent, prepare for, and respond to the COVID-19 pandemic, domestically or internationally.189 DOD, through the Defense Health Program, provides worldwide medical services to active-duty and other eligible beneficiaries, including costs associated with the delivery of TRICARE benefits. In 2019, DOD operated 475 military Medical Treatment Facilities to deliver care to the approximately 9.6 million individuals eligible for DOD health care services, including active-duty and retired servicemembers and their dependents.
For fiscal years 2020 through 2021, DOD has allocated approximately $1.64 billion from the CARES Act—including $1.35 billion from the Defense Health Program and $291 million from the CARES Act for Defense-wide Research, Development, Test and Evaluation—to support medical research and development efforts for COVID-19, including vaccines, diagnostics, and therapeutics through partnerships between military health system components and various academic and commercial partners.190 DOD has a long-standing medical research and development program with projects across various areas of the medical field, including infectious diseases.
189 Coronavirus Aid, Relief, and Economic Security (CARES) Act, Pub. L. No. 116-136, div. B, title III, 134 Stat. 281, 518 (March 27, 2020). The Families First Coronavirus Response Act, Pub. L. No. 116-127, title II, 134 Stat. 178, 181 (March 18, 2020) also appropriated $82 million to the Defense Health Program. Under the CARES Act, DOD received a total of $10.5 billion that, in addition to the $3.8 billion enacted for the Defense Health Program, included appropriations for the National Guard; the defense working capital funds; and the Office of the Inspector General, among other things. We discuss the funding provided to the National Guard for personnel and operations and maintenance in the enclosure on Defense Support of Civil Authorities.
190 Remaining amounts from the $3.8 billion Defense Health Program appropriated funds were allocated to other nonmedical research and development categories, such as medical care, cleaning contracts, nonmedical supplies and equipment, and for transfer or reprogramming to other COVID-19 response costs.

Appendix I: Enclosures
Page 151 GAO-21-191
The Under Secretary of Defense for Personnel and Readiness and the Assistant Secretary of Defense for Health Affairs oversee DOD’s COVID-19 medical research and development efforts. DOD’s COVID-19 medical research and development funding is overseen by the Assistant Secretary of Defense for Health Affairs and the Under Secretary of Defense for Research and Engineering. DOD has a number of organizations that conduct and sponsor medical research, such as the U.S. Army Medical Research and Development Command; the Air Force Research Laboratory; the Navy Medical Research Center; the Uniformed Services University of the Health Sciences; the Joint Program Executive Office for Chemical, Biological, Radiological, and Nuclear Defense; and the Defense Advanced Research Projects Agency.
Overview of Key Issues
As of September 30, 2020, DOD reported 66,375 cumulative, confirmed cases of COVID-19 among military servicemembers, their dependents, civilians, and contractors (see table), an increase of 14 percent since our last report in September 2020.191 Specifically, as new COVID-19 cases were reported, the cumulative incidence of COVID-19 among the servicemember population increased over this time period from 2,367 per 100,000 servicemembers to 3,408 per 100,000 servicemembers. Reserve and National Guard members account for approximately 21 percent of cumulative cases of COVID-19 among servicemembers.
191 A confirmed COVID-19 case in DOD is defined by a positive laboratory test. In September 2020, we reported that, as of September 9, 2020, DOD had identified 58,058 cumulative cases of COVID-19 among servicemembers, their dependents, civilians, and contractors.

Appendix I: Enclosures
Page 152 GAO-21-191
Number of COVID-19 Cases Reported by the Department of Defense, as of September 30, 2020
Category Cumulative cases
Hospitalizations Deaths
Military servicemembers 45,759 618 8 Active component 36,374 458 1 Reserve 4,143 118 5 National Guard 5,242 42 2 Dependents 6,092 131 7 Civilians 10,210 437 59 Contractors 4,314 181 22 Total 66,375 1,367 96
Source: GAO analysis of data from the Department of Defense’s (DOD) COVID-19 Task Force. I GAO-21-191.
Note: A confirmed COVID-19 case in DOD is defined by a positive laboratory test.
According to DOD officials, the department continues to address the COVID-19 pandemic within its workforces by applying a conditions-based approach to prevention and mitigation, which includes testing, closely monitoring health surveillance data (e.g., COVID-19 testing positivity rates and cases data, among other indicators), leveraging DOD’s public health emergency management protocols at installations worldwide, and implementing updated guidelines from the Centers for Disease Control and Prevention, among other things. Concurrently, and in tandem with whole-of-government efforts, DOD is investing in COVID-19 medical research and development projects (“projects”) for vaccines, therapeutic treatments, and new and improved testing capabilities for the benefit of servicemembers and the general population.192 These types of capabilities are referred to collectively as “medical countermeasures.” In preparation for the availability of a COVID-19 vaccine, DOD is also developing a distribution plan to administer doses across workforces and beneficiaries.
Medical countermeasures research and development projects. According to DOD officials, the department’s strategy for COVID-19 research and 192 Outside of DOD’s efforts to pursue medical research and deve lopment projects for COVID-19 vaccines, therapeutics, and diagnostics as part of its efforts to protect servicemembers, Operation Warp Speed aims to accelerate the development, manufacturing, and distribution of COVID-19 vaccines and therapeutics, with the goal of producing 300 million doses of a COVID-19 vaccine for the general population, with initial doses available by January 2021.

Appendix I: Enclosures
Page 153 GAO-21-191
development is designed to achieve a balance of short- and long-term countermeasures projects. This strategy includes projects that complement government-wide efforts with applicability for the general population, and those that are specifically tailored to DOD’s unique operational and population needs. Short-term projects are those aligned with the expedited time frames of the federal government’s Operation Warp Speed. Longer term projects, according to DOD officials, are those that may provide enhanced capabilities, such as easier storage and distribution for the DOD population, a portion of which operates in remote locations across the globe without ready access to a medical facility.
According to DOD officials, in January 2020, department leaders decided to initiate medical countermeasure projects for COVID-19 in response to the increasing numbers of COVID-19 cases in Asia among the general population.193 To do so prior to a supplemental appropriation, DOD officials stated that they initially applied base budget funding from the Defense Health Program funds toward new research and development for COVID-19 medical countermeasures. However, they stated that most of DOD’s portfolio of COVID-19 medical countermeasures projects are now funded by supplemental appropriations through the CARES Act.
As of September 2020, DOD was applying about $1.64 billion allocated from the CARES Act toward the advancement of the COVID-19 medical countermeasures portfolio, and a wide variety of other supporting research studies to improve knowledge about the SARS-CoV-2 virus and COVID-19 in servicemember populations (e.g., transmission, incidence, disease course, and immunological response), testing technology, and manufacturing of medical countermeasures. According to DOD officials, DOD entities oversee and manage the projects, while academic and commercial partners execute much of the day-to-day clinical work on many projects through a combination of grants, cooperative agreements, and contracts. Moreover, DOD provides infrastructure and manufacturing support to COVID-19 medical countermeasures projects. For example, by leveraging the department’s clinical trial networks, DOD officials stated that they were able to quickly establish protocols to understand the
193 On February 26, 2020, U.S. Forces Korea confirmed the first positive COVID-19 case in a U.S. servicemember.

Appendix I: Enclosures
Page 154 GAO-21-191
natural history of COVID-19 and have supported clinical studies evaluating investigational medical countermeasures.194
DOD’s portfolio of medical countermeasures investments for COVID-19 through fiscal year 2021 includes a mix of vaccines, diagnostics, and therapeutics in varying stages of maturity.
· Vaccines. DOD has five vaccine development projects. Three of these projects could have applications for the general population, but are not candidates of Operation Warp Speed, according to DOD officials. DOD officials also stated that the department’s Advanced Development and Manufacturing facility is already producing thousands of doses of one vaccine candidate for availability by the end of 2020.195 The other vaccine projects are being designed to more specifically meet the operational needs of the department, such as qualities that allow for storage and use in more austere locations, according to DOD officials. According to DOD documentation, the department’s vaccine investments are leveraging platforms and technologies available within the department, and those of established partners. In addition, DOD is leveraging its capabilities in support of an Operation Warp Speed vaccine candidate that the Department of Health and Human Services is sponsoring and funding through a public-private partnership with AstraZeneca. Specifically, DOD announced in September 2020 that it will support Phase III clinical trials at five of its military Medical Treatment Facilities.
· Diagnostics. DOD is investing in a spectrum of diagnostic testing capabilities. According to DOD officials, testing will continue to be a critical component of addressing the COVID-19 threat even after
194 According to the Centers for Disease Control and Prevention, the natural history of a disease refers to the progression of a disease process in an individual over time, in the absence of treatment.
195 DOD has long expressed concerns about its ability to acquire and maintain the capability to research, develop, and manufacture medical countermeasures (e.g., vaccines, drugs, and diagnostics) against biological warfare threat agents, toxins, and endemic diseases. In 2013, DOD partnered with a private -sector biopharmaceutical company to develop an Advanced Development and Manufacturing facility in Alachua, Florida, with the capability to use disposable equipment enabling timely changes in a production line for medical countermeasures. The facility became fully operationa l in March 2017. See Biological Defense: Additional Information That Congress May Find Useful as It Considers DOD’s Advanced Development and Manufacturing Capability, GAO-17-701 (Washington, D.C.: July 17, 2017).

Appendix I: Enclosures
Page 155 GAO-21-191
vaccines and therapeutics are developed. The diagnostic testing-based projects include a mixture of molecular, antigen, and serology testing.196 DOD officials stated that the department’s existing relationships with industry partners has facilitated development and emergency use authorizations from the Food and Drug Administration (FDA) for molecular diagnostic tests and associated platforms. According to DOD documentation, investments in antigen testing aim to establish quick and easy access to testing supplies to increase the screening of large groups of symptomatic individuals. DOD’s serology testing projects aim to expand knowledge about the presence of antibodies, and how, when, and where antibodies can be utilized in the COVID-19 response. DOD officials stated that the department’s vast serum repository, which includes samples from every servicemember collected at least every 2 years, is a substantial and unique asset for advancing knowledge about antibodies.
· Therapeutics. DOD’s therapeutics-based projects are focused on managing positive COVID-19 cases using appropriate therapeutic agents and treatments. Similar to reasons for investing in new and improved testing capabilities, DOD officials stated that investments in therapeutics are critical for ensuring a balanced strategy of countermeasures to address COVID-19 even after a vaccine becomes available. DOD investment areas for therapeutics include antivirals, anti-inflammatories, plasma products, and antibodies. According to DOD officials, the department sponsored the development of an antiviral pharmaceutical, remdesivir, which is now used as a COVID-19 treatment after receiving an emergency use authorization from the FDA for that indication. DOD officials also stated that, at the outset of COVID-19, the department pivoted its antibody discovery pipeline toward rapid development of monoclonal and polyclonal antibodies targeted against SARS-CoV-2.
Since that time, according to DOD officials, several of the department’s antibody discoveries have been licensed by pharmaceutical companies for clinical development and commercial manufacturing. Additionally, DOD is investing to increase manufacturing capabilities for therapeutics for the short term (through December 2020) and the long term (through calendar year 2021). For example, DOD’s Advanced Development and
196 Molecular diagnostic viral tests detect the presence of genetic material from SARS-CoV-2, the virus that causes COVID-19. The antigen viral tests detects the presence of a protein that is part of SARS-CoV and SARS-CoV-2. Serology tests detect antibodies produced in the blood of patients who have had a previous COVID-19 infection.
Appendix I: Enclosures
Page 156 GAO-21-191
Manufacturing Facility is producing monoclonal antibody doses that are expected to be available by the end of 2020, according to DOD officials.
Vaccine distribution plan. In preparation for the FDA’s issuance of an emergency use authorization for one or more COVID-19 vaccines later in 2020 or in 2021, the Defense Health Agency established a COVID-19 vaccine working group of subject matter experts with representation from across the department, such as the military services and the Joint Staff. According to the Joint Staff Surgeon, various multidisciplinary DOD teams are collaborating with the vaccine working group to plan for the information technology, logistics, and public health requirements for vaccine distribution both within military medical treatment facilities and expeditionary, or deployed, settings. The Deputy Secretary of Defense and the Vice Chairman of the Joint Chiefs of Staff—as co-chairs of DOD’s COVID-19 Task Force—oversee the working group.
According to Defense Health Agency officials, the working group has been drafting an implementation plan supporting COVID-19 vaccine distribution. They stated that the uncertainties about which vaccine (or vaccines) will be authorized and the timing of their availability pose a challenge at this stage of planning for distribution. DOD would need to seek a waiver from the President to require servicemembers to receive a COVID-19 vaccination, should the vaccine’s emergency use authorization include an option to decline vaccination. The working group anticipates that mass immunization events will likely be required, and vaccination prioritization tiers will be needed due to vaccine supply limitations.
DOD is communicating updates to its military Medical Treatment Facilities about vaccines in development and how the facilities may start to prepare for the receipt of one or more vaccines for SARS-CoV-2. Among other preparation steps, the DOD working group is
· developing policy and guidance on vaccine administration; working on ordering procedures and cold chain management requirements for the unique shipping and storage needs anticipated for one or more SARS-CoV-2 vaccines; establishing a public website;
· developing webinars and podcasts for immunization personnel along with clinicians, leaders, and vaccine recipients; and
· providing education and training to immunization personnel, including a competency assessment checklist.

Appendix I: Enclosures
Page 157 GAO-21-191
Agency Comments
We provided a draft of this enclosure to DOD and the Office of Management and Budget (OMB) for review and comment. DOD provided technical comments on this enclosure, which we incorporated as appropriate. OMB did not have comments on this enclosure.
GAO’s Methodology
To conduct this work, we reviewed DOD guidance and the most recent DOD data available as of September 30, 2020. We also interviewed DOD officials knowledgeable about COVID-19 response efforts and reviewed publicly available DOD media reports, statements, and documents. The data were provided to us by the DOD COVID-19 Task Force, which maintains the COVID-19 data of record for the department and reports them to senior DOD leaders. To assess the reliability of the data on COVID-19 cases among servicemembers, dependents, civilians, and contractors, we discussed the data with agency officials, reviewed the data for outliers or obvious errors, and reviewed relevant DOD documents. We determined that the data were sufficiently reliable for the purposes of this enclosure. However, we did not independently review the data for accuracy.
Contact information: Brenda S. Farrell, (202) 512-3604, [email protected]
Defense Support of Civil Authorities
The Department of Defense’s support to civil authorities continued to decrease since the peak of the department’s COVID-19 pandemic response efforts in April 2020, as civil authorities became better equipped to manage the response and the need for the department’s assistance declined.
Entities involved: Department of Defense, including its active-duty, reserve, and National Guard forces; the U.S. Army Corps of Engineers; and the Defense Logistics Agency
Key Considerations and Future GAO Work
We continue to examine the support the Department of Defense (DOD) provides to civil authorities as part of the response to and recovery from
Appendix I: Enclosures
Page 158 GAO-21-191
the COVID-19 pandemic, and the coordination among the federal agencies supporting the pandemic response.
Background
DOD has played a prominent role in supporting civil authorities’ response to the COVID-19 pandemic, in addition to other natural and man-made emergencies, such as wildfires, hurricanes, and civil unrest. DOD provides such support through its Defense Support of Civil Authorities mission, and is authorized to do so when requested by another federal agency and approved by the Secretary of Defense or when directed by the President.197 In a series of presidential memorandums sent to the Secretaries of Defense and Homeland Security during March, April, May, and June 2020, the Federal Emergency Management Agency (FEMA) was directed to fund 100 percent of emergency assistance associated with COVID-19 response activities undertaken by state National Guards.198
In the CARES Act, Congress appropriated approximately $1.5 billion for National Guard personnel and operations expenses incurred in responding to COVID-19 to prevent, prepare for, and respond to the coronavirus domestically or internationally.199 These amounts were required to be obligated by September 30, 2020. Section 13001 of the CARES Act authorized DOD to transfer amounts appropriated to the department by the act to other applicable DOD appropriations for expenses incurred in preventing, preparing for, or responding to COVID-
197 Requesting agencies could include, for example, the Federal Emergency Management Agency (FEMA), Health and Human Services (HHS), and the U.S. Department of Agriculture. DOD provides such support through federal milita ry forces; DOD civilians and contract personnel; and DOD component assets, to include the National Guard and the U.S. Army Corps of Engineers.
198 The requirement for the federal government to fund 100 percent of the costs for the states’ and territories’ use of National Guard forces was available for orders of any length of authorizing duty through August 21, 2020.
199 CARES Act, Pub. L. No. 116-136, div. B, title III, 134 Stat. 281, 518 and 520 (March 27, 2020). As we previously noted in our September 2020 report, DOD received about $10.5 billion under the act that, in addition to the National Guard activities, included appropriations for the Defense Health Program; the defense working capital funds; and the Office of the Inspector General, among other things.

Appendix I: Enclosures
Page 159 GAO-21-191
19, including in support of other federal departments and agencies, and state, local, and tribal governments.200
Subsequently, an April 1, 2020, memorandum signed by the acting Undersecretary of Defense (Comptroller) stated that transfers under section 13001 may be made only to meet the department’s requirements, stating that DOD does not receive appropriations for, and has no authority to provide National Guard support to, federal agencies, states, or local, territorial, or tribal governments on a nonreimbursable basis. Therefore, the transfer authority provided under section 13001 does not authorize DOD to use its appropriations to support non-DOD entities.201
As of September 30, 2020, the department reprogrammed approximately $1.28 billion of the approximately $1.5 billion appropriated to the Army and Air National Guards’ Personnel and Operations and Maintenance accounts to other DOD appropriations.202 According to USAspending.gov, as of August 31, 2020, the National Guard had obligated about $111.5 million and spent about $50.9 million of the $1.5 billion it received from the CARES Act.203 See table below for details about the use and transfer of these funds.
200 CARES Act, Pub. L. No. 116-136, div. B, title III, § 13001, 134 Stat. 281, 521 (March 27, 2020).
201 Under Secretary of Defense (Comptroller), Availability of National Guard Funding under the “Coronavirus Aid, Relief, and Economic Security Act” (“CARES” Act) (April 1, 2020).
202 In October 2020, DOD officials in the Comptroller’s office told us that the department’s report on CARES Act expenditures through the end of fiscal year 2020 would not be available until November 2020, after the period of our re view. As a result, we were not able to evaluate those data for this report, but plan to report on them in our March 2021 report.
203 USAspending.gov, accessed on October 19, 2020.

Appendix I: Enclosures
Page 160 GAO-21-191
Funds Available for the Department of Defense to Transfer from the CARES Act Appropriations for the Army and Air National Guards’ Personnel and Operations and Maintenance Accounts
Account Total appropriationsa ($ thousands)
Total obligationsb ($ thousands)
Total expendituresb ($ thousands)
Funds made available for
transferc ($ thousands)
Personnel, total 1,228,716 56,089 41,111 1,101,743 Army National Guard 746,591 51,353 38,920 677,004 Air National Guard 482,125 4,736 2,191 424,739 Operation and Maintenance, total
262,450 55,401 9,788 180,932
Army National Guard 186,696 51,730 7,671 122,132 Air National Guard 75,754 3,671 2,117 58,800 Total 1,491,166 111,490 50,899 1,282,675
Source: GAO analysis of Department of Defense and USAspending.gov data. I GAO-21-191.
Note: In October 2020, Department of Defense (Comptroller) off icials told us that the department’s report on CARES Act expenditures through the end of f iscal year 2020 w ould not be available until early November 2020–after the period of our review . aAppropriation amounts w ere identif ied through the CARES Act. bObligation and expenditure amounts w ere obtained from USASpending.gov, accessed on October 19, 2020. These amounts w ere identif ied as of August 31, 2020. We plan to obtain f inal obligation and expenditure amounts from DOD once they become available in November 2020. cFunds made available for transfer were identif ied through DOD’s internal reprogramming actions and information provided National Guard off icials. These amounts w ere identif ied as of September 30, 2020.
According to a September 2020 DOD reprogramming action, the department, for example, transferred $24.4 million from the Army National Guard’s Personnel account to the Army Research, Development, Test, and Evaluation account. According to the reprogramming action, the funds were available due to the increased use of Army National Guard members for additional FEMA mission assignments and the use of base Military Personnel appropriated funds to support COVID-19 costs. The reprogramming action also stated that the funds were needed to assess COVID-19 testing capability for the Army force and would be used to evaluate the viability and reliability of two COVID-19 testing systems for operational settings. We will continue to work with the DOD Comptroller’s office to obtain additional detailed information on these reprogramming actions and the accounts to which these funds were transferred, and plan to report our findings in a future update.
According to DOD’s May 2020 CARES Act Spend Plan, the department requested that CARES Act funding for DOD’s support of states’ COVID-

Appendix I: Enclosures
Page 161 GAO-21-191
19 response be provided as an appropriation into the Emergency Response Fund, Defense account along with the authority for DOD to provide nonreimbursable support to other federal departments, states, local, and tribal governments.204 Congress, however, chose to appropriate CARES Act amounts into existing National Guard accounts without authority for DOD to provide nonreimbursable assistance. Additionally, as noted previously, a series of presidential memorandums directed FEMA to fund 100 percent of emergency assistance associated with COVID-19 response activities undertaken by the National Guard.
As we noted in our September 2020 report, DOD officials stated that the total amounts appropriated to the National Guard in the CARES Act could not be fully obligated before they expired at the end of fiscal year 2020. DOD officials further stated that National Guard support to the states for the COVID-19 response was fully reimbursed by FEMA. Consequently, amounts appropriated to the National Guard in support of states’ COVID-19 response were identified as available for transfer to other DOD accounts for COVID-19-related priority activities.
Overview of Key Issues
DOD support efforts. According to DOD officials, as of September 30, 2020, DOD had received 368 FEMA mission assignments and other requests for assistance.205 Further, as of September 30, 2020, approximately 40 active-duty medical personnel were providing support under FEMA mission assignments, and an additional 93 medical personnel were in a restriction of movement status after supporting a FEMA mission in Texas. In addition, as of September 30, 2020, more than 16,000 National Guard members remained on orders in 43 states and 3 territories to support the response to COVID-19,206 which is fewer
204 Under Secretary of the Defense (Comptroller), Department of Defense Spend Plan for Funding Received in the Coronavirus Aid, Relief, and Economic Security “CARES” Act (P.L. 116-136) (May 2020).
205 According to DOD officials, this total comprised 328 FEMA mission assignments and 40 requests for assistance.
206 National Guard forces may provide support to civil authorities when ordered to active duty—commonly referred to as Title 10 duty status—and are funded and commanded by DOD. National Guard members may also be placed in a duty status pursuant to section 502(f)(2)(A) to support operations or missions undertaken by the member’s unit at the request of the President or the Secretary of Defense. When operating in Title 32 duty status, National Guard forces are funded by DOD and commanded by the state.

Appendix I: Enclosures
Page 162 GAO-21-191
than half of the number of National Guard personnel on orders at the peak of the response in spring 2020.207
According to DOD officials, the department’s support to the states has continued to shift over the course of the pandemic, particularly as civil authorities became better equipped to manage the response and the demand for medical and other assistance from the department declined. For example, the focus of the initial response was on building field hospitals and providing staff for those facilities; however, the focus of the more recent support was on sending DOD medical personnel into local hospitals to augment the medical staff. According to officials, DOD medical personnel will be sent in when the need for medical support exceeds local capabilities or what the Department of Health and Human Services can provide. Officials explained that this approach has also facilitated the department’s efforts to balance internal requirements with the demand for support from the states.
According to the National Guard Bureau, the vast majority of the support currently provided by the National Guard is related to testing and screening activities. The following are examples of civil support provided by the National Guard through September 2020:
· Testing and screening. National Guard members in 44 states and territories, including Alaska, California, Colorado, Florida, and Ohio, assisted with testing and screening for COVID-19. This remains the priority effort for National Guard support in the states. For example, Florida National Guard support to the state’s testing efforts has assisted in the testing of more than 1,400,000 residents for COVID-19.
· Warehouse operations and supplies. In 36 states and territories, National Guard members provided support to warehouse operations. For example, Vermont National Guard members continue to support Strategic National Stockpile warehouse operations and reception of FEMA deliveries. Colorado National Guard members assisted with inventorying supplies and distributing personal protective equipment to public schools.
207 According to DOD officials, approximately 3,570 medical personnel provided support at the peak of the COVID-19 response in late April 2020. In addition, more than 41,000 National Guard personnel in Title 32 status provided support at the peak of the response to the COVID-19 pandemic.

Appendix I: Enclosures
Page 163 GAO-21-191
· Food bank and program support. National Guard members in 24 states and territories are providing support to food banks. For example, California National Guard members have provided such support to, among other things, help ensure continuity.
· Nursing home support. California National Guard members assisted by backfilling staff shortages at skilled nursing facilities. National Guard members in Ohio also provided support to nursing homes and other long-term care facilitates.
· COVID-19 mapping. National Guard members in 15 states and territories, including Colorado, Nevada, and Washington are supporting COVID-19 mapping. The states are working with health departments to manage and analyze data.
Reimbursement for National Guard support. In a series of presidential memorandums issued in spring 2020, the White House provided for the use of National Guard forces to assist FEMA with emergency assistance associated with the COVID-19 response to states. The White House memorandums also directed that FEMA fund 100 percent of the support provided by the National Guard forces. In a June 2, 2020, memorandum, the White House extended this authorization through August 21, 2020.208
A presidential memorandum issued on August 3, 2020, terminated the requirement that FEMA fund 100 percent of that National Guard costs for providing assistance to the majority of states as of August 21, 2020.209
Instead, FEMA was directed to fund 75 percent of the emergency assistance activities associated with preventing, mitigating, and responding to the threat to public health and safety posed by COVID-19 in the named states through December 31, 2020.210 As a result of this change, certain states became responsible for reimbursing FEMA for 25 percent of the cost of their National Guard’s support to the COVID-19 response after August 21, 2020.
208 Presidential Memorandum, Governors’ Use of the National Guard to Respond to COVID-19 and to Facilitate Economic Recovery, 85 Fed. Reg. 34955 (June 5, 2020) (signed June 2, 2020).
209 Presidential Memorandum, Extension of the Use of the National Guard to R espond to COVID-19 and to Facilitate Economic Recovery, 85 Fed. Reg. 47885 (Aug. 6, 2020) (signed Aug. 3, 2020).
210 Arkansas, Florida, Idaho, Minnesota, Texas, and Wyoming were not included among those named states receiving 75-percent cost share assistance upon termination of the 100-percent cost share support.

Appendix I: Enclosures
Page 164 GAO-21-191
Subsequent presidential memorandums issued throughout August 2020 extended 100-percent cost sharing through December 31, 2020, for Florida and Texas, and restored 100-percent cost sharing through September 30, 2020, for Arizona, California, Louisiana, and Connecticut.211
According to DOD officials, historically the department has been reimbursed for 100 percent of the costs of providing National Guard assistance when supporting states and territories and, therefore, any changes to the percentage funded by the federal government through other agencies does not impact department’s response.212 DOD officials stated that federal agencies, such as FEMA, and states are typically required to share the cost of National Guard assistance because states bear some responsibility for funding their response efforts. DOD officials further stated that support for the COVID-19 pandemic has been different than other support missions—such as responding to a hurricane––because the COVID-19 pandemic has impacted all states and U.S. territories and necessitated a response from them.
According to National Guard Bureau officials, the states are evaluating the level of support they can maintain, given the portion that they are required to fund. National Guard officials further stated that some states adjusted the number of National Guard members providing support based on their budgets. In addition, they also stated that many states have asked for the cost-share ratio be re-evaluated.
Agency Comments
We provided a draft of this enclosure to DOD and the Office of Management and Budget (OMB) for review and comment. DOD provided technical comments on this enclosure, which we incorporated as appropriate. OMB did not have comments on this enclosure.
211 The memorandums affecting Arizona, California, Louisiana, and Connecticut added an additional 25 percent to the revised 75-percent cost share. Upon expiration of the additional 25 percent, the total federal cost share will return to 75 percent. With respect to Louisiana, the August 29, 2020, memorandum noted the need to maximize the assistance to the Governor of Louisiana where the National Guard was fully deployed and engaged to help the state recover from the devastation of Hurricane Laura.
212 No amounts appropriated to the National Guard are available to support state -level response activities.

Appendix I: Enclosures
Page 165 GAO-21-191
GAO’s Methodology
To conduct this work, we reviewed documentation and the most recent data available from DOD through September 30, 2020, and USAspending.gov through August 31, 2020, and interviewed DOD officials.
Contact information: Diana Maurer, (202) 512-9627, [email protected].
HHS COVID19 Funding
The COVID-19 relief laws appropriated more than $250 billion to the Department of Health and Human Services to address various aspects of the public health response to COVID-19. About $163 billion (65 percent) had been obligated and about $117 billion (47 percent) had been expended as of October 31, 2020, according to department officials. This represents an increase of about 13 percent and 18 percent since July 31, 2020, when reported obligations and expenditures were $144 billion and $99 billion, respectively.
Entity involved: Department of Health and Human Services
Key Considerations and Future GAO Work
We will continue to examine the Department of Health and Human Services’ (HHS) use of appropriations contained in four relief laws enacted to help fund the COVID-19 response. Specifically, we will examine the status of obligations and expenditures of these funds; the activities funded, including how those activities were determined; and efforts to monitor funding use and any related challenges.
Background
HHS received approximately $251 billion in supplemental appropriations from four relief laws enacted to assist the response to COVID-19 (see table below).213
213 Coronavirus Preparedness and Response Supplemental Appropriations Act, 2020, Pub. L. No. 116-123, 134 Stat. 146 (2020); Families First Coronavirus Response Act, Pub. L. No. 116-127, 134 Stat. 178 (2020); CARES Act, Pub. L. No. 116-136, 134 Stat. 281 (2020); Paycheck Protection Program and Health Care Enhancement Act, Pub. L. No. 116-139, 134 Stat. 620 (2020).
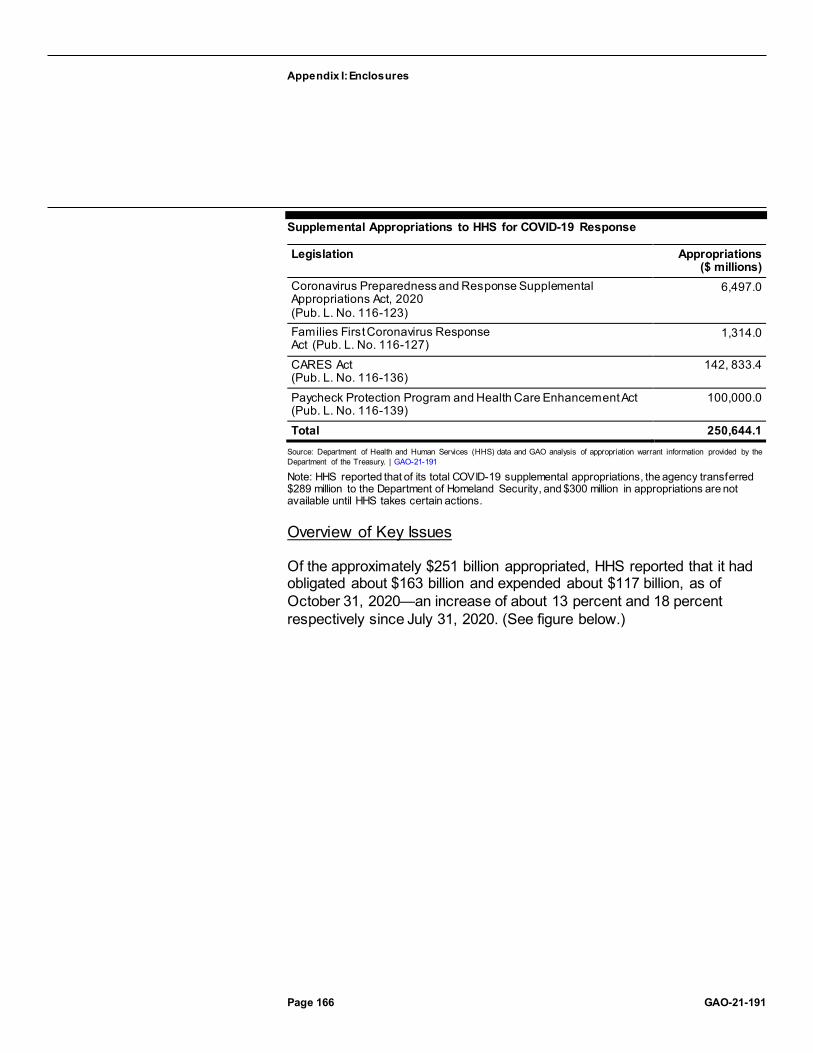
Appendix I: Enclosures
Page 166 GAO-21-191
Supplemental Appropriations to HHS for COVID-19 Response
Legislation Appropriations ($ millions)
Coronavirus Preparedness and Response Supplemental Appropriations Act, 2020 (Pub. L. No. 116-123)
6,497.0
Families First Coronavirus Response Act (Pub. L. No. 116-127)
1,314.0
CARES Act (Pub. L. No. 116-136)
142, 833.4
Paycheck Protection Program and Health Care Enhancement Act (Pub. L. No. 116-139)
100,000.0
Total 250,644.1 Source: Department of Health and Human Services (HHS) data and GAO analysis of appropriation warrant information provided by the Department of the Treasury. | GAO-21-191
Note: HHS reported that of its total COVID-19 supplemental appropriations, the agency transferred $289 million to the Department of Homeland Security, and $300 million in appropriations are not available until HHS takes certain actions.
Overview of Key Issues
Of the approximately $251 billion appropriated, HHS reported that it had obligated about $163 billion and expended about $117 billion, as of October 31, 2020—an increase of about 13 percent and 18 percent respectively since July 31, 2020. (See figure below.)

Appendix I: Enclosures
Page 167 GAO-21-191
Supplemental Appropriations to HHS for COVID-19 Response and HHS’s Reported Obligations and Expenditures, as of October 31, 2020
HHS reported appropriations, obligations, and expenditures by agency. As of October 31, 2020, the Indian Health Service had expended the largest portion of their supplemental appropriations (59 percent). The following table provides HHS’s reported appropriations, obligations, and expenditures by HHS agency.
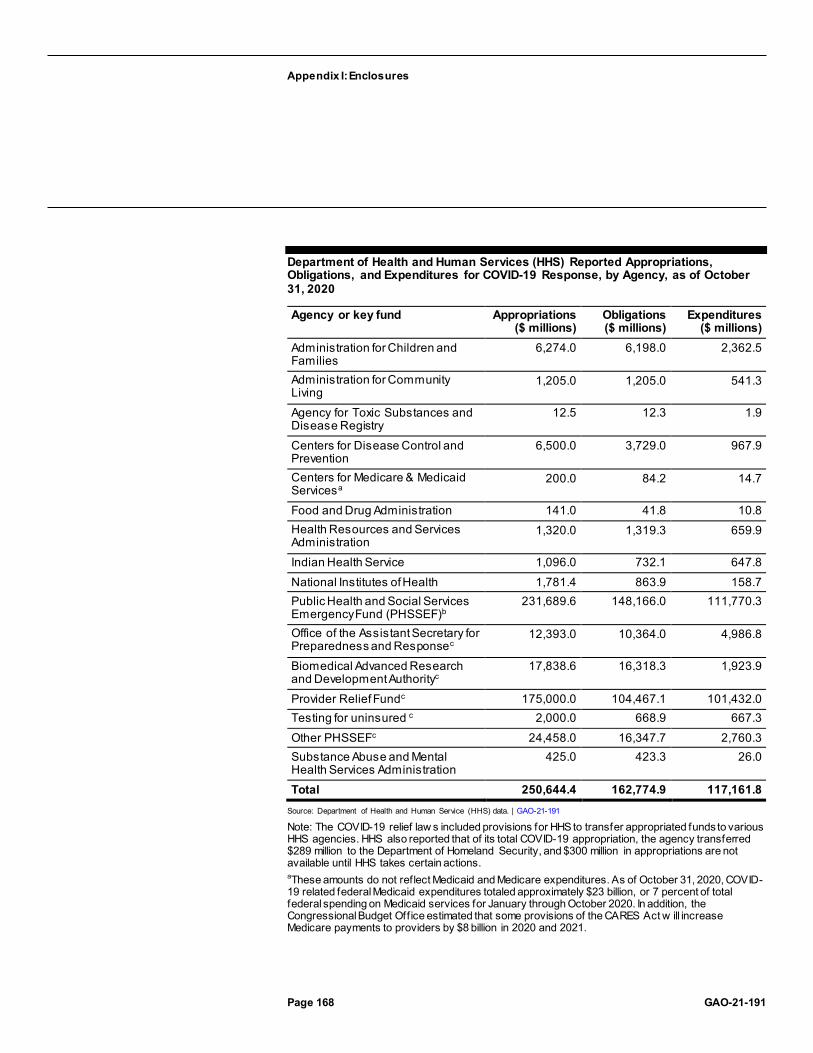
Appendix I: Enclosures
Page 168 GAO-21-191
Department of Health and Human Services (HHS) Reported Appropriations, Obligations, and Expenditures for COVID-19 Response, by Agency, as of October 31, 2020
Agency or key fund Appropriations ($ millions)
Obligations ($ millions)
Expenditures ($ millions)
Administration for Children and Families
6,274.0 6,198.0 2,362.5
Administration for Community Living
1,205.0 1,205.0 541.3
Agency for Toxic Substances and Disease Registry
12.5 12.3 1.9
Centers for Disease Control and Prevention
6,500.0 3,729.0 967.9
Centers for Medicare & Medicaid Servicesa
200.0 84.2 14.7
Food and Drug Administration 141.0 41.8 10.8 Health Resources and Services Administration
1,320.0 1,319.3 659.9
Indian Health Service 1,096.0 732.1 647.8 National Institutes of Health 1,781.4 863.9 158.7 Public Health and Social Services Emergency Fund (PHSSEF)b
231,689.6 148,166.0 111,770.3
Office of the Assistant Secretary for Preparedness and Responsec
12,393.0 10,364.0 4,986.8
Biomedical Advanced Research and Development Authorityc
17,838.6 16,318.3 1,923.9
Provider Relief Fundc 175,000.0 104,467.1 101,432.0 Testing for uninsured c 2,000.0 668.9 667.3 Other PHSSEFc 24,458.0 16,347.7 2,760.3 Substance Abuse and Mental Health Services Administration
425.0 423.3 26.0
Total 250,644.4 162,774.9 117,161.8 Source: Department of Health and Human Service (HHS) data. | GAO-21-191
Note: The COVID-19 relief law s included provisions for HHS to transfer appropriated funds to various HHS agencies. HHS also reported that of its total COVID-19 appropriation, the agency transferred $289 million to the Department of Homeland Security, and $300 million in appropriations are not available until HHS takes certain actions. aThese amounts do not reflect Medicaid and Medicare expenditures. As of October 31, 2020, COVID-19 related federal Medicaid expenditures totaled approximately $23 billion, or 7 percent of total federal spending on Medicaid services for January through October 2020. In addition, the Congressional Budget Off ice estimated that some provisions of the CARES Act w ill increase Medicare payments to providers by $8 billion in 2020 and 2021.

Appendix I: Enclosures
Page 169 GAO-21-191
bThe Public Health and Social Services Emergency Fund (PHSSEF) is an account though w hich funding is provided to certain HHS off ices, such as the Office of the Assistant Secretary for Preparedness and Response. Amounts have been appropriated to this fund for the COVID-19 response to support certain HHS agencies and response activities. PHSSEF appropriations transferred to other HHS agencies or key funds not specif ically listed are included under “Other PHSSEF.” For example, the Health Resources and Services Administration received $975 million in transfers from the PHSSEF, and this is represented in the table in “Other PHSSEF.” cThe italicized amounts are subtotals of the PHSSEF and are not added in the total since they are included in the PHSSEF amount. Italicized amounts listed under the PHSSEF appropriations column are HHS allocations based on appropriations made in the relief law s and approved allotment decisions made by HHS in coordination w ith the Office of Management and Budget. The Provider Relief Fund reimburses eligible health care providers for health care related expenses or lost revenues that are attributable to COVID-19. The CARES Act and Paycheck Protection Program and Health Care Enhancement Act appropriated $175 billion for provider relief. In addition, the Families First Coronavirus Response Act appropriated $1 billion and the Paycheck Protection Program and Health Care Enhancement Act appropriated up to $1 billion to reimburse providers for COVID-19 testing for uninsured individuals. Provider Relief Fund expenditures also may be referred to as disbursements.
HHS reported allocations, obligations, and expenditures for a variety of COVID-19 response activities, including activities to support testing, the development of vaccines or therapeutics, and the acquisition of critical supplies. As of October 31, 2020, 58 percent of funds allocated to the Provider Relief Fund had been expended, compared with less than 5 percent of the funding allocated each for telehealth and global disease detection. The following table provides HHS’s reported allocations, obligations, and expenditures by selected key response activity.

Appendix I: Enclosures
Page 170 GAO-21-191
Department of Health and Human Services (HHS) Reported Allocations, Obligations, and Expenditures for COVID-19 Response, by Selected Key Response Activity, as of October 31, 2020
Key activity Total HHS allocations ($ millions)
Total HHS obligations ($ millions)
Total HHS expenditures
($ millions) Health centersa 2,020.0 2,018.3 927.5 Head Start 750.0 743.3 182.1 Provider Relief Fundb 175,000.0 104,467.1 101,432.0 Testing for uninsured 2,000.0 668.9 667.3 Support to state, local, territorial, and tribal organizations for preparedness
13,990.0 13,133.8 1,769.4
Strategic National Stockpile 10,669.9 8,904.4 4,061.2 Telehealth 175.0 39.7 4.8 Testing 4,491.8 3,544.5 981.4 Vaccines 13,814.7 13,341.0 1,279.3 Drugs and therapeutics 3,013.0 2,796.4 622.1 Global disease detection and emergency response
800.0 250.1 37.4
Other response activities c 23,920.0 12,867.4 5,197.3 Total 250,644.4 162,774.9 117,161.8
Source: Department of Health and Human Services (HHS) data. | GAO-21-191
Note: HHS reported allocations, obligations, and expenditures for these activities based on the primary programmatic recipient organization of the funds, although some activities apply to multiple categories. For example, certain funds in the “support to state, local, territorial, and tribal organizations for preparedness” category were provided for testing but are not reflected in the “testing” category. According to HHS off icials, the allocations reported for the key activities above are based on amounts appropriated for these activities in the relief law s and approved allotment decisions made by HHS in coordination w ith the Office of Management and Budget. aHealth centers provide a comprehensive set of primary and preventative health care services to individuals regardless of their ability to pay. Approximately $17 million of this funding is for Health Center Program look-alikes, w hich are centers that do not receive Health Center Program funding but meet program requirements. bThe Provider Relief Fund reimburses eligible health care providers for health care related expenses or lost revenues that are attributable to COVID-19. The CARES Act and Paycheck Protection Program and Health Care Enhancement Act appropriated $175 billion for provider relief. In addition, the Families First Coronavirus Response Act appropriated $1 billion and the Paycheck Protection Program and Health Care Enhancement Act appropriated up to $1 billion to reimburse providers for COVID-19 testing for uninsured individuals. Provider Relief Fund expenditures may also be referred to as disbursements. cAccording to HHS off icials, other response activities include Centers for Disease Control and Prevention agency-wide activities and program support, health care preparedness and response activities, Biomedical Advanced Research and Development Authority diagnostics development, and various activities conducted by the National Institutes of Health.

Appendix I: Enclosures
Page 171 GAO-21-191
Agency Comments
We provided HHS and the Office of Management and Budget (OMB) with a draft of this enclosure. HHS and OMB did not provide comments on this enclosure.
GAO’s Methodology
We requested, and HHS provided, data on appropriations, allocations, obligations, and expenditures by HHS agency and by key response activity, as of October 31, 2020. We also obtained and analyzed appropriation warrant information provided by the Department of the Treasury as of May 31, 2020. To assess the reliability of the data reported by HHS, we reviewed information from the federal spending database, USAspending.gov, as well as HHS’s spending database, taggs.hhs.gov, and HHS’s documentation on spending, and we determined that the data were sufficiently reliable for the purposes of our reporting objective.214 We also reviewed the four relief laws enacted to assist the response to COVID-19.
Contact information: Carolyn L. Yocom, (202) 512-7114, [email protected]
Health Disparities
Data collected or made available by the Department of Health and Human Services on indicators of COVID-19 are incomplete, but available data continue to demonstrate racial and ethnic disparities.
Entities involved: Department of Health and Human Services, including the Centers for Disease Control and Prevention, Centers for Medicare & Medicaid Services, Health Resources and Services Administration, Indian Health Service, National Institutes of Health, Office of the Assistant Secretary for Health, and Office of Minority Health
214 We searched HHS’s Tracking Accountability in Government Grants System website and USAspending.gov—a publicly available website developed and operated by the Department of the Treasury that includes detailed data on federal spending, including obligations, across the federal government. See https://taggs.hhs.gov/coronavirus, accessed 11/2/2020, and https://USAspending.gov, accessed 11/2/2020. We did not independently validate the data provided by HHS.

Appendix I: Enclosures
Page 172 GAO-21-191
Key Considerations and Future GAO Work
The Department of Health and Human Services (HHS), including the Centers for Disease Control and Prevention (CDC), collects and makes some data available on indicators of COVID-19 by race and ethnicity, but gaps exist in these data, particularly in four areas:
· Testing. Both race and ethnicity information was missing for 82.0 percent of COVID-19 laboratory tests reported to CDC as of October 11, 2020.215
· Cases. Race and ethnicity information was missing for 41.5 percent of COVID-19 cases with case report forms received by CDC, or 62.7 percent of total cases reported, as of October 20, 2020.216
· Hospitalizations. CDC’s hospitalization data for COVID-19 are limited to select counties in 14 states, and race and ethnicity information are not complete in the reported data.
· Deaths. Race and ethnicity data were missing for 14.0 percent of COVID-19-related deaths with case report forms received by CDC, or 44.9 percent of total deaths reported through case reporting, as of October 20, 2020.217
On July 22, 2020, CDC released a COVID-19 Response Health Equity Strategy to accelerate progress towards reducing disparities in indicators
215 CDC data represent viral COVID-19 laboratory test results from laboratories in the U.S., including commercial laboratories, public health laboratories, and other testing locations from 45 jurisdictions. The data represent total laboratory tests, not individual people, and exclude antibody and antigen tests.
216 CDC officials noted that the number of cases with case report forms received by CDC is less than the total number of reported cases because there is generally a 2 -week lag from when total cases are reported by state and jurisdictional health de partments to when CDC receives the case report forms. Total cases reported by CDC include both probable and confirmed cases as reported by states or jurisdictions. A probable case does not have confirmatory laboratory evidence, but meets certain other criteria.
217 CDC officials noted that the number of deaths with case report forms received by CDC is less than the total number of reported deaths through case reporting because there is generally a 2-week lag from when total deaths are reported by state and jurisdictional health departments to when CDC receives case report forms noting deaths. CDC also makes data available on COVID-19 deaths from death certificate data through its National Vital Statistics System (NVSS). CDC stated that over 99 percent of deaths in NVSS have race and ethnicity information.

Appendix I: Enclosures
Page 173 GAO-21-191
of COVID-19, among other efforts to achieve health equity.218 As CDC implements its strategy, we recommended in September 2020 that the Director of CDC
· determine whether having the authority to require states and jurisdictions to report race and ethnicity information for COVID-19 cases, hospitalizations, and deaths is necessary for ensuring more complete data, and if so, seek such authority from Congress;
· involve key stakeholders to help ensure the complete and consistent collection of demographic data; and
· take steps to help ensure its ability to comprehensively assess the long-term health outcomes of persons with COVID-19, including by race and ethnicity.
HHS, including CDC, agreed with the recommendations. In response to our recommendations, CDC stated that the agency is committed to having discussions with stakeholders to assess whether having the authority to require states and jurisdictions to report race and ethnicity information for COVID-19 cases would result in improved reporting. CDC also noted that the agency is convening a team to develop a plan to monitor the long-term health outcomes of persons with COVID-19 by identifying health care surveillance systems that can electronically report health conditions to state and local health departments. We will continue to conduct work examining HHS, CDC, and other component agencies’ ongoing work regarding indicators of COVID-19 and disparities that exist for various populations.
Background
HHS and its agencies, including CDC, collect and make data available on various indicators of COVID-19, including testing, cases, hospitalizations, and deaths. (See our related July 2020 report on COVID-19 data quality and considerations for modeling and analysis.) These data are collected from a variety of sources, such as health care providers, laboratories, funeral homes, and state and jurisdictional health departments. Data collected and made available by CDC on indicators of COVID-19 by race and ethnicity are important for assessing potential disparities between different racial and ethnic minority groups and can help decision-makers
218 Centers for Disease Control and Prevention, CDC COVID-19 Response Health Equity Strategy: Accelerating Progress Towards Reducing COVID-19 Disparities and Achieving Health Equity (July 2020).
Appendix I: Enclosures
Page 174 GAO-21-191
understand the spread and severity of COVID-19 in different populations. (See our related Health Care Indicators enclosure.)
Overview of Key Issues
Disparities by race and ethnicity in COVID-19 indicators. Though limited, available data from CDC and others demonstrate disparities in COVID-19 indicators by race and ethnicity, with racial and ethnic minorities bearing a disproportionate burden of COVID-19 positive tests, cases, hospitalizations, and deaths.
· Testing. CDC race and ethnicity data on the percent of positive test results, while incomplete, suggest disproportionate test positivity rates for racial and ethnic minority groups. Among COVID-19 diagnostic test results reported to CDC from laboratories from 45 jurisdictions as of October 11, 2020, the percent of positive COVID-19 tests were 18.0 percent for non-Hispanic American Indian/Alaska Native, 15.1 percent for non-Hispanic Native Hawaiian or Other Pacific Islander persons, 17.9 percent for Hispanic or Latino persons, and 13.1 percent for Black persons, compared to 7.7 percent for non-Hispanic White persons.219
· Cases. CDC race and ethnicity data on COVID-19 cases, while incomplete, demonstrate that racial and ethnic minority groups have been disproportionately affected.220 Among cases with known race and ethnicity reported to CDC as of October 20, 2020, 29.4 percent of cases were for persons who were Hispanic or Latino (compared to 18 percent of the U.S. population), 17.4 percent were non-Hispanic Black (compared to 13 percent of the U.S. population), 1.2 percent were non-Hispanic American Indian/Alaska Native (compared to 0.7 percent of the U.S. population), and 45.1 percent were non-Hispanic White persons (compared to 60.1 percent of the population).221
219 CDC data represent total laboratory tests, not individual people, and exclude antibody and antigen tests. Both race and ethnicity information was missing for 82.0 percent of COVID-19 laboratory tests reported to CDC as of October 11, 2020.
220 Additional disparities may be observed at the state or jurisdictional level. For example, CDC reported that as of October 13, 2020, counties with large non -Hispanic Black populations were more likely to have a recent high burden of COVID-19 cases.
221 Centers for Disease Control and Prevention, Morbidity and Mortality Weekly Report, Vol. 69, No. 24 (June 19, 2020). We compared the population distribution data by race and ethnicity in this report with data from the CDC COVID Data Tracker, accessed October 20, 2020, https://www.cdc.gov/covid-data-tracker.

Appendix I: Enclosures
Page 175 GAO-21-191
· Hospitalizations. CDC data indicate that racial and ethnic minority groups are disproportionately hospitalized with COVID-19 in select counties in 14 states included in CDC’s COVID-19-Associated Hospitalization Surveillance Network (COVID-NET).222 According to CDC’s analysis of data in select counties in 14 states included in COVID-NET hospitalizations between March 1, 2020 and October 10, 2020, Hispanic or Latino persons were hospitalized with COVID-19 at a rate 4.5 times that of non-Hispanic White persons. Non-Hispanic American Indian/Alaska Native and non-Hispanic Black persons were hospitalized at a rate 4.4 times that of non-Hispanic White persons when adjusting for age (see figure).
Cumulative COVID-19-Associated Hospitalization Rates per 100,000 Population from Select Counties in 14 States, Adjusted for Age, by Race and Ethnicity, March 1, 2020 through October 10, 2020
Note: American Indian/Alaska Native, Asian or Pacif ic Islander, Black, and White persons w ere non-Hispanic. Hispanic or Latino persons might be of any race. Hospitalization data are from Centers for Disease Control and Prevention’s Coronavirus Disease 2019 (COVID-19)-Associated Hospitalization Surveillance Netw ork (COVID-NET), w hich provides data from select counties in 14 states, representing 10 percent of the U.S. population. Age-adjusted rates, which hold constant the age
222 COVID-NET is a surveillance system maintained by CDC that collects data on COVID-19 hospitalizations that are confirmed by laboratory testing. It includes data from select counties in California, Colorado, Connecticut, Georgia, Iowa, Maryland, Michigan, Minnesota, New Mexico, New York, Ohio, Oregon, Tennessee, and Utah, representing approximately 10 percent of the U.S. population. As of October 10, 2020, approximately 5.3 percent of the data reported in COVID-NET lacked data on race and ethnicity.

Appendix I: Enclosures
Page 176 GAO-21-191
distributions betw een different population groups, allow researchers to focus analyses on other demographics, such as race and ethnicity, w ithout being concerned about differences that are due to different age distributions of the racial and ethnic groups. Age-adjusted rates are particularly important to consider for indicators of COVID-19 because persons in older age groups are more likely to experience hospitalizations and racial and ethnic groups have different age distributions in the U.S. population.
· Deaths. A CDC analysis of National Center for Health Statistics (NCHS) death certificate data indicated a disproportionate number of deaths among non-Hispanic Black persons, who represent more than one in five COVID-19 deaths in the U.S.223 As of October 7, 2020, NCHS data show that non-Hispanic Black persons died of COVID-19 at a rate almost two times higher than non-Hispanic White persons (see figure).224
223 The National Center for Health Statistics’ (NCHS) National Vital Statistics System is the source of official statistics on deaths in the U.S.
224 Department of Health and Human Services, Centers for Disease Control and Prevention, Report to Congress on Paycheck Protection Program and Health Care Enhancement Act Disaggregated Data on U.S. Coronavirus Disease 2019 (COVID -19) Testing, 5th 30-Day Update & COVID-19 Diagnosis, Hospitalizations, and Deaths (October 2020). Disparities by race and ethnicity can also be observed at the state or jurisdictional level. GAO analyzed CDC’s NCHS death certificate data in states with more than 100 deaths and 10 or more deaths for the race or ethnicity group, and found that non-Hispanic Black persons had an elevated share of deaths in 26 of 40 states, Hispanic persons had an elevated share in 35 of 45 states, and non -Hispanic American Indian/Alaskan Native persons had an elevated share in 17 of 29 states, as of the data released on October 21, 2020. We defined an elevated share of deaths as having a relative difference of 30 percent or more, accounting for the geographic location of the deaths and the age distribution of the population groups.

Appendix I: Enclosures
Page 177 GAO-21-191
COVID-19 Death Rates, by Race and Ethnicity, through October 7, 2020
Note: Data are from Department of Health and Human Services, Centers for Disease Control and Prevention, Report to Congress on Paycheck Protection Program and Health Care Enhancement Act Disaggregated Data on U.S. Coronavirus Disease 2019 (COVID-19) Testing, 5th 30-Day Update & COVID-19 Diagnosis, Hospitalizations, and Deaths (October 2020). American Indian/Alaska Native, Asian, Black, Native Haw aiian or Other Pacif ic Islander, and White persons w ere non-Hispanic. Hispanic or Latino persons might be of any race. Death rates include deaths reported in the U.S., and are reported by CDC/NCHS from its National Vital Statistics System (NVSS), w hich is the source of off icial statistics on deaths in the U.S. CDC noted that death certif icate data are provisional, and may not include all deaths. CDC stated that over 99 percent of deaths in NVSS have race and ethnicity information.
CDC reported that the percentage of higher than expected deaths—that is, the percent increase in deaths during the COVID-19 pandemic compared to the average number of deaths from 2015 through 2019 during the same time period—also shows disparities by racial and ethnic minority groups.225 Specifically, the highest increases in weekly deaths among Hispanic or Latino (114.7 percent), Non-Hispanic Asian (110.4 percent), and Non-Hispanic Black (112.1 percent) persons were approximately four times the highest increase in deaths among Non-Hispanic White persons (27.8 percent) (see figure).
225 Centers for Disease Control and Prevention, Morbidity and Morta lity Weekly Report, Vol. 69, No. 41 (October 20, 2020). According to CDC, while some higher than expected deaths may be directly attributable to COVID-19, the extent to which excess deaths above the 2015 through 2019 average weekly death rate may be attributable to COVID-19 is not yet known.
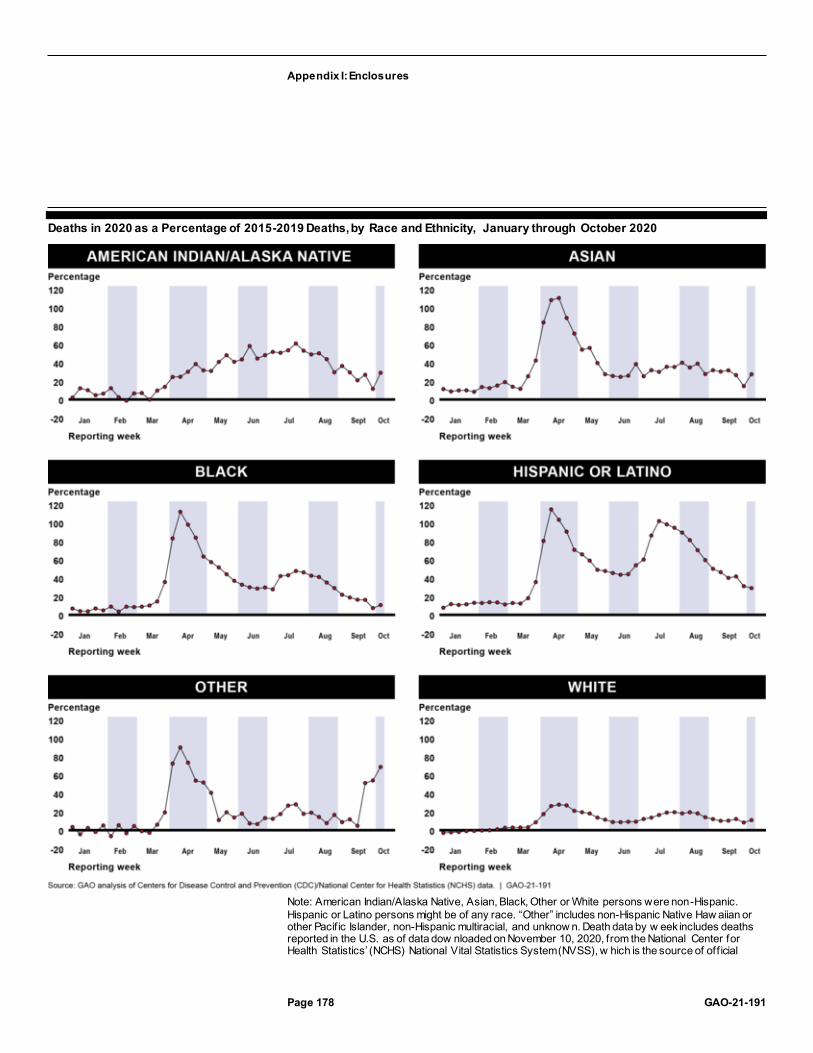
Appendix I: Enclosures
Page 178 GAO-21-191
Deaths in 2020 as a Percentage of 2015-2019 Deaths, by Race and Ethnicity, January through October 2020
Note: American Indian/Alaska Native, Asian, Black, Other or White persons were non-Hispanic. Hispanic or Latino persons might be of any race. “Other” includes non-Hispanic Native Haw aiian or other Pacif ic Islander, non-Hispanic multiracial, and unknow n. Death data by w eek includes deaths reported in the U.S. as of data dow nloaded on November 10, 2020, from the National Center for Health Statistics’ (NCHS) National Vital Statistics System (NVSS), w hich is the source of off icial

Appendix I: Enclosures
Page 179 GAO-21-191
statistics on deaths in the U.S. NCHS noted that death certif icate data are provisional and may not be complete, especially for the most recent w eeks. Percentages greater than zero show higher than expected deaths during the COVID-19 pandemic compared to the average number of deaths from 2015 through 2019 during the same time period. Percentages w ere weighted to account for potential underreporting in the most recent w eeks, but may not fully account for underreporting. According to NCHS, w hile some higher than expected deaths may be directly attributable to COVID-19, the extent to w hich excess deaths may be directly or indirectly attributable to COVID-19 is not yet know n. See CDC’s National Center for Health Statistics w ebpage on excess deaths for further details: https://www.cdc.gov/nchs/nvss/vsrr/covid19/excess_deaths.htm, accessed on November 12, 2020.
Additional race and ethnicity disparities within age groups. Additional disparities by race and ethnicity may be observed within age groups, including persons age 65 and older who are covered by Medicare.
· Cases. A Centers for Medicare & Medicaid Services (CMS) preliminary analysis of Medicare fee-for-service claims data and Medicare Advantage (Medicare’s managed care program) encounter data for services from January 1 through August 15, 2020, received by September 11, 2020, found racial and ethnic disparities in COVID-19 case rates. Case rates were highest for Black beneficiaries (2,799 cases per 100,000), Hispanic or Latino beneficiaries (2,627 cases per 100,000), and American Indian/Alaska Native beneficiaries (2,152 cases per 100,000) and lowest among White beneficiaries (1,272 cases per 100,000) and Asian beneficiaries (1,243 cases per 100,000).226
· Hospitalizations. As part of a preliminary analysis of Medicare claims and encounter data for services from January 1 through August 15, 2020, received by September 11, 2020, CMS found racial and ethnic disparities in COVID-19 hospitalization rates among Medicare beneficiaries, with hospitalization rates highest for Black beneficiaries (1,114 hospitalizations per 100,000), American Indian/Alaska Native beneficiaries (917 hospitalizations per 100,000), and Hispanic or Latino beneficiaries (831 hospitalizations per 100,000) and lowest
226 Department of Health and Human Services, Centers for Medicare & Medicaid Services, Preliminary Medicare COVID-19 Data Snapshot (September 11, 2020).

Appendix I: Enclosures
Page 180 GAO-21-191
among White beneficiaries (303 hospitalizations per 100,000) as of August 15, 2020.227
· Deaths in younger age groups. In September 2020, CDC reported that 78 percent of COVID-19 deaths in persons under age 21 were among Hispanic, non-Hispanic Black, and non-Hispanic American Indian/Alaska Native persons, according to case reporting.228 In addition, racial and ethnic minority populations comprise a larger proportion of COVID-19 deaths at younger age groups (35-44 and 45-54), according to death certificate data (see figure).229
· Deaths in older age groups. CDC also reported that as of October 7, 2020, non-Hispanic Black persons older than age 85 had the highest death rate (1,589.4 per 100,000), followed by Hispanic or Latino persons older than age 85 (1,422.4 per 100,000) and non-Hispanic American Indian/Alaskan Native persons older than age 85 (910.4 per 100,000), according to case reporting.230 (See figure.)
227 Department of Health and Human Services, Centers for Medicare & Medicaid Services, Preliminary Medicare COVID-19 Data Snapshot (September 11, 2020). The rate of Medicare COVID-19 hospitalizations per 100,000 people is calculated by taking Medicare COVID-19 hospitalizations divided by the Medicare population with Part A insurance, expressed as per 100,000 people. For more details about the metrics used in the snapshot, see CMS’s Preliminary Medicare COVID-19 Data Snapshot Methodology, accessed October 9, 2020, at https://www.cms.gov/files/document/medicare-covid-19-data-snapshot-methodology.pdf. Medicare claims and encounter data are collected for payment and other program purposes, not public health surveillance, so caution must be used when interpreting the data.
228 Centers for Disease Control and Prevention, Morbidity and Mortality Weekly Report, Vol. 69, No. 37 (Sept. 18, 2020).
229 The age distribution of the population and of COVID-19 deaths may vary between race and Hispanic origin groups.
230 Department of Health and Human Services, Centers for Disease Control and Prevention. Report to Congress on Paycheck Protection Program and Health Care Enhancement Act Disaggregated Data on U.S. Coronavirus Disease 2019 (COVID -19) Testing, 5th 30-Day Update & COVID-19 Diagnosis, Hospitalization, and Deaths (October 2020).
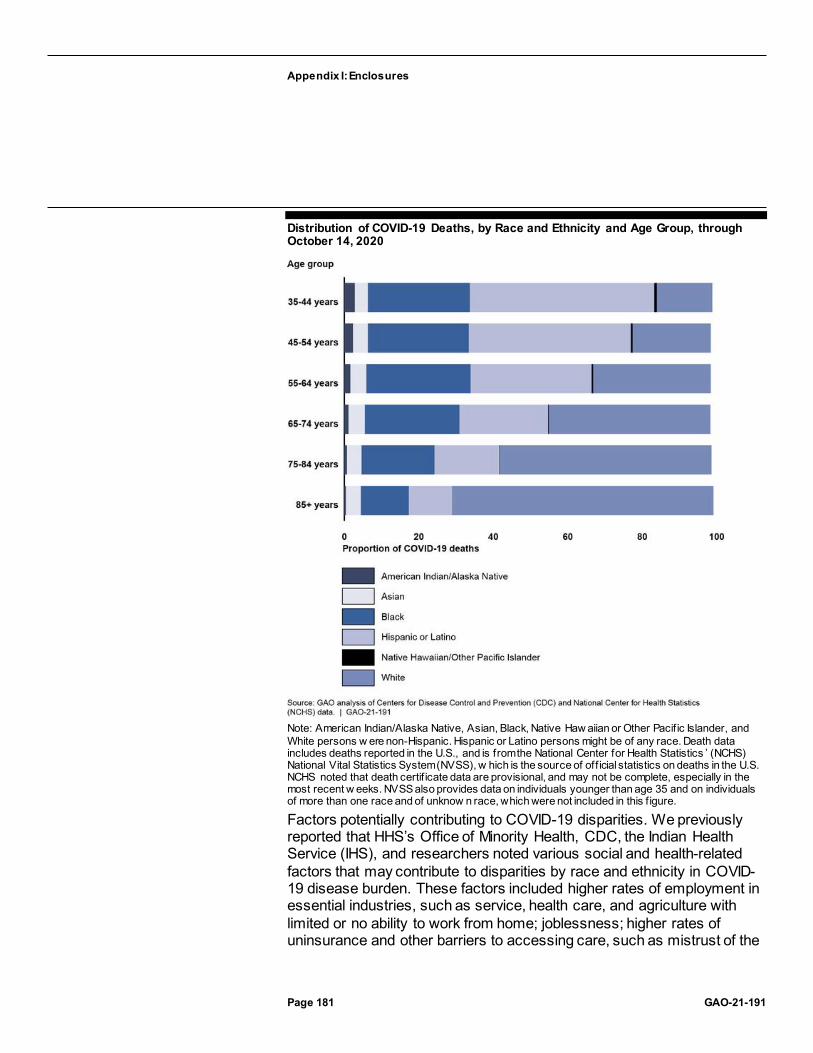
Appendix I: Enclosures
Page 181 GAO-21-191
Distribution of COVID-19 Deaths, by Race and Ethnicity and Age Group, through October 14, 2020
Note: American Indian/Alaska Native, Asian, Black, Native Haw aiian or Other Pacif ic Islander, and White persons w ere non-Hispanic. Hispanic or Latino persons might be of any race. Death data includes deaths reported in the U.S., and is from the National Center for Health Statistics ’ (NCHS) National Vital Statistics System (NVSS), w hich is the source of off icial statistics on deaths in the U.S. NCHS noted that death certif icate data are provisional, and may not be complete, especially in the most recent w eeks. NVSS also provides data on individuals younger than age 35 and on individuals of more than one race and of unknow n race, which were not included in this f igure.
Factors potentially contributing to COVID-19 disparities. We previously reported that HHS’s Office of Minority Health, CDC, the Indian Health Service (IHS), and researchers noted various social and health-related factors that may contribute to disparities by race and ethnicity in COVID-19 disease burden. These factors included higher rates of employment in essential industries, such as service, health care, and agriculture with limited or no ability to work from home; joblessness; higher rates of uninsurance and other barriers to accessing care, such as mistrust of the

Appendix I: Enclosures
Page 182 GAO-21-191
health care system, language barriers, and cost of missing work; higher population density and overcrowded, multigenerational, or multi-family homes; and experiences of racism, stigma, and systemic inequities.231
As of October 2020, HHS’s Office of the Assistant Secretary for Health, NIH, and HRSA noted additional factors that may contribute to health disparities in indicators of COVID-19, including the following:
· uneven geographic distribution of health resources and health care; · reduced access to health care and supportive services due to closure
of schools, community health centers, senior centers, and home visitation programs due to COVID-19, particularly for children and women;
· environmental health inequities such as concentration of respiratory hazards and toxic sites in low-socioeconomic status areas with high minority representation;
· advanced aging caused by bodily wear and tear from fight-or-flight responses to external stressors, especially racial discrimination;
· higher rates of pre-existing behavioral health conditions, such as substance use disorders;
· lack of digital literacy by providers, patients, families, and caregivers; · lack of internet connectivity including broadband, connection speed,
and WIFI internet service; · presence of food deserts in rural and urban areas; · lack of access to reliable, affordable, and safe transportation; and · inequitable application of the law and access to affordable legal
services.
Agency Comments
We provided HHS, including CDC and CMS, and the Office of Management and Budget (OMB) with a draft of this enclosure. CDC,
231 For example, see M. L. Wang, et al., “Addressing inequalities in COVID -19 morbidity and mortality: research and policy recommendations,” Translational Behavioral Medicine. (2020) and Selden T. M. and Berdahl T. A., “COVID-19 and racial/ethnic disparities in health risk, employment, and household composition,” Health Affairs 39, No. 9. (2020).

Appendix I: Enclosures
Page 183 GAO-21-191
CMS, and HHS provided technical comments on this enclosure, which we incorporated as appropriate.
GAO’s Methodology
To conduct this work, we reviewed the most recent agency data on indicators of COVID-19 reported by CDC and CMS as of October 20, 2020; reviewed federal laws, agency guidance and documentation; and interviewed or obtained written responses from HHS officials, including those from its Office of Minority Health, Office of the Assistant Secretary for Health, CDC, CMS, HRSA, IHS, and NIH. We assessed the reliability of the datasets used in our analyses by reviewing relevant CDC and CMS documentation and interviewing agency officials. We determined the data were sufficiently reliable for the purposes of our reporting objective.
Contact information: Alyssa M. Hundrup, (202) 512-7114, [email protected]
Related GAO Product
COVID-19 Data Quality and Considerations for Modeling and Analysis. GAO-20-635SP. Washington, D.C.; July 30, 2020.
Behavioral Health
Evidence suggests that effects of the COVID-19 pandemic and related economic crisis—such as increased social isolation, stress, and unemployment—are potentially driving an additional national crisis related to behavioral health. At the same time symptoms of behavioral health conditions—mental health and substance use disorders—are shown to be worsening, access to treatment may be declining due to factors such as treatment providers closing or limiting hours, and loss of employer-based health insurance. Multiple federal agencies are taking actions to help address the impacts of the COVID-19 pandemic on behavioral health.
Entities involved: Department of Health and Human Services, including its Centers for Disease Control and Prevention, Commissioned Corps of the United States Public Health Service, Health Resources and Services Administration, National Institutes of Health, Office of the Assistant Secretary for Preparedness and Response, and Substance Abuse and Mental Health Services Administration; and the Federal Emergency Management Agency, within the Department of Homeland Security

Appendix I: Enclosures
Page 184 GAO-21-191
Key Considerations and Future GAO Work
Our work examining the behavioral health impacts of the COVID-19 pandemic is ongoing. We will continue to examine the pandemic’s impacts on Americans’ behavioral health; demand for and access to treatment—particularly among populations especially vulnerable to negative impacts; and the federal response.
Background
Behavioral health conditions—mental health and substance use disorders—affect a substantial number of adults in the United States, and have been of growing concern even before the COVID-19 pandemic.232
For example, in 2019, an estimated 52 million adults in the United States (21 percent) had “any mental illness”—including 13 million adults (5 percent) with a serious mental illness.233 Additionally, 20 million people aged 12 or older (or 7 percent of this population) had a substance use disorder—alcohol use disorder, an illicit drug use disorder, or both.
In October 2017, the Acting Secretary of Health and Human Services first declared the opioid crisis a public health emergency and a declaration has been in effect since that time.234 In March 2020, we determined drug 232 We define behavioral health conditions as all mental, emotional, and behavioral disorders that are included in the Diagnostic and Statistical Manual of Mental Disorders. Examples of mental health conditions that are included are anxiety disorders, including post-traumatic stress disorder; mood disorders, including depression and bipolar disorder; and schizophrenia. Examples of substance use disorders are alcohol use disorder and opioid use disorder.
233 See Substance Abuse and Mental Health Services Administration (SAMHSA), Key Substance Use and Mental Health Indicators in the United States: Results from the 2019 National Survey on Drug Use and Health, (Rockville, M.D.: September 2020). SAMHSA classified adults aged 18 or older as having any mental illness if they had any mental, behavioral, or emotional disorder in the past year of sufficient duration to meet criteria in the Diagnostic and Statistical Manual of Mental Disorders (excluding developmental disorders and substance use disorders). SAMHSA classified adults with any mental illness as having serious mental illness if they had any mental, behavioral, or emotional disorder that substantially interfered with or limited one or more major life activities. In its estimates of those with a substance use disorder, SAMHSA included those reporting an alcohol use disorder, illicit drug use disorder, or both in the past year.
234 A public health emergency declaration is in effect until the Secretary declares the emergency no longer exists, or 90 days after the declaration, whichever occurs first. A declaration that expires may be renewed by the Secretary. See 42 U.S.C. § 247d(a). The opioid crisis was first declared a public health emergency in October 2017, and the declaration has been renewed 12 times, most recently in October 2020.

Appendix I: Enclosures
Page 185 GAO-21-191
misuse (the use of illicit drugs and the misuse of prescription drugs) was high-risk and reported that we would include this issue in our 2021 High-Risk Series update.235 We noted then that the COVID-19 pandemic could fuel some of the contributing factors of drug misuse, such as unemployment, highlighting the need to sustain and build upon ongoing federal efforts to address drug misuse.
Various federal agencies regularly conduct behavioral health-related work, including the Substance Abuse and Mental Health Services Administration (SAMHSA), Centers for Disease Control and Prevention (CDC), Health Resources and Services Administration (HRSA), and National Institutes of Health (NIH). Further, in times of disasters or emergencies such as the COVID-19 pandemic, additional federal agencies may take on roles to address behavioral health concerns, including the Office of Assistant Secretary for Preparedness and Response (ASPR), the Commissioned Corps of the U.S. Public Health Service, and the Federal Emergency Management Agency (FEMA).
Under the CARES Act, SAMHSA was appropriated $425 million for health surveillance and program support related to the COVID-19 pandemic.236
Of this, the Act specified that
· at least $250 million is available for the Certified Community Behavioral Health Clinic Expansion Grant program,237
· at least $50 million shall be available for suicide prevention programs, · at least $100 million is available for noncompetitive grants, contracts,
or cooperative agreements to public entities to address emergency
235 Our High-Risk List is a regularly updated list of programs and operations that are “high risk” because, among other things, they need transformation. For more information about GAO’s High Risk List, see https://www.gao.gov/highrisk/overview.
236 Pub. L. No. 116-136, div. B., tit. VIII, 134 Stat. 281, 556 (2020). In addition to the funds appropriated to SAMHSA, other agencies such as NIH, HRSA, and FEMA received supplemental appropriations under the CARES Act and/or other COVID-19 relief acts. While these supplemental appropriations were not specifically targeted for behavioral health, agencies may be using some of them for behavioral health related eff orts.
237 According to SAMHSA, the purpose of the this expansion grant program is to increase access to, and improve the quality of, community mental health and substance use disorder treatment services through the expansion of Certified Community Behaviora l Health Clinics. Such clinics provide access to a continuum of coordinated services and supports, including rapid-response 24/7 crisis services, peer and family support, targeted case management, and clinical outpatient psychotherapeutic interventions.
Appendix I: Enclosures
Page 186 GAO-21-191
substance abuse or mental health needs in local communities, as authorized under section 501(o) of the Public Health Service Act, and
· at least $15 million shall be allocated to tribes, tribal organizations, urban Indian health organizations, or health or behavioral health service providers to tribes.
Overview of Key Issues
Expected increases in substance use, mental health disorders, and suicidality. As a result of the COVID-19 pandemic, federal officials and stakeholder organizations who address behavioral health issues told us that they expect increases in substance use, mental health disorders, and suicidality, with some noting that the behavioral health consequences resulting from the pandemic are likely to persist after the risk from COVID-19 has decreased. Data collected to date during the pandemic corroborates these concerns. For example, in September 2020, SAMHSA reported increases in opioid overdose deaths in some areas of the country as much as 25 to 50 percent higher during the pandemic than the comparison time period in 2019.238
Regarding anxiety and depression, from April through October 2020, the Census Bureau, in collaboration with CDC and other federal agencies, collected information for its Household Pulse Survey on the percentage of U.S. adults reporting symptoms of anxiety disorder and depressive
238 See Dr. Elinore McCance-Katz, Assistant Secretary for Mental Health and Substance Use, Substance Abuse and Mental Health Administration, The National Survey on Drug Use and Health: 2019 [Webcast Slides], September 2020, accessed October 9, 2020, https://www.samhsa.gov/data/report/dr-elinore-f-mccance-katz-webcast-slides-national-2019. Additionally, data from the Overdose Detection Mapping Application Program —a surveillance system that provides near real-time suspected overdose data nationally—showed that between March and May 2020, over 61 percent of participating counties experienced an increase in overdose reports with an 18 percent increase in suspected overdose reports when comparing the weeks prior to and following the commencement of state-mandated stay-at-home orders. The Washington/Baltimore High Intensity Drug Trafficking Area, housed within the University of Baltimore Center for Drug Policy and Enforcement, develops and maintains the Overdose Detection Mapping Application Program.

Appendix I: Enclosures
Page 187 GAO-21-191
disorder during the COVID-19 pandemic.239 Results of the Household Pulse survey found that the percentage of adults reporting experiencing these symptoms began at about 36 percent at the start of the survey period (April 23-May 5), generally increased over time to a peak of about 41 percent from July 16-21, and then decreased slightly to about 38 percent at the end of the survey period (October 14-26).240 In comparison, a CDC survey conducted in 2019 using similar questions found that about 11 percent of U.S. adults reported experiencing these symptoms from January to July 2019.241
The results of the Household Pulse Survey also suggest that the percentage of U.S. adults experiencing symptoms differs by age, with more individuals aged 18-29 experiencing symptoms of anxiety disorder
239 These mental health indicators are based on responses to two questions about symptoms of depressive disorder and two questions about symptoms of anxiety disorder in the prior 7 days. The percentage of adults include those who reported symptoms that generally occurred more than half the days or nearly every day. The 2020 Household Pulse Survey, an experimental data product, is an interagency federal statistical rapid response survey to measure household experiences during the COVID-19 pandemic. Sample sizes were determined such that a two-percentage point detectable difference in weekly estimates for an estimate of 40 percent of the population would be detectable with a 90 percent confidence interval within each sample area. Weighted response rates have ranged from 1.3–10.3 percent. The Census Bureau reports that it will conduct a nonresponse bias assessment. Measures, such as the demographic distribution of the survey respondents compared to benchmarks, will be produced for data users to consider in their analysis. See https://www.cdc.gov/nchs/covid19/pulse/mental-health.htm and https://www2.census.gov/programs-surveys/demo/technical-documentation/hhp/Source-and-Accuracy-Statement-July-16-July-21.pdf for more information about the survey methodology and mental health results.
240 There were two data collection phases in the Household Pulse Survey. The first phase collected information from April to July 2020 in multi -day collection periods—April 23-May 5 was the start of the survey period and July 16-21 was the end. The second phase of the survey collected information from August to October 2020 in multi -day collection periods—August 19-31 was the start of the survey period and October 14 -26 was the end.
241 See Centers for Disease Control and Prevention, National Center for He alth Statistics, Early Release of Selected Mental Health Estimates Based on Data from the January–June 2019 National Health Interview Survey (May 2020). This estimate is based on responses to two questions about symptoms of anxiety disorder and two questio ns about symptoms of depressive disorder in the prior 14 days. The percentage of adults include those who reported symptoms that generally occurred more than half the days or nearly every day. This estimate was published prior to final data editing and fin al weighting to provide benchmarks for recent mental health estimates derived from the U.S. Census Bureau’s Household Pulse Survey.

Appendix I: Enclosures
Page 188 GAO-21-191
or depressive disorder compared to other age groups.242 With regard to race or ethnicity, a higher percentage of individuals identifying as Hispanic, Black, and other or multiple races reported symptoms of anxiety disorder or depressive disorder compared to White and Asian individuals consistently over the survey period.243 (See our Health Disparities enclosure.)
In addition, in August 2020, CDC published the results of other surveys conducted during late June 2020 related to mental health, substance use, and suicidal ideation during the COVID-19 pandemic.244 Overall, about 41 percent of 5,412 respondents who completed surveys during June reported symptoms of at least one adverse behavioral health condition, including about 26 percent of respondents who reported trauma- and stressor-related disorder symptoms related to COVID-19.245
Among other survey findings, persons aged 18 to 24 years most commonly reported symptoms of various behavioral health conditions, and prevalence decreased progressively with age. Other subgroups reporting higher prevalence of symptoms of adverse behavioral health conditions included Hispanic respondents, non-Hispanic Black respondents, self-reported unpaid caregivers and essential workers, and those receiving treatment for a previously diagnosed mental health condition.
242 The percentage of individuals aged 18-29 experiencing symptoms of anxiety disorder or depressive disorder increased from about 47 percent at the start of the survey (April 23 -May 5) to just over 50 percent at the end of the survey (October 14-26). The percentage of U.S. adults experiencing symptoms of anxiety disorder or depressive disorder decreased by age group (e.g. 30-39 years, 40-49 years, etc.) consistently over the survey period. See https://www.cdc.gov/nchs/covid19/pulse/mental-health.htm for more details about the percentage of U.S. adults in each age group reporting symptoms of anxiety disorder or depressive disorder.
243 Individuals identifying as White, Black, Asian, and other or multiple races were non -Hispanic. Hispanic individuals might be of any race.
244 See M. É. Czeisler, R. I. Lane, E. Petrosky, et al., Mental Health, Substance Use, and Suicidal Ideation During the COVID-19 Pandemic — United States, June 24–30, 2020, MMWR Morbidity and Mortality Weekly Report, vol. 69, no. 32 (2020): p. 1049-1057 (Atlanta, Ga: Centers for Disease Control and Prevention, Aug. 14, 2020).
245 Disorders classified as trauma- and stressor-related disorder in the Diagnostic and Statistical Manual of Mental Disorders include posttraumatic stress disorder, acute stress disorder, and adjustment disorders, among others.
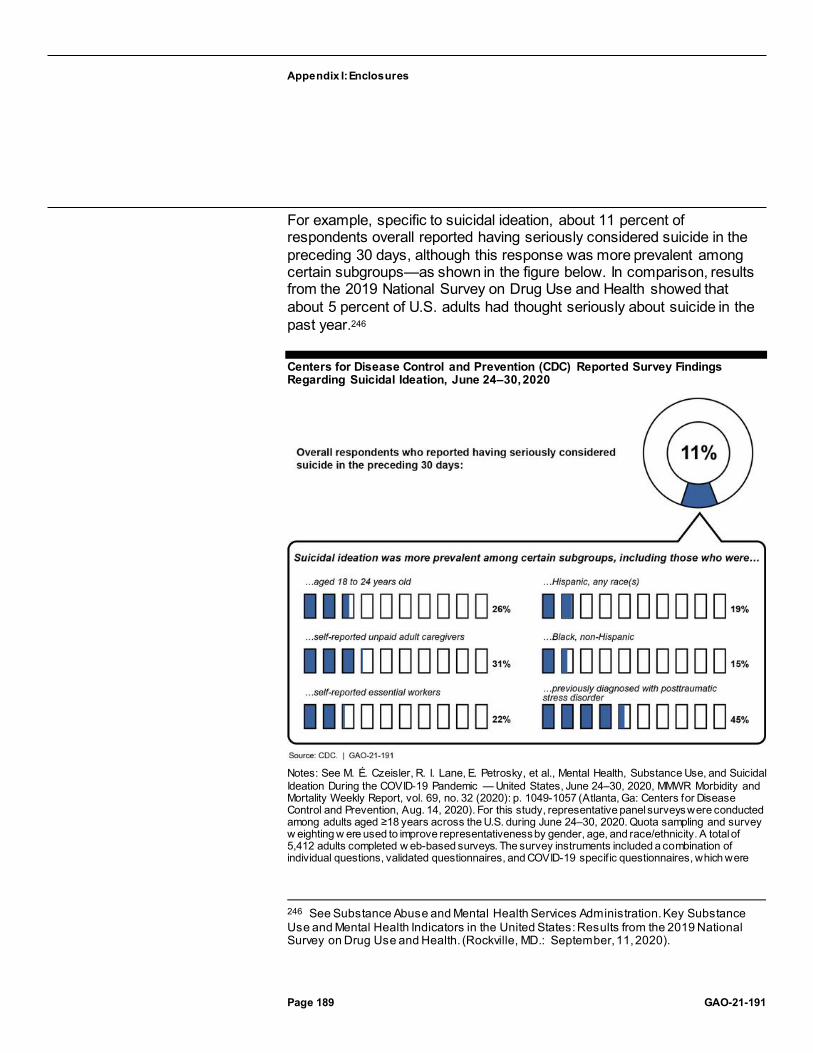
Appendix I: Enclosures
Page 189 GAO-21-191
For example, specific to suicidal ideation, about 11 percent of respondents overall reported having seriously considered suicide in the preceding 30 days, although this response was more prevalent among certain subgroups—as shown in the figure below. In comparison, results from the 2019 National Survey on Drug Use and Health showed that about 5 percent of U.S. adults had thought seriously about suicide in the past year.246
Centers for Disease Control and Prevention (CDC) Reported Survey Findings Regarding Suicidal Ideation, June 24–30, 2020
Notes: See M. É. Czeisler, R. I. Lane, E. Petrosky, et al., Mental Health, Substance Use, and Suicidal Ideation During the COVID-19 Pandemic — United States, June 24–30, 2020, MMWR Morbidity and Mortality Weekly Report, vol. 69, no. 32 (2020): p. 1049-1057 (Atlanta, Ga: Centers for Disease Control and Prevention, Aug. 14, 2020). For this study, representative panel surveys were conducted among adults aged ≥18 years across the U.S. during June 24–30, 2020. Quota sampling and survey w eighting w ere used to improve representativeness by gender, age, and race/ethnicity. A total of 5,412 adults completed w eb-based surveys. The survey instruments included a combination of individual questions, validated questionnaires, and COVID-19 specif ic questionnaires, which were
246 See Substance Abuse and Mental Health Services Administration. Key Substance Use and Mental Health Indicators in the United States: Results from the 2019 National Survey on Drug Use and Health. (Rockville, MD.: September, 11, 2020).

Appendix I: Enclosures
Page 190 GAO-21-191
used to assess respondent attitudes, behaviors, and beliefs related to COVID-19 and its mitigation, as w ell as the social and behavioral health impacts of the COVID-19 pandemic.
Similarly, while about 13 percent of overall respondents reported having started or increased substance use to cope with stress or emotions related to COVID-19, this response was more common among certain subgroups—(see figure).
Centers for Disease Control and Prevention (CDC) Reported Survey Findings Regarding Substance Use, June 24–30, 2020
Notes: See M. É. Czeisler, R. I. Lane, E. Petrosky, et al., Mental Health, Substance Use, and Suicidal Ideation During the COVID-19 Pandemic — United States, June 24–30, 2020, MMWR Morbidity and Mortality Weekly Report, vol. 69, no. 32 (2020): p. 1049-1057 (Atlanta, Ga: Centers for Disease Control and Prevention, Aug. 14, 2020). For this study, representative panel surveys were conducted among adults aged ≥18 years across the U.S. during June 24–30, 2020. Quota sampling and survey w eighting w ere used to improve representativeness by gender, age, and race/ethnicity. A total of 5,412 adults completed w eb-based surveys. The survey instruments included a combination of individual questions, validated questionnaires, and COVID-19 specif ic questionnaires, which were used to assess respondent attitudes, behaviors, and beliefs related to COVID-19 and its mitigation, as w ell as the social and behavioral health impacts of the COVID-19 pandemic.
Demand for services increasing and access to treatment expected to worsen. Although not all individuals experiencing new or exacerbated behavioral health symptoms will require or seek treatment, there is preliminary data indicating that demand for treatment services is

Appendix I: Enclosures
Page 191 GAO-21-191
increasing.247 For example, data provided by SAMHSA indicate that call and text volume to its Disaster Distress Helpline increased considerably during the pandemic as compared to 2019.248
Specifically, between March and August 2020, call volume peaked at 9,965 calls in April 2020—an 890 percent increase over April 2019, and then tapered off in the following months to 3,778 calls in August 2020 (a 340 percent increase). Text volume increased by even greater percentages, also peaking in April 2020. Call volume to SAMHSA’s National Helpline—a mental health and substance use treatment referral and information service—also increased during the pandemic. SAMHSA data show that call volume to this helpline began increasing over 2019 volume beginning in May 2020 (from 54,203 to 64,177 calls, or an 18 percent increase), and peaked in August 2020 (at 80,348 calls or a 35 percent increase).
Moreover, an August 2020 survey by the National Council for Behavioral Health found that 52 percent of the 343 provider member organizations surveyed reported demand for their services increasing in the 3 months before the survey.249
At the same time as demand increases, access to behavioral health treatment services is expected to worsen as a result of the COVID-19 pandemic. SAMHSA cites contributing factors such as layoffs of behavioral health staff and the loss of providers without the financial reserves to survive long-term and those unable to generate sufficient revenue to continue to operate.250 According to the August 2020 survey of 247 NIH officials noted that while there will likely be increases in clinical need, the cu rrent increases in symptoms of anxiety and depression, for example, are not necessarily indicative of large increases in serious and enduring mental and behavioral disorders.
248 SAMHSA’s Disaster Distress Helpline provides crisis counseling and support to people experiencing emotional distress related to natural or human -caused disasters. The Disaster Distress Helpline is staffed by trained counselors from a network of crisis call centers located across the United States.
249 See National Council for Behavioral Health. Member Survey: National Council for Behavioral Health Polling Presentation (September 2020), accessed October 15, 2020, https://www.thenationalcouncil.org/wp-content/uploads/2020/09/NCBH_Member_Survey_Sept_2020_CTD2.pdf.
250 As a result of the COVID-19 pandemic, behavioral health care providers, like other health care providers, may be experiencing financial losses and changes in operating expenses due to factors such as decreased revenues from cancellations of in -person visits, limitations in services due to social distancing requirements, and increased expenses, such as for purchasing personal protective equipment.

Appendix I: Enclosures
Page 192 GAO-21-191
the National Council for Behavioral Health provider member organizations, as a result of the COVID-19 pandemic:
· 26 percent of organizations reported laying off employees, · 24 percent furloughed employees, · 43 percent decreased the hours for staff, and · 65 percent of organizations reported having to cancel, reschedule, or
turn away patients in the last 3 months. SAMHSA officials and several stakeholder organizations cited additional factors that might limit access to care, such as loss of employer-based health insurance, and lack of broadband access or access to telehealth-capable devices as providers switched to telehealth-based treatment during the pandemic.
As we previously reported in June 2015, concerns about the availability of behavioral health treatment, particularly for low-income individuals, have been longstanding. For instance, before the COVID-19 pandemic, HRSA reported that by 2025 shortages of seven selected types of behavioral health providers were expected, with shortages of some provider types expected to exceed 10,000 full-time equivalents.251 As of September 30, 2020, HRSA designated more than 5,700 mental health provider shortage areas, affecting more than 119 million Americans. In these areas, about 27 percent of the estimated need for behavioral health providers is met.252
Federal agencies are taking actions to help address behavioral health impacts. Multiple federal agencies are taking actions to help address
251 See Health Resources and Services Administration, National Center for Health Workforce Analysis, National Projections of Supply and Demand for Selected Behavioral Health Practitioners: 2013-2025 (Rockville, M.D.: November 2016). A total of nine types of behavioral health practitioners were considered in these estimates: psychiatrists; behavioral health nurse practitioners; behavioral health physician assistants; clinical, counseling, and school psychologists; substance abuse and behavioral disorder counselors; mental health and substance abuse social workers; mental health counselors; school counselors; and marriage and family therapists. These professions were chosen because they have the largest number of providers within behavioral health care.
252 HRSA computes the percent of need met by dividing the number of mental health providers available to serve the population of the area, g roup, or facility by the number of mental health providers that would be necessary to reduce the population -to-provider ratio below the threshold that would allow it to eliminate the designation as a Health Professional Shortage Area for mental health.

Appendix I: Enclosures
Page 193 GAO-21-191
impacts of the COVID-19 pandemic on behavioral health, including the following:
SAMHSA. SAMHSA established a website, https://www.samhsa.gov/coronavirus, on which it has posted guidance and other documents related to providing behavioral health treatment services during the pandemic. For example, SAMHSA and the Centers for Medicare & Medicaid Services issued guidance encouraging health insurance issuers to expand coverage for mental health and substance use disorder services delivered via telehealth, among other things. 253
SAMHSA also released guidance related to other topics, such as considerations for outpatient mental and substance use disorder treatment settings, and state psychiatric hospitals during the COVID-19 pandemic.
In partnership with the Drug Enforcement Administration, SAMHSA announced flexibilities related to the provision of methadone and buprenorphine for the treatment of opioid use disorder in response to the COVID-19 pandemic. For example:
For new patients treated with buprenorphine, SAMHSA is exempting opioid treatment programs (OTPs) from the requirement to perform an in-person physical evaluation, allowing for the evaluation of the patient to be accomplished via telehealth.254
253 The Centers for Medicare & Medicaid Services, within the Department of Health and Human Services, administers Medicare, and oversees Medicaid at the federal level. The agency provides information about the behavioral health services covered by Medicare and Medicaid.
254 OTPs, sometimes referred to as narcotic treatment programs or methadone clinics, offer medication-assisted treatment (including medications like methadone and buprenorphine, counseling, and other services) for individuals addicted to heroin o r other opioids.For new OTP patients treated with buprenorphine, SAMHSA is temporarily exempting OTPs from the requirement to perform an in -person physical evaluation prior to admission if an authorized physician determines that an adequate evaluation of the patient can be completed via telehealth. This exemption does not apply to new OTP patients treated with methadone.

Appendix I: Enclosures
Page 194 GAO-21-191
For existing OTP patients, SAMHSA released guidance allowing for practitioners in OTPs to continue treatment with methadone and buprenorphine via telehealth, as long as certain conditions are met.255
A SAMHSA official told us that SAMHSA is also undertaking other efforts related to behavioral health and the COVID-19 pandemic, including offering training and technical assistance to behavioral health providers and educators, and focusing on public awareness messaging with entities such as school systems and local news organizations.
From its CARES Act funding, in July 2020, SAMHSA announced grant awards totaling over $424 million. This funding went to support various behavioral health related service providers, including Certified Community Behavioral Health Clinics, tribal behavioral health programs, states and territories, and local- and state-funded crisis centers, according to SAMHSA (see table). A SAMHSA official told us that the demand for these awards exceeded available funds, and that SAMHSA was not able to fund all applicants.
Substance Abuse and Mental Health Services Administration (SAMHSA) COVID-19 Related Grants
Grant Amount awarded ($) Certified Community Behavioral Health Clinics expansion grantsa
249,657,910
Emergency grants to address mental and substance use disorders during COVID-19b
109,791,641
Tribal Behavioral Health program supplemental funding c 14,999,908 Suicide Prevention Lifeline Crisis Center follow-up expansion grantsd
2,978,828
Suicide Lifeline/Disaster Distress Helpline supplemental fundinge
7,021,172
COVID-19 emergency response for suicide prevention grants f
39,795,212
Total 424,244,671 Source: GAO summary of SAMHSA data. | GAO-21-191
Notes: Grants noted w ere awarded through July 20, 2020. aSAMHSA reports that the purpose of the Certif ied Community Behavioral Health Clinics (CCBHC) expansion grants is to increase access to and improve the quality of community mental and
255 In addition, OTPs can dispense certain quantities of methadone or buprenorphine based on a telehealth evaluation, depending on a patien t’s clinical stability and ability to safely manage medication.
Appendix I: Enclosures
Page 195 GAO-21-191
substance use disorder treatment services through CCBHC expansion, and that it aw arded expansion grants to 64 CCBHCs. bSAMHSA reports that the purpose of this emergency grant program is to provide crisis intervention services, mental and substance use disorder treatment, and other related recovery s upports for children and adults affected by the COVID-19 pandemic. Funding w as available to states, territories, and tribes, and 96 aw ards were made. cSAMHSA reports that the purpose of the Tribal Behavioral Health program is to prevent suicide and substance misuse, to reduce the impact of trauma, and to promote mental health among American Indian/Alaska Native (AI/AN) youths up to 24 years old. SAMHSA provided supplemental funding to 154 current tribal behavioral health grant recipients in the amount of $97,402 each. dThe National Suicide Prevention Lifeline (NSPL) is a netw ork of over 170 local- and state-funded crisis centers located across the United States. Eligibility for these grants w as limited to NSPL Crisis Centers, and 3 aw ards were made. eSAMHSA reports that the purpose of this supplemental funding w as to support the Lifeline’s use of text messaging and expand access to the Lifeline services across the nation in response to the COVID-19 pandemic. This funding w as provided to the organization w hich runs the NSPL and Disaster Distress Hotline. fSAMHSA reports that the purpose of this grant program is to support states and communities during the COVID-19 pandemic in advancing efforts to prevent suicide and suicide attempts among adults age 25 and older. Funding w as available to states, territories, tribes and tribal organizations, community-based primary care or behavioral healthcare organizations, community-based service providers able to meet psychiatric and psychosocial needs of clients, public health agencies, and emergency departments. Fifty aw ards were made.
CDC. In addition to CDC’s partnership with the Census Bureau on the Household Pulse Survey and publication of the June survey related to mental health, substance use, and suicidal ideation during the COVID-19 pandemic, CDC reported that it modified some of its existing, ongoing data collection efforts on behavioral health in response to the COVID-19 pandemic. For example, starting in July 2020, CDC added questions to identify those diagnosed with COVID-19 to its annual National Health Interview Survey so the agency can examine the mental health of those individuals.256 According to CDC officials, the agency has also been involved in disseminating resources to the public to respond to behavioral health impacts of COVID-19. For example, the CDC Foundation provided support for the interactive website How Right Now, which provides tools to help individuals experiencing feelings of grief, loss, or worry during COVID-19 identify resources to help meet their needs.257
HRSA. HRSA indicated that one of its primary actions during the COVID-19 pandemic related to behavioral health has been to support its grantees in their efforts to continue providing or expanding access to behavioral
256 The National Health Interview Survey collects data on a broad range of health topics, including mental health, through personal household interviews.
257 See https://howrightnow.org/ for more information.

Appendix I: Enclosures
Page 196 GAO-21-191
health services.258 For example, HRSA reported that it has awarded more than $2 billion in supplemental funding to support health centers in responding to COVID-19, including maintaining or increasing health center capacity to support the continued delivery of primary care services, including substance use disorder and mental health services.
HRSA also reported that in response to the pandemic, the agency has focused on increasing access to telehealth for mental health and substance use services. For example, HRSA noted that it has awarded $15 million in CARES Act funding to increase telehealth access and infrastructure to support four areas of maternal and child health—one of which is services and supports for delivering trauma-informed health care, including behavioral health care. Additionally, HRSA’s behavioral health training programs incorporated telehealth and distance learning models in their education, training, and practice programs.
Further, HRSA administers the Provider Relief Fund, which reimburses eligible providers for health care-related expenses or lost revenues attributable to COVID-19.259 Behavioral health providers may have been eligible to receive some of the Provider Relief Fund disbursements to date, if, for example, they participate in Medicare or Medicaid. Additionally, on October 1, 2020, the Department of Health and Human Services, through HRSA, announced a new allocation of $20 billion from the Provider Relief Fund, noting that an expanded group of behavioral health providers will be eligible for these relief payments, such as addiction counseling centers, mental health counselors, and psychiatrists. (See the Relief for Health Care Providers enclosure for more information on Provider Relief Fund allocations and disbursements.)
258 HRSA reports that one of the ways it fulfills its mission to improve health outcomes and address health disparities through access to quality services, a skilled health workforce, and innovative, high-value programs, is through grants and cooperative agreements. In addition to grants made through HRSA’s Behavioral Health Workforce Education and Training Program, grants that may support behavioral health are made through programs such as its Health Center Program, Maternal and Child Health Programs, Ryan White HIV/AIDS Program, and Rural Health Program.
259 $175 billion was appropriated to reimburse eligible providers for health care -related expenses or lost revenues attributable to COVID-19, known as the Provider Relief Fund. Specifically, the CARES Act appropriated $100 billion and the Paycheck Protection Program and Health Care Enhancement Act appropriated an additional $75 billion for the fund. Pub. L. No. 116-136, div. B, tit. VIII, 134 Stat. 281, 563 (2020); Pub. L. No. 116-139, div. B, tit. I, 134 Stat. 620, 622 (2020).

Appendix I: Enclosures
Page 197 GAO-21-191
NIH. NIH officials reported that the agency has made changes to its behavioral health research plans based on the COVID-19 pandemic.260
The agency reported in its July 2020 Strategic Plan for COVID-19 Research that it planned to support research to understand and address the impacts of COVID-19 on behavioral health including potential impacts of the public health measures used to prevent the spread of the virus which may affect behavioral health.261 NIH reported that the agency had made numerous COVID-19 specific awards related to behavioral health research.262 For example, the National Institute on Drug Abuse issued a notice in March 2020 to solicit research on risks and outcomes for COVID-19 in individuals with substance use disorders. As a result, in fiscal year 2020, NIH funded 70 awards under this notice, many directly focused on behavioral health.263
Additionally, NIH officials told us that various NIH institutes and offices have coordinated research efforts through an NIH-wide workgroup intended to examine a broad range of topics. These include the social and economic impacts of various efforts to mitigate the pandemic; the effects of these impacts on mental health, suicide, substance use, violence, and other disorders; and the effects of the pandemic and its mitigation on health care access.264 As of September 2020, this workgroup had issued two funding opportunities focused on interventions to reduce the impact of the pandemic on vulnerable populations, such as those with health disparities.
260 NIH officials reported that the agency is using its regular appropriations to accommodate these changes.
261 See National Institutes for Health (NIH), NIH-Wide Strategic Plan for COVID-19 Research (July 2020).
262 Some of the NIH institutes that have ongoing or planned research related to mental health and substance use include the National Institute on Alcohol Abuse and Alcoholism, the National Institute on Drug Abuse, the National Institute of Mental Health, and the National Institute on Minority Health and Health Disparities.
263 NIH reports that these awards were a combination of supplements and urgent competitive revisions—revisions to awards to meet immediate needs to help address a specific public health crisis.
264 The workgroup—called the “Social, Behavioral, and Economic Health Impacts of COVID-19, Particularly in Vulnerable and Health Disparity Populations”—is led by officials from NIH’s National Institute of Mental Health, National Institute on Minority Health and Health Disparities, National Institute on Aging, Office of Behavioral and Social Sciences Research, and Office of Extramural Research.

Appendix I: Enclosures
Page 198 GAO-21-191
NIH is also internally conducting research related to the behavioral health impacts of the COVID-19 pandemic. For example, the National Institute of Mental Health began studying the mental health impact of the COVID-19 pandemic in April 2020 to learn how stressors related to the COVID-19 pandemic affect mental health over time.
ASPR. ASPR reported in October 2020 that it had deployed 20 National Disaster Medical System mental health specialists and one psychologist, both in-person and virtually, to help address behavioral health needs related to the COVID-19 pandemic.265 For example, ASPR reports that National Disaster Medical System teams providing medical support for state and local facilities in relation to COVID-19 usually include a mental health specialist to provide responders with support and guidance on managing extreme stress.
ASPR also reported that it was engaged in ongoing activities with other federal departments related to behavioral health and COVID-19. For example, an ASPR official chairs a behavioral health work group that also includes SAMHSA, CDC, and nonfederal participants. ASPR reports that the group aims to support mental health and substance use disorder treatment systems through efforts such as promoting promising practices and strategies for system sustainability.
Commissioned Corps. The Commissioned Corps of the United States Public Health Service reported that as of September 15, 2020, it had deployed 165 behavioral health officers in support of the COVID-19 pandemic response. These behavioral health support missions included activities such as providing behavioral health support for:
· quarantined residents on Air Force bases, · residents of long-term care facilities, and · patients in Indian Health Service facilities. FEMA. As of October 15, 2020, FEMA reports that it has awarded more than $302 million to 48 states and territories through its Crisis Counseling Assistance and Training program, which assists individuals and communities in recovering from the psychological effects of natural and
265 The National Disaster Medical System is the main program through which the Department of Health and Human Services enrolls responders to assist with the federal medical and public health response to public health emergencies.
Appendix I: Enclosures
Page 199 GAO-21-191
human caused disasters through community-based outreach and educational services.266 Some states have reported that they are using this funding, for example, to fund local hotlines, and deploy outreach counselors and clinicians to provide basic education and counseling around issues related to the pandemic, and assess high-risk individuals for mental health referrals.
In addition to the actions taken by the federal agencies listed above, on October 3, 2020 the President signed an Executive Order, which, among other things, established a Coronavirus Mental Health Working Group to be co-chaired by the Secretary of Health and Human Services and the Assistant to the President for Domestic Policy (or their designees). According to the Executive Order, the working group will include representatives from numerous federal agencies, as well as the Office of National Drug Control Policy and the Office of Management and Budget. It directs the working group to examine existing protocols and evidence-based programs that may serve as models to better support mental and behavioral health conditions of vulnerable populations, and to submit a plan to the President within 45 days of the date of the order for improved service coordination between all relevant stakeholders and agencies to assist individuals in crisis.267
Agency Comments
We provided a draft of this enclosure to the Department of Health and Human Services, the Department of Homeland Security, and the Office of Management and Budget. The Department of Health and Human Services provided technical comments, which we incorporated as appropriate. Neither the Department of Homeland Security nor the Office of Management and Budget provided comments on this enclosure.
266 See 42 U.S.C. § 5183; 44 C.F.R. § 206.171. When states or tribal entities request major disaster declarations, they may request assistance under the Crisis Counseling Assistance and Training program. Likewise, when the President makes a major disaster declaration, the declaration may authorize FEMA’s Individual Assistance program, which may also include the Crisis Counseling Assistance and Trainin g program. On April 28, 2020, President Trump delegated authority to approve the Crisis Counseling Assistance and Training program for COVID-19 pandemic related disasters to the FEMA Administrator for disasters declared prior to that date.
267 Exec. Order No. 13,954, 85 Fed. Reg. 63,977 (Oct. 8, 2020). The Executive Order includes in its description of vulnerable populations: minorities, seniors, veterans, small business owners, children, and individuals potentially affected by domestic violence or physical abuse; those living with disabilities; and those with a substance use disorder.
Appendix I: Enclosures
Page 200 GAO-21-191
GAO’s Methodology
To conduct this work, we reviewed federal law, agency guidance and documents; and interviewed or obtained written responses from agency officials, including those from SAMHSA, CDC, HRSA, NIH, ASPR, and FEMA. We reviewed data from Phase 1 and 2 of the Household Pulse Survey through October 26, 2020, as reported by CDC’s National Center for Health Statistics, and SAMHSA’s Disaster Distress Helpline and National Helpline data provided for January through August 2019 and January through August 2020. We assessed the reliability of these data, and the June survey data published in CDC’s Morbidity and Mortality Weekly Report, by reviewing relevant agency documentation, requesting written information from agency officials, and checking for obvious errors. We determined that these data were sufficiently reliable for the purpose of describing reported impacts of the COVID-19 pandemic on behavioral health symptoms and demand for treatment.
We also conducted interviews, and reviewed written responses and other reports and documentation provided by organizations that represent various types of behavioral health service providers, referred to as stakeholders, to obtain their perspectives on behavioral health concerns, challenges, and federal agency actions.268 We reviewed the findings from the National Council for Behavioral Health’s August 2020 member survey, and assessed the reliability of these data by requesting information from the Council, and reviewing survey documentation. We determined that these data were sufficiently reliable for the purpose of describing reported impacts of the COVID-19 pandemic on behavioral health treatment providers. In addition to federal agency and stakeholders’ reports and documentation, we also reviewed other published reports and research papers related to behavioral health and the COVID-19 pandemic.
Contact information: Alyssa M. Hundrup, (202) 512-7114, [email protected]
268 We interviewed or received written responses from stakeholders including the American Psychiatric Association, American Psychological Association, American Society of Addiction Medicine, National Alliance on Mental Illness, National Council for Behavioral Health, and National Association of Addiction Treatment Providers.
Appendix I: Enclosures
Page 201 GAO-21-191
Related GAO Products
Drug Misuse: Sustained National Efforts Are Necessary for Prevention, Response, and Recovery. GAO-20-474. Washington, D.C.: March 26, 2020.
Behavioral Health: Options for Low-Income Adults to Receive Treatment in Selected States. GAO-15-449. Washington, D.C.: June 19, 2015.
States’ Perspectives on Medical Supply Availability
States and territories in our nationwide survey continue to report limitations in the availability of certain medical supplies, such as nitrile gloves and reagents used for COVID-19 testing.
Entities involved: The Federal Emergency Management Agency, within the Department of Homeland Security; and the Department of Health and Human Services, including its Office of the Assistant Secretary for Health and Office of the Assistant Secretary for Preparedness and Response.
Key Considerations and Future GAO Work
In September 2020, we reported ongoing constraints with the availability of certain types of personal protective equipment (PPE) and testing supplies due to a supply chain with limited domestic production and high global demand. Specifically, we found that the Food and Drug Administration (FDA) and Federal Emergency Management Agency (FEMA) had both identified shortages of certain supplies. Officials from seven of the eight states, as well as stakeholder groups GAO interviewed in July and August 2020, identified constraints around PPE and testing supplies. We also found that states and other nonfederal entities have experienced challenges tracking supply requests made through the federal government and budgeting for ongoing needs.
To address these issues, we recommended that the Department of Health and Human Services (HHS)—the lead agency in charge of the federal public health response to the pandemic—in coordination with FEMA:
· further develop and communicate to stakeholders plans outlining specific actions the federal government will take to help mitigate supply chain shortages for the remainder of the pandemic.
Appendix I: Enclosures
Page 202 GAO-21-191
· immediately document roles and responsibilities for supply chain management functions transitioning to HHS, including continued support from other federal partners, to ensure sufficient resources exist to sustain and make the necessary progress in stabilizing the supply chain.
· devise interim solutions, such as systems and guidance and dissemination of best practices, to help states enhance their ability to track the status of supply requests and plan for supply needs for the remainder of the COVID-19 pandemic response.
HHS and the Department of Homeland Security (DHS) disagreed with these recommendations, noting, among other things, the work that they had done to manage the medical supply chain and increase supply availability.
We recognize the efforts of federal agencies in improving the supply chain. However, in light of reported shortages, and our October 2020 nationwide survey of state and territorial public health and emergency management officials described below, we underscore the critical imperative that HHS and FEMA implement our September 2020 recommendations. Taking these actions could help address the ongoing medical supply chain challenges identified in our survey and related work.
We will continue to monitor the implementation of our recommendations and continue our work reviewing the medical supply chain, to include pharmaceuticals, supplies for testing, and the management of the Strategic National Stockpile.
Background
Medical supplies are crucial to preventing, detecting, and treating COVID-19, and will be needed to administer a COVID-19 vaccine when available.
PPE and testing supplies. Typically, the commercial medical supply chain supports the needs of health care providers (such as hospitals and nursing homes), and laboratories—which can be hospital-based, private, public health, or commercial.
However, the demands of the global COVID-19 pandemic overwhelmed the medical supply chain, causing constraints in the availability of PPE supplies like N95 respirator masks, surgical gowns, and gloves; as well as of supplies needed to test patients for COVID-19. (See figures below.) These testing supplies include nasal swabs used to collect viral

Appendix I: Enclosures
Page 203 GAO-21-191
specimens from patients, transport media that keep samples viable for testing, reagents used to process tests, testing instruments, and rapid point-of-care tests. As a result, health care providers and laboratories have had challenges in obtaining timely and complete access to needed supplies through the commercial market.

Appendix I: Enclosures
Page 204 GAO-21-191
Examples of Personal Protective Equipment

Appendix I: Enclosures
Page 205 GAO-21-191
Examples of COVID-19 Testing Supplies
The federal government and the states have taken multiple actions to help ensure supplies are available where they are needed. For example,
According to FEMA officials, if a local entity, such as a nursing home or hospital, has issues acquiring PPE on the commercial market, it can turn to the state, tribe, or territory, which may be able to provide assistance. However, if a state is unable to meet local PPE needs through the purchase of materials from the commercial market or other state-initiated efforts (e.g., donations), it can make a resource request to the federal government.
HHS distributes monthly allocations of certain testing supplies (nasal swabs and transport media) to states based, in part, on each state’s testing plan, utilization of supplies from the prior month, epidemiological indicators, and logistical considerations.269
The federal government has, at times, distributed supplies directly to health care providers. For example, FEMA and HHS’s Office of the Assistant Secretary for Health coordinated the delivery directly to each Medicare- and Medicaid-certified nursing home of a 14-day supply of gloves, surgical masks, gowns, and eye protection from May through
269 HHS does not provide supplies directly to commercial laboratories, which account for about half of all COVID-19 tests performed nationwide.

Appendix I: Enclosures
Page 206 GAO-21-191
August 2020. They later distributed point-of-care testing devices and kits to all nursing homes.
Vaccine administration supplies. The quantity of supplies needed to administer the COVID-19 vaccine to the U.S. population is so large that the federal government has contracted for the production and assembly of vaccine-related supplies into kits that will be distributed along with the vaccine. In its September 2020 COVID-19 Vaccination Program Interim Playbook for Jurisdiction Operations, the Centers for Disease Control and Prevention stated that ancillary supply kits would be distributed along with vaccines that contain needles, syringes, alcohol prep pads, surgical masks, face shields, and vaccination cards.270 The Interim Playbook also noted that these kits will not include other supplies such as sharps containers, gloves, and bandages. In an October 19, 2020, letter to the President, the National Governors’ Association relayed states’ concerns about how the federal government would manage the supply chain for vaccine administration supplies such as needles, syringes, alcohol pads, and bandages.
Overview of Key Issues
Our survey results indicate states and territories—hereafter, states—have experienced challenges in procuring adequate quantities of supplies to meet the needs of local entities within their states and at testing sites.271
The majority of the 47 states that responded to our survey reported that they received and were able to fulfill requests for certain PPE, while other supplies remained constrained. States also expressed concerns about having adequate supplies to administer a future COVID-19 vaccine, and
270 The exact content may vary depending on the specific vaccine. See our enclosure on the Strategic National Stockpile in this report for more information on vaccine supply kits.
271 The results are based on our survey s ent to senior officials in the public health and/or emergency management departments of all 50 states; Washington, D.C.; and the U.S. territories (American Samoa, Guam, Commonwealth of the Northern Mariana Islands, Puerto Rico, and the U.S. Virgin Islands); fielded from October 10 through October 21, 2020. We received responses from 47 of the 56 locations, representing 41 states, Washington, D.C., and all five territories. Not all states responded to each survey question.

Appendix I: Enclosures
Page 207 GAO-21-191
they noted some challenges in tracking and budgeting associated with supplies received from the federal government.272
States are fulfilling PPE requests, but supplies of some PPE remain constrained. The majority of states that responded to our survey received requests for supplies from organizations and entities within their states and were mainly able to fulfill them. However, availability constraints continue with certain PPE, such as nitrile gloves.
Almost all (46 of 47) responding states reported that they had received requests for at least one type of PPE from organizations or entities within their states in the 30 days preceding the survey. The presence of these requests indicates that these organizations remain challenged in their ability to procure adequate quantities of supplies to meet their needs. The most commonly requested supplies were surgical masks (46 states), followed by N95 respirators, nitrile gloves, and face shields and goggles (45 states received requests for each of these supplies).
We found that while many states are receiving requests for PPE, they are able to fulfill those requests, with a few exceptions. For example, 38 states responded that they were able to fulfill requests greatly or completely for non-surgical masks in the previous 30 days. (See figure below.) In contrast, less than half (22 states) responded that they were greatly or completely able to fulfill requests for nitrile gloves, and 11 states reported slightly or not at all fulfilling those requests. In open-ended responses, one of the reasons given for the lack of complete fulfillment was a lack of availability of certain sizes of nitrile gloves—two states noted an inability to obtain extra-large nitrile gloves, for example.
272 FEMA generally reimburses 75 percent of the eligible cost of medical supplies that states purchase under its Public Assistance program and receive through mission assignments. See 44 C.F.R. § 206.47 (2019). Conversely, supplies that states and other recipients receive directly from the Strategic National Stockpile are covered at 100 percent and are not subject to cost sharing.

Appendix I: Enclosures
Page 208 GAO-21-191
Extent that States and Territories Fulfilled Requests for Selected Personal Protective Equipment (PPE)
Note: The results are based on our survey sent to senior off icials in the public health and/or emergency management departments of all 50 states; Washington, D.C., and the U.S. territories (American Samoa, Guam, Commonw ealth of the Northern Mariana Islands, Puerto Rico, and the U.S. Virgin Islands), f ielded from October 10 through October 21, 2020. We received responses from 47 of the 56 locations, representing 41 states, Washington, D.C., and all f ive territories. Not all states responded to each survey question. For this survey question, we asked states to what extent they w ere able to fulf ill requests received for selected PPE types in the 30 days prior to the survey. At least 44 states responded for all PPE types listed above except for surgical gow ns (42) and boot covers (31).
A majority of states reported that they had a 30-day stockpile of six of the seven PPE types in our survey, consistent with what we reported in September 2020. (See figure below.) In addition, in their open-ended responses, more than one-third of the states indicated that they had 30-day stockpiles of additional PPE items; two commonly stockpiled items were coveralls (full-body suits) and bouffant caps (hair coverings).

Appendix I: Enclosures
Page 209 GAO-21-191
Number of States Reporting 30-day Stockpiles of Selected Personal Protective Equipment (PPE)
Note: We sent a survey to senior off icials in the public health and/or emergency management departments of all 50 states; Washington, D.C.; and the U.S. territories (American Samoa, Guam, Commonw ealth of the Northern Mariana Islands, Puerto Rico, and the U.S. Virgin Islands), f ielded from October 10 through October 21, 2020. We received responses from 47 of the 56 locations, representing 41 states, Washington, D.C., and all f ive territories. Not all states responded to each survey question. For this survey question, w e asked states whether they had at least a 30-day supply on hand (stockpiled) of selected PPE. All 47 states responded to this question; the table represents only those states that responded “yes” for each PPE type (other response options w ere no, unsure, or not applicable). States responding that stockpiling w as not applicable w ere as follows: one state each for surgical masks and surgical gow ns; two states for non-surgical masks; and 10 states for boot covers.
More than half the states reported having obtained supplies from either the commercial market or FEMA in the past 30 days, indicating that states could not completely fulfill requests from supplies they had on hand.
Almost all states (44) reported having obtained PPE from the commercial market. Of those 44 states, 17 reported that they were able to greatly or completely obtain supplies to meet their states’ needs; 22 states responded that they were moderately able to do so.
Almost three-quarters of states (34) reported having obtained PPE from FEMA, which indicates challenges in procuring these supplies from the commercial market, as states would only request supplies from FEMA when they were unable to meet their needs through the commercial market. Of those 34 states, 12 reported that they were greatly or completely able to obtain supplies from FEMA to meet their states’ needs; 8 states reported slightly or not at all being able to obtain needed

Appendix I: Enclosures
Page 210 GAO-21-191
supplies. In an open-ended response, one state noted that supplies received from FEMA in the past 30 days were ordered 6 months prior.
The extent to which states expressed confidence in their ability to fulfill PPE requests they may receive over the 60 days following the survey varied among states and by PPE type. (See figure below.) For example, 32 states were greatly or completely confident in their ability to fulfill future requests for face shields and goggles. In contrast, about one-third (17) of states were greatly or completely confident in their ability to fulfill future requests for nitrile gloves; 15 states responded that they were only slightly confident or not at all confident in their ability to fulfill future requests for nitrile gloves.
Extent of States’ Confidence in Ability to Fulfill Future Requests for Selected Personal Protective Equipment (PPE)
Note: We sent a survey to senior off icials in the public health and/or emergency management departments of all 50 states; Washington, D.C.; and the U.S. territories (American Samoa, Guam, Commonw ealth of the Northern Mariana Islands, Puerto Rico, and the U.S. Virgin Islands), f ielded from October 10 through October 21, 2020. We received responses from 47 of the 56 locations, representing 41 states, Washington, D.C., and all f ive territories. Not all states responded to each survey question. For this survey question, w e asked states the extent to w hich they were confident in their ability to fulf ill requests for selected PPE items in the 60 days follow ing the survey. All 47 states responded for all PPE types listed above except for non-surgical masks (46) and boot covers (45).

Appendix I: Enclosures
Page 211 GAO-21-191
Shortages reported for three of five types of testing supplies. In our survey, we asked whether states’ testing sites or laboratories had experienced shortages of five selected testing supplies in the previous 30 days. Most states reported no shortages of swabs or transport media, but one-third to one-half of the 47 states reported shortages in the other three types of testing supplies: reagents (21 states), testing instruments (16 states), and rapid point-of-care tests (24 states). (See figure below.)
State-Reported Supply Shortages for Testing Sites or Laboratories
Note: We sent a survey to senior off icials in the public health and/or emergency management departments of all 50 states; Washington, D.C.; and the U.S. territories (American Samoa, Guam, Commonw ealth of the Northern Mariana Islands, Puerto Rico, and the U.S. Virgin Islands); f ielded from October 10 through October 21, 2020. We received responses from 47 of the 56 locations, representing 41 states; Washington, D.C.; and all f ive territories. Not all states responded to each survey question. For this survey question, w e asked states whether testing sites or laboratories had experienced shortages of selected testing supplies in the 30 days preceding the survey. Forty -six states responded for all testing supply types listed above.
When asked about testing supply availability at testing sites and laboratories for the 60 days following the survey, half the states (22) expected there would be shortages in rapid point-of-care tests, and 20 states expected there would be shortages in reagents. (See figure below.) This is also consistent with our September 2020 report, where we reported that officials in several states we interviewed identified difficulties in acquiring reagents and test kits from the commercial market. In contrast, more than half the states reported that they did not expect to experience shortages in swabs (29 states) or transport media (28 states). (See our related COVID-19 Testing Guidance enclosure.)

Appendix I: Enclosures
Page 212 GAO-21-191
States’ Anticipated Supply Shortages for Testing Sites or Laboratories
Note: We sent a survey to senior off icials in the public health and/or emergency management departments of all 50 states; Washington, D.C.; and the U.S. territories (American Samoa, Guam, Commonw ealth of the Northern Mariana Islands, Puerto Rico, and the U.S. Virgin Islands); f ielded from October 10 through October 21, 2020. We received responses from 47 of the 56 locations, representing 41 states; Washington, D.C.; and all f ive territories. Not all states responded to each survey question. For this survey question, w e asked states whether they anticipated that testing sites or laboratories w ould experience shortages of selected testing supplies in the 60 days follow ing the survey. Forty-six states responded for all testing supply types listed above except for transport media (45).
Planning for future COVID-19 vaccine supply needs. States responding to our survey expressed concerns about having adequate supplies to distribute and administer a future COVID-19 vaccine. In our survey:
About one-third of the states (17 of 47) responded that they were greatly or completely concerned about having sufficient vaccine-related supplies to administer COVID-19 vaccines in their state or territory. An additional 21 states were moderately concerned.
In their open-ended responses, senior officials from six states stated they were specifically concerned about the federal government’s ability to supply needles given reports of shortages; three of those states also reported challenges maintaining supplies of needles for their state’s flu vaccination efforts.
Working with the federal government to meet supply needs. We reported in September 2020 that state and other nonfederal partners experienced three types of challenges in working with the federal government to meet supply needs: (1) knowing which federal supplies would arrive and when; (2) confirming the right entities received correct and usable supplies when

Appendix I: Enclosures
Page 213 GAO-21-191
federal programs delivered them directly to local organizations or entities; and (3) determining how to plan and budget for future supply needs, in part due to uncertainty about which programs provided which supplies.
Our survey results indicate that while most states did not report challenges in knowing which supplies would arrive and when, many states reported experiencing other types of challenges.
Most states (41 of 47) responded that they had a slight or no challenge in knowing which supplies would arrive and when.
A majority of states (26) reported experiencing a moderate to great challenge in tracking supplies that were delivered directly to local points of care.
About half the states (23) responded that budgeting for future supply needs was greatly or completely challenging, and an additional 17 reported a moderate challenge.
One-quarter of the states (12) responded that it was either a great or complete challenge to gain clarity on the state’s share of the cost for supplies already requested and delivered; an additional 15 states reported this was a moderate challenge.
Agency Comments
We provided HHS, DHS, and the Office of Management and Budget (OMB) with a draft of this enclosure. HHS, in its comments, repeated its disagreement with our September 2020 recommendations and noted its efforts to meet the needs of states. Our report acknowledges those efforts, but we continue to maintain that our recommendations are warranted.
In its comments, HHS incorrectly stated that our survey results showed that few states had experienced or anticipated shortages in medical or testing supplies. Rather, our survey results show that fewer than half the states (22 of the 45 that received requests) reported being able to completely fulfill supply requests for nitrile gloves. Similarly, 21 states reported shortages in the availability of reagents needed to process COVID-19 tests in the 30 days preceding our survey. About one-third of the states also remained concerned about having adequate supplies available to administer a COVID-19 vaccine.
Appendix I: Enclosures
Page 214 GAO-21-191
HHS also reiterated its request for the names of states with reported shortages and identifying information for senior state officials with whom we spoke. As we stated in our September report, our findings and recommendations are not that HHS should follow up to adjudicate individual issues that have already occurred. Rather, our findings from our nationwide survey of state public health and emergency management offices could help inform the department’s supply efforts moving forward by providing a snapshot of states’ needs and concerns. Further, the intent of the recommendations is that HHS and FEMA, as leads for this pandemic response, seek to better understand the problems we continue to identify and devise solutions to help ensure the federal government can mitigate remaining medical supply gaps and assist states, tribes, and territories in serving their citizens effectively.
DHS provided technical comments, which we incorporated as appropriate. OMB did not provide comments on this enclosure.
GAO’s Methodology
To conduct this work, we designed and fielded a survey to senior state and territorial public health and/or emergency management officials in the 50 states; Washington, D.C.; and the U.S. territories (American Samoa, Guam, Commonwealth of the Northern Mariana Islands, Puerto Rico, and the U.S. Virgin Islands). We asked senior state officials to respond to each question from the perspective of their state or territory as a whole; however, we did not independently verify whether senior officials sought input from other state offices when completing the survey. The survey contained questions designed to obtain senior state officials’ perspectives on the availability of PPE, testing, and vaccine administration supplies. We asked about supply availability within the 30 days preceding the survey, as well as projected availability over the 60 days following the survey. The survey also contained questions designed to obtain senior state officials’ perspectives on working with the federal government to meet supply needs.
We fielded this survey from October 10, 2020 through October 21, 2020. We pretested a draft of the survey with state officials in two states—a public health official in one state and an emergency management official in another—to help ensure that the questions were understandable and answerable. We received survey responses from 41 states, Washington,

Appendix I: Enclosures
Page 215 GAO-21-191
D.C., and all five territories—47 responses total.273 We assessed data reliability by checking for missing values and survey response errors. We followed up with state officials on survey responses as appropriate. After completing these checks, we determined that the final survey data were sufficiently reliable for the purpose of obtaining states’ perspectives on medical supply availability.
Contact information: Mary Denigan-Macauley, 202-512-7114; [email protected]
COVID19 Cyber Response
The Department of Health and Human Services has increased collaboration and coordination to respond to cyber threats that attempted to exploit COVID-19 to target health care organizations. In addition, the department has made progress in implementing our prior recommendations regarding cybersecurity weaknesses at its component agencies. However, several recommendations remain unimplemented.
Entities involved: Department of Health and Human Services; Cybersecurity and Infrastructure Security Agency, within the Department of Homeland Security; and Federal Bureau of Investigation, within the Department of Justice
Key Considerations and Future GAO Work
We are currently reviewing the Department of Health and Human Services’ (HHS) roles and responsibilities for assisting with cybersecurity in the health care and public health critical infrastructure sector. This review includes an evaluation of the department’s efforts to collaborate and coordinate as part of its response to COVID-19-related cyberattacks. In addition, we are monitoring the department’s efforts to expedite implementation of our prior cybersecurity-related recommendations at its component agencies. Since we last reported in September 2020, the component agencies—Centers for Medicare & Medicaid Services, Food and Drug Administration (FDA), and Centers for Disease Control and Prevention—implemented an additional 54 cybersecurity recommendations. This brings the total number of implemented
273 We did not receive responses from the following states: California, Colorado, Delaware, Florida, Massachusetts, Mississippi, Nebraska, Nevada, and New Mexico.

Appendix I: Enclosures
Page 216 GAO-21-191
recommendations to 404 of 434, which reflects a 12 percent increase of corrective actions taken to bolster cybersecurity at the component agencies.274
Background
National emergencies, such as the current COVID-19 public health emergency, call for coordinated efforts to strengthen and maintain secure, functioning, and resilient critical infrastructure, as is set out in Presidential Policy Directive 21.275 In this regard, the directive requires sector-specific agencies to work with critical infrastructure owners and operators and other sector partners to manage risk and strengthen the security and resilience of the nation’s critical infrastructure.276 According to the directive, these efforts should consider all hazards, including cybersecurity threats, and are intended to identify and disrupt threats and hasten response and recovery, among other things. Presidential Policy Directive 21 designated HHS as the sector-specific agency for health care and public health. In this role, HHS is responsible for collaborating with sector partners and coordinating activities to strengthen cybersecurity in the sector.
Overview of Key Issues
Given the increase in cyberattacks against health care organizations since March 2020, HHS increased its collaboration efforts and coordination with other federal agencies to respond to cyber threats that attempted to leverage the COVID-19 pandemic to target those organizations.277 The department leads, or co-leads, several collaborative 274 For two of the recommendations to FDA, the agency previously issued a waiver for one and accepted the risk for the other; as a result, the recommendations were not implemented.
275 Critical infrastructure includes assets, networks, and systems that are vital to the nation’s safety, prosperity, and well-being. Presidential Policy Directive 21 on critical infrastructure security and resilience identifies health care and public health as one of 16 critical infrastructure sectors.
276 Sector-specific agencies are federal agencies with institutional knowledge and specialized expertise about a particular sector and have been designated to have a lead role in critical infrastructure protection efforts for that sector.
277 As we previously reported in September 2020, malicious cyber actors have used, for example, phishing attacks referencing COVID-19 as a means to obtain patient information, intellectual property, public health data, and intelligence from health care organizations, such as pharmacies, academic institutions, and medical research organizations.

Appendix I: Enclosures
Page 217 GAO-21-191
efforts intended to strengthen cybersecurity in the health care and public health sector. Since March 2020, the department increased collaborative efforts to address cybersecurity concerns associated with COVID-19, as described in the table below.
Department of Health and Human Services’ (HHS) Collaborative Efforts to Respond to Increased Cyberattacks Associated with COVID-19 since March 2020
HHS-led collaborative group Description Collaborative effort HHS Chief Information Security Officer Council
A collaborative effort led by the HHS Chief Information Security Officer that facilitates the sharing of information among the chief information security officers across the department.
During the council’s April and May 2020 meetings, participants received a demonstration of the HHS Protect system;a information on the Department of Homeland Security’s cybersecurity support (i.e., staffing and funding) to the department in light of COVID-19; and notification of the release of best practices for using Zoomb and video conferencing.
HHS Cybersecurity Working Group A forum of HHS staff divisions and component agencies led by the Office of the Assistant Secretary for Preparedness and Response (ASPR) that facilitates discussions and coordination of cybersecurity issues in the health care sector.
The working group has met monthly—with the exception of May 2020—to discuss and coordinate efforts focused on health care sector cybersecurity. For example, during the April 2020 meeting, the Food and Drug Administration (FDA) provided updates on its efforts to engage with the sector’s industry partners for medical device security.
Government Coordinating Council’s Cybersecurity Working Group
An ASPR-led group of federal, state, local, tribal, and territorial health care partners. It coordinates to enhance critical infrastructure resiliency and to reduce cyber risks across the public landscape of the health care sector.
The working group collaborated to establish a Telehealth Task Group to address cybersecurity risks to the telehealth industry. The task group, which was formally established on August 26, 2020, has met biweekly to discuss ongoing telehealth-related activities, such as those led by HHS’s component agencies.
Joint Healthcare and Public Health Sector Cyber Working Group
The working group is co-led by ASPR, the HHS Office of the Chief Information Officer, and FDA, along with industry partners. It is a forum of government and industry partners that facilitates discussion of issues and development of resources to enhance cybersecurity among health care sector stakeholders.
The working group has collaborated to discuss establishment of the Telehealth Task Group described above. The working group also collaborated to develop and distribute guidance on managing cybersecurity risks while teleworking.
Healthcare Threat Operations Center A collaborative effort between the federal health care partners—HHS, the Department of Veterans Affairs, and the Defense Health Agency—that is intended to improve the computer security and incident response capabilities of those agencies.
The federal health care partners have shared cybersecurity threat information among each other through the ThreatConnect secure portal.c For example, HHS shared information regarding a phishing campaign that attempted to trick users into thinking that HHS had sent them a legitimate email requesting face masks and forehead thermometers that were listed in a malicious email attachment.

Appendix I: Enclosures
Page 218 GAO-21-191
Source: GAO analysis of HHS documentation. | GAO-21-191 aHHS Protect is intended to serve as a secure data ecosystem for collecting, sharing, and analyzing near-real-time COVID-19 data. bAccording to its w ebsite, Zoom is a cloud platform for video and voice conferencing, content sharing, and chatting that w orks across several devices, including mobile devices, desktop computers, and telephones. cThreatConnect is a secure portal that allow s users to share information related to cyber alerts, cyber w arnings, and cyber threat intelligence.
In addition to the increased collaboration efforts, HHS expanded cybersecurity coordination with the Department of Homeland Security’s (DHS) Cybersecurity and Infrastructure Security Agency (CISA) and the Federal Bureau of Investigation (FBI) to address cyber threats associated with COVID-19, as described below.
According to officials in the HHS Office of the Chief Information Officer (OCIO) and the Office of the Assistant Secretary for Preparedness and Response (ASPR), ASPR coordinated meetings with CISA and FBI to identify and notify critical organizations and organizations with critical assets that need extra protection during the nation’s response to COVID-19. The HHS officials informed us that these efforts began in March 2020 and are still ongoing.
Between March and July 2020, HHS’s Health Sector Cybersecurity Coordination Center (HC3) routinely provided information on cybersecurity threats, vulnerabilities, and incidents to CISA.278 According to officials at CISA, the agency disseminated the information provided by HC3 more broadly to federal, state, and local partners; private industries; critical infrastructure partners; and international partners through various information-sharing platforms.
ASPR, HC3, CISA, and FBI meet weekly as part of the Cyber Watch Project, which is intended to execute and coordinate government-wide cyber engagements in support of health care sector entities that are developing and testing COVID-19 therapeutics and vaccines. They jointly develop and prioritize a list of sector entities involved in developing therapeutics and vaccinations. After the prioritized list is developed, they offer cybersecurity support through engagements intended to ensure that the identified entities are not impacted or interrupted by cyber threats.
278 HC3 is a component of HHS’s Office of the Chief Information Officer. HC3 is intended to support the defense of the health care and public health sector’s information technology infrastructure by providing technical analysis and information sharing within the sector.

Appendix I: Enclosures
Page 219 GAO-21-191
According to HHS OCIO and ASPR officials, these efforts began in March 2020 and are still ongoing.
Between April and July 2020, ASPR held joint weekly webinars with DHS and the InfraGard National Capital Region that focused on physical security and cybersecurity during COVID-19.279
Agency Comments
We provided HHS and the Office of Management and Budget (OMB) a draft of this enclosure for review and comment. HHS and OMB did not provide any comments on this enclosure.
GAO’s Methodology
To conduct this work, we reviewed the most recent charters and concept of operations describing the collaborative groups led by HHS to strengthen cybersecurity in the health care and public health critical infrastructure sector. We also obtained documentation demonstrating recent efforts of those groups to collaborate and coordinate with other entities on cybersecurity issues related to COVID-19. In addition, we interviewed officials from HHS OCIO, ASPR, and CISA to obtain information and documentation on their efforts to collaborate and coordinate in response to the increased cyberattacks associated with COVID-19. To update the status of the recommendations made to the HHS component agencies, we assessed the effectiveness of corrective actions taken by these agencies to resolve the cybersecurity weaknesses identified in our prior reports.
Contact information: Jennifer R. Franks, (404) 679-1831, [email protected]
Nutrition Assistance
The Department of Agriculture has disbursed most of the additional funding provided for federal nutrition assistance programs during the pandemic to respond to increased demand, and recent legislative
279 The InfraGard program is a public/private cooperative effort dedicated to improving national security. The Infragard National Capital Region consists of professionals intending to create a more res ilient critical infrastructure in the Washington, D.C., metro area.

Appendix I: Enclosures
Page 220 GAO-21-191
changes may help address challenges states faced implementing the programs earlier in the pandemic.
Entity involved: Food and Nutrition Service, within the Department of Agriculture
Key Considerations and Future GAO Work
In June 2020, we reported that states and local governments faced challenges operating federal nutrition assistance programs during the pandemic and that some vulnerable populations may not have access to assistance. We will continue to monitor challenges states and local agencies face in implementing federal nutrition assistance programs during the COVID-19 pandemic, as well as their use of program flexibilities authorized in relief laws. We will also continue to monitor the Food and Nutrition Service’s (FNS) use of COVID-19 relief funds and the agency’s efforts to help states collect and report accurate and reliable participation data.
Background
The COVID-19 pandemic has threatened to reverse recent gains in low-income households’ access to food, and has increased demand for federal nutrition assistance programs. The largest of these programs—the Supplemental Nutrition Assistance Program (SNAP)—served more than 35 million individuals per month on average in fiscal year 2019. In September 2020, the Department of Agriculture (USDA) estimated that one in 10 U.S. households were food insecure in 2019—meaning they lacked consistent access to food—continuing a downward trend for several years.280 USDA does not yet have estimates on the extent of the increased need for assistance due to the pandemic’s effect on issues such as employment and food costs.
FNS, within USDA, administers SNAP and other federal nutrition assistance programs, including the Special Supplemental Nutrition Program for Women, Infants, and Children (WIC) and the Emergency Food Assistance Program (TEFAP) (see table). Eligibility criteria vary
280 Alisha Coleman-Jensen, Matthew P. Rabbitt, Christian A. Gregory, and Anita Singh, Household Food Security in the United States in 2019, ERR -275 (Department of Agriculture, Economic Research Service, 2020). The prevalence of food insecurity peaked at about 15 percent in 2011 following the Great Recession, and 2019 marked the first time the national food insecurity rate dipped back below the 2007 pre -recession level.

Appendix I: Enclosures
Page 221 GAO-21-191
across FNS’s nutrition assistance programs, and individuals and households may receive assistance from multiple programs.
FNS also administers the Pandemic Electronic Benefits Transfer (Pandemic EBT) program—a new program authorized under the Families First Coronavirus Response Act (FFCRA) to provide benefits to households with children who would have received free or reduced-price school meals if not for school closures due to COVID-19.281 All states are operating the program.282 Pandemic EBT was set to expire at the end of fiscal year 2020, but on October 1, 2020, the Continuing Appropriations Act, 2021 and Other Extensions Act (Continuing Appropriations Act) extended the program through fiscal year 2021 and expanded it to include younger children affected by day care closures, among other provisions.283
281 See Pub. L. No. 116-127, § 1101, 134 Stat. 178, 179 (2020).
282 For reporting purposes in this enclosure, we refer to the District of Columbia as a state.
283 See Pub. L. No. 116-159, § 4601, 134 Stat. 709, 744.

Appendix I: Enclosures
Page 222 GAO-21-191
Key Information on Federal Nutrition Assistance Programs during the COVID-19 Pandemic
Program Description FY 2020 appropriation ($) Total COVID-19 funding ($)
COVID-19 expenditures as of September 30, 2020
SNAP Provides low-income individuals and households with benefits to purchase allowed food items and achieve a more nutritious diet.
56.2 billiona 15.5 billion FNS has disbursed all $15.5 billion.
WIC Provides eligible low-income women, infants, and children up to age 5 who are at nutrition risk with nutritious foods to supplement diets, information on healthy eating, and referrals to health care.
6 billion 500 million FNS has not needed to use any of the additional WIC funding and plans to disburse the funds in fiscal year 2021.
TEFAP Provides groceries to low-income individuals through food banks.
401.9 million 850 million FNS has disbursed $257.4 million.
Pandemic EBT Provides benefits to purchase food to households with children who would have received free or reduced-price school meals if not for school closures due to COVID-19.
Indefinite appropriation of necessary amounts
12.8 billionb FNS has disbursed $8.4 billion.
Source: GAO analysis of relevant provisions of the Families First Coronavirus Response Act and the CARES Act; information from the Department of Agriculture’s Food and Nutrition Service; and the Further Consolidated Appropriations Act, 2020, and the Joint Explanatory Statement accompanying the Further Consolidated Appropriations Act, 2020 (fiscal year 2020 appropriations). | GAO-21-191
Notes: COVID-19 = Coronavirus Disease 2019, Pandemic EBT = Pandemic Electronic Benefits Transfer, SNAP = the Supplemental Nutrition Assistance Program, TEFAP = the Emergency Food Assistance Program, and WIC = the Special Supplemental Nutrition Program for Women, Infants, and Children. aThis amount is the f iscal year 2020 appropriation for SNAP benefits only. SNAP also receives funding for administrative costs, employment and training activities, and other purposes. bThis amount is the apportionment for Pandemic EBT as of September 30, 2020. This amount w ill increase as states implement Pandemic EBT in f iscal year 2021.
Overview of Key Issues
Spending for federal nutrition assistance programs increased during the pandemic, but data reliability issues have kept USDA from reporting data on participation increases.
SNAP. In fiscal year 2020, FNS provided approximately $75 billion in SNAP benefits—nearly matching the historic high for the program,

Appendix I: Enclosures
Page 223 GAO-21-191
according to FNS data.284 This amount includes the entire fiscal year 2020 appropriation for benefits, the $15.5 billion provided for SNAP in the CARES Act, and approximately $4 billion in SNAP reserves, according to FNS data.285 Increases reflect both increases in participation and emergency increases in the amount of certain households’ benefits. Through October 2020, nearly all states were continuing to issue emergency allotments authorized in FFCRA, which increased some households’ monthly SNAP benefits.286 FNS estimated that emergency allotments increased SNAP expenditures by about $2 billion per month in fiscal year 2020.
Though increases in SNAP expenditures reflect, in part, increases in participation, FNS does not currently have reliable data on SNAP participation during the pandemic. In August 2020, FNS announced it had identified significant issues with the accuracy of state-reported data, and that FNS would not release updated program data until it could resolve the issues. Specifically, FNS noted that SNAP participation data beginning in April 2020 might erroneously include Pandemic EBT participants, leading to larger-than-actual estimates for SNAP participation. Consequently, SNAP data for March 2020 are the most recent available that were not subject to these data quality issues. The March 2020 data do not yet reflect increases in SNAP participation during the pandemic, nor do they account for any additional changes in eligibility
284 In nominal terms, SNAP expenditures peaked in fiscal year 2013 , when benefits totaled $76.1 billion, according to FNS data. SNAP expenditures had declined since then, with benefits totaling $55.6 billion in fiscal year 2019.
285 FNS receives $3 billion each fiscal year for a SNAP contingency reserve that is available for multiple years in the case of an emergency or a lapse in appropriations, according to FNS officials. FNS began fiscal year 2020 with $9 billion in this reserve and needed to use approximately $4 billion of it to cover SNAP program costs for that year.
286 Some territories have also issued emergency allotments to eligible SNAP households. In June 2020, we reported that FNS denied several states’ requests to provide SNAP emergency allotments to households already receiving the maximum benefit, which accounted for about 37 percent of SNAP households in fiscal year 2018, the most recent data available. FNS officials told us that issuing emergency allotments to households already receiving the maximum benefit was prohibited based on provisions in the Food and Nutrition Act of 2008 as well as FFCRA. Since then, we have become aware of litigation in federal district courts challenging USDA’s interpretation and implementation of the emergency allotments. See Gilliam v. U.S. Dep’t. of Agric., No. 2:20-CV-03504 (E.D. Pa. filed July 16, 2020); Hall v. U.S. Dep’t. of Agric., No. 4:20-CV-03454 (N.D. Cal. filed May 21, 2020).

Appendix I: Enclosures
Page 224 GAO-21-191
or demand for SNAP after the Federal Pandemic Unemployment Compensation program expired in July 2020.287
FNS officials said the agency is actively working to address SNAP data quality issues, including reiterating reporting guidance to states and changing how FNS’s data systems generate reports. While FNS worked to identify the root cause of the issues, it opted not to release participation data for SNAP or any other federal nutrition assistance programs for May 2020. FNS officials said they expect that states were able to report reliable data for June and July 2020, but as of mid-November 2020, FNS had not released any data beyond April 2020.
WIC. The April 2020 data show that WIC participation remained steady early in the pandemic—approximately 6.3 million individuals received WIC benefits that month, a slight increase from March 2020, but a slight decrease compared to April 2019.288 FNS officials said the agency had sufficient WIC funding available from the regular fiscal year 2020 appropriation to support states and continue to provide benefits and services to WIC participants throughout fiscal year 2020. FNS had not disbursed any of the $500 million provided for WIC in FFCRA, as of September 30, 2020, according to FNS data. The funds are available through fiscal year 2021, and FNS officials said the agency plans to disburse the funds during that fiscal year.
TEFAP. States do not report data to FNS on the number of individuals or households served through TEFAP, and therefore nationwide data on TEFAP participation are not available. However, TEFAP expenditures reflect the increased need for assistance due to the COVID-19
287 The Federal Pandemic Unemployment Compensation program generally authorized an additional $600 benefit that augmented weekly unemployment insurance benefits through July 2020. Unemployment insurance is treated as income for purposes of SNAP eligibility. Claimants who were no longer receiving unemployment insurance after the Federal Pandemic Unemployment Compensation program expired may have turned to SNAP for assistance.
288 WIC participation varies considerably by state. For example, North Carolina experienced an 8 percent increase in WIC participation from March to April 2020, while Arkansas experienced a 5 percent decrease during that period, according to FNS data. Representatives from the National WIC Association noted several factors that could cause state-level variation in participation, including whether the state has technology to issue benefits on an EBT card, and whether that technology allows for remote benefit issuance. In states without this technology, participants must go in -person to receive WIC benefits, a potential barrier to participation during the public health emergency.

Appendix I: Enclosures
Page 225 GAO-21-191
pandemic.289 As of September 30, 2020, FNS had disbursed $257.4 million of the $850 million appropriated for TEFAP by FFCRA and the CARES Act. The funds are also available through fiscal year 2021.
Challenges to implementing federal nutrition assistance programs during the COVID-19 pandemic. The COVID-19 relief laws provided flexibilities for operating some federal nutrition assistance programs during the pandemic. FNS also provided guidance on how states could adjust operations consistent with existing program regulations. These adjustments helped states administer the programs during the pandemic, such as by operating the program remotely to minimize exposure to COVID-19 for state employees and program participants, according to FNS and state officials. However, states also identified several challenges to implementing these programs during the pandemic, including with FNS’s approach to reviewing states’ requests for various flexibilities and the timing of FNS’s decisions.
SNAP. FFCRA allowed states to request from FNS various adjustments to federal requirements for SNAP related to how states issue benefits, review applications, and report data during the pandemic. In several cases, FNS required states to apply for extensions of certain adjustments each month, rather than extending adjustments for multiple months. FNS used a month-to-month approach to minimize program integrity issues, discourage states from using long-term adjustments, and encourage states to return to normal operations as soon as possible, according to officials.
FNS had instructed states to prepare for a “new normal” for SNAP operations in September 2020. Specifically, FNS notified states via email and letters that extensions of SNAP adjustments would be extremely limited and based on the individual circumstances in a given state, such as substantial increases in new applications or sizable increases in case backlogs. FNS’s website did not include information on the criteria or thresholds FNS used to determine if state data warranted extensions of SNAP adjustments. When we requested this information, FNS provided two emails sent to FNS regional offices in August 2020 outlining the criteria states needed to meet in order to adjust certain eligibility
289 For more information on the experiences of emergency feeding organizations during the COVID-19 pandemic, including the federal programs available to them, see Congressional Research Service, Food Banks and Other Emergency Feeding Organizations: Federal Aid and the Response to COVID-19, R46432 (Washington, D.C.: June 25, 2020).
Appendix I: Enclosures
Page 226 GAO-21-191
verification and interview requirements. For example, according to the emails, states could demonstrate a need for these adjustments if they had experienced a 50 percent increase in new SNAP applications in the previous 3 months compared to the same months in the prior year.
Representatives we interviewed from several national research and advocacy organizations noted that FNS’s month-to-month approach to reviewing and extending SNAP adjustments caused uncertainty for states and made implementing the program difficult. For example, they explained that in some cases FNS decided late in the preceding month to approve or deny a state’s request to extend an adjustment for the subsequent month (e.g., informing states of decisions for July 2020 in late June 2020). They explained that such adjustments included those related to interviewing new SNAP applicants or assessing participants’ continued eligibility. States had to plan for SNAP operations without knowing whether FNS would approve their extension request each time, according to these representatives. We asked FNS to provide its rationale for waiting until the end of the month to approve or deny certain state requests for SNAP adjustments. FNS officials said they issued decisions as soon as they were ready.
In a September 2020 letter to FNS, attorneys general from 22 states echoed many of these challenges, including that requesting extensions each month was time-consuming. They added that FNS had not provided clear public guidance on how much or what kind of data states would need to provide to obtain SNAP adjustments in fall 2020.290
Provisions in the Continuing Appropriations Act may help address the challenges states faced working with FNS to implement SNAP during the pandemic. The Continuing Appropriations Act granted states broader authority to adjust SNAP operations into fiscal year 2021 without obtaining prior approval from FNS. For example, states can adjust deadlines for interviewing SNAP applicants and assessing participants’ continued eligibility based on the needs of their state.291
WIC. In contrast to SNAP, FNS generally provided states with longer-term waivers for WIC operations during the pandemic, but in some cases
290 Karl A. Racine, Attorney General, Government of the District of Columbia, Letter to Secretary of Agriculture George E. Perdue and Administrator of the Food and Nutrition Service Pamilyn Miller in Conjunction with 21 States, September 1 7, 2020.
291 Pub. L. No. 116-159, § 4603, 134 Stat. 709, 745 (2020).

Appendix I: Enclosures
Page 227 GAO-21-191
issued extensions only days before waivers were set to expire, leading to some uncertainty among states. Specifically, on June 29, 2020, FNS extended WIC waivers through the end of fiscal year 2020; the waivers were set to expire on June 30, 2020. On September 21, 2020, FNS further extended certain WIC waivers until 30 days after the COVID-19 public health emergency ends; the waivers were set to expire on September 30, 2020. We asked FNS to provide its rationale for waiting to extend WIC waivers until a few days before expiration. FNS officials said they had heard from state partners about the continued need for WIC waivers and accommodated states’ requests to ensure there were no gaps in service. The Continuing Appropriations Act extended USDA’s authority to grant certain WIC waivers through fiscal year 2021.292 FNS officials said they would continue to support states as they provide services to WIC participants and work toward a safe and timely transition back to in-person appointments and regular documentation.
WIC waivers allowed individuals to apply for WIC without being physically present in a WIC office and allowed states to issue benefits remotely, among other things. Representatives from the National WIC Association said the timing of FNS’s decisions about extensions to WIC waivers caused uncertainty among states about program operations, such as when local WIC offices would need to return to in-person services. Because FNS extended WIC waivers until after the public health emergency ends, states now have greater clarity on waivers available for WIC at the beginning of fiscal year 2021.
TEFAP. FFCRA and the CARES Act did not provide states with additional authority to adjust TEFAP operations during the pandemic, though states could revise their TEFAP distribution plans consistent with current program regulations. FNS officials said the agency approved the majority of TEFAP distribution plan revisions that states have submitted during the pandemic. They said that common revisions included accommodations for social distancing, removing signature requirements, simplifying income eligibility requirements, and changing state policy on using a proxy system for TEFAP distributions to allow another individual to pick up food for an eligible household.
In addition, organizations we interviewed identified several challenges to implementing TEFAP during the pandemic. For example, representatives from the American Commodities Distribution Association and Feeding
292 Pub. L. No. 116-159, § 4602(b), (c), 134 Stat. 709, 745.

Appendix I: Enclosures
Page 228 GAO-21-191
America—members of these organizations distribute food for TEFAP and other FNS programs—said it was difficult for food banks to collect household information at TEFAP distribution sites due to social distancing protocols.293 These representatives said that FNS has also canceled multiple TEFAP food orders during the pandemic—such as orders for canned meats, soups, and vegetables—which has left food banks without the commodities they expected to distribute to participants. For example, representatives from one organization noted that food banks are having a particularly difficult time weathering order cancelations at a time when they are receiving less in food donations and have fewer state agency staff available to process orders.
FNS officials and representatives from these organizations explained several factors that contributed to canceled TEFAP orders during the pandemic, including that no vendors bid on a given order, the food was unavailable due to supply chain issues, and increased costs for transportation and raw materials. According to FNS data, the magnitude of canceled TEFAP orders in terms of both estimated value and total truckloads was similar from March to September 2020 compared to the same months in 2019.
Agency Comments
We provided a draft of this enclosure to FNS and the Office of Management and Budget (OMB) for review and comment. FNS provided technical comments, which we incorporated as appropriate. OMB did not provide comments.
GAO’s Methodology
To conduct our work, we reviewed the most recent FNS data on participation as of mid-November 2020 and expenditures as of September 30, 2020. With the exception of SNAP and Pandemic EBT participation data after March 2020, we determined these data were sufficiently reliable for the purposes of reporting on levels of participation in the programs and related expenditures during the pandemic. We also 293 Food banks and other sites distributing TEFAP foods must collect addresses at the time of a household’s application to receive TEFAP foods for home consumption. FNS noted that these sites can collect household information by text messaging or in drop boxes. FNS also clarified that it is not necessary to re -collect addresses at future distributions and provided states with guidance on distributing TEFAP while adhering to social distancing, such as by placing food directly into participants’ vehicles at drive -up distributions.

Appendix I: Enclosures
Page 229 GAO-21-191
reviewed relevant federal laws, regulations, agency guidance and documents, and FNS’s written responses to our questions. Additionally, we interviewed officials from the American Public Human Services Association; the National WIC Association; the American Commodities Distribution Association; and several national research and advocacy organizations, including the American Enterprise Institute, the Center on Budget and Policy Priorities, Feeding America, the Food Research and Action Center, and No Kid Hungry. While not representative, information gathered from these interviews provides examples of challenges states faced implementing nutrition assistance programs during the COVID-19 pandemic.
Contact information: Kathryn A. Larin, (202) 512-7215 or [email protected]
Child Welfare
Child welfare agencies face challenges ensuring the well-being of children impacted by the COVID-19 pandemic, and to assist them, the Administration for Children and Families has distributed CARES Act funds; provided guidance and flexibilities, such as on conducting virtual visits with foster families; and facilitated information sharing.
Entity involved: The Administration for Children and Families, within the Department of Health and Human Services
Key Considerations and Future GAO Work
Physical distancing measures to prevent the spread of COVID-19 and the pandemic’s effects on the economy have disrupted operations for state and local child welfare agencies. We plan to continue work to understand how these agencies have responded to needs stemming from the pandemic and what lessons can be learned to help them better respond to such events in the future.
Background
Though states are primarily responsible for administering their child welfare programs, the Department of Health and Human Services’ (HHS) Administration for Children and Families (ACF) distributes and oversees federal funding that states can use for these programs. One of the primary sources of federal funding authorized for child welfare services is
Appendix I: Enclosures
Page 230 GAO-21-191
Title IV-B of the Social Security Act.294 In fiscal year 2020, approximately $268.7 million was provided to states under Title IV-B subpart I, and the CARES Act appropriated an additional $45 million for child welfare services as authorized under Title IV-B subpart 1 to be used to prevent, prepare for, and respond to COVID-19.295,296
State child welfare programs provide a continuum of services intended to prevent the abuse or neglect of children; ensure they have safe, permanent homes; and promote the well-being of families.297 For example, state and local child welfare agencies receive and investigate reports of child abuse and neglect, and assess child and family needs. For children who are removed from their homes, child welfare caseworkers must visit them in foster or relative homes or in other living arrangements to ensure their health, education, and other needs are met.
Caseworkers also facilitate visits between children in foster care and their biological parents and siblings. For children exiting foster care, caseworkers may coordinate family reunifications, adoptions, and legal guardianships, or provide transitional supports such as housing and job search services for children who age out of care. State juvenile or family courts are also involved in decisions regarding a child’s removal, placement, and services.
294 Title IV-B of the Social Security Act is codified at 42 U.S.C. §§ 620-629m. Title IV-B funds can be used to accomplish the following purposes: (1) protect and promote the welfare of all children; (2) prevent the abuse, neglect, and exploitation of children; (3) support at-risk families through family preservation and unification services; (4) promote the safety, permanence, and well-being of children in foster care and adoptive families; and (5) provide training, professional development, and support to ensure a well -qualified child welfare workforce.
295 Pub. L. No. 116-136, div. B, tit. VIII, 34 Stat. 281, 558.
296 Though we focused on child welfare services under Title IV-B subpart 1 for the purposes of this enclosure, funding under Title IV-E of the Social Security Act can be used by states to help cover the costs of operating their foster care, adoption, and guardianship assistance programs. 42 U.S.C. §§ 670-679c. Title IV-E funds appropriated specifically for foster care programs totaled nearly $5.3 billion in fiscal year 2020.
297 State child welfare agencies investigated or assessed over 2.4 million repor ts of child abuse and neglect in 2018, the most recent year of data that are available. In fiscal year 2019, nearly 424,000 children were in foster care and about 249,000 exited, most commonly through reunifications with their parents or primary caretakers (47 percent), adoptions (26 percent), guardianships (11 percent), and aging out (8 percent).
Appendix I: Enclosures
Page 231 GAO-21-191
Overview of Key Issues
Disruptions due to the COVID-19 pandemic have raised a number of concerns about the well-being of children and families and the continuity of child welfare services. Representatives from eight national organizations that conduct child welfare advocacy, training, and research described these concerns, including:
· Declines in child abuse reports. Representatives from five of the eight national organizations we interviewed raised concerns about declines in child abuse reports, particularly as some noted that families may be experiencing increased stress and hardship during this time and children have less frequent contact with mandatory reporters, such as school and medical personnel. Though nationwide data are unavailable, one national research organization reported that in March 2020, some states noted a decline of between 20 and 70 percent in the number of child abuse reports.298 Representatives from three national organizations said that while reporting declines are concerning, little is known about the extent to which abuse is occurring. One representative told us that studies are under way to understand the implications of reporting declines.
· Court delays in child welfare decisions. Representatives from five national organizations discussed how court closures and limited schedules, particularly at the beginning of the pandemic, delayed decisions in child welfare cases. They said delays can affect when children are able to see their biological parents, and how soon children can return home or be adopted.
· Financial and housing instability for youth aging out of foster care. Representatives from four of the eight national organizations we spoke with described how the pandemic has exacerbated challenges for youth aging out of foster care. For example, one representative said the pandemic’s economic impact has left youth out of work. Another representative said the closure of college campuses may result in youth losing their housing. One representative noted that aging out of foster care is already difficult for youth, even without a pandemic, because they may lose the supports they received in foster care and may not have a network to rely on.
298 These data were gathered from media reports, and we did not assess their reliability or consistency among states. We plan to further examine data on child abus e reports as part of our continuing work.

Appendix I: Enclosures
Page 232 GAO-21-191
· Health risks and limitations with in-person visits for children in foster care. Representatives from five national organizations discussed challenges state child welfare agencies faced early in the pandemic either accessing personal protective equipment or technology needed to protect the health of caseworkers, families, and children while continuing visits to ensure children’s safety and well-being. For example, representatives from two national organizations said agencies struggled to get caseworkers designated as essential personnel so they would have priority access to masks, hand sanitizer, and other personal protective equipment. Representatives from three national organizations said agencies also faced challenges obtaining laptops, cellphones, internet, and other technology for child welfare caseworkers, families, and children so that caseworkers can visit children in foster homes and children can visit their biological families virtually. We plan to examine these and other ongoing challenges for state child welfare agencies as part of our continuing work.
· Overall budgetary constraints for child welfare agencies. Representatives from five national organizations raised concerns about budgetary constraints for child welfare agencies as a result of the pandemic’s economic impact on state budgets. For example, one representative explained that decreases in state revenues during the pandemic contributed to decisions by some states to implement spending cuts, including for child welfare services. Another representative said limited funding has affected agencies’ ability to assist service providers as well as families caring for children in foster care, including some who may be in financial distress or have additional needs due to school closures.
To help child welfare agencies address the impacts of COVID-19, ACF has distributed funds, provided guidance and flexibilities, and facilitated information sharing. ACF reported that it issued the supplemental grant awards from the $45 million provided under the CARES Act to all Title IV-B grantees on April 23, 2020, and that grants were awarded according to statutory formula.299 The amounts provided to states ranged from $15,686 to $4,690,717, with an average of $847,907 per state. According to ACF officials, examples of early actions by states include purchasing personal protective equipment for child welfare caseworkers and technology for families and children; extending support services to youth who have aged 299 Funds were distributed to states in proportion to their population of children under age 21 multiplied by the complement of their average per capita income (i.e., states with a lower per capita income receive a higher per child federal funding level). See 42 U.S.C. § 623.

Appendix I: Enclosures
Page 233 GAO-21-191
out of foster care (e.g., up to age 23); and providing additional funds to support foster care families. ACF has also issued guidance and flexibilities to help state child welfare agencies address the effects of the pandemic, including concerns described by the national organization representatives with whom we spoke (see table). Last, ACF has met with various stakeholder groups to listen to their concerns, and facilitated phone calls with state child welfare officials and others to share information on actions taken during the pandemic. For example, ACF officials said the agency has met with human services, parent, youth, foster care, and legal organizations in addition to state agency staff, and has conducted two town halls with older and transitioning youth.

Appendix I: Enclosures
Page 234 GAO-21-191
Examples of ACF Guidance and Flexibilities Provided to Help State Child Welfare Agencies Respond to Pandemic Concerns Described by National Organizations
Concerns related to child welfare services
ACF guidance and flexibilities
Declines in child abuse reports A joint letter to stakeholders with HHS’s Health Resources and Services Administration on May 28, 2020, outlines concerns about the well -being of families during the pandemic and encourages continued partnerships with families and providers as well as virtual service delivery
Court delays in child welfare decisions A letter to child welfare legal and judicial leaders on March 27, 2020, encourages them to continue hearings for child welfare cases as required under law, and underscored the need for children in foster care to have ongoing contact with their parents A letter to chief justices and state court administrators on April 14, 2020, outlines opportunities to use existing federal funds for court improvement programs to support telework and videoconferencing capabilities for virtual hearings Guidance on April 16, 2020, through ACF’s Capacity Building Center for Courts, outlines best practices for virtual hearings in child welfare cases
Financial and housing instability for youth aging out of foster care
A letter to child welfare agencies on March 12, 2020, encou rages them to contact current and former foster youth in colleges or other settings who may need assistance while their campus is closed Program instructions to child welfare agencies on May 8, 2020, provide flexibilities for agencies to extend federal support to youth in foster care up to age 21, such as by waiving education and employment requirements for youth if they are unable to meet them due to the pandemic A letter to child welfare agencies on May 26, 2020, outlines opportunities to use existing federal funds to extend services for youth currently and formerly in foster care
Health risks and limitations with in-person visits for children in foster care
A letter to child welfare agencies on March 18, 2020, provides flexibilities for caseworkers to conduct required visits with children in foster care virtually. A letter issued on April 15, 2020, expands on these flexibilities and outlines flexibilities for new foster parent fingerprints to be collected for background checks A letter to governors on April 17, 2020, encourages them to classify child welfare caseworkers and providers as essential personnel to allow them greater access to personal protective equipment
Overall budgetary constraints for child welfare agencies
A letter to child welfare agencies on April 17, 2020, outlines opportunities to use existing child welfare funds for personal protective equipment and cellphones Program instructions to child welfare agencies on June 8, 2020, provide information on the allowable uses of and reporting requirements for funds provided under the CARES Act
Source: GAO analysis of information from the Department of Health and Human Services’ (HHS) Administration for Children and Families (ACF) and obtained in interviews with representatives from eight national advocacy, training, and research organizations. | GAO-21-191
ACF plans to collect information on states’ use of the additional child welfare funds provided under the CARES Act. The agency required states to submit a brief narrative in July 2020 describing their plans for using the funds. We will examine these plans as part of our continuing work. States will be required to submit information on how they used these funds as part of their regular annual reports required under Title IV-B of the Social Security Act, which are due in June 2021.

Appendix I: Enclosures
Page 235 GAO-21-191
Agency Comments
We provided HHS and the Office of Management and Budget with a draft of this enclosure. Neither agency had any comments on the draft enclosure.
GAO’s Methodology
To conduct this work, we reviewed relevant federal laws and regulations and ACF policies and guidance. We also interviewed representatives from eight national organizations that conduct child welfare related advocacy, training, and research, and may specialize in certain aspects of child welfare, such as the workforce, foster youth, and family courts.
Contact information: Kathryn A. Larin, (202) 512-7215, [email protected]
Leave Benefits and Tax Relief for Employers
The Department of Labor is reviewing employee complaints about potential employer violations of paid leave requirements, and the Internal Revenue Service continues to process employers’ claims for refundable tax credits and employer payroll tax deferrals to mitigate the cost of paid leave and other pandemic related costs.
Entities involved: Department of Labor; Department of the Treasury, including the Internal Revenue Service; and the Small Business Administration
Key Considerations and Future GAO Work
Administering and enforcing the paid leave provisions of the Families First Coronavirus Response Act (FFCRA) helps ensure that employers covered under FFCRA (covered employers) are aware of their obligations under the law and that eligible employees understand their rights and receive the benefits to which they are entitled. We have ongoing work that will examine the Department of Labor’s (DOL) efforts to enforce FFCRA paid leave provisions.
We will also examine information on employers’ use of tax credits under FFCRA and the CARES Act as the Internal Revenue Service (IRS) processes employment tax data on returns filed electronically and catches up on the paper returns.

Appendix I: Enclosures
Page 236 GAO-21-191
As a result of finalizing a data sharing agreement with the Small Business Administration (SBA), IRS received Paycheck Protection Program (PPP) loan data on September 25, 2020. These data will help IRS ensure that PPP loan recipients did not inappropriately claim the Employee Retention Credit. On October 29, IRS officials said that they plan to use the SBA loan data but did not provide any documentation or timeframes for this plan. We will continue to monitor these issues and will include updates in our bimonthly CARES Act reports and in a separate report planned for 2021.
Background
FFCRA, as amended by the CARES Act, requires covered employers to provide emergency paid sick leave and expanded family and medical leave to eligible employees affected by COVID-19, through December 31, 2020.300 FFCRA and the CARES Act also provide tax credits to mitigate the cost of paid sick and family leave for covered employers, as well as provide an employee retention credit for all employers, among other tax relief.
FFCRA paid leave provisions for employees. Covered employers generally must provide eligible employees (1) up to 80 hours of emergency paid sick leave, subject to daily and aggregate payment caps, and (2) up to 12 weeks of emergency family and medical leave, including 2 weeks unpaid and 10 weeks paid at no less than two-thirds the eligible employee’s regular rate of pay, subject to daily and aggregate payment caps.301 All employees of a covered employer are eligible to take emergency paid sick leave regardless of their duration of employment. Moreover, all employees who have been employed by a covered employer for at least 30 calendar days are eligible to take expanded
300 In addition to FFCRA paid leave provisions, the Family and Medical Leave Act of 1993, as amended, (FMLA) generally requires employers to provide up to 12 weeks of unpaid leave per year for eligible employees to help care for a spouse, child, or parent with a serious health condition or for their own serious health condition, among other things. Employees are generally eligible if they meet certain requirements related to length of employment and size of employer. State laws in some states also provide paid sick or family leave, and eligibility rules vary by state.
301 Pub. L. No. 116-127, §§ 3101–3106, 5101–5111, 134 Stat. 178, 189-192, 195-201 (2020); Pub. L. No. 116-136, §§ 3601, 3602, 134 Stat. 281, 410 (2020).The emergency paid sick leave may be used for quarantine and other situations related to COVID -19 that leave employees unable to work, and both leave provisions cover care for a child whose school, place of care, or child care provider is closed or unavailable due to COVID-19.

Appendix I: Enclosures
Page 237 GAO-21-191
family and medical leave. However, an employer may exclude employees who are health care providers or emergency responders from the application of these leave requirements.
Covered employers generally face liability for not providing or for improperly denying emergency paid sick leave or expanded family and medical leave or for discharging, disciplining, or discriminating against any employee for taking either type of leave.302 Covered employers include most public employers and private employers with fewer than 500 employees. Small businesses—those with fewer than 50 employees—may qualify for an exemption from certain paid leave requirements. More specifically, if an employee requests leave due to school, place of care, or child care provider closures or unavailability and the requested leave would jeopardize the viability of the business, a small business may claim an exemption from providing this leave.303
DOL’s Wage and Hour Division (WHD) administers and enforces FFCRA paid leave requirements. Employees who believe their covered employer violated FFCRA may call a toll-free number for assistance or to file a complaint. When an employee files a complaint related to FFCRA paid leave provisions, WHD determines if it meets the criteria for investigation. If so, it registers the complaint as a case, determines the priority level of the complaint, and determines what type of compliance action to take.
There are four types of compliance actions for FFCRA complaints—conciliation, office audit, limited investigation, or full investigation—with conciliations requiring WHD to utilize minimal resources and full investigations requiring WHD to allocate the most resources. The type of compliance action taken depends on factors such as the number of employees involved, level of resources involved, or the level of fact finding required to investigate the complaint. The different compliance
302 Covered employers that fail to provide emergency paid sick leave to eligible employees are considered to have committed minimum wage violations under the Fair Labor Standards Act of 1938, as amended, and they are subject to penalties described therein, including being liable to the affected employees. See Pub. L. No. 116 -127, § 5105(a), 134 Stat. at 197. Covered employers are subject to additional penalties for discharging, disciplining, or discriminating against any employee for taking emergency paid sick leave. See id. § 5105(b), 134 Stat. at 197. The prohibitions and enforcement provisions in FMLA apply to leave under the expanded family and medical leave provisions. See 26 U.S.C. §§ 2615 and 2617. Employees may also bring civil action against covered employers that violate the expanded family and medical leave provisions. See 26 U.S.C. § 2617(a).
303 See 29 C.F.R. § 826.40(b).

Appendix I: Enclosures
Page 238 GAO-21-191
actions are discussed in greater detail later. In addition to taking compliance actions in response to complaints, WHD may initiate compliance actions—known as agency-directed actions—to expand on an existing complaint or based on a lead from another source, such as a newspaper account or a federal or state agency. However, WHD officials said the vast majority of agency-initiated investigations are data-driven initiatives in key priority industries.
Tax credits for employers. IRS is administering tax credits authorized by the FFCRA and CARES Act among other tax relief. The Joint Committee on Taxation estimates that these provisions will lead to about $172 billion in foregone revenue for fiscal years 2020-2030. The IRS’s capacity to implement new initiatives, such as the CARES Act tax measures, is an ongoing challenge cited in our 2019 High Risk Report. The tax provisions include:
· Paid leave credits. Businesses and tax-exempt organizations with fewer than 500 employees, as well as self-employed individuals, are eligible for refundable FFCRA credits.304 The credits are equal to qualified leave wages, plus the employer share of Medicare taxes paid with respect to qualified wages and allocable health plan expenses, from April 1 through December 31, 2020. Credit recipients who receive PPP loans cannot count the wages paid for by the credit as payroll costs toward loan forgiveness.305
Payroll tax credits may be claimed on the employer’s employment tax return, typically Form 941, Employer’s Quarterly Federal Tax Return. To receive immediate relief, employers may reduce their semiweekly or monthly payroll tax deposits by the amount of their credit.306 If an anticipated credit amount remains after reducing deposits, the employer may receive an advance refund by filing Form 7200,
304 Pub. L. No. 116-127, §§ 7001–7004, 134 Stat. 178, 210–219 (2020). A refundable tax credit reduces tax liability, dollar for dollar; if the credit exceeds tax liability, a refund is due. Full-time and part-time employees are counted. Both credits have maximum payouts. Self-employed individuals may not file for advances on their credit refu nds.
305 15 U.S.C. § 636(a)(36)(A)(viii)(II)(dd), (ee). PPP recipients must meet certain criteria for loan forgiveness.
306 Internal Revenue Service, COVID-19-Related Tax Credits: General Information FAQs (Sept. 19, 2020), accessed online on October 21, 2020, https://www.irs.gov/newsroom/covid-19-related-tax-credits-general-information-faqs.

Appendix I: Enclosures
Page 239 GAO-21-191
Advance Payment of Employer Credits Due to COVID-19. Form 7200 must be submitted using electronic fax (e-fax).
· Employee Retention Credit. Under the CARES Act, eligible employers of any size—including tax-exempt entities and self-employed individuals with employees—can receive the refundable Employee Retention Credit. The credit equals 50 percent of qualified wages (up to $10,000 per employee for a maximum credit of $5,000) paid from March 13 through December 31, 2020, including certain health care expenses.307 Eligible employers are those who experience, in calendar year 2020, either (1) full or partial suspension of operations due to government orders limiting activity in response to COVID-19 during any calendar quarter, or (2) a decline in gross receipts of more than 50 percent, compared with the same quarter in 2019. PPP recipients are not eligible for the Employee Retention Credit, except for certain employers that repaid their PPP loans by May 18, 2020.308 Qualified leave wages for which FFCRA credits are allowed are not included in qualified wages for which an employer may claim the Employee Retention Credit, among other wages for which an employer may not claim the Employee Retention Credit.309 Employers can claim the credit on their employment tax returns and may reduce payroll tax deposits by the credit amounts, or file Form 7200 for advance refunds.
· Deferred payroll tax payments for employer share of Social Security. The CARES Act granted all employers the option to defer deposits and payments of the employer share of Social Security tax that they would otherwise be required to make during the period beginning March 27 through December 31, 2020, and payments of the tax
307 Pub. L. No. 116-136, § 2301, 134 Stat. at 347–351. For employers with more than 100 full-time employees in 2019, the credit is calculated on wages paid to employees fo r time they are not providing services. For smaller employers, all wages are countable.
308 See 85 Fed. Reg. 23450 (Apr. 28, 2020); 85 Fed. Reg. 29845 (May 19, 2020); 85 Fed. Reg. 31357 (May 26, 2020).
309 For example, employees counted under a Work Opportun ity Tax Credit are not counted for purposes of the Employee Retention Credit.

Appendix I: Enclosures
Page 240 GAO-21-191
imposed on wages paid during that period.310 Self-employed individuals may defer half of their Social Security taxes imposed on net earnings from self-employment during the period beginning March 27 through December 31, 2020.311 Deferred deposits are to be reported on Form 941.
Overview of Key Issues
Administration and enforcement of FFCRA paid leave provisions. WHD officials said they have conducted outreach, provided customer service, and issued guidance on FFCRA paid leave provisions. They have also responded to complaints related to FFCRA paid leave provisions; WHD reported that it has received 4,233 FFCRA paid leave complaints, of which 3,459 (82 percent) resulted in a compliance action and 595 (14 percent) resulted in no action.312 WHD also reported initiating additional agency-directed compliance actions, for a total of 3,463 compliance actions, as of September 16, 2020.
· As of September 16, 2020, WHD reported conducting 2,160 outreach events to educate employers about their obligations under the new law and to make employees aware of their rights. These efforts included conducting compliance consultations with employers, holding webinars, and making presentations, among others.
· WHD officials said that more calls to the toll-free number are now being answered by WHD staff rather than by an automated system to help reach resolution on questions or complaints faster.
· WHD has issued and updated its rules and guidance since FFCRA paid leave provisions went into effect. Most notably, DOL issued revisions and clarification to its April 2020 temporary rule implementing FFCRA paid leave provisions, effective September 16,
310 Pub. L. No. 116-136, § 2302, 134 Stat. at 351–352, as amended by the Paycheck Protection Program Flexibility Act, Pub. L. No. 116-142, § 4, 134 Stat. 641, 643 (2020). To be considered timely, deferred payments of 50 percent of tax are to be made by December 31, 2021, with the remainder due December 31, 2022. The employer share of Social Security tax is 6.2 percent of taxable earnings up to the cap on taxable income. The tax finances the Social Security trust funds.
311 Self-employed individuals pay the employer and employee tax share, which is 12.4 percent of taxable earnings, up to the cap on taxable income.
312 The remaining 4 percent of cases were in the intake or review stages of processing.

Appendix I: Enclosures
Page 241 GAO-21-191
2020.313 DOL made these revisions in response to a federal court ruling that invalidated certain provisions of the April 2020 temporary rule.314 DOL also revised its frequently asked questions website to reflect these revisions. Among other things, DOL revised its definition of “health care provider” because the federal court found DOL’s original definition to be overly broad. DOL revised the definition to include only employees who either (1) meet the definition of a health care provider under the Family and Medical Leave Act regulations or (2) are employed to provide diagnostic services, preventative services, treatment services or other services that are integrated with and necessary to the provision of patient care, which, if not provided, would adversely impact patient care.315 The April 2020 rule estimated that 9 million individuals employed in the health care and social assistance industry by employers with fewer than 500 employees were exempt from utilizing FFCRA paid leave. These individuals could be affected by the September 2020 change in the health care provider definition, though the impact of the change could affect more individuals than the April 2020 rule estimated. An August 2020 DOL Office of Inspector General report found that DOL’s estimate of 9 million individuals affected by the April 2020 rule may understate the true number of affected individuals.316
WHD began enforcement actions related to FFCRA paid leave provisions on April 18, 2020, after a limited stay of enforcement to enable public and private employers who are covered by the act to come into compliance
313 See 85 Fed. Reg. 57,677 (Sept. 16, 2020).
314 See New York v. U.S. Dep’t of Labor, No. 20-CV-3020 (JPO), 2020 WL 4462260 (S.D.N.Y. Aug. 3, 2020).
315 In addition to changing the definition of health care provider, the September 2020 revisions reaffirm and further explain that emergency paid sick leave and expanded family and medical leave may only be taken if an employee has work from which to take leave; reaffirm and further explain that an employee must obtain approval from their employer to take FFCRA leave intermittently; clarify that employees must provide required documentation supporting their need for FFCRA leave to their employers as soon as practicable; and correct an inconsistency regarding when employees may be required to provide notice of a need to take expanded family and medical leave to their employers.
316 The DOL Office of Inspector General conducted a performance audit to examine how WHD has implemented its FFCRA responsibilities. See Department of Labor, Office of Inspector General, COVID-19: WHD Needs to Closely Monitor the Pandemic Impact on Its Operations, 19-20-009-15-001 (Washington, D.C.: August 2020).

Appendix I: Enclosures
Page 242 GAO-21-191
with the new law.317 To familiarize their staff with the law and instruct them on how to respond to complaints, WHD officials said they provided training to all WHD enforcement staff, conducted webinars, and issued guidance.
WHD reported that 2,398 (69 percent) of the 3,463 compliance actions it has taken had been concluded, as of September 16, 2020. The vast majority of compliance actions were concluded using a conciliation (see table below). WHD officials said that conciliation—which is limited to the correction of minor violations consisting of a single issue affecting only one or a few employees and does not involve any fact finding—is usually the most appropriate action for FFCRA paid leave complaints because most complaints are straightforward and involve only one or a few employees. They further said that the use of conciliation provides the quickest relief for the affected employee or employees, while educating the employer on their responsibilities. WHD officials said they use a variety of remedies for employees when a compliance action is concluded, such as requiring employers to pay lost wages, restore jobs that employees had lost, or provide leave.
Number and Type of Compliance Actions Related to Families First Coronavirus Response Act Paid Leave Provisions, as of September 16, 2020
Enforcement action Number of cases registereda
Number of cases concludedb
Percent of cases concluded
Average number of days to conclude
cases Conciliation 2,811 2,146 76 13 Office Audit 623 248 40 59 Limited Investigation 12 3 25 71 Full Investigation 17 1 6 56 Total 3,463 2,398 69 50
Source: Department of Labor data. | GAO-21-191 aRegistered cases result from a complaint or an agency -directed action. bWage and Hour Division off icials said concluded cases are those that w ent through the entire investigation process. They said some cases result in a compliance action for w hich the Department of Labor is unable to complete the investigative process because, for example, an employer is out of business.
317 During the limited stay of enforcement period starting April 1, 2020, the date the FFCRA leave provisions became effective, WHD reserved its right to exercise its enforcement authority if the employer violated FFCRA willfully, failed to provide a written commitment to future compliance with FFCRA, or failed to remedy a violation upon notification by DOL. After April 17, 2020, this limited stay of enforcement was lifted.

Appendix I: Enclosures
Page 243 GAO-21-191
For complaints it receives from employees of small businesses, WHD officials said they may ask for documentation to support an exemption claim in the course of investigating a complaint. While small businesses do not formally apply or submit documentation to WHD to claim the exemption from providing paid leave for an employee due to school, place of care, or child care closures or unavailability, they must document the basis for the exemption for their own records and retain the documentation for 4 years. WHD officials said each small business must determine whether the exemption is warranted based on the specific circumstances of the individual employee and business.
WHD established new performance measures to capture its enforcement, outreach, and customer service efforts under FFCRA. WHD officials said they collected baseline data in fiscal year 2020 to determine the targets for these performance measures for fiscal year 2021 (see table below).
New FFCRA-related Performance Measures for Department of Labor’s Wage and Hour Division
Performance measure FY 2020 resulta FY 2021 target Percent of Families First Coronavirus Response Act (FFCRA) conciliations concluded in 15 calendar days
78.6% 70%
Number of outreach events involving FFCRAb 2,160 200 Percent of public calls answered livec 87.4% 55%
Source: Department of Labor documentation. | GAO-21-191 aThese values are as of September 16, 2020. bThe Department of Labor’s (DOL) FY 2021 Operating Plan did not include a FY 2020 result; how ever, DOL reported conducting 2,160 outreach events related to FFCRA paid leave. cThis measure is not specif ic to FFCRA but includes all calls received by DOL’s call center.
IRS processing of tax credits and employer share of Social Security payroll tax deferrals. On September 22, 2020, IRS and SBA finalized a data-sharing agreement that allows IRS to use SBA data to help ensure that PPP loan recipients did not also inappropriately claim the Employee Retention Credit. IRS received data on September 25, 2020, and will periodically receive updated data. IRS officials said they plan to use SBA loan data to reverse inappropriately claimed credits but need to review the data before developing a programming plan to use it, and will not be able to use it while processing third-quarter employment tax returns.

Appendix I: Enclosures
Page 244 GAO-21-191
As of October 29, 2020, there were filings claiming about $1.3 billion for the FFCRA leave tax credits and about $4.5 billion for the Employee Retention Credit (see table below).318
Summary of Claims Requested on Filed Quarterly Employment Tax Returns, as of October 29, 2020
Provision Number of employers claiming
Dollars claimed ($ billions)a
Families First Coronavirus Response Act leave credits
149,830 1.3
Employee Retention Credit 26,604 4.5 Deferred employer-share Social Security tax
105,657 27.6
Source: Internal Revenue Service data. | GAO-21-191
Notes: The table includes second quarter electronically f iled returns and 145,077 paper returns. The second quarter returns include amounts for the Employee Retention Credit from the end of the f irst quarter because legislation passed too late in the quarter to be reported then. Figures in this table include some electronically f iled Forms 941 that have not yet been accepted and processed by IRS. Dollars claimed include advance credits also claimed on Form 7200. IRS continues to process a paper return backlog, w hich makes the data in the table above incomplete, particularly for small employers. aThe tax credit dollar f igures w e are reporting are as reported by taxpayers and are subject to taxpayer reporting error. These f igures may differ from IRS’s reported f igures because we are reporting w hat was filed on second quarter Form 941s w ithout adjustments.
Of the 3.4 million quarterly employment tax return filings, less than 1 percent of employers filed for the Employee Retention Credit.
Of employers for whom the IRS collects data on closures, 197 employers claiming one of the tax credits or deferring payroll taxes reported their business would be closing or stopping payment of wages in the second quarter.319 The 197 employers claimed $1,298,470 in tax credits through the paid leave credits and Employee Retention Credits and deferred $1,263,038 in employer share of Social Security payroll tax payments. IRS officials said they have existing rules and procedures—such as
318 The tax credit dollar figures we are reporting are as reported by taxpayers and are subject to taxpayer reporting error. These figures may differ from IRS’s reported figures because we are reporting what was filed on second quarter Form 941s without adjustments.
319 This number is likely an undercount because it is based on e -filed returns only, and does not include the 63,633 employers who do not provide this information because their information is reported on Schedule R, Allocation Schedule for Aggregate Form 941 Filers. According to IRS officials, the 197 employers may also include employers who have switched to a third-party filer or, in certain circumstances, who have been acquired, merged, or consolidated.

Appendix I: Enclosures
Page 245 GAO-21-191
through bankruptcy proceedings—to collect taxes from closed businesses.
IRS continues to process a paper return backlog, which makes the data in the table above incomplete, particularly for small employers. Officials at a payroll professional organization we interviewed told us that employers filing Form 941 on paper are more likely to be smaller than those filing electronically. As of October 19, 2020, IRS facilities that process paper Forms 941 are operating at reduced capacity after being closed for months during the spring. IRS officials said they were experiencing a backlog and they have a goal to open all of the mail by November 9, 2020.
IRS also continues to process Forms 7200 for tax credit advance refunds. As of October 18, 2020, IRS had issued $583.17 million in advance credits.320 Of the $5.7 billion in claims for the Employee Retention Credit and leave credits on the second quarter Forms 941, as of October 29, 2020, about 3 percent were filed as advance refunds through a Form 7200 filing.321
Officials at a payroll professional association told us that employers who filed a Form 7200 for advance refunds experienced long processing times in the spring that did not give them much advantage over filing a Form 941 and may have discouraged continued filings for advance refunds. IRS officials said the backlogs that occurred in the spring have been resolved. On average, IRS officials said they are processing employers’ Forms 7200 within 15 to 20 days from initial receipt to refund issuance. To prevent duplicate or improper payments, additional analysis may be warranted if an employer submits multiple forms during a specified period. Such analyses may cause longer processing times.
IRS designated 14,604 of the 26,748 submissions of Form 7200 claims it received as of October 19, 2020 as “rejected.” IRS sent letters to employers whose forms were rejected. According to IRS officials, the most common reasons for rejecting a Form 7200 claim were that the filer provided an unauthorized signature or filed a Form 7200 after submitting a Form 941 for the quarter or after the due date of the Form 941 for the
320 Some of these advances are also included in the table above because employers are to report on Form 941 the advance credits they have received.
321 This calculation is based on the amount of advance credits received reported by taxpayers on Form 941, which differs from the amount of advance credits IRS has issued.

Appendix I: Enclosures
Page 246 GAO-21-191
quarter. Since IRS resumed sending mail on June 19, 2020, as of October 19, 2020 it has mailed 13,688 letters to employers whose Form 7200 claims were rejected.
Agency Comments
We provided IRS, Treasury, the Small Business Administration (SBA), the Department of Labor (DOL) and the Office of Management and Budget with a draft of this enclosure. IRS’s written comments are reproduced in appendix VI, and IRS and Treasury provided technical comments, which we incorporated as appropriate. SBA, DOL, and the Office of Management and Budget did not have any comments on this enclosure.
GAO’s Methodology
To conduct our work, we reviewed DOL data as of September 16, 2020, and IRS data as of October 29, 2020. We determined the data were sufficiently reliable for the purposes of this report. We also reviewed federal laws and agency documents; and interviewed officials at DOL and IRS and at payroll and tax professional associations.
Contact information: Thomas Costa, (202) 512-7215, [email protected]; Jessica Lucas-Judy, (202) 512-9110, [email protected]
HUD Programs
While the Department of Housing and Urban Development continues to obligate CARES Act funding, as of September 2020, expenditures were low in some of its programs, particularly its community development and homelessness programs.
Entity involved: Department of Housing and Urban Development
Key Considerations and Future GAO Work
In June 2020, we noted concerns about the potential for grantee oversight and management challenges in the Department of Housing and Urban Development’s (HUD) CARES Act programs based on our prior work. Specifically, in our March 2019 report on Community Development Block Grant Disaster Recovery grants, we recommended that HUD develop and implement a comprehensive monitoring plan for its disaster recovery grant portfolio. In our July 2016 report on HUD management, we

Appendix I: Enclosures
Page 247 GAO-21-191
recommended that HUD incorporate management practices designed to improve agency governance and operations. HUD agreed with both recommendations but they remain open as of mid-October 2020. We maintain that by implementing these recommendations, HUD will be better positioned to address the challenges posed by COVID-19.322
Since June 2020, we have identified additional concerns regarding HUD grantees’ rate of expenditures. To help grantees expend funds, HUD plans to provide them with technical assistance and has issued clarifying guidance and additional waivers to provide grantees with more flexibility. We have ongoing work on HUD’s implementation and oversight of CARES Act funds.
Background
The CARES Act appropriated over $12 billion to HUD programs for purposes of providing additional resources to prevent, prepare for, and respond to housing needs related to COVID-19 (see figure).323
322 We sent a letter to HUD in April 2020 highlighting recommendations that we consider to be high-priority due to their potential to improve government operations.
323 Pub. L. No. 116-136, div. B, tit. XII, 134 Stat. 281, 601-13.

Appendix I: Enclosures
Page 248 GAO-21-191
Status of Supplemental CARES Act Funding for HUD Programs, as of September 30, 2020
aThe CARES Act also appropriated $50 million to HUD for management and administration of CARES Act funding and $5 million to the HUD Office of the Inspector General for audits and investigations. Pub. L. No. 116-136, div. B, tit. XII, 134 Stat. at 601, 612. bFunding for permanent supportive housing competitive grantees ($10 million) is to remain available until September 30, 2022.
Key programs include the following:
· Community Development Block Grant Coronavirus Response (CDBG-CV). This program helps states and entitlement communities support

Appendix I: Enclosures
Page 249 GAO-21-191
a wide variety of activities, including emergency payments to families and individuals and business assistance.324
· Emergency Solutions Grants Coronavirus Response (ESG-CV). This program supports homelessness assistance and prevention activities. Eligible activities include street outreach, temporary emergency shelter, rental assistance, and housing relocation and stabilization services. 325
· Office of Public and Indian Housing assistance for public housing agencies (PHA). This assistance helps with COVID-19-related expenses (for example, purchasing personal protective equipment), housing assistance payments, and regular eligible activities.326
The CARES Act provided HUD with broad authority to waive statutes and regulations related to many of its programs. For example, it waived CDBG’s 15 percent spending cap on public services (which include job training and childcare). HUD also issued waivers for PHAs allowing them to delay annual reexamination of family income and inspections.
Overview of Key Issues
Implementation challenges. As of September 30, 2020, HUD had obligated over $6.4 billion—or 52 percent—of its CARES Act funds, up from $2.26 billion, as of May 31, 2020. However, HUD data indicate that only about $2.1 billion—or 17 percent—had been expended.
Office of Community Planning and Development. About 1 percent of the $9 billion appropriated to CDBG-CV and ESG-CV had been expended as of September 2020. In September 2020, HUD officials and an industry association representative of CDBG and ESG grantees told us that low initial expenditures were due in part to grantees taking additional planning
324 Entitlement communities generally are principal cities of metropolitan statistical areas, other metropolitan cities with populations of at least 50,000, and qualified urban counties with populations of 200,000 or more (excluding the populations of entitlement cities).
325 ESG grantees are generally metropolitan cities, urban counties, territories, and states. These grantees may award their ESG funds to subrecipients.
326 A public housing agency is typically a local agency created under state law that manages housing for low-income residents at rents they can afford. HUD offers assistance to low-income renters through the public housing and voucher programs. HUD’s public housing program offers units for eligible tenants in properties generally owned and administered by state and local public housing agencies. HUD’s voucher program subsidizes private-market rents for low-income households.
Appendix I: Enclosures
Page 250 GAO-21-191
time, especially since some are designing new programs (for example, using CDBG-CV funds for rental assistance or business assistance).327
The industry association representative also told us that CDBG grantees were hesitant to spend funds until HUD issued a Federal Register notice with guidance and program waivers—particularly since many are designing new programs. 328
HUD officials told us that a number of ESG grantees also chose to wait for the publication of a similar notice for ESG-CV before making funding decisions.329 HUD issued the CDBG-CV notice in August 2020 and the ESG-CV notice in early September 2020 (about 4 months after funding was initially available in April). In September 2020, HUD issued a waiver in response to grantee reports that individuals experiencing homelessness were staying in institutions longer due to COVID-19 (for example, longer hospital stays when infected with COVID-19 or extended jail stays due to delays in hearings when courts are closed or operating at reduced capacity). Specifically, the waiver expanded the definition of homelessness for the ESG-CV program to include homeless individuals who had stayed in such institutions for up to 120 days (an increase from the previous 90 days)—allowing greater flexibility for grantees’ usage of ESG-CV funds.330
327 Some grantees received funding from other sources, such as the Federal Em ergency Management Agency and the Coronavirus Relief Fund, which have earlier spending deadlines or less flexible uses. Additionally, grantees could also reallocate their original fiscal year 2019 and 2020 CDBG grants to COVID-19 activities.
328 A CDBG grantee association sought input from its 453 grantee members on issues and challenges in administering CDBG-CV to date. This was the most common response among the 103 who responded. Notice of Program Rules, Waivers, and Alternative Requirements Under the CARES Act for Community Development Block Grant Program Coronavirus Response Grants, Fiscal Year 2019 and 2020 Community Development Block Grants, and for Other Formula Programs, 85 Fed. Reg. 51457 (Aug. 20, 2020).
329 Department of Housing and Urban Development, Waivers and Alternative Requirements for the Emergency Solutions Grants (ESG) Program Under the CARES Act, CPD Notice 20-08 (Sept. 1, 2020).
330 Specifically, HUD considers an individual homeless if they have resided in an emergency shelter or place not meant for human habitation immediately before entering institutions such as hospitals or jails. The waiver also applies to the regular ESG program. Department of Housing and Urban Development, Availability of Additional Waivers for Community Planning and Development (CPD) Grant Programs to Prevent the Spread of COVID-19 and Mitigate Economic Impacts Caused by COVID-19 (Washington, D.C.: Sept. 30, 2020).
Appendix I: Enclosures
Page 251 GAO-21-191
HUD officials and the industry association representative also noted that some grantees may have limited capacity to quickly spend a large increase in funding.331 To help grantees manage additional funds, the CARES Act provided CDBG-CV and ESG-CV with a total of $50 million for technical assistance to build grantees’ capacity. However, HUD data show that less than 3 percent of technical assistance funds had been expended, as of September 2020. With respect to ESG-CV, HUD officials told us that, as of mid-October 2020, they had held 12 training webinars, issued a toolkit on avoiding duplicating benefits between programs, and provided direct technical assistance to over 47 grantees, including assistance on COVID-19-related health and safety in collaboration with the Centers for Disease Control and Prevention. HUD officials also noted that ESG-CV technical assistance providers obligated $17 million in technical assistance funds. In early October 2020, HUD launched a CDBG-CV webpage where grantees can submit questions and request technical assistance for complex issues. HUD plans to roll out additional CDBG-CV technical assistance throughout 2021, including guidance for providing rental and economic development assistance, a virtual conference for its CARES Act grantees, and 10 problem-solving clinics. In March 2019, we reported that CDBG Disaster Recovery grantees that received funding in response to the 2017 hurricanes also experienced a lag in accessing funds and capacity issues.
Office of Public and Indian Housing. HUD announced funding allocations to PHAs in May and August 2020. However, PHA association representatives told us that PHAs were initially hesitant to spend funds due to a lack of clarity on eligible uses and because reporting requirements for the funds had not yet been issued. In August 2020, the Assistant Secretary for Public and Indian Housing sent a letter to PHA directors expressing concern about the slow expenditure of public housing operating funds and clarifying that these funds could be used for both COVID-19-related expenses and regular PHA expenses (e.g., maintenance costs).332 In September 2020, HUD issued guidance on how
331 For both programs, the CARES Act appropriation was larger than their initial fiscal year 2020 appropriations ($3.425 billion for CDBG and $290 million for ESG).
332 Department of Housing and Urban Development, Letter from Assistant Secretary for Public and Indian Housing, August 4, 2020, accessed September 18, 2020, https://www.hud.gov/sites/dfiles/PIH/documents/CARES_Act_Spending_Final.pdf.
Appendix I: Enclosures
Page 252 GAO-21-191
PHAs should report the supplemental funds.333 PHA associations with whom we spoke said that their members were using many of the waivers HUD implemented, particularly waivers on income recertification and inspections.334
Oversight challenges. According to HUD officials, HUD’s CARES Act Compliance Response Team (HCCRT) worked with program offices to identify top oversight risks—including effective monitoring and reporting—along with initial steps to address them.335 To help ensure program offices’ existing data collection processes comply with CARES Act reporting requirements, HCCRT created a template for program offices to identify data and reporting needs and requirements and is developing specific guides for each program office based on this template. In addition, HCCRT is working with the program offices to develop strategies to oversee CARES Act-specific requirements remotely, such as preventing duplication of benefits. As of early October, HUD officials said they were developing a timeline for developing and implementing these strategies.
Further, several program offices reported concerns that staffing levels were insufficient for overseeing CARES Act funds and concerns about administering funds during the agency-wide shift to telework. In early November 2020, HUD officials commented that 96 new positions had been approved to help with CARES Act administration, of which 40 had
333 Department of Housing and Urban Development, Extension of Period of Availability for CARES Act Supplemental Public Housing and Housing Choice Voucher Funds, Guidance on CARES Act Financial Reporting Requirements (FDS and Quarterly Reporting), and Other CARES Act Provisions, Notice PIH-2020-24 (Sept. 14, 2020). This notice also extended the deadlines for some of these funds from December 31, 2020 and March 31, 2021, to December 31, 2021.
334 In June 2020, we reported that some industry groups warned that because the PHAs are not required to implement such waivers, they may not use them. However, industry representatives told us that PHAs have willingly implemented many waivers, such as those allowing virtual property ins pections (and thus minimizing potential exposure between residents and inspectors) and providing flexibility in income reexamination (in response to difficulties accessing income documentation).
335 We reported in June 2020 that HUD had established HCCRT to implement an oversight plan focusing on the impact of the CARES Act on HUD people, processes, and technology.

Appendix I: Enclosures
Page 253 GAO-21-191
been on-boarded and 39 were in the recruitment process.336 Officials also told us that the Office of the Chief Human Capital Officer, in consultation with the Office of the Chief Financial Officer, developed an approach to streamline and expedite CARES Act hiring, which includes guidance for creating CARES Act-related job listings and a unique identification number that distinguishes CARES Act hires from other hires.337 In mid-October 2020, HUD officials told us that the Office of Community Planning and Development had hired 11 employees to assist with CARES Act implementation and compliance activities.
Agency Comments
We provided HUD and the Office of Management and Budget with a draft of this enclosure. In its comments, reproduced in appendix V, HUD noted that funds from its Office of Community Planning and Development (which includes CDBG-CV and ESG-CV) are available for 3–6 years and provided more detail about its technical assistance efforts. In addition, HUD provided updated information on its hiring efforts and other technical comments, which we incorporated as appropriate. The Office of Management and Budget did not have any comments on this enclosure.
GAO’s Methodology
To conduct this work, we reviewed HUD guidance and documentation and written responses from HUD officials. In addition, we interviewed selected industry organizations representing CDBG-CV and ESG-CV grantees and PHAs to obtain their views on HUD’s administration and oversight of CARES Act funds. Their views are not generalizable to other associations that represent HUD grantees or PHAs, but offered important perspectives. We assessed the reliability of HUD’s data by comparing them to publicly available data and reviewing written responses from agency officials. We determined that the data were sufficiently reliable for reporting on the status of HUD’s CARES Act spending.
336 According to HUD officials, the agency’s hiring efforts were ongoing. Appointments under the CARES Act must be made by December 31, 2020. See Pub. L. No. 116-136, § 4010, 134 Stat. 478.
337 Similarly, in March 2019, we reported on numerous challenges that HUD encountered when administering CDBG Disaster Recovery funds in response to the 2017 hurricanes, including a lack of workforce planning. As mentioned previously, we recommended that HUD develop and implement a comprehensive monitoring plan and conduct workforce planning to effectively manage the CDBG Disaster Recovery grant portfolio.
Appendix I: Enclosures
Page 254 GAO-21-191
Contact information: Alicia Puente Cackley, (202) 512-8678, [email protected]
Related GAO Products
Priority Open Recommendations: Department of Housing and Urban Development. GAO-20-500PR. Washington, D.C.: April 23, 2020.
Disaster Recovery: Better Monitoring of Block Grant Funds Is Needed. GAO-19-232. Washington, D.C.: March 25, 2019.
Department of Housing and Urban Development: Actions Needed to Incorporate Key Practices into Management Functions and Program Oversight. GAO-16-497. Washington, D.C.: July 20, 2016.
Unemployment Insurance Programs
Weekly news releases issued by the Department of Labor have improperly presented state-reported claims volumes as the number of individuals claiming benefits in unemployment insurance programs because the number of claims has not been an accurate approximation of the number of individuals claiming benefits during the pandemic. Each week, the agency publishes the number of weeks of unemployment benefits claimed by individuals in each state during the period, and reports the total count as the number of people claiming benefits nationwide. Department of Labor officials told us that they have traditionally reported the numbers in this way because they were a close approximation of each other. However, because backlogs in processing a historic volume of claims have led to individuals claiming multiple weeks of benefits at a time for previous weeks of unemployment, as well as other data issues, these traditional estimates have not been appropriate in the context of the pandemic. For example, by using claims counts to represent the number of people, individuals who submitted multiple claims are counted more than once in the Department of Labor’s estimate. At the same time, not all states have been included in each weekly estimate due to delays in states’ data submissions. As the demand for unemployment insurance benefits remains high, state resources are strained, and reports of fraud in the system continue, the Department of Labor has taken steps to monitor and assist states with program integrity issues.
Entity involved: Department of Labor
Appendix I: Enclosures
Page 255 GAO-21-191
Recommendations for Executive Action
We are making the following two recommendations to the Department of Labor:
The Secretary of Labor should ensure the Office of Unemployment Insurance revises its weekly news releases to clarify that in the current unemployment environment, the numbers it reports for weeks of unemployment claimed do not accurately estimate the number of unique individuals claiming benefits.
The Secretary of Labor should ensure the Office of Unemployment Insurance pursues options to report the actual number of distinct individuals claiming benefits, such as by collecting these already available data from states, starting from January 2020 onward.
Key Considerations and Future GAO Work
The unemployment insurance (UI) system provides a vital safety net for individuals who become unemployed through no fault of their own, and this support is essential during widespread economic downturns. As certain CARES Act UI programs approach their scheduled expiration in December 2020, the UI system continues to experience high numbers of claims as a result of the COVID-19 pandemic. However, the Department of Labor (DOL) does not currently collect or report reliable counts of the number of individuals claiming benefits, which could inform policy makers and the public about how the size of the population being supported has changed during the pandemic, and the potential effects of the expiration of CARES Act benefits.
We continue to focus on the implications of persistently high numbers of claims for UI benefits. Enhanced benefits under the Federal Pandemic Unemployment Compensation program expired at the end of July 2020 and supplemental payments under the federal lost wages assistance program covered weeks of unemployment through September 5, 2020, at the latest. Individuals claiming benefits for unemployment after the expiration of these supplemental benefits will be more reliant on the benefits provided by the UI system in their state, and their household income may no longer exceed poverty guidelines. States also face continued financial pressure in paying claims. As of November 9, 2020, 21 states and territories held about $40.2 billion in federal loans to pay UI benefits.

Appendix I: Enclosures
Page 256 GAO-21-191
We also remain concerned about potential fraud throughout the system. States have identified schemes that reportedly could account for tens of thousands of fraudulent claims and potentially millions of dollars in improper payments. Federal agencies are working with states to detect and respond to UI fraud. For example, DOL’s Office of Inspector General (OIG) designated UI as a high priority for addressing program integrity issues and has ongoing fraud investigations. We will continue to monitor OIG findings and DOL actions to provide guidance and support to states to help ensure UI program integrity.
Following a recommendation in our June 2020 report, DOL issued guidance on August 12, 2020, addressing potential risks that certain workers being paid wages with proceeds from the Paycheck Protection Program (PPP)—administered by the Small Business Administration—could also simultaneously be receiving UI benefits.338 The guidance clarified that individuals working full-time and being paid through PPP are not eligible for UI, and that individuals working part-time and being paid through PPP would be subject to certain state policies, including policies on partial unemployment, to determine their eligibility for UI benefits.
Background
The UI program is a federal-state partnership that provides temporary financial assistance to eligible workers who become unemployed through no fault of their own. States design and administer their own UI programs within federal parameters, and DOL oversees states’ compliance with federal requirements, such as ensuring states pay benefits when they are due. Regular UI benefits—those provided under the state programs in place before the CARES Act was enacted—are funded primarily through federal and state taxes levied on employers.339
338 Department of Labor, Unemployment Insurance Program Letter, No. 14-20, Change 1 (Aug. 12, 2020).
339 To be eligible for regular UI benefits, applicants generally must be able and available to work, and be actively seeking work. 42 U.S.C. § 503(a)(12).

Appendix I: Enclosures
Page 257 GAO-21-191
The CARES Act created three federally funded temporary UI programs that expanded benefit eligibility and enhanced benefits.340
1. Pandemic Unemployment Assistance (PUA), available through December 2020, generally authorizes up to 39 weeks of UI benefits to individuals not otherwise eligible for UI benefits, such as self-employed and certain gig economy workers, who are unable to work as a result of COVID-19.341
2. Federal Pandemic Unemployment Compensation (FPUC) generally authorized an additional $600 benefit through July 2020 that augmented weekly benefits available under the regular UI and CARES Act UI programs.342
3. Pandemic Emergency Unemployment Compensation (PEUC), available through December 2020, authorizes an additional 13 weeks of UI benefits to those who exhaust their regular UI benefits.343
On August 8, 2020, the President signed a memorandum directing the Department of Homeland Security’s Federal Emergency Management Agency (FEMA) to provide up to $44 billion in lost wages assistance (LWA).344 Pursuant to the presidential memorandum, upon receiving a FEMA grant, states and territories may provide eligible claimants $300 or
340 The CARES Act also addressed other aspects of the UI system, such as authorizing certain flexibilities for states to hire additional staff and to participate in Short -Time Compensation programs. In addition to the CARES Act, the Families First Coronavirus Response Act provided up to $1 billion in emergency grant funding to states in fiscal year 2020 for UI administrative purposes.
341 Pub. L. No. 116-136, § 2102, 134 Stat. at 313.
342 Pub. L. No. 116-136, § 2104, 134 Stat. at 318.
343 Pub. L. No. 116-136, § 2107, 134 Stat. at 323.
344 The White House, Memorandum on Authorizing the Other Needs Assistance Program for Major Disaster Declarations Related to Coronavirus Disease 2019 (Aug. 8, 2020). The additional benefits are funded by the Department of Homeland Security’s Disaster Relief Fund.

Appendix I: Enclosures
Page 258 GAO-21-191
$400 per week—which includes a $300 federal contribution—in addition to their UI benefits.345
Overview of Key Issues
The number of weekly initial claims for UI benefits remains persistently high, though at a lower level than early in the pandemic. UI benefits provide a vital safety net for unemployed individuals. DOL reported 723,105 initial claims for regular UI benefits and 298,154 initial claims for PUA benefits were submitted nationwide during the week ending November 7, 2020.346 The number of regular UI initial claims submitted in recent weeks is considerably lower than the peak of about 6.2 million submitted in the week ending April 4 (see figure). Inconsistent state reporting of PUA initial claims limits the conclusions that can be drawn about trends in that program. The general decline in overall initial claims suggests that workers are losing jobs at a slower rate nationwide than in the early weeks of the pandemic. However, the number of regular UI initial claims submitted each week has remained relatively steady since the week ending August 8, and remains considerably higher than pre-pandemic levels. For example, the 723,105 regular UI initial claims submitted during the week ending November 7, 2020—which does not include the 298,154 PUA initial claims—is about 3 times as high as the 238,996 submitted during the corresponding week in 2019.
345 To be eligible for LWA, individuals need to be receiving at least $100 per week in UI benefits, such as regular UI or PUA benefits, or in benefits from certain other programs. According to FEMA, states providing $400 per week in LWA would contribute $100 each week in state funds, while states providing $300 per week in LWA may count existing state funding used to pay regular UI benefits to satisfy the state match.
346 An initial claim is the first claim filed by an individual to determine eligibility for UI benefits after separating from an employer. Initial claims counts presented are not seasonally adjusted, and counts for the week ending November 7, 2020 reflect advance initial claims, which are preliminary and subject to revision. In some cases, advance initial claims represent estimates submitted by states. For example, in late September, California paused its acceptance of initial claims to reduce its backlog of claims and to implement tools to help prevent fraud in the program. As a result, California submitted estimated numbers of initial claims to DOL for the weeks ending September 26, October 3, and October 10. Because states did not implement the PUA program or begin reporting claims data at the same time, we do not identify a peak in PUA initial claims.
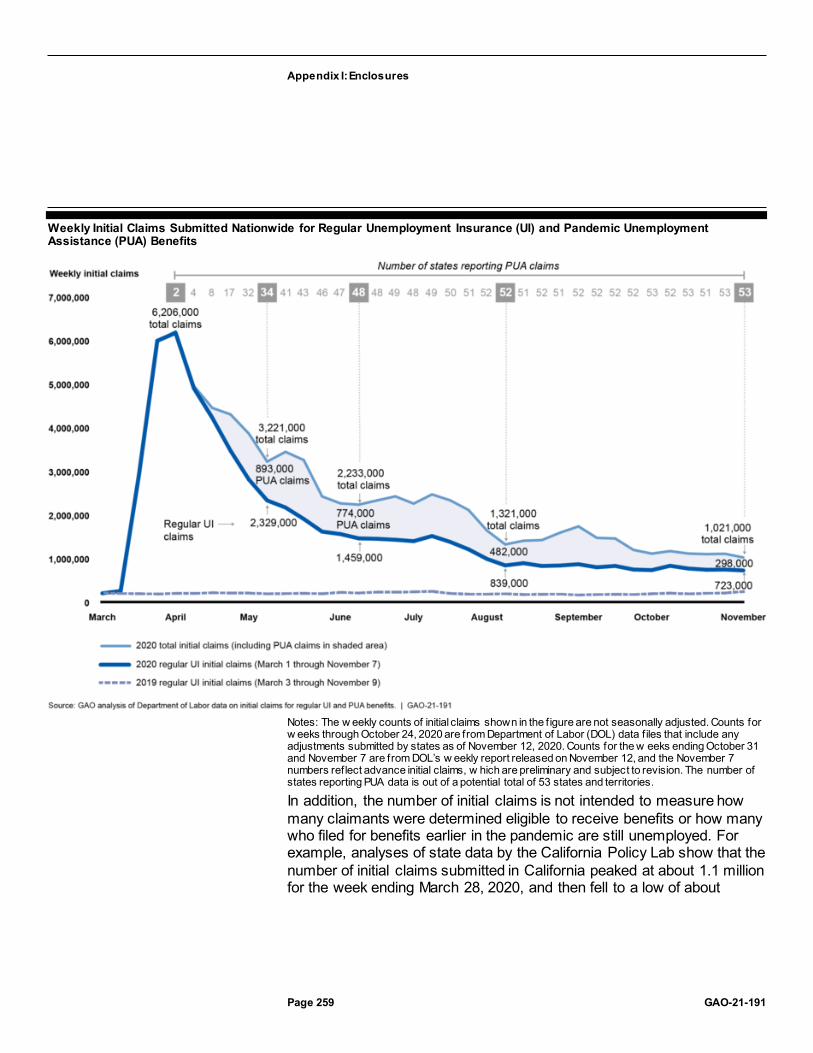
Appendix I: Enclosures
Page 259 GAO-21-191
Weekly Initial Claims Submitted Nationwide for Regular Unemployment Insurance (UI) and Pandemic Unemployment Assistance (PUA) Benefits
Notes: The w eekly counts of initial claims shown in the f igure are not seasonally adjusted. Counts for w eeks through October 24, 2020 are from Department of Labor (DOL) data f iles that include any adjustments submitted by states as of November 12, 2020. Counts for the w eeks ending October 31 and November 7 are from DOL’s w eekly report released on November 12, and the November 7 numbers reflect advance initial claims, w hich are preliminary and subject to revision. The number of states reporting PUA data is out of a potential total of 53 states and territories.
In addition, the number of initial claims is not intended to measure how many claimants were determined eligible to receive benefits or how many who filed for benefits earlier in the pandemic are still unemployed. For example, analyses of state data by the California Policy Lab show that the number of initial claims submitted in California peaked at about 1.1 million for the week ending March 28, 2020, and then fell to a low of about

Appendix I: Enclosures
Page 260 GAO-21-191
298,000 for the week ending May 23.347 However, because some individuals remain unemployed for multiple weeks and can submit claims retroactively, the number of initial claims is not necessarily equivalent to the number of unemployed individuals receiving benefits each week. In California, the number of individuals who received benefits for unemployment increased from about 3.1 million for the week ending March 28 to about 4.6 million for the week ending May 23, even as the number of initial claims declined.348 In addition, from early June through mid-July, the California Policy Lab also found that about 1 to 3 percent of PUA claimants and about 4 to 5 percent of regular UI claimants exited the program each week due to, for example, obtaining employment.
DOL’s characterization of state-reported continued claims as representing the number of individuals claiming benefits is not appropriate in the context of the pandemic. DOL’s weekly UI news releases include valuable state-reported data on claims volume, but they have improperly represented the number of unique individuals claiming UI benefits and the changes in these numbers from week to week. Each week, DOL publishes the number of continued claims submitted by states in all UI programs (i.e., weeks of unemployment claimed by individuals during a reporting period), and reports it as the total number of people claiming benefits in all programs.
While DOL officials told us that they have traditionally used the number of continued claims to represent the number of individuals claiming benefits because they were a close approximation of each other, various issues 347 The peak in initial claim submissions in California in the week ending March 28, 2020, was prior to any PUA claims being counted. Alex Bell, Thomas J. Hedin, Geoffrey Schnorr, and Till von Wachter, California Policy Lab, Policy Brief: An Analysis of Unemployment Insurance Claims in California During the COVID-19 Pandemic (California Policy Lab, Sept. 15, 2020). The California Policy Lab is an organization that facilitates partnerships between state and local policymakers and university researchers to conduct and share research and technical assistance on issues such as unemployment, according to its website.
348 Unlike DOL’s reporting of claims, the California Policy Lab’s analysis identified and counted actual individuals who filed regular UI or PUA claims as of August 29, 20 20 and also accounted for retroactive claims. Thus, in this case, if an individual filed a claim during the week ending August 29 that included retroactive claims for unemployment from the week ending May 23, onward, the individual was counted as an unempl oyed claimant in each week from May 23 through August 29. The number of individuals claiming UI or PUA benefits peaked at about 5.0 million the week ending May 2, 2020. The numbers presented are from data tabulations for figures and analysis in the Califor nia Policy Lab report that we received from the California Employment Development Department, Labor Market Information Division.

Appendix I: Enclosures
Page 261 GAO-21-191
arising from the pandemic have made this practice problematic—potentially overstating the number of individuals in certain circumstances and understating the number in others.
Prior to the pandemic, according to DOL officials, the number of continued claims approximated the number of people claiming benefits because each week individuals typically filed a claim for just the previous one week of continued unemployment.349 However, this has not been the case during the pandemic because of challenges implementing the newly created PUA program and backlogs in processing historic numbers of claims in many states. For example, for the week ending October 24, 2020, states reported about 21.2 million continued claims in all programs—about 6.8 million in the regular UI program, about 9.4 million in the PUA program, and about 4.9 million in other programs, such as the PEUC program.350 However, the number of continued claims is not equivalent to the number of individuals claiming benefits.
If an individual claims benefits for multiple weeks of unemployment during a single reporting period, each week is counted as a separate continued claim. This could happen if an individual was unemployed for multiple weeks before their application was processed—due to claims backlogs—or if the individual claimed benefits retroactively in the PUA program.351
Thus, by using claims counts to represent the number of people, individuals who submitted multiple claims are counted more than once in DOL’s estimate, which has been prevalent during the pandemic. For example, according to a news release by the California Employment Development Department, as of September 16, 2020, the state had a backlog of nearly 600,000 individuals who had applied for UI benefits and whose applications had not been processed for more than 21 days.
349 In some states, individuals certify continued unemployment on a biweekly schedule, and thus may submit claims for 2 weeks at a time.
350 The number of PEUC continued claims has increased in recent weeks, likely due to individuals exhausting their regular UI benefits as the length of the pandemic has extended. For example, DOL reported that PEUC continued claims increased from about 2.0 million in the week ending September 19, 2020, to about 4.1 million in the week ending October 24.
351 Benefit payments under PUA are retroactive, for weeks of unemployment starting on or after January 27, 2020, according to DOL. Thus, according to DOL officials, eligible individuals claiming PUA benefits at any time during the pandemic could have claimed retroactive weeks of benefits, which has occurred in part because of the time it took states to implement the new program.

Appendix I: Enclosures
Page 262 GAO-21-191
The reliability of DOL’s weekly reporting of claims data is also affected by inconsistent state reporting of PUA data, which has resulted in flawed week-to-week comparisons of total claims numbers. From April through October, different numbers of states reported PUA data in many weeks. For example, states started reporting PUA claims data at different times, depending on how quickly they were able to implement the new program and establish reporting processes. In addition, even after implementing the program, in certain weeks some states did not report data to DOL to include in its weekly news releases.
The inconsistency in the group of states reporting each week undermines meaningful comparisons over time and may have led DOL to inaccurately characterize changes in claims numbers in their weekly UI news releases. For example, in its July 23, 2020, publication, DOL reported that the number of continued claims in all programs for the week ending July 4 decreased by about 200,000 from the previous week. However, Arizona did not report PUA data for that week, after reporting almost 2.3 million claims the previous week. Had Arizona submitted data, DOL likely would have reported a significant increase in claims from the prior week instead of a decrease. Arizona stopped reporting data that week due to suspected fraud in the PUA program, according to DOL officials.
Potential fraud in the UI system, and particularly in the PUA program, according to DOL, further complicates counts, as some states’ claims numbers may be inflated due to fraudulent claims, while others’ numbers may not be. For example, Maine canceled almost 24,000 initial claims and 41,000 continued claims between late May and late June that it determined to be fraudulent, according to a state labor department news release.
Backlogs in states’ claims processing and the ability to claim benefits retroactively have resulted in individuals claiming multiple weeks of benefits in single reporting periods. Multi-week claims are especially prevalent in the PUA program because individuals accumulated weeks of unemployment as states implemented the new program. PUA continued claims make up a large part of DOL’s reported total number of people claiming benefits. However, analyzing data for 20 selected states, we found that the number of continued claims submitted in the PUA program through June 27, 2020, exceeded by almost 20 million the cumulative

Appendix I: Enclosures
Page 263 GAO-21-191
number of individuals who had submitted an initial claim since the program began (see figure).352
Over-reporting of Individuals Claiming Pandemic Unemployment Assistance (PUA)
352 We selected states from among the 26 that began reporting PUA initial claims to DOL within 1 week of the implementation date they reported to DOL. We excluded several of these states due to data reliability concerns. We calculated the states’ total initial claims submitted from the beginning of the program through the week ending June 27, 2020, and compared this to the number of continued claims submitted each week. Because individuals cannot submit a continued claim without having first been counted as an initial claim, the cumulative count of initial claims submitted represents an upper bound estimate of the number of individuals who could submit a continued claim in any period. The actual number of individuals would be lower than this estimate because some initial claims are denied during eligibility reviews and for other reasons, and some individuals exit the PUA program each week due to obtaining employment or for other reasons. Because initial claim denials and program exits occur each week, an estimate of cumulative initia l claims that does not account for these reductions is less accurate the more weeks it includes —i.e., the estimated count is increasingly higher than reality each week, thus underestimating the difference with the number of continued claims. For that reaso n, our analysis only runs through the week ending June 27, 2020.
Appendix I: Enclosures
Page 264 GAO-21-191
Notes: We selected the 20 states included in the f igure because they had started to report PUA initial claims to DOL w ithin 1 w eek of the implementation date they reported to DOL, and because of data reliability considerations. The differences shown are illustrative examples and represent how much higher the reported count of continued claims in a given w eek w as than the cumulative count of initial claims through that w eek. The cumulative count of initial claims represents an upper bound estimate of the number of individuals w ho could submit a continued claim in any period. The actual number of individuals w ould be low er than this estimate because some initial claims are denied during eligibility review s and for other reasons, and some individuals exit the PUA program each w eek due to obtaining employment or for other reasons. Because initial claim denials and program exits occur each w eek, an estimate of cumulative initial claims that does not account for these reductions is less accurate the more w eeks it includes—i.e., the estimated count is increasingly higher than reality each w eek, thus underestimating the difference with the number of continued claims. For that reason, our analysis only runs through the w eek ending June 27, 2020.
Similarly, in California—where claimants generally certify for 2 weeks of benefits at a time—analysis by the California Policy Lab suggests that the number of continued claims in the state consistently exceeded twice the number of individuals submitting those claims. For example, during the week ending August 8, 2020, the California Policy Lab found that about 2.2 million individuals submitted about 6.3 million continued claims—almost 2 million greater than the 4.4 million that might be expected based on the number of claimants.353 The excess claims likely reflect retroactive weeks claimed and demonstrate how counts of continued claims can cause over-reporting of the number of individuals claiming benefits. In this case, most of this over-reporting occurred in the PUA program. According to the California Policy Lab, PUA claimants, on average, filed claims for about 4 to 9 weeks of unemployment each week from early May through late August. Over the same period, regular UI claimants, on average, filed for slightly more than 2 weeks of benefits each week.354
To understand the supportive role UI and PUA benefits are playing in the economy during the pandemic, reliable data are needed on both the number of new claimants each week and the number of continuing claimants who are relying on program benefits. Federal standards for internal control state that management should process data into quality information that is complete, accurate, and readily available to the intended audience when needed. DOL has continued to collect and report claims data in the ways it has historically, which provides some valuable information about the volume of claims submitted. However, because of 353 California Policy Lab, An Analysis of Unemployment Insurance Claims in California During the COVID-19 Pandemic. The numbers presented are from data tabulations for figures and analysis in the California Policy Lab report that we received from the California Employment Development Department, Labor Market Information Division.
354 California Policy Lab, An Analysis of Unemployment Insurance Claims in California During the COVID-19 Pandemic. The numbers presented are from data tabulations for figures and analysis in the California Policy Lab report that we received from the California Employment Development Department, Labor Market Information Division.

Appendix I: Enclosures
Page 265 GAO-21-191
the atypical unemployment environment during the pandemic, the use of these traditional methods has resulted in the inaccurate reporting of information about the number of individuals receiving benefits. States already collect information to identify and pay unique individuals claiming UI benefits, and could use this information to provide DOL with an accurate weekly count of individuals submitting initial and continued claims, along with the number of claims submitted.
Without an accurate accounting of the number of individuals who are relying on UI and PUA benefits in as close to real-time as possible, policy makers may be challenged to respond to the crisis at hand. In addition, with the looming expiration of the PUA program in December 2020, policy makers may need better information about how many individuals face a loss of benefits and what segments of the population and the economy may be most affected.
Average weekly regular UI and PUA benefits vary by state, and the majority of states have been paying PUA claimants the minimum allowable benefit instead of the amount they are eligible for based on prior earnings. The average regular UI benefits paid by states in September ranged from about $181 to about $466 per week, with the median state paying an average of $295 per week. Among the 41 states reporting PUA data for September, average benefits paid ranged from about $114 to about $357 per week.355 However, the average weekly PUA benefits reported by a majority of these states were close to their minimum benefit amounts, as set by DOL guidance.356
Specifically, 27 of the 41 states reported average weekly PUA benefits paid that were within 25 percent of the state’s minimum PUA benefit 355 We calculated average benefit amounts for regular UI and PUA by dividing the state -reported monthly amounts for total compensation paid by total weeks compensated. These amounts do not include supplemental benefits provided by FPUC or LWA. Benefit amounts are based on data reported by states as of November 9, 2020, at which point one state had reported PUA data for October. Thus, we analyzed benefit payment data for September. The following states either did not report PUA monthly data in September or were excluded from our analysis due to data reliability concerns: Alabama, Alaska, Delaware, Florida, Illinois, Indiana, New Hampshire, Puerto Rico, South Carolina, South Dakota, Vermont, and Wyoming.
356 The minimum benefit for PUA aligns with the minimum benefit for the Disaster Unemployment Assistance program and is set in Unemployment Insurance Program Letter (UIPL) 3-20. Department of Labor, Minimum Disaster Unemployment Assistance (DUA) Weekly Benefit Amount: January 1 - March 31, 2020, UIPL 3-20 (Washington, D.C.: Dec. 12, 2019).

Appendix I: Enclosures
Page 266 GAO-21-191
amount; 10 of these states reported average benefits within 10 percent of the minimum. This suggests that many individuals in these states are receiving the minimum benefit—because the average is close to the minimum. For example, in Maine, the PUA minimum benefit amount is $172 per week and the state reported average benefits paid in September of about $194 per week.357 According to a July 2020 Maine Department of Labor news release, in order to expedite payments, individuals initially received the minimum PUA benefits, and the state planned to update benefit amounts based on tax information, starting at the end of July. If a new benefit amount was determined, individuals would receive retroactive benefits payments for all weeks previously paid.
DOL officials told us that to facilitate implementation of the new program most states decided to initially pay PUA claimants the minimum allowable benefit, rather than calculate benefit amounts based on claimants’ documentation of their prior earnings. States have previously used this approach to pay benefits more expediently under the Disaster Unemployment Assistance (DUA) program, according to DOL officials. DOL guidance notes that when individuals submit sufficient documentation of wages, states must immediately recalculate their weekly benefits.358 States should pay the difference between the amount previously paid and the amount owed for all weeks of unemployment that an individual files during the Pandemic Assistance Period. Based on DUA regulations, states must pay the full PUA benefit amount with the greatest promptness that is administratively feasible.359 DOL officials said they did not know how many states have begun recalculating individuals’ benefits and making these payments. According to California’s website, the state initially paid claimants the minimum PUA benefit and, as of October 30, 2020, was recalculating benefit payments based on individuals’ total
357 Some states reported average weekly PUA benefits paid in certain months that were slightly lower than their minimum benefit amount. This may be because PUA benefit payment data include full and partial claims, and partial benefits may be lower than the minimum allowable benefit amount. DOL does not collect data on how many partial weeks of PUA benefits are claimed. We examined data for the regular UI program and found that across states, about 87 percent of weeks compensated in September 2020 were for full weeks of total unemployment.
358 Department of Labor, CARES Act of 2020 – Pandemic Unemployment Assistance (PUA) Program Reporting Instructions and Questions and Answers, UIPL 16 -20, Change 1 (Washington, D.C.: Apr. 27, 2020).
359 See 20 C.F.R. § 625.9(e). Under the CARES Act, the regulations for DUA generally apply to PUA. Pub. L. No. 116-136, § 2102(h), 134 Stat. 281, 317.

Appendix I: Enclosures
Page 267 GAO-21-191
earnings in 2019. The difference in benefit amounts will be back-paid to claimants, according to the state website.
The expiration of supplemental payments for UI claimants may mean that some households’ income no longer exceeds poverty guidelines. Claimants’ households vary in size and may have multiple earners. In addition, the UI system is intended to be a temporary safety net for unemployed individuals. In September, not including supplemental payments, the average weekly regular UI benefits paid in 13 states and the average weekly PUA benefits paid in 29 of the 41 states reporting data were lower than the approximately $245 per week needed to remain above the 2020 poverty guidelines for a 1-person household (annual income of $12,760).360 Supplemental payments issued under FPUC and LWA through early September, at the latest, exceeded the weekly amount needed for a 1-person household to remain above the 2020 poverty guidelines. However, those supplemental benefits have ended. In addition, with the scheduled expiration of certain CARES Act benefits in December 2020, PUA claimants who remain unemployed may face additional hardship.
For weeks of unemployment starting in late March through the end of July, eligible claimants received an additional $600 weekly benefit under FPUC. After FPUC expired at the end of July, eligible claimants in most states could receive an additional $300 or $400 per week in supplemental payments as LWA. As of November 9, 2020, 49 states, the District of Columbia, and four territories were approved for funding to provide LWA, with grants totaling $42.8 billion of $44 billion available, according to FEMA.361 FEMA approved states and territories to pay at most 6 weeks of benefits, retroactively, beginning with claims filed for the week ending August 1, 2020, and continuing through the week ending September 5.
An increasing number of states are taking out federal loans to pay UI benefits. As the number of regular UI continued claims remains
360 The poverty guidelines are issued each year by the Department of Health and Human Services to be used for administrative purposes, such as dete rmining financial eligibility for certain federal programs; the $12,760 poverty guideline is for the 48 contiguous states and the District of Columbia. For household sizes of 2, 3, and 4 people, the 2020 poverty guideline is an annual income of $17,240, $21,720, and $26,200 per year (about $332, $418, or $504 per week), respectively.
361 The four territories are the Commonwealth of the Northern Mariana Islands, Guam, Puerto Rico, and the U.S. Virgin Islands.

Appendix I: Enclosures
Page 268 GAO-21-191
historically high, more states are facing increased financial strain, and some have sought loans from the federal government to pay UI benefits.362 Since we last reported in September 2020, seven additional states have taken out federal loans to pay UI benefits. As of November 9, 2020, more than 7 months since the March 2020 spike in UI claims, 20 states and the U.S. Virgin Islands held federal loans totaling about $40.2 billion. This total loan balance is about equal to the approximately $40.2 billion held by 30 states and territories at the end of 2010, the height of borrowing after the 18-month long 2007-2009 recession and early recovery.363 If unemployment remains high, it is likely that additional states may have to take out loans to pay UI benefits, and states with existing loans may need to borrow more.
States may take years to reestablish financial solvency in their UI programs. For example, 19 of the 30 states and territories holding the approximately $40.2 billion in federal loans to pay UI benefits at the end of 2010 took 4 or more years to repay the loans.364 With some states already exceeding the amount they borrowed then, it is likely that states may take years to repay federal loans taken out to pay UI benefits during the pandemic.
DOL continues to support states’ implementation of CARES Act UI programs; however, the DOL OIG has reported that additional actions would strengthen UI program integrity. Since March, according to DOL, 362 While the CARES Act UI programs are federally funded, regular UI is primarily funded through state and federal taxes on employers. When a state exhausts the funds available for regular UI benefits, it may borrow from the federal government. According to DOL data, even before the pandemic, many states were not taking in enough UI tax revenue to satisfy the solvency standard specified in DOL regulations providing for interest -free loans to states. See 20 C.F.R. § 606.32.
363 DOL compiles and publishes historical data on outstanding federal loan balances in its annual program and financial data handbook, ETA Financial Data Handbook 394. The 20 states with outstanding federal loans to pay UI benefits are California, Colorado, Connecticut, Delaware, Georgia, Hawaii, Illinois, Indiana, Kentucky, Louisiana, Massachusetts, Minnesota, New Jersey, New Mexico, New York, Ohio, Pennsylvania, Texas, Virginia, and West Virginia. According to DOL, the U.S. Virgin Islands had a residual loan balance of about $0.06 billion at the beginning of 2020 left from the 2007 -2009 recession. According to the National Bureau of Economic Research, the 2007 -2009 recession began in December 2007 and ended in June 2009.
364 The loan data we analyzed is a year-end snapshot. Thus, we counted repayment time from the year a state first had a loan balance to the year the state no longer had a balance. For example, if a state had a loan balance that first appeared in 2009 and last appeared in 2012, we counted the state as having taken 4 years to repay the loan. Almost all states increased their loan balances after the first year a loan appeared, before beginning to repay the loan.
Appendix I: Enclosures
Page 269 GAO-21-191
the agency has addressed program integrity in numerous guidance documents and has taken steps to reinforce its importance, such as through calls with states, coordinated workgroups, and a partnership with the UI Integrity Center to provide states and other partners with technical assistance, training, and other program integrity resources. The UI Integrity Center operates an Integrity Data Hub (IDH), a multi-state data system that states can use to support the prevention and detection of fraud. DOL issued three notices since late August to encourage states to use the UI Integrity Center’s resources and remind them of tools available to prevent and detect improper and potentially fraudulent payments.
In September, according to DOL, the Secretary of Labor sent letters to governors requesting their leadership to implement key strategies to prevent and detect fraud in the UI system, and DOL hosted a call with state workforce agencies to discuss the importance of addressing UI fraud. Also in September, DOL’s regional offices began formal monitoring reviews of the CARES Act UI programs. These reviews will include many questions related to program integrity and improper payment prevention, detection, and recovery. DOL is also working with the DOL OIG to ensure states are actively working with the OIG and other federal law enforcement entities to prevent and detect fraud.
In August and October, the DOL OIG issued reports that addressed UI program integrity. The August report acknowledged that while DOL is leveraging existing tools to combat fraud, more needs to be done.365 For example, the report stated that DOL should do more to ensure that states are effectively using existing program integrity tools, such as the State Information Data Exchange System, to combat fraud and improper payments. In addition, the report noted that DOL could provide additional guidance to further reduce the risk of fraud or improper payments related to PUA program eligibility and individuals refusing return to work opportunities.
In October, the DOL OIG issued a report on actions states are taking to deter and detect fraud relating to the self-certification process in their PUA programs.366 These actions include using predictive analytics to 365 Department of Labor Office of the Inspector General, COVID-19: More Can Be Done to Mitigate Risk to Unemployment Compensation Under the CARES Act, 19-20-008-03-315 (Washington, D.C.: Aug. 7, 2020).
366 Department of Labor Office of the Inspector General, COVID-19: States Cite Vulnerabilities in Detecting Fraud While Complying with the CARES Act UI Program Self-Certification Requirement, 19-21-001-03-315 (Washington, D.C.: Oct. 21, 2020).

Appendix I: Enclosures
Page 270 GAO-21-191
identify suspicious claims and cross-matching with other databases to verify eligibility. The OIG found that regardless of actions taken to detect and deter fraud, some states reported that fraud vulnerabilities still exist, such as those inherent to self-certification or inadequate fraud screen filters, tools, and program controls. The DOL OIG continues to review UI programs as part of its Pandemic Response Oversight Plan.
Potentially large fraud schemes have prompted several federal agencies to assist states with their investigations. As of November 5, 2020, DOL’s OIG had publicly released information on 14 ongoing investigations of UI fraud during the pandemic that the agency was supporting, some of which concern millions of taxpayer dollars potentially paid improperly, according to the OIG. DOL’s OIG is conducting these investigations in coordination with state workforce agencies and other federal agencies. For example, in September, the Maryland Department of Labor reported it had coordinated with the DOL OIG and the U.S. Attorney’s Office to uncover a scheme involving about 45,800 UI claims that the state determined were fraudulent. According to the state press release, blocking the fraudulent claims saved hundreds of millions of dollars. In September, DOL provided $100 million in funding to support state efforts to combat fraud and recover improper payments, specifically in the PUA and PEUC programs. States may use this funding to hire or train investigators, or to implement tools to prevent, detect, and recover fraudulent payments.
The U.S. Secret Service is also conducting UI fraud investigations in coordination with various federal, state, and local partners, including the DOL OIG. As of October 19, 2020, since approximately March 2020, the Secret Service had established almost 150 investigations related to UI fraud, arrested 7 individuals, seized $6.4 million, and coordinated the return of $750 million in potentially fraudulent UI benefits to state UI programs, according to the agency.367 In addition, the Department of Justice established the National UI Fraud Task Force to coordinate efforts across the federal government. In September, the National UI Fraud Task Force issued a consumer protection guide, advising the public on what to
367 These investigations fall within Secret Service’s jurisdiction to investigate cyber -enabled financial crimes, according to the agency.

Appendix I: Enclosures
Page 271 GAO-21-191
do if they suspect their identity has been exploited by UI fraudsters, among other things.368
State workforce agencies also continue to identify and respond to UI fraud. For example, in June the Michigan Unemployment Insurance Agency stopped benefit payments to approximately 340,000 active accounts suspected of fraud. The state agency worked with fraud experts and law enforcement to examine these claims—where claims were identified as legitimate, the agency resumed payments. In September, California paused new UI applications for two weeks to, in part, combat fraud in the system. During this 2-week reset, the California Employment Development Department implemented a new identity verification tool, according to a press release from the department.
Agency Comments
We provided the Department of Homeland Security (DHS), DOL, and the Office of Management and Budget (OMB) with a draft of this enclosure. DHS and OMB did not have any comments on this enclosure. DOL provided written comments, reproduced in appendix VII, and technical comments, which we incorporated as appropriate.
In its comments, DOL agreed with our recommendation to revise its weekly news releases, and partially agreed with our recommendation to pursue options to report the actual number of distinct individuals claiming benefits, starting from January 2020 onward.
· DOL stated it plans to clarify in its weekly news releases that the numbers it reports for weeks of unemployment claimed do not accurately estimate the number of unique individuals claiming benefits.
· DOL agreed with our recommendation to pursue options to report the actual number of distinct individuals claiming UI benefits. However, DOL did not agree with the retroactive effective date of the reporting. DOL indicated that state UI programs may face challenges implementing any new reporting requirements, particularly retroactively. In addition, DOL stated that the CARES Act UI provisions are scheduled to expire in December 2020 and noted that requirements to provide notice and comment for the new data
368 Department of Justice, National Unemployment Insurance Task Force, Unemployment Insurance Fraud Consumer Protection Guide (Washington, D.C: Sept. 21, 2020).

Appendix I: Enclosures
Page 272 GAO-21-191
collection could take up to a year to complete, further reducing the utility of retroactive reporting.
We maintain that DOL should pursue options to report the actual number of distinct individuals claiming UI benefits, retroactive to January 2020. These data are vital to understanding how many individuals are receiving UI benefits, as well as the size of the population supported by the UI system during the pandemic. We acknowledge that certain provisions of the CARES Act are scheduled to expire in December 2020 and that the process to begin collecting new data may take months. However, our recommendation to pursue options to report on the number of distinct individuals claiming benefits applies to the CARES Act UI programs as well as the regular UI program, which is not expiring.
Even if the information is unavailable for some time, reporting numbers retroactively, beginning with calendar year 2020, will help DOL and policy makers identify lessons learned about the administration and utilization of regular and expanded UI benefits programs during the pandemic. As of September 30, 2020, hundreds of billions of dollars have been obligated for UI programs as part of COVID-19 relief funds. Given this substantial investment, an accurate accounting of the size of the population supported by this funding, even retroactively, may be critical to understanding the efficiency and effectiveness of the nation’s response to unemployment during the pandemic.
DOL has reported flawed estimates of the number of individuals receiving benefits each week throughout the pandemic. This record should be corrected so that future analyses of the effects of expanded UI benefits rely on accurate information. Retroactive data collection and reporting would provide an opportunity for future analyses to identify lessons learned from the pandemic, which could be valuable in considering policy solutions to address any future economic disruptions of a similar magnitude. In addition, establishing a way of accurately reporting the number of individuals claiming benefits now would help ensure DOL is ready to report this information in real time in the future, especially in times of increased demand and if the expanded UI programs are reauthorized.
We encourage DOL to pursue options to report the actual number of individuals claiming benefits in the most feasible and least burdensome way. Collecting already available data from states is one way DOL can address the recommendation, but DOL could also develop other ways of gathering and reporting this information.

Appendix I: Enclosures
Page 273 GAO-21-191
GAO’s Methodology
To conduct this work, we analyzed regularly reported DOL data for calendar years 2019 and 2020, with our most recent data obtained as of November 12, 2020. For our comparison of PUA continued claims and cumulative initial claims, we analyzed DOL data for 20 states that began reporting PUA initial claims to DOL soon after they reported implementing the program and that had reliable data. We also used California state data from the California Policy Lab’s analyses; reviewed state agency documents, relevant federal laws, DOL guidance, and DOL Office of Inspector General reports; and interviewed DOL officials about program data and agency actions. We determined the various data we used were sufficiently reliable for the purposes of this report.
Contact information: Thomas Costa, (202) 512-7215, [email protected]
Related GAO Product
Standards for Internal Control in the Federal Government. GAO-14-704G. Washington, D.C.: Sept. 10, 2014.
Economic Impact Payments
The Department of the Treasury and the Internal Revenue Service extended the online filing deadline for economic impact payments and have conducted additional outreach, but could take additional steps to monitor the outcomes of their outreach efforts to potentially eligible economic impact payment recipients who have yet to file for a payment.
Entity involved: Internal Revenue Service, within the Department of the Treasury
Recommendations for Executive Action
The Secretary of the Treasury, in coordination with the Commissioner of Internal Revenue, should begin tracking and publicly reporting the number of individuals who were mailed an economic impact payment notification letter and subsequently filed for and received an economic impact payment, and use that information to inform ongoing outreach and communications efforts.

Appendix I: Enclosures
Page 274 GAO-21-191
Key Considerations and Future GAO Work
We have made three recommendations related to economic impact payments (EIP). In June, we recommended that the Commissioner of Internal Revenue should consider cost-effective options for notifying ineligible recipients on how to return payments. The Internal Revenue Service (IRS) agreed with this recommendation and continues to take steps to recover payments.
In September, we recommended that the Secretary of the Treasury, in coordination with the Commissioner of Internal Revenue, should update and refine the estimate of eligible recipients who have yet to file for an EIP to help target outreach and communications efforts. We also recommended that the Secretary of the Treasury, in coordination with the Commissioner of Internal Revenue, should make estimates of eligible recipients who have yet to file for an EIP, and other relevant information, available to outreach partners to raise awareness about how and when to file for an EIP. Treasury and IRS neither agreed nor disagreed with the recommendations.
The Department of the Treasury (Treasury) and IRS took actions that are consistent with our recommendations, such as using tax return information to identify and notify nearly 9 million individuals that they may be eligible for an EIP. However, Treasury and IRS have not updated estimates of those who could be eligible, but have yet to file. Without an updated estimate, Treasury, IRS, other federal agencies, and IRS’s outreach partners may be limited in their ability to appropriately scale and target outreach and communication efforts to additional individuals who may be eligible for a payment.
IRS extended the deadline for using its Non-Filers Tool to November 21, 2020; the online portal had allowed individuals who do not normally file a tax return to claim an EIP. In September, Treasury and IRS sent nearly 9 million notices to non-filers to raise awareness about EIPs. In addition, the IRS set November 10 as ‘National EIP Registration Day’ in which the agency and outreach partners across the country launched a final push to encourage non-filers to register to receive an EIP. However, Treasury and IRS are not monitoring the effectiveness of the outreach notices. If the agencies knew how many non-filers who received notices ultimately received an EIP, then they could better determine whether additional or targeted outreach is needed for the 2021 filing season.

Appendix I: Enclosures
Page 275 GAO-21-191
Our work on EIPs is ongoing. We will continue to examine Treasury and IRS efforts to identify and notify individuals about their eligibility for the EIP and their efforts to recoup payments sent to ineligible individuals, and we will review how many taxpayers claim the EIP as part of their 2020 tax filing. We will also examine challenges eligible recipients faced filing for an EIP, including through the online Non-Filers Tool.
Background
The CARES Act included direct payments for eligible individuals to address financial stress due to the pandemic. These Economic Impact Payments (EIP) provide up to $1,200 per eligible individual or $2,400 for individuals filing a joint tax return, plus up to $500 per qualifying child.369
The payment phases out gradually based on adjusted gross income (AGI). The payments can be offset by the federal government only to collect delinquent child support obligations.370 Treasury and IRS have been working together to identify eligible recipients and process payments.371
As of September 30, 2020, Treasury and IRS had disbursed over 165.8 million payments to individuals, totaling $274.7 billion.372 According to IRS data, more than 26 million non-filers received a payment, including around 21 million who received an automatic payment and more than 5 million non-filers who used the online tool to receive an EIP.
369 Pub. L. No. 116-136, 134 Stat. 281, 335–340 (2020) (to be codified at 26 U.S.C. § 6428). These payments are in an advance refund for a tax year 2020 tax credit. The CARES Act refers to this credit and the advance refund as Recovery Rebates for Individuals. IRS refers to the advance refunds as Economic Impact Payments.
370 The Economic Impact Payments can be offset through the Treasury Offset Program (TOP) only to collect delinquent child support obligations that have been referred by the state to TOP.
371 IRS sends payment files to Treasury’s Bureau of the Fiscal Service, which then processes the payments.
372 The volume of payments is taken from the IRS Master File and does not include reversals or payments to residents of territories. The amount of payments is taken from the IRS general ledger and includes reversals and $4.6 billion in payments to the U.S. Territories.

Appendix I: Enclosures
Page 276 GAO-21-191
Number of Filers and Non-Filers Issued an Economic Impact Payment as of September 30, 2020
Note: Volumes reflect the latest cycle and payment type in w hich an economic impact payment w as paid to an individual. Likew ise, payments are the net of all payment attempts and reversals. Non-filers may receive more than one of the relevant government benefits, and therefore are counted multiple times even though they received a single EIP.
Overview of Key Issues
Eligible individuals who have not yet received an EIP were given extra time to file for one, after Treasury and IRS extended the deadline for using the online Non-Filers Tool from October 15, 2020, to November 21, 2020. Treasury and IRS have continued outreach efforts to potentially eligible individuals who had yet to file for an EIP, but they have not updated their estimate of individuals who have not filed. Therefore, it is not clear how many eligible individuals missed the deadline and remain at risk of not getting a payment in 2020.373
Treasury and IRS used information that they have on reportable payments to individuals from third parties such as payroll processors and banks to identify and notify individuals who could potentially be eligible for
373 Eligible individuals who do not receive a payment may claim a 2020 recovery r ebate credit on their Tax Year 2020 return filed in 2021.

Appendix I: Enclosures
Page 277 GAO-21-191
an EIP.374 Starting on September 17, 2020, IRS sent a notice to nearly 9 million individuals who had not received an EIP and were potentially eligible. The notice explained who is eligible for an EIP and provided instructions about how to claim an EIP.375
Treasury, in an effort to assist other federal agencies and IRS’s outreach partners in appropriately scaling and targeting outreach and communication efforts to individuals who may be eligible for an EIP, posted publicly and shared with these agencies and organizations a count broken down by state and zip code of individuals who were mailed a notice.376 While those actions are significant, we maintain that Treasury and IRS should update and refine the estimate of eligible recipients who have yet to receive an EIP. An updated estimate will help Treasury, IRS, and Congress better understand the magnitude of the eligible population that has not received an EIP. This information can also inform and support ongoing outreach efforts.
Further, Treasury and IRS officials initially said they did not plan to track and analyze the outcomes of their EIP notice-mailing strategy until February or March 2021. According to federal standards for internal control, management should monitor activities and periodically evaluate the quality of information received to achieve its objective.377 Treasury officials said they had other priorities—namely, starting the 2020 tax filing season, which usually begins at the end of January, and producing estimates for the administration’s budget. After that, they said they could analyze data on the number of individuals who were mailed a notice and subsequently filed for and received an EIP. However, in response to a 374 According to Treasury officials, Treasury identified potentially EIP eligible individuals using the following information returns from Tax Year (TY) 2019 or TY 2018, W-2, Wage and Tax Statement; Form 1095-A, Health Insurance Marketplace Statement; Form 1095-B, Health Coverage; Form 1095-C, Employer-Provided Health Insurance Offer and Coverage; Form 1099-MISC, Miscellaneous Income; Form 1099-R, Distributions From Pensions, Annuities, Retirement or Profit-Sharing Plans, IRAs, Insurance Contracts, etc.; Form 1098-T, Tuition Statement; Form 1098-E, Student Loan Interest Statement; and Form SSA-1099, Social Security Benefit Statement.
375 To view the notice, see https://www.irs.gov/pub/irs-pdf/n1444aes.pdf, accessed October 21, 2020.
376 Internal Revenue Service, https://www.irs.gov/newsroom/irs-releases-state-by-state-breakdown-of-nearly-9-million-non-filers-who-will-be-mailed-letters-about-economic-impact-payments, accessed October, 21, 2020 and https://www.irs.gov/pub/irs-utl/number-of-eip-letter-recipients-by-state-and-zip-code.xlsx, accessed October 30, 2020
377 GAO, Standards for Internal Control in the Federal Government, GAO-14-704G (Washington, D.C.: Sept. 10, 2014).

Appendix I: Enclosures
Page 278 GAO-21-191
draft of this enclosure, Treasury said that it planned to start the analysis and tracking in January 2021
Timely analysis would provide Treasury and IRS with data to assess the effectiveness of their notice strategy and redirect resources as needed to other outreach and communication efforts. For example, we analyzed data from the Non-Filer’s Tool, which showed an overall increase in use after IRS sent the notices. This increase suggests that the notices may have been a contributing factor.
Number of Non-Filers Who Used IRS Non-Filers Tool to File for and Received an Economic Impact Payment
Note: Data as of November 6, the most recent date for w hich IRS had data at the time this report w as issued.
Additional analysis on the part of Treasury and IRS could potentially provide more information that Treasury and IRS could use to determine if their strategy was more effective among certain populations. For example, Treasury and IRS could compare performance across locations, points in time, or subgroups of the population to identify important variations in performance. They could share this information with their outreach partners to amplify their message and bolster outreach efforts where needed.
Appendix I: Enclosures
Page 279 GAO-21-191
In those areas where notices are not leading to an increase in the number of people filing for an EIP, Treasury and IRS could use this information to develop alternative strategies for reaching potential recipients. Although the Non-Filers Tool deadline has passed, eligible non-filers can still file for an EIP by filing a 2020 tax return before April 15, 2021. By delaying their analysis of the EIP notice-mailing strategy, Treasury and IRS are missing an opportunity to use their data to determine whether the strategy is effectively reaching those who are outside the tax system and likely vulnerable and in need of an EIP.
IRS worked with its community outreach partners to raise awareness about the Non-Filers Tool deadline and ways in which non-filers can file for an EIP in 2021. For example, IRS set November 10 as National EIP Registration Day, an effort to broadcast information about how to file for an EIP in advance of the November 21 Non-Filers Tool deadline. According to IRS officials, IRS worked with its partners inside and outside of the tax community to try to reach eligible non-filers, with a focus on low-income and other underserved communities. To support the ongoing effort as well as “National EIP Registration Day,” IRS worked with its partners to translate and make available EIP information and resources in 35 languages.
Representatives from IRS outreach partners we spoke with said IRS took certain actions that were helpful to the communities they support. For example, two partners commended IRS’s decision to reopen the registration period for qualifying children, stating that the decision positively impacted many federal beneficiaries, such as veterans and Social Security recipients.378 However, partners suggested that IRS could improve its outreach to hard-to-reach non-filers by coordinating with state benefit agencies and by increasing its frequency of communication with organizations that work directly with these populations, namely low-income or homeless communities.
According to IRS officials, they have been working with other federal agencies, through the Council on Economic Mobility, which includes the Departments of Agriculture and Health and Human Services, among others, and asking those contacts to push out their EIP materials to their state and local contacts. IRS officials also said they have been 378 In September, we reported that IRS reopened the registration period for federal benefits recipients who had not previously received $500 per qualifying child. Opening the registration period and extending it by six weeks allowed more eligible recipients to seek the financial relief to which they were entitled and owed by law.

Appendix I: Enclosures
Page 280 GAO-21-191
conducting train-the-trainer sessions with social services organizations. These sessions are intended to show the organizations how the Non-Filers Tool works, so the organizations can assist their clients.
In July 2020, we tested 289 EIP transactions processed by IRS between April 10 and May 29, 2020.379 We found that IRS’s controls over the processing of EIP transactions were operating effectively; however, we identified instances in which IRS erroneously disbursed EIPs of up to $500 for children who did not have valid identification numbers.380
Further, we found one instance in which IRS did not disburse an EIP to a deceased individual’s spouse, who was eligible for the payment.381 To address erroneous payments of EIPs, IRS posted instructions for returning payments on its Economic Impact Payment Information Center website.382
IRS continues to correct underpayments and other errors (e.g., disbursements to spouses of deceased individuals) for EIPs it has already sent. For example, the table below shows the groups that had received an incorrect payment, the estimated size of that group, and the date IRS sent the corrected payment amount.
379 This testing was performed in connection with our audit of IRS’s FY20 financial statements and consisted of a monetary unit sample of 112 EIPs as well as 177 EIPs that were greater than or equal to $8,000.
380 Pub. L. No. 116-136, div. A, § 2201, 134 Stat. 281, 335–340 (Mar. 27, 2020) (codified at 26 U.S.C. § 6428(g)). This CARES Act provision prohibits a payment to a taxpayer of up to $500 for a child without a valid identification number.
381 IRS is aware of the issue and, as noted in the table Groups That Can Expect Corrected Economic Impact Payment (EIP) in 2020, has planned to disburse corrected EIPs to eligible spouses of deceased individuals.
382 The Economic Impact Payment Information Center website is https://www.irs.gov/coronavirus/economic-impact-payment-information-center, updated October 6, 2020.
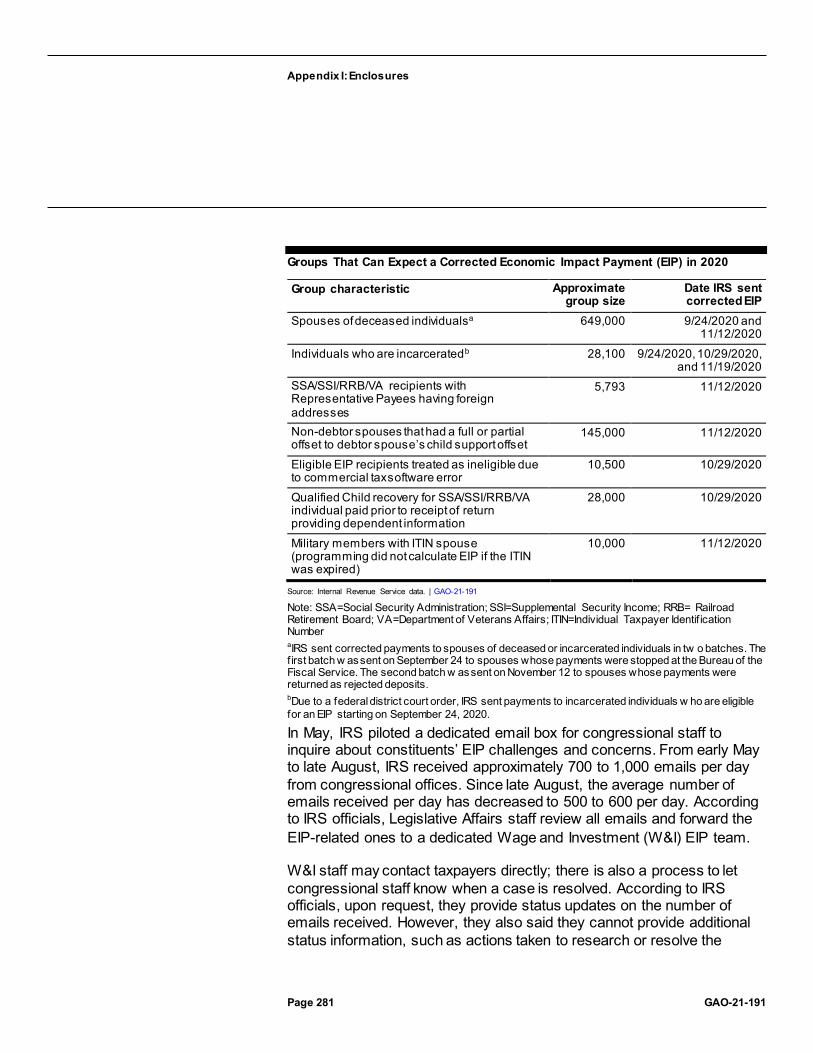
Appendix I: Enclosures
Page 281 GAO-21-191
Groups That Can Expect a Corrected Economic Impact Payment (EIP) in 2020
Group characteristic Approximate group size
Date IRS sent corrected EIP
Spouses of deceased individualsa 649,000 9/24/2020 and 11/12/2020
Individuals who are incarceratedb 28,100 9/24/2020, 10/29/2020, and 11/19/2020
SSA/SSI/RRB/VA recipients with Representative Payees having foreign addresses
5,793 11/12/2020
Non-debtor spouses that had a full or partial offset to debtor spouse’s child support offset
145,000 11/12/2020
Eligible EIP recipients treated as ineligible due to commercial tax software error
10,500 10/29/2020
Qualified Child recovery for SSA/SSI/RRB/VA individual paid prior to receipt of return providing dependent information
28,000 10/29/2020
Military members with ITIN spouse (programming did not calculate EIP if the ITIN was expired)
10,000 11/12/2020
Source: Internal Revenue Service data. | GAO-21-191
Note: SSA=Social Security Administration; SSI=Supplemental Security Income; RRB= Railroad Retirement Board; VA=Department of Veterans Affairs; ITIN=Individual Taxpayer Identif ication Number aIRS sent corrected payments to spouses of deceased or incarcerated individuals in tw o batches. The f irst batch w as sent on September 24 to spouses whose payments were stopped at the Bureau of the Fiscal Service. The second batch w as sent on November 12 to spouses whose payments were returned as rejected deposits. bDue to a federal district court order, IRS sent payments to incarcerated individuals w ho are eligible for an EIP starting on September 24, 2020.
In May, IRS piloted a dedicated email box for congressional staff to inquire about constituents’ EIP challenges and concerns. From early May to late August, IRS received approximately 700 to 1,000 emails per day from congressional offices. Since late August, the average number of emails received per day has decreased to 500 to 600 per day. According to IRS officials, Legislative Affairs staff review all emails and forward the EIP-related ones to a dedicated Wage and Investment (W&I) EIP team.
W&I staff may contact taxpayers directly; there is also a process to let congressional staff know when a case is resolved. According to IRS officials, upon request, they provide status updates on the number of emails received. However, they also said they cannot provide additional status information, such as actions taken to research or resolve the

Appendix I: Enclosures
Page 282 GAO-21-191
inquiry, because the volume of emails received has been overwhelming. The congressional inbox is one of several options that individuals can use to get information on the status of their EIP; other options include contacting the Taxpayer Advocate, the Get My Payment website, or the helpline number IRS established.383 We will continue to review these options and how well they performed as part of our longer-term work.
Treasury and IRS also continue to take steps to recover payments sent to decedents, including posting instructions on the IRS website requesting that individuals voluntarily mail these payments back to IRS. Of the $1.2 billion in EIP sent to decedents, as of September 30, 2020, around 57 percent (just over $700 million) had been recovered. There are also likely more returned payments in unopened mail that IRS has yet to process.384
Treasury and IRS continue to review and monitor data on the number of payments that were sent to decedents and have since been recovered to determine whether further action may be warranted.
IRS had been taking similar steps to recover payments through a voluntary process from individuals who are incarcerated. We reported in June 2020 that, according to IRS officials, IRS worked with federal and state prison officials to assist in the return of payments made to individuals who are incarcerated. On August 1, 2020, two individuals filed a class action suit in federal district court on behalf of individuals who have been incarcerated in the United States any time from March 27, 2020, to the present to stop the withholding of their EIPs. On September 24, 2020, the court provisionally certified the class action and issued a preliminary injunction ordering IRS to stop withholding EIPs from individuals on the basis of their incarcerated status.385
On October 7, 2020, the court ordered IRS to take certain steps to provide notice to class members, including updating the IRS website, communicating with prison officials, and mailing individualized notices to
383 The Get My Payment website is https://www.irs.gov/coronavirus/get-my-payment. The number for the IRS EIP helpline is 800-919-9835. The website for the Taxpayer Advocate is TAS Coronavirus (COVID-19) Tax Relief site.
384 According to Treasury officials, IRS has a backlog of 5.8 million pieces of unopened mail in its processing sites and will not be able to provide further data on any additional returned payments until after the end of the year.
385 Order Granting Motion for Preliminary Injunction and Motion for Class Certification, Scholl v. Mnuchin, No. 20-05309 (N.D. Cal. Sept. 24, 2020).

Appendix I: Enclosures
Page 283 GAO-21-191
class members for whom IRS has a mailing address.386 On October 19, IRS updated its website with instructions explaining how individuals who are incarcerated can file for an EIP using the Non-Filers Tool or a simplified paper return. According to IRS, approximately 2.3 million individuals currently incarcerated have a Social Security number valid for employment; IRS determined that approximately 977,000 of those individuals could be eligible for an EIP.
Agency Comments
We provided a draft of this enclosure to Treasury, IRS, and the Office of Management and Budget.
In its comments, reproduced in appendix X, Treasury reaffirmed its commitment to encouraging as many non-filers as possible to claim their EIP before the Non-Filers Tool closed and described actions it took to support that goal. Treasury also agreed with our recommendation. In its letter, Treasury noted that it intends to begin tracking and publicly reporting the number of individuals who received a notice and subsequently filed for an EIP in January 2021, sooner than it previously planned. Treasury also noted it will use this information to inform outreach and communication efforts.
In its comments, reproduced in appendix VI, IRS described the range of steps it has taken to ensure all EIP eligible recipients could access the program. These steps include its ongoing outreach, education, and communications campaign, partnerships with hundreds of organizations outside the traditional tax community, sending nearly 9 million notices to potentially eligible recipients, and declaring November 10 as National EIP Registration Day. IRS also said that it plans to provide additional reminder messages and outreach through the 2021 filing season for those individuals who have not received a payment and can claim it on next year’s tax return.
Treasury and IRS also provided technical comments, which we incorporated as appropriate. The Office of Management and Budget, which reviewed the enclosure, had no comments.
386 Order Re: Notice to Class Members, Scholl v. Mnuchin, No. 20-05309 (N.D. Cal. Oct. 7, 2020). The court also recognized that IRS extended the deadline for filing simplified paper returns to October 30, 2020. The government has filed a Notice of Appeal for both the September 24 and October 7 orders.

Appendix I: Enclosures
Page 284 GAO-21-191
GAO’s Methodology
To review how Treasury and IRS administered payments, we reviewed Treasury and IRS data as of September 30, 2020, examined federal laws and agency guidance, and interviewed Treasury and IRS officials. We assessed the reliability of the data by reviewing relevant Treasury and IRS documents, reviewing GAO’s prior use of the data sources, and interviewing agency officials. We determined the data were sufficiently reliable to describe the number and amount of payments disbursed.
We asked representatives from five selected IRS outreach partners to provide us with their perspectives on IRS outreach efforts leading up to the November 21 Non-Filers Tool deadline. The outreach partners were the AARP, Feeding America, the United Way, the Code of Support Foundation, and the National Low Income Housing Coalition. These organizations were selected for their work on a national scale and their work with constituencies such as low-income families, veterans, and seniors. This sample is not representative, but the interviews provided us with illustrative examples of how organizations worked with IRS to reach traditionally underserved communities and what aspects of the IRS communications plan worked well, and also highlighted potential areas for improvement.
To test IRS’s controls over the processing of EIPs and to determine whether IRS complied with the EIP provisions of the CARES Act, we statistically selected a monetary unit sample of 112 EIPs, totaling $230,264, from the population of approximately $269 billion processed between April 10 and May 29, 2020. In addition, during the review of the EIP population, we identified 177 EIPs that were greater than or equal to $8,000, totaling approximately $1.6 million, which we selected for testing. Our test consisted of reviewing IRS tax module records and relevant IRS records including files of individuals who are incarcerated, individual tax returns, and payment confirmations from the Bureau of the Fiscal Service to determine whether IRS issued any duplicate EIPs or EIPs to ineligible individuals and applied no offsets against EIPs other than for past-due child support, and to validate that IRS’s records, which were used to determine eligibility and calculate EIPs, were accurate.
Contact information: James R. McTigue Jr., (202) 512-9110, [email protected]

Appendix I: Enclosures
Page 285 GAO-21-191
SSA Disability Service Delivery
The Social Security Administration experienced service disruptions related to processing disability claims and appeals due to office closures as a result of the COVID-19 pandemic. The agency has taken steps to increase the use of telework, conduct business by phone, and expand its online services.
Entity involved: Social Security Administration
Key Considerations and Future GAO Work
We will continue to monitor the Social Security Administration’s (SSA) provision of disability services as part of our ongoing work examining SSA’s service delivery during the COVID-19 pandemic.
Background
SSA manages two of the nation’s largest disability programs, Disability Insurance (DI) and Supplemental Security Income (SSI). In fiscal year 2019, these programs received more than 2.34 million claims and paid about $185 billion in benefits. As of December 2019, approximately 12.3 million adults with disabilities and their eligible dependents received either DI or SSI benefits.387
Determining eligibility based on disability for these programs may involve several levels of decision-making:
· Field office. Staff in SSA field offices review applications from individuals who want to claim disability benefits (claimants) and determine whether the claimants meet nonmedical eligibility requirements. If they do, their applications are forwarded to state Disability Determination Services (DDS) offices.
· Disability Determination Services Office. DDS staff review initial-level claims forwarded by field offices based on medical and vocational requirements. Specifically, DDS examiners assemble medical and vocational information for each claim. If recent medical records to support a claim are unavailable, an examiner may refer the claimant
387 The 12.3 million adults with disabilities described here do not include individuals who receive SSI benefits because they are 65 or over and meet the program’s income and asset requirements.
Appendix I: Enclosures
Page 286 GAO-21-191
for consultative exams with physicians or psychologists. The DDS examiner uses this information to determine whether the claimant is eligible for benefits. Claimants who are dissatisfied with the initial-level DDS eligibility determination may request a “reconsideration” of their claim. The reconsideration is conducted by a DDS examiner who was not involved in the original determination.
· Administrative Law Judge Hearing. Claimants who are dissatisfied with the DDS’s initial and reconsideration determination may appeal by requesting a hearing before an SSA administrative law judge (ALJ). The ALJ may review new evidence and ask other witnesses, such as medical and vocational experts, to testify at the hearing. Claimants whose claim for benefits is denied at the hearings level may appeal the decision to SSA’s Appeals Council—comprised of administrative appeals judges and appeals officers—and subsequently in federal court.
SSA received $300 million under the CARES Act to prevent, prepare for, and respond to the COVID-19 pandemic.388 According to SSA officials, SSA used most of this money to pay the salaries and benefits of staff who normally conduct program integrity work that was suspended for the first several months of the pandemic.389 Officials also reported using the CARES Act funding to cover leave for staff unable to telework and other COVID-19 related expenses, including information technology to expand telework.
We have previously reported on SSA’s long-standing challenges with managing disability-related workloads and deciding who is eligible for disability benefits in a timely way. In part because of these persistent challenges, “Improving and Modernizing Federal Disability Programs” has remained on our High-Risk List since 2003.390 Our prior work on this high-risk area has highlighted the potential for these challenges to grow as 80 388 Pub. L. No. 116-136, div. B, tit. VIII, 134 Stat. 281, 572.
389 Specifically, SSA suspended continuing disability reviews (CDR), in which the agency examines whether current beneficiaries continue to meet the eligibility criteria for disability benefits. SSA received dedicated funding authority for fiscal year 2020 for program integrity efforts, including CDRs, and according to SSA officials, the agency would have used this funding to pay the salaries of staff conducting CDRs. The officials stated, however, that the agency was not able to fully use this funding in fiscal year 2020 because the agency conducted fewer CDRs than planned. The officials stated that the staff who normally perform CDRs performed other assigned workloads, and SSA paid a portion of those staff’s salaries with the CARES Act funding.
390 GAO, High-Risk Series: Substantial Efforts Needed to Achieve Greater Progress on High-Risk Areas, GAO-19-157SP (Washington, D.C.: Mar. 6, 2019).
Appendix I: Enclosures
Page 287 GAO-21-191
million members of the baby boom generation reach their most disability-prone years. The COVID-19 pandemic adds a new and unprecedented challenge for SSA’s delivery of services to individuals with disabilities.
Overview of Key Issues
In response to the pandemic and to prevent the spread of COVID-19, SSA took several steps to protect the safety of its staff and the public. Beginning March 17, 2020, SSA closed all offices to the public, including its field and hearings offices, except for limited in-office appointments for critical services. SSA encouraged individuals seeking assistance from field office staff to first try to use SSA’s online and telephone services. At the hearings level, SSA also halted all in-person hearings and conducted hearings by phone if claimants consented to do so. In September 2020, SSA made available to some claimants and representatives the option to attend online video hearings, and intends to expand this option to all claimants over time. SSA also temporarily suspended referrals for in-person consultative exams for claimants at the initial and hearings levels, from March through the issuance of a framework on May 29, 2020, for resuming in-person consultative exams on a voluntary basis.
DDS administrators and ALJs we surveyed reported various challenges to maintaining service delivery during the pandemic, and the number of DDS determinations and hearings decisions through September 2020 declined compared to months before the pandemic.
Challenges processing initial claims remotely. DDS offices varied in their response to the pandemic and the extent to which they were able to provide continuous service delivery. According to our July 2020 survey of all 52 DDS administrators, nine DDS offices reported shutting down for some period of time because of the pandemic.391 All DDS offices reported reducing the number of staff on-site, with 27 reporting their staff worked alternative shifts and 51 reporting their staff teleworked off-site. One DDS administrator reported expanding the hours during which staff could telework or work on-site.
DDS administrators cited two challenges with transitioning to a telework environment that affected DDS operations:
391 There are 52 DDS offices located in 50 states, the District of Columbia, and Puerto Rico.

Appendix I: Enclosures
Page 288 GAO-21-191
· Lack of technology among staff. Ten of 52 DDS administrators stated that technology challenges had affected their operations. For example, one reported that staff in their DDS office did not have access to technology needed to telework offsite, such as laptops and other related equipment.392
· Inability to schedule consultative exams. Eight DDS administrators reported that the inability to schedule consultative medical exams for claimants had affected their operations.393 To address this challenge, SSA issued guidance that permitted the use of virtual consultative exams, which use video telehealth technology for cases in which a physical exam was not needed, such as for psychiatric consultative exams. By the third week in June 2020, SSA reported that 33 DDSs had resumed scheduling in-person CEs, and by September 2020, all DDSs were doing so.
In light of these challenges, from March 2020 through September 2020, initial-level claims processing declined compared to the same period last year, and the number of pending cases grew. Specifically, the average number of initial determinations processed per month during this period was about 152,000—a 23 percent decline from the previous year’s average of about 198,000 per month (see figure). From March 2020 through September 2020, new disability claims have decreased somewhat—about 14 percent—compared to the same period last year.394
Because the decrease in determinations was greater than the decrease in new claims, the number of pending claims has generally increased during the pandemic, although the number of pending claims decreased in September 2020. Specifically, the number of pending claims at the end of September 2020 was 21 percent higher than in February 2020.
392 Our survey of DDS administrators included an open-ended question: “What additional context would your DDS like to provide about how COVID -19 affected operations in your DDS?” We included the number of administrators that reported challenges with technology in response to this question.
393 Our survey of DDS administrators included an open-ended question: “What additional context would your DDS like to provide about how COVID -19 affected operations in your DDS?” We included the number of administrators that reported challenges with their staff’s inability to schedule consultative exams in response to this question.
394 Disability claims may subsequently rise if claims follow the pattern of the 2007 -2009 Great Recession, when new disability claims did not reach peak levels until well after the technical end of the recession. Disability applications peaked in October 2010 and plateaued at high levels through 2012.

Appendix I: Enclosures
Page 289 GAO-21-191
Social Security Administration Initial-level Disability Determination Workloads, March 2019 through September 2020
Challenges conducting hearings by phone. ALJs and SSA headquarters officials cited several challenges to conducting hearings during the COVID-19 pandemic. In a survey of ALJs located in six hearings offices, we asked how the pandemic was affecting ALJs’ ability to meet productivity goals, which involve making a certain number of decisions each year.395 Of the 53 ALJs who responded, 39 reported challenges with claimants or claimant representatives declining phone hearings. At the beginning of the pandemic, SSA officials indicated that about 1 in 4
395 We surveyed 58 ALJs, and 53 responded. These ALJs were from six hearing offices (in three regions), with whom we also held virtual discussion groups. The offices were selected for variation in geography, average size of case files, median ALJ productivity, and minimum number of ALJs. The information gathered from the survey is not intended to be representative, but provides examples of challenges ALJs are facing during the COVID-19 pandemic.

Appendix I: Enclosures
Page 290 GAO-21-191
claimants were declining phone hearings. In October 2020, about 1 in 10 claimants were declining phone hearings, according to SSA officials.
Further, in our survey, 17 ALJs reported challenges reaching claimants for phone hearings. For example, one judge stated that staff faced challenges contacting the claimant prior to hearings, while another cited challenges locating the claimant at the time of the hearing. Sixteen ALJs also cited limitations with technology, and nine said that phone hearings took longer to conduct. Eight ALJs also cited challenges obtaining medical evidence or consultative exams. In addition to claimants declining phone hearings, SSA headquarters officials cited other reasons for hearings postponements including scheduling conflicts, the late submission of evidence, and the lack of availability of expert witnesses.
Finally, during the pandemic, hearings offices were not scheduling hearings for cases that involve paper records and do not have electronic records that can be accessed remotely. These cases represent approximately 4 percent of SSA’s total pending cases (disability, non-disability, and overpayment cases) at the hearings level, according to SSA officials. In response to our survey, seven of 53 ALJs said that their inability to process paper cases was impeding their ability to meet their productivity goals. According to SSA officials, the agency has recently begun using a temporary solution to scan these paper-based workloads into an electronic format, allowing staff to develop these cases remotely.
In light of these challenges, the daily average hearings in a given week fell dramatically during the first months of the pandemic compared to past months (see figure). Specifically, between the week of March 20, 2020, and October 16, 2020, the average number of hearings per day ranged from 967 to 2,045. In contrast, during the first 5 months of fiscal year 2020 prior to the pandemic, SSA held 2,228 hearings per day on average, according to SSA officials.

Appendix I: Enclosures
Page 291 GAO-21-191
Daily Average Number of Social Security Administration Disability Hearings Held, March 20, 2020 through October 16, 2020
Agency Comments
We provided SSA with a draft of this enclosure. SSA provided comments, which are reproduced in appendix IX. In its comments, SSA noted its progress towards reducing wait times at the hearings level. SSA also provided information on the number of DDSs that had resumed scheduling in-person consultative exams and technical comments, which we incorporated as appropriate.
GAO’s Methodology
We interviewed SSA officials, analyzed SSA’s case-processing data, and surveyed DDS administrators and SSA administrative law judges to understand how SSA responded to the COVID-19 pandemic. Specifically, we surveyed the administrators of all 52 DDS offices, and all 52
Appendix I: Enclosures
Page 292 GAO-21-191
administrators responded. We also surveyed a nongeneralizable sample of 58 ALJs (out of 1,377 full time ALJs at the end of fiscal year 2020, according to SSA officials), of whom 53 responded. To understand how productivity levels changed at DDS offices in response to the pandemic, we analyzed administrative data on the number of initial decisions processed per month from March 2019 through September 2020. To understand how productivity levels changed at the hearings level, we obtained and analyzed data on the number of hearings conducted per day during and prior to the pandemic. We conducted data reliability checks on the initial and hearings-level case-processing data and found them to be sufficiently reliable for the purposes of this analysis.
Contact information: Elizabeth Curda, (202) 512-7215, [email protected]
Related GAO Products
High-Risk Series: Substantial Efforts Needed to Achieve Greater Progress on High-Risk Areas. GAO-19-157SP. Washington, D.C.: Mar. 6, 2019.
Social Security Disability: Better Timeliness Metrics Needed to Assess Transfers of Appeals Work. GAO-18-501. Washington, D.C.: July 19, 2018.
Social Security Administration: Continuing Leadership Focus Needed to Modernize How SSA Does Business. GAO-18-432T. Washington, D.C.: Mar. 7, 2018.
Social Security Disability: Additional Measures and Evaluation Needed to Enhance Accuracy and Consistency of Hearings Decisions. GAO-18-37. Washington, D.C.: Dec. 7, 2017.
Social Security Administration: Improvements Needed in Facilities Planning and Service Delivery Evaluation. GAO-17-597. Washington, D.C.: July 25, 2017.
Social Security Administration: Long-Term Strategy Needed to Address Key Management Challenges. GAO-13-459. Washington, D.C.: Mar. 29, 2013.

Appendix I: Enclosures
Page 293 GAO-21-191
Employee Payroll Tax Deferrals
Payroll and accounting representatives told us very few employers are implementing employee payroll tax deferrals; and the Internal Revenue Service still has a few remaining implementation steps.
Entities involved: Department of the Treasury, including the Internal Revenue Service; the Office of Management and Budget
Key Considerations and Future GAO Work
The Internal Revenue Service (IRS) quickly issued guidance and updated forms and instructions to implement the deferral of the employee share of certain payroll taxes, but IRS still has some decisions to make regarding how employers should report the deferrals and whether employers need additional guidance to help with reporting. We will review employment tax data for the third and fourth quarters of 2020 to assess the extent to which employers are implementing the deferrals, and we will continue to monitor any compliance plans that IRS develops to examine reported deferrals.
Background
On August 8, 2020, the President signed a Presidential Memorandum that, in part, directed the Secretary of the Treasury to exercise his authority under section 7508A of the Internal Revenue Code.396 It would defer the withholding, deposit, and payment of the employee share of certain employment taxes imposed on wages or compensation paid from September 1, 2020, through December 31, 2020, if an employee’s wages or compensation are below a certain amount in a pay period. If an employee’s employment taxes are deferred, that employee’s take-home pay is increased by the amount of the deferred taxes, but, absent a change in statute, the amount deferred must be paid once the deferral period ends. The Presidential Memorandum directs the Secretary of the Treasury to make this deferral available to an employer for employees whose earnings during any biweekly pay period generally are less than
396 U.S. Presidential Memorandum, Memorandum on Deferring Payroll Tax Obligations in Light of the Ongoing COVID-19 Disaster (Aug. 8, 2020), accessed online August 20, 2020, https://www.whitehouse.gov/presidential-actions/memorandum-deferring-payroll-tax-obligations-light-ongoing-covid-19-disaster/. The memorandum also directs the Secretary to “explore avenues, including legislation, to eliminate the obligation to pay the taxes deferred pursuant to the implementation of this memorandum.”

Appendix I: Enclosures
Page 294 GAO-21-191
$4,000 on a pre-tax basis, or the equivalent amount with respect to other pay cycles.
On August 28, 2020, IRS and the Department of the Treasury (Treasury) issued Notice 2020-65 implementing the Presidential Memorandum. The notice states employers can defer the withholding and payment of the employee share of Social Security payroll taxes or the railroad retirement tax equivalent on applicable wages or compensation paid to employees for the period covered in the Presidential Memorandum.397 According to the guidance, employers must withhold and pay the deferred taxes during the period beginning on January 1 and ending April 30, 2021.398 During this period, employees will have payroll taxes withheld from their pay as they normally would and will also be subject to withholding to recoup the previously deferred taxes. This will result in a reduction in take-home pay as compared to what would have occurred without the deferral. Employers are to report deferred taxes on their employment tax returns, typically on Form 941, Employer’s Quarterly Federal Tax Return.
Overview of Key Issues
IRS revised the third-quarter Form 941 to allow participating employers to report any deferral of the employee share of Social Security taxes. IRS also distributed information on the deferral through instructions to the Form 941 and, according to IRS officials, provided information on monthly calls with the payroll industry. As of October 2020, IRS officials said they are still determining what information to provide with respect to reporting on Form W-2, Wage and Tax Statement and Form W-2c, Corrected Wage and Tax Statement.
IRS established a telephone hotline to answer questions related to Notice 2020-65, and, in an outgoing recorded message for the hotline, answered common questions. Among other things, the recorded message said that, 397 IRS Notice 2020-65, 2020-38 I.R.B. 567 (Sept. 14, 2020), available online at: https://www.irs.gov/irb/2020-38_IRB (accessed Oct. 21, 2020). We were asked to issue a legal decision regarding whether Notice 2020-65 is a rule under the Congressional Review Act. We determined that since IRS submitted Notice 2020-65 to us under the Congressional Review Act, there is no need for a legal decision from our office. See GAO, Request for a Congressional Review Act Opinion on IRS Notice 2020 -65, B-332517 (Washington D.C.: September 2020). As noted in our correspondence, on September 4, 2020, Representative John Larson of Connecticut introduced House Joint Resolution 94 which is a resolution of disapproval of the Notice. H. R. J. Res. 94, 116th Con g. (2020).
398 The guidance directs employers to ratably withhold and pay the deferred taxes, meaning, in general, equally apportioned across the period.
Appendix I: Enclosures
Page 295 GAO-21-191
if the employer is unable to withhold the deferred taxes from the employee’s wages or compensation because an employee terminates employment before April 30, 2021, or for another reason, the employer may make other arrangements to collect the deferred taxes from the employee. The employer is liable to pay the deferred taxes to the IRS, according to the recording. IRS officials said they do not have plans to issue additional guidance, but may consider it.
Initial data on the deferrals—such as the number of participating employers and the amount of deferred payroll taxes—will not begin to be available until the third-quarter employment tax returns are processed, beginning in November 2020. Those returns will include deferrals from September 1 to September 30, and the remainder of the deferrals will be reported after December 31, 2020, for the fourth-quarter returns.
IRS implemented controls to flag employers that report more taxes deferred—for both the employee and employer share—than their amounts allowed. Other checks on compliance, yet to be determined, will occur during examinations, according to IRS officials.
Representatives from an accountant industry group and two payroll industry groups told us very few of their clients had implemented the deferrals. Very few employees whose employers offered an option to participate did so, according to the payroll representatives. The payroll and accounting representatives also highlighted several concerns with the deferral. For example, some representatives indicated that they believe the deferrals are a disservice to employees and will put employees in a poor position next year when withholding of the deferred payroll taxes resumes. According to one payroll professional, “It’s deceiving to employees when they think they’re getting a tax break. A lot of them don’t understand they would have to pay it back in the spring so they would be paying double at that time.”
Moreover, employers, according to some payroll professionals, fear liability for the taxes if an employee departs. Another payroll professional told us, “If we had to lay people off because of the economy and business not returning quickly enough, the company would have been on the hook for paying these taxes. While I know we could try to get the former employees to pay, the likelihood of this happening is not realistic.”
Several industry representatives said if an employee departs before withholding resumes in 2021, the employer’s legal options for collecting deferred taxes are unclear, potentially leaving the employer with the
Appendix I: Enclosures
Page 296 GAO-21-191
obligation to pay the taxes. For employers that may go out of business before they resume withholding, IRS officials said the agency would use its normal procedures, such as those associated with bankruptcy proceedings, to recoup the taxes.
The issue of employer liability has implications for the federal government. The Office of Management and Budget directed executive branch agencies to defer the applicable payroll taxes for all employees who earn less than the $4,000 biweekly threshold and to inform and educate employees on the deferral’s anticipated impact on their paychecks in the coming months.399 For example, officials at the General Services Administration (GSA) said GSA processes payroll for about 16,400 federal employees at GSA and other agencies. This represents about 0.8 percent of the executive branch.400 Of the approximately 16,400 employees, 47 percent had their employee share of certain payroll taxes deferred for the pay period ending September 12, 2020, according to GSA officials.
Agency Comments
We provided IRS, Treasury, GSA, and the Office of Management and Budget with a draft of this enclosure. IRS, Treasury, and GSA provided technical comments, which we incorporated as appropriate. The Office of Management and Budget did not have any comments on this enclosure.
GAO’s Methodology
We interviewed agency officials, representatives from a payroll industry group, and representatives from an accounting industry group, and gathered written responses from another payroll industry group. We selected these groups because they represent large numbers of professionals assisting employers with payroll tax filing. We also reviewed IRS and GSA documentation.
399 Office of Management and Budget, Guidance on Implementing Payroll Tax Deferral for Federal Employees (Sept. 11, 2020), accessed online Oct. 19, 2020, https://www.whitehouse.gov/wp-content/uploads/2020/09/M-20-35.pdf. The memorandum does not cover legislative and judicial branch entities.
400 This percentage is based on data on most executive branch employees, except for U.S. Postal Service employees, as of September 30, 2019, obtained from the Office of Personnel Management’s Enterprise Human Resources Integration database.
Appendix I: Enclosures
Page 297 GAO-21-191
Contact information: Jessica Lucas-Judy, (202) 512-9110, [email protected]
Tax Relief for Businesses
The Internal Revenue Service cannot yet know the extent to which businesses are taking advantage of certain tax relief options—such as carrying additional losses back to prior tax years—but refunds may be delayed for businesses that submit amended returns on paper.
Entities involved: Department of the Treasury, including the Internal Revenue Service
Recommendation for Executive Action
We are making the following recommendation to the Internal Revenue Service:
The Commissioner of Internal Revenue should update the Form 1040-X instructions to include information on the electronic filing capability for tax year 2019.
Key Considerations and Future GAO Work
As the Internal Revenue Service (IRS) continues to receive net operating loss (NOL) carryback tentative refund requests from taxpayers, it has begun offering alternative options that would allow taxpayers to file amended federal income tax returns by some means other than paper, such as electronic fax (e-fax). For some refunds, the IRS must process a taxpayer’s amended return before issuing a carryback claim or carryback tentative refund.
The IRS now allows taxpayers to electronically file (e-file) Form 1040-X, Amended U.S. Individual Income Tax Return, for tax year 2019. To help taxpayers bypass mail backlogs and to expedite refunds, it is important that IRS include e-file information in the procedures and instructions that taxpayers may use to file their form. The Form 1040-X instructions do not include this e-file option. We will continue to monitor how IRS communicates this change, and the status and content of IRS’s plans in these areas. We will also continue to monitor IRS’ efforts to ensure compliance with the CARES Act.

Appendix I: Enclosures
Page 298 GAO-21-191
Background
To provide liquidity to businesses during the COVID-19 pandemic, the CARES Act includes tax measures to help businesses—including sole proprietors, estates, and trusts—receive cash refunds or other reductions to tax obligations.401 The Joint Committee on Taxation estimates these measures will lead to about $174 billion in foregone revenue in fiscal years 2020-2030. The IRS’s capacity to implement new initiatives, such as the CARES Act tax measures, is an ongoing challenge we cited in our 2019 High Risk Report.
The CARES Act modified, among other provisions of the tax law, provisions enacted as part of the 2017 legislation known as the Tax Cuts and Jobs Act (TCJA):402
· NOL carrybacks. The CARES Act allows carrybacks for up to 5 years for NOLs beginning in tax years 2018, 2019, and 2020, which may provide a cash refund for certain taxpayers.403 Tax years prior to 2018 had a higher tax rate, which increases the incentive to carryback post-2018 NOLs from lower tax rate years, in order to generate a carryback refund. The use of a carryback is optional and may affect other tax obligations.404 For NOLs arising in tax years beginning after 2017, TCJA limited the deduction of NOL carrybacks and carryforwards to 80 percent of taxable income.405 Under the CARES Act, those NOLs
401 Pub. L. No. 116-136, §§ 2301–2306, 134 Stat. 281, 347–359 (2020). In addition to the provisions below, the CARES Act also included increased limits on business interest and changed the rule on excess business losses.
402 Pub. L. No. 115-97, 131 Stat. 2054 (2017).
403 Pub. L. No. 116-136, § 2303, 134 Stat. at 352–356. An NOL occurs when a taxpayer’s allowable deductions exceed its gross income for a tax year. During an NOL year, a taxpayer generally does not owe any income taxes. TCJA generally repealed NOL carrybacks and required NOLs to be carried over indefinitely. Pub. L. No. 115 -97, § 13302(b), 131 Stat. at 2122. The NOL offsets the taxpayer’s taxable income in other tax years. 26 U.S.C. § 172(a). For ease of reporting, we use the term taxpayer to refer to an entity that may use the CARES Act tax relief provisions described in this enclosure.
404 NOLs must be carried back unless taxpayers make a valid election to waive the carryback. 26 U.S.C. § 172(b)(3).
405 Pub. L. No. 115-97, § 13302(a)(1), 131 Stat. at 2121.

Appendix I: Enclosures
Page 299 GAO-21-191
can reduce 100 percent of taxable income for tax years beginning before 2021.406
Taxpayers who have amounts included in their income because of the transitional repatriation tax established in the TCJA (referred to as “section 965” tax), can elect to exclude those inclusion years from the carryback period to produce an NOL refund in other years.407 NOL refunds are typically claimed on Form 1120-X, an Amended U.S. Corporation Income Tax Return; paper Form 1139, Corporate Application for Tentative Refund, or paper Form 1045, Application for Tentative Refund (for individuals, including sole proprietors, estates and trusts). However, in April 2020 IRS issued temporary procedures to allow for e-fax of Forms 1139 and 1045 for a quick tentative refund during the period that IRS campuses were closed and mail was not being processed due to COVID-19.408 The IRS updated these procedures in October 2020 to state that the last day to e-fax an eligible refund claim under these procedures is December 31, 2020.
· Acceleration of alternative minimum tax (AMT). TCJA repealed the corporate AMT, but most corporations could claim their remaining unused minimum tax credits as a refundable credit for tax years 2018 through 2021.409 Under the CARES Act, corporations with AMT credits may claim a refund for tax years beginning in 2018 and 2019 and may
406 Pub. L. No. 116-136, § 2303(b)(1), 134 Stat. at 353–354. Losses carried forward can reduce future taxable income and tax, but cannot reduce taxable income below zero.
407 26 U.S.C. § 965. Corporations that elect to exclude the transition tax years from the carryback period may receive a higher refund. 26 U.S.C. § 172(b)(1)(D)(iv), (v).
408 Corporations file Form 1139, Corporation Application for Tentative Refund. Individuals, estates, and trusts file Form 1045, Application for Tentative Refund. See: IRS, Temporary procedures to fax certain Forms 1139 and 1045 due to COVID -19, accessed June 3, 2020, https://www.irs.gov/newsroom/temporary-procedures-to-fax-certain-forms-1139-and-1045-due-to-covid-19.
409 Pub. L. No. 115-97, § 12001(a), 131 Stat. at 2092. Prior to TCJA, corporations were required to calculate their tax liability under two sets of rules—they compute their regular tax liability and their tentative AMT liability and pay whichever is greater. If the tentative AMT is more than the regular tax, the difference between them is AMT. The purpose of the AMT is to prevent companies from eliminating their tax liability from overuse of certain corporate tax preferences. In general, AMT applies a lower tax rate to a broader tax base by limiting the use of tax preferences and disallowing credits and deductions.

Appendix I: Enclosures
Page 300 GAO-21-191
either file Form 1139 or Form 1120-X to receive a refund for some or all of these credits.410
Overview of Key Issues
Complete data on the number of taxpayers taking advantage of these provisions, and the associated dollar amounts, will not be available until after tax year 2020 income tax returns are processed in 2021. The table shows information on tentative refund requests, as of October 19, 2020.
CARES Act Net Operating Loss (NOL) and Alternative Minimum Tax (AMT) Tentative Refund Cases, as of October 19, 2020
Form and provision All casesa Number of taxpayers filing
Number of cases in suspenseb
Form 1139, AMT only 943 916 5 Form 1139, NOL or AMT 10,397 9,120 64 Form 1045, NOL 9,696 8,412 77
Source: Internal Revenue Service data. | GAO-21-191 aA single case may include multiple e-fax submissions. Submissions for the same identif ication number, form, and tax period generally are one case. Submissions for the same number and form, but for different tax periods, are separate cases. bA case is in suspense because additional information is needed.
Since May 31st, 14,070 more taxpayers have filed for NOL or AMT carryback refunds. The percentage of forms in suspense—not being processed due to missing information—has decreased by 66 percent since May 31st and 86 percent since July 31st.411
Data on refund dollar amounts is being captured, according to IRS officials, but they are still extracting pertinent data from the tentative refund applications so that it may be accessed and reported. The IRS does not yet have a date for when the data will be available. However, 410 Pub. L. No. 116-136, § 2305, 134 Stat. at 357. Under the CARES Act, corporations with AMT credits in excess of the credit allowed to offset regular tax liability (excess credit), may claim 50 percent of the excess credit as a refundable credit for the first tax year beginning in 2018 and then claim any remaining excess credit as a refundable credit in 2019. Alternatively, a taxpayer may elect to claim the entire excess credit as a refundable credit in the tax year beginning in 2018. If a corporation elects to claim all of the excess credit as a refundable credit in 2018, the Form 1139 may be used to receive a tentative refund for this credit. If this election is not made, a Form 1120 -X must be filed to obtain a refund for this refundable credit.
411 The IRS reported 1,018 Forms 1139 and 1045 in suspense as of July 31st. The decrease from July to October shows that they have been working through this problem.
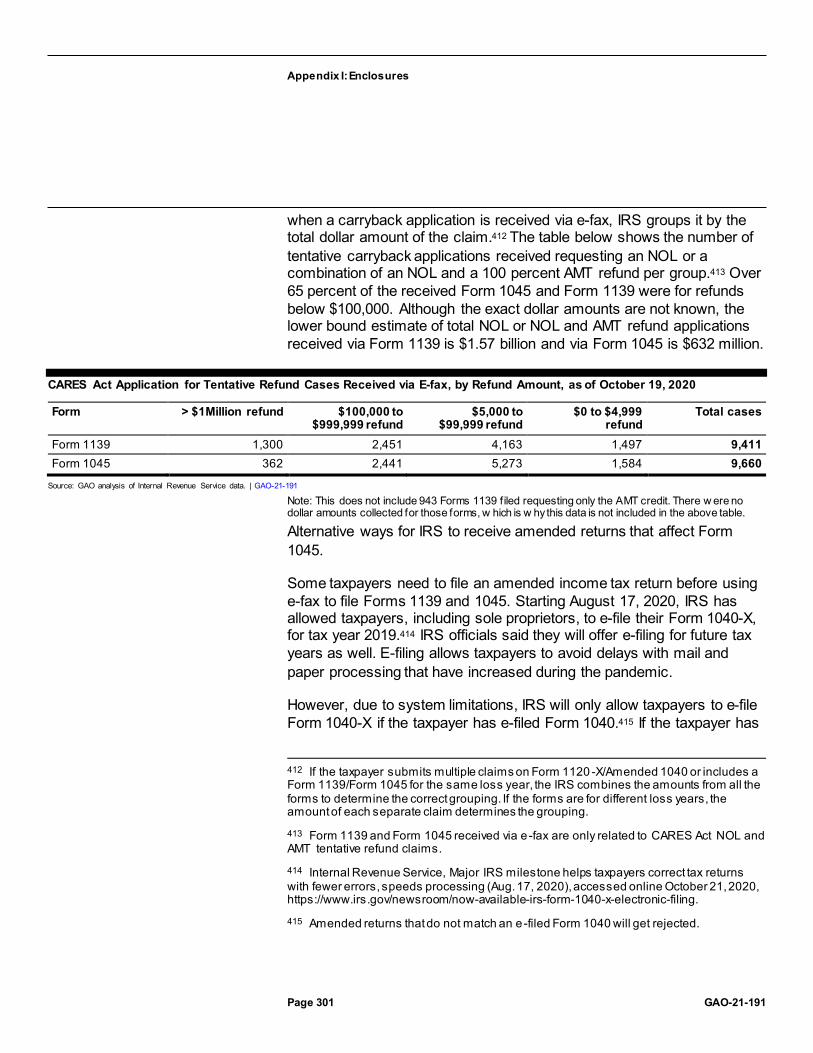
Appendix I: Enclosures
Page 301 GAO-21-191
when a carryback application is received via e-fax, IRS groups it by the total dollar amount of the claim.412 The table below shows the number of tentative carryback applications received requesting an NOL or a combination of an NOL and a 100 percent AMT refund per group.413 Over 65 percent of the received Form 1045 and Form 1139 were for refunds below $100,000. Although the exact dollar amounts are not known, the lower bound estimate of total NOL or NOL and AMT refund applications received via Form 1139 is $1.57 billion and via Form 1045 is $632 million.
CARES Act Application for Tentative Refund Cases Received via E-fax, by Refund Amount, as of October 19, 2020
Form > $1Million refund $100,000 to $999,999 refund
$5,000 to $99,999 refund
$0 to $4,999 refund
Total cases
Form 1139 1,300 2,451 4,163 1,497 9,411 Form 1045 362 2,441 5,273 1,584 9,660
Source: GAO analysis of Internal Revenue Service data. | GAO-21-191
Note: This does not include 943 Forms 1139 f iled requesting only the AMT credit. There w ere no dollar amounts collected for those forms, w hich is w hy this data is not included in the above table.
Alternative ways for IRS to receive amended returns that affect Form 1045.
Some taxpayers need to file an amended income tax return before using e-fax to file Forms 1139 and 1045. Starting August 17, 2020, IRS has allowed taxpayers, including sole proprietors, to e-file their Form 1040-X, for tax year 2019.414 IRS officials said they will offer e-filing for future tax years as well. E-filing allows taxpayers to avoid delays with mail and paper processing that have increased during the pandemic.
However, due to system limitations, IRS will only allow taxpayers to e-file Form 1040-X if the taxpayer has e-filed Form 1040.415 If the taxpayer has
412 If the taxpayer submits multiple claims on Form 1120 -X/Amended 1040 or includes a Form 1139/Form 1045 for the same loss year, the IRS combines the amounts from all the forms to determine the correct grouping. If the forms are for different loss years, the amount of each separate claim determines the grouping.
413 Form 1139 and Form 1045 received via e-fax are only related to CARES Act NOL and AMT tentative refund claims.
414 Internal Revenue Service, Major IRS milestone helps taxpayers correct tax returns with fewer errors, speeds processing (Aug. 17, 2020), accessed online October 21, 2020, https://www.irs.gov/newsroom/now-available-irs-form-1040-x-electronic-filing.
415 Amended returns that do not match an e-filed Form 1040 will get rejected.

Appendix I: Enclosures
Page 302 GAO-21-191
filed a paper Form 1040, that taxpayer will not be able to e-file Form 1040-X. This affects mainly sole proprietors who are trying to claim tentative refunds on their business. The amended return for corporate filers was already available for e-filing, but faces the same system limitation that requires the initial return be e-filed.416
COVID-19 caused IRS facilities to shut down and the subsequent large-scale staffing changes prevented the timely processing of paper returns. This backlog of paper returns is preventing IRS from processing paper-filed Forms 1040-X for tax year 2018 and paper-filed returns from 2019 in a timely manner, according to IRS officials. IRS processing centers re-opened in June and IRS officials said they have been processing mail in the order of receipt while operating at partial capacity to accommodate social distancing.
IRS officials said they anticipate opening all of the mail, but not processing all of the returns, by early November. Without the timely processing of paper-filed Forms 1040-X, some taxpayers’ Forms 1045 will be held “in suspense” and their CARES-Act-related NOL refunds cannot be issued. As of October 19, 2020, 77 Forms 1045 are in suspense, which according to IRS officials, could be because they are awaiting a processed amended return, or for other reasons. This number has greatly declined since IRS reported 805 Forms 1045 in suspense as of July 31, 2020.
IRS officials were unsure if the 16-week estimated processing time for Form 1040-X, as stated on irs.gov, and provided prior to the pandemic and e-filing, is still valid. According to IRS officials, employees were prioritizing the e-fax Form 1139 and 1045 filings, but as of August 2020, they are processing carryback claims and tentative refund applications—including those filed prior to the CARES Act—on a first-in first-out basis. They are meeting the statutory 90-day time frame for processing NOL and AMT refunds filed on Form 1139 and Form 1045, according to IRS officials.417 As of October 19, 2020, it has taken an average of 40 days to process a refund, including suspended returns.
For refund requests that are incomplete or potentially cannot be processed, IRS internal guidance instructs staff to contact the taxpayer or the taxpayer’s representative via telephone to determine if an issue can 416 Corporations file Form 1120-X, Amended U.S. Corporation Income Tax Return.
417 26 U.S.C. § 6411(d)(2); Pub. L. No. 116-136, § 2305(d)(1), 134 Stat. at 357.
Appendix I: Enclosures
Page 303 GAO-21-191
be resolved by having the taxpayer or representative fax any missing information. However, it was unclear if IRS staff were consistently using the guidance in this way. In September 2020, we discussed with IRS potential strategies to mitigate the backlog of paper Form 1040-X and identified an opportunity for IRS staff to ask the taxpayer to send a missing Form 1040-X directly via fax so that IRS can process the taxpayer’s Form 1045. This step could be especially helpful for taxpayers who already paper-filed their Form 1040-X, but whose form has not been reviewed because of the backlog.
As a result of these discussions, IRS issued an alert on October 1, 2020, that reminds staff to contact the taxpayer to request a copy of their amended return if it has not yet been received.418 This alert can help taxpayers that previously paper-filed their Form 1040-X to bypass the paper backlog and ultimately help taxpayers receive their NOL refunds faster. Representatives from different companies told us that this backlog has been an issue for their clients who are trying to receive CARES Act NOL refunds.
Additional ways for IRS to promote e-filing of the 2019 Form 1040-X. As discussed above, in August 2020 IRS began allowing taxpayers, who e-filed Form 1040 to e-file Form 1040-X. IRS officials told us that they have issued many press releases and posted announcements to irs.gov about the e-file capability. However, as of October 15, 2020, the temporary procedures for filing Form 1045, and the filing instructions for Form 1040-X, did not state that the 1040-X can be e-filed.419 The procedures state that the Form 1040-X must be filed in accordance with existing form instructions. Since the form instructions were also not updated to include the e-file information, this makes the procedures inaccurate as written.
In a draft of this report, we recommended IRS update the agency’s Temporary procedures to fax certain Forms 1139 and 1045 due to COVID-19 to include information on the Form 1040-X electronic filing capability for tax year 2019. Prior to final issuance of this report, IRS officials implemented this recommendation by adding a note to these temporary procedures on October 29th indicating that IRS recently 418 Servicewide Electronic Research Program alerts notify users of system problems and “need to know” information that does not change procedures or guidelines in the IRS’s official guidance, the Internal Revenue Manual.
419 Temporary procedures to fax certain Forms 1139 and 1045 due to COVID -19, accessed October 16, 2020, https://www.irs.gov/newsroom/temporary-procedures-to-fax-certain-forms-1139-and-1045-due-to-covid-19.

Appendix I: Enclosures
Page 304 GAO-21-191
announced that taxpayers can now submit Form 1040-X electronically. However, the form instructions were not updated to include the e-file information, so taxpayers who go directly to the form instructions may not know about the e-file option.
The IRS Strategic Plan states that IRS will empower and enable all taxpayers to meet their tax obligations by simplifying the process for tax filing and improving education and outreach on taxpayer rights and obligations. In the case of the COVID-19 response, it is important to provide taxpayers with ample information for them to file for their CARES Act benefits effectively. Including the 2019 Form 1040-X e-file information in the temporary procedures for Form 1045, and in the Form 1040-X instructions will help the IRS provide taxpayers with the most recent available information and clear procedures to enable them to file their amended returns and tentative refund claims effectively. This will help reduce paper submissions and potential delays.
Agency Comments
We provided IRS, Treasury, and the Office of Management and Budget with a draft of this enclosure, which included two recommendations. IRS provided written comments that are summarized below and reproduced in Appendix VI. IRS also provided technical comments, which we incorporated as appropriate. Treasury and the Office of Management and Budget did not have any comments on this enclosure.
In its written comments, IRS agreed with both recommendations, and took action before this report issued to update the Temporary procedures to fax certain Forms 1139 and 1045 due to COVID-19 to include information on the Form 1040-X e-filing capability. We removed this recommendation and no further action is required. The IRS also said that it will initiate the actions to update the Form 1040-X instructions to include information on the e-file capability for tax year 2019, but did not indicate a timeframe for this update. We will continue to monitor this, as it is important that the Form 1040-X instructions accurately reflect all filing options. It would be beneficial if this were done in time for taxpayers to submit their refund applications before the e-fax line closes on December 31, 2020.
GAO’s Methodology
We reviewed IRS data as of October 19, 2020, federal laws, and agency guidance; and interviewed IRS officials. To analyze IRS data, we

Appendix I: Enclosures
Page 305 GAO-21-191
compared the numbers we received from them in May, July, and October to determine what has changed. We also calculated a lower bound estimate of the Form 1139 and Form 1045 tentative refund applications to determine what the lowest possible amount of refunds could be.
Contact information: Jessica Lucas-Judy, (202) 512-9110, [email protected]
Financial Assistance to Aviation and Other Eligible Businesses
The Department of the Treasury has provided over $28 billion in payroll support to the nation’s aviation sector, but has not yet finalized a plan to fully monitor recipients’ compliance with the terms of this assistance or to take action if noncompliance is found.
Entities involved: Department of Transportation and the Department of the Treasury
Recommendation for Executive Action
The Secretary of the Treasury should finish developing and implement a compliance monitoring plan that identifies and responds to risks in the Payroll Support Program to ensure program integrity and address potential fraud, including the use of funds for purposes other than for the continuation of employee wages, salaries, and benefits.
Key Considerations and Future GAO Work
According to aviation industry forecasts, demand for air travel is not expected to recover to prepandemic levels until 2024. As a result, many aviation sector businesses, including air carriers and other air service companies, will likely continue to struggle to generate enough revenue to cover their expenses.
In June and September 2020, we reported that the Department of the Treasury (Treasury) has continued to provide financial assistance required by the CARES Act as payroll support to help the aviation industry retain employees. With air travel remaining far below last year’s levels, we continue examining the effects of the COVID-19 pandemic on the aviation sector.

Appendix I: Enclosures
Page 306 GAO-21-191
By the end of November 2020 Treasury expects to have finished providing CARES Act financial assistance through loans and loan guarantees for passenger and cargo air carriers, ticket agents, repair station operators, and other businesses critical to maintaining national security, including for nonaviation sector businesses. We have ongoing work examining Treasury’s implementation of this loan program, the extent to which Treasury’s policies and procedures were consistent with statutory requirements and other standards, and the extent to which eligible businesses participated in the program.
Background
The CARES Act authorized Treasury to provide financial assistance in the form of payroll support payments and loans.420 The Payroll Support Program (PSP) provides $32 billion in financial assistance divided among three categories of applicants—up to $25 billion for passenger air carriers, up to $4 billion for cargo air carriers, and up to $3 billion for certain aviation contractors—that shall exclusively be used for the continuation of payment of employee wages, salaries, and benefits. These entities were entitled to receive up to the amount of compensation and benefits paid to their employees for the period from April 1, 2019, through September 30, 2019, as reported to the Department of Transportation (DOT) or certified, as applicable.421
As of September 30, 2020, Treasury had obligated and expended $28 billion of the $32 billion that Congress appropriated for PSP. As required by statute, PSP recipients were to agree to refrain from conducting involuntary furloughs or reducing pay rates and benefits until September 30, 2020, and to refrain from certain share buybacks, dividend payments, and other capital distributions until September 30, 2021, among other conditions.422 Further, DOT required scheduled passenger air carriers
420 Pub. L. No. 116-136, § 4112, 134 Stat. 281, 498 (2020).
421 CARES Act, § 4113(a)(1)-(3), 134 Stat at 498. Certain air carriers report wages and salaries pursuant to 14 C.F.R. part 241; air carriers that do not, as well as contractors, must certify the amount of wages, salaries, benefits, and other compensation paid to employees using sworn financial statements or other appropriate data. The CARES Act provided Treasury the authority to reduce, on a pro rata basis, the amounts due to these entities to address any shortfall in assistance that would otherwise be provided un der the program. CARES Act, § 4113(c), 134 Stat at 499.
422 CARES Act, § 4114(a), 134 Stat. at 499.
Appendix I: Enclosures
Page 307 GAO-21-191
receiving financial assistance to maintain minimum scheduled passenger service through September 30, 2020.423
According to Treasury guidance, on August 14, 2020, PSP recipients were to begin reporting quarterly to Treasury information on their compliance with PSP agreement terms.424 The recipients, for example, are to submit through Treasury’s web portal information on employee headcount, wages, salaries, benefits, and other information.
Overview of Key Issues
Treasury had awarded 88 percent of the $32 billion in payroll support program funds as of October 2020.425 According to October 5, 2020, data from Treasury, 610 PSP agreements were executed with 352 passenger air carriers, 38 cargo air carriers, and 220 aviation contractors that totaled $28.2 billion or about 88 percent of available funds.426 While the average PSP award amount for passenger air carriers was nearly $71 million, 13 passenger air carrier recipients had awards greater than $100 million and five of those recipients had awards greater than $1 billion. For aviation contractors, the average award amount was nearly $11 million, but six of those contractors had awards greater than $100 million.
PSP funds have provided benefits to recipients, but certain factors contribute to the potential risk of funds being used for purposes other than payroll support. Some PSP recipients accessed other assistance under the CARES Act that risks overlap with PSP funds, while others received 423 CARES Act, § 4114(b), 134 Stat. at 499-500. DOT did not extend these minimum service obligations beyond September 30, 2020.
424 For most PSP recipients, quarterly compliance reports must be submitted to Treasury through May 2022.
425 As of October 16, 2020, Treasury had finished executing PSP agreements. Up to $4 billion was appropriated for cargo air carriers; however, total demand by cargo air carriers for PSP funds was far below available funds. Therefore, $3 billion of funds in this category were not awarded and cannot be reallocated by Treasury to other categories of recipients.
426 As the total demand for PSP funds exceeded available funds in the passenger air carrier and aviation contractor categories, Treasury applied an initial proration of 76 percent to passenger air carrier awards and 69.7 percent to aviation contractor awards. However, since some applicants were not approved for payments or dropped o ut of the PSP, Treasury adjusted the proration percentage to 78.2 percent for passenger air carriers. This adjustment resulted in additional funds being disbursed to certain passenger air carrier recipients around September 27, 2020. As of October 31, 2020 , Treasury is still determining the final proration percentage for aviation contractors.
Appendix I: Enclosures
Page 308 GAO-21-191
PSP funds in excess of their current number of employees. For some smaller businesses, one potential risk is that other CARES Act assistance could be obtained to pay salaries, wages, or benefits to the same employees over the same time period. For example, many PSP recipients also received federal assistance through the Small Business Administration’s Paycheck Protection Program (PPP).427 Specifically, at least 66 percent of PSP recipients received PPP loans.428 To be eligible for PPP loans, these recipients had to make a good faith certification that economic uncertainty made the PPP loan necessary to support ongoing operations. These PPP recipients also had to meet other eligibility requirements including a limit on the number of employees.429 Businesses in our analysis that were PSP recipients and received PPP loans had an average of 90 employees. According to several industry associations representing smaller air carriers and other eligible businesses, these two federal assistance programs offered critical support to their members during a period of economic hardship and uncertainty. According to one industry association, it was initially unclear to their members if businesses could access both programs, but Treasury confirmed that it was permitted if a business was eligible for both programs.430
For some larger businesses that received PSP awards, a potential risk is related to the size of their PSP awards when compared to actual employment levels. For example, we and others have reported about PSP recipients’ reductions in employment levels before receiving PSP
427 The CARES Act and the Paycheck Protection Program and Health Care Enhancement Act appropriated a total of $670 billion for the Paycheck Protection Program (PPP) under the Small Business Administration’s 7(a) small business lending program. PPP loans are made at 1 percent interest and will be fully forgiven if certain conditions are met. In general, small businesses with 500 or fewer employees, including tax-exempt nonprofit organizations, veteran’s organizations, and tribal businesses were eligible. Businesses in certain industries with more than 500 employees were eligible for loans.
428 Based on PSP data as of July 31, 2020, and PPP data as of August 8, 2020, about 380 of 580 PSP recipients had also received a PPP loan.
429 In order for a PPP loan recipient to qualify for full loan forgiveness, a loan recipient must use at least 60 percent of the covered loan amount for payroll costs, and may use up to 40 percent of such amount for non-payroll costs, as defined by the CARES Act. Paycheck Protection Flexibility Act of 2020, Pub. L. No. 116-142, § 3, 134 Stat. 641-642 (amending § 1106 of the CARES Act).
430 In a Frequently Asked Questions (FAQ) document dated April 2, 2020 posted under program information on Treasury’s website, Treasury noted that “an air carrier or contractor that has applied for or received support under other provisions of the CARES Act is not precluded, by virtue of such applications or support, from ap plying for and receiving Payroll Support.”

Appendix I: Enclosures
Page 309 GAO-21-191
funds. Specifically, in September 2020, we reported layoffs and furloughs announced by several large aviation contractors before signing their PSP agreements with Treasury. In addition, several major airlines reported using voluntary measures to reduce employment levels—including voluntary separation through early retirement programs and extended leave programs—to allow them to reduce costs.
As a result, while these actions could be determined to be consistent with statutory and program requirements, they make it more difficult to ensure that PSP funds are used exclusively to continue to pay employees. This risk is also heightened by certain program circumstances and decisions. These include the range of dates PSP agreements were signed—from April through October 2020—and Treasury’s decision to put no deadline on recipients’ use of PSP funds.
PSP recipients that signed award agreements by end of June 2020 were required to submit their first compliance reports in August, but Treasury has not fully established a monitoring system. According to Treasury guidance, PSP recipients that signed award agreements before June 30, 2020, were required to submit their first quarterly compliance report by August 14, 2020.431 According to Treasury officials, they have taken the following steps to monitor PSP recipients’ compliance with award agreement terms:
· Performing an initial automated review of quarterly reports to assess recipient compliance with PSP agreement terms and conditions, including a review of the use of PSP funds, involuntary terminations or furloughs, and involuntary reductions of compensation pay rates and benefits. This review resulted in a scorecard that presented the potential for compliance issues for each recipient and for each compliance test applied. The scorecards have been reviewed by Treasury personnel to determine if recipients are either in compliance or appear to be out of compliance.
· Performing a second level of in-depth review, for any recipient deemed potentially noncompliant, by Treasury analysts. Recipients may be asked to provide additional information. Recipients may be cleared or found to be out of compliance. Treasury also plans to include additional recipients, beyond those deemed potentially
431 According to Treasury, 489 PSP recipients—the number of recipients that signed agreements as of June 30, 2020—have submitted their first quarterly compliance reports and have undergone Treasury review.

Appendix I: Enclosures
Page 310 GAO-21-191
noncompliant, in this second level of review to ensure a mix of all types of PSP recipients get an in-depth review.
Three months have passed since the first compliance reports were due and Treasury has not completed its plan and guidance to fully describe how it will monitor the extent to which PSP recipients are complying with PSP agreement terms. As a result, some details of its monitoring still have to be determined. For example, the PSP agreement term prohibiting involuntary terminations or furloughs expired on September 30, 2020. In our discussions with Treasury officials, they said they have not determined whether employee headcount data would be required for quarterly compliance reports on the use of funds in reports covering the period after this requirement expired (that is reports submitted after November 14, 2020). However, they may tailor future requests for headcount data to fulfill compliance and other reporting requirements in future quarterly compliance reports.
Regarding guidance on enforcing penalties for noncompliance, according to Treasury officials, Treasury is still in the process of determining remedies for recipients deemed to be noncompliant due to, for example, conducting involuntary terminations or furloughs or not submitting quarterly compliance reports. Treasury plans to finalize its internal guidance on enforcing compliance in November 2020. Certain decisions on penalties for noncompliance will be determined by Treasury’s compliance team and senior management regarding the severity of the noncompliance issue.
Fully developing and implementing a monitoring system to identify and respond to the risk of noncompliance with PSP agreement terms is especially important given the complexity of the entities that Treasury will be monitoring––recipients that include large corporations with operations across the country and small businesses serving their local communities. Without risk-based monitoring that takes into account the differences in recipients’ financial conditions and actions, Treasury may not be able to detect misuse in a timely manner that allows for remediation. Federal internal control standards state that management should consider the potential for fraud—such as misuse—when identifying, analyzing, and responding to risks.
Agency Comments
We provided DOT, the Small Business Administration (SBA), Treasury, and the Office of Management and Budget (OMB) with a draft of this
Appendix I: Enclosures
Page 311 GAO-21-191
enclosure. DOT and Treasury provided technical comments, which we incorporated as appropriate. Treasury’s general comments are reproduced in appendix X. In its management response, Treasury agreed that compliance monitoring is a critical element of the PSP and reiterated the compliance monitoring steps it is currently taking. Treasury neither agreed nor disagreed with our recommendation, but committed to reviewing additional measures that may further enhance its compliance monitoring and ensure that PSP funds are used as intended. OMB and SBA did not provide comments on this enclosure.
GAO’s Methodology
To conduct this work, we reviewed the most recent Treasury data on financial assistance to aviation sector businesses as of October 5, 2020, which through interactions with Treasury officials we found to be reliable for the purposes of summarizing the number and value of PSP awards to recipients; the CARES Act; and related agency guidance. We examined the extent to which recipients of PSP funds were also awarded federal credit assistance through the Paycheck Protection Program (PPP) by matching unique identifiers for each PSP recipient to PPP recipients. We also reviewed current reports (Form 8-Ks) filed with the Securities and Exchange Commission from March 2020 through October 2020 by major airlines and other public companies that received PSP awards over $100 million for passenger air carriers, over $50 million for cargo air carriers, and over $37.5 million for aviation contractors. We reviewed these reports to understand those companies’ rationales and plans to use the assistance programs and the effects of these programs. In addition, we interviewed and/or received written responses from Treasury and DOT officials and industry associations representing businesses eligible to apply to the PSP.
Contact information: Heather Krause, (202) 512-2834, [email protected]
Related GAO Product
Standards for Internal Control in the Federal Government. GAO-14-704G. Washington, D.C.: September 10, 2014.

Appendix I: Enclosures
Page 312 GAO-21-191
Agriculture Spending
The U.S. Department of Agriculture continues to spend CARES Act funds for direct payments to agricultural producers and food purchases for redistribution to food banks, nonprofits, and other entities.
Entities involved: U.S. Department of Agriculture, including its Agricultural Marketing Service and Farm Service Agency
Key Considerations and Future GAO Work
Our work on the U.S. Department of Agriculture’s (USDA) implementation and oversight of a range of CARES Act funds, including any implementation challenges, is ongoing. Among other things, we will continue to examine the department’s
· verification of eligibility and distribution of direct payments to agricultural producers and
· contracting decisions and characteristics of food purchases and redistributions.
Background
COVID-19 has caused disruptions in the U.S. food supply chain, from the farms where raw agricultural commodities are produced, to the food processing and distribution network that enables these commodities to be used by consumers.432 As a result, prices for many major agricultural commodities, including livestock (cattle, hogs, poultry, and dairy), significantly decreased, which has meant a loss in income for many producers. In addition, the closure of institutions (schools, restaurants, and hotels, for example) made it difficult for agricultural producers to market their commodities, leading to the spoilage of crops, dumping of milk, and euthanization of livestock.
This enclosure discusses the following amounts Congress provided to USDA through coronavirus relief legislation, among other things:
432 COVID-19 affected consumer prices for food. In May 2020, the U.S. Bureau of Labor Statistics reported that April 2020 saw the sharpest increase in grocery store prices since 1974.

Appendix I: Enclosures
Page 313 GAO-21-191
· $9.5 billion to USDA’s Office of the Secretary through the CARES Act,433
· $14 billion to the Commodity Credit Corporation through the CARES Act,434 and
· $4 billion through the Families First Coronavirus Recovery Act.435
In addition, USDA has made available $6.5 billion for direct payments to agricultural producers from funding generally available to the agency through its Commodity Credit Corporation.436 The Commodity Credit Corporation is a wholly government-owned entity that finances a broad array of agricultural support programs. It has permanent authority to borrow up to $30 billion at any given time from the Treasury.
Overview of Key Issues
Coronavirus Food Assistance Program—direct payments. USDA continues to spend CARES Act and other funds for direct payments to agricultural producers. In total, USDA announced it will provide up to $30 billion in direct payments through two programs, the Coronavirus Food Assistance Program 1 (CFAP 1) and the Coronavirus Food Assistance Program 2 (CFAP 2). The payments for the programs come from the CARES Act appropriations and the Commodity Credit Corporation.
For CFAP 1, on May 19, 2020, USDA announced up to $16 billion in direct payments to agricultural producers—up to $9.5 billion from CARES Act appropriations to USDA’s Office of the Secretary and up to $6.5 billion from funds the agency previously made available through the Commodity Credit Corporation. For CFAP 2, on September 17, 2020, USDA
433 The CARES Act, Pub. L. No. 116-136, div. B, tit. I, 134 Stat. 281, 505 (2020).
434 Pub. L. No. 116-136, 134 Stat. at 509. Generally, appropriations acts enacted annually reimburse the Commodity Credit Corporation for its net realized losses.
435 Families First Coronavirus Recovery Act, Pub. L. No. 116-127, div. A, tit. I §1101(g) and (i), 134 Stat. 178, 180 (2020). See also, https://www.usda.gov/media/press-releases/2020/05/19/usda-announces-details-direct-assistance-farmers-through.
436 The Commodity Credit Corporation Charter Act is codified at 15 U.S.C. §§ 714 -714p.

Appendix I: Enclosures
Page 314 GAO-21-191
announced up to $14 billion would be available through the Commodity Credit Corporation.437
In CFAP 2, USDA added commodities that were previously ineligible for payments under CFAP 1 and created new payment formulas.438 CFAP 2 will provide up to $100 million to tobacco producers using part of the $9.5 billion that the CARES Act appropriated to the Office of the Secretary for coronavirus relief because, as stated in USDA’s Federal Register notice, the Commodity Credit Corporation Charter Act does not allow payments to tobacco producers.439
As of October 19, 2020, USDA paid about $10.3 billion in CFAP 1 payments for 647,362 approved applications.440 About half of the payments ($5 billion) were for livestock, of which about 87 percent were for cattle. The second highest payments were for nonspecialty crops ($2.6 billion), of which about 67 percent were for corn. The third highest payments were for dairy ($1.8 billion), of which over 99 percent were for milk.
As of October 19, 2020, USDA paid about $6.1 billion in CFAP 2 payments for 349,747 approved applications.441 Over half of the payments ($3.2 billion) were for acreage-based crops, of which about 57 percent were for corn. The second highest payments were for livestock ($1.7 billion), of which about 80 percent were for cattle. The third highest payments were for dairy ($626 million), all of which were for milk.
437 The application period for CFAP 1 was May 26, 2020, through September 11, 2020, with an extension to October 9, 2020, for producers in certain locations impacted by natural disasters. The application period for CFAP 2 is September 21, 2020, through December 11, 2020.
438 CFAP 2 created formulas for three categories of commodities: (1) “price trigger commodities” that receive payments based on price declines, (2) “flat-rate crops” that receive $15 per acre, and (3) “sales commodities” that receive payments based on a percentage of sales.
439 In general, the Commodity Credit Corporation can exercise its powers only with regard to agricultural commodities other than tobacco. 15 U.S.C. § 714c. USDA states in its Federal Register notice that funds available under 15 U.S.C. § 714 c(b), (d), and (e) cannot be used to provide assistance for tobacco. 85 Fed. Reg. 59,380 (Sept. 22, 2020).
440 See https://www.farmers.gov/cfap/data, accessed on October 21, 2020.
441 See https://www.farmers.gov/cfap/data, accessed on October 21, 2020.

Appendix I: Enclosures
Page 315 GAO-21-191
Producers received payments based on a self-certification of the amount they produced or sold on certain dates. According to USDA’s plan for reviewing CFAP, USDA will spot check a minimum of 5 percent of the applications to verify the applicants’ self-reported data.442 USDA officials told us they will begin spot checks of CFAP 1 applications in late October 2020. We plan to evaluate USDA’s efforts to verify the accuracy of applications as part of our ongoing review of CFAP 1 and 2.
According to USDA officials, it is not possible to track how USDA is spending the $14 billion provided under the CARES Act to the Commodity Credit Corporation for its net realized losses. As discussed above, USDA announced it will provide up to $14 billion in direct payments under CFAP 2. While the CARES Act provided a $14 billion reimbursement of the Commodity Credit Corporation, agency officials explained that USDA is not tracking whether the $14 billion reimbursement from the CARES Act is the same $14 billion that it is using to fund CFAP 2. In general, USDA states it does not track the source of Commodity Credit Corporation reimbursements with specific Commodity Credit Corporation spending. USDA does not track the CARES Act reimbursement separately. Therefore, USDA cannot specify how much of the $14 billion reimbursement of the Commodity Credit Corporation provided under the CARES Act is being used for CFAP 2. A further difficulty in tracking the funding is that USDA made the following transfers from the Commodity Credit Corporation to the Office of the Secretary:
· $6.5 billion on May 1, 2020, and · $14 billion on September 16, 2020.443
We are seeking additional information from USDA regarding the $14 billion reimbursement to the Commodity Credit Corporation provided
442 USDA, Farm Production and Conservation (FPAC), Farm Service Agency (FSA), Coronavirus Food Assistance Program (CFAP) Internal Controls and Integrity Plan (May 12, 2020).
443 According to USDA officials, the $14 billion transfer resulted in a corresponding net realized loss for the Commodity Credit Corporation. USDA received a reimbursement of the Commodity Credit Corporation in the Continuing Appropriations Act, 2021 and Other Extensions Act, enacted on October 1, 2020, for the net realized losses as of Septem ber 17, 2020. Pub. L. No. 116-159, div. A, § 173, 134 Stat 709, 725. This reimbursement replenished the Commodity Credit Corporation’s maximum borrowing authority of $30 billion.
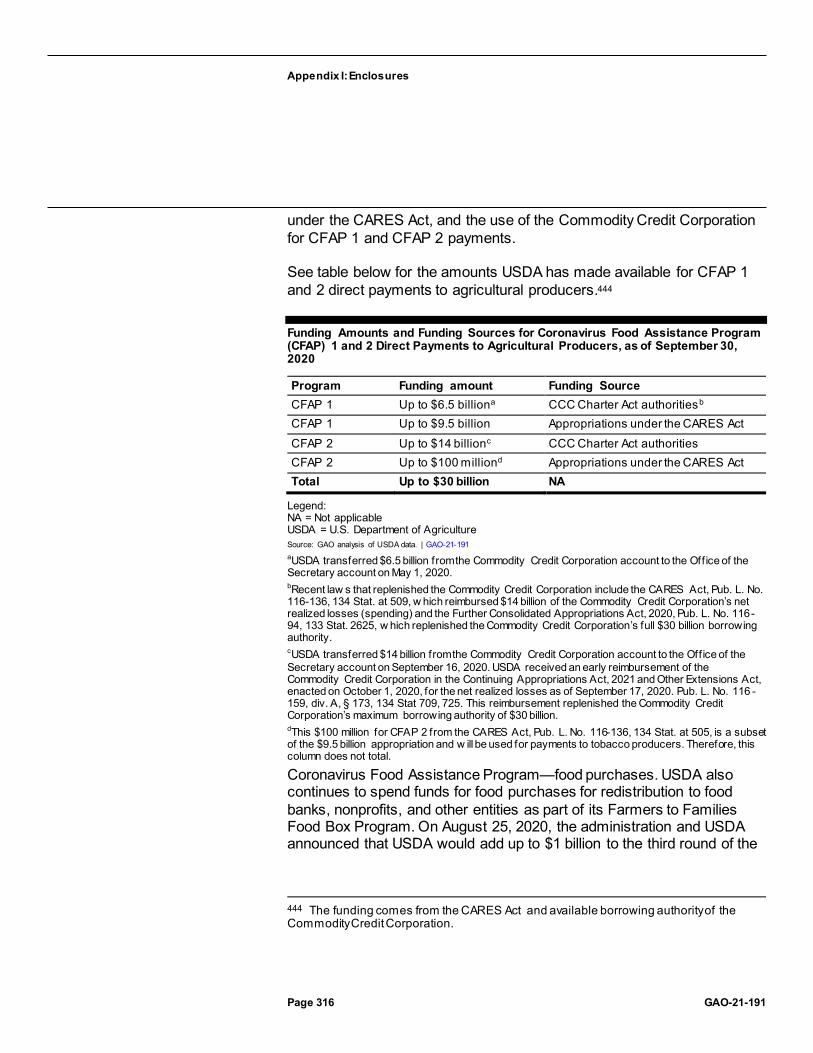
Appendix I: Enclosures
Page 316 GAO-21-191
under the CARES Act, and the use of the Commodity Credit Corporation for CFAP 1 and CFAP 2 payments.
See table below for the amounts USDA has made available for CFAP 1 and 2 direct payments to agricultural producers.444
Funding Amounts and Funding Sources for Coronavirus Food Assistance Program (CFAP) 1 and 2 Direct Payments to Agricultural Producers, as of September 30, 2020
Program Funding amount Funding Source CFAP 1 Up to $6.5 billiona CCC Charter Act authoritiesb CFAP 1 Up to $9.5 billion Appropriations under the CARES Act CFAP 2 Up to $14 billionc CCC Charter Act authorities CFAP 2 Up to $100 milliond Appropriations under the CARES Act Total Up to $30 billion NA
Legend: NA = Not applicable USDA = U.S. Department of Agriculture Source: GAO analysis of USDA data. | GAO-21-191 aUSDA transferred $6.5 billion from the Commodity Credit Corporation account to the Office of the Secretary account on May 1, 2020. bRecent law s that replenished the Commodity Credit Corporation include the CARES Act, Pub. L. No. 116-136, 134 Stat. at 509, w hich reimbursed $14 billion of the Commodity Credit Corporation’s net realized losses (spending) and the Further Consolidated Appropriations Act, 2020, Pub. L. No. 116-94, 133 Stat. 2625, w hich replenished the Commodity Credit Corporation’s full $30 billion borrowing authority. cUSDA transferred $14 billion from the Commodity Credit Corporation account to the Office of the Secretary account on September 16, 2020. USDA received an early reimbursement of the Commodity Credit Corporation in the Continuing Appropriations Act, 2021 and Other Extensions Act, enacted on October 1, 2020, for the net realized losses as of September 17, 2020. Pub. L. No. 116 -159, div. A, § 173, 134 Stat 709, 725. This reimbursement replenished the Commodity Credit Corporation’s maximum borrowing authority of $30 billion. dThis $100 million for CFAP 2 from the CARES Act, Pub. L. No. 116-136, 134 Stat. at 505, is a subset of the $9.5 billion appropriation and w ill be used for payments to tobacco producers. Therefore, this column does not total.
Coronavirus Food Assistance Program—food purchases. USDA also continues to spend funds for food purchases for redistribution to food banks, nonprofits, and other entities as part of its Farmers to Families Food Box Program. On August 25, 2020, the administration and USDA announced that USDA would add up to $1 billion to the third round of the
444 The funding comes from the CARES Act and available borrowing authority of the Commodity Credit Corporation.
Appendix I: Enclosures
Page 317 GAO-21-191
program for a total of up to $4 billion.445 In September 2020, we noted that there are opportunities to identify successes and challenges that could be used to inform future similar efforts if the program is extended; we recommended that USDA conduct an evaluation of the Farmers to Families Food Box Program after the third round of the program.446 The figure below shows the obligations and purchases (or expenditures), as of September 30, 2020, for each round of the program.
445 On October 23, 2020, USDA announced that it had authorized $500 million for a fourth round of purchases for the Farmers to Families Food Box Program. According to a USDA official, the funding will come from unobligated balances of the CARES Act $9.5 billion appropriation to USDA’s Office of the Secretary.
446 GAO, Agriculture Spending: Opportunities Exist for USDA to Identify Successes and Challenges of the Farmers to Families Food Box Program to Inform Future Efforts, GAO-20-711R (Washington, D.C.: Sept. 16, 2020). USDA provided comments on this report and did not explicitly agree or disagree with our recommendation. In response to our recommendation, USDA said that it had initiated an internal review of the program at th e beginning of August 2020 that would verify that procurements were properly accounted for and that payments made to vendors were based on appropriate documentation provided by nonprofit organizations. We responded that we continued to believe that by cond ucting an overall evaluation of the Farmers to Families Food Box Program after the third round of the program, USDA would have better assurance it has identified successes and challenges which could inform future efforts to address similar situations. In October 2020, a USDA official said that Agricultural Marketing Service intended to implement our recommendation.

Appendix I: Enclosures
Page 318 GAO-21-191
Obligations and Purchases for Each Round of the U.S. Department of Agriculture’s Farmers to Families Food Box Program, as of September 30, 2020
Note: According to the U.S. Department of Agriculture, it determines expenditures (or purchases) by the payments USDA makes on invoices it receives from contractors.
Agency Comments
We provided a draft of the report and this enclosure to the Office of Management and Budget and USDA for review and comment. The Office of Management and Budget and USDA’s Agricultural Marketing Service and Farm Service Agency did not comment on this enclosure.
GAO’s Methodology
To conduct this work, we reviewed the most recent data on the USDA website as of October 21, 2020, for CFAP 1 and CFAP 2 spending; reviewed federal laws, agency policy and other guidance, and expenditure and budgetary data provided to us by USDA as of September 30, 2020; reviewed written responses to our questions by USDA officials in the Agricultural Marketing Service and Farm Service Agency; and interviewed USDA officials. We found the data mentioned above to be reliable for our purposes of describing USDA spending.

Appendix I: Enclosures
Page 319 GAO-21-191
Contact information: Steve D. Morris, (202) 512-3841, [email protected]
Federal Food Safety Inspections and Inspectors’ Exposure to COVID19
The U.S. Department of Agriculture continues to spend CARES Act funds—at least $12 million spent of the $33 million appropriated—to maintain staffing for federal inspections of meat and poultry plants, as well as to provide personal protective equipment and supplies for employees.
Entities involved: Food Safety and Inspection Service, within the U.S. Department of Agriculture
Key Considerations and Future GAO Work
Our work on the U.S. Department of Agriculture’s (USDA) implementation and oversight of a range of CARES Act funds, including on any implementation challenges, is ongoing. We will continue to examine the department’s capacity to ensure the continuity of food safety inspections.
The Food and Drug Administration (FDA) did not receive CARES Act funds for food safety-related activities. We plan to examine FDA’s response to COVID-19 with respect to food safety inspections and related activities.
Background
COVID-19 has caused disruptions in the U.S. food supply chain, from the farms where raw agricultural commodities are produced, to the food-processing and distribution network that enables these commodities to be used by consumers.447 The 7,850 inspectors and other staff from the USDA’s Food Safety and Inspection Service (FSIS) work in 6,458 federally inspected meat and poultry plants and other establishments. These inspectors help ensure the safety and wholesomeness of the meat and poultry that enter interstate commerce, and some have been exposed to COVID-19. According to April 2020 interim guidance from the Centers for Disease Control and Prevention and the Occupational Safety
447 COVID-19 continues to affect consumer prices for food. In May 2020, the U.S. Bureau of Labor Statistics reported that April 2020 saw the sharpest increase in grocery store prices since 1974.

Appendix I: Enclosures
Page 320 GAO-21-191
and Health Administration, working in close conditions may contribute to exposure to COVID-19.
As of September 30, 2020, USDA had obligated $17 million and spent $12 million of the $33 million in CARES Act funds that Congress appropriated to FSIS to prevent, prepare for, and respond to COVID-19 with regard to food safety inspections.448
Overview of Key Issues
USDA officials told us that, as of October 1, 2020, they continued to use CARES Act funds for the procurement and distribution of FSIS worker safety items: masks, face shields, sanitizer, and disinfectant. The agency will also use funds to cover the expenses for additional hours of part-time inspectors; the additional inspectors needed from other USDA offices, and associated travel; and nonreimbursable overtime, as needed.449
The agency has maintained all required inspection services to ensure that establishments can operate, according to USDA officials. USDA continues to track USDA inspectors’ absences because of COVID-19-related illness or quarantine. USDA employs 7,850 FSIS inspectors and staff. According to USDA documentation, as of September 30, 2020, 682 FSIS employees (including inspectors) reported a COVID-19 diagnosis confirmed by a test or medical professional. Of these employees, 653 had returned to work, 18 were self-quarantining, and seven had died.450 FSIS employees deceased from COVID-19 are not included in the cumulative count of employees who had a COVID-19 diagnosis, according to USDA documentation. Although FSIS does not have a specific requirement to report COVID-19 infections and relies on staff to self-report, FSIS
448 Pub. L. No. 116-136, div. B, tit. I, 134 Stat. 281, 506.
449 According to a USDA FSIS official, nonreimbursable overtime occurs when an inspector has already worked a full shift and needs to work addition al hours at another establishment that is not in an overtime status and subject to paying FSIS an overtime fee.
450 This number combines inspectors and staff whose occupational exposures may vary. According to USDA documentation, the number of employees who had a COVID-19 diagnosis is cumulative and this cumulative number includes employees who have returned to work (i.e., recovered from the disease).

Appendix I: Enclosures
Page 321 GAO-21-191
employees are required to report an absence from work.451 USDA officials said that as of September 30, 2020, there were no establishments that had to close because of a lack of available USDA inspectors.
FSIS employees have expressed concern about exposure to COVID-19 as outbreaks occurred at some meatpacking plants. According to officials, USDA received 25 reports from FSIS employees that identified COVID-19 as a health-related occupational hazard in meat and poultry plants and other establishments.452 In addition, according to FSIS officials, FSIS has been involved in numerous Department of Labor Occupational Safety and Health Administration inspections and investigations concerning exposure to COVID-19.
FSIS officials stated that the agency continues to follow national guidance for meat and poultry processing workers and employers. To mitigate risks associated with COVID-19, FSIS directs inspection personnel to wear face coverings or masks in conjunction with face shields. The agency has made personal protective equipment available to employees, in addition to hand sanitizer, according to officials. According to USDA officials, as of September 30, 2020, the agency spent over $4 million dollars for FSIS inspectors’ personal protective equipment, including for supplies to combat heat stress.453 The figure below lists the quantity and costs of the agency’s purchases of personal protective equipment for inspectors and other FSIS staff.
451 According to USDA’s FSIS Human Pandemic Operations Plan, under the agency’s leave directive, FSIS employees are required to report to their supervisors if they will be absent from duty and, in the event of a human pandemic, supervisors and managers should initiate a follow-up for any unscheduled employee absence. See U.S. Department of Agriculture, Office of the Administrator, The Food Safety and Inspection Service Human Pandemic Operations Plan, March 2020. U.S. Department of Agriculture, Food Safety and Inspection Service, Leave, FSIS Directive 4630.2 (Washington, D.C.: Sept. 15, 2010).
452 USDA FSIS employees report safety and health hazards by submitting a form to their supervisors or to designated officials in charge. See U.S. Department of Agriculture, Food Safety and Inspection Service, Reporting and Correcting Occupational Hazards, FSIS Directive 4791.12 (Washington, D.C.: June 19, 1996).
453 According to USDA officials, this includes personal protective equipment purchased for in-plant personnel in the field and personal protective equipment for FSIS employees based in laboratories and office locations.

Appendix I: Enclosures
Page 322 GAO-21-191
U.S. Department of Agriculture Food Safety and Inspection Service’s Personal Protective Equipment Purchases by Type, Quantity, and Cost, as of September 30, 2020
Note: Amounts are rounded up to the nearest w hole number. aThis amount includes the cost of a “discontinued” face shield that the agency no longer purchases. bSome purchases combined tw o types of products (e.g., sanitizers and stands or wipes and stands). Therefore, w e were unable to report these quantities separately and w e counted them as one. Regarding the volume of each sanitizer product, it varied from ounces to gallons. cFor costs, this personal protective equipment category includes costs for storing and transporting supplies. dSupplies for heat stress included electrolyte f luids, neck cooling scarves, cooling vests, cooling hat liners, evaporative cooling hard hats, evaporative cooling bandanas, and cooling tie hats.
Agency Comments
We provided a draft of this enclosure to USDA and the Office of Management and Budget for review and comment. USDA provided technical comments that we incorporated as appropriate. The Office of Management and Budget did not have any comments related to this enclosure.
GAO’s Methodology
To conduct this work, we reviewed the most recent USDA data on COVID-19 illnesses and exposures among FSIS employees available as of September 30, 2020; the CARES Act; agency policy and other guidance; USDA expenditure data including purchases of personal protective equipment, as of September 30, 2020; and written responses to questions we emailed USDA officials in the FSIS. We assessed the reliability of agency data by reviewing relevant USDA FSIS documents, reviewing our prior use of the data sources, and reviewing written responses from the agency about the data. We determined the data were

Appendix I: Enclosures
Page 323 GAO-21-191
sufficiently reliable for our purposes of determining (1) the number of FSIS staff; (2) the number that had become ill with COVID-19; and (3) the types, quantity, and cost of personal protective equipment for FSIS staff.
Contact information: Steve D. Morris, (202) 512-3841, [email protected]
USDA Support for Rural America
The U.S. Department of Agriculture has made progress in awarding CARES Act funding for grants to improve broadband access and for business development loans to help address the COVID-19 pandemic in rural America.
Entities involved: U.S. Department of Agriculture, including the Rural Utilities Service and Rural Business-Cooperative Service
Key Considerations and Future GAO Work
In our June 2020 CARES Act report, we stated that the U.S. Department of Agriculture (USDA) officials said they are still working to implement three open recommendations from our April 2017 report examining the Rural Utilities Service’s (RUS) broadband grant and loan program. Those recommendations address USDA’s management of the program related to periodic evaluations of completed grant projects, monitoring grantees, and developing written policies and procedures. USDA officials said that they plan to complete their efforts by the end of 2020. We will continue monitoring the implementation of these recommendations.
Background
USDA Rural Development agencies support economic development and essential services to help improve the economy and quality of life in rural America. These agencies include RUS, which works to address rural infrastructure needs, and the Rural Business-Cooperative Service (RBCS), which offers programs to support businesses and job training.
The CARES Act provided $145.5 million in funding for three Rural Development programs to prevent, prepare for, and respond to coronavirus:454
454 Pub. L. No. 116-136, 134 Stat. 281, 507, 510 (2020).

Appendix I: Enclosures
Page 324 GAO-21-191
· ReConnect. $100 million for RUS to provide additional grants to support broadband deployment projects in rural areas that lack sufficient access to broadband
· Distance Learning and Telemedicine. $25 million for RUS to provide financial assistance to help rural areas develop and acquire distance learning and telemedicine equipment and services
· Rural business development programs. $20.5 million for RBCS to make loans to improve business, industry, and employment and the economic and environmental climate in rural communities
Overview of Key Issues
USDA has made progress in providing the $145.5 million in CARES Act funding for the ReConnect, Distance Learning and Telemedicine, and rural business development programs.
ReConnect. From June through September 2020, USDA announced nine ReConnect awards funded by the CARES Act for broadband providers in seven states: Georgia, Maryland, Mississippi, Missouri, North Carolina, Oklahoma, and Tennessee.455 These nine awards totaled about $90 million, of which about $85 million will be provided in grants, with one award consisting of a combination of a $4.9 million grant and a $4.9 million loan from CARES Act funding and second round ReConnect Program funding.456 According to USDA documents, these projects are collectively estimated to serve about 15,700 households, 1,800 farms, and 420 businesses, in addition to also serving schools and other community institutions. USDA received two other applications for ReConnect grants; however, USDA officials said there were issues with the applications that prevented the agency from making awards. Officials said that USDA will reach out to these two applicants to obtain additional documentation to support their applications.
455 Once ReConnect applicants are announced as receiving awards, they must meet any applicable additional terms and conditions specific to the award before funds are provided.
456 The ReConnect program distributes awards as (1) grants, (2) loans, or (3) combinations of grants and loans. The CARES Act provided funding to USDA to make additional awards as grants. Prior USDA appropriations for the program included funding for grants and loans.
Appendix I: Enclosures
Page 325 GAO-21-191
USDA officials said they verified the eligibility of award recipients through a three-step process consisting of:
4. an initial review to determine if basic eligibility requirements had been satisfied;
5. a detailed financial, technical, and environmental review; and 6. a validation process to check that the area the provider proposes
serving currently lacks broadband service as specified by the requirements of the program.457
Award recipients we interviewed told us they took steps to make sure their applications included only eligible areas by eliminating potential service areas from their applications that could make their applications ineligible.
USDA officials said they are addressing risks of fraud in the program by updating its fraud risk assessment and monitoring grantees in the same manner as other ReConnect grantees to ensure compliance with program requirements. Award recipients we interviewed acknowledged that they must report to USDA on their progress once they start using grant funds.458 Awardees we interviewed said that they had not yet started deploying broadband using the grants, as the awards are in various stages of review before USDA finalizes them and makes funds available.
Distance Learning and Telemedicine. USDA is using CARES Act funds for a second round of grants under its existing Distance Learning and Telemedicine Grants program. Of the total $25 million appropriated, USDA officials told us they allocated $24.25 million for grants and that the remaining $750,000 is being used for administrative and oversight-related
457 To be eligible for ReConnect, the proposed service area must be rural and at least 90 percent of its households must lack access to fixed broadband of at least 10 megabits per second (Mbps) download speed and 1 Mbps upload speed. See Consolidated Appropriations Act, 2018, Pub. L. No. 115-141, § 779, 132 Stat. 348, 399; Consolidated Appropriations Act, 2019, Pub. L. No. 166-6, § 762(a), 133 Stat. 13, 88. Similarly, the CARES Act requires that at least 90 percent of the households to be served by a project receiving a grant from the $100 million appropriated for ReConnect be in a rural area without sufficient access to broadband.
458 USDA published a notice in April 2020 that informs the public that the CARES Act provides an additional $100 million for ReConnect grants. The funding notice provides for awardees to follow the same eligibility and other requirements as a December 2019 notice announcing application procedures for funding under ReConnect, which includes semiannual reports for 3 years after the completion of con struction.
Appendix I: Enclosures
Page 326 GAO-21-191
expenses for the program.459 As of October 2020, USDA officials said that they were reviewing the 534 applications they received as of July 2020 and expected to complete their review and make awards later in the 2020 calendar year.460 Of the 534 applications, 189 were from nonprofit organizations.
According to USDA, while the CARES Act requires these funds be used to prevent, prepare for, and respond to COVID-19, the agency believes projects funded under its existing program already serve that purpose. As a result, USDA is encouraging applicants to identify specific ways in which their application addresses COVID-19, but the agency is not requiring applicants to do this. For example, one applicant stated that the funds would allow the entity to assess patients in their homes to determine if there is an emergent need to be seen and, if so, allow staff to prepare to care for patients with full personal protective equipment once they arrive on site.
Rural business development programs. According to USDA officials, as of September 25, 2020, they had made 70 loans for a total of about $214 million. USDA has stated that agricultural producers that are not eligible for USDA Farm Service Agency loans may receive funding through the program. As of September 25, 2020, 9 of the 70 loans that had been approved were for agricultural producers. USDA plans to provide funding for approved loans through September 2021 (or until the funding runs out), after which no loans from this program funded by the CARES Act will be approved.
Agency Comments
We provided a draft of this enclosure to USDA and the Office of Management and Budget (OMB) for review and comment. USDA and OMB did not provide comments on the enclosure.
GAO’s Methodology
To conduct this work, we reviewed federal laws and agency documents, including program funding notices, and we requested and reviewed updates from USDA officials about their ongoing efforts to implement
459 CARES Act, § 11001, 134 Stat. at 509 (allowing up to 3 percent of the funds made available to the Rural Development mission area to be used for administrative costs).
460 The application window for the second round of grants closed as of July 13, 2020.

Appendix I: Enclosures
Page 327 GAO-21-191
provisions of the CARES Act. We also interviewed three broadband providers that were awarded CARES Act-funded grants through the ReConnect program to learn more about how they intend to use the grants and any challenges they experienced. We selected providers among those USDA had announced would receive ReConnect grants funded through the CARES Act to represent a variety of providers serving different states with a focus on those with larger grant awards; larger square-mileage served; and a greater number of households, people, and businesses served. Finally, we reviewed written responses to our questions by USDA officials in Rural Development on the status of spending for the ReConnect, Distance Learning and Telemedicine, and rural business development programs.
Contact information: Andrew Von Ah, (202) 512-2834, [email protected]
Related GAO Product
Rural Broadband Deployment: Improved Consistency with Leading Practices Could Enhance Management of Loan and Grant Programs. GAO-17-301. Washington, D.C.: April 13, 2017.
Community Economic Development Support
As of September 30, 2020, the Economic Development Administration had obligated over half of its CARES Act funds to existing grantees, primarily to provide lending capital to local businesses, and was finalizing its performance monitoring system.
Entity involved: Economic Development Administration, within the Department of Commerce
Key Considerations and Future GAO Work
We reported in June 2020 that the Department of Commerce’s (Commerce) Economic Development Administration (EDA) would need to ensure that CARES Act funds are distributed in a timely and transparent way to support local economies while providing sufficient oversight. Since June 2020, we have monitored EDA’s efforts to distribute and oversee CARES Act funds. Our work in these areas is ongoing.

Appendix I: Enclosures
Page 328 GAO-21-191
Background
EDA received about $1.5 billion through the CARES Act to fund grants under its Economic Adjustment Assistance program to help communities prevent, prepare for, and respond to COVID-19.461 EDA has traditionally supported communities experiencing long-term economic distress or sudden economic dislocation through public infrastructure investments, technical assistance and research, and comprehensive economic development strategies. EDA provides grants to EDA-designated district organizations, Indian tribes, institutions of higher education, state and local governments, and nonprofits that support businesses and organizations in distressed communities.462
As of September 30, 2020, EDA had obligated 54 percent of these funds ($805 million) and expended $22 million.463 In comparison, in June 2020, we reported that EDA had obligated less than 1 percent of these funds. The CARES Act provided that all EDA funds are available for obligation until September 30, 2022.
Overview of Key Issues
Status of funds. In recognition of the national effects of COVID-19, EDA allocated funds among its six regions, each of which received between $193 million and $266 million (see figure).464 EDA officials said they
461 Pub. L. No. 116-136, 134 Stat. 281, 510-511(2020). Up to 2 percent of the CARES Act funds may be used by EDA for salaries and expenses for related administration and oversight activities. An additional $3 million were to be transferred to Comm erce’s Office of Inspector General to carry out investigations and audits related to appropriated funds. Although the amount appropriated to EDA through the CARES Act was about five times its annual appropriation for fiscal year 2020, EDA received a total of $1.2 billion in fiscal years 2018 and 2019 to respond to the economic effects of natural disasters occurring in 2017–2019.
462 According to EDA, the agency is not authorized to provide economic adjustment assistance grants to individuals or for-profit entities. See generally 42 U.S.C. § 3122(4) and 13 C.F.R. § 300.3. District organizations include multi -jurisdictional entities, commonly composed of multiple counties.
463 Obligated and expended amounts do not include the $3 million transferred to the Department of Commerce’s Office of Inspector General to carry out investigations and audits related to the appropriated funds.
464 According to EDA officials, EDA also allocated $40 million to support innovation and entrepreneurship challenge and national technical assistance grants made through its headquarters.

Appendix I: Enclosures
Page 329 GAO-21-191
based the regional allocations on indicators of the preexisting economic conditions and on information on the regional effects of the pandemic, and noted that EDA may update the allocations as needed.465 As of September 30, 2020, the largest portion of EDA’s obligated CARES Act funds (26 percent, or $208 million) was awarded to states in the Northeast region, and the amount obligated to individual states nationwide ranged from $300,000 (Hawaii) to $56 million (California) (see figure). According to EDA officials, approximately 60 percent of funds were obligated to entities located in regional or multi-jurisdictional areas that encompass both urban and rural areas, 17 percent to entities in rural areas, and 23 percent to entities in urban areas.466
465 In determining these regional allocations, EDA officials explained that they considered prepandemic unemployment rates and per capita income, among other things. As of September 2020, EDA officials stated that they had not changed their initial allocations.
466 Urban areas represent densely developed territory and encompass residential, commercial, and other nonresidential urban lands and are identified as those areas with 50,000 or more people or clusters of at least 2,500 and less than 50,000 people. Rural areas encompass all population, housing, and territory not included within an urban area. Regional or multi-jurisdictional areas are those that include both urban and rural communities.

Appendix I: Enclosures
Page 330 GAO-21-191
Economic Development Administration Grants Awarded with CARES Act Funds by State and U.S. Territory, as of September 30, 2020
Further, to distribute funds quickly and mitigate compliance risks from entities unfamiliar with EDA’s grant process, EDA officials told us they initially prioritized noncompetitive awards to existing grantees because they are already familiar with EDA processes and have experience
Appendix I: Enclosures
Page 331 GAO-21-191
responding to economic dislocation caused by disasters.467 As of September 30, 2020, EDA had obligated $778 million in CARES Act funds through noncompetitive grant awards to existing grantees.468 The majority of these grant funds (78 percent, or $605 million) went to approximately 300 revolving loan funds to provide access to capital for businesses affected by COVID-19.469
EDA officials told us that they are taking steps to encourage new grantees to participate in the competitive award process by holding virtual meetings with regional and local economic development stakeholders, issuing social media advisories, and providing guidance on the grant application process to local organizations. As of September 30, 2020, EDA had obligated $27 million in CARES Act funds through competitive grant awards to 10 grantees, including one new grantee. EDA officials told us that approximately 44 percent of the approximately 950 competitive award applications it had received as of September 30, 2020, were from new applicants.470
Spending challenges. EDA officials told us that they anticipate obligating approximately 90 percent of the $1.47 billion available for grants under the CARES Act by the third quarter of fiscal year 2022, and the remaining 10 percent by the fourth quarter of fiscal year 2022. According to EDA officials, some of the challenges to distributing funds are limited local capacity to prepare and submit applications and the length of the required
467 EDA also limited its noncompetitive awards to certain activities (economic recovery planning and coordination, technical assistance, and rapid delivery of lending capital to small businesses) that it identified as essential for the immediate response to COVID -19.
468 According to EDA officials, as of September 30, 2020, 784 of EDA’s 851 eligible existing grantees had received a noncompetitive CARES Act award. Only existing grantees that are in substantial compliance with the terms and conditions of their awards and whose awards are not suspended or in the process of termination and, for revolving loan fund recipients, whose EDA-funded revolving loan funds were rated “A” or “B” under EDA’s Revolving Loan Fund Risk Analysis System were eligible to apply for a noncompetitive CARES Act award.
469 EDA provides grants to eligible entities to capitalize revolving loan funds that lend to businesses that cannot otherwise obtain traditional bank financing. As of September 30, 2020, the remaining $173 million in grants was awarded to 365 economic development districts and 46 Indian tribes to help develop COVID-19 economic recovery strategies, and to 62 universities to provide technical or other assistance to businesses’ and communities’ economic recovery efforts.
470 New applicants are those that have never applied for an EDA grant or have not applied within the last 10 years.

Appendix I: Enclosures
Page 332 GAO-21-191
review processes for some types of projects, such as infrastructure projects, which may require environmental or historic preservation reviews.471 EDA officials noted that they are still hiring the additional staff authorized by the CARES Act. As of September 30, 2020, EDA officials said they had hired 70 of the approximately 100 additional staff they plan to bring on to help manage and oversee their CARES Act activities. EDA expects to complete hiring for CARES Act-funded-positions by spring 2021.
Oversight. EDA officials said they are taking steps to integrate oversight best practices identified by Commerce’s Office of Inspector General into their CARES Act response.472 This includes updating existing procedures, hiring a new executive manager responsible for managing and coordinating EDA’s CARES Act activities, and participating in training on grant management, oversight, and fraud awareness led by the Office of Inspector General. As of late September 2020, EDA had hired a new executive manager and was finalizing its performance monitoring system for the CARES Act awards. To oversee grantee activities, the agency plans to increase the frequency of CARES Act award progress reviews and financial monitoring to at least semiannually, as opposed to the annual financial monitoring conducted as part of its regular oversight.473 In addition, according to EDA officials, CARES Act awards for all
471 EDA anticipates making awards for infrastructure projects that address the effects of COVID-19 on various communities. Examples of such projects include broad band infrastructure to support telecommuting, public infrastructure to support local manufacturing facilities producing pandemic response items, and infrastructure to support diversification of local economies that are highly dependent on sectors vulnerabl e to COVID-19 (e.g., tourism).
472 Department of Commerce, Office of Inspector General, Bipartisan Budget Act of 2018: Oversight Challenges Facing the Economic Development Administration, OIG-18-022 (Washington, D.C.: June 4, 2018). The Office of Inspector General identified five actions EDA should take to oversee 2018 disaster relief funds: (1) follow a comprehensive oversight implementation strategy; (2) acquire sufficient staff with the appropriate proficiency; (3) develop a risk management strategy to strengthen internal control; (4) mitigate fraud, waste, and abuse; and (5) identify unused funds for use on other eligible projects.
473 For CARES Act–funded grantees, EDA plans to perform quarterly progress reviews and semiannual financial monitoring of infrastructure grants and semiannual progress reviews and financial monitoring of noninfrastructure grants.

Appendix I: Enclosures
Page 333 GAO-21-191
noninfrastructure grantees will be subject to EDA’s new performance measurement and evaluation process beginning in December 2020.474
Agency Comments
We provided EDA (within Commerce) and the Office of Management and Budget with a draft of this enclosure. Neither agency had comments.
GAO’s Methodology
To conduct this work, we reviewed EDA’s grant award data as of September 30, 2020, federal laws and agency documents, and written responses from EDA officials. We assessed the reliability of EDA’s data by reviewing relevant documentation and written responses from agency officials. We determined that the data were sufficiently reliable for the purpose of describing state-level award distribution. To better understand local community experience with EDA funds, we also interviewed two nationwide organizations that represent organizations responsible for economic development activities in their communities. Their views are not generalizable to other associations that work in community economic development, but offered important perspectives.
Contact information: John Pendleton, (202) 512-8678, [email protected]
Paycheck Protection Program
The Small Business Administration has started accepting decisions from lenders on Paycheck Protection Program loan forgiveness, and the loan forgiveness process will be ongoing for some time.
Entities involved: Small Business Administration, Department of the Treasury
Key Considerations and Future GAO Work
In June 2020, we recommended that the Small Business Administration (SBA) develop and implement plans to identify and respond to risks in the 474 Under EDA’s new performance measurement and evaluation system, all noninfrastructure grantees are required to report semiannually on the outputs of their activities (such as the number of trainings held or loans made) and annually on the outcomes of those activities (such as the number of jobs created).

Appendix I: Enclosures
Page 334 GAO-21-191
Paycheck Protection Program (PPP) to ensure program integrity, achieve program effectiveness, and address potential fraud, including in loans of $2 million or less. Consistent with our recommendation, SBA has developed oversight plans but has not provided requested documentation yet detailing its plans and how it will implement them.
Our work on PPP is ongoing. We continue to examine the borrowers that received the PPP loans, the safeguards SBA implemented to help ensure that lenders and borrowers complied with program requirements, and the loan forgiveness process.
Background
The CARES Act and the Paycheck Protection Program and Health Care Enhancement Act appropriated a total of $670 billion for PPP under SBA’s largest guaranteed loan program, its 7(a) small business lending program.475 PPP loans, made by lenders but guaranteed 100 percent by SBA, are low interest (1 percent) and fully forgivable if certain conditions are met.476
As of August 8, 2020 (the close of the program’s application period), lenders had made over 5.2 million PPP loans totaling more than $525 billion.477 According to SBA officials, SBA had obligated about $532 billion for PPP, including lender fees, and expended about $528 billion as of October 31, 2020.
475 See Pub. L. No. 116-136, §§ 1102(b), 1107(a)(1), 1112, 134 Stat. 281, 293, 301; Pub. L. No. 116-139, § 101(a), 134 Stat. 620, 620 (2020).
476 As originally implemented by SBA, at least 75 percent of the loan forgiveness amount must have been for payroll costs. In addition, the CARES Act required loans to be used within an 8-week period in order for the loans to be fully forgiven. However, the Paycheck Protection Program Flexibility Act of 2020 modified this to at least 60 percent and allowed borrowers to pay or incur those expenses over a 24 -week period. Pub. L. No. 116-142, § 3, 134 Stat. 641, 641-42 (2020). Under the Paycheck Protection Program Flexibility Act of 2020, the covered period for PPP loans ends the earlier of 24 weeks after origination or December 31, 2020.
477 Totals exclude canceled loans. According to SBA, canceled loans may include, but are not limited to, duplicative loans, loans not closed for any reason, and loans that were fully paid off. In our September 2020 report, we provided information on the types of borrowers that received PPP loans and the size of PPP loans.

Appendix I: Enclosures
Page 335 GAO-21-191
Overview of Key Issues
Loan forgiveness process. As shown in the figure below, the PPP loan forgiveness process will be ongoing for some time. The period for requesting loan forgiveness varies because the borrower may submit the loan forgiveness application any time on or before the maturity date of the loan—including before the end of the 8- or 24-week covered period—if the borrower has used all of the loan funds for which the borrower is requesting forgiveness.478 Borrowers are incentivized to wait no more than 10 months after the last day of the covered period to apply for loan forgiveness because the loan deferral period ends then (meaning that borrowers must start making payments of principal, interest, and fees).479
However, as of October 19, 2020, not all lenders had begun accepting loan forgiveness applications. Once a borrower submits a loan forgiveness application, lenders have 60 days to make a decision, and SBA has 90 days after the lender issues its decision to SBA, subject to any SBA review of the loan or loan application, to remit the appropriate forgiveness amount to the lender. As a result, borrowers that choose not to apply for forgiveness until October 2021 may not get resolution on their loan forgiveness application until March 2022 (or later if there are appeals or the borrower waits until after the deferment period to apply for loan forgiveness).
478 For loans made before June 5, 2020, the maturity is 2 years; however, borrowers and lenders may mutually agree to extend the maturity of such loans to 5 years. For loans made on or after June 5, 2020, the maturity is 5 years. For purposes of loan forgiveness, the covered period is generally the 24-week period beginning on the date the lender disburses the PPP loan. Alternatively, a borrower that received a PPP loan before June 5, 2020, may elect for the covered period to end 8 weeks after the date of disbursement of the PPP loan.
479 The loan deferral period can extend past the 10 -month mark if the borrower’s loan forgiveness application is still being processed because the deferment does not end until SBA remits the forgiveness payment (if any).

Appendix I: Enclosures
Page 336 GAO-21-191
Paycheck Protection Program (PPP) Loan Forgiveness Process Time Frames
aThe maximum time for PPP loan forgiveness may take longer if the borrower waits until after the deferment period to apply for loan forgiveness. bSBA’s Loan Review Procedures Interim Final Rule subjected the 90 day remittance timeline to any SBA review of the loan or loan application. 85 Fed. Reg. 33,010, 33,013 (June 1, 2020).
According to SBA officials, SBA had received about 397,000 loan forgiveness decisions from lenders (about 7.6 percent) as of November 4, 2020, and had reviewed all of these decisions using an automated review tool to identify potential indicators of noncompliance with select eligibility requirements, fraud, or abuse. SBA officials stated that as of October 2, 2020, SBA had begun remitting loan forgiveness payments for loans of less than $2 million that were not flagged by the automated tool.480 As of October 30, 2020, SBA was still finalizing documentation on its procedures for reviewing lenders’ loan forgiveness decisions.
In September 2020, 10 trade associations representing banks and credit unions of all sizes sent a letter to Congress that called for simplifying the “overly complicated” loan forgiveness process.481 They expressed support for proposed legislation that would simplify the forgiveness application
480 According to SBA officials, as of November 4, 2020, SBA had made about 168,000 forgiveness payments totaling $20.2 billion.
481 In the letter, the lender associations also asked Congress to extend PPP. According to SBA officials, loan forgiveness is prescribed by statute but SBA has worked to make the process as user-friendly as possible, consistent with the statute and the agency’s obligation to protect taxpayer dollars.

Appendix I: Enclosures
Page 337 GAO-21-191
process for the smallest borrowers, stating that such measures would eliminate the existing requirement to spend several hours completing onerous paperwork or hiring consultants to comply with the existing PPP loan forgiveness forms. On October 8, 2020, SBA and the Department of the Treasury (Treasury) posted an interim final rule that simplified the forgiveness and loan review processes for PPP loans of $50,000 or less.482 In conjunction with the rule, SBA released a new form that requires fewer calculations and less documentation for eligible borrowers.483
SBA oversight plans. In our June 2020 report, we recommended that SBA develop and implement plans to identify and respond to risks in PPP to ensure program integrity, achieve program effectiveness, and address potential fraud, including in loans of $2 million or less. SBA neither agreed nor disagreed with our recommendation at that time. Because SBA had limited time to implement up-front safeguards for the PPP loan approval process and assess program risks, we reported that ongoing oversight would be crucial. We also reported that although SBA had announced efforts to implement safeguards after loan approval, the agency provided limited information on how it would implement these safeguards.
As we reported in September 2020, SBA has said that it plans to review all PPP loans of $2 million or more and further stated that it may review any PPP loan it deems appropriate, including loans of less than $2 million.484 They also told us at the time that a contractor would use the automated review tool previously discussed to flag potentially questionable loans and that contractor and SBA staff would conduct a manual review of loans flagged by the tool. According to SBA officials in October 2020, SBA was also flagging loans for manual review identified through a variety of ways, including Department of Justice (DOJ) or SBA Office of Inspector General referrals, fraud tips, credible media reports, or whistleblowers.
482 85 Fed. Reg. 66,214 (Oct. 19, 2020). According to SBA, there are approximately 3.57 million outstanding PPP loans of $50,000 or less, totaling approximately $62 billion.
483 Borrowers that use the new form are exempt from reductions in loan forgiveness amounts based on reductions in full -time equivalent (FTE) employees or in employee salaries or wages. They also are not required to show the calculations used to determine their loan forgiveness amount. However, SBA may request information and documents to review those calculations as part of its loan review process.
484 See 85 Fed. Reg. 33,010, 33,012 (June 1, 2020).
Appendix I: Enclosures
Page 338 GAO-21-191
According to Treasury officials, the loan review process will test loans for compliance with program requirements and evaluate the accuracy of PPP borrowers’ self-certifications and material representations. SBA officials told us that as of October 30, 2020, they had developed the review process and tested it on some loans but were still refining the process and finalizing documents that summarize it. They also told us that they would provide us a document outlining the loan review process when it was finalized.
Cases of potential PPP fraud. We reported in October 2020 that given the immediate need for PPP loans, SBA worked to streamline the program so that lenders could begin distributing these funds as soon as possible. As a result, we noted that there may be significant risk that some fraudulent or inflated applications were approved.
Since May 2020, DOJ has publicly announced charges in over 60 fraud-related cases associated with PPP funds.485 The charges—filed across the U.S. and investigated by a range of law enforcement agencies—include allegations of making false statements and engaging in identity theft, wire and bank fraud, and money laundering. As of September 2020, DOJ estimated that the defendants in these cases sought to get more than $175 million in PPP loans and actually received more than $70 million in PPP loans, of which law enforcement agencies have recovered more than $30 million. Additionally, according to SBA’s Office of Inspector General, as of October 1, 2020, it had received tens of thousands of complaints of wrongdoing on its hotline and initiated hundreds of investigations involving complaints of fraud associated with SBA loan programs.
Agency Comments
We provided SBA, Treasury, and the Office of Management and Budget (OMB) with a draft of this enclosure. SBA and Treasury provided technical comments that we incorporated as appropriate. OMB did not have any comments.
SBA made one comment that we considered more than technical in nature. It disagreed with our statement that SBA had not provided documentation detailing its oversight plans and how it will implement
485 Both SBA and Treasury officials observed that the number of fraud -related cases was small relative to the large size of the PPP program.

Appendix I: Enclosures
Page 339 GAO-21-191
them. Specifically, SBA stated that it had provided us with a copy of a contract statement of work and explained in detail the loan review process with its layers of review. SBA provided us the contract statement of work and a high-level overview of the layers of review in interviews. However, SBA has not provided documents we have requested, such as procedures and checklists that SBA and contractor staff will follow during the review process, that would allow us to evaluate the efficacy of the reviews in identifying noncompliance and potential fraud. In other comments on the draft report, SBA acknowledged that it was still finalizing documents that summarize the loan review process.
GAO’s Methodology
To conduct this work, we reviewed interim final rules and guidance issued by SBA and Treasury and interviewed SBA and Treasury officials. We assessed the reliability of SBA’s data by interviewing SBA officials. We determined that the data were sufficiently reliable for reporting on the number and dollar amount of PPP loans and the status of expenditures.
Contact information: William B. Shear, (202) 512-8678, [email protected]
Related GAO Product
Small Business Administration: COVID-19 Loans Lack Controls and Are Susceptible to Fraud, GAO-21-117T. Washington, D.C.: October 1, 2020.
Economic Injury Disaster Loan Program
The Small Business Administration’s cumulative average processing time for Economic Injury Disaster Loan applications has increased from about 29 to about 31 days since our September 2020 report. We continue to have concerns about the agency’s communication of program information, such as what information applicants should provide to SBA to request reconsideration of declined applications, and management of fraud risk.
Entity involved: Small Business Administration
Key Considerations and Future GAO Work
We remain concerned about challenges we reported in September 2020 related to the Small Business Administration’s (SBA) communication of

Appendix I: Enclosures
Page 340 GAO-21-191
program information to Economic Injury Disaster Loan (EIDL) applicants. Stakeholders also continue to raise questions about loan caps and the extent to which the EIDL program is meeting small business needs, as businesses face uncertainties surrounding the duration of the pandemic. Finally, we continue to be concerned about the potential for fraud in the program and have ongoing work related to internal control and fraud prevention.
As we reported on October 1, 2020, we have experienced delays in obtaining data and information requested from SBA. SBA has provided some of the information we requested, and we are working with SBA to obtain complete records in order to continue our work.
Background
To assist small businesses adversely affected by COVID-19, in the Paycheck Protection Program and Health Care Enhancement (PPPHCE) Act, Congress appropriated $50 billion in loan credit subsidies for SBA to make EIDL loans. Additionally, in the CARES Act and the PPPHCE Act, Congress appropriated $20 billion for advances, a new component of the program.486 On July 11, 2020, SBA announced that it had fully allocated the $20 billion in funding for EIDL advances and stopped accepting requests for them. The agency plans to continue to accept applications for EIDL loans through either December 31, 2020, or when funding is exhausted, whichever comes first.487
Overview of Key Issues
SBA continues to process EIDL loan applications. As of October 3, 2020, SBA had accepted about 15.5 million applications for EIDL loans related 486 The Coronavirus Preparedness and Response Supplemental Appropriations Act, 2020, made businesses experiencing economic injury caused by COVID-19 eligible for the EIDL program. As a result, SBA has used its existing $1.1 billion in loan credit subsidy to provide between $7 billion and $8 billion in EIDL loans to affected businesses. The loan credit subsidy covers the government’s cost of extending or guaranteeing credit and is used to protect the government against the risk of estimated shortfalls in loan repayments. SBA also provided advances using the $10 billion Congress appropriated under the CARES Act. Under the Paycheck Protection Program and Health Care Enhancement Act, Congress appropriated another $10 billion for advances and $50 billion in loan credit subsidy for EIDL loans.
487 SBA’s application deadline for COVID-19-related EIDL loans is December 31, 2020, and CARES Act changes to application requirements for EIDL loans due to COVID -19 are in effect through December 31, 2020. However, Congress did not include an application deadline for EIDL loans due to COVID-19.

Appendix I: Enclosures
Page 341 GAO-21-191
to COVID-19 and approved about 3.6 million of these applications, totaling about $194.2 billion in loans (or an average of about $53,000 per loan). As of September 30, 2020, SBA officials said the agency had $24.89 billion in loan credit subsidy remaining and estimated that the agency could make about $279.1 billion in additional loans.
Loan recipient characteristics vary. EIDL loan data as of October 4, 2020 indicate that businesses in certain states obtained higher amounts of EIDL loans. The average loan size for each borrower by state ranged from about $42,000 in Mississippi to about $63,000 in North Dakota. In 21 states, the average loan size was below the national average of $53,000. In 29 states and the District of Columbia, the average loan size was at or above $53,000. Additionally, the average dollar amount of EIDL loans relative to the total number of small businesses in each state ranged from about $3,500 in Kentucky to about $8,200 in California (see figure).
Average Dollar Amount of Economic Injury Disaster Loans Relative to the Total Number of Small Businesses in Each State, as of October 4, 2020
Note: Numbers of small businesses are from the Small Business Administration’s 2020 Small Business Profile, and dollar amounts of loans are from its Economic Injury Disaster Loan program
Appendix I: Enclosures
Page 342 GAO-21-191
data as of October 4, 2020. We excluded U.S. territories from the f igure because the 2020 Small Business Profile used different measures for them.
Application processing times increased. As of October 3, 2020, SBA’s cumulative average processing time for all EIDL loan applications was about 31 days, an increase of 2 days compared to the approximately 29-day processing time we reported as of August 22, 2020.488 This increase resulted primarily from an increase in cumulative average processing time for declined applications from about 17 days to about 22 days. In comparison, the cumulative average processing time for approved applications remained at around 44 days.
Applicant understanding of financial terms and missing information may affect application outcomes. Representatives of a few state or regional Small Business Development Centers (SBDC) that assist small businesses told us that SBA could better communicate certain information about the application and reconsideration process. For example, representatives from five of the six SBDCs we spoke with told us that some applicants did not understand certain terms on the EIDL application—such as “cost of goods”—which resulted in some applicants inputting incorrect information. SBA uses “cost of goods” to determine whether an applicant should receive a loan and how much. Inputting incorrect information may result in application denials or inaccurate estimates of applicants’ need. Representatives from four SBDCs told us SBA did not provide reasons for declined applications to some applicants, resulting in uncertainty as to what information applicants should provide to SBA to request reconsideration.489
Internal control and fraud risk management appear to be deficient. We reported in September 2020 and again in October 2020 that efforts to expedite processing may have contributed to increased fraud risk in the EIDL program.490 In July 2020, the SBA Office of Inspector General (OIG) issued a preliminary review of the EIDL program and warned SBA about indicators of widespread potential fraud and deficiencies with SBA’s 488 These data include applications that were declined, approved, and withdrawn. They exclude declined applications that SBA is reconsidering.
489 For declined applications, SBA provides applicants up to 6 months to request a reconsideration of the decision. SBA may request additional information as part of the reconsideration, such as an applicant’s tax returns and driver’s license.
490 SBA officials stated that CARES Act changes eased EIDL program requirements, such as acceptance of an applicant’s self-certification of eligibility for advances and not requiring tax returns.

Appendix I: Enclosures
Page 343 GAO-21-191
internal control.491 In October 2020, the SBA OIG reiterated these concerns and stated that relaxed internal controls and unprecedented demand for EIDL loans put significant stress on SBA’s existing controls.492 Further, it reported that SBA approved billions of dollars in potentially fraudulent EIDL loans to applicants who later changed the bank account number associated with the loan, applicants who submitted duplicate information, and ineligible entities.
The SBA OIG made 10 recommendations for SBA to strengthen its controls to lower fraud risk and recover funds from ineligible businesses. SBA partially agreed with 9 of the recommendations and disagreed with 1 recommendation. While SBA noted that there was insufficient evidence that loans were approved and disbursed to ineligible businesses, SBA OIG stated that SBA is taking corrective actions to fully implement its recommendations. In addition, since May 2020, the Department of Justice has announced fraud investigations related to the EIDL program and, in conjunction with other federal agencies, announced charges related to EIDL fraud.493
Other challenges may affect EIDL applicants during the COVID-19 pandemic. SBDC representatives told us that in general, EIDL had helped many small businesses but had not sufficiently met some businesses’ financial needs. One reason for this is the limit on loan amounts. As we reported in September 2020, on May 4, 2020, SBA placed a limit of $150,000 on EIDL loans. SBA data show that the agency approved about 544,000 EIDL loans in the amount of $150,000 for businesses that had an estimated economic injury greater than $150,000, as of October 3, 2020. For some small businesses, in particular larger small businesses, loans capped at $150,000 were insufficient to cover operating expenses, according to representatives from five state or regional SBDCs and the national SBDC association. Also, representatives from four SBDCs said
491 Small Business Administration, Office of Inspector General, Serious Concerns of Potential Fraud in Economic Injury Disaster Loan Program Pertaining to the Response to COVID-19, Report No. 20-16 (Washington, D.C.: July 28, 2020).
492 Small Business Administration, Office of Inspector General, Inspection of Small Business Administration’s Initial Disaster Assistance Response to the Coronavirus Pandemic, Report No. 21-02 (Washington, D.C.: Oct. 28, 2020).
493 Since May 2020, the Department of Justice has announced charges in 13 fraud -related cases involving EIDL funds. The charges —based on investigations by a range of law enforcement agencies—include making false statements and engaging in identity theft, wire and bank fraud, and money laundering.

Appendix I: Enclosures
Page 344 GAO-21-191
that as businesses reopen, they could benefit from an additional round of EIDL funding due to uncertainties surrounding the duration of the pandemic, among other things. Representatives from three SBDCs said that although some businesses are seeking additional funding beyond SBA—through lenders, for example—pandemic closures and conservative lending practices in response to pandemic-related uncertainty makes such funding difficult to obtain.494
Agency Comments
We provided SBA and the Office of Management and Budget with a draft of this enclosure; neither had any comments.
GAO’s Methodology
To conduct this work, we reviewed publicly available SBA data on EIDL loans as of October 4, 2020 and SBA data on EIDL loan applications and processing times as of October 3, 2020. We assessed the reliability of SBA’s data by reviewing relevant documentation and written responses from agency officials. We determined that the data were sufficiently reliable for our purposes of describing program trends. In addition, we interviewed representatives from the national SBDC association and a nongeneralizable sample of six state or regional SBDCs located in California, Illinois, Georgia, New York, Oklahoma, and Puerto Rico about their clients’ experiences with the EIDL program. We selected these SBDCs based on factors including the share of a state’s businesses that received EIDL loans and the share that experienced a large negative impact from the pandemic, according to U.S. Census Bureau data.
Contact information: William B. Shear, (202) 512-8678, [email protected]
Related GAO Product
Small Business Administration: COVID-19 Loans Lack Controls and Are Susceptible to Fraud. GAO-21-117T. Washington, D.C.: October 1, 2020.
494 The Federal Reserve’s Senior Loan Officer Opinion Survey for the third quarter of 2020 showed that banks have tightened their credit standards and terms on commercial and industrial loans to small businesses.

Appendix I: Enclosures
Page 345 GAO-21-191
Federal Reserve Lending Facilities
The CARES Act lending facilities’ transaction volume and purchases of assets remain limited, and the use of non-CARES Act facilities has diminished since May 2020. On November 19, 2020, Treasury announced that it plans to allow the CARES Act facilities to expire on December 31, 2020.
Entities involved: Department of the Treasury, Federal Reserve System
Key Considerations and Future GAO Work
In July 2011, we made two recommendations regarding lending programs (or facilities) that the Board of Governors of the Federal Reserve System (Federal Reserve) established in response to the 2007–2009 financial crisis. These two recommendations are to (1) strengthen procedures related to high-risk borrowers and (2) estimate and track losses within and across all facilities. Both recommendations are relevant for the recently established facilities because they operate similarly. We continue to examine the status of our recommendations as part of our ongoing review of the Federal Reserve’s design, implementation, and monitoring of the facilities, and the extent to which markets disrupted by the pandemic are recovering.495
Background
The CARES Act appropriated $500 billion to the Department of the Treasury (Treasury) and authorized at least $454 billion of that total for Treasury to support the Federal Reserve in establishing lending facilities to provide economic relief to states, tribes, municipalities, and eligible businesses and nonprofit organizations.496 As of October 15, 2020, Treasury had committed about 43 percent of these funds, which remains
495 Federal Reserve has taken actions that addressed the intent of the first recommendation. Federal Reserve officials said they have taken some actions to address the second recommendation. However, some documentation we need for a full assessment of the actions were not available at the time of our reporting.
496 The facilities are authorized under Section 13(3) of the Federal Reserve Act, which permits the Federal Reserve to provide emergency lending, and are approved by the Secretary of the Treasury. Section 13(3) facilities must comply with requirements relating to loan collateralization and taxpayer protection, among others. Of the $500 billion appropriated under Section 4027 of the CARES Act, $25 million shall be made available to the Special Inspector General for Pandemic Recovery.

Appendix I: Enclosures
Page 346 GAO-21-191
unchanged from what we reported in June 2020. The Federal Reserve also established four facilities that do not receive CARES Act–appropriated funds; these facilities aim to provide liquidity to the financial sector and businesses.
Overview of Key Issues
As of October 15, 2020, all nine Federal Reserve lending facilities with CARES Act funding were operational. The transaction volume across these facilities remained limited. As of the same date, all four facilities without CARES Act funding also were operational.
CARES Act facilities. As of October 15, 2020, the Federal Reserve lending facilities supported by Treasury’s CARES Act funding had conducted almost $21 billion in transactions (see table).
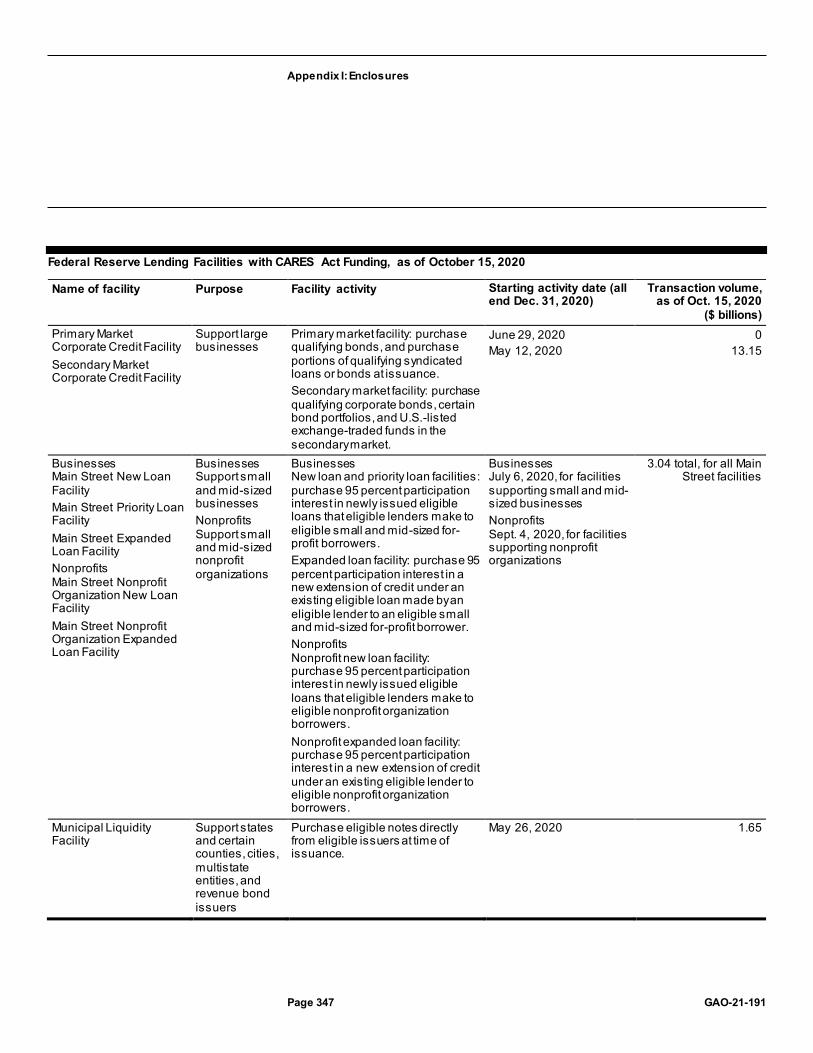
Appendix I: Enclosures
Page 347 GAO-21-191
Federal Reserve Lending Facilities with CARES Act Funding, as of October 15, 2020
Name of facility Purpose Facility activity Starting activity date (all end Dec. 31, 2020)
Transaction volume, as of Oct. 15, 2020
($ billions) Primary Market Corporate Credit Facility Secondary Market Corporate Credit Facility
Support large businesses
Primary market facility: purchase qualifying bonds, and purchase portions of qualifying syndicated loans or bonds at issuance. Secondary market facility: purchase qualifying corporate bonds, certain bond portfolios, and U.S.-listed exchange-traded funds in the secondary market.
June 29, 2020 May 12, 2020
0 13.15
Businesses Main Street New Loan Facility Main Street Priority Loan Facility Main Street Expanded Loan Facility Nonprofits Main Street Nonprofit Organization New Loan Facility Main Street Nonprofit Organization Expanded Loan Facility
Businesses Support small and mid-sized businesses Nonprofits Support small and mid-sized nonprofit organizations
Businesses New loan and priority loan facilities: purchase 95 percent participation interest in newly issued eligible loans that eligible lenders make to eligible small and mid-sized for-profit borrowers. Expanded loan facility: purchase 95 percent participation interest in a new extension of credit under an existing eligible loan made by an eligible lender to an eligible small and mid-sized for-profit borrower. Nonprofits Nonprofit new loan facility: purchase 95 percent participation interest in newly issued eligible loans that eligible lenders make to eligible nonprofit organization borrowers. Nonprofit expanded loan facility: purchase 95 percent participation interest in a new extension of credit under an existing eligible lender to eligible nonprofit organization borrowers.
Businesses July 6, 2020, for facilities supporting small and mid-sized businesses Nonprofits Sept. 4, 2020, for facilities supporting nonprofit organizations
3.04 total, for all Main Street facilities
Municipal Liquidity Facility
Support states and certain counties, cities, multistate entities, and revenue bond issuers
Purchase eligible notes directly from eligible issuers at time of issuance.
May 26, 2020 1.65

Appendix I: Enclosures
Page 348 GAO-21-191
Name of facility Purpose Facility activity Starting activity date (all end Dec. 31, 2020)
Transaction volume, as of Oct. 15, 2020
($ billions) Term Asset-Backed Securities Loan Facility
Support consumers and businesses
Provide nonrecourse loans to U.S. companies secured by qualifying asset-backed securities generally backed by recently originated consumer and business loans.
June 17, 2020 3.24
Source: GAO analysis of Board of Governors of the Federal Reserve System (Federal Reserve) documents and data. | GAO-21-191
As of October 15, 2020, Treasury had committed $195 billion, or about 43 percent, of the $454 billion from the CARES Act available to support the facilities and disbursed $102.5 billion of that commitment.497 As of the same date, the nine facilities in operation had conducted about $21 billion in transactions—with the Secondary Market Corporate Credit Facility accounting for $12 billion. October’s total transaction volume of $21 billion is a 31 percent increase from August’s volume of $16 billion (which we reported in September 2020). Overall, the Federal Reserve has determined that all CARES Act facilities combined may hold a maximum of $1.95 trillion in assets. Although demand for the CARES Act facilities continues to be relatively limited, the Main Street facilities experienced a sizeable increase in activity from August to October. Specifically, as of October 15, 2020, the Main Street facilities serving small and mid-sized businesses had conducted $3.04 billion in transactions, an increase of 769 percent from $350 million in August.498
On November 19, 2020, the Secretary of the Treasury issued a letter to the Chairman of the Federal Reserve Board announcing that all of the CARES Act facilities will stop purchasing eligible assets or extending credit on December 31, 2020, the date previously established for the
497 To implement these facilities, the Federal Reserve is using legal entities known as special purpose vehicles to purchase qualifying assets from, or initiate lending to, eligible institutions. Treasury also has made equity investments in the special purp ose vehicles with CARES Act funds. For Treasury loan program subsidies under Section 4003 of the CARES Act (Economic Stabilization Program), total obligations of budget authority are recorded on a net present value basis. As a result, total Economic Stabil ization Program subsidy obligations related to the Federal Reserve facilities are $30.12 billion with outlays of $19.07 billion.
498 Recently, on October 30, 2020, the Federal Reserve lowered the minimum loan amount for most Main Street facilities from $250,000 to $100,000. The Main Street Expanded Loan Facility and Nonprofit Organization Expanded Loan Facility have a minimum loan requirement of $10 million.

Appendix I: Enclosures
Page 349 GAO-21-191
facilities’ termination.499 In the letter, the Secretary stated that “while portions of the economy are still severely impacted and in need of additional fiscal support, financial conditions have responded and the use of these facilities has been limited.” The letter cited improvements in conditions in certain markets targeted by some of the facilities and stated that banks currently have the lending capacity to meet the borrowing needs of their corporate, municipal, and nonprofit customers. The letter also requested the Federal Reserve return the unused CARES Act funds to Treasury. In a statement provided to the press on November 19, 2020, the Federal Reserve stated that it “would prefer that the full suite of emergency facilities established during the coronavirus pandemic continue to serve their important role as a backstop for our still-strained and vulnerable economy.”
In the most recent periodic reports to Congress on the lending facilities, the Federal Reserve Board stated it continues to expect that the facilities will not result in losses to the Federal Reserve. 500
Non-CARES Act facilities. As of October 15, 2020, all four of these facilities were operational and had conducted more than $293 billion in transactions—with the Paycheck Protection Program Liquidity Facility and the Primary Dealer Credit Facility accounting for about $101 billion and nearly $130 billion, respectively (see table). The majority of transactions in non-CARES Act facilities occurred before May 15, 2020. In the November 19, 2020 letter to the Chairman of the Federal Reserve Board,
499 See https://home.treasury.gov/news/press-releases/sm1190, accessed Nov. 20, 2020. For CARES Act and non-CARES Act facilities that include a special purpose vehicle, the responsible Federal Reserve Banks will continue to fund the vehicle after the facility’s termination date until the vehicle’s underlying assets mature or are sold.
500 According to Federal Reserve officials, the expectation of the facilities incurring no losses for the Federal Reserve takes into account Treasury’s support using funds appropriated under the CARES Act.

Appendix I: Enclosures
Page 350 GAO-21-191
the Secretary of the Treasury requested that the Federal Reserve approve an extension of 90 days for all four non-CARES Act facilities. 501
Federal Reserve Lending Facilities without CARES Act Funding, as of October 15, 2020
Name of facility Purpose Facility activity Starting activity date
Transaction volume, as of Oct. 15, 2020
($ billions) Commercial Paper Funding Facility
Serve as funding backstop to provide liquidity for U.S. issuers of commercial paper
Purchase commercial paper from eligible companies; eligible issuers include U.S. issuers of com mercial paper, including municipal issuers and U.S. issuers with a foreign parent company
Apr. 14, 2020 4.27
Money Market Mutual Fund Liquidity Facility
Assist money market mutual funds in meeting demands for redemption by households and other investors
Make nonrecourse loans available to eligible financial institutions that are secured by high-quality assets purchased by the financial institution from money market mutual funds
Mar. 23, 2020 58.01
Paycheck Protection Program Liquidity Facility
Facilitate lending by eligible institutions that provide loans to small businesses under the Paycheck Protection Program (PPP)
Lend to institutions eligible for making PPP loans on a nonrecourse basis, taking PPP loans as collaterala
Apr.16, 2020 101.22
Primary Dealer Credit Facility
Provide support to primary dealers to facilitate the availability of credit to businesses and households
Provide loans to primary dealers in exchange for collateral
Mar. 20, 2020 129.83
Source: GAO analysis of Board of Governors of the Federal Reserve System (Federal Reserve) documents and data. | GAO-21-191 aThe Federal Reserve established the PPP Liquidity Facility under its Section 13(3) authority to encourage participation in the PPP established under the CARES Act.
Agency Comments
We provided a draft of this enclosure to the Federal Reserve, Treasury, and the Office of Management and Budget for review. The Federal
501 In the November 19, 2020 letter to the Chairman of the Federal Reserve Board, the Secretary of the Treasury requested that the Board of Governors of the Federal Reserve System approve an extension of 90 days for the non-CARES Act facilities. As of November 20, 2020, the Federal Reserve had not updated the terms of these fac ilities to reflect an extension. The Primary Dealer Credit Facility will remain available to primary dealers until December 31, 2020, unless extended; the Money Market Mutual Fund Liquidity Facility and Paycheck Protection Program Liquidity Facility will n ot make credit extensions after December 31, 2020, unless extended; and the Commercial Paper Funding Facility will terminate on March 17, 2021, unless extended.

Appendix I: Enclosures
Page 351 GAO-21-191
Reserve and Treasury provided technical comments that we incorporated, where appropriate.
GAO’s Methodology
To conduct this work, we reviewed Federal Reserve documentation on each facility, including term sheets and related press releases; reports to Congress on the facilities; and the most recent agency transaction data on the facilities available, as of October 15, 2020. We also interviewed Federal Reserve officials and officials of industry and state and local government associations, and we obtained updated information from Treasury.
Contact information: Michael E. Clements, (202) 512-8678, [email protected]
Related GAO Product
Federal Reserve System: Opportunities Exist to Strengthen Policies and Processes for Managing Emergency Assistance. GAO-11-696. Washington, D.C.: July 21, 2011.
Cleaning Federal Buildings
The U.S. General Services Administration plans to obligate most of the $275 million in CARES Act funds provided to the Federal Buildings Fund in fiscal year 2021 for enhanced cleaning and additional labor, supplies, and operations.
Entity involved: U.S. General Services Administration
Key Considerations and Future GAO Work
We will continue to monitor the U.S. General Services Administration’s (GSA) management of federal real property as part of our ongoing High Risk Updates.
Background
GSA provides centralized procurement for the federal government, offering billions of dollars’ worth of products, services, and facilities that federal agencies need to serve the public. GSA uses the Federal

Appendix I: Enclosures
Page 352 GAO-21-191
Buildings Fund (FBF) for the acquisition, operation, and maintenance of assets in its building portfolio. The Public Buildings Amendments of 1972 established the FBF, into which GSA deposits rent collected from tenant agencies.502 Congress exercises control over the FBF through the appropriations process by determining how much of the FBF can be obligated for various activities. In addition, it periodically provides supplemental appropriations for the FBF.
The CARES Act provided $275 million to the FBF for GSA to prevent, prepare for, and respond to COVID-19, domestically and internationally.503 These funds are available to GSA to obligate until expended without fiscal year limitation. The CARES Act also exempts GSA from submitting to Congress a proposed facility prospectus and reviews under the National Environmental Policy Act of 1969 when acquiring real property or taking other specified actions in response to COVID-19.
Overview of Key Issues
GSA had obligated $45,565,052 of the funds provided by the CARES Act to the FBF as of September 30, 2020 and plans to obligate the remaining funds in fiscal year 2021 for enhanced cleaning and additional labor, supplies, and operations. GSA officials explained that about half of the funds obligated were used for enhanced cleaning and responding to COVID-19 events and the other half were used for labor, supplies, and operations. GSA officials explained that the agency had large labor costs in the beginning of the pandemic due to the need to develop protocols for responding to the pandemic, but officials did not anticipate similarly large labor costs going forward. GSA officials explained that the agency plans to use most of the funds in fiscal year 2021 for cleaning federal buildings. Since most GSA tenants’ workers are still teleworking full time, GSA has obligated its CARES Act funds slowly. However, the cadence of obligations is expected to increase as federal workers return to buildings, prompting additional cleaning needs. GSA officials said that GSA follows guidance for expending emergency COVID-19 funding outlined in Office of Management and Budget (OMB) Memorandum M-20-21, Centers for 502 Pub. L. No. 92-312, § 3, 86 Stat. 216, 218-19, codified as amended at 40 U.S.C. § 592.
503 Pub. L. No. 116-136, 134 Stat. 281, 531-532 (2020).The CARES Act also provided $18,650,000 for GSA’s Federal Citizen Services Fund and $1,500,000 for GSA’s Working Capital Fund. We did not include these funds in our review.
Appendix I: Enclosures
Page 353 GAO-21-191
Disease Control and Prevention (CDC) guidelines for enhanced cleaning as a result of COVID-19, and GSA guidance outlining specific emergency acquisition authorities.504
GSA plans to obligate $200 million of the CARES Act funds for cleaning services and $75 million for labor, supplies, and operations by the end of fiscal year 2021. GSA’s spending plan states that the agency may need additional funding in 2021 and beyond to support its COVID-19-related efforts.
Enhanced daily cleaning and response to COVID-19 events. GSA officials explained that all facilities under GSA’s custody or control will require enhanced cleaning and disinfecting services. This enhanced cleaning applies to over 8,000 leases and at least 1,500 federally owned buildings. In conducting these cleaning activities, GSA officials told us GSA adheres to its Communicable Disease Pandemic Plan for confronting and managing the COVID-19 pandemic. GSA officials explained that the plan applies to all GSA services, including all GSA-controlled facilities. Officials also explained that there are two types of increased cleaning: regular cleaning in compliance with CDC standards and cleaning in response to a COVID-19 event.
· Regular cleaning in compliance with CDC standards. Based on currently issued guidance, GSA has modified its specifications for regular custodial service to help reduce the risk and spread of COVID-19, and is incorporating new disinfection requirements into existing
504 See OMB Memorandum M-20-21, Implementation Guidance for Supplemental Funding Provided in Response to the Coronavirus Disease 2019 (COVID -19), 2020.

Appendix I: Enclosures
Page 354 GAO-21-191
custodial and lease contracts.505 GSA will provide cleaning services as outlined in the applicable custodial or lease contract, including the incorporation of routine cleaning and disinfection of frequently touched surfaces in common and high-traffic areas. GSA estimated the increased cost of cleaning for routine high touch surface areas for both leased and owned spaces. Once it estimated these costs, GSA made quarterly timing assumptions for the expenditure of funds based on individual agency plans to return to facilities. GSA officials said that these assumptions may change as more data are received and agency plans change.
· Cleaning in response to a COVID-19 event. GSA will also respond to the need for detailed cleaning and disinfection when a COVID-19 event occurs in buildings under GSA’s control.506 Should an employee, contractor, or visitor to a GSA-controlled facility develop a confirmed or suspected case of COVID-19, GSA will provide cleaning of specific portions of the facility accessed by the infected individual in accordance with the recommended CDC protocol. As of August 31, 2020, GSA had addressed 3,409 COVID-19 incidents. However, the GSA Inspector General found in a September 2020 report that GSA did not always receive timely notice of COVID-19 incidents from building occupants and did not always provide timely notification to
505 In a September 2020 Alert Memorandum, the GSA Office of Inspector General (OIG) explained that GSA does not have assurance that contractors are cleaning and disinfecting space in accordance with GSA and CDC guidance. Specifically, the report found that GSA did not update its contractor oversight plans for COVID -19 cleaning, and as a result, it does not have assurance that contractors are c leaning and disinfecting space in accordance with applicable requirements. GSA acknowledged that it did not modify or enhance its custodial contracts in some cases; however, GSA stated that the GSA Communicable Disease Pandemic Plan does not require the contracts to be modified or enhanced and that the decision whether to modify or enhance these plans is left to Contracting Officers’ discretion. GSA also stated that, prior to the pandemic, GSA required custodial contracts to include a pandemic plan. GSA exp lained that, at the onset of the COVID-19 pandemic, GSA took steps to confirm that all of its custodial contracts included the pandemic plan and, for the contracts that did not, GSA modified them to include a requirement for a pandemic plan. U.S. General Services Administration Office of Inspector General, Alert Memorandum: Concerns Regarding PBS’s Communication and Cleaning Procedures for Coronavirus Disease 2019 (COVID-19) Exposures, Memorandum No. A201018-2 (Sept. 3, 2020).
506 A COVID-19 event is an instance when someone who is confirmed or suspected to have COVID-19 enters or occupies a GSA-controlled facility.

Appendix I: Enclosures
Page 355 GAO-21-191
tenants of confirmed COVID-19 cases.507 The cost of the enhanced cleaning for a COVID-19 event may exceed the applicable custodial or lease contract. GSA officials explained that GSA estimated obligating $2.5 million per month to respond to COVID-19 events based on early indicators.508 Officials provided an example in which GSA cleaned areas of the Edward R. Roybal Federal Building and U.S. Courthouse in Los Angeles per CDC guidelines after a tenant reported a COVID-19 case in April 2020, at a cost of $13,125, according to GSA.
Labor, supplies, and operations. GSA plans to obligate $75 million of the CARES Act funds on contract support services, overtime labor requirements, supplies, and operational needs at its facilities. GSA has obligated funds for supplemental labor hours specifically related to the pandemic response effort. These supplemental labor hours will be required on an ongoing basis. Many of the employees that will require supplemental labor hours represent first-line staff working in or directly supporting GSA’s facilities to sustain the new building operations requirements. In addition, GSA plans to procure incidental items to support GSA-controlled facilities to educate employees and provide necessary supplies required to abide by safety protocols. For example, GSA plans to purchase hand sanitizer and stations, hand foam, wipes, dispensers, refills, batteries, wayfinding signage, signs and stickers for lobbies and common areas, sneeze guards and barriers, disinfection
507 GSA OIG found that GSA did not always receive timely notice of positive COVID -19 test results from building occupants. GSA OIG selected a limi ted sample of 11 confirmed COVID-19 cases reported in GSA-owned or leased locations between March 23, 2020, and May 14, 2020. GSA OIG found two cases of significant lags in time between when tenant agencies became aware of an employee’s positive COVID -19 test result and when the agencies notified GSA. In both cases, approximately 1 week passed before GSA was notified. Additionally, GSA did not always provide timely notification of positive COVID-19 cases to building occupants. In two of seven GSA-owned locations sampled, GSA did not notify occupants of the positive COVID-19 cases within 24 hours of the reported incident, as required by GSA and CDC guidance. In one instance, GSA notified occupants 16 days after receiving notification. In another, GSA notified occupants 7 days after receiving notification. U.S. General Services Administration Office of Inspector General, Alert Memorandum: Concerns Regarding PBS’s Communication and Cleaning Procedures for Coronavirus Disease 2019 (COVID-19) Exposures, Memorandum No. A201018-2 (Sept. 3, 2020).
508 This estimate includes a contingency amount to cover variations from those indicators. GSA officials said that this contingency amount is necessary until GSA can obtain more firm agency plans, get updated contract pricing data, and adjust estimates accordingly.

Appendix I: Enclosures
Page 356 GAO-21-191
webinars and training, and portable hand washing stations for the majority of buildings.
Agency Comments
We provided a draft of this enclosure to GSA and OMB for review and comment. GSA and OMB provided technical comments on this enclosure, which we incorporated as appropriate.
GAO’s Methodology
To conduct this work, we reviewed agency documents and interviewed GSA officials about how they plan to implement provisions of the CARES Act.
Contact information: David Trimble, (202) 512-2834, [email protected]
Amtrak Grants
Amtrak used CARES Act funds to address shortfalls in ticket revenue, pay employee salaries, and cover other operational expenses, but faces immediate and longer-term challenges.
Entities involved: Amtrak; Federal Railroad Administration, within the Department of Transportation
Key Considerations and Future GAO Work
We will continue to monitor how the National Railroad Passenger Corporation (commonly known as Amtrak) uses CARES Act funds and any future supplemental financial assistance, as well as its rail service and workforce levels.
Background
Amtrak provides almost all intercity passenger rail service in the U.S. across an approximately 21,000-mile rail network. This system includes three lines of business: the Northeast Corridor, 28 state-supported short-distance (750 miles or less) routes funded in part by the 17 states they serve, and long-distance (greater than 750 miles) routes that connect

Appendix I: Enclosures
Page 357 GAO-21-191
rural areas with major cities.509 Amtrak has seen steady increases in ridership and revenues on its network in recent years, with over 32 million trips taken in fiscal year 2019, but operated at an overall loss of $881 million.510
Amtrak depends on grants from the federal government to operate the national passenger rail system and reinvest in the underlying infrastructure. Amtrak receives federal funding through grants from the Federal Railroad Administration (FRA), which executes and oversees grant agreements with Amtrak. The Further Consolidated Appropriations Act, 2020, provided $700 million for the Northeast Corridor Grants program and $1.3 billion for the National Network Grant program, which includes the state-supported and long-distance routes.511
As a result of the COVID-19 pandemic, Amtrak has experienced a significant drop in ridership and corresponding revenue from ticket sales across its network. In response, Amtrak significantly reduced, and in some cases temporarily suspended, its service. Amtrak received $1.018 billion through the CARES Act to prevent, prepare for, and respond to COVID-19, including $492 million through the Northeast Corridor Grants program and $526 million through the National Network Grants program.512 Of the $526 million provided through the National Network Grants program, at least $239 million must be made available to be used to offset payments by states to Amtrak for operating its state-supported
509 Amtrak owns about 360 of the 457 miles of the Northeast Corridor, which generally runs from Boston, Massachusetts, to Washington, D.C. However, Amtrak provides the majority of its long-distance and state-supported service on infrastructure (tracks and other facilities) owned by others, such as freight railroads or public agencies.
510 Amtrak officials thought that Amtrak might for the first time generate passenger revenues exceeding operating expenses in fiscal year 2020.
511 Pub. L. No. 116-94, 133 Stat. 2959-60 (2019). This law also allowed the Department of Transportation to retain up to one-half of 1 percent of the $2 billion in funds for specified activities of FRA and other entities.
512 Pub. L. No. 116-136, 134 Stat. 281, 598-599 (2020).

Appendix I: Enclosures
Page 358 GAO-21-191
routes.513 FRA has awarded all of these funds to Amtrak, and as of September 30, 2020, Amtrak had expended $871 million, or 86 percent of the funds (see table).
Amtrak Expenditure of CARES Act Funds by Grant Program, as of September 30, 2020
Category Northeast Corridor
(in dollars)
National Network
(in dollars)
National Network State-supported
routes (in dollars)
Total (in dollars)
Total CARES Act funds received
492 million 287 million 239 million 1.018 billion
Total expended as of September 30, 2020
423 million 287 million 161 million 871 million
Total available on October 1, 2020
69 million 0 78 million 147 million
Source: GAO presentation of Amtrak data. | GAO-21-191
Amtrak established four expenditure categories for the CARES Act funds to support immediate response activities on both the Northeast Corridor and the National Network. The figures below are what Amtrak had expended as of September 30, 2020:514
· Operating labor. Amtrak expended a large portion of the CARES Act funds to offset its loss in ticket revenue—which Amtrak uses to pay its employees—and to avoid staff furloughs in fiscal year 2020 ($297 million).
· Direct COVID-19 expenditures. Amtrak expended CARES Act funds for supplies to increase train, station, and office cleaning, protective gear, and improve train ventilation ($2.1 million).
· Protected pay. Amtrak expended CARES Act funds to provide up to 14 days of paid leave for workers affected by COVID-19 ($4.5 million).
513 The CARES Act limits the amount that Amtrak can invoice the states for their share of routes that Amtrak operates on behalf of states in fiscal year 2020 to 80 percent of the amount each state paid in fiscal year 2019. For example, if a state paid the company $1 million for this service in fiscal year 2019, the state cannot pay more than $800,000 in fiscal year 2020. To offset this reduction, the CARES Act provided $239 million in funds that Amtrak is to draw down each month to cover the difference between the full cost of providing state-supported services and the reduced amount the company can charge the states. The CARES Act also allowed FRA to transfer and merge the funds provided for the Northeast Corridor Grants and National Network Grants programs.
514 The remaining $161 million are the state-supported funds allocated to date.

Appendix I: Enclosures
Page 359 GAO-21-191
· Other qualifying expenses. Amtrak expended CARES Act funds for train-related expenses such as fuel, power, and commissary food ($408 million).
Overview of Key Issues
Amtrak officials said they had not faced significant challenges expending the CARES Act funds and said that they were able to modify their existing processes for managing the Northeast Corridor and the National Network grants to account for the CARES Act funds. The Amtrak Office of Inspector General reported in August 2020 that Amtrak moved swiftly to develop a comprehensive plan for using, tracking, and reporting on CARES Act funds.515 Amtrak officials stated that they faced some initial challenges in facilitating the distribution of funds for the state-supported routes, but said that they are working with their state partners to administer the state payments and that collaboration has improved. However, the Inspector General reported that while Amtrak is taking steps to provide transparency over how it is allocating the $239 million of CARES Act funds set aside for state-supported routes, the Inspector General has an ongoing audit assessing the cost-sharing and billing processes between Amtrak and its state partners.516
Immediate and long-term challenges. While Amtrak is not currently experiencing challenges expending the CARES Act funds, according to officials, Amtrak continues to face both immediate and longer-term effects on its operations stemming from the pandemic that include reduced ridership and revenue, loss of state and commuter rail support, and uncertainty over long-term financial sustainability.
· Ridership and revenue. Amtrak continues to face reduced ridership on all of its lines of business after experiencing an overall 80 percent reduction in ridership from average prepandemic levels as of September 2020 on all lines of business (see figure). 517 According to Amtrak officials, ridership slowly began increasing in April 2020, and they initially expected ridership to increase to about 50 percent of
515 Amtrak, Office of Inspector General, Governance: Observations on Amtrak’s Use of CARES Act Funds, OIG-MAR-2020-013 (Washington, D.C.: Aug. 5, 2020).
516 The Inspector General audit is not specifically looking at CARES Act funds, but according to officials, some pandemic issues could arise.
517 The prepandemic average is from October 2018 to February 2020. The post-pandemic average is from March 2020 to September 2020.

Appendix I: Enclosures
Page 360 GAO-21-191
fiscal year 2019 levels by September 2020. However, ridership has plateaued since July 2020. Amtrak now expects that system-wide ridership in fiscal year 2021 will be about 34 percent of fiscal year 2019 levels, in part because it anticipates widespread telework to continue into the summer of 2021 or later.
Amtrak Ridership Actuals and Forecast, October 2018–September 2021
Note: The forecast for the f irst half of 2021 is tentative due to the uncertainty in the improvement in travel rates, the availability of a vaccine to the public, and the end of the seasonal f lu, according to Amtrak off icials.
Because revenue from ticket sales has fallen along with ridership, Amtrak has also dealt with reduced revenues and budget shortfalls. For example, Amtrak revenues were on average 81 percent lower than their average prepandemic levels as of September 2020.
· Loss of state and commuter rail support. In addition to potential loss of ridership and revenue on its service, Amtrak also faces the potential loss of financial support from state- supported and commuter rail services. While the decline in ridership on Amtrak’s network initially allowed Amtrak to accelerate some capital projects, sustained reductions in ridership on these systems could affect Amtrak’s revenue in fiscal year 2021 and beyond. For example, according to
Appendix I: Enclosures
Page 361 GAO-21-191
Amtrak officials, given growing state revenue shortfalls, states may be unable to pay Amtrak their portion of the costs on the state-supported routes. In fiscal year 2019, Amtrak revenue from state-supported routes was $538.1 million.518
In addition, while some commuter railroads on the Northeast Corridor have resumed full operations, they are operating at significantly reduced capacity, raising questions about the sustainability of their operations without additional financial support. As a result, some commuter railroads that operate on Amtrak’s infrastructure may no longer be able to pay for that access, thereby reducing Amtrak’s overall income.519 In fiscal year 2019, Amtrak received about $158 million from commuter railroads for access to the Northeast Corridor.
· Long-term financial sustainability. There may also be uncertainties about the long-term financial sustainability of Amtrak stemming from the impact COVID-19 has had on ridership. Amtrak officials said it may take 3 to 5 years for operations on its network to recover to 2019 levels. To develop its forecasts, Amtrak analyzes reservation data on all portions of its network and conducts ridership surveys of its customers. In addition, Amtrak monitors overall COVID-19 infection rates in areas where it operates, along with efforts to develop a vaccine; travel trends in the airline industry as an indicator of consumers’ willingness to travel; and broader economic trends, such as unemployment. However, Amtrak officials stated that it is difficult to develop accurate forecasts due to the unpredictability of various factors, such as shifting workforce trends and economic pressures. For example, Amtrak anticipates that ridership demographics could permanently change as business travel—which accounts for a high portion of Amtrak’s overall ticket revenues—may not return to the same levels in the future. For example, ridership on the Acela line, which carries mostly business travelers on the Northeast Corridor, remains over 90 percent lower than its prepandemic average, while the other routes have increased slightly since April 2020. On the other hand, Amtrak officials stated
518 National Railroad Passenger Corporation and Subsidiaries (Amtrak), Management’s Discussion and Analysis of Financial Condition and Results of Operations and Consolidated Financial Statements with Report of Independent Auditors, Fiscal Year 2019.
519 See the January 2016 report listed in Related GAO Products for further information on Amtrak’s cost sharing with commuter railroads.

Appendix I: Enclosures
Page 362 GAO-21-191
that going forward the average age of Amtrak riders may skew younger, which may help offset some ridership losses.
FRA support and oversight of funding. According to FRA officials, they have not experienced any challenges in overseeing Amtrak’s use of the CARES Act funds. FRA officials told us they amended the existing Northeast Corridor and National Network grants to include the CARES Act funds, rather than create a separate program, which allowed FRA to leverage existing monitoring and oversight structures. For example, to monitor the use of the funds, FRA established a new line of accounting in its financial system, and requires Amtrak to report monthly on how the funds are being spent, including the funds used to offset payments on the state-supported routes.520 According to FRA officials, they have experienced delays in receiving a sample audit of CARES Act expenditures from Amtrak as experienced quality assurance staff have accepted voluntary separations in response to Amtrak’s cost saving measures. In August 2020, the Amtrak Office of Inspector General reported that Amtrak had not yet conducted testing of its expenditures and therefore cannot be assured that the data it is reporting to FRA are accurate and complete.521 In response to the Inspector General findings, Amtrak agreed to implement timelier testing of its CARES Act expenditures.
Amtrak officials said that the CARES Act funds will only get Amtrak through fiscal year 2020 and will run out early in fiscal year 2021. As a result, in October 2020, Amtrak submitted an updated supplemental funding request stating that Amtrak had updated its forecast and now anticipates needing up to $4.9 billion in funding to operate and invest in its network, support its state and commuter partners, and address various congressional concerns, such as avoiding employee furloughs and maintaining daily long-distance service. Amtrak has started to furlough employees and plans to furlough over 2,000 employees total.522 Amtrak 520 The CARES Act requires the Department of Transportation to notify the House and Senate Committees on Appropriations, the Committee on Transportation and Infrastructure of the House of Representatives, and the Committee on Commerce, Science, and Transportation of the Senate of any Amtrak employee furloughs as a result of efforts to prevent, prepare for, and respond to COVID-19.
521 Amtrak, Office of Inspector General, Governance: Observations on Amtrak’s Use of CARES Act Funds, OIG-MAR-2020-013 (Washington, D.C.: Aug. 5, 2020).
522 According to Amtrak, 116 employees have been furloughed as of November 5, 2020, which does not include 87 management employees that have been or will be involuntarily separated.
Appendix I: Enclosures
Page 363 GAO-21-191
also reduced the frequency of service on most of its long-distance routes from daily to three times a week, which it expects will reduce costs by $150 million.523 Amtrak officials also said they may have to postpone capital projects if they do not receive supplemental funding.
Agency Comments
We provided Amtrak, FRA, and the Office of Management and Budget (OMB) with a draft of this enclosure. Amtrak and OMB did not have comments on this enclosure. FRA provided technical comments that we incorporated, where appropriate.
GAO’s Methodology
To conduct this work, we reviewed the most recent agency data Amtrak provided to FRA as of September 30, 2020, relevant laws, and agency guidance on the Northeast Corridor and National Network Grant programs. We also met with senior Amtrak and FRA officials to discuss Amtrak’s plans to recover from the pandemic-driven decline in ridership and revenue, as well as FRA’s plans and actions to oversee Amtrak’s use of the funds. To assess the reliability of the Amtrak data, we conducted interviews with knowledgeable officials and reviewed documentation. We determined that the data were reliable for our purposes. Finally, we met with the Amtrak Office of Inspector General to discuss its issued and ongoing work related to Amtrak’s use of CARES Act funds and the Northeast Corridor Commission to discuss the access payments made by railroads on the Northeast Corridor.
Contact information: Elizabeth Repko, (202) 512-2384, [email protected]
Related GAO Product
Amtrak: Better Reporting, Planning, and Improved Financial Information Could Enhance Decision Making. GAO-16-67. Washington, D.C.: January 6, 2016.
523 According to Amtrak, the reduction of long-distance service should provide $300 million in costs savings, which is offset by a $150 million loss in ticket re venues, for an expected overall savings of $150 million. Amtrak officials said they would consider resuming daily service on the long-distance routes using three metrics: 1) COVID-19 pandemic hospitalization rates, 2) the percentage of trips booked for 202 1, and 3) actual ridership levels.

Appendix I: Enclosures
Page 364 GAO-21-191
Assistance for Fishery Participants
The Department of Commerce’s National Oceanic and Atmospheric Administration has obligated about $297 million of the $300 million in CARES Act funding for fishery participants, and as of October 23, 2020 about $16.5 million had been disbursed because the agency continues to work with stakeholders involved in the process to disburse funds.
Entity involved: National Oceanic and Atmospheric Administration, within the Department of Commerce.
Key Considerations and Future GAO Work
We will continue to monitor CARES Act assistance to fishery participants in ongoing and planned work.
Background
Commercial and recreational marine fisheries are critical to the nation’s economy, contributing approximately $99.5 billion to the U.S. gross domestic product and supporting approximately 1.7 million jobs in 2016, according to the Department of Commerce’s National Oceanic and Atmospheric Administration (NOAA).524 Widespread restaurant closures in the spring of 2020 led to a decrease in demand for seafood, adversely affecting the fisheries industry.
The CARES Act authorizes the Department of Commerce to provide assistance to eligible tribal, subsistence, commercial, and charter fishery participants affected by COVID-19, which may include direct relief payments.525 Under the act, Congress appropriated $300 million to the Department of Commerce to assist fishery participants, which include tribes, persons, fishing communities, aquaculture businesses not otherwise eligible for certain assistance, processors, and other fishery- 524 U.S. Department of Commerce, National Oceanic and Atmospheric Administration, National Marine Fisheries Service, Fisheries Economics of the United States, 2016, Technical Memorandum NMFS-F/SPO-187a (Silver Spring, MD: December 2018). Information on gross domestic product and jobs includes data on commercial seafood harvesters, processors, dealers, wholesalers, distributors, importers, and retailers, as well as recreational fishing trips and fishing equipment. Data for 2 016 were the most recent available at the time of our review.
525 Pub. L. No. 116-136, § 12005(a), 134 Stat. at 518.

Appendix I: Enclosures
Page 365 GAO-21-191
related businesses, who have incurred, as a direct or indirect result of COVID-19, certain specified economic revenue losses or other negative impacts.526 Businesses such as vessel repair businesses, restaurants, and seafood retailers are not considered fishery-related businesses eligible to receive CARES Act funding, according to NOAA’s website.
Overview of Key Issues
On May 7, 2020, the Secretary of Commerce announced the allocation of CARES Act funding to states, tribes, and territories with fishery participants, as shown in the table. NOAA used this allocation to obligate funding to three interstate marine fisheries commissions between June 30 and July 2, 2020.527 These commissions have been working with states, tribes, and territories in their regions to develop spend plans for NOAA approval and eventual implementation. These plans explain how states, tribes, and territories will verify whether fishery participants meet the requirements of the CARES Act to receive funds.
526 Pub. L. No. 116-136, § 12005(b), (d), 134 Stat. at 518. Specifically, fishery participants are defined as belonging to these categories a nd as having incurred, as a direct or indirect result of the COVID-19 pandemic, economic revenue losses greater than 35 percent as compared with their prior 5 -year average revenue or any negative impacts to subsistence, cultural, or ceremonial fisheries. Additionally, the CARES Act provided that the Department of Commerce may use up to 2 percent of the $300 million for administration and oversight activities.
527 Puerto Rico and the U.S. Virgin Islands are not part of an interstate commission. Funds were obligated to Puerto Rico on July 14, 2020, and NOAA anticipates obligating funds to the U.S. Virgin Islands in fiscal year 2021.

Appendix I: Enclosures
Page 366 GAO-21-191
Allocation of CARES Act Funding for Fishery Participants Made to States, Tribes, and Territories on May 7, 2020
Interstate commission State/territory/tribe Allocationa ($ thousands)
Atlantic States Marine Fisheries Commission
Massachusetts Florida Maine New Jersey New York North Carolina Virginia Maryland Pennsylvania Rhode Island New Hampshire Georgia Connecticut South Carolina Delaware
27,808 23,471 20,166 11,259
6,703 5,422 4,489 4,096 3,345 3,271 2,713 1,908 1,823 1,515
993 Gulf States Marine Fisheries Commission
Louisiana Texas Alabama Mississippi
14,682 9,173 3,277 1,524
Pacific States Marine Fisheries Commission
Alaska Washington California Oregon West Coast Tribes Hawaii American Samoa Alaska Tribes Guam Commonwealth of the Northern Mariana Islands
49,650 49,650 18,222 15,871
5,062 4,307 2,535
993 993 993
Territory of Puerto Ricob 993 Territory of the U.S. Virgin Islandsb
993
Total $297,902 Source: GAO analysis of Department of Commerce data. | GAO-21-191

Appendix I: Enclosures
Page 367 GAO-21-191
Note: The CARES Act appropriated $300 million to the Department of Commerce to assist f ishery participants. Pub. L. No. 116-136, § 12005(d), 134 Stat. at 518. aAccording to National Oceanic and Atmospheric Administration (NOAA) off icials, allocations represent the maximum amount of total funding that f ishery participants in a particular state, tribe, or territory can receive. These allocations are net of administrative fees that NOAA assessed. Additional administrative fees can be assessed by grantees, such as the interstate marine f isheries commissions, according to NOAA off icials. bPuerto Rico and the U.S. Virgin Islands are not part of an interstate marine f isheries commission.
According to NOAA officials, the agency is in the process of reviewing and approving spend plans from states, tribes, and territories. NOAA officials said they expect to receive 30 spend plans from states and territories and 30 from tribes. As of September 30, 2020, NOAA had received 23 of the 30 plans it anticipated from the states and territories. Of these 23 plans, 12 had been approved, and 11 were under review. As of September 30, 2020, 30 tribal spend plans had been submitted and were all still under review by NOAA. Once a spend plan has been approved by NOAA, the agency anticipates that the states, tribes, or territories will solicit and review applications from fishery participants and decide whether they meet the criteria in an approved spend plan to receive funding and how much funding they should receive according to the approved spend plan.528 The respective interstate marine fisheries commissions will disburse the appropriate amount of funds directly to the fishery participant consistent with the approved spend plan, though some states and tribes may distribute funds themselves.529
As of October 23, 2020, about $16.5 million had been disbursed to fishery participants, according to NOAA officials. NOAA officials reported there is not a set schedule for disbursing funds to fishery participants. They said it takes time to review the associated spend plans to ensure they are in compliance with the CARES Act and for states, territories, and tribes to implement these plans. For example, they can have different timelines for implementing their plans, including different application periods. In September 2020, the Department of Commerce’s Inspector General started an evaluation of NOAA’s implementation of CARES Act funding.
528 NOAA officials said that states, tribes, or territories can also use existing records, such as fishing permits, to identify eligible recipients.
529 Puerto Rico and the U.S. Virgin Islands are not part of an interstate marine fisheries commission, so they will disburse funds directly to fishery participants.

Appendix I: Enclosures
Page 368 GAO-21-191
Agency Comments
We provided the Department of Commerce with a draft of this enclosure for review, and the department did not have any comments on it.
GAO’s Methodology
To conduct this work, we reviewed data provided by NOAA. We also reviewed the CARES Act and agency documents and interviewed NOAA officials.
Contact information: Anne-Marie Fennell, (202) 512-3146, [email protected]
K12 Education
Issues remain with federal guidance on schools’ operating status and English learners and students with disabilities face challenges with distance learning.
Entities involved: Centers for Disease Control and Prevention, within the Department of Health and Human Services; Office of Elementary and Secondary Education, within the Department of Education
Key Considerations and Future GAO Work
We continue to monitor challenges related to educating children during the COVID-19 pandemic. In September 2020, we recommended that the Director of the Centers for Disease Control and Prevention (CDC) ensure that, as it makes updates to its federal guidance related to reassessing schools’ operating status, the guidance is cogent, clear, and internally consistent. In its response letter dated September 4, CDC agreed with our recommendation, noting that it strives to ensure that all content is consistent and current and that it was working to update its reopening guidance. However, this recommendation remains open as of November 12, as CDC has made progress but the guidance remains inconsistent and unclear in places. We will continue to review guidance from the CDC.
In addition, in November 2020 we issued a report on some of the remote learning challenges school districts faced providing remote education to K-12 English learners and students with disabilities and on lessons

Appendix I: Enclosures
Page 369 GAO-21-191
learned from how selected school districts addressed aspects of these challenges.
Finally, we also have recently begun work that will examine the pandemic’s effect on learning loss, as well as disparities in the access to technology for all students—a key tool in distance learning.
Background
While K-12 education is a fundamentally state and local issue, the Department of Education (Education) quickly made available more than $13.2 billion through the Elementary and Secondary School Emergency Relief Fund established by the CARES Act to support, among other things, continued learning for K-12 students whose educations have been disrupted by the pandemic.
Both CDC and Education have provided information and guidance to help state and local school district officials fulfill their roles as key decision makers regarding how and when to reopen schools for in-person learning. For example, CDC’s guidance includes considerations on whether and how to screen students and staff for symptoms of COVID-19, considerations for school readiness and planning, and frequently asked questions (FAQ) for school administrators, teachers, parents, and childcare providers.
Further, Education has provided guidance on various topics during the pandemic. For example, in March and May 2020 it issued guidance pertinent to the 5 million public school students (about 10 percent) who are English learners and over 7 million (14 percent) who receive special education services. Specifically, Education noted that if school districts provide educational opportunities to the general student population during a school closure, they must also provide services to English learners and ensure that students with disabilities have equal access to the same educational opportunities as other students. 530 Education has also recognized that during the national emergency, schools may not be able
530 Department of Education, Questions and Answers on Providing Services to Children with Disabilities During the COVID-19 Outbreak (Washington, D.C.: Mar. 12, 2020) and Department of Education, Office of Elementary and Secondary Education, Fact Sheet: Providing Services to English Learners During the COVID-19 Outbreak (Washington, D.C.: May 18, 2020).

Appendix I: Enclosures
Page 370 GAO-21-191
to provide all services in the same manner they are typically provided. 531
More recently, in September 2020, Education released a Questions and Answers document about providing certain special education services in the current COVID-19 environment.
Education plays many roles in supporting educational opportunities for English learners and students with disabilities, including overseeing federal education and civil rights laws, and related funding, such as:
· The Individuals with Disabilities Education Act (IDEA), which was enacted to ensure among other things, that all children with disabilities have access to a free appropriate public education that emphasizes special education and related services designed to meet their unique needs and prepare them for further education, employment, and independent living.532
· Title VI of the Civil Rights Act of 1964, which prohibits discrimination on the basis of race, color, or national origin in any program that receives federal funds or assistance.533 In order to comply with Title VI, school districts must take affirmative steps to ensure that students with limited English proficiency can meaningfully participate in the district’s educational programs and services.534
· The Elementary and Secondary Education Act (ESEA), as amended, which among other things, promotes efforts to close educational achievement gaps by, in part, focusing attention on historically low-
531 Department of Education, Supplemental Fact Sheet Addressing the Risk of COVID -19 in Preschool, Elementary and Secondary Schools While Serving Children with Disabilities (Washington, D.C.: Mar. 21, 2020).
532 20 U.S.C. § 1400(d). For additional information on our work on IDEA, see GAO, Special Education: Varied State Criteria May Contribute to Differences in Percentages of Children Served, GAO-19-348 (Washington, D.C.: Apr. 11, 2019).
533 42 U.S.C. § 2000d.
534 Lau v. Nichols, 414 U.S. 563 (1974). Furthermore, according to guidance from the Department of Education and the Department of Justice, school districts generally may not segregate students on the basis of national origin or English learner status, though certain programs may involve English learners receiving separate instruction for a limited portion of the day or period of time.
Appendix I: Enclosures
Page 371 GAO-21-191
performing subgroups, including English learners and students with disabilities.535
Overview of Key Issues
As of November 12, 2020, portions of CDC’s guidance for K-12 schools remain internally inconsistent although the agency updated some of its guidance since our September 2020 report.536 CDC’s guidance on symptom screening and daily health checks for K-12 students and staff still includes contradictory recommendations. For example, as of November 12, although CDC updated its Screening K-12 Students for Symptoms of COVID-19: Limitations and Considerations guidance to include additional information on methods of screening and school based testing, the guidance did not recommend that schools conduct daily symptom screening for all K-12 students.537 However, its Considerations for K-12 Schools Readiness and Planning Tool still directed schools to develop a plan to conduct daily health checks (e.g., temperature screening or symptom checking) of staff and students.538 CDC also took steps to more clearly identify when guidance has been updated and what changes have been made, with notices at the top of guidance pages; however, our daily reviews of CDC’s website found that not all updates are identified and changes were not made consistently within or across guidance documents. For example, CDC’s November update to its screening guidance removed the symptoms fever, chills, and cough; but did not do so consistently throughout the document and those symptoms were later reinserted, potentially creating confusion.
535 The Every Student Succeeds Act, enacted on December 10, 2015, reauthorized the Elementary and Secondary Education Act of 1965 (ESEA). Pub. L. No. 89-10, 79 Stat. 27 (1965), as amended by Pub. L. No. 114-95, 129 Stat. 1802 (2015).
536 See Centers for Disease Control and Prevention, Coronavirus Disease 2019: Schools and Childcare Programs; Plan, Prepare, and Respond, accessed November 12, 2020, https://www.cdc.gov/coronavirus/2019-ncov/community/schools-childcare/index.html.
537 See Centers for Disease Control and Prevention, Screening K-12 Students for Symptoms of COVID-19: Limitations and Considerations, accessed November 12, 2020, https://www.cdc.gov/coronavirus/2019-ncov/community/schools-childcare/symptom-screening.html.
538 See Centers for Disease Control and Prevention, Considerations for K-12 Schools: Readiness and Planning Tool: CDC Readiness and Planning Tool to Prevent the Spread of COVID-19 in K-12 Schools, accessed November 12, 2020, https://www.cdc.gov/coronavirus/2019-ncov/community/schools-childcare/symptom-screening.html.

Appendix I: Enclosures
Page 372 GAO-21-191
In addition, in September and October of 2020, in response to our recommendation, CDC took steps to better align its guidance with risk-based decision-making. For example, CDC posted Indicators for Dynamic School Decision-Making, which includes risk-based indicators for decision makers to consider when deciding to open, close, or reopen schools over time.539 In this guidance, CDC recommends thresholds for assessing inherent risk of transmission in schools (i.e. lowest, lower, moderate, higher, and highest). The guidance states that if school officials determine that a school is at “moderate,” “higher,” or “highest” risk of transmission, it should consider alternative learning models (e.g., mix of in-person and virtual learning, also known as hybrid learning, or virtual-only).
However, other portions of CDC guidance remained internally inconsistent for weeks. For example, on October 13, CDC published Interim Considerations for Testing for K-12 School Administrators and Public Health Officials, which provides guidance on the appropriate use of testing in K-12 schools for, among other things, screening.540 The guidance recommends testing approaches based on level of risk of transmission in schools, and suggests a tiered approach to determine which individuals and schools should be prioritized for testing (e.g., close contacts, potential contacts, and potentially exposed individuals). However, as of November 12, CDC’s previous screening remained prominent on CDC’s website and did not recommend testing as an appropriate screening method. In addition, long-standing guidance urging schools to reopen in person—a statement that appears misaligned with CDC’s own statements on risk-based decision-making—remained prominently on CDC’s main internet page for schools and child care facilities throughout the fall. Then, while a draft of this report was with CDC for review, the link to the statement was removed from CDC’s main page. As the school year progresses and as local health conditions change—cogent, clear, and consistent federal guidance remains critical
539 See Centers for Disease Control and Prevention, Coronavirus Disease 2019: Indicators for Dynamic School Decision-Making, accessed October 21, 2020, https://www.cdc.gov/coronavirus/2019-ncov/community/schools-childcare/indicators.html.
540 See Centers for Disease Control and Prevention, Interim Considerations for Testing for K-12 School Administrators and Public Health Officials, accessed October 14, 2020, https://www.cdc.gov/coronavirus/2019-ncov/community/schools-childcare/k-12-testing.html. In addition to screening, the guidance also describes testing as appropriate for surveillance, diagnosis, or outbreak response.

Appendix I: Enclosures
Page 373 GAO-21-191
to helping state and local officials make safe, risk-based decisions for their students, teachers, staff, and communities.
Observations about distance learning for English learners and students with disabilities. At the same time that key decision makers are trying to determine how and whether to return to in-person education, they are also faced with the logistical and instructional challenges of educating students via distance learning. These challenges can particularly affect certain subgroups of students with additional needs, such as English learners and students with disabilities, whom research shows already experience persistent academic achievement gaps.541 In addition, early observations and lessons learned from districts that found successful strategies to at least partially address such challenges in spring 2020 may benefit other decision makers as they continue to navigate distance learning in their own districts. In November 2020, we reported on the challenges and lessons learned from teaching English learners and students with disabilities during COVID-19-related school closures in the spring of the 2019-2020 school year.
Officials we interviewed from advocacy and professional organizations and four selected school districts said some English learners and their families faced challenges to fully participating in distance learning due to the lack of necessary technology, language barriers, and the demands of meeting basic family needs. For example, they told us that during distance learning students did not have the opportunities they normally would during the school day to practice their language skills with English speakers, and others noted that limited English comprehension affected the ability of families to assist students with the distance-learning curriculum. They also told us that some school districts addressed aspects of challenges created by distance learning by increasing access to the internet and devices and adapting materials and instructional methods. For example, one school district partnered with a Spanish language TV network to broadcast curriculum for an hour every morning.
541 The academic achievement gap between English learners and students that are not English learners has remained roughly the same over the last decade. The gap between students with and without disabilities has also remained roughly the same. Department of Education, Institute of Education Sciences, National Center for Education Statistics, Digest of Education Statistics, 2019, tables 221.12 (October 2019) and 222.12 (November 2019).

Appendix I: Enclosures
Page 374 GAO-21-191
This made learning more accessible for both students and families, according to the official.
Similarly, a variety of factors made it more difficult to deliver special education services during distance learning, according to officials from selected school districts, national organizations representing school administrators and service providers, and researchers we interviewed.542
Such factors included the wide range of student needs and the services specified in their individualized education programs (IEP); and the capacity of parents or caregivers to assist teachers and services providers in delivering general education, specialized instruction, and related services to their children. For example, school officials we interviewed from all four districts told us that delivering related services—such as occupational therapy, physical therapy, or speech therapy—for students with complex needs was particularly difficult in a virtual setting.
School district officials we spoke with noted success addressing some challenges to providing distance learning to students with disabilities by modifying instruction, meeting with parents virtually, and encouraging teacher collaboration. In some cases, some districts modified students’ goals and services to account for the limitations of distance learning by adding temporary distance learning plans to students’ IEPs.543 Officials from two districts told us they are considering using virtual IEP meetings even after they fully return to in-person education and would most certainly use them as warranted during any future school closures.
542 According to guidance from Education, states, school districts, and schools must ensure that, to the greatest extent possible, each student with a disability can be provided the special education and related services identified in the student’s individualized education program.
543 Under IDEA, meetings of the IEP team may occur through alternative means, such as videoconferencing and conference telephone calls, subject to the agreement of the parent and the public agency. Education guidance from March 12, 2020 stated “IEP teams may, but are not required to, include distance learning plans in a child’s IEP that could be triggered and implemented during a selective closure due to a COVID -19 outbreak. Such contingent provisions may include the provision of special education and related services at an alternate location or the provision of online or virtual instruction, instructional telephone calls, and other curriculum -based instructional activities, and may identify which special education and related services, if any, could be provided at the child’s home.” Department of Education, Office of Special Education and Rehabilitative Services and Office of Special Education Programs, Questions And Answers On Providing Services To Children With Disabilities During The Coronavirus Disease 2019 Outbreak (Washington, D.C.: Mar. 12, 2020).

Appendix I: Enclosures
Page 375 GAO-21-191
In contrast with some of the challenges district officials noted, all of the school district officials and some researchers we spoke with told us that some students with disabilities thrived in the virtual environment. For example, an official from one of the districts stated that some students with social anxiety and other mental health conditions were able to focus better outside of a classroom of their peers. Officials from several school districts told us that future special education and service delivery may include additional elements of virtual learning.
Agency Comments
We provided HHS (including CDC), Education, and the Office of Management and Budget (OMB) with a draft of this enclosure. While HHS provided general comments on this report, which are reproduced in appendix IV, it did not comment on the issues raised in this enclosure. CDC and Education provided technical comments, which we incorporated as appropriate. OMB did not comment on this enclosure.
GAO’s Methodology
To conduct our work on guidance for K-12 schools, we reviewed CDC’s guidance on reopening schools, as well Education’s information for schools on COVID-19. We reviewed relevant federal laws. We also reviewed the administration’s public statements about school reopening guidance and interviewed Education officials.
For our work on distance learning for English learners and students with disabilities we also reviewed “distance learning plans” from a nongeneralizable selection of 15 school districts selected for their high proportion of either English learners or students with disabilities to determine how they served English learners and students with disabilities. We interviewed officials from four of the 15 school districts that sent us documents for review. We also interviewed a wide variety of representatives and subject matter experts, including representatives of organizations that advocate for English learners or students with disabilities; associations of educators, school administrators, and special education administrators; and several different types of related service providers; three technical assistance centers supported by Education; and four research organizations. We also reviewed relevant federal laws, regulations, and guidance.
Contact information: Jacqueline M. Nowicki, (617) 788-0580, [email protected]

Appendix I: Enclosures
Page 376 GAO-21-191
Related GAO Product
Distance Learning: Challenges Providing Services to K-12 English Learners and Students with Disabilities during COVID-19. GAO-21-43. Washington, D.C.: November 19, 2020.
Transit Industry
Transit agencies have used CARES Act grants primarily to cover operating expenses and mitigate the effects of the COVID-19 pandemic, but transit agency officials report uncertainty about future ridership and revenue.
Entity involved: Federal Transit Administration, within the U.S. Department of Transportation
Key Considerations and Future GAO Work
We will continue to monitor the status of CARES Act grants to transit agencies in ongoing and planned work.
Background
Millions of Americans rely on public transportation systems for mobility and access to jobs, education, and essential services, such as medical care and grocery shopping. Within the Department of Transportation (DOT), the Federal Transit Administration (FTA) provides grants to state Departments of Transportation, local public transit systems, and tribes to support and expand services. These services may include buses, subways, light rail, commuter rail, trolleys, and ferries in urban, rural, and tribal areas.
The CARES Act appropriated about $25 billion to the FTA to support the transit industry through its Urbanized Area ($22.7 billion) and Rural Area ($2.2 billion) formula programs.544 Of the funds appropriated to the Rural Area formula program, $30 million is set aside for tribal transit programs.545 FTA allocated the $25 billion on April 2, 2020, and posted information on allocation amounts to urbanized areas, states, and tribes 544 Pub. L. No. 116-136, 134 Stat. 281, 599 (2020).
545 An additional $75 million is set aside for the administration and oversight of the funds.

Appendix I: Enclosures
Page 377 GAO-21-191
to its website. Transit agencies that receive grants from these allocations may use the funds for any expenses incurred related to COVID-19 on or after January 20, 2020, and there is no limit on the amount of funds recipients may use for operating expenses.546
Overview of Key Issues
FTA has continued to distribute CARES Act grant funds and support transit agencies. As of September 30, 2020, FTA had awarded 758 grants, representing 93 percent of allocated CARES Act funding. FTA officials reported that an additional 75 grants were in progress. FTA officials said that as of September 30, 2020, recipients had obligated 90 percent of CARES Act funds for operating expenses, though obligating funds for capital and planning expenses is also allowed (see table).
546 These flexibilities are exceptions to the usual process for FTA’s Urban and Rural formula programs. An additional exception is that there is no requirement for local matching funds for grants provided to large and small urban areas and rural areas. All other Urbanized Area and Rural Area program requirements apply to CARES Act funds, with the exception that operating and certain capital expenses do not need to be included in a transportation improvement program, a long-range transportation or statewide transportation plan, or a statewide transportation improvement program.

Appendix I: Enclosures
Page 378 GAO-21-191
Transit Agency Obligations of CARES Act Grant Funds by Expense Category in Urban, Rural, and Tribal Areas, as of September 30, 2020
Expense Urban ($ millions)
Rural ($ millions)
Tribal ($ millions)
Total ($ millions)
Operating 20,722.7 1,584.2 17.5 22,324.5 Capital 685.4 86.9 3.2 775.5 Othera 34.9 166.4 0.8 202.1 Totalb 21,443.0 1,837.5 21.6 23,302.1
Source: GAO analysis of Federal Transit Administration data. | GAO-21-191
Note: The law appropriating the amounts obligated here is the CARES Act, Pub. L. No. 116-136, 134 Stat. 281 (2020). aIncludes expenses for project and program administration, intercity bus, planning, job access and reverse commute, and training expenses. bNumbers may not total due to rounding.
FTA continues to report no challenges with administering CARES Act grants and overseeing recipients’ use of the funds. FTA officials said the agency continues regular outreach to recipients through industry calls, and regional staff are in regular contact with recipients as they develop their applications. Officials we interviewed from 22 transit agencies said they had not experienced any challenges related to the distribution of CARES Act grants from FTA, and officials from all but one of the 22 agencies said they had not faced any challenges getting assistance from FTA during the awards process.
FTA has postponed its routine program oversight reviews that were scheduled for fiscal year 2020 until fiscal year 2021, but continues to monitor and provide guidance to grant recipients.
Transit agencies have reported using CARES Act grants to mitigate the effects of COVID-19, but concerns remain about future ridership and revenue. Officials from the 22 transit agencies we interviewed said they had used CARES Act grants to cover operating expenses, which included those incurred in retaining employees or providing paid sick leave (8 of 22), providing personal protective equipment for employees such as face masks or shields (5 of 22), and implementing enhanced cleaning and sanitation procedures on their vehicles (7 of 22).
Officials from some agencies we interviewed said they were holding CARES Act funds in reserve to mitigate anticipated budgetary shortfalls. Of the 22 agencies interviewed, 3 said they had already obligated all

Appendix I: Enclosures
Page 379 GAO-21-191
funds, and 12 expected to do so within 6 months to one year. However, about one-third (7 of 22) of the agencies said they did not expect to use all their CARES Act funding until a year or more, for reasons that included helping to ensure that they do not encounter any unanticipated budgetary shortfalls amid continued uncertainty and the expectation of a slow economic recovery. Officials from about 85 percent (19 of 22) of the agencies said they had imposed reductions in transit service.
Officials from most agencies we interviewed anticipated lasting effects from the pandemic to their transit operations. For example, about two-thirds (15 of 22) of the agencies said they experienced reduced ridership and were concerned it would continue. Similarly, some officials expressed concerns about prolonged reductions in revenue from state and local sales tax (8 of 22) or other sources of revenue (8 of 22). As a result of decreased revenue, officials from about one-third (8 of 22) of the agencies we interviewed said they were concerned that they may need to reduce their workforces, which could negatively impact their operations in the future.
When asked to describe steps they took to mitigate the spread of COVID-19 among their passengers and employees, transit agency officials said they took steps such as enhanced cleaning and sanitation, requiring the use of masks, and social distancing, among others (see table). FTA has provided a COVID-19 resource tool for public transportation on its website, which organizes federal agency guidance on many of these measures.
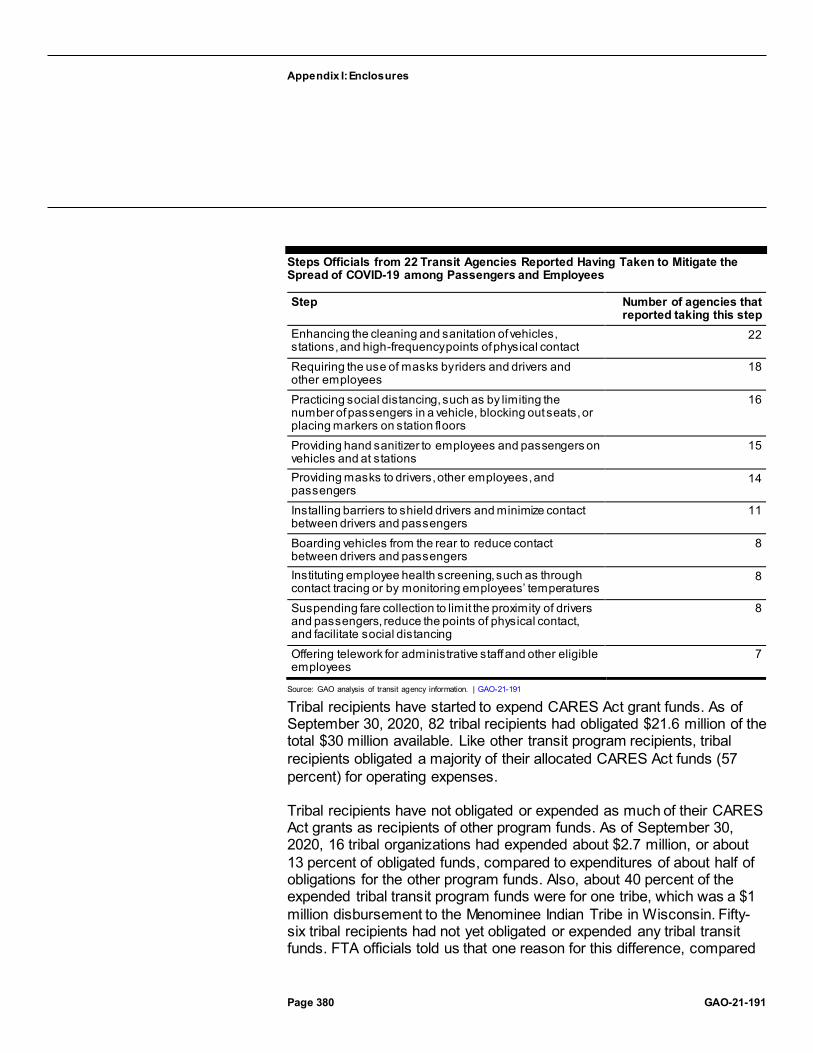
Appendix I: Enclosures
Page 380 GAO-21-191
Steps Officials from 22 Transit Agencies Reported Having Taken to Mitigate the Spread of COVID-19 among Passengers and Employees
Step Number of agencies that reported taking this step
Enhancing the cleaning and sanitation of vehicles, stations, and high-frequency points of physical contact
22
Requiring the use of masks by riders and drivers and other employees
18
Practicing social distancing, such as by limiting the number of passengers in a vehicle, blocking out seats, or placing markers on station floors
16
Providing hand sanitizer to employees and passengers on vehicles and at stations
15
Providing masks to drivers, other employees, and passengers
14
Installing barriers to shield drivers and minimize contact between drivers and passengers
11
Boarding vehicles from the rear to reduce contact between drivers and passengers
8
Instituting employee health screening, such as through contact tracing or by monitoring employees’ temperatures
8
Suspending fare collection to limit the proximity of drivers and passengers, reduce the points of physical contact, and facilitate social distancing
8
Offering telework for administrative staff and other eligible employees
7
Source: GAO analysis of transit agency information. | GAO-21-191
Tribal recipients have started to expend CARES Act grant funds. As of September 30, 2020, 82 tribal recipients had obligated $21.6 million of the total $30 million available. Like other transit program recipients, tribal recipients obligated a majority of their allocated CARES Act funds (57 percent) for operating expenses.
Tribal recipients have not obligated or expended as much of their CARES Act grants as recipients of other program funds. As of September 30, 2020, 16 tribal organizations had expended about $2.7 million, or about 13 percent of obligated funds, compared to expenditures of about half of obligations for the other program funds. Also, about 40 percent of the expended tribal transit program funds were for one tribe, which was a $1 million disbursement to the Menominee Indian Tribe in Wisconsin. Fifty-six tribal recipients had not yet obligated or expended any tribal transit funds. FTA officials told us that one reason for this difference, compared

Appendix I: Enclosures
Page 381 GAO-21-191
to other program recipients, is that many tribes closed transit operations during summer 2020 which delayed their obligations.
Further, in June 2020 we reported that the COVID-19 pandemic was having a disproportionate economic effect on tribal communities. FTA officials also told us that transit agencies in urban areas typically expend funds at a faster rate than agencies in rural areas, which include many tribal recipients. In addition, we have previously reported that some rural transit providers, including tribal transit providers, may face staffing constraints. For example, some staff take on multiple duties, such as serving as a bus driver and dispatcher in addition to grant and program manager. Such staffing constraints could make it difficult for tribal transit providers to fulfill the administrative requirements necessary to obtain FTA funding.
Agency Comments
We provided DOT and the Office of Management and Budget (OMB) with a draft of this enclosure. DOT provided technical comments, which we incorporated as appropriate. OMB did not provide comments on this enclosure.
GAO’s Methodology
To conduct this work, we analyzed DOT and FTA data on transit industry grant funding, including on tribal transit funding, as of September 30, 2020, which we found to be reliable for the purposes of describing federal allocations and transit agency obligations and expenditures. We reviewed written responses from DOT and FTA officials about how they were implementing provisions of the CARES Act. We also spoke to or reviewed responses from 22 of 30 selected transit agencies on challenges they had experienced with the pandemic and the provision of CARES Act grants. We selected the 30 transit agencies based on the size of their CARES Act allocations, as well as their geographic distribution across all 10 FTA regional offices. Finally, we interviewed the Community Transportation Association of America to discuss the impact of the CARES Act on their members.
Contact information: Andrew Von Ah, (202) 512-2834, [email protected]

Appendix I: Enclosures
Page 382 GAO-21-191
Related GAO Product
Public Transportation: Enhanced Federal Information Sharing on Coordination Could Improve Rural Transit Services. GAO-20-205. Washington, D.C.: January 7, 2020.
FEMA Disaster Relief Fund
We continue to be concerned about the demands on the Disaster Relief Fund and challenges the Federal Emergency Management Agency faces managing a significant number of concurrent disaster operations, among those being the 57 major disaster declarations for COVID-19 issued for each U.S. state, the District of Columbia, one tribe, and each U.S. territory.
Entity involved: Federal Emergency Management Agency, within the Department of Homeland Security
Key Considerations and Future GAO Work
In June 2020 we reported that the Federal Emergency Management Agency’s (FEMA) Disaster Relief Fund—the primary source of federal funding to provide disaster assistance to state, local, tribal, and territorial governments—had never been used to provide assistance for a nationwide public health emergency on the scale required by the COVID-19 pandemic. At that time, we noted that the scale and scope of federal efforts and funding required to address the COVID-19 pandemic is testing FEMA’s and other federal agencies’ capacity to mount an equitable and effective nationwide response.
Since that time, FEMA has spent billions from its Disaster Relief Fund to address the unprecedented number of simultaneous major disaster declarations in response to the COVID-19 pandemic; emerging disasters such as Western wildfires; recent hurricanes; and ongoing recovery operations from past disasters, including several large-scale hurricanes and wildfires in 2017 and 2018. One new but time-limited use of the fund—for the Lost Wages Assistance program (described in more detail below and in the Unemployment Insurance enclosure)—resulted in particularly rapid expenditures from the fund.
Since 2012, we have raised concerns about FEMA’s ability to assess jurisdictions’ capability to respond to and recover from disasters without

Appendix I: Enclosures
Page 383 GAO-21-191
federal aid. In our June 2020 report, we noted that with the scale and uncertainty surrounding the COVID-19 pandemic response, it will be even more important for FEMA to have a sound basis for determining what kind of aid it provides in order to uphold its responsibility to serve as a good steward of federal funds.
We will continue to monitor FEMA’s role in coordinating response and recovery efforts and to provide disaster assistance to individuals and communities for the COVID-19 pandemic response and other concurrent disaster operations.
Background
The Disaster Relief Fund receives an annual appropriation that since fiscal year 2012 has been based primarily on a 10-year rolling average of past obligations for noncatastrophic disasters (less than $500 million) and an estimate of needs for past catastrophic disasters (more than $500 million). In addition, the fund has routinely received supplemental appropriations. Appropriations to the Disaster Relief Fund are generally available until obligated, and FEMA uses a first-in, first-out accounting method to track its obligations. As of February 29, 2020, the fund had a balance of approximately $42.6 billion. The CARES Act appropriated an additional $45 billion.547 The figure below shows the Disaster Relief Fund’s monthly balance from February 2020 through October 2020.
547 CARES Act, Pub. L. No. 116-136, div. B, tit. VI, 134 Stat. 281, 543 (2020).

Appendix I: Enclosures
Page 384 GAO-21-191
Monthly Disaster Relief Fund Balance, February 2020 through October 2020
Overview of Key Issues
This is the first time in U.S. history that every state and territory has had simultaneous open declarations for the same disaster event.548 The figure below shows FEMA’s obligations from the Disaster Relief Fund for COVID-19 by state and territory as of October 2020.
548 Under the Robert T. Stafford Disaster Relief and Emergency Assistance Act (Stafford Act), the President may declare that a major disaster exists in response to a governor’s or tribal chief executive’s request if the disas ter is of such severity and magnitude that effective response is beyond the capabilities of a state, tribe, or local government and federal assistance is necessary. See 42 U.S.C. § 5170. As of September 2020, FEMA had issued 57 major disaster declarations for COVID-19 for each U.S. state, the District of Columbia, each U.S. territory, and one tribe.

Appendix I: Enclosures
Page 385 GAO-21-191
FEMA Obligations from the Disaster Relief Fund for COVID-19 by State and Territory, as of October 2020
Note: Since enactment of the Sandy Recovery Improvement Act of 2013, federally recognized tribes have had the option to make major disaster and emergency declaration requests directly or to join a state’s request for federal disaster assistance. See Pub. L. No. 113-2, § 1110, 127 Stat. 4, 47-49 (codif ied at 42 U.S.C. §§ 5170(b), 5191(c)). Prior to this, tribes had to receive assistance through a state. Of the 574 federally recognized tribes, there are 89 tribes w orking with FEMA as of September 30, 2020—about half of those 89 tribes are direct recipients w ith emergency declarations and about half are recipients under state major disaster declarations. One tribe, the Seminole Tribe of Florida, is a direct recipient w ith a major disaster and emergency declaration.
As of October 31, 2020, FEMA had obligated $54.15 billion to respond to the COVID-19 pandemic. Through the Disaster Relief Fund, FEMA provides grants—Individual Assistance and Public Assistance grants, among others—to disaster-affected individuals and state, local, tribal, and territorial governments after a presidential emergency or major disaster declaration. FEMA also issues mission assignments—work orders directing other federal agencies to provide direct assistance to state, local, tribal, and territorial governments—to support disaster response

Appendix I: Enclosures
Page 386 GAO-21-191
and recovery, which FEMA may reimburse through the Disaster Relief Fund. The figure below shows that as of September 2020 FEMA had obligated most of the funds for Individual Assistance. 549
COVID-19 Obligations from the Disaster Relief Fund by Program or Activity, as of September 2020
FEMA generally awards Individual Assistance grants directly to disaster-affected individuals and households. The Individual Assistance program has a number of facets used to cover a range of disaster needs. For weather- and climate-related and earthquake disasters, the majority of these needs consist of sheltering and housing needs, and assistance includes repairing damaged dwellings and providing immediate and interim shelter for individuals whose homes were damaged. Before August 8, 2020, Individual Assistance had been used, in the COVID-19 context, only to provide crisis counseling. However, on August 8, 2020, the President issued a presidential memorandum that directed that up to $44 billion be made available from the Disaster Relief Fund to provide
549 FEMA’s Disaster Relief Fund data as of October 31, 2020 combines program actual October 2020 COVID-19 obligations with program estimated November and December 2020 COVID-19 obligations, so we cannot provide COVID-19 obligations from the Disaster Relief Fund by program or activity as of October 31, 2020.
Appendix I: Enclosures
Page 387 GAO-21-191
Lost Wages Assistance to supplement unemployment insurance compensation.550
FEMA generally awards Public Assistance grants for states and other jurisdictions to use for life-saving and emergency protective measures and for longer term recovery needs. In weather- and climate-related and earthquake disasters, the larger Public Assistance expenditures have tended to be for permanent reconstruction projects such as rebuilding damaged public infrastructure. These permanent reconstruction projects may take years to complete. For all 57 major disaster declarations for COVID-19, FEMA has authorized Public Assistance grants for emergency protective measures only. In general, this has meant making reimbursements for medical care, food purchase and distribution, non-congregate medical sheltering, some personal protective equipment, and limited other activities.551
For the COVID-19 response, as of October 2, 2020, FEMA had issued a total of 1,424 mission assignments for a range of activities, from providing cleaning and medical supplies to building large temporary medical facilities. As shown in the figure below, nearly 70 percent of these mission assignments were tasked to four federal agencies—the Department of Defense, the Department of Veterans Affairs, the Department of Health and Human Services, and the U.S. Army Corps of Engineers. Over half of all mission assignments tasked to these four federal agencies are related to personnel.
550 The presidential memorandum directed that the program would end when $44 billion had been obligated; the balance of the Disaster Relief Fund reached $25 billion; on December 27, 2020; or upon the enactment of legislation providing supplemental federal unemployment compensation, whichever comes first. Although FEMA has a disaster unemployment assistance program, this is the first time it has implemented and funded through the Disaster Relief Fund this type of Lost Wages Assistance program.
551 FEMA Policy FP 104-009-19, Coronavirus (COVID-19) Pandemic: Work Eligible for Public Assistance (Interim), September 1, 2020.

Appendix I: Enclosures
Page 388 GAO-21-191
Four Federal Agencies Tasked with the Most Mission Assignments
Note: Percentages may not add to 100 due to rounding. The “other” category includes, among other things, amendments to existing mission assignments that do not represent new activities. For each agency listed, the category that included amendments and administrative assignments made up from 9 to 31 percent of the total number of mission assignments. The “personnel” category includes but is not limited to activities such as the deployment of National Guard personnel, Disaster Medical Assistance Teams, and a system of healthcare w orkers mobilized to augment healthcare systems. The “medical facilities” category includes but is not limited to mission assignments such as deployable temporary medical treatment facilities. Less than 0.5 percent of mission ass ignment data did not include information on the nature of the request.
Our concerns about the ability of the Disaster Assistance Fund to meet demands continue. In addition to the 57 major disaster declarations for COVID-19, as of October 15, 2020, FEMA had about 500 non-COVID-19 active major disaster declarations in various states of response and recovery. The figure below compares obligations from the Disaster Relief Fund for the five costliest storms with obligations for COVID-19.552
552 We identified the five costliest storms based on data from the National Oceanic and Atmospheric Administration’s National Centers for Environmental Information (NCEI), Costliest U.S. Tropical Cyclones, (October 7, 2020). NCEI determined the estima ted total costs in terms of dollars (values based on the 2020 Consumer Price Index adjusted cost) that would not have been incurred had the disaster event not taken place. Insured and uninsured losses are included in damage estimates. Sources include the N ational Weather Service, FEMA, the U.S. Department of Agriculture, the U.S. Army Corps of Engineers, individual state emergency management agencies, state and regional climate centers, media reports, and insurance industry estimates. This chart depicts Dis aster Relief Fund obligations for these storms and COVID-19, as of October 2020.

Appendix I: Enclosures
Page 389 GAO-21-191
Obligations from the Disaster Relief Fund for COVID-19 and the Five Costliest Storms, as of October 2020
The number of concurrent demands on the Disaster Relief Fund and the unpredictability of future response needs raise questions about its availability for both the COVID-19 response and the significant number of active disasters in different stages of recovery, including the ongoing recovery in Puerto Rico—one of the largest recovery efforts in FEMA history. According to the Congressional Research Service, the balance in the Disaster Relief Fund previously has dropped to a point that raised concerns about the availability of adequate resources. In those circumstances, FEMA implemented restrictions aimed at prioritizing Individual Assistance and emergency response and emergency protective measures, while temporarily putting on hold funding for long-term recovery projects and hazard mitigation projects.553
Given that the COVID-19 pandemic calls for a different kind of response than past disasters and all Public Assistance obligations have been for emergency protective measures, it is not clear what it would mean to the COVID-19 pandemic response or to the other disaster recoveries should FEMA have to implement restrictions. According to senior officials 553 Congressional Research Service, The Disaster Relief Fund: Overview and Issues, R45484 (Washington, D.C.: Apr. 16, 2020).

Appendix I: Enclosures
Page 390 GAO-21-191
responsible for FEMA’s Public Assistance program, they work closely with the Office of the Chief Financial Officer to monitor balances and upcoming needs. These officials said they are not worried about Disaster Relief Fund balances in the immediate term, but if they did confront this kind of low balance situation, they would likely restrict or slow down project obligations in some way, as they have in the past.
In addition, while FEMA has experience determining when the emergency response phase has ended in the wake of weather- and climate-related disasters and earthquakes, and the temporal and geographical bounding of these disasters makes doing so more clear cut, it is not clear when nonfederal governments will no longer require FEMA help to fund their emergency protective measures for the COVID-19 pandemic. According to senior FEMA officials, they will continue to monitor the whole-of-nation COVID-19 response and evaluate a framework for deciding when states have capacity to respond without federal support, but they are not currently at the point of making any of these kinds of decisions. We will continue to monitor the use of the Disaster Relief Fund for COVID-19, including evaluating any criteria used to determine how and when to close out existing major disaster declarations for the COVID-19 pandemic.
Agency Comments
We provided the Department of Homeland Security (DHS) and the Office of Management and Budget (OMB) with a draft of this enclosure. DHS provided technical comments, which we incorporated as appropriate. OMB did not provide comments on this enclosure.
GAO’s Methodology
To conduct this work, we reviewed FEMA documentation on its disaster assistance programs and relevant federal law, including the March 2020 CARES Act and the Stafford Act, and analyzed the most recent data on congressional appropriations and FEMA obligations in response to the COVID-19 pandemic. We also reviewed the August 8, 2020, presidential memorandum and past Congressional Research Service work on the Disaster Relief Fund. We interviewed FEMA officials regarding federal disaster assistance efforts and challenges the agency has faced in effectively helping affected state and local governments to respond and recover from disasters.
Contact information: Chris Currie, (404) 679-1875, [email protected]

Appendix I: Enclosures
Page 391 GAO-21-191
Related GAO Product
Federal Disaster Assistance: Improved Criteria Needed to Assess a Jurisdiction’s Capability to Respond and Recover on Its Own. GAO-12-838. Washington, D.C.: September 12, 2012.
Airport Grants
The Federal Aviation Administration is administering funding for grants to help the nation’s airports respond to and recover from the economic effects of the COVID-19 pandemic.
Entity involved: Federal Aviation Administration, within the U.S. Department of Transportation
Key Considerations and Future GAO Work
Since we reported on airport grants in September 2020, we have identified continued concerns from airports about declines in revenue from reduced aircraft operations and passengers, and about the uncertainty of receiving additional federal funding. We will continue to monitor CARES Act grants to airports in ongoing and planned work.
Background
U.S. airports are important contributors to the U.S. economy and fulfill a variety of vital roles, from supporting scheduled commercial air service to supporting freight transportation, emergency medical transportation, and disaster relief. Approximately 3,300 airports in the U.S. are part of the national airport system and are eligible to receive federal Airport Improvement Program (AIP) grants to fund infrastructure projects. As we reported in February 2020, from fiscal years 2013 through 2017 airports received an average of $3.2 billion annually in federal AIP grants.
Historic decreases in passenger demand for air travel due to the COVID-19 pandemic are significantly affecting U.S. airports’ abilities to generate the revenue needed for operating and infrastructure costs. According to recent data filed with the U.S. Department of Transportation (DOT), U.S. airlines operated 65 percent fewer flights in June 2020 than in June 2019. While federal AIP grants are used to fund capital infrastructure projects, airport owners—also known as airport sponsors—may use CARES Act funds for any purpose for which airport revenues may be lawfully used,

Appendix I: Enclosures
Page 392 GAO-21-191
including for airport operating expenses and debt service. The CARES Act provided $10 billion to support U.S. airports of all sizes experiencing severe economic disruption caused by the COVID-19 pandemic through four different funding groups (see table).554
CARES Act Airport Grants by Funding Group
CARES Act funding group Funds appropriated (in dollars)a
Formula applied
Group 1: Increase federal share for 2020 Airport Improvement Program (AIP) grants
At least 500 million Increase the federal share to 100 percent for grants awarded for airport infrastructure projects under fiscal year 2020 AIP and supplemental discretionary grantsb
Group 2: Commercial service airports (i.e., publicly owned airports with at least 2,500 passenger boardings per year and scheduled air service)
At least 7.4 billion Allocate based on a formula that considers an airport’s passenger boardings, the airport sponsor’s debt service, and the sponsor’s ratio of unrestricted reserves to debt servicec
Group 3: Primary airports (i.e., large, medium, and small hub and non-hub airports with more than 10,000 passenger boardings per year)d
Up to 2 billion Allocate based on statutory AIP entitlement formulas
Group 4: General aviation airports (i.e., airports with fewer than 2,500 passenger boardings per year and no scheduled air service)
At least 100 million Allocate based on the categories these airports are placed in given activity measures (e.g., volume and type of flights) and other factors in the most current National Plan of Integrated Airport Systems
Source: GAO analysis of CARES Act. Pub. L. No. 116-136, 134 Stat. 281 (2020). | GAO-21-191 aThe CARES Act gives the Federal Aviation Administration (FAA) the authority to retain up to 0.1 percent of the $10 billion (up to $10 million) provided for Grants-in-Aid for Airports to fund the aw ard and oversight by FAA of grants made under the CARES Act. bNational system airports are eligible to receive federal funding from AIP grants for infrastructure development. The distribution of federal AIP grants is based on a combination of formula funds—also referred to as entitlement funds—that are available to national system airports, and discretionary funds that FAA aw ards for selected eligible projects. Entitlement funds are apportioned by formula to airports and may generally be used for any eligible airport improvement or planning project. Discretionary funds are approved by FAA based on FAA selection criteria and a priority system, w hich FAA uses to rank projects based on the extent to w hich they reflect FAA’s nationally identif ied priorities. The federal share for AIP grants generally ranges from 75 percent to 95 percent. cThe FAA used f iscal year 2018 Certif ication Activity Tracking System data, reported as of March 14, 2020, to calculate allocations under the CARES Act formulas for commercial service airports. More specif ically, the total allocation to a commercial service airport is determined by a formula that considers an airport’s passenger boardings for calendar year 2018 (50 percent), the airport sponsor ’s debt service for f iscal year 2018 (25 percent), and the sponsor ’s ratio of unrestricted reserves to debt service for f iscal year 2018 (25 percent). dThis funding group may also include non-primary commercial service airports with 8,000 – 9,999 passenger boardings. CARES Act, Div. B, Title XII, para. (3), 134 Stat. at 597.
554 Pub. L. No. 116-136, 134 Stat. 281, 596-597. The CARES Act gives the Federal Aviation Administration (FAA) the authority to retain up to 0.1 percent of the $10 billion (up to $10 million) provided for Grants -in-Aid for Airports to fund the award and oversight by FAA of grants made under the CARES Act.
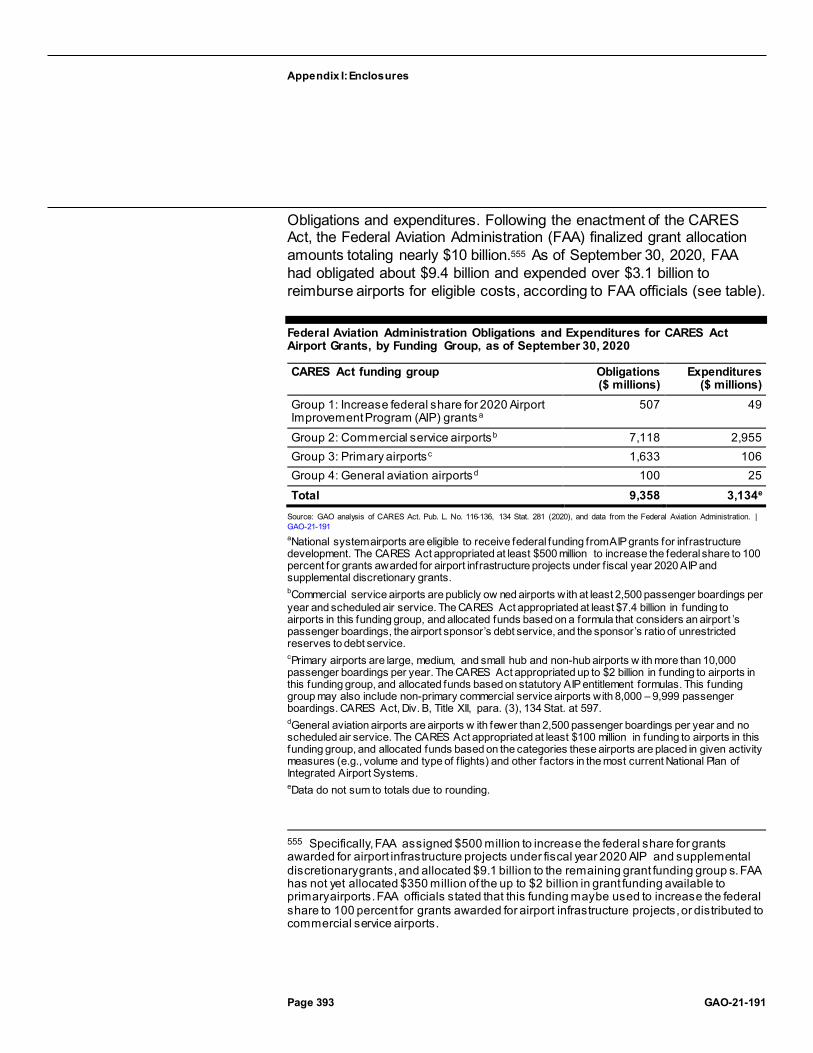
Appendix I: Enclosures
Page 393 GAO-21-191
Obligations and expenditures. Following the enactment of the CARES Act, the Federal Aviation Administration (FAA) finalized grant allocation amounts totaling nearly $10 billion.555 As of September 30, 2020, FAA had obligated about $9.4 billion and expended over $3.1 billion to reimburse airports for eligible costs, according to FAA officials (see table).
Federal Aviation Administration Obligations and Expenditures for CARES Act Airport Grants, by Funding Group, as of September 30, 2020
CARES Act funding group Obligations ($ millions)
Expenditures ($ millions)
Group 1: Increase federal share for 2020 Airport Improvement Program (AIP) grants a
507 49
Group 2: Commercial service airportsb 7,118 2,955 Group 3: Primary airportsc 1,633 106 Group 4: General aviation airportsd 100 25 Total 9,358 3,134e
Source: GAO analysis of CARES Act. Pub. L. No. 116-136, 134 Stat. 281 (2020), and data from the Federal Aviation Administration. | GAO-21-191 aNational system airports are eligible to receive federal funding from AIP grants for infrastructure development. The CARES Act appropriated at least $500 million to increase the federal share to 100 percent for grants awarded for airport infrastructure projects under f iscal year 2020 AIP and supplemental discretionary grants. bCommercial service airports are publicly ow ned airports with at least 2,500 passenger boardings per year and scheduled air service. The CARES Act appropriated at least $7.4 billion in funding to airports in this funding group, and allocated funds based on a formula that considers an airport ’s passenger boardings, the airport sponsor’s debt service, and the sponsor’s ratio of unrestricted reserves to debt service. cPrimary airports are large, medium, and small hub and non-hub airports w ith more than 10,000 passenger boardings per year. The CARES Act appropriated up to $2 billion in funding to airports in this funding group, and allocated funds based on statutory AIP entitlement formulas. This funding group may also include non-primary commercial service airports with 8,000 – 9,999 passenger boardings. CARES Act, Div. B, Title XII, para. (3), 134 Stat. at 597. dGeneral aviation airports are airports w ith fewer than 2,500 passenger boardings per year and no scheduled air service. The CARES Act appropriated at least $100 million in funding to airports in this funding group, and allocated funds based on the categories these airports are placed in given activity measures (e.g., volume and type of f lights) and other factors in the most current National Plan of Integrated Airport Systems. eData do not sum to totals due to rounding.
555 Specifically, FAA assigned $500 million to increase the federal share for grants awarded for airport infrastructure projects under fiscal year 2020 AIP and supplemental discretionary grants, and allocated $9.1 billion to the remaining grant funding group s. FAA has not yet allocated $350 million of the up to $2 billion in grant funding available to primary airports. FAA officials stated that this funding may be used to increase the federal share to 100 percent for grants awarded for airport infrastructure projects, or distributed to commercial service airports.

Appendix I: Enclosures
Page 394 GAO-21-191
Workforce retention requirements. Certain airport sponsors accepting CARES Act grant funds must continue to employ, through December 31, 2020, at least 90 percent of the number of individuals employed as of March 27, 2020. According to FAA, the 130 largest U.S. airports are subject to this requirement, and are to submit to the agency workforce retention reports, which we discuss below. These 130 airports served approximately 96 percent of commercial service passenger boardings in the U.S. in 2018. Airports with limited commercial service or that primarily serve general aviation flights are exempt from this requirement.556
Overview of Key Issues
Program administration and monitoring. According to FAA officials, since we last reported in September 2020, FAA has continued to process grant applications, obligate funds, and review invoices to reimburse airport sponsors. As of September 30, 2020, FAA had processed grant applications for 3,234 U.S. airports, including for those in territories and tribes, totaling about $8.8 billion.
Moreover, since we last reported, FAA has taken additional actions to oversee and monitor airports’ compliance with workforce retention requirements. According to FAA, the agency sent letters to 88 airports that had not yet submitted requested workforce retention reports as of August 2020. FAA officials said that, as of October 2020, all 130 airports had submitted initial and June 30 reports on workforce retention statistics. FAA officials said they will continue to work with airports to obtain timely reporting for September 30 and December 31, but airports that fail to report could be subject to suspension of reimbursements or possibly grant termination. FAA would resort to these consequences only if repeated outreach efforts with the airport were unsuccessful. FAA officials said airport sponsors have asked for additional information on workforce retention requirements, including for information about the reporting
556 Specifically, non-hub and nonprimary airports are excluded from the workforce retention requirement. As a result, non-hub primary commercial service airports (airports with more than 10,000 annual passenger boardings, but less than .05 percent of total annual passenger boardings), nonprimary commercial service airports (airports with at least 2,500 and no more than 10,000 annual passenger boardings), general aviation airports (public-use airports that do not have scheduled service or have scheduled service with fewer than 2,500 annual passenger boardings), and reliever airports (airports designated by FAA to relieve congestion at commercial service airports) are all exempt from the workforce retention requirement.

Appendix I: Enclosures
Page 395 GAO-21-191
format, applicability of the requirements, and implications of not meeting the requirements.
As we previously reported in September 2020, FAA has identified challenges with administering and monitoring CARES Act airport grants, including the need to process grants for over 3,000 airport sponsors under expedited time frames, with expanded eligible uses for these funds. To address the increased workload of processing and monitoring these grants, FAA rehired three annuitants in September, and is in the process of hiring a contractor to help with internal auditing, documentation processing, and reporting. FAA officials also stated they are updating guidance to incorporate lessons learned through the invoicing process to streamline processes and reduce workload. Selected airport sponsors and airport association representatives that we spoke to noted that FAA has provided timely guidance and assistance on how to apply for federal funds and determine the eligibility for and claim reimbursement for airport costs.
Airport grant funding’s uses and needs. According to FAA officials, airports continue to use CARES Act grant funds primarily for payroll and debt service. Airport association representatives told us that the federal funding provided has been critical to the survival of the industry. However, airport concerns continue due to declines in revenue from reduced aircraft operations and passengers, and the uncertainty of additional federal funding. Some airports said that, as a result, they have deferred some of their planned capital improvements. Some general aviation airports said that they are beginning to experience growth in chartered flight operations, as some passengers seek alternatives to commercial airlines. However, for some airports, activity levels overall are still significantly lower due to the ongoing effects of the pandemic.
According to airport associations, additional federal aid will be needed for airports to, among other things, continue to pay their employees and meet their debt obligations. In addition, airport associations we spoke with said that any future federal funding should be based on an airport’s prepandemic activity level, such as on the number of passenger boardings for commercial service airports and operations for general aviation airports, rather than on the CARES Act grant allocation formulas currently used (summarized in the first table). For example, as we reported in June 2020, the grant formula in the CARES Act and available data for calculating the awards for commercial service airports (i.e., passenger boardings, debt service, and the ratio of unrestricted reserves to debt service) resulted in some small airports being allocated large
Appendix I: Enclosures
Page 396 GAO-21-191
amounts relative to their passenger activity or annual operating budgets. In other cases, the formula and available data resulted in some airports with large annual passenger boardings being awarded less funding than airports with fewer annual passenger boardings. Finally, some airport association representatives and airport officials we spoke with said that, in addition to airport relief, they are also supportive of additional federal assistance for airport tenants and related businesses who have been significantly impacted by the pandemic.
Agency Comments
We provided DOT and the Office of Management and Budget (OMB) with a draft of this enclosure. DOT provided technical comments, which we incorporated as appropriate. OMB did not provide comments on this enclosure.
GAO’s Methodology
To conduct this work, we reviewed FAA data on airport funding as of September 30, 2020, which we found to be reliable for the purposes of describing obligations and expenditures through interviews with agency officials and reviewing relevant documentation, and we reviewed federal laws and agency guidance related to the CARES Act. We also conducted interviews with representatives from three airport associations, selected to represent a wide variety of industry and airport types, and from a nongeneralizable selection of several general aviation airports.
Contact information: Heather Krause, (202) 512-2834, or [email protected]
Related GAO Product
Airport Infrastructure: Information on Funding and Financing for Planned Projects. GAO-20-298. Washington, D.C.: February 13, 2020.
Federal Contracts and Agreements for COVID19
As of October 15, 2020, government-wide contract obligations totaled about $33.4 billion, and agencies reported an additional $10 billion for other transaction agreements in response to COVID-19. In the past, our work has noted that the use of other transaction agreements carries a risk of reduced accountability and transparency.

Appendix I: Enclosures
Page 397 GAO-21-191
Entities involved: Department of Health and Human Services; Department of Defense; and Department of Homeland Security, among others
Key Considerations and Future GAO Work
As federal contracting activity continues to play a critical role in response to the pandemic, ensuring that criteria for tracking contract actions and associated obligations are consistently applied and account for the long-term needs of users—such as federal agencies and Congress—is critical. In September 2020, we recommended that the Secretaries of Homeland Security and Defense (1) revise the criteria in the 2019 National Interest Action code memorandum of agreement to clearly identify steps they will take to obtain input from key federal agencies prior to extending or closing a National Interest Action code, (2) establish timelines for evaluating the need to extend a National Interest Action code, and (3) define what constitutes a consistent decrease in contract actions and routine contract activity to ensure the criteria for extending or closing the National Interest Action code reflect government-wide needs for tracking contract actions in longer term emergencies, such as a pandemic.
The Department of Defense (DOD) and the Department of Homeland Security (DHS) did not agree with our recommendations. However, in October 2020 in response to our recommendations, DOD and DHS officials said they plan to review the 2019 National Interest Action code memorandum of agreement by the end of calendar year 2020. At that time, officials stated they intend to update the agreement to include additional details on practices for communicating with other agencies, and will consider whether additional changes should be incorporated into the agreement. We continue to believe that revising the memorandum of agreement is necessary to ensure consistent application of the criteria and increased transparency regarding the process for extending and closing National Interest Action codes.
We have additional work underway related to the federal government’s use of contracts to respond to COVID-19, including, among other things, assessing (1) contracts awarded by selected agencies in response to COVID-19, including agencies’ efforts to review prospective contractor qualifications in advance of awarding a contract; (2) selected agencies’ use of contracting flexibilities, such as other transaction agreements and undefinitized contracts; (3) the use of contractor paid leave provisions in the CARES Act.

Appendix I: Enclosures
Page 398 GAO-21-191
Background
To facilitate the U.S. response to COVID-19, federal agencies have used a variety of contracting mechanisms to provide vital goods and services in support of federal, state, and local COVID-19 response efforts. Our prior work has found that contracts play a key role in federal emergency response efforts, and that contracting during an emergency can present a unique set of challenges as officials can face a significant amount of pressure to provide critical goods and services as expeditiously and efficiently as possible.557
The CARES Act authorized additional contracting flexibilities for federal agencies. For example, the CARES Act relaxed certain limitations on the use of other transactions for the Department of Health and Human Services (HHS) and DOD, such as congressional reporting requirements and requirements for who can approve certain transactions.558
Overview of Key Issues
Government-wide contract obligations. In response to the COVID-19 pandemic, contract obligations totaled about $33.4 billion as of October 15, 2020.559 HHS accounted for about 39 percent of the total obligations made by federal agencies (see figure).
557 GAO, Disaster Contracting: FEMA Continues to Face Challenges with Its Use of Contracts to Support Response and Recovery, GAO-19-518T (Washington, D.C.: May 9, 2019); 2017 Disaster Contracting: Actions Needed to Improve the Use of Post -Disaster Contracts to Support Response and Recovery, GAO-19-281 (Washington, D.C.: Apr. 24, 2019); and 2017 Disaster Contracting: Action Needed to Better Ensure More Effective Use and Management of Advance Contracts, GAO-19-93 (Washington, D.C: Dec. 6, 2018).
558 Pub. L. No. 116-136, §§ 3301, 13006, 134 Stat. at 383, 522.
559 For the purposes of this report, “contract obligations” refers to obligations on contracts that are subject to the Federal Acquisition Regulation and does not include, for example, grants, cooperative agreements, loans, other transactions for research, real property leases, or requisitions from federal stock.
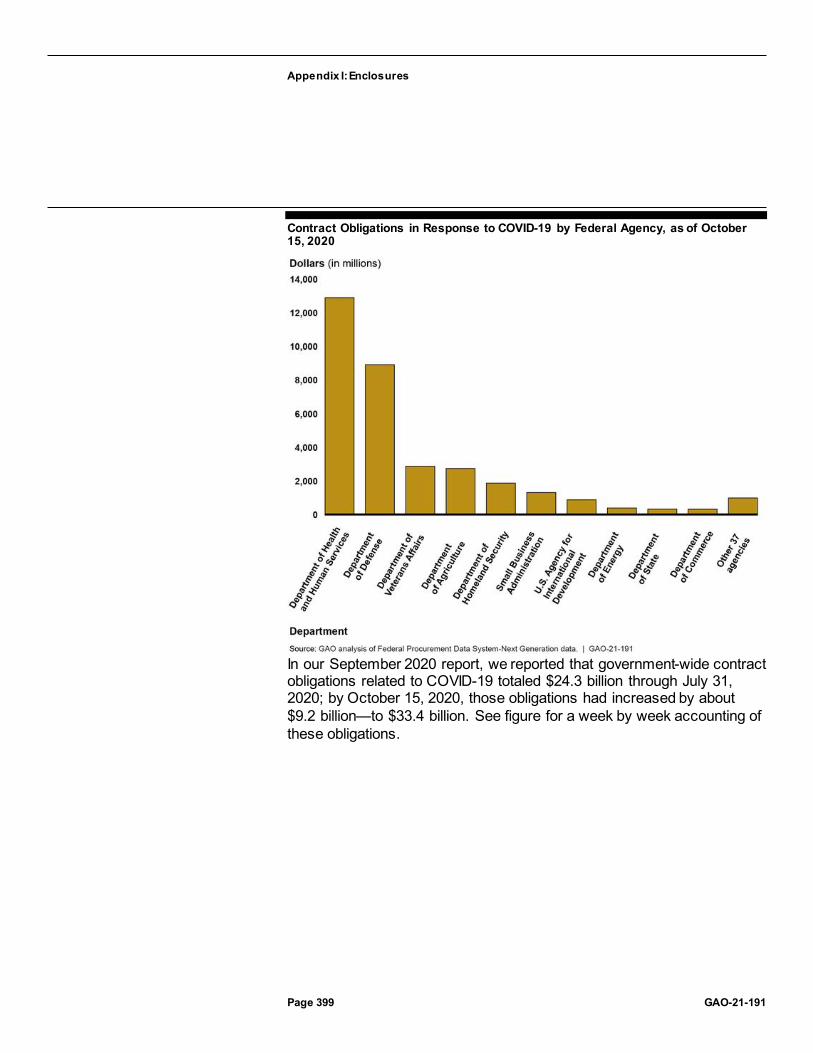
Appendix I: Enclosures
Page 399 GAO-21-191
Contract Obligations in Response to COVID-19 by Federal Agency, as of October 15, 2020
In our September 2020 report, we reported that government-wide contract obligations related to COVID-19 totaled $24.3 billion through July 31, 2020; by October 15, 2020, those obligations had increased by about $9.2 billion—to $33.4 billion. See figure for a week by week accounting of these obligations.

Appendix I: Enclosures
Page 400 GAO-21-191
Government-wide Contract Obligations Related to COVID-19 by Week, February–October 2020
Consistent with what we reported in September 2020, medical equipment and supplies—including ventilators and personal protective equipment—continue to be the largest area of government-wide contract obligations in response to COVID-19. As of October 15, 2020, these obligations had increased by about $1.5 billion since July 31, 2020, and accounted for about $8.3 billion, or 25 percent of government-wide contract obligations. Since July 31, 2020, obligations for fruits and vegetables—made primarily in support of the U.S. Department of Agriculture’s Farmers to Families Food Box Program—rose to the second highest area of government-wide contract obligations, increasing by $885.4 million to $1.9 billion. See figure for obligation amounts for the most-procured goods and services.

Appendix I: Enclosures
Page 401 GAO-21-191
Contract Obligation Amounts for Goods and Services Most Procured in Response to COVID-19, as of October 15, 2020
Similar to what we reported in September 2020, half of government-wide contract obligations—about $16.9 billion as of October 15, 2020—were on contracts we identified as having been awarded noncompetitively. Agencies cited an urgent need for awarding contracts noncompetitively for about 68 percent, or $11.5 billion, of the contract obligations that were awarded noncompetitively. 560 Awarding contracts under the unusual and compelling urgency exception to full and open competition can be necessary in certain circumstances. However, our prior work has noted that promoting competition—even in a limited form—increases the
560 For the purposes of this report, obligations on contracts identified as using the unusual and compelling urgency exception include those associated with contracts subject to Federal Acquisition Regulation 6.302-2, as well as orders under multiple award contracts, which are subject to separate competition requirements under Federal Acquisition Regulation Part 16. Specifically, under Federal Acquisition Regulation 16.505(b)(2), orders on multiple award contracts require contracting officers to give every awardee a fair opportunity to be considered for a delivery order or task order exceeding $3,500, with exceptions, including if the agency need for the supplies or services is so urgent that providing a fair opportunity would result in unacceptable delays. When using the unusual and compelling urgency exception to full and open competition, agencies still must request offers from as many potential sources as is practicable under the circumstances.

Appendix I: Enclosures
Page 402 GAO-21-191
likelihood of acquiring quality goods and services at a lower price in urgent situations. 561
Contracts for goods continued to be competed less frequently than contracts for services: about 63 percent of the obligations for goods were on contracts that were not awarded competitively, compared with about 36 percent of the obligations for services. For example, about $7.2 billion, or 87 percent of the $8.3 billion in obligations for medical and surgical equipment, were on contracts awarded noncompetitively.
Agencies have reported using a variety of contracting techniques to respond to COVID-19. For example, undefinitized contracts can enable the government to quickly fulfill requirements that are urgent or need to be met quickly by allowing contractors to begin work before reaching a final agreement with the government on all contract terms and conditions.562 From July 31, 2020, through October 15, 2020, undefinitized contract obligations increased by $99.6 million to about $2.3 billion, and accounted for about 7 percent of government-wide contract obligations on contracts awarded in response to COVID-19. DOD reported the highest amount of undefinitized contract obligations, identifying about $1.6 billion, or about 18 percent of its COVID-19-related contract obligations as being undefinitized. Our prior work has shown that these types of contracts can pose risks to the government. For example, contractors may lack incentives to control costs before all contract terms and conditions are defined.563
Other transaction agreements. In addition to contract obligations, agencies have continued to report using other transaction agreements in response to COVID-19. These agreements can enable federal agencies to negotiate terms and conditions specific to a project without requiring them to comply with certain federal laws and regulations. However, our prior work has noted that their use carries the risk of reduced
561 GAO, Federal Contracting: Noncompetitive Contracts Based on Urgency Need Additional Oversight, GAO-14-304 (Washington, D.C.: Mar. 26, 2014).
562 Undefinitized contracts include letter contracts , as well as other undefinitized actions.
563 GAO, Defense Contracting: DOD Has Enhanced Insight into Undefinitized Contract Action Use, but Management at Local Commands Needs Improvement, GAO-10-299 (Washington, D.C.: Jan. 28, 2010).

Appendix I: Enclosures
Page 403 GAO-21-191
accountability and transparency. 564 From July 31, 2020, through October 15, 2020, reported obligations associated with other transaction agreements increased from about $6.6 billion to about $10 billion.
DOD has reported obligating about $8.7 billion of that total in prototype and production other transaction agreements, including a $2.1 billion agreement for large-scale antibody and vaccine manufacturing in response to COVID-19. Within the Federal Procurement Data System-Next Generation, we found that HHS reported obligating about $1.3 billion for other transactions, including for vaccine development and manufacturing. 565
Agency Comments
We provided HHS, DOD, DHS, and the Office of Management and Budget with a draft of this enclosure. The agencies did not provide comments on this enclosure.
GAO’s Methodology
To identify agencies’ federal contract obligations and competition rate on contracts in response to COVID-19, we reviewed Federal Procurement
564 GAO, Department of Homeland Security: Improvements Could Further Enhance Ability to Acquire Innovative Technologies Using Other Transaction Authority, GAO-08-1088 (Washington, D.C.: Sept. 23, 2008) and Defense Acquisitions: DOD Has Implemented Section 845 Recommendations but Reporting Can Be Enhanced, GAO-03-150 (Washington, D.C.: Oct. 9, 2002).
565 We identified actions associated with at least four other transaction agreements that HHS has reported as Federal Acquisition Regulation based contract obligations in the Federal Procurement Data System-Next Generation. For those actions that HHS confirmed were other transaction agreements, we removed those obligations from our reported contract obligations and are reporting them as other transaction agreement obligations.

Appendix I: Enclosures
Page 404 GAO-21-191
Data System-Next Generation data through October 15, 2020.566 We identified contract obligations related to COVID-19 using the National Interest Action code, as well as the contract description field.567 For contract actions over $1 million, we removed obligations that were identified in the contract description as not related to COVID-19. We assessed the reliability of federal procurement data by reviewing existing information about the Federal Procurement Data System-Next Generation and the data it collects—specifically, the data dictionary and data validation rules—and by performing electronic testing. We determined that the data were sufficiently reliable for the purposes of describing agencies’ reported contract obligations in response to COVID-19.
Contact information: Marie A. Mak, (202) 512-4841, [email protected]
International Trade
U.S. imports of COVID-19-related products in July and August 2020568
were lower than the peak level in June, and U.S. agencies have taken trade-related actions to address medical supply chain issues and to support businesses to strengthen the domestic industrial base in response to COVID-19.
566 Data from FPDS-NG.gov accessed October 15, 2020. For purposes of this report, “competition rate” is the percentage of total obligations associated with contracts awarded competitively. We calculated competition rates as the percentages of obligations on competitive contracts and orders over all obligations on contracts and orders annually. Competitive contracts included contracts and orders coded in the Federal Procurement Data System-Next Generation as “full and open competition,” “full and open after exclusion of sources,” and “competed under simplified acquisition procedures” as well as orders coded as “subject to fair opportunity” and as “fair opportunity given,” and “competitive set aside.” Noncompetitive contracts included contracts and orders coded in the Federal Procurement Data System-Next Generation as “not competed,” “not avai lable for competition,” and “not competed under simplified acquisition procedures,” as well as orders coded as an exception to “subject to fair opportunity,” including “urgency,” “only one source,” “minimum guarantee,” “follow-on action following competitive initial action,” “other statutory authority,” and “sole source.” Even for contracts identified as noncompetitive, agencies may have solicited more than one source.
567 Our prior work has identified some inconsistencies in the information agencies report in the contract description field in the Federal Procurement Data System -Next Generation. See GAO, DATA Act: Quality of Data Submissions Has Improved by Further Action Is Needed to Disclose Known Data Limitations, GAO-20-75 (Washington, D.C.: Nov. 8, 2019).
568 This was the latest data available when we completed our analysis for this area. Future reports will include updated information.

Appendix I: Enclosures
Page 405 GAO-21-191
Entities involved: Export-Import Bank of the United States; U.S. International Development Finance Corporation.
Key Considerations and Future GAO Work
We plan to continue to monitor the effect of COVID-19 on international trade and the medical supply chain. In particular, we are expanding our review of the U.S. International Development Finance Corporation’s (DFC) use of Defense Production Act (DPA) funding.
Background
The COVID-19 pandemic has disrupted businesses around the world. The World Trade Organization reported on June 23, 2020, that international trade fell sharply as the COVID-19 pandemic upended the global economy, estimating a drop of almost 19 percent from 2019. In the face of disrupted international supply chains, U.S. imports of COVID-19-related products such as face masks, ventilators, gloves, and hand sanitizers have fluctuated.
U.S. agencies, including the Export-Import Bank of the United States (EXIM) and DFC, have taken steps to address issues that affect the U.S. supply of such essential products, and trade in general.
Overview of Key Issues
U.S. imports of COVID-19-related products have declined. Available data indicate that the upward trend in imports of product categories related to the COVID-19 response has halted. Imports of these products increased by roughly 46 percent from February to June 2020, but declined by about 8 percent from June to July, and increased by roughly 5 percent from July to August 2020 (see figure).569 In particular, imports from China increased significantly between March and May 2020, but decreased by 25 percent from May to August 2020. Meanwhile, imports from other countries declined significantly between March and May 2020, but increased by 14 percent from May to August 2020. Imports from China accounted for
569 These product categories were identified by the U.S. International Trade Commission (USITC) in its report, COVID-19 Related Goods: U.S. Imports and Tariffs, Investigation No. 332-576, USITC Publication 5073 (Washington, D.C.: June 2020). USITC changed 12 of these product categories in its July 1, 2020, revision to the Harmonized Tariff Schedule. We identified these product categories and included them in the July and August 2020 data for our analysis.
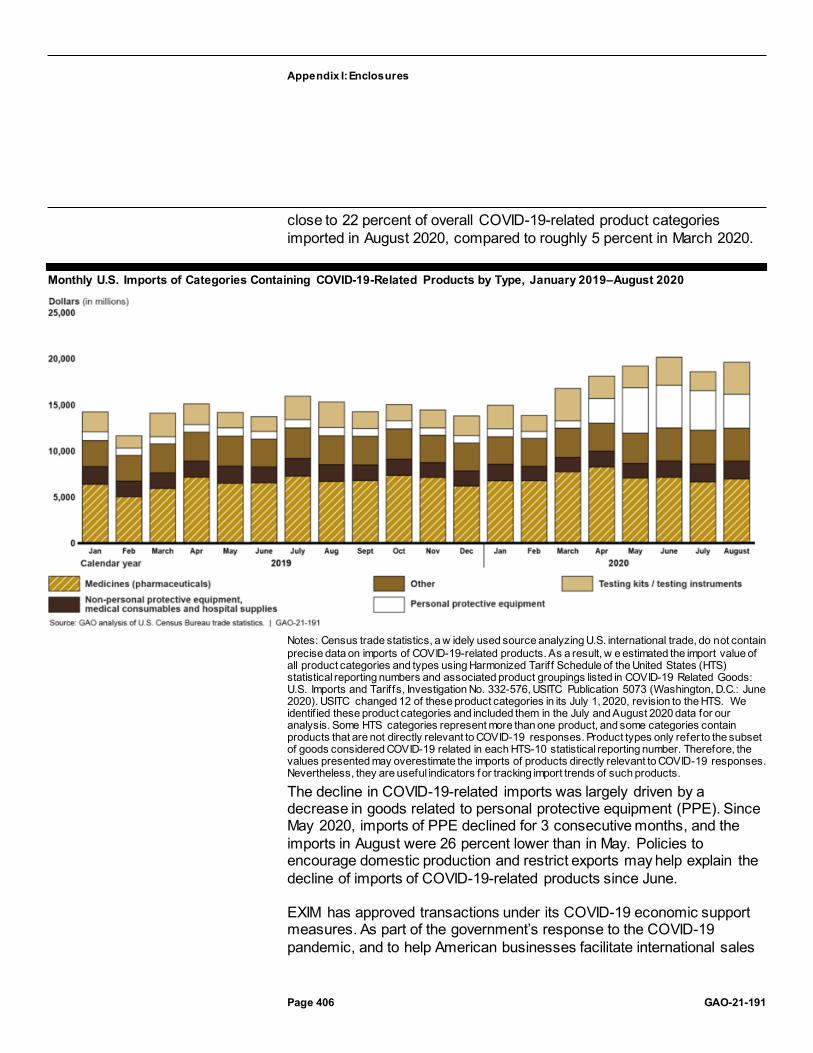
Appendix I: Enclosures
Page 406 GAO-21-191
close to 22 percent of overall COVID-19-related product categories imported in August 2020, compared to roughly 5 percent in March 2020.
Monthly U.S. Imports of Categories Containing COVID-19-Related Products by Type, January 2019–August 2020
Notes: Census trade statistics, a w idely used source analyzing U.S. international trade, do not contain precise data on imports of COVID-19-related products. As a result, w e estimated the import value of all product categories and types using Harmonized Tariff Schedule of the United States (HTS) statistical reporting numbers and associated product groupings listed in COVID-19 Related Goods: U.S. Imports and Tariffs, Investigation No. 332-576, USITC Publication 5073 (Washington, D.C.: June 2020). USITC changed 12 of these product categories in its July 1, 2020, revision to the HTS. We identif ied these product categories and included them in the July and August 2020 data for our analysis. Some HTS categories represent more than one product, and some categories contain products that are not directly relevant to COVID-19 responses. Product types only refer to the subset of goods considered COVID-19 related in each HTS-10 statistical reporting number. Therefore, the values presented may overestimate the imports of products directly relevant to COVID-19 responses. Nevertheless, they are useful indicators f or tracking import trends of such products.
The decline in COVID-19-related imports was largely driven by a decrease in goods related to personal protective equipment (PPE). Since May 2020, imports of PPE declined for 3 consecutive months, and the imports in August were 26 percent lower than in May. Policies to encourage domestic production and restrict exports may help explain the decline of imports of COVID-19-related products since June.
EXIM has approved transactions under its COVID-19 economic support measures. As part of the government’s response to the COVID-19 pandemic, and to help American businesses facilitate international sales

Appendix I: Enclosures
Page 407 GAO-21-191
and compete in the global marketplace, EXIM has taken temporary economic support measures to provide relief to exporters and financial institutions, and, according to EXIM officials, has indefinitely restricted its export support for certain scarce medical supplies, such as PPE.
In March 2020, EXIM announced several new or expanded programs, effective through April 2021, to support U.S. exporters by addressing temporary liquidity problems caused by the pandemic. These programs include
· new short-term bridge financing for foreign customers of U.S. exporters,
· expanded pre-export financing to support progress (installment) payments on manufactured capital goods,
· expanded supply chain financing for suppliers, and · increased flexibility in EXIM’s working capital guarantees. In July 2020, EXIM approved two transactions using these programs to support the export of aircraft and aircraft engines. According to EXIM, the financing support provided under these transactions is necessary due to the economic conditions associated with the pandemic, including the lack of commercial financing capacity and risks associated with the aircraft manufacturing industry.
According to EXIM officials, as of August 2020, five other transactions under consideration would use these COVID-19 economic support programs. These transactions under consideration and those already approved total approximately $1.5 billion, and represented approximately 3 percent of EXIM’s current $45.6 billion portfolio, as of June 30, 2020. EXIM officials also stated that exporters, borrowers, and lenders have expressed interest in these programs, and they anticipate additional applications under the programs.
EXIM has also provided flexibilities for EXIM customers using certain loan guarantee and insurance programs, such as extended reporting and payment deadlines and insurance policy renewal processing, among others. EXIM officials said these flexibilities are intended to provide short-term relief during the crisis to EXIM borrowers whose current liquidity challenges are temporary and are not an indication of long-term issues. EXIM recently extended these flexibilities through April 2021.
Appendix I: Enclosures
Page 408 GAO-21-191
DFC to offer financing assistance to strengthen domestic industrial base in response to COVID-19. As part of U.S. efforts to strengthen industrial base capabilities in response to COVID-19, DFC stated that it plans to award loans to U.S. private sector projects that supply resources to respond to COVID-19 or strengthen relevant supply chains under the authority of the Defense Production Act (DPA). Executive Order 13922, signed May 14, 2020, delegated the authority to make these loans to the chief executive officer of DFC. According to DFC officials, DFC will use $100 million of the Department of Defense’s CARES Act funding to cover the program’s direct and indirect implementation costs, including loan subsidy costs and administrative costs. In its June 2020 Request for Proposals, DFC stated that it seeks to finance projects focused on producing or distributing PPE, medical testing supplies, vaccines, pharmaceuticals, ventilation equipment, or relevant materials and technologies. As of September 30, 2020, DFC had received 67 applications for DPA financing, but had not awarded any DPA loans.
Agency Comments
We provided DFC, EXIM, and the Office of Management and Budget with a draft of this enclosure. We incorporated technical comments, as appropriate.
GAO’s Methodology
To conduct this work, we reviewed the most recent trade statistics from the Census Bureau combined with U.S. International Trade Commission data on Harmonized Tariff Schedule codes associated with COVID-19 products, and reviewed agency announcements and guidance from EXIM and DFC. We found the data to be sufficiently reliable to describe trade in general and trade in COVID-19-related products.
Contact information: Kimberly Gianopoulos, (202) 512-8612, [email protected]
Payment Integrity
Delays in improper payment reporting may prevent timely identification and resolution of COVID-19 spending issues, including potential fraud.
Entities involved: Government-wide

Appendix I: Enclosures
Page 409 GAO-21-191
Matter for Congressional Consideration
To hold agencies accountable and increase transparency, Congress should consider, in any future legislation appropriating COVID-19 relief funds, designating all executive agency programs and activities making more than $100 million in payments from COVID-19 relief funds as “susceptible to significant improper payments” for purposes of 31 U.S.C. § 3352.
Recommendations for Executive Action
We are making the following two recommendations—one each to the Office of Management and Budget and the Small Business Administration.
The Director of the Office of Management and Budget should develop and issue guidance directing agencies to include COVID-19 relief funding with associated key risks, such as provisions contained in the CARES Act and other relief legislation that potentially increase the risk of improper payments or changes to existing program eligibility rules, as part of their improper payment estimation methodologies. This should especially be required for already existing federal programs that received COVID-19 relief funding.
The Administrator of the Small Business Administration should expeditiously estimate improper payments and report estimates and error rates for the Paycheck Protection Program due to concerns about the possibility that improper payments, including those resulting from fraudulent activity, could be widespread.
Key Considerations and Future GAO Work
We will monitor the status of our matter for congressional consideration and recommendations in future reports and continue our oversight of government-wide payment integrity efforts.
Background
Agency-reported improper payment estimates for fiscal year 2019 were about $175 billion, based on improper payment estimates reported by federal programs, an increase from the fiscal year 2018 total of $151
Appendix I: Enclosures
Page 410 GAO-21-191
billion.570 An improper payment is defined as any payment that should not have been made or that was made in an incorrect amount (including overpayments and underpayments) under statutory, contractual, administrative, or other legally applicable requirements, and it includes any payment that is the result of fraud.571 According to statute, when an agency cannot determine, due to insufficient documentation, whether a payment is proper, the payment shall be treated as an improper payment for the purpose of conducting a risk assessment to determine susceptibility to significant improper payments or producing an improper payment estimate. To help ensure that federal funds are appropriately safeguarded, executive branch agencies are required to take various steps regarding improper payments under the Payment Integrity Information Act of 2019 (PIIA) and as directed by Office of Management and Budget (OMB) guidance.572
Under OMB guidance, a risk assessment to determine susceptibility to significant improper payments should be completed after the first 12 months of program operations.573 In the fiscal year following the fiscal year in which the risk assessment was conducted, programs that are determined to be susceptible to the risk of significant improper payments
570 See 31 U.S.C. §§ 3351-3352. For purposes of this enclosure, we defined “programs” to include both programs and activities.
571 Improper payment is defined at 31 U.S.C. § 3351(4). While an improper payment may be the result of fraudulent activity, not all improper payments are the result of fraud. Fraud involves obtaining something of value through willful misrepresentation. Whether an act is in fact fraud is a determination to be made through the judicial or other adjudicative system.
572 Under PIIA, agencies are required to perform a risk assessment of all programs at least once every 3 fiscal years and identify those that are susceptible to “significant” improper payments. Improper payments and payments whose propriety cannot be determined by the executive agency due to lacking or insufficient documentation are considered “significant” if in the preceding fiscal year they may have exceeded either (1) 1.5 percent of program outlays and $10 million or (2) $100 million (regardless of the improper payment rate). PIIA, Pub. L. No. 116-117, 134 Stat. 113, 114 (Mar. 2, 2020), codified at 31 U.S.C. § 3352(a). PIIA repealed the prior improper payment statutes but instead enacted substantially similar provisions in a new subchapter of the U.S. Code. However, the core structure of executive branch agency assessment, estimation, analysis, and reporting of improper payments remains consistent with the prior statutory framework. See 31 U.S.C. §§ 3351-3352. See also Office of Management and Budget, Appendix C to OMB Circular A-123, Requirements for Payment Integrity Improvement, OMB Memorandum M-18-20 (Washington, D.C.: June 26, 2018); Office of Management and Budget, Financial Reporting Requirements, Circular No. A-136, (Washington, D.C.: Aug. 27, 2020).
573 OMB M-18-20.

Appendix I: Enclosures
Page 411 GAO-21-191
are to develop and report improper payment estimates, including root causes and corrective actions.
COVID-19 relief laws appropriated about $2.6 trillion to fund response and recovery efforts. Of these appropriations, over $1 trillion may be spent through newly established COVID-19 programs. Unless these funds are incorporated into the improper payment risk assessment and reporting processes for existing programs, new risk assessments will need to be performed to determine if they are susceptible to significant improper payments.
The extent and significance of improper payments associated with COVID-19 relief funds has not yet been determined. However, the impact of these improper payments, including those that are the result of fraud, could be substantial. Even if improper payments are limited to 1 percent of the COVID-19 relief funds appropriated to date, this would equate to $2.6 billion. We also have concerns about the possibility that improper payments could be widespread based on indications of fraud across federal programs. For example:
· Eight individuals pleaded guilty to federal charges of defrauding COVID-19 relief programs—including the Small Business Administration’s (SBA) Paycheck Protection Program and Economic Injury Disaster Loan (EIDL) program and the Department of Labor’s (DOL) unemployment insurance program—from March through September 2020. In one case, an individual pleaded guilty to conspiring to defraud the U.S. by applying for 18 separate Paycheck Protection Program loans for four shell companies, falsely claiming, among other things, that the businesses had employees and needed the loans to pay employees’ salaries, thereby fraudulently inducing banks to distribute approximately $1.4 million in loans.
· There are 130 individuals facing federal charges related to attempting to defraud these programs.574
574 A charge is merely an allegation, and all defendants are presumed innocent until proven guilty beyond a reasonable doubt in a court of law.

Appendix I: Enclosures
Page 412 GAO-21-191
· Offices of inspector general and other law enforcement agencies have initiated numerous fraud-related investigations.575
These federal charges and investigations may eventually result in further fraud convictions. One of the many challenges, however, is that because of fraud’s deceptive nature, programs can incur financial losses related to fraud that are never identified, and such losses are difficult to reliably estimate.
Overview of Key Issues
As the four COVID-19 relief laws appropriated about $2.6 trillion to fund COVID-19 response and recovery efforts, reporting of improper payment estimates, including losses that are the result of fraud, for such programs is critical to agency accountability and transparency over whether appropriated funds were spent for their intended purposes. As part of government-wide payment integrity efforts, agencies must (1) identify risk-susceptible programs, (2) develop reliable estimates of improper payments and implement corrective action plans to reduce them, and (3) report improper payment information.
Identifying risk-susceptible programs. Properly executed improper payment risk assessments are the cornerstone of the government-wide effort to identify and reduce improper payments. For new programs, under OMB guidance, a risk assessment to determine susceptibility to significant improper payments should be completed after the first 12 months of program operations, and a determination of susceptibility triggers reporting requirements in the following fiscal year.576 However, the supplemental appropriations acts that provided for disaster relief related to the 2017 hurricanes and California wildfires required agencies to deem all programs receiving these relief funds that expended more than $10 million in any one fiscal year as “susceptible to significant
575 In addition, federal hotlines have received numerous complaints from the public alleging potential fraud involving COVID-19 relief funds. For example, the Inspector General for SBA testified on October 1, 2020, that the hotline operated by his office has received tens of thousands of allegations of wrongdoing. Similarly, from March 13, 2020, through September 30, 2020, our hotline—known as FraudNet—received over an estimated 1,000 complaints related to the CARES Act, many of which involve SBA’s Paycheck Protection Program and EIDL program.
576 OMB M-18-20.

Appendix I: Enclosures
Page 413 GAO-21-191
improper payments.”577 Agencies were therefore required to report improper payment estimates for such programs without the need to conduct a risk assessment.
The COVID-19 relief laws did not contain a similar provision. OMB staff informed us that OMB will not direct agencies to expedite the risk assessments of new COVID-19 programs for susceptibility to improper payments.578 OMB staff stated that this decision was due, in part, to their assessment that it is unclear that (1) the benefit of increased reporting would outweigh the added burden to do so and (2) the current controls and guidance in place are insufficient. While we recognize the importance of reducing agency burden, we believe that reporting improper payment estimates quickly for risk-susceptible programs helps hold agencies accountable and provides additional transparency for Congress and others in their oversight of government-wide improper payments. In addition, estimating improper payments and identifying root causes would help ensure that agencies develop and implement corrective actions to help reduce them.
Additionally, OMB staff stated that the COVID-19 relief laws appropriated additional funding to the inspectors general to assist in their efforts to prevent and detect fraud, waste, abuse, and mismanagement. While we acknowledge that independent oversight by inspectors general is critical to enhancing government accountability, agency management ultimately
577 Supplemental Appropriations for Disaster Relief Requirements Act, 2017, Pub. L. No. 115-56, div. B, 131 Stat. 1129, 1136 (2017), Additional Supplemental Appropriations for Disaster Relief Requirements Act, 2017, Pub. L. No. 115-72, div. A, 131 Stat. 1224, 1224-1229 (2017), and Further Additional Supplemental Appropriations for Disaster Relief Requirements Act, 2018, Pub. L. No. 115-123, div. B, subdiv. 1, 132 Stat. 64, 65-110 (2018), provided certain federal agencies with at least $120 billion in supplemental appropriations related to the 2017 hurricanes and California wildfires and stated that all programs expending more than $10 million in any one fiscal year were deemed to be “susceptible to significant improper payments.”
578 OMB M-18-20 authorizes each federal agency to determine the definition of “program” that most clearly identifies and reports improper payments for the agency. However, OMB M-18-20 also states that agencies should not put programs into groupings that may mask significant improper payment rates by the large size or scope of a grouping. Depending on how agencies classify or group the newly established COVID-19 programs, agencies may consider them to be part of their existing programs. Furthermore, M-18-20 provides that, “if a program that is on a three year risk assessment cycle experiences a significant change in legislation and/or a significant increase in its funding level, agencies may need to reassess the program’s risk susceptibility during the next annual cycl e, even if it is less than three years from the last risk assessment.” In such instances, agencies may choose not to assess the newly established COVID-19 programs after the first 12 months of program operations and instead wait until the next 3 -year risk assessment cycle.

Appendix I: Enclosures
Page 414 GAO-21-191
retains responsibility for enhancing payment integrity through efforts to prevent and reduce improper payments, including those resulting from fraudulent activity.
According to OMB staff, current statute and OMB guidance requires agencies to identify and recover overpayments for all programs regardless of whether a program formally reports an improper payment estimate or performs an improper payment risk assessment. Although we acknowledge that agencies may take actions to identify and recover overpayments, we believe that quickly identifying programs that are susceptible to significant improper payments is critical. Such identification is an important first step to estimating improper payments, identifying root causes, and developing corrective actions to address improper payments.
Congress appropriated over $1 trillion for newly established COVID-19 programs. Given the time frames of the payment integrity process, these appropriations may be spent before the programs are assessed for susceptibility to significant improper payments. For example, SBA’s Paycheck Protection Program was appropriated about $670 billion. According to SBA officials, SBA is designing a plan for estimating Paycheck Protection Program improper payments that will go through the standard OMB review channels. As such, SBA stated that it expects to include the Paycheck Protection Program in its fiscal year 2021 reporting of improper payments. However, SBA officials did not provide us with a time frame for when the agency expects to finalize the plan. Because SBA has not yet finalized the plan, as stated below, we are retaining our recommendation.
In addition, the COVID-19 relief laws established new programs within previously existing programs. For example, the COVID-19 relief laws created three new, federally funded unemployment insurance programs within DOL: the Pandemic Unemployment Assistance, the Federal Pandemic Unemployment Compensation, and the Pandemic Emergency Unemployment Compensation programs. These new programs were appropriated about $144 billion by the COVID-19 relief laws.
DOL’s Office of Inspector General (OIG) previously reported that by not including CARES Act programs in the unemployment insurance improper payment estimates, DOL will materially underestimate unemployment

Appendix I: Enclosures
Page 415 GAO-21-191
insurance improper payments for fiscal years 2020 and 2021.579 DOL OIG recommended that DOL include CARES Act unemployment insurance transactions in its current sampling methodology or develop an alternative methodology to reliably estimate improper payments for those programs. DOL did not agree with the recommendation.
According to DOL officials, DOL plans to follow OMB guidance for identifying risk-susceptible programs and developing improper payment estimates for the newly established programs. DOL officials stated that DOL will conduct a risk assessment after the first year of each program’s operations and, if the programs remain in place, will include estimates, if required, in its reporting for fiscal year 2022. According to the agency, DOL has begun developing a statistical methodology for estimating improper payments for the CARES Act programs, and stated that this is a complex endeavor that will take at least 12–16 months. DOL officials stated that this process includes designing statistical sampling and case investigation processes tailored to the specific eligibility requirements associated with the CARES Act programs, and developing and implementing information technology systems at both the state and federal levels to support reporting and data analysis.
Federal internal control standards state that management should use quality information to achieve the entity’s objectives. As part of these standards, management obtains data on a timely basis so that they can be used for effective monitoring. Without a statutory requirement designating all executive agency programs making more than $100 million in payments from COVID-19 relief funds as “susceptible to significant improper payments,” substantial time may elapse before agencies start reporting improper payments for these new programs. It is especially important for agencies with large appropriated amounts to expeditiously estimate their improper payments, identify root causes, and develop corrective actions when there are concerns about the possibility that improper payments, including those resulting from fraudulent activity, could be widespread. Given the rapid timeline of COVID-19 program-related spending, such time lags in assessing risk and developing corrective actions may result in improper payment issues within COVID-19 programs, including those resulting from fraudulent activities, not being identified or addressed until after most or even all funds are disbursed.
579 Department of Labor, Office of Inspector General, COVID-19: More Can Be Done to Mitigate Risk to Unemployment Compensation Under the CARES Act, 19-20-008-03-315 (Washington, D.C.: Aug. 7, 2020).

Appendix I: Enclosures
Page 416 GAO-21-191
Developing reliable estimates of improper payments and implementing corrective action plans to reduce them. Given that the COVID-19 relief laws appropriated about $2.6 trillion to fund response and recovery efforts for COVID-19, developing reliable improper payment estimates is essential for understanding and addressing financial vulnerabilities. Additionally, developing corrective action plans that respond to the root causes of payment errors, which can include failure to verify eligibility and identify fraud, is a key component in government-wide efforts to reduce improper payments. These steps are particularly critical for newly established programs receiving significant COVID-19 relief funds. These steps are also important for existing programs receiving significant COVID-19 relief funding that have previously reported high estimated improper payment rates. For example:
· The Department of Health and Human Services’ Medicaid program (which is expected to increase spending by about $50 billion over fiscal years 2020 through 2021 because of COVID-19) reported fiscal year 2019 estimated improper payments of $57.4 billion, representing a 14.9 percent estimated improper payment rate.
· DOL’s unemployment insurance program (which was appropriated about $394.3 billion for COVID-19 relief) reported fiscal year 2019 estimated improper payments of $2.9 billion, representing a 10.6 percent estimated improper payment rate.
· SBA’s Disaster Loans program (which was appropriated about $20 billion for the EIDL program) reported fiscal year 2019 estimated improper payments of $103 million, representing a 6.3 percent estimated improper payment rate.
Reliable improper payment estimates and effective corrective action plans are key in helping to prevent and reduce improper payments of COVID-19 relief funds. PIIA requires OMB to issue guidance for agencies to follow in developing their improper payment estimates. OMB guidance for developing improper payment estimates focuses on the statistical nature of the estimates and provides agencies with flexibility in developing their estimates.580 According to OMB staff, in working with the chief financial officer community, OMB has identified multiple risk factors caused by COVID-19 that are likely to alter payment integrity risks, such as the creation of new programs, new legal provisions, changes to existing eligibility rules, different payment processes, increased funding, and
580 OMB M-18-20.

Appendix I: Enclosures
Page 417 GAO-21-191
limited time to spend funding. OMB issued a memorandum providing agencies the option to incorporate new COVID-19 relief funding into their normal sampling processes; however, it does not specifically direct agencies to do so.581
We reported in May 2018 that agencies use a variety of processes to develop their improper payment estimates and that certain differences in these processes may affect the quality of the resulting estimates and consequently these agencies’ efforts to reduce improper payments. Without an OMB directive for agencies to include COVID-19 relief funding and associated key risks as part of their improper payment estimation methodologies, there is an increased risk that agencies’ processes may not result in reliable estimates, calling into question their usefulness for developing effective corrective actions.
Reporting improper payment information. According to OMB guidance, for newly established programs, agencies are given until the fiscal year following the risk assessment to develop and report improper payment information, including estimates, root causes, and corrective actions.582
As a result, in some instances, improper payment estimates associated with new COVID-19 programs established in March 2020 may not be reported until November 2022, as shown in the figure below.
581 Office of Management and Budget, Risk-Based Financial Audits and Reporting Activities in Response to COVID-19 (Washington, D.C.: June 17, 2020).
582 According to OMB staff, giving agencies until the following year is necessary due to multiple factors, such as the time needed to secure a contract for a statistician and develop an appropriate sampling and estimation methodology, and the need for programs to report on 12 full months of data in their annual reporting.

Appendix I: Enclosures
Page 418 GAO-21-191
Example Timeline for Newly Established COVID-19 Programs’ Reporting of Improper Payment Estimates
Note: Annual agency reporting is typically due in the November follow ing the end of each f iscal year. According to Office of Management and Budget (OMB) staff, for f iscal year 2020 reporting, OMB provided an extension until December 2020 given the demands placed on agencies in connection w ith COVID-19. aDepending on agencies’ improper payment estimation methodologies, spending for this time period may or may not be included in a future improper payment estimate.
Agencies may never report an improper payment estimate for certain COVID-19 programs—such as the Department of the Treasury’s economic impact payments—if the programs expend all of their funds within a 12-month period. In addition, agencies may never report improper payment estimates for COVID-19 programs if their future risk assessments do not determine the program to be susceptible to significant improper payments. According to OMB staff, requiring improper payment reporting for COVID-19 programs that do not extend beyond a single year would not be useful, as once a program has ended, developing an estimate, identifying root causes, and developing corrective actions cannot improve the payment integrity of the program.
OMB staff further stated that OMB will continue to assess the analyses of oversight bodies such as GAO and the offices of inspector general to determine whether additional government-wide guidance or reporting is needed for all programs, including those that expend all of their funding in less than 12 months.
We believe that requiring agencies to report improper payment estimates for COVID-19 programs and implement corrective actions could improve transparency at individual agencies and government-wide. This information would also be a critical component of the government-wide

Appendix I: Enclosures
Page 419 GAO-21-191
improper payment estimate OMB is required to report each fiscal year under PIIA.583
According to OMB guidance, to the extent possible, the data that agencies currently reporting improper payment estimates use for estimating improper payments in a given program should coincide with the fiscal year being reported. However, agencies may use a different 12-month reporting period with approval from OMB.584 For example, for most programs that reported estimates for fiscal year 2019, agencies sampled from the population of payments during fiscal year 2018 to estimate the reported fiscal year 2019 improper payment rate and amounts. As a result, reporting of improper payment estimates related to expenditures for programs that received COVID-19 relief funds will likely not take place until fiscal year 2021 reporting or later.
Changes to OMB payment integrity reporting directives. OMB Circular A-136, Financial Reporting Requirements, provides guidance for agencies on preparing their agency financial reports or performance and accountability reports, including the reporting of improper payment information.585 In its most recently issued Circular A-136 guidance for fiscal year 2020 reporting, instead of directing agencies to include improper payment information in their agency financial reports or performance and accountability reports as done in prior years, OMB directed agencies to provide such information to OMB to be included on its www.paymentaccuracy.gov website.586 Agencies are then directed to provide a link to this website in their agency financial reports or performance and accountability reports. According to OMB officials, centralized reporting of agencies’ improper payment information on www.paymentaccuracy.gov facilitates efficient analysis and increased transparency of government-wide improper payment information.
583 PIIA, Pub. L. No. 116-117, § 2(a), 134 Stat. 113, 114 (Mar. 2, 2020), codified at 31 U.S.C. § 3352(f).
584 According to OMB M-18-20, agencies do not need to resubmit a request for approval every year, only when they are planning to change their reporting time period.
585 OMB Circular No. A-136.
586 An official website of the U.S. government managed by OMB, www.paymentaccuracy.gov contains information about current and historical rates and amounts of estimated improper payments, why improper payments occur, and what agencies are doing to reduce and recover improper paymen ts.

Appendix I: Enclosures
Page 420 GAO-21-191
Agency Comments
We provided OMB, SBA, Treasury, and DOL with a draft of this enclosure for comment. We received written comments from SBA, which are reproduced in appendix VIII and summarized below. OMB provided comments in an email, which are summarized below. SBA, Treasury, and DOL also provided technical comments, which we incorporated as appropriate.
In their comments, OMB staff neither agreed nor disagreed with our recommendation. OMB stated that additional clarity could be aided by indicating the types of information that define the scope of associated key risks within the recommendation. We clarified this portion of our recommendation by including examples of risks identified by OMB that are likely to alter payment integrity risks.
In its written comments, SBA neither agreed nor disagreed with our recommendation. SBA stated that it is planning to conduct improper payment testing for the Paycheck Protection Program. However, SBA has not finalized the plan for estimating improper payments for its Paycheck Protection Program. Therefore, we believe that our recommendation is important to help expedite the identification and reduction of improper payments.
GAO’s Methodology
To conduct this work, we reviewed relevant improper payment legislation and guidance, COVID-19 relief laws, and COVID-19 appropriation amounts for new and established programs.
Contact information: Beryl H. Davis, (202) 512-2623, [email protected]
Related GAO Products
Improper Payments: Actions and Guidance Could Help Address Issues and Inconsistencies in Estimation Processes. GAO-18-377. Washington, D.C.: May 31, 2018.
Standards for Internal Control in the Federal Government. GAO-14-704G. Washington, D.C.: September 10, 2014.

Appendix II: List of Ongoing GAO Work Related to COVID-19, as of November 10, 2020
Page 421 GAO-21-191
Appendix II: List of Ongoing GAO Work Related to COVID19, as of November 10, 2020 Repatriation Program COVID-19 Response
Oversight of Unemployment Insurance during COVID-19
Higher Education Aid and Student Loan Flexibilities in Response to COVID-19
Early Care and Education and the Coronavirus Pandemic Response
Agency Information Technology Preparedness in Response to Coronavirus Pandemic
Tracking Funds and Associated Activities Related to Federal Response to COVID-19
Diagnostic Testing
Strategic National Stockpile
Worker Safety in the Pandemic
Distance Learning Challenges for English Learners and Students with Disabilities
Business/Employer Tax Provisions
Nutrition Assistance
Agencies’ Telework Readiness and Use of Telework for Employees
Internal Revenue Service Administration of Economic Impact Payments

Appendix II: List of Ongoing GAO Work Related to COVID-19, as of November 10, 2020
Page 422 GAO-21-191
Housing Finance System in the Pandemic
Military Health System COVID Response
COVID-19-Related Grant Flexibilities
Bureau of Prisons’ Emergency Preparedness & Response
Transportation Security Administration (TSA) Measures to Prevent COVID-19 at Checkpoints
Nursing Home Infection Prevention and Control
Biodefense Preparedness and Response for COVID-19
Federal Agencies’ Reentry
Agencies’ Human Capital Flexibilities in Response to Coronavirus Pandemic
Immigration Detention Facilities and Operations
Federal Emergency Management Agency Response to COVID-19
Department of Veterans Affairs’ (VA) COVID-19 Procurement Response
Election Funding and Administration during the Pandemic
Defense Production Act
Effects of COVID-19 on Dedicated Fees
School Meals during the Pandemic
VA’s Civilian Public Health Response to the COVID-19 Pandemic
CARES Act Housing Protections
Bureau of Indian Education Distance Education
Child Welfare Services

Appendix II: List of Ongoing GAO Work Related to COVID-19, as of November 10, 2020
Page 423 GAO-21-191
Department of the Interior and Department of the Treasury’s (Treasury) Actions for Tribal Governments in Response to the Pandemic
Department of State Repatriation Efforts
Small Business Administration’s Implementation of the Paycheck Protection Program
Indian Health Service Response to COVID-19
Vaccine Development
Nurse Loan Repayment Program
Coronavirus Economic Stabilization Act Loans and Investments Programs
Coast Guard COVID-19 Response Efforts
Human Pandemic Preparedness Plan for Food Safety Inspections
CARES Act Assistance to Farmers
COVID-19 Impacts on Customs and Border Patrol Operations
Medicaid Waivers and Flexibilities for COVID-19
Immigration Courts Response
Department of Defense Depot COVID-19 Impacts
Economic Injury Disaster Loans and Advances
Federal Air Marshal Service Response
Treasury Debt Management Response
Services for Older Adults
Characteristics of Paycheck Protection Program Loans
Aviation Operations in a Pandemic Environment
International Humanitarian Assistance
Appendix II: List of Ongoing GAO Work Related to COVID-19, as of November 10, 2020
Page 424 GAO-21-191
United States Postal Service
Behavioral Health Impacts
Unemployment Support for Contingent Workers
CARES Act Aviation Loans
VA’s Preparedness for, Response to, and Recovery from COVID-19
Operation Warp Speed
Department of Health and Human Services Medicare Waivers for COVID-19 (including Telehealth)
Vaccine Distribution and Communication
VA Nursing Homes
Community Behavioral Health Demonstrations
VA COVID-19 Supplemental Funding
VA Access to Community Care
State and Local Fiscal Conditions & Federal Implications
Bureau of Prisons’ Response to COVID-19
VA COVID-19 Financial Controls
Pandemic Learning Loss
Strategic National Stockpile Internal Controls
COVID-19 Contracting Flexibilities
Agencies’ COVID-19 Contract Planning and Review of Contractor Qualifications
Department of State & U.S. Agency for International Development Continuity of Operations

Appendix II: List of Ongoing GAO Work Related to COVID-19, as of November 10, 2020
Page 425 GAO-21-191
Farmer Food Purchases and Distribution
Department of Housing and Urban Development CARES Act Oversight
Internal Controls over Higher Education Emergency Relief Fund
Supply Chain and the Defense Production Act
Effect of Tax Policies on Women and Minority Led Households
Contractor Paid Leave Reimbursement Approaches
Paid Leave Enforcement
Therapeutics and Vaccines
Aviation Disease Research and Development
K-12 Digital Divide
Tax Policy Effects on Businesses by Gender and Race
TSA Process for Restricting International Air Travel
Defense-wide Working Capital Fund COVID-19 Effects
Contact Tracing App Technology Assessment
Scientific Integrity at CDC and FDA
Treasury Coronavirus Relief Fund

Appendix III: Status of Our Recommendations
Page 426 GAO-21-191
Appendix III: Status of Our Recommendations In our June 2020 CARES Act report, we made three recommendations; in our September 2020 CARES Act report, we made 16 recommendations; and in November 2020 we issued a report on COVID-19 vaccines and therapeutics and made one recommendation. To date, the status of these recommendations is as follows:
Status of recommendations made in our June 2020 CARES Act report
Recommendation 1. The Secretary of Labor should, in consultation with the Small Business Administration (SBA) and the Department of the Treasury (Treasury), immediately provide information to state unemployment agencies that specifically addresses SBA’s Paycheck Protection Program (PPP) loans, and the risk of improper payments associated with these loans.
Status: Closed
Comment: The Department of Labor (DOL) neither agreed nor disagreed with our recommendation. Following our recommendation, DOL issued guidance on August 12, 2020, that clarified that individuals working full-time and being paid through PPP are not eligible for unemployment insurance (UI), and that individuals working part-time and being paid through PPP would be subject to certain state policies, including state policies on partial unemployment to determine their eligibility for UI benefits. Further, the guidance clarified that individuals being paid through PPP but not performing any services would similarly be subject to certain provisions of state law, and noted that an individual receiving full compensation would be ineligible for UI.
Recommendation 2. The Commissioner of Internal Revenue should consider costeffective options for notifying ineligible recipients on how to return payments.
Status: Open

Appendix III: Status of Our Recommendations
Page 427 GAO-21-191
Comment: The Internal Revenue Service (IRS) agreed with our recommendation. Treasury and IRS have taken steps to implement this recommendation and are considering further actions. Currently, IRS has instructions on its website requesting that individuals voluntarily return by mail the appropriate economic impact payment (EIP) amount sent to a decedent, for both electronic and paper check payments. Also, the envelopes in which paper checks were sent have a checkbox to indicate if the recipient is deceased, and individuals could mail envelopes with that checkbox indicated to the Bureau of the Fiscal Service. Finally, Treasury has held and canceled EIPs to decedents in addition to the EIPs that have been returned.
Of the $1.2 billion in EIPs sent to decedents, as of September 30, 2020, around 57 percent (just over $700 million) had been recovered. There are likely more returned EIPs in unopened mail that IRS has yet to process. Treasury and IRS continue to review and monitor data on the number of EIPs that were sent to decedents and have since been recovered to determine whether further action may be warranted.
Treasury was considering sending letters to request the return of outstanding checks and the repayment of amounts already paid by direct deposit or by checks that have been cashed. However, according to Treasury, it has not moved forward with this effort because Congress is currently considering legislation that would clarify or change the eligibility requirements of the EIPs, including payments to deceased individuals.
Our work on EIPs is ongoing. We will continue to examine Treasury and IRS efforts to recoup payments sent to ineligible individuals.
Recommendation 3. The Administrator of SBA should develop and implement plans to identify and respond to risks in PPP to ensure program integrity, achieve program effectiveness, and address potential fraud, including in loans of $2 million or less.
Status: Open
Comment: SBA neither agreed nor disagreed with our recommendation. In response to our recommendation, SBA has developed oversight plans but has not provided requested documentation yet detailing its plans and how it will implement them. As we reported in September 2020, SBA has said that it plans to review all PPP loans of $2 million or more and further stated that it may review any PPP loan it deems appropriate, including loans of less than $2 million. SBA also told us at that time that a
Appendix III: Status of Our Recommendations
Page 428 GAO-21-191
contractor would use an automated review tool to flag potentially questionable loans and that contractor and SBA staff would conduct a manual review of loans flagged by the tool. As of October 2020, SBA officials told us that they had developed the review process and tested it on some loans but were refining the process and finalizing documents that summarize it. According to SBA and Treasury officials, SBA’s loan review process will test loans for compliance with program requirements and evaluate the accuracy of PPP borrowers’ self-certifications.
Status of recommendations made in our September 2020 CARES Act report
Recommendation 1. The Secretary of Health and Human Services in coordination with the Administrator of the Federal Emergency Management Agency—who head agencies leading the COVID-19 response through the Unified Coordination Group—should immediately document roles and responsibilities for supply chain management functions transitioning to the Department of Health and Human Services (HHS), including continued support from other federal partners, to ensure sufficient resources exist to sustain and make the necessary progress in stabilizing the supply chain, and address emergent supply issues for the duration of the COVID19 pandemic.
Status: Open
Comment: HHS disagreed with our recommendation, noting, among other things, the work that the department had done to manage the medical supply chain and increase supply availability.
Recommendation 2. The Secretary of Health and Human Services in coordination with the Administrator of the Federal Emergency Management Agency—who head agencies leading the COVID19 response through the Unified Coordination Group—should further develop and communicate to stakeholders plans outlining specific actions the federal government will take to help mitigate remaining medical supply gaps necessary to respond to the remainder of the pandemic, including through the use of Defense Production Act authorities.
Status: Open

Appendix III: Status of Our Recommendations
Page 429 GAO-21-191
Comment: HHS disagreed with our recommendation, noting, among other things, the work that the department had done to manage the medical supply chain and increase supply availability.
Recommendation 3. The Secretary of Health and Human Services—who heads one of the agencies leading the COVID-19 response through the Unified Coordination Group—consistent with their roles and responsibilities, should work with relevant federal, state, territorial, and tribal stakeholders to devise interim solutions, such as systems and guidance and dissemination of best practices, to help states enhance their ability to track the status of supply requests and plan for supply needs for the remainder of the COVID-19 pandemic response.
Status: Open
Comment: HHS disagreed with our recommendation, noting, among other things, the work that the department had done to manage the medical supply chain and increase supply availability.
Recommendation 4. The Administrator of the Federal Emergency Management Agency—who heads one of the agencies leading the COVID-19 response through the Unified Coordination Group—consistent with its roles and responsibilities, should work with relevant federal, state, territorial, and tribal stakeholders to devise interim solutions, such as systems and guidance and dissemination of best practices, to help states enhance their ability to track the status of supply requests and plan for supply needs for the remainder of the COVID19 pandemic response.
Status: Open
Comment: The Department of Homeland Security (DHS) disagreed with our recommendation, noting, among other things, the work that they had done to manage the medical supply chain and increase supply availability.
Recommendation 5. The Secretary of Health and Human Services, with support from the Secretary of Defense, should establish a time frame for documenting and sharing a national plan for distributing and administering a COVID19 vaccine and, in developing such a plan, ensure that it is consistent with best practices for project planning and scheduling and outlines an approach for how efforts will be coordinated across federal agencies and nonfederal entities.

Appendix III: Status of Our Recommendations
Page 430 GAO-21-191
Status: Open
Comment: HHS neither agreed nor disagreed with our recommendation.
Recommendation 6. As the Centers for Disease Control and Prevention (CDC) implements its COVID-19 Response Health Equity Strategy, the Director of CDC should determine whether having the authority to require states and jurisdictions to report race and ethnicity information for COVID-19 cases, hospitalizations, and deaths is necessary for ensuring more complete data and, if so, seek such authority from Congress.
Status: Open
Comment: CDC agreed with our recommendation. In response to our recommendation, CDC stated that the agency is committed to having discussions with stakeholders to assess whether having the authority to require states and jurisdictions to report race and ethnicity information for COVID-19 cases would result in improved reporting. We will continue to conduct work examining HHS, CDC, and other component agencies’ ongoing work regarding indicators of COVID-19 and disparities that exist for various populations.
Recommendation 7. As CDC implements its COVID-19 Response Health Equity Strategy, the Director of CDC should involve key stakeholders to help ensure the complete and consistent collection of demographic data.
Status: Open
Comment: CDC agreed with our recommendation. In response to our recommendation, CDC stated that the agency is committed to having discussions with stakeholders to assess whether having the authority to require states and jurisdictions to report race and ethnicity information for COVID-19 cases would result in improved reporting. We will continue to conduct work examining HHS, CDC, and other component agencies’ ongoing work regarding indicators of COVID-19 and disparities that exist for various populations.
Recommendation 8. As CDC implements its COVID-19 Response Health Equity Strategy, the Director of the Centers for Disease Control and Prevention should take steps to help ensure CDC’s ability to comprehensively assess the long-term health outcomes of persons with COVID-19, including by race and ethnicity.

Appendix III: Status of Our Recommendations
Page 431 GAO-21-191
Status: Open
Comment: CDC agreed with our recommendation. In response to our recommendation, CDC noted that the agency is convening a team to develop a plan to monitor the long-term health outcomes of persons with COVID-19 by identifying health care surveillance systems that can electronically report health conditions to state and local health departments. We will continue to conduct work examining HHS, CDC, and other component agencies’ ongoing work regarding indicators of COVID-19 and disparities that exist for various populations.
Recommendation 9. The Secretary of the Treasury, in coordination with the Commissioner of Internal Revenue, should update and refine the estimate of eligible recipients who have yet to file for an EIP to help target outreach and communications efforts.
Status: Open
Comment: Treasury neither agreed nor disagreed with our recommendation. In response to our recommendation, Treasury and IRS took actions that are consistent with our recommendation, such as using tax return information to identify and notify nearly 9 million individuals that they may be eligible for an EIP. However, Treasury and IRS did not update estimates of those who could be eligible, but have yet to file. Without an updated estimate, Treasury, IRS, other federal agencies, and IRS’s outreach partners are limited in their ability to appropriately scale and target outreach and communication efforts to individuals who may be eligible for a payment.
Our work on EIPs is ongoing. We will continue to examine Treasury and IRS efforts to identify and notify individuals about their eligibility for an EIP and we will review how many taxpayers claim an EIP as part of their 2020 tax filing.
Recommendation 10. The Secretary of the Treasury, in coordination with the Commissioner of Internal Revenue, should make estimates of eligible recipients who have yet to file for an EIP, and other relevant information, available to outreach partners to raise awareness about how and when to file for EIPs.
Status: Open

Appendix III: Status of Our Recommendations
Page 432 GAO-21-191
Comment: Treasury neither agreed nor disagreed with our recommendation. Treasury and IRS took actions that are consistent with our recommendation, such as using tax return information to identify and notify nearly 9 million individuals that they may be eligible for an EIP. Without an updated estimate, Treasury, IRS, other federal agencies, and IRS’s outreach partners are limited in their ability to appropriately scale and target outreach and communication efforts to individuals who may be eligible for an EIP.
In November, the IRS’s Non-Filers Tool closed, which had allowed individuals who do not normally file a tax return to claim an EIP. In September, Treasury and IRS sent nearly 9 million notices to nonfilers to raise awareness about EIPs. However, Treasury and IRS are not monitoring the effectiveness of the notices. If they knew how many nonfilers who had received notices ultimately received an EIP, they could then determine whether additional or targeted outreach is needed for the 2021 filing season.
Our work on EIPs is ongoing. We will continue to examine Treasury and IRS efforts to identify and notify individuals about their eligibility for an EIP, and we will review how many taxpayers claim an EIP as part of their 2020 tax filing.
Recommendation 11. The Director of the Office of Management and Budget, in consultation with Treasury, should issue the addendum to the 2020 Compliance Supplement as soon as possible to provide the necessary audit guidance.
Status: Open
Comment: The Office of Management and Budget neither agreed nor disagreed with the recommendation. The Office of Management and Budget indicated that it planned to issue the compliance supplement addendum in mid-November. We will continue to monitor the issuance of the addendum.
Recommendation 12. The Director of CDC should ensure that, as it makes updates to its federal guidance related to reassessing schools’ operating status, the guidance is cogent, clear, and internally consistent.
Status: Open

Appendix III: Status of Our Recommendations
Page 433 GAO-21-191
Comment: CDC agreed with our recommendation, noting that it strives to ensure that all content is consistent and current and that it is working to update its reopening guidance. However, this recommendation remains open as of November 12, as CDC has made progress but the guidance remains inconsistent and unclear in places. We will continue to review guidance from CDC.
Recommendation 13. The Secretary of Homeland Security, in coordination with the Secretary of Defense, should (1) revise the criteria in the 2019 National Interest Action code memorandum of agreement to clearly identify steps they will take to obtain input from key federal agencies prior to extending or closing a National Interest Action code, (2) establish timelines for evaluating the need to extend a National Interest Action code, and (3) define what constitutes a consistent decrease in contract actions and routine contract activity to ensure the criteria for extending or closing the National Interest Action code reflect governmentwide needs for tracking contract actions in longer term emergencies, such as a pandemic.
Status: Open
Comment: DHS disagreed with our recommendation. DHS officials said they plan to review the 2019 National Interest Action code memorandum of agreement by the end of calendar year 2020. At that time, officials stated they intend to update the agreement to include additional details on practices for communicating with other agencies, and will consider whether additional changes should be incorporated into the agreement.
Recommendation 14. The Secretary of Defense, in coordination with the Secretary of Homeland Security, should (1) revise the criteria in the 2019 National Interest Action code memorandum of agreement to clearly identify steps they will take to obtain input from key federal agencies prior to extending or closing a National Interest Action code, (2) establish timelines for evaluating the need to extend a National Interest Action code, and (3) define what constitutes a consistent decrease in contract actions and routine contract activity to ensure the criteria for extending or closing the National Interest Action code reflect governmentwide needs for tracking contract actions in longer term emergencies, such as a pandemic.
Status: Open

Appendix III: Status of Our Recommendations
Page 434 GAO-21-191
Comment: The Department of Defense (DOD) disagreed with our recommendation. DOD officials said they plan to review the 2019 National Interest Action code memorandum of agreement by the end of calendar year 2020. The officials stated that at that time they will update the agreement to include additional details on practices for communicating with other agencies, and will consider whether additional changes should be incorporated into the agreement.
Recommendation 15. The Secretary of Health and Human Services, in consultation with the Centers for Medicare & Medicaid Services (CMS) and CDC, should develop a strategy to capture more complete data on confirmed COVID-19 cases and deaths in nursing homes retroactively back to January 1, 2020, and to clarify the extent to which nursing homes have reported data before May 8, 2020. To the extent feasible, this strategy to capture more complete data should incorporate information nursing homes previously reported to CDC or to state or local public health offices.
Status: Open
Comment: HHS partially agreed with our recommendation. HHS continues to consider how to implement our recommendation.
Recommendation 16. Based on the imminent cybersecurity threats, the Secretary of Health and Human Services should expedite implementation of our prior recommendations regarding cybersecurity weaknesses at its component agencies.
Status: Open
Comment: HHS agreed with our recommendation and is considering how to implement it. Although HHS has not taken action on this recommendation at the departmentlevel, the relevant component agencies—the Food and Drug Administration (FDA), CMS, and CDC—have addressed additional cybersecurity weaknesses since we reported in September 2020. Specifically, FDA, CMS, and CDC implemented an additional 54 of our cybersecurity recommendations, bringing the total number of implemented recommendations to 404 of the total 434 we made to these agencies. This reflects a 12percent increase in corrective actions taken to bolster cybersecurity at the component agencies.
Appendix III: Status of Our Recommendations
Page 435 GAO-21-191
Status of recommendation made in our November 2020 report on vaccines and therapeutics
Recommendation 1. The Secretary of Health and Human Services should direct the FDA Commissioner to identify ways to uniformly disclose to the public the information from FDA’s scientific review of safety and effectiveness data—similar to the public disclosure of the summary safety and effectiveness data supporting the approval of new drugs and biologics—when issuing EUAs for therapeutics and vaccines, and, if necessary, seek the authority to publicly disclose such information.
Status: Open
Comment: We plan to provide an update on the status of this recommendation in our January 2021 CARES Act report.

Appendix IV: Comments from the Department of Health and Human Services
Page 436 GAO-21-191
Appendix IV: Comments from the Department of Health and Human Services

Appendix IV: Comments from the Department of Health and Human Services
Page 437 GAO-21-191

Appendix IV: Comments from the Department of Health and Human Services
Page 438 GAO-21-191

Appendix IV: Comments from the Department of Health and Human Services
Page 439 GAO-21-191

Appendix IV: Comments from the Department of Health and Human Services
Page 440 GAO-21-191

Appendix IV: Comments from the Department of Health and Human Services
Page 441 GAO-21-191
Appendix V: Comments from the Department of Housing and Urban Development
Page 442 GAO-21-191
Appendix V: Comments from the Department of Housing and Urban Development
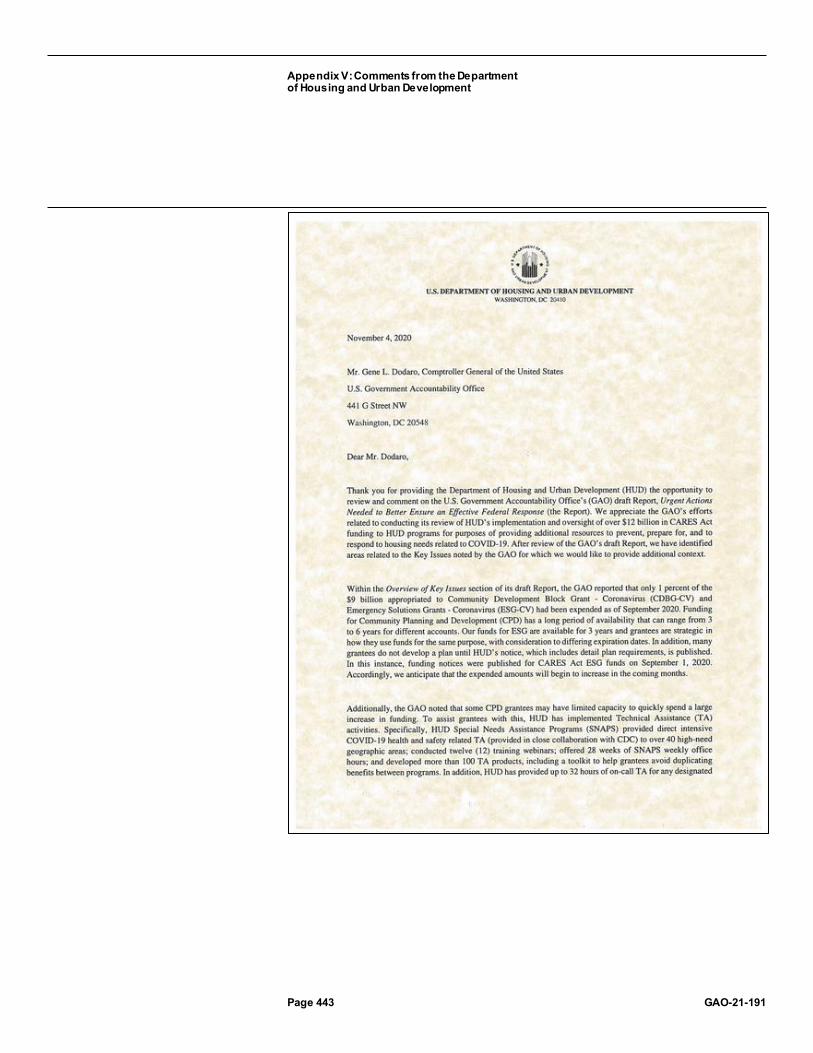
Appendix V: Comments from the Department of Housing and Urban Development
Page 443 GAO-21-191

Appendix V: Comments from the Department of Housing and Urban Development
Page 444 GAO-21-191

Appendix VI: Comments from the Internal Revenue Service
Page 445 GAO-21-191
Appendix VI: Comments from the Internal Revenue Service

Appendix VI: Comments from the Internal Revenue Service
Page 446 GAO-21-191

Appendix VI: Comments from the Internal Revenue Service
Page 447 GAO-21-191

Appendix VI: Comments from the Internal Revenue Service
Page 448 GAO-21-191
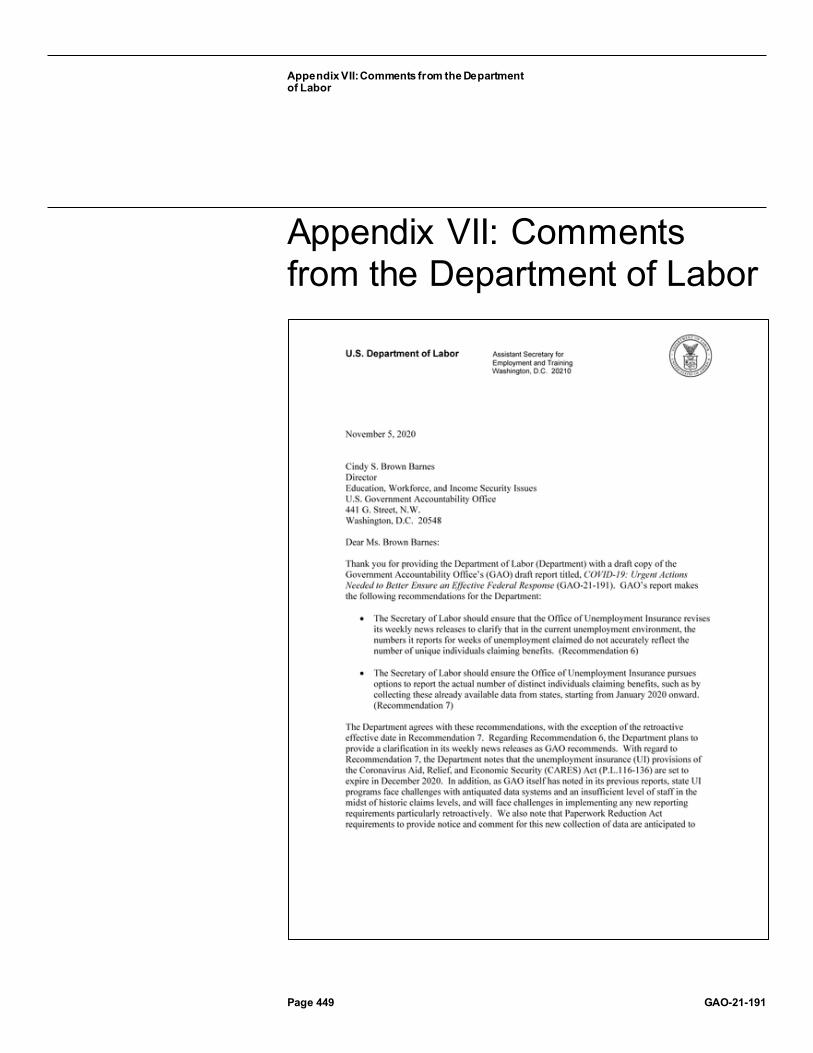
Appendix VII: Comments from the Department of Labor
Page 449 GAO-21-191
Appendix VII: Comments from the Department of Labor

Appendix VII: Comments from the Department of Labor
Page 450 GAO-21-191

Appendix VIII: Comments from the Small Business Administration
Page 451 GAO-21-191
Appendix VIII: Comments from the Small Business Administration

Appendix VIII: Comments from the Small Business Administration
Page 452 GAO-21-191

Appendix IX: Comments from the Social Security Administration
Page 453 GAO-21-191
Appendix IX: Comments from the Social Security Administration

Appendix IX: Comments from the Social Security Administration
Page 454 GAO-21-191

Appendix X: Comments from the Department of the Treasury
Page 455 GAO-21-191
Appendix X: Comments from the Department of the Treasury

Appendix X: Comments from the Department of the Treasury
Page 456 GAO-21-191

Appendix X: Comments from the Department of the Treasury
Page 457 GAO-21-191

Appendix XI: Comments from the Department of Veterans Affairs
Page 458 GAO-21-191
Appendix XI: Comments from the Department of Veterans Affairs

Appendix XI: Comments from the Department of Veterans Affairs
Page 459 GAO-21-191
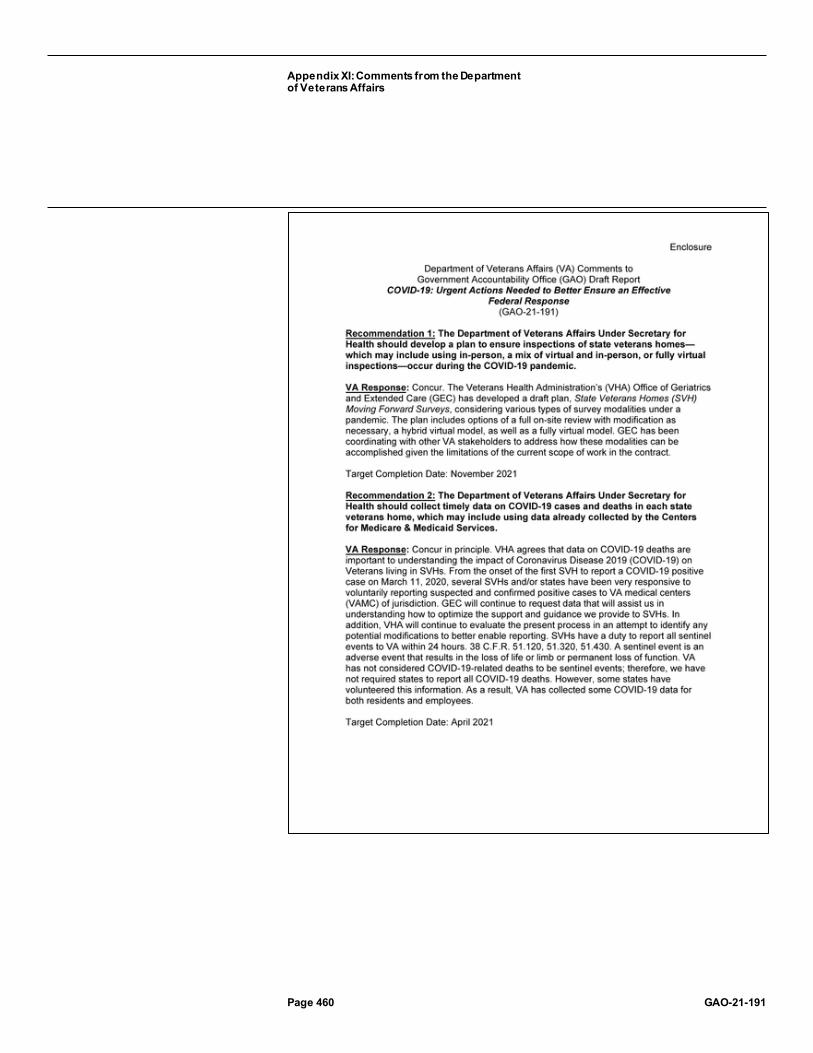
Appendix XI: Comments from the Department of Veterans Affairs
Page 460 GAO-21-191

Appendix XI: Comments from the Department of Veterans Affairs
Page 461 GAO-21-191

Appendix XII: Accessible Data
Page 462 GAO-21-191
Appendix XII: Accessible Data Data Tables
Accessible Data for Number of Unemployed Workers Permanently Losing Jobs and on Temporary Layoff, January 2019 through October 2020
Observation date
Workers permanently losing jobs Workers on temporary layoff
1/1/2019 1.4 0.9 2/1/2019 1.3 0.8 3/1/2019 1.4 0.9 4/1/2019 1.3 0.7 5/1/2019 1.3 0.9 6/1/2019 1.4 0.8 7/1/2019 1.4 0.8 8/1/2019 1.4 0.8 9/1/2019 1.3 0.7 10/1/2019 1.3 0.8 11/1/2019 1.4 0.8 12/1/2019 1.3 0.8 1/1/2020 1.3 0.7 2/1/2020 1.3 0.8 3/1/2020 1.5 1.8 4/1/2020 2.0 18.1 5/1/2020 2.3 15.3 6/1/2020 2.9 10.6 7/1/2020 2.9 9.2 8/1/2020 3.4 6.2 9/1/2020 3.8 4.6 10/1/2020 3.7 3.2

Appendix XII: Accessible Data
Page 463 GAO-21-191
Accessible Data for State-Reported Testing Supply Shortages, as of October 2020 Category Yes No Unsure Rapid point-of-care tests
24 16 6
Reagents 21 19 6 Testing instruments 16 24 6 Transport media 9 33 4 Swabs 9 34 3

Appendix XII: Accessible Data
Page 464 GAO-21-191
Accessible Data for Types of COVID-19 Testing Approaches Type of testing approach Description Diagnostic Intended to identify occurrence at the individual level
and is performed when there is a reason to suspect that an individual may be infected, such as having symptoms or suspected recent exposure, or to determine resolution of infection.
Screening Intended to identify occurrence at the individual level even if there is no reason to suspect infection—e.g., there is no known exposure. This includes, but is not limited to, screening of non-symptomatic individuals without known exposure with the intent of making decisions based on the test results.
Surveillance Includes ongoing systematic activities, including collection, analysis, and interpretation of health-related data that are essential to planning, implementing, and evaluating public health practice and monitoring of community- or population-level occurrence.

Appendix XII: Accessible Data
Page 465 GAO-21-191
Accessible Data for Number of Filers and Non-Filers Issued an Economic Impact Payment, as of September 30, 2020
Filers Non-filers 133,875,411 26,445,782

Appendix XII: Accessible Data
Page 466 GAO-21-191
Social Security beneficiaries
Railroad Retirement Board beneficiaries
Supplemental Security Income beneficiaries
Veterans Affairs beneficiaries
Non-filers who used online tool
17,614,076 59,196 2,888,543 403,265 5,480,702

Appendix XII: Accessible Data
Page 467 GAO-21-191
Accessible Data for Figure 2: Selected Federal Actions That Congress and the Administration Have Taken Related to COVID-19, as of November 2020
Date Event 29 January President announced the formation of the White House Coronavirus
Task Force. 31 January HHS Secretary declares that the novel coronavirus is a public health
emergency for the U.S., retroactive to January 27, 2020.
6 March The Coronavirus Preparedness and Response Supplemental Appropriations Act, 2020 is enacted.
11 March WHO declares a global pandemic. 13 March President declares a national emergency under the National
Emergencies Act and a nationwide emergency under the Stafford Act, retroactive to March 1, 2020.
18 March The Families First Coronavirus Response Act is enacted. 18 March President issues first Executive Order to utilize the Defense Production
Act of 1950.e 27 March The CARES Act is enacted. 11 April President approves a major disaster declaration under the Stafford Act
for Wyoming (retroactive to January 20, 2020), meaning all 50 states, the District of Columbia, and five territories have a major disaster declaration.
24 April The Paycheck Protection Program and Health Care Enhancement Act is enacted.
5 June The Paycheck Protection Program Flexibility Act of 2020 is enacted. 5 August President issues an executive order and three presidential
memorandums providing for housing assistance, student loan payment relief, financial support to the unemployed, and payroll tax deferral options.
2 October HHS Secretary announces that the COVID-19 public health emergency for the U.S. will be extended, effective October 23, 2020.

Appendix XII: Accessible Data
Page 468 GAO-21-191
Accessible Data for Figure 3: Higher-Than-Expected Weekly Mortality, January to October 2020
Week ending
Month Upper_Bound_Threshold (in thousands)
Deaths_GT_upper_bound (in thousands)
Deaths_LE_upper_bound (in thousands)
1/4/2020 January 61.972 60.154
1/11/2020 January 62.534 60.7
1/18/2020 January 62.529 59.341
1/25/2020 January 62.568 59.134
2/1/2020 January 61.984 58.785
2/8/2020 February 61.788 59.351
2/15/2020 February 61.625 58.784
2/22/2020 February 61.273 58.853
2/29/2020 February 60.831 59.255
3/7/2020 March 60.604 59.628
3/14/2020 March 60.215 58.62
3/21/2020 March 59.915 59.142
3/28/2020 March 59.385 3.562 59.385
4/4/2020 April 58.822 13.413 58.822
4/11/2020 April 58.263 20.746 58.263
4/18/2020 April 57.654 19.061 57.654
4/25/2020 April 57.053 16.749 57.053
5/2/2020 April 56.379 12.838 56.379
5/9/2020 May 55.805 10.925 55.805
5/16/2020 May 55.498 9.266 55.498
5/23/2020 May 55.085 6.785 55.085
5/30/2020 May 54.871 5.044 54.871
6/6/2020 June 54.701 4.437 54.701
6/13/2020 June 54.406 3.872 54.406
6/20/2020 June 54.506 3.693 54.506
6/27/2020 June 54.245 4.48 54.245
7/4/2020 July 54.073 5.978 54.073
7/11/2020 July 53.918 8.251 53.918
7/18/2020 July 53.684 9.783 53.684
7/25/2020 July 53.709 10.835 53.709
8/1/2020 July 53.529 10.925 53.529
8/8/2020 August 53.551 10.305 53.551
8/15/2020 August 53.415 10.2 53.415
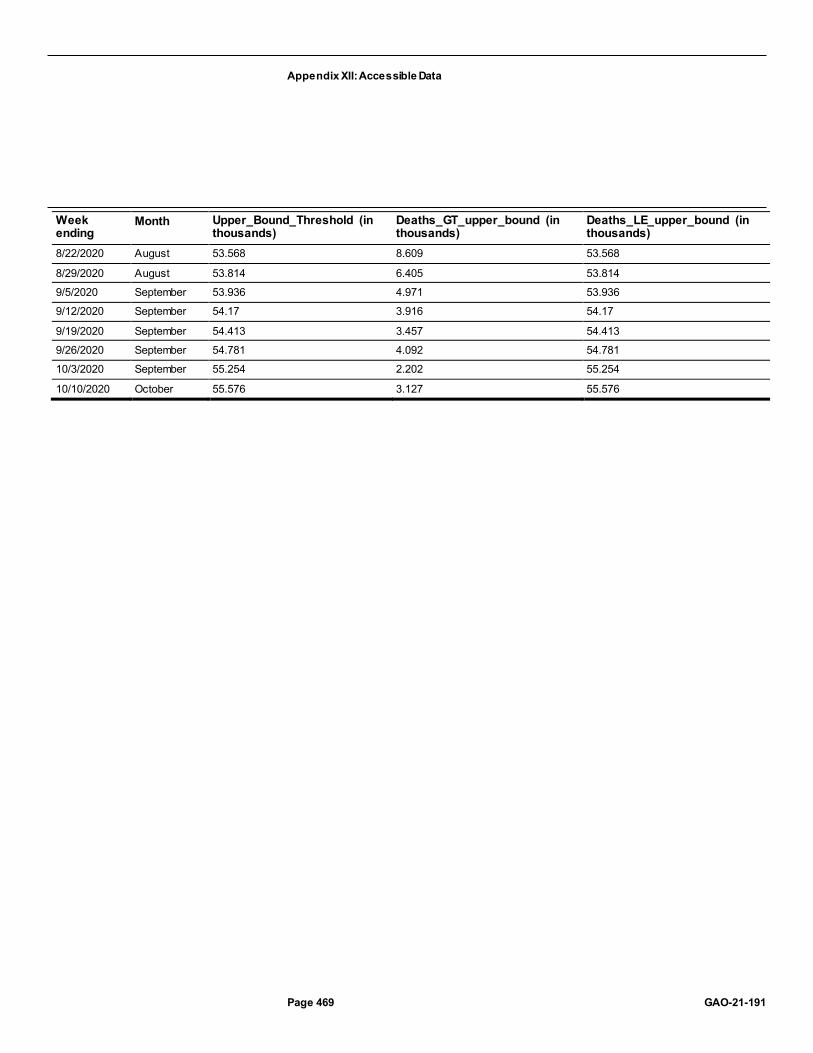
Appendix XII: Accessible Data
Page 469 GAO-21-191
Week ending
Month Upper_Bound_Threshold (in thousands)
Deaths_GT_upper_bound (in thousands)
Deaths_LE_upper_bound (in thousands)
8/22/2020 August 53.568 8.609 53.568
8/29/2020 August 53.814 6.405 53.814
9/5/2020 September 53.936 4.971 53.936
9/12/2020 September 54.17 3.916 54.17
9/19/2020 September 54.413 3.457 54.413
9/26/2020 September 54.781 4.092 54.781
10/3/2020 September 55.254 2.202 55.254
10/10/2020 October 55.576 3.127 55.576

Appendix XII: Accessible Data
Page 470 GAO-21-191
Accessible Data for Figure 4: Number of Unemployed Workers Permanently Losing Jobs and on Temporary Layoff, January 2019 through October 2020
Observation date
Workers permanently losing jobs Workers on temporary layoff
1/1/2019 1.4 0.9 2/1/2019 1.3 0.8 3/1/2019 1.4 0.9 4/1/2019 1.3 0.7 5/1/2019 1.3 0.9 6/1/2019 1.4 0.8 7/1/2019 1.4 0.8 8/1/2019 1.4 0.8 9/1/2019 1.3 0.7 10/1/2019 1.3 0.8 11/1/2019 1.4 0.8 12/1/2019 1.3 0.8 1/1/2020 1.3 0.7 2/1/2020 1.3 0.8 3/1/2020 1.5 1.8 4/1/2020 2.0 18.1 5/1/2020 2.3 15.3 6/1/2020 2.9 10.6 7/1/2020 2.9 9.2 8/1/2020 3.4 6.2 9/1/2020 3.8 4.6 10/1/2020 3.7 3.2
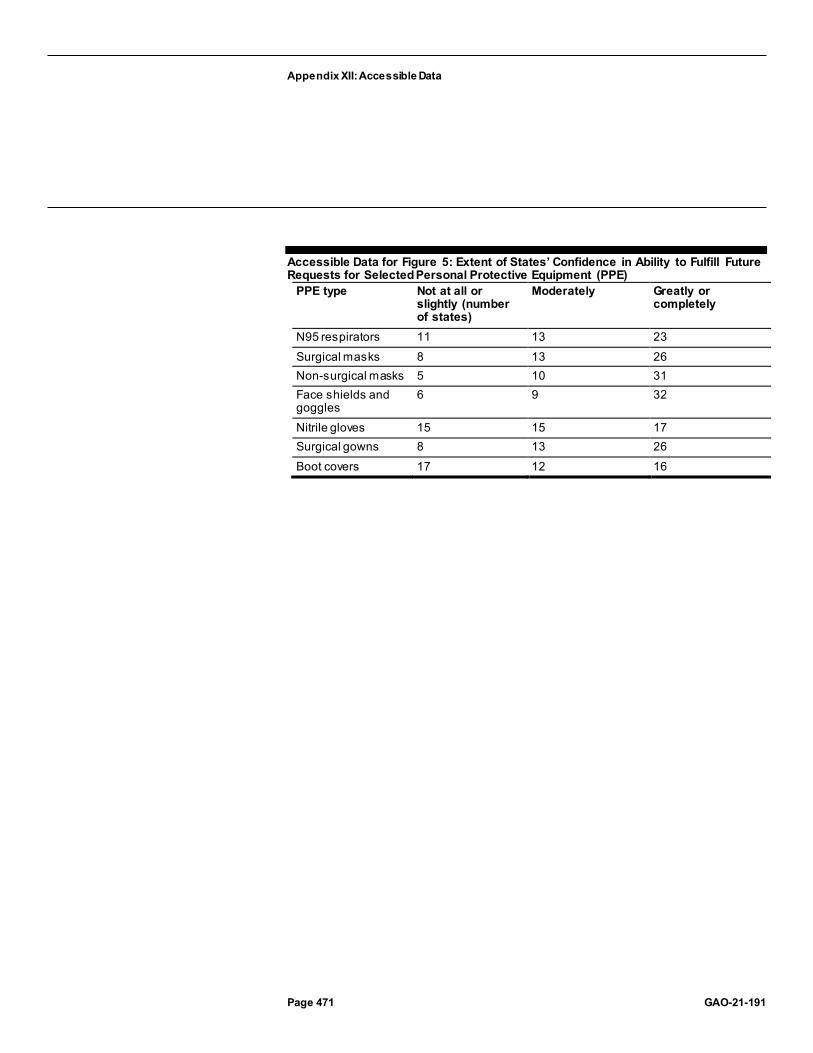
Appendix XII: Accessible Data
Page 471 GAO-21-191
Accessible Data for Figure 5: Extent of States’ Confidence in Ability to Fulfill Future Requests for Selected Personal Protective Equipment (PPE)
PPE type Not at all or slightly (number of states)
Moderately Greatly or completely
N95 respirators 11 13 23 Surgical masks 8 13 26 Non-surgical masks 5 10 31 Face shields and goggles
6 9 32
Nitrile gloves 15 15 17 Surgical gowns 8 13 26 Boot covers 17 12 16

Appendix XII: Accessible Data
Page 472 GAO-21-191
Accessible Data for Figure 6: State-Reported Supply Shortages for Testing Sites or Laboratories
Testing supply type Yes No Unsure Rapid point-of-care tests
24 16 6
Reagents 21 19 6 Testing instruments 16 24 6 Transport media 9 33 4 Swabs 9 34 3
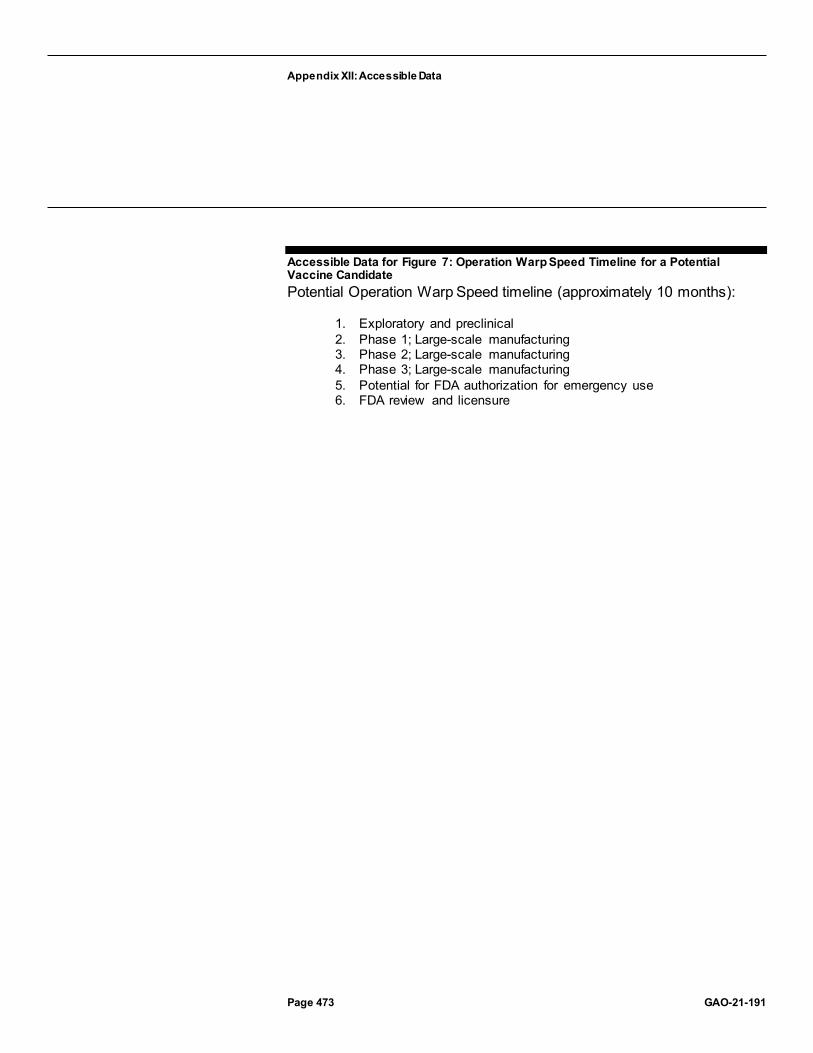
Appendix XII: Accessible Data
Page 473 GAO-21-191
Accessible Data for Figure 7: Operation Warp Speed Timeline for a Potential Vaccine Candidate Potential Operation Warp Speed timeline (approximately 10 months):
1. Exploratory and preclinical 2. Phase 1; Large-scale manufacturing 3. Phase 2; Large-scale manufacturing 4. Phase 3; Large-scale manufacturing 5. Potential for FDA authorization for emergency use 6. FDA review and licensure

Appendix XII: Accessible Data
Page 474 GAO-21-191
Accessible Data for Indicators for Areas of the Economy Supported by the Federal Pandemic Response, July 2020 through October 2020, cumulative change since February 2020
Indicator July August September October Cumulative change since February
Employment-to-population ratioa
55.1 56.5 56.6 57.4 -3.7 (negative trend)
Consumer Credit Default Composite Index (not seasonally adjusted)b
0.66 0.67 (negative trend)
0.63 N/A -0.39
Small Business Health Index (not seasonally adjusted)c
83.6 84.1 84.2 N/A 0.5
Spreads on investment grade corporate bondsd
137 128 130 (negative trend) 127 +17 (negative trend)
Spreads on municipal bondse
74 56 63 (negative trend) 61 +67 (negative trend)
Changes in state and local government employment
+206,000 +213,000 -187,000 (negative trend)
-130,000 (negative trend)
-1,342,000 (negative trend)
Changes in health care employment
+130,300 +74,200 +72,100 +58,300 -589,800 (negative trend)
Changes in personal spending on health care services ($ billions)f
+37 +18 +45 NA -147 (negative trend)

Appendix XII: Accessible Data
Page 475 GAO-21-191
Accessible Data for Percentage Change in Employment by Sector, February through October 2020
Sector Percent difference between Feb and October, 2020
Federal government 4 Utilities -1 Financial activities -1 Retail trade -3 Construction -4 Healthcare and social assistance -5 Transportation and warehousing -5 Manufacturing -5 Wholesale trade -5 Professional and business services -5 State and local government -7 Other services -7 Information -9 Educational services -10 Mining and logging -13 Leisure and hospitality -21

Appendix XII: Accessible Data
Page 476 GAO-21-191
Accessible Data for Number of Unemployed Workers Permanently Losing Jobs and on Temporary Layoff, January 2019 through October 2020
Observation date
Workers permanently losing jobs (in millions)
Workers on temporary layoff (in millions)
1/1/2019 1.4 0.9 2/1/2019 1.3 0.8 3/1/2019 1.4 0.9 4/1/2019 1.3 0.7 5/1/2019 1.3 0.9 6/1/2019 1.4 0.8 7/1/2019 1.4 0.8 8/1/2019 1.4 0.8 9/1/2019 1.3 0.7 10/1/2019 1.3 0.8 11/1/2019 1.4 0.8 12/1/2019 1.3 0.8 1/1/2020 1.3 0.7 2/1/2020 1.3 0.8 3/1/2020 1.5 1.8 4/1/2020 2.0 18.1 5/1/2020 2.3 15.3 6/1/2020 2.9 10.6 7/1/2020 2.9 9.2 8/1/2020 3.4 6.2 9/1/2020 3.8 4.6 10/1/2020 3.7 3.2

Appendix XII: Accessible Data
Page 477 GAO-21-191
Accessible Data for Serious Delinquency Rates on Single-Family Residential Mortgages, January 2019 through August 2020
Date FHA Fannie Mae and Freddie Mac loans Jan-19 3.29% 0.74% Feb-19 3.23% 0.73% Mar-19 3.01% 0.71% Apr-19 2.87% 0.69% May-19 2.80% 0.67% Jun-19 2.86% 0.67% Jul-19 2.87% 0.65% Aug-19 2.91% 0.65% Sep-19 2.97% 0.65% Oct-19 3.02% 0.65% Nov-19 3.14% 0.64% Dec-19 3.42% 0.65% Jan-20 3.17% 0.64% Feb-20 3.10% 0.63% Mar-20 3.28% 0.64% Apr-20 3.40% 0.68% May-20 4.35% 0.86% Jun-20 8.38% 2.58% Jul-20 10.00% 3.19% Aug-20 10.74% 3.26%

Appendix XII: Accessible Data
Page 478 GAO-21-191
Accessible Data for State and Local Government Tax Revenue, First Quarter 2019 through Second Quarter 2020
Quarter Total state and local tax revenue (billions) 2019 Q1 $384.6 2019 Q2 $401.1 2019 Q3 $394.4 2019 Q4 $397.8 2020 Q1 $404.0 2020 Q2 $335.1

Appendix XII: Accessible Data
Page 479 GAO-21-191
Accessible Data for Weekly Confirmed COVID-19 Cases and Deaths among U.S. Nursing Home Residents and Staff, as Reported by Medicare- and Medicaid-Certified Nursing Homes, Weeks Ending May 31, 2020 through October 4, 2020
na Confirmed cases (weekly number, in thousands)
Deaths (weekly number, in thousands)
Reporting week Residents Staff Residents Staff May 31 10.971 9.753 3.599 0.068 Jun 7 9.395 8.053 2.869 0.055 Jun 14 6.819 6.049 2.066 0.038 Jun 21 6.309 6.153 1.76 0.03 Jun 28 6.693 6.799 1.534 0.026 Jul 5 7.268 8.093 1.522 0.034 Jul 12 9.083 10.43 1.668 0.03 Jul 19 10.863 11.844 1.828 0.026 Jul 26 11.872 11.875 2.13 0.047 Aug 2 11.183 10.198 2.04 0.032 Aug 9 10.96 9.014 2.028 0.035 Aug 16 9.532 8.444 1.822 0.042 Aug 23 8.696 7.587 1.733 0.032 Aug 30 8.098 6.954 1.515 0.041 Sep 6 7.723 7.208 1.419 0.027 Sep 13 7.093 7.017 1.269 0.025 Sep 20 7.062 7.605 1.221 0.019 Sep 27 7.232 7.364 1.195 0.023 Oct 4 6.991 6.805 1.187 0.027

Appendix XII: Accessible Data
Page 480 GAO-21-191
Accessible Data for Federal Entities Involved in Management of the Strategic National Stockpile (SNS) Supplies during the COVID-19 Pandemic
Group Key agencies Purpose White House Coronavirus Task Force NA NA Unified Coordination Group (UCG) Federal Emergency Management Agency,
Assistant Secretary for Preparedness and Response, and Centers for Disease Control and Prevention
Leads the federal response
Supply Chain Task Force (March – June 2020)
Department of Defense, Federal Emergency Management Agency
Primary federal body coordinating and managing supply chain responsibilities
Supply Chain Advisory Group (June 2020 – Present)
Department of Defense, Federal Emergency Management Agency
Provide advice and assistance on supply chain responsibilities including SNS restructure
Joint Acquisition Task Force (March – September 2020)
Department of Defense Support the acquisition needs of federal agencies in their public health response activities
Defense Assisted Acquisition Cell (October 2020 – Present)
Department of Defense Support the acquisition needs of federal agencies in their public health response activities
Assistant Secretary for Preparedness and Response, Division of SNS
Department of Health and Human Services Control and maintain the SNS
Logistics, Supply Chain, Next Gen SNS Working Group (June – September 2020)
White House, Federal Emergency Management Agency, Department of Health and Human Services, Assistant Secretary of Preparedness and Response, Department of Defense, Department of Commerce, Supply Chain Task Force, Department of Veterans Affairs, Office of Management and Budget, Office of Trade and Manufacturing Policy
Re-assess, restructure, and replenish the SNS

Appendix XII: Accessible Data
Page 481 GAO-21-191
Accessible Data for Primary Use of Pharmaceutical Products the Office of the Assistant Secretary for Preparedness and Response Will Include in the Strategic National Stockpile
Primary Use · Anesthetic · Antibiotic · Anti-Inflammatory · Anti-Nausea · Blood Pressure Control · Blood Thinner · Bronchodilator (inhaler) · Heart Rhythm Control · Muscle Relaxant · Pain Relief · Rehydration · Sedative
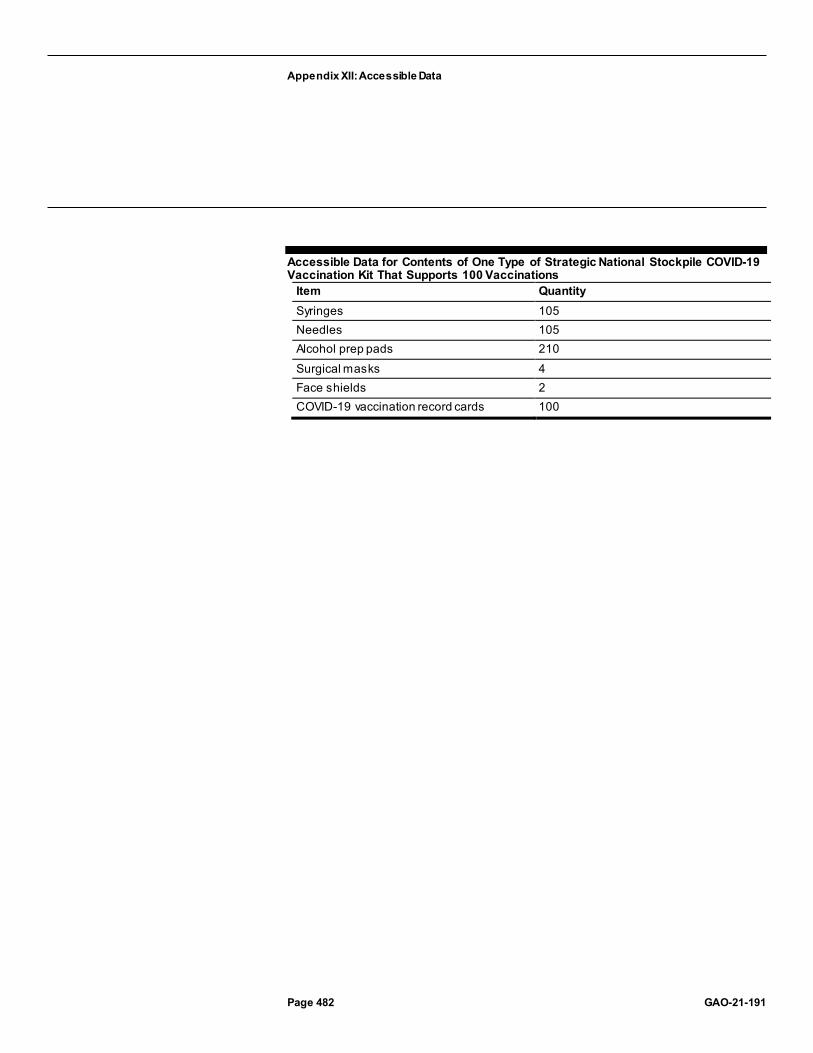
Appendix XII: Accessible Data
Page 482 GAO-21-191
Accessible Data for Contents of One Type of Strategic National Stockpile COVID-19 Vaccination Kit That Supports 100 Vaccinations
Item Quantity Syringes 105 Needles 105 Alcohol prep pads 210 Surgical masks 4 Face shields 2 COVID-19 vaccination record cards 100

Appendix XII: Accessible Data
Page 483 GAO-21-191
Accessible Data for HHS Definitions and Applicable Requirements, by Type of COVID-19 Testing Approach
Type of testing approach
Description Laboratory requirements
Diagnostic Intended to identify occurrence at the individual level and is performed when there is a reason to suspect that an individual may be infected, such as having symptoms or suspected recent exposure, or to determine resolution of infection.
Must be performed by CLIA-certified laboratory using a Food and Drug Administration (FDA)-authorized or approved test.
Screening Intended to identify occurrence at the individual level even if there is no reason to suspect infection—e.g., there is no known exposure. This includes, but is not limited to, screening of non-symptomatic individuals without known exposure with the intent of making decisions based on the test results.
Must be performed by CLIA-certified laboratory using a FDA-authorized or approved test.
Surveillance Includes ongoing systematic activities, including collection, analysis, and interpretation of health-related data that are essential to planning, implementing, and evaluating public health practice and monitoring of community- or population-level occurrence.
Can be performed in a laboratory that is not CLIA-certified, and may use a test or technique without FDA authorization where a specific diagnosis is not returned to the individual.

Appendix XII: Accessible Data
Page 484 GAO-21-191
Accessible Data for Timeline of Selected Changes to Centers for Disease Control and Prevention (CDC) Testing Guidelines for Asymptomatic Individuals with Known or Suspected Exposure
Category May 3, 2020 June 13, 2020 August 24, 2020 September 18, 2020 GAO summary of Change to testing guidelines on the CDC web site
CDC updated testing guidelines to outline high priority categories that should be tested, including asymptomatic individuals in disproportionately affected racial and ethnic minority groups, or those prioritized by health departments or clinicians.
CDC updated testing guidelines to remove high priority categories, also noting that testing is appropriate for asymptomatic individuals with recent known or suspected exposure.
CDC updated testing guidelines to state that asymptomatic individuals with recent or known exposure may not need a test unless they are a vulnerable individual or if a health care provider or public health official recommends testing.
CDC updated testing guidelines to state that asymptomatic individuals with known potential exposure should be tested.
CDC Description of Changes
“Updated recommendations for testing, specimen collection, and reporting patients and reporting positive test results Specification of testing priorities”
Changes above not described or clarified in summary of changes.
“Diagnostic testing categories have been edited to focus on testing considerations and actions to be taken by individuals undergoing testing.”
“Due to the significance of asymptomatic and pre-symptomatic transmission, this guidance further reinforces the need to test asymptomatic persons, including close contacts of a person with documented SARS-CoV-2 infection.”

Appendix XII: Accessible Data
Page 485 GAO-21-191
Accessible Data for Supplemental Appropriations to HHS for COVID-19 Response and HHS’s Reported Obligations and Expenditures, as of October 31, 2020 note: Total amount of HHS supplemental appropriations – $250.6 billion
Category May 31, 2020 (in billions)
June 30, 2020 (in billions)
July 31, 2020 (in billions)
August 31, 2020 (in billions)
September 30, 2020 (in billions)
October 31, 2020 (in billions)
Obligations $101 $124 $144 $152 $158 $163 Expenditures $67 $82 $99 $108 $113 $117

Appendix XII: Accessible Data
Page 486 GAO-21-191
Accessible Data for Cumulative COVID-19-Associated Hospitalization Rates per 100,000 Population from Select Counties in 14 States, Adjusted for Age, by Race and Ethnicity, March 1, 2020 through October 10, 2020
Category Rate per 100,000 population American Indian/ Alaska Native 376.9 Asian or Pacific Islander 113.8 Black 376.3 Hispanic or Latino 386.6 White 85.9

Appendix XII: Accessible Data
Page 487 GAO-21-191
Accessible Data for COVID-19 Death Rates, by Race and Ethnicity, through October 7, 2020
Category Rate per 100,000 population American Indian/ Alaska Native 82.2 Asian 43.7 Black 100.4 Hispanic or Latino 70.6 Native Hawaiian/ Other Pacific Islander 58.2 White 51.8

Appendix XII: Accessible Data
Page 488 GAO-21-191
Accessible Data for Deaths in 2020 as a Percentage of 2015-2019 Deaths, by Race and Ethnicity, January through October 2020
Reporting week
Month American Indian\Alaska Native (percentage)
Asian (percentage)
Black (percentage)
Hispanic or Latino (percentage)
Other (percentage)
White (percentage)
1 January 2.1 11.4 6.9 7.8 3.5 2.1
2 January 12.2 8.8 4.1 11.7 -4.4 12.2
3 January 10.1 9.9 3.9 10.8 2.4 10.1
4 January 4.7 10 7 11.5 -1.8 4.7
5 January 6.4 8.4 4.9 13.1 5.2 6.4
6 February 12.3 13.6 9 12.9 -6.5 12.3
7 February 2.5 12.4 3.6 13.7 5.4 2.5
8 February -1.2 15.2 8.9 13.5 -3.2 -1.2
9 February 6.7 19 8.5 11.3 4.5 6.7
10 March 7.1 13.9 8.9 12.9 -1 7.1
11 March 0 11.6 10.2 12.4 -2.8 0
12 March 9.7 25.2 14.6 18.1 6 9.7
13 March 13.8 42.4 35.7 35.7 19.4 13.8
14 April 24.5 83.8 83.2 80.4 72.5 24.5
15 April 24.7 108.1 112.1 114.7 90 24.7
16 April 30.2 110.4 98.1 103.4 73.5 30.2
17 April 38.6 88.7 83.9 90.5 53.9 38.6
18 April 31.7 71.7 63.4 70.7 51.9 31.7
19 May 31 54.2 57.4 65.8 40.7 31
20 May 40.9 56.1 51.6 59 11 40.9
21 May 48.2 39.7 44.2 49 19.5 48.2
22 May 41 27.5 37.1 47.7 13.8 41
23 June 43.6 25.6 32.8 45.5 18 43.6
24 June 58.2 24.6 30 43.6 7.4 58.2
25 June 44.6 25.9 28.6 44.2 6.7 44.6
26 June 48.2 38.5 29.8 53.9 13.2 48.2
27 July 51.8 25.3 27.8 60.1 12.4 51.8
28 July 50.8 31.9 42.2 86.3 17.6 50.8
29 July 53.5 30.1 43.1 102 26.8 53.5
30 July 60.9 35.6 47.7 98.4 28.1 60.9
31 July 53.1 35.4 46.2 94.7 17.8 53.1
32 August 49 40.1 42.6 89.5 19.1 49

Appendix XII: Accessible Data
Page 489 GAO-21-191
Reporting week
Month American Indian\Alaska Native (percentage)
Asian (percentage)
Black (percentage)
Hispanic or Latino (percentage)
Other (percentage)
White (percentage)
33 August 50.3 34.8 41.2 81.3 14.4 50.3
34 August 43.9 39 35.2 70.3 7.7 43.9
35 August 29.6 27.7 29.1 59.6 16.7 29.6
36 September 36.5 31.9 21.9 50.1 8.8 36.5
37 September 29.5 30.4 18.9 46.4 11.8 29.5
38 September 20.9 31.7 16.5 40.2 4.8 20.9
39 September 26.9 26.5 16.3 41.8 51.3 26.9
40 September 11.6 14.6 7.4 31.2 54.1 11.6
41 October 29.1 27.5 10.7 29.1 68.8 29.1

Appendix XII: Accessible Data
Page 490 GAO-21-191
Accessible Data for Distribution of COVID-19 Deaths, by Race and Ethnicity and Age Group, through October 14, 2020
Category American Indian/Alaska Native
Asian Black Hispanic or Latino
Native Hawaiian/Other Pacific Islander
White
35-44 years 2.8 3.5 27.4 49.5 0.7 14.9 45-54 years 2.3 4 27.1 43.5 0.5 21 55-64 years 1.6 4.3 28 32.5 0.4 31.6 65-74 years 1.1 4.4 25.4 23.8 0.2 43.4 75-84 years 0.7 3.9 19.6 17.4 0.1 56.9 85+ years 0.4 4 12.9 11.6 0 70.2

Appendix XII: Accessible Data
Page 491 GAO-21-191
Accessible Data for Centers for Disease Control and Prevention (CDC) Reported Survey Findings Regarding Suicidal Ideation, June 24–30, 2020
Category Percentage Overall respondents who reported having seriously considered suicide in the preceding 30 days: 11% Suicidal ideation was more prevalent among certain subgroups, including those who were: aged 18 to 24 years old
26%
Suicidal ideation was more prevalent among certain subgroups, including those who were : self-reported unpaid adult caregivers
31%
Suicidal ideation was more prevalent among certain subgroups, including those who wer e: self-reported essential workers
22%
Suicidal ideation was more prevalent among certain subgroups, including those who were : Hispanic, any race(s)
19%
Suicidal ideation was more prevalent among certain subgroups, including those who were : Black, non-Hispanic
15%
Suicidal ideation was more prevalent among certain subgroups, including those who were : previously diagnosed with posttraumatic stress disorder
44%
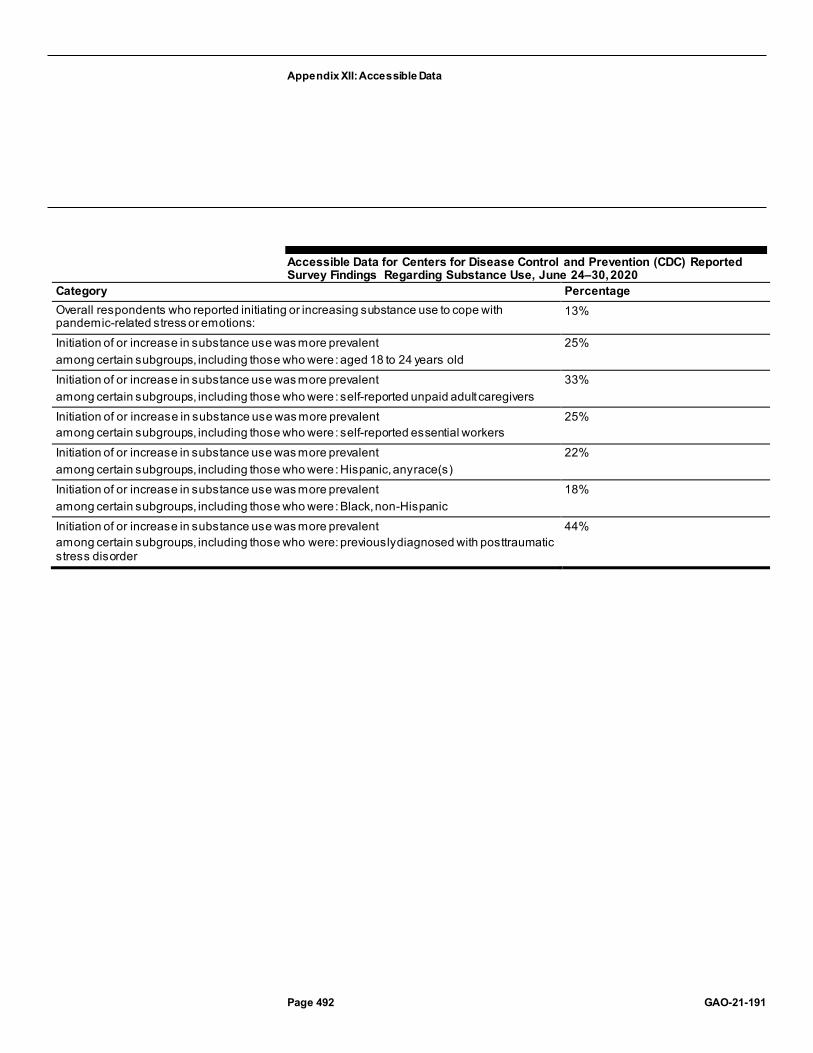
Appendix XII: Accessible Data
Page 492 GAO-21-191
Accessible Data for Centers for Disease Control and Prevention (CDC) Reported Survey Findings Regarding Substance Use, June 24–30, 2020
Category Percentage Overall respondents who reported initiating or increasing substance use to cope with pandemic-related stress or emotions:
13%
Initiation of or increase in substance use was more prevalent among certain subgroups, including those who were: aged 18 to 24 years old
25%
Initiation of or increase in substance use was more prevalent among certain subgroups, including those who were: self-reported unpaid adult caregivers
33%
Initiation of or increase in substance use was more prevalent among certain subgroups, including those who were: self-reported essential workers
25%
Initiation of or increase in substance use was more prevalent among certain subgroups, including those who were: Hispanic, any race(s)
22%
Initiation of or increase in substance use was more prevalent among certain subgroups, including those who were: Black, non-Hispanic
18%
Initiation of or increase in substance use was more prevalent among certain subgroups, including those who were: previously diagnosed with posttraumatic stress disorder
44%

Appendix XII: Accessible Data
Page 493 GAO-21-191
Accessible Data for Examples of Personal Protective Equipment Personal protective equipment:
1. N95 respirators 2. Surgical masks 3. Non-surgical masks 4. Face shields and googles 5. Nitrile gloves 6. Surgical gowns 7. Boots covers

Appendix XII: Accessible Data
Page 494 GAO-21-191
Accessible Data for Examples of COVID-19 Testing Supplies Testing supplies:
1. Swabs 2. Transport data 3. Reagents 4. Rapid point-of-care tests 5. Testing instruments
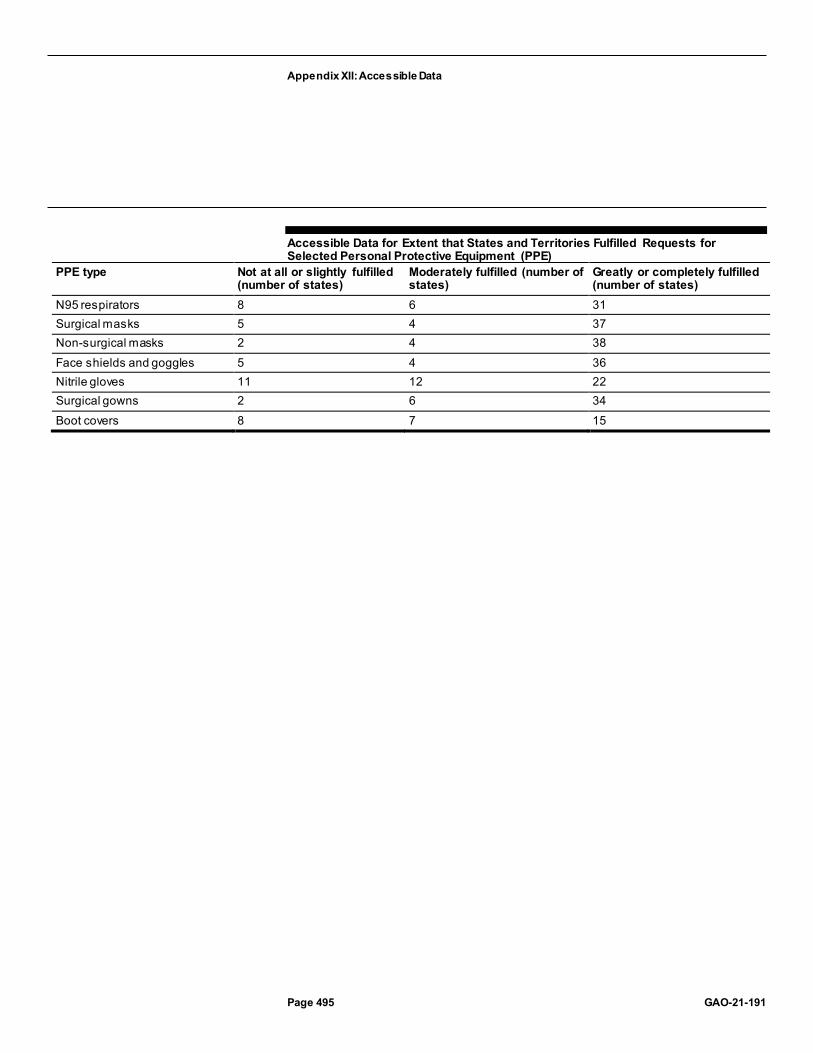
Appendix XII: Accessible Data
Page 495 GAO-21-191
Accessible Data for Extent that States and Territories Fulfilled Requests for Selected Personal Protective Equipment (PPE)
PPE type Not at all or slightly fulfilled (number of states)
Moderately fulfilled (number of states)
Greatly or completely fulfilled (number of states)
N95 respirators 8 6 31 Surgical masks 5 4 37 Non-surgical masks 2 4 38 Face shields and goggles 5 4 36 Nitrile gloves 11 12 22 Surgical gowns 2 6 34 Boot covers 8 7 15

Appendix XII: Accessible Data
Page 496 GAO-21-191
Accessible Data for Number of States Reporting 30-day Stockpiles of Selected Personal Protective Equipment (PPE)
PPE type Number of states N95 respirators 41 Surgical masks 34 Non-surgical masks 40 Face shields and goggles 41 Nitrile gloves 25 Surgical gowns 39 Boot covers 22

Appendix XII: Accessible Data
Page 497 GAO-21-191
Accessible Data for Extent of States’ Confidence in Ability to Fulfill Future Requests for Selected Personal Protective Equipment (PPE)
PPE type Not at all or slightly (number of states)
Moderately (number of states) Greatly or completely (number of states)
N95 respirators 11 13 23 Surgical masks 8 13 26 Non-surgical masks 5 10 31 Face shields and goggles 6 9 32 Nitrile gloves 15 15 17 Surgical gowns 8 13 26 Boot covers 17 12 16

Appendix XII: Accessible Data
Page 498 GAO-21-191
Accessible Data for State-Reported Supply Shortages for Testing Sites or Laboratories
Testing supply type Yes (number of states)
No (number of states)
Unsure (number of states)
Rapid point-of-care tests
24 16 6
Reagents 21 19 6 Testing instruments 16 24 6 Transport media 9 33 4 Swabs 9 34 3

Appendix XII: Accessible Data
Page 499 GAO-21-191
Accessible Data for States’ Anticipated Supply Shortages for Testing Sites or Laboratories
Testing supply type Yes (number of states)
No (number of states)
Unsure (number of states)
Rapid point-of-care tests
22 12 12
Reagents 20 13 13 Testing instruments 13 19 14 Transport media 8 28 9 Swabs 8 29 9

Appendix XII: Accessible Data
Page 500 GAO-21-191
Accessible Data for Status of Supplemental CARES Act Funding for HUD Programs, as of September 30, 2020
HUD program office
Programa Appropriated (funding dollars)
Obligated amount
Obligated percentage
Expended amount
Expended percentage
Purpose Expiration
Community Planning and Development
Community Development Block Grant
$5 billion $1.8 billion 35 $72 million 1 Support state, community, and non-profit activities to prevent, prepare for, and respond to COVID-19
9/30/22
Community Planning and Development
Emergency Solutions Grants
$4 billion $1.7 billion 43 $15 million 0 Provide homeless assistance and prevention activities for individuals and families
9/30/22
Community Planning and Development
Housing Opportunities for Persons with AIDS
$65 million $48 million 75 $1 million 2 Maintain operations and rental assistance, supportive services, and other necessary actions
9/30/21b
Public and Indian Housing
Tenant-Based Rental Assistance
$1.25 billion $1.09 billion
88 $850 million
68 Maintain public housing agency operations and take other necessary actions during the period of COVID-19
Available until expended
Public and Indian Housing
Public Housing Operating Fund
$685 million $685 million
100 $313 million
46 Maintain public housing agency operations and take other necessary actions during the period of COVID-19
9/30/21
Public and Indian Housing
Native American programs
$300 million $295 million
98 $41.5 million
14 Maintain normal operations and fund eligible affordable housing activities during the period of COVID-19
9/30/24
Housing Project-Based Rental Assistance
$1 billion $823 million
82 $812 million
81 Help property ow ners or sponsors that receive project-based rental assistance maintain normal operations and take other necessary actions during the period of COVID-19
Available until expended
Housing Section 202: Housing for the Elderly
$50 million $19 million 38 $15.6 million
31 Help property ow ners or sponsors that receive project-based rental assistance maintain normal operations and take other necessary actions during the period of COVID-19
9/30/23

Appendix XII: Accessible Data
Page 501 GAO-21-191
HUD program office
Programa Appropriated (funding dollars)
Obligated amount
Obligated percentage
Expended amount
Expended percentage
Purpose Expiration
Housing Section 811: Housing for Persons with Disabilities
$15 million $5 million 35 $4 million 29 Help property ow ners or sponsors that receive project-based rental assistance maintain normal operations and take other necessary actions during the period of COVID-19
9/30/23
Fair Housing and Equal Opportunity
Fair housing programs
$2.5 million $1.9 million
75 $0.8 million
34 Address fair housing issues and support fair housing education and outreach activities relating to COVID-19
9/30/21
Total Na $12.37 billion $6.4 billion 52 $2.1 billion 17 na na

Appendix XII: Accessible Data
Page 502 GAO-21-191
Accessible Data for Weekly Initial Claims Submitted Nationwide for Regular Unemployment Insurance (UI) and Pandemic Unemployment Assistance (PUA) Benefits
Date 2019 regular UI initial claims (March 3 through November 9) (Rounded to 1,000)
2020 regular UI initial claims (March 1 through November 7) (Rounded to 1,000)
PUA 2020 (Rounded to 1,000)
2020 total initial claims (including PUA claims in shaded area) (Rounded to 1,000)
Number of states reporting PUA claims
March 209 200 200 March 194 252 252 March 190 2,918 2,918 March 184 5,992 5,992 April 196 6,174 32 6,206 2 April 196 4,903 52 4,955 4 April 212 4,228 225 4,453 8 April 205 3,470 833 4,303 17 May 204 2,810 1,051 3,862 32 May 188 2,329 893 3,221 34 May 192 2,167 1,277 3,444 41 May 198 1,904 1,352 3,256 43 May 190 1,614 808 2,422 46 June 220 1,558 704 2,262 47 June 206 1,459 774 2,233 48 June 226 1,449 881 2,330 48 June 225 1,427 996 2,423 49 July 232 1,395 861 2,257 48 July 244 1,513 955 2,468 49 July 196 1,377 954 2,331 50 July 179 1,207 902 2,109 51 August 180 988 650 1,639 52 August 187 839 482 1,321 52 August 171 890 515 1,405 51 August 177 826 594 1,420 52 August 180 837 754 1,591 51 September 160 866 868 1,734 52 September 173 796 675 1,471 52 September 175 827 630 1,457 52 September 173 744 451 1,195 52

Appendix XII: Accessible Data
Page 503 GAO-21-191
Date 2019 regular UI initial claims (March 3 through November 9) (Rounded to 1,000)
2020 regular UI initial claims (March 1 through November 7) (Rounded to 1,000)
PUA 2020 (Rounded to 1,000)
2020 total initial claims (including PUA claims in shaded area) (Rounded to 1,000)
Number of states reporting PUA claims
October 188 731 379 1,110 53 October 202 830 337 1,167 52 October 187 767 345 1,111 53 October 199 739 360 1,098 51 October 206 744 362 1,106 53 November 239 723 298 1,021 53

Appendix XII: Accessible Data
Page 504 GAO-21-191
Accessible Data for Over-reporting of Individuals Claiming Pandemic Unemployment Assistance (PUA)
Date PUA continued claims (in thousands)
PUA cumulative initial claims (in thousands)
Difference Number of selected states reporting PUA claims
3/28/2020 0 0 4/4/2020 0 0 1 4/11/2020 120 0 3 4/18/2020 802 91 7 4/25/2020 1200 586 12 5/2/2020 2300 919 1.4 million 15 5/9/2020 3767 1244 18 5/16/2020 5856 1957 3.9 million 20 5/23/2020 4537 2645 20 5/30/2020 4208 3004 20 6/6/2020 4572 3303 20 6/13/2020 5565 3618 1.9 million 20 6/20/2020 5796 3992 20 6/27/2020 6180 4433 20

Appendix XII: Accessible Data
Page 505 GAO-21-191
Accessible Data for Number of Filers and Non-Filers Issued an Economic Impact Payment as of September 30, 2020
Filers Non-filers 133,875,411 26,445,782
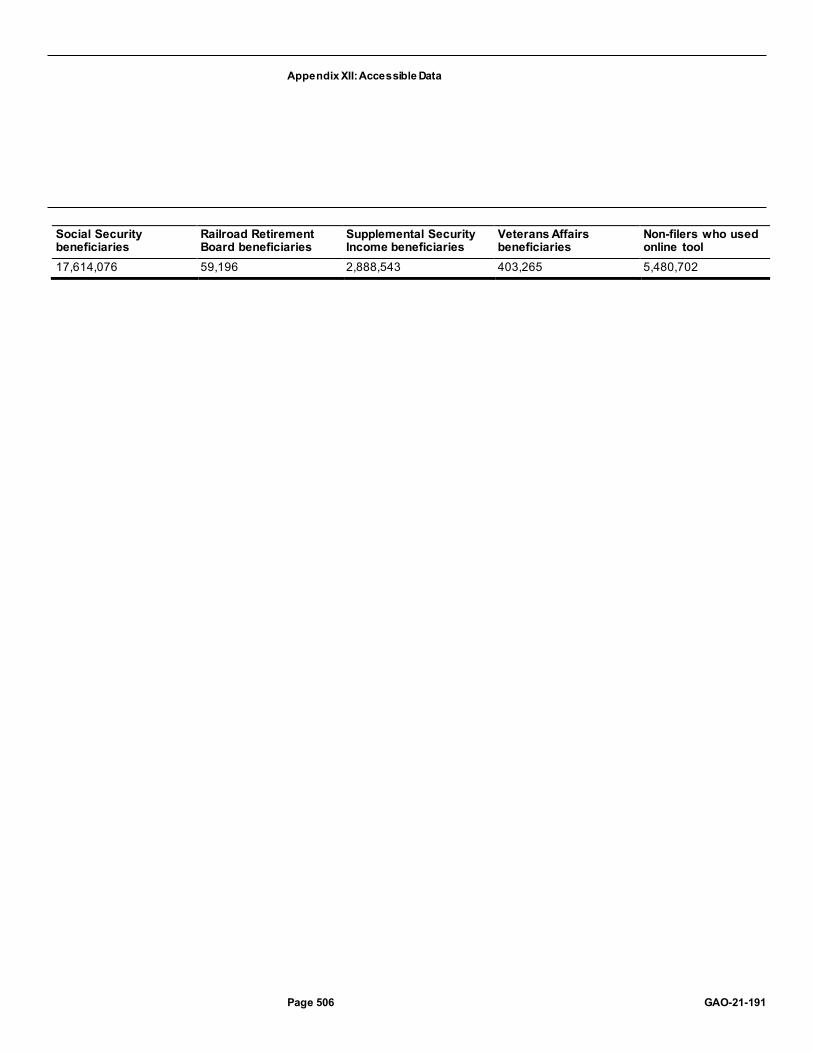
Appendix XII: Accessible Data
Page 506 GAO-21-191
Social Security beneficiaries
Railroad Retirement Board beneficiaries
Supplemental Security Income beneficiaries
Veterans Affairs beneficiaries
Non-filers who used online tool
17,614,076 59,196 2,888,543 403,265 5,480,702

Appendix XII: Accessible Data
Page 507 GAO-21-191
Accessible Data for Number of Non-Filers Who Used IRS Non-Filers Tool to File for and Received an Economic Impact Payment
Category Aug 7 Aug 14 Aug 21 Aug 28 Sep 4 Sep 11 Sep 18 Sep 25 Oct 2 Oct 9 Oct 16 Oct 23 Oct 30 Nov 6 Non-filers (non-government beneficiaries)
46,910 43,412 45,713 29,502 24,677 21,606 26,630 33,312 41,450 109,380 137,844 58,707 99,720 179,500
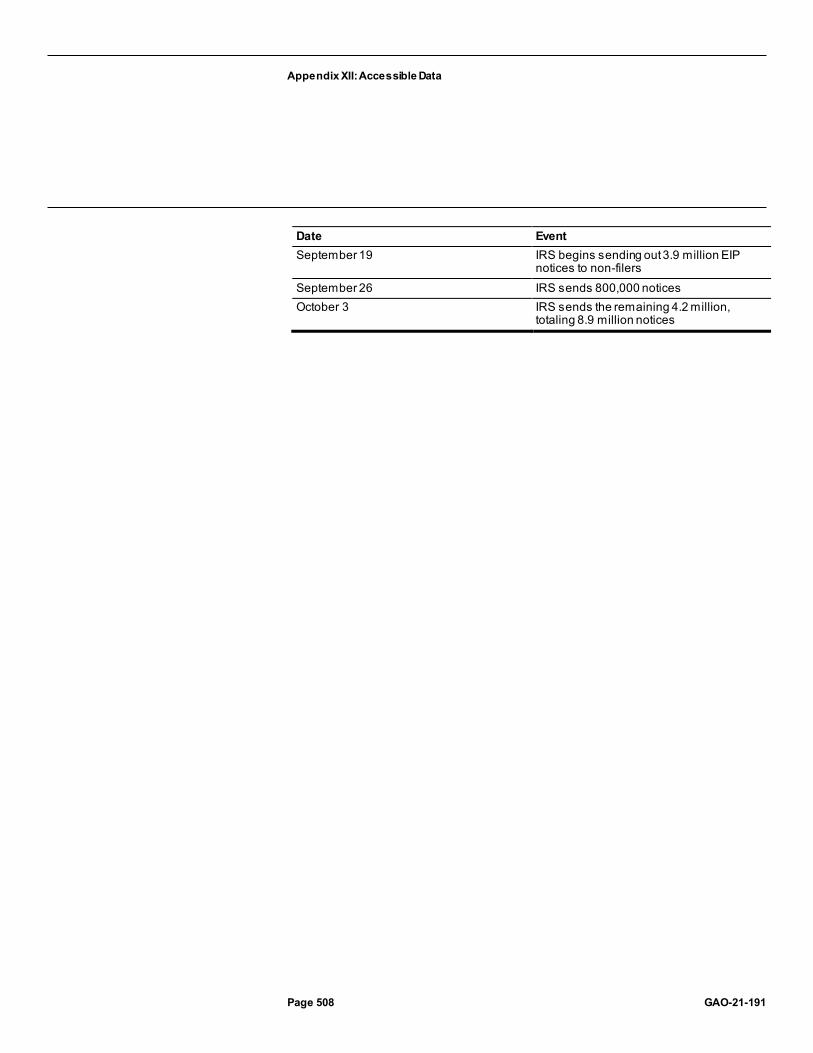
Appendix XII: Accessible Data
Page 508 GAO-21-191
Date Event September 19 IRS begins sending out 3.9 million EIP
notices to non-filers September 26 IRS sends 800,000 notices October 3 IRS sends the remaining 4.2 million,
totaling 8.9 million notices

Appendix XII: Accessible Data
Page 509 GAO-21-191
Accessible Data for Social Security Administration Initial-level Disability Determination Workloads, March 2019 through September 2020
Date Pending claims New claims Claims completed March 2019 550,652 244,241 218,560 April 2019 563,032 196,267 172,977 May 2019 574,029 238,203 215,750 June 2019 587,406 205,413 181,094 July 2019 596,485 189,714 169,369 August 2019 602,771 250,592 234,061 September 2019 593,072 192,061 192,554 October 2019 600,147 189,257 172,420 November 2019 609,204 221,717 202,103 December 2019 605,052 166,439 160,377 January 2020 609,166 218,380 203,633 February 2020 629,924 203,544 171,718 March 2020 656,555 186,202 148,063 April 2020 692,920 197,069 146,825 May 2020 726,946 202,040 148,243 June 2020 768,611 173,141 114,490 July 2020 798,281 208,302 160,853 August 2020 812,585 173,788 146,487 September 2020 762,905 159,179 195,942
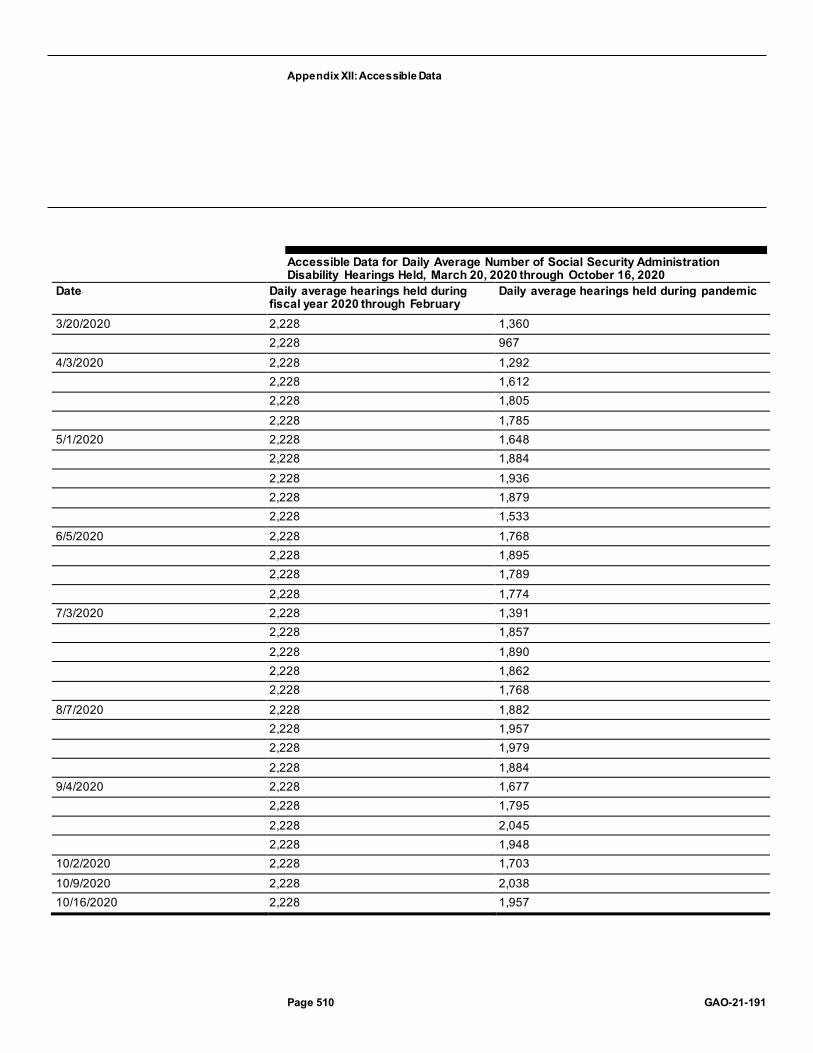
Appendix XII: Accessible Data
Page 510 GAO-21-191
Accessible Data for Daily Average Number of Social Security Administration Disability Hearings Held, March 20, 2020 through October 16, 2020
Date Daily average hearings held during fiscal year 2020 through February
Daily average hearings held during pandemic
3/20/2020 2,228 1,360 2,228 967
4/3/2020 2,228 1,292 2,228 1,612 2,228 1,805 2,228 1,785
5/1/2020 2,228 1,648 2,228 1,884 2,228 1,936 2,228 1,879 2,228 1,533
6/5/2020 2,228 1,768 2,228 1,895 2,228 1,789 2,228 1,774
7/3/2020 2,228 1,391 2,228 1,857 2,228 1,890 2,228 1,862 2,228 1,768
8/7/2020 2,228 1,882 2,228 1,957 2,228 1,979 2,228 1,884
9/4/2020 2,228 1,677 2,228 1,795 2,228 2,045 2,228 1,948
10/2/2020 2,228 1,703 10/9/2020 2,228 2,038 10/16/2020 2,228 1,957

Appendix XII: Accessible Data
Page 511 GAO-21-191
Accessible Data for Obligations and Purchases for Each Round of the U.S. Department of Agriculture’s Farmers to Families Food Box Program, as of September 30, 2020
Category Round 1 (May 15 through June 30, 2020)
Round 2 (July 1 through August 31, 2020)
Round 3 (September 1 through October 31, 2020)
Total
Obligations 1.11 billion 1.43 billion 1.45 billion as of 9/30 3.99 billion Purchases (or expenditures) 953 million 1.34 billion 427 million as of 9/30 2.72 billion

Appendix XII: Accessible Data
Page 512 GAO-21-191
Accessible Data for U.S. Department of Agriculture Food Safety and Inspection Service’s Personal Protective Equipment Purchases by Type, Quantity, and Cost, as of September 30, 2020
Category Disposable masks and cloth face coverings
Face shields, attachments, and anti-fog spray kits
Sanitizer, stands, and disinfectant wipesb
Supplies for heat stress (e.g., fluids and cooling pads)d
Quantity 3,507,890 91,636 135,510 8,385 Cost $2,668,263 $811,361a $848,181c $137,043

Appendix XII: Accessible Data
Page 513 GAO-21-191
Accessible Data for Economic Development Administration Grants Awarded with CARES Act Funds by State and U.S. Territory, as of September 30, 2020
Area Number of awards Amount of EDA funds awarded
Alabama 18 $13,543,739 Alaska 12 $8,109,717 American Samoa 1 $2,013,000 Arizona 7 $2,988,000 Arkansas 17 $14,561,000 California 33 $56,043,616 Colorado 12 $4,708,651 Connecticut 6 $6,901,000 Delaware 3 $2,115,000 District of Columbia 1 $351,247 Florida 14 $11,155,987 Georgia 22 $28,539,132 Hawaii 1 $300,000 Idaho 13 $13,436,918 Illinois 18 $12,598,922 Indiana 16 $19,961,031 Iowa 30 $27,114,024 Kansas 11 $6,705,524 Kentucky 14 $24,637,000 Louisiana 13 $10,422,000 Maine 15 $16,219,000 Maryland 7 $4,628,937 Massachusetts 18 $21,406,885 Michigan 19 $10,693,433 Minnesota 23 $27,169,000 Mississippi 19 $27,538,712 Missouri 29 $17,366,399 Montana 23 $16,455,112 Nebraska 9 $5,151,478 Nevada 3 $4,000,000 New Hampshire 4 $2,004,131 New Jersey 6 $15,616,000 New Mexico 13 $7,500,000

Appendix XII: Accessible Data
Page 514 GAO-21-191
Area Number of awards Amount of EDA funds awarded
New York 26 $51,196,261 North Carolina 22 $14,395,204 North Dakota 18 $11,832,507 Ohio 16 $17,848,247 Oklahoma 16 $6,548,428 Oregon 29 $30,664,528 Pennsylvania 21 $44,461,546 Puerto Rico 2 $847,705 Rhode Island 2 $6,798,000 South Carolina 16 $18,505,000 South Dakota 19 $18,384,793 Tennessee 18 $17,884,000 Texas 40 $29,555,762 Utah 13 $7,675,230 Vermont 5 $2,956,000 Virginia 16 $18,167,820 Washington 19 $26,569,448 West Virginia 15 $18,953,600 Wisconsin 20 $19,569,571 Wyoming 1 $550,000 TOTAL 784 $805,318,244

Appendix XII: Accessible Data
Page 515 GAO-21-191
Accessible Data for Paycheck Protection Program (PPP) Loan Forgiveness Process Time Frames
Date Milestone July16 to August 8, 2020 PPP loan to borrower December 31, 2020 End of covered period for PPP loans
disbursed after July15, 2020 October 31, 2021 Loan forgiveness applications must be
submitted by borrowers within 10 months of the covered period end [or the borrower has to begin making payments]
December 30, 2021 Lender reviews and submits forgiveness decision to SBA within 60 days
na Borrower may request SBA review of lender decision to fully deny forgiveness within 30 days
March 30, 2022 SBA reviews lender decision and remits appropriate forgiveness amount within 90 days
Late April or early May 2022 Borrower may appeal SBA’s loan forgiveness decision within 30 calendar days of notice of that decision

Appendix XII: Accessible Data
Page 516 GAO-21-191
Accessible Data for Average Dollar Amount of Economic Injury Disaster Loans Relative to the Total Number of Small Businesses in Each State, as of October 4, 20204
State Loan Amt / Businesses California $8,240.25 New York $7,811.44 New Jersey $7,738.20 District of Columbia $7,565.91 Nevada $7,464.30 Florida $7,404.45 Hawaii $7,318.52 Georgia $7,029.10 Louisiana $6,859.22 Washington $6,086.88 Alaska $6,072.77 Connecticut $5,917.33 Delaware $5,914.60 Texas $5,756.44 Illinois $5,585.48 Maryland $5,541.59 Arizona $5,363.34 Oregon $5,361.51 Rhode Island $5,350.33 South Dakota $5,186.23 North Dakota $5,071.91 Virginia $5,049.58 Michigan $4,983.67 New Mexico $4,979.38 South Carolina $4,977.79 Massachusetts $4,965.04 Alabama $4,930.91 New Hampshire $4,835.22 Mississippi $4,833.95 Colorado $4,815.81 Oklahoma $4,768.65 Pennsylvania $4,706.53 Nebraska $4,591.80

Appendix XII: Accessible Data
Page 517 GAO-21-191
State Loan Amt / Businesses Wyoming $4,557.77 Utah $4,544.82 North Carolina $4,534.69 Vermont $4,356.05 Montana $4,323.28 Minnesota $4,296.69 Ohio $4,200.74 Wisconsin $4,150.52 Kansas $4,124.23 Tennessee $4,019.44 Arkansas $3,973.44 Idaho $3,964.00 Maine $3,935.23 Missouri $3,900.30 Indiana $3,767.96 Iowa $3,713.97 West Virginia $3,635.06 Kentucky $3,527.67

Appendix XII: Accessible Data
Page 518 GAO-21-191
Accessible Data for Amtrak Ridership Actuals and Forecast, October 2018–September 2021
Date Northeast Corridor State Supported Short Distance
Long Distance
Oct-18 1.14751e+06 1.311e+06 351278 Nov-18 1.13873e+06 1.35111e+06 386630 Dec-18 958839 1.29172e+06 420257 Jan-19 884396 1.08678e+06 316442 Feb-19 851745 1.0343e+06 275379 Mar-19 1.03066e+06 1.2796e+06 378076 Apr-19 1.07668e+06 1.28453e+06 366061 May-19 1.11873e+06 1.32454e+06 402384 Jun-19 1.10545e+06 1.33074e+06 427550 Jul-19 1.06645e+06 1.4348e+06 465578 Aug-19 1.06196e+06 1.43922e+06 429036 Sep-19 1.08448e+06 1.27047e+06 336163 Oct-19 1.16776e+06 1.34246e+06 344796 Nov-19 1.11209e+06 1.32054e+06 353632 Dec-19 1.06412e+06 1.37879e+06 416254 Jan-20 907128 1.18576e+06 305444 Feb-20 897431 1.10153e+06 276474 Mar-20 382444 551727 194161 Apr-20 18734 54048 48358 May-20 31992 91530 90385 Jun-20 82454 182698 151901 Jul-20 138326 246843 175278 Aug-20 160498 263633 165040 Sep-20 190850 289390 168730 Oct-20 184496 284813 167776 Nov-20 193000 264200 71700 Dec-20 177100 267000 80800 Jan-21 150000 231800 61900 Feb-21 148600 206400 53000 Mar-21 214900 336000 79900 Apr-21 270800 390900 87200 May-21 310600 445600 96800 Jun-21 361700 521100 108800

Appendix XII: Accessible Data
Page 519 GAO-21-191
Date Northeast Corridor State Supported Short Distance
Long Distance
Jul-21 383800 602500 127500 Aug-21 413000 639200 121000 Sep-21 426400 569300 99800
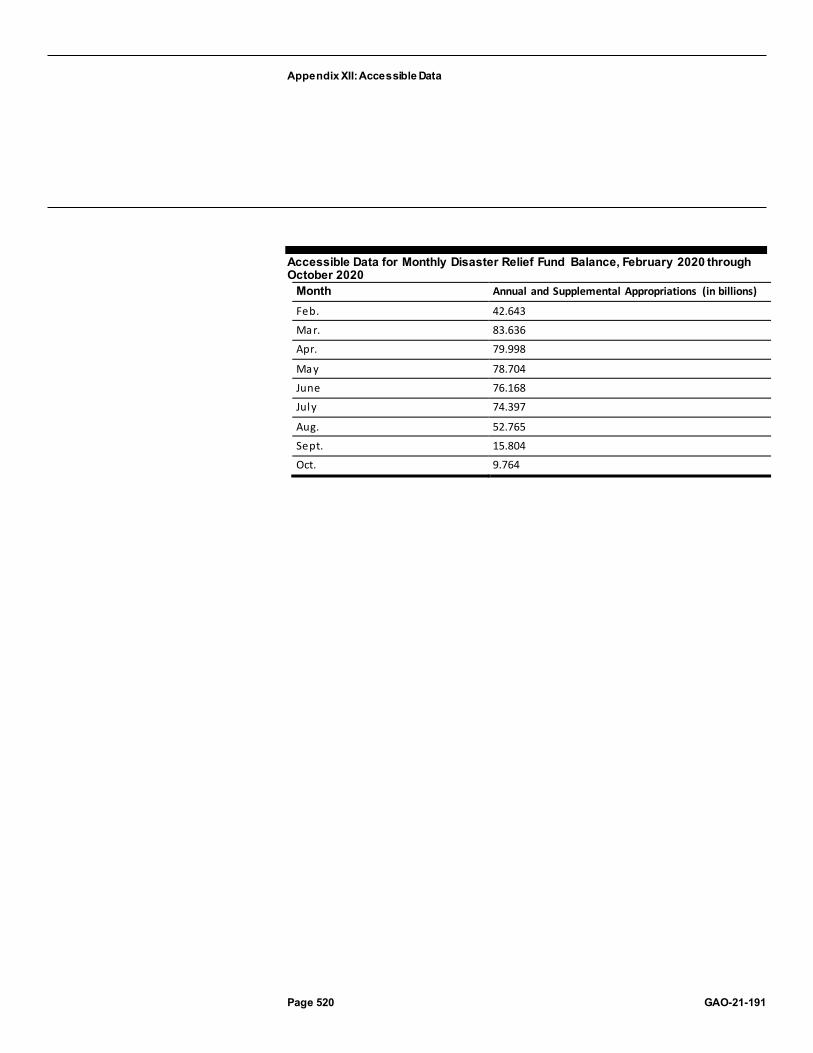
Appendix XII: Accessible Data
Page 520 GAO-21-191
Accessible Data for Monthly Disaster Relief Fund Balance, February 2020 through October 2020
Month Annual and Supplemental Appropriations (in billions)
Feb. 42.643
Mar. 83.636
Apr. 79.998
May 78.704
June 76.168
July 74.397
Aug. 52.765
Sept. 15.804
Oct. 9.764

Appendix XII: Accessible Data
Page 521 GAO-21-191
Accessible Data for FEMA Obligations from the Disaster Relief Fund for COVID-19 by State and Territory, as of October 2020
States and territories Obligations (dollars in millions) Seminole Tribe of Florida 0 American Samoa 2 South Dakota 17 Wyoming 17 Northern Mariana Islands 34 US Virgin Islands 37 Idaho 51 North Dakota 77 Montana 78 Guam 80 Alaska 86 Vermont 107 Delaware 108 Utah 120 New Hampshire 132 West Virginia 159 Arkansas 159 Maine 160 Nebraska 180 Kansas 185 Kentucky 239 Rhode Island 253 District of Columbia 280 New Mexico 301 Mississippi 319 Oklahoma 339 Wisconsin 351 Alabama 368 Iowa 398 South Carolina 442 Hawaii 476 Missouri 477 Connecticut 501

Appendix XII: Accessible Data
Page 522 GAO-21-191
States and territories Obligations (dollars in millions) Nevada 514 Indiana 547 Oregon 572 Minnesota 611 Tennessee 623 Virginia 785 Colorado 790 Puerto Rico 803 North Carolina 945 Maryland 979 Arizona 1,218 Washington 1,336 Massachusetts 1,353 Louisiana 1,362 Ohio 1,527 Illinois 1,650 Florida 1,742 Georgia 1,859 New Jersey 1,981 Michigan 2,159 Pennsylvania 2,918 Texas 5,702 New York 6,012 California 9,628

Appendix XII: Accessible Data
Page 523 GAO-21-191
Accessible Data for COVID-19 Obligations from the Disaster Relief Fund by Program or Activity, as of September 2020
Category Dollar amount Percentage Individual Assistance $42,143 million 80% Public Assistance $6,058 million 11% Mission Assignments $4,319 million 8% Administrative cost $161 million <1%

Appendix XII: Accessible Data
Page 524 GAO-21-191
Accessible Data for Four Federal Agencies Tasked with the Most Mission Assignments
Support: Total mission assignments
Personnel percent
Medical facilities percent
other percent
USACE 135 56% 10% 33% HHS 161 35% 19% 44% VA 169 67% 0% 33% DOD 524 54% 3% 43%
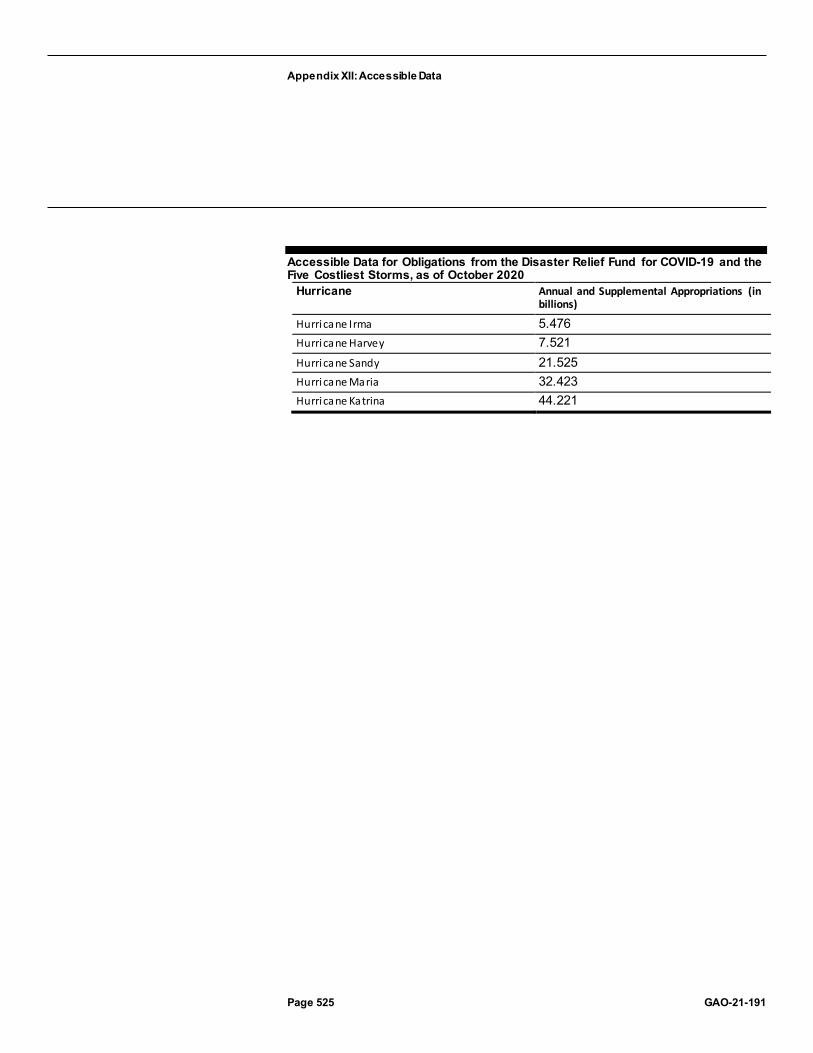
Appendix XII: Accessible Data
Page 525 GAO-21-191
Accessible Data for Obligations from the Disaster Relief Fund for COVID-19 and the Five Costliest Storms, as of October 2020
Hurricane Annual and Supplemental Appropriations (in billions)
Hurricane Irma 5.476 Hurricane Harvey 7.521 Hurricane Sandy 21.525 Hurricane Maria 32.423 Hurricane Katrina 44.221

Appendix XII: Accessible Data
Page 526 GAO-21-191
Accessible Data for Contract Obligations in Response to COVID-19 by Federal Agency, as of October 15, 2020
Department Dollars (in millions) Department of Health and Human Services 12892.2 Department of Defense 8909.0 Department of Veterans Affairs 2868.6 Department of Agriculture 2733.2 Department of Homeland Security 1865.7 Small Business Administration 1306.5 U.S. Agency for International Development 870.4 Department of Energy 385.1 Department of State 314.9 Department of Commerce 311.4 Other 37 agencies 985.1

Appendix XII: Accessible Data
Page 527 GAO-21-191
Accessible Data for Government-wide Contract Obligations Related to COVID-19 by Week, February–October 2020
Date Contract obligations (in millions) 2-Feb 0.2 9-Feb 4.3 16-Feb 2.2 23-Feb 6.5 1-Mar 4.5 8-Mar 38.4 15-Mar 312.9 22-Mar 911.4 29-Mar 2428.8 5-Apr 2269.1 12-Apr 2321.7 19-Apr 1633.9 26-Apr 1438.7 3-May 1550.7 10-May 1916.2 17-May 801.5 24-May 1107.6 31-May 591.9 7-Jun 432.7 14-Jun 367.2 21-Jun 1820.8 28-Jun 241.2 5-Jul 452.1 12-Jul 993.6 19-Jul 827 26-Jul 1245.8 2-Aug 549.9 9-Aug 1854.8 16-Aug 584.6 23-Aug 400.7 30-Aug 1033.5 6-Sep 594.5 13-Sep 2041.5

Appendix XII: Accessible Data
Page 528 GAO-21-191
Date Contract obligations (in millions) 20-Sep 1298.1 27-Sep 1210.1 4-Oct 104.3 11-Oct 47.1

Appendix XII: Accessible Data
Page 529 GAO-21-191
Date Key events along timeline 13-Mar-20 President declares a national emergency under the National
Emergencies Act and the Stafford Act 18-Mar-20 President issues first Executive Order to utilize the Defense Production
Act of 1950 20-Mar-20 President approves the first major disaster declaration, under the
Stafford Act, for New York. 21-Mar-20 Federal Emergency Management Agency begins co-leading the federal
COVID-19 response with Health and Human Services 27-Mar-20 U.S. surpasses 100,000 confirmed COVID-19 cases 11-Apr-20 All 50 states, the District of Columbia, and four territories have approved
major disaster declarations 28-Apr-20 U.S. surpasses 1 million confirmed COVID-19 cases 8-Jul-20 U.S. surpasses 3 million confirmed COVID-19 cases 9-Aug U.S. surpasses 5 million confirmed COVID-19 cases 25-Sep U.S. surpasses 7 million confirmed COVID-19 cases

Appendix XII: Accessible Data
Page 530 GAO-21-191
Accessible Data for Contract Obligation Amounts for Goods and Services Most Procured in Response to COVID-19, as of October 15, 2020
Goods and services Dollars (in millions)
Medical equipment and supplies 8252.4 Fruits and vegetables 1924.4 Drugs and biologicals 1870.2 Other professional support 1410.2 Hospital and surgical clothing 1291.2 Laboratory equipment and supplies 1195.4 Laboratory testing 984.4 Advanced biomedical research 874.6 Financial management support services 851.7 Engineering support services 698.5

Appendix XII: Accessible Data
Page 531 GAO-21-191
Accessible Data for Monthly U.S. Imports of Categories Containing COVID-19-Related Products by Type, January 2019–August 2020
Year Month Medicines (pharmaceuticals) – dollars, in millions
Non-personal protective equipment, medical consumables and hospital supplies (dollars, in millions)
Other (dollars, in millions)
Personal protective equipment (dollars, in millions)
Testing kits / testing equipment (dollars, in millions)
2019 Jan 6367 1929 2833 937 2181
2019 Feb 5017 1690 2798 803 1356
2019 March 5921 1690 3151 780 2564
2019 Apr 7140 1747 3137 831 2241
2019 May 6478 1863 3258 901 1686
2019 June 6525 1729 3018 830 1624
2019 July 7253 1933 3300 904 2544
2019 Aug 6684 1829 3140 878 2782
2019 Sept 6770 1704 3116 842 1834
2019 Oct 7329 1774 3294 861 1774
2019 Nov 7121 1598 2983 788 1953
2019 Dec 6164 1666 3035 805 2125
2020 Jan 6748 1806 2976 871 2561
2020 Feb 6762 1574 3016 754 1737
2020 March 7728 1562 3172 790 3539
2020 Apr 8240 1722 3061 2658 2438
2020 May 7047 1583 3297 4936 2350
2020 June 7127 1771 3593 4617 3067
2020 July 6628 1952 3670 4275 2075
2020 August 6948 1941 3588 3675 3465

Appendix XII: Accessible Data
Page 532 GAO-21-191
Accessible Data for Example Timeline for Newly Established COVID-19 Programs’ Reporting of Improper Payment Estimates
Date Event March 2020 New COVID-19 programs established March 2021 Agencies may begin conducting improper payment risk assessments
for new programs November 2021 Agencies report results of risk assessments November 2022 Agencies report their first improper payment estimates for new
programs deemed susceptible to significant improper payments Beyond fiscal year 2023
Agencies report improper payment estimates annually until funds are fully expended or the programs are no longer deemed susceptible

Appendix XII: Accessible Data
Page 533 GAO-21-191
Agency Comment Letters
Accessible Text for Appendix IV: Comments from the Department of Health and Human Services
Page 1
November 4, 2020
A Nicole Clowers Managing Director, Health Care U.S. Government Accountability Office 441 G Street NW Washington, DC 20548
Dear Ms. Clowers:
Attached are comments on the U.S. Government Accountability Office' s (GAO) report entitled, "COVID-19: Urgent Actions Needed to Better Ensure an Effective Federal Response" (Job code I0435l/GAO-21-191 ).
The Department appreciates the opportunity to review this report prior to publication.
Sincerely,
Sarah C. Arbes Assistant Secretary for Legislation
Attachment
Page 2
GAO Recommendation
In light of reported shortages, including GAO's nationwide survey findings, GAO underscores the critical imperative for HHS and FEMA to implement its September 2020 recommendations.

Appendix XII: Accessible Data
Page 534 GAO-21-191
HHS Response
As when this recommendation was first made in the September CARES Act report (GAO-20- 701), HHS appreciates the feedback GAO has provided and welcomes the opportunity to consider any recommendations it may have that would improve the execution of its mission. That said, HHS does not concur with the recommendation as currently stated.
GAO's recommendation suggesting that HHS currently lacks a comprehensive supply management plan remains incorrect. In response to the pandemic, HHS, FEMA, and other federal partners launched the most comprehensive supply management effort undertaken by our nation since World War II, and developed the most sophisticated and comprehensive database for supply chain logistics our nation has ever had. Through these efforts, the Administration has been highly successful in identifying gaps in supply needs across the nation, and taking swift action to ensure those needs are met. The Supply Chain Task Force (SCTF) orchestrated a comprehensive four pronged strategy to preserve medical supplies, accelerate industrial manufacturing and distribution, expand industry, and allocate resources to the right place at the right time. Any fair assessment of nationwide supply data shows that the SCTF's effort have been remarkably successful. Particularly in light of GAO's own survey data reporting no acute shortages in medical and testing supplies.
Even though GAO's data showed no state or jurisdiction reported acute shortages of any medical or testing supplies, GAO stated that between 7 to 10 unnamed states anticipate shortages in certain categories of testing supplies. This assertion lacks transparent evidentiary support and is too vague to guide how HHS can improve in its efforts to assist states in meeting their medical and testing supply needs. HHS cannot assess or independently validate GAO's findings and related recommendations regarding the medical supply chain based on the minimal supporting information provided in the report. Not only has GAO declined to identify the states that anticipate supply shortages, each "[t]esting supply type" listed by GAO for purported future shortages encompasses equipment and products of different makes and models from multiple manufacturers. Without access to GAO's 50 state survey and other information GAO relied on, GAO's findings are of negligible value to HHS and the other Executive Branch agencies responsible for the federal response to COVID-19.

Appendix XII: Accessible Data
Page 535 GAO-21-191
Throughout the COVID-19 response there has been a pattern of states requesting materials that substantially exceed their expected needs. Some states have also attempted to procure material from the Strategic National Stockpile (SNS), which is provided without charge, for their own long-term stockpiling rather than for immediate use as a stop-gap measure. HHS-ASPR believes FEMA experiences a similar phenomenon, as states are responsible for only 25% of the cost of material provided by FEMA. Simply put, anonymous reports from 7-10 unnamed states indicating that they anticipate shortages of certain categories of medical and testing supplies does not warrant an overhaul of the Administration's supply chain management. To the contrary, the fact that no state has current supply deficiencies signals that HHS and its federal partners are
Page 3
properly managing supply disbursement and ensuring that federal supplementation resources are flowing to meet actual needs.
GAO's refusal to allow HHS access to the data it collects in preparing CARES Act reports limits the practical utility of CARES Act reports. Following the September CARES Act report, HHS specifically asked GAO to share information it received from anonymous state employees in 8 states who allegedly reported minor and temporary supply chain coordination issues on which GAO based 3 recommendations. HHS engages with state, local, and tribal partners on supply challenges regularly. However, states, localities, and private hospital systems have always had primary responsibility for meeting supply needs, and the federal government has always played a supporting, supplementation role. Without basic information from GAO regarding the specific shipments reportedly at issue or job descriptions for the anonymous state employees, HHS cannot determine whether federal or state officials were responsible for the alleged coordination failures.
The unprecedented challenges caused by the COVID-19 pandemic led HHS and its federal partners to execute an unprecedentedly comprehensive effort to obtain and understand nationwide supply chain data, to enhance the production and procurement of supplies, and to execute supply chain logistics to distribute supplies to fill identified gaps. This Administration is proud of the work it has done to identify and fill gaps in state and local response, and to support the response efforts that have been managed and executed at the state and local level. According to GAO's own survey of supply chain results, the approach taken by HHS and this Administration is working.

Appendix XII: Accessible Data
Page 536 GAO-21-191
In addition to meeting the current needs of states, the Administration has also grown the SNS. As of November 5, 2020, the SNS predicts its end of year inventory to reach approximately: 273,000,000 N95s, 436,000,000 masks, 19,080,000 face shields, 265,000,000 gowns,
4,500,000,000 gloves, and 152,000 ventilators.
GAO Recommendation The Secretary of Health and Human Services should direct the FDA Commissioner to identify ways to consistently communicate the information from FDA's scientific review of safety and effectiveness data- similar to the summary review memo for new drugs- when issuing EUAs for therapeutics and vaccines, and if necessary, seek authority to publicly disclose such information.
FDA Response FDA shares GAO's goal of being as transparent as possible with the public about the Agency's review of the safety and effectiveness data that supports the issuance of an EUA for a drug or biological product. FDA believes that disclosing such information from its clinical review memoranda supporting the issuance of EUAs for therapeutics and vaccines, similar to what FDA discloses from its approval packages for new drugs and biologics, will contribute to the public's confidence in the Agency's rigorous, independent review of the scientific data available and will help the Agency achieve its transparency goal. To that end, FDA will explore approaches for greater transparency in this area, including considering whether additional authorities are needed.
GAO Recommendation
Page 4
The Secretary of Health and Human Services should ensure that the Director of the Centers for Disease Control and Prevention clearly disclose the scientific rationale for any change to testing guidelines at the time the change is made.
CDC Response HHS concurs with GAO's recommendation.
CDC typically consults with our scientific experts- state, city, and locality partners and other stakeholders- regarding scientific recommendations

Appendix XII: Accessible Data
Page 537 GAO-21-191
and considerations. We will continue to evaluate our processes surrounding new or updated guidance.
GAO Recommendation: The Administrator of the Centers for Medicare & Medicaid Services should quickly develop a plan to respond to and implement, as appropriate, the 27 recommendations in the final report of the Coronavirus Commission on Safety and Quality in Nursing Homes, which CMS released on September 16, 2020. Such a plan should include milestones that allow the agency to track and report on the status of each recommendation; should identify actions taken and planned, including areas where CMS determined not to take action; and should identify areas where CMS can coordinate with other federal and nonfederal entities.
CMS response: Safeguarding the health and wellbeing of our most vulnerable citizens is a top priority for CMS. As detailed in the table describing CMS's public response to each of the Commission's recommendations, released the day the Commission's report became public (posted at https://edit.cms.gov/files/document/covid-independent-nursing-home-covid-19 -federalresponse.pdf), we have already taken significant steps to implement virtually all of the Commission's findings that are within CMS's purview. For example, since March, the Administration has conducted weekly calls with nursing homes and established a National Nursing Home COVID-19 Training program focused on infection control and best practices. To further support nursing homes financially during this challenging time, the Administration distributed over $21 billion to America's nursing homes - more than $1.5 million each on average. To ensure nursing homes had access to supplies, the Administration shipped a 14-day supply of personal protective equipment (PPE) to more than 15,000 nursing homes across the nation in May. CMS has also required facilities to report data about COVID-19 cases, deaths, and supply levels, with 99.3 percent of facilities currently reporting as of mid-September .
CMS took action to keep COVID-19 out of nursing homes by requiring them to test staff, a requirement that was paired with the Administration's offer of point-of-care testing devices to America's approximately 15,500 nursing homes with a Clinical Laboratory Improvement Amendments certificate of waiver. Ultimately the Administration distributed 13,850 devices. As of mid-October, the Administration has also deployed federal Task Force Strike Teams in ten waves, in 28 states so far, to 90 facilities particularly affected by COVID-19 to share best practices and gain a
Appendix XII: Accessible Data
Page 538 GAO-21-191
deeper understanding of how the virus spreads. CMS also required states to conduct focused infection control inspections at their nursing homes; as of September, states completed these inspections at essentially all (99.9 percent) of their Medicare and Medicaid
Page 5
certified nursing homes. Recognizing that physical separation from family and other loved ones has taken a significant toll on nursing home residents, CMS also issued revised guidance in September that would enable nursing homes to begin resuming visitation in a safe way. This includes both indoor and outdoor settings and in compassionate care situations. The guidance also outlines certain core principles and best practices to reduce the risk of COVID-19 transmission to adhere to during visitations. CMS is committed to keeping nursing home residents safe, and intends to continually refer to and act upon the Commission's recommendations as appropriate.

Appendix XII: Accessible Data
Page 539 GAO-21-191
Accessible Text for Appendix V: Comments from the Department of Housing and Urban Development
Page 1
November 4, 2020
Mr. Gene L. Dodaro, Comptroller General of the United States
U.S. Government Accountability Office
441 G Street NW
Washington, DC 20548
Dear Mr. Dodaro,
Thank you for providing the Department of Housing and Urban Development (HUD) the opportunity to review and comment on the U.S. Government Accountability Office's (GAO) draft Report, Urgent Actions Needed to Better Ensure an Effective Federal Response (the Report). We appreciate the GAO's efforts related to conducting its review of HUD's implementation and oversight of over $12 billion in CARES Act funding to HUD programs for purposes of providing additional resources to prevent, prepare for, and to respond to housing needs related to COVID-19. After review of the GAO's draft Report, we have identified areas related to the Key Issues noted by the GAO for which we would like to provide additional context.
Within the Overview of Key Issues section of its draft Report, the GAO reported that only 1 percent of the $9 billion appropriated to Community Development Block Grant - Coronavirus (CDBG-CV) and Emergency Solutions Grants - Coronavirus (ESG-CV) had been expended as of September 2020. Funding for Community Planning and Development (CPD) has a long period of availability that can range from 3 to 6 years for different accounts. Our funds for ESG are available for 3 years and grantees are strategic in how they use funds for the same purpose, with consideration to differing expiration dates. In addition, many grantees do not develop a plan until HUD's notice, which includes detail plan requirements, is published. In this instance, funding notices were published for CARES Act ESG funds on September 1, 2020. Accordingly,

Appendix XII: Accessible Data
Page 540 GAO-21-191
we anticipate that the expended amounts will begin to increase in the coming months.
Additionally, the GAO noted that some CPD grantees may have limited capacity to quickly spend a large increase in funding. To assist grantees with this, HUD has implemented Technical Assistance (TA) activities. Specifically, HUD Special Needs Assistance Programs (SNAPS) provided direct intensive COVID-19 health and safety related TA (provided in close collaboration with CDC) to over 40 high-need geographic areas; conducted twelve (12) training webinars; offered 28 weeks of SNAPS weekly office hours; and developed more than 100 TA products, including a toolkit to help grantees avoid duplicating benefits between programs. In addition, HUD has provided up to 32 hours of on-call TA for any designated
Page 2
staff to quickly respond to ESG-CV grantees; delivered direct intensive TA to 17 state and territory ESG recipients; provided direct intensive TA to over 30 ESG entitlement jurisdictions and corresponding Continuum of Care (CoCs) in high-need geographic areas; shared active Ask-A-Question Help Desk responses; and conducted five rounds of COVID-19 related five-week intensive workshops that Feached a total of more than 300 ESG recipients and CoCs.
Lastly, regarding HUD staffing, hiring efforts are ongoing and appointments utilizing the specific temporary authority granted under the CARES Act must be made by December 31, 2020. Of the 96 positions approved under the CARES Act funding, 79 recruitment requests have been submitted and 40 of the individuals are already on-boarded. Of the remaining 39 requests in- process, 16 already have a selection.
HUD remains committed to fulfilling its mission of creating strong, sustainable, inclusive communities and quality affordable homes for American families and individuals, while also responding to the impacts of COVID-19 on housing. We acknowledge the importance of recognizing that there may be opportunities to improve Federal response and recovery efforts. The HUD CARES Act Compliance and Response Team (HCCRT) will continue to integrate across the

Appendix XII: Accessible Data
Page 541 GAO-21-191
Department to facilitate progress on overcoming challenges and providing comprehensive and timely compliance monitoring.
Sincerely,
Irving L. Dennis
Chief Financial Officer
cc:
Brian Montgomery, Deputy Secretary
Andrew Hughes, Chief of Staff
Hunter Kurtz, Assistant Secretary for Public and Indian Housing
John Gibbs, Acting Assistant Secretary for Community Planning and Development
Monica Matthews, Chief Human Capital Officer
Michael Williams, Office of General Counsel
George Tomchick, Deputy Chief Financial Officer
MelaJo Kubacki, Assistant Chief Financial Officer for Financial Management

Appendix XII: Accessible Data
Page 542 GAO-21-191
Accessible Text for Appendix VI: Comments from the Internal Revenue Service
Page 1
November 4, 2020
Mr. James R. McTigue, Jr. Director , Tax Issues, Strategic Issues Team U.S. Government Accountability Office 441 G Street, N.W. Washington, D.C. 20548
Dear Mr. McTigue:
On behalf of the Commissioner and the Senior Leadership team at the Internal Revenue Service, thank you for the opportunity to review your draft report titled: COVID-19: Urgent Actions Needed to Better Ensure an Effective Federal Response (GAO-21-191).
On March 27, 2020, the President signed the Coronavirus Aid, Relief, and Economic Security (CARES) Act into law. The CARES Act mandates payment of Economic Impact Payments (EIPs) to eligible recipients "as rapidly as possible." The CARES Act requirement that we base such payments on 2019 or 2018 tax returns or payment information for certain federal benefits facilitated the rapid delivery of these payments . We are extremely proud of our employees , many who worked around the clock to provide EIPs, ensuring fiscal relief to people affected by the pandemic. The CARES Act provided for a payment of $1,200 to each eligible individual and $500 for dependent children under the age of 17. Through the dedication of our workforce, IRS sent more than 160 million stimulus payments totaling approximately $270 billion to eligible individuals.
The COVID-19 global pandemic illustrates the significant role that the IRS plays in the overall health of our country. Not only were we called upon to provide much needed economic relief to individuals and businesses, but we did so in the midst of Filing Season 2020, when we had to temporarily scale back operations to protect the health and safety of both IRS employees and taxpayers. Even with our reduced operations, the IRS continued to successfully deliver the tax filing season, by processing

Appendix XII: Accessible Data
Page 543 GAO-21-191
electronic tax returns, issuing direct deposit tax refunds and accepting electronic payments. Through October 16, 2020, we processed more than 159 million returns and issued almost 123 million refunds totaling over $305 billion.
While the vast majority of eligible individuals received EIPs safely, securely, quickly , and accurately, we have taken unprecedented steps to ensure all eligible recipients could fully access the important relief offered through this program. The IRS has
Page 2
conducted a sweeping outreach, education and media campaign for months, one of the biggest campaigns we've ever done, to help people understand their eligibility. We have reached out beyond our usual tax administration contacts to organizations representing lower-income, military, veteran, retired, limited English proficient and homeless communities around the country and in 35 languages, to make sure people who don't normally file a tax return or receive other federal benefits register for EIPs.
We have also sought assistance from hundreds of local community groups, religious organizations, advocacy organization and various national associations to extend and broaden our reach as far as possible. To support their efforts, we developed a special online toolkit containing helpful information for them to use in identifying and getting the word out to people who may qualify for EIPs. We also provided information regarding a similar online toolkit to every Member of Congress for use in responding to inquiries and helping us reach their constituents. We have supported numerous recent events in partnership with various social service organizations, food banks, and state/local/federal agencies that help people who are experiencing homelessness, or agencies that help people who are underserved, have low income or no income. Also instrumental to this effort are contributions from Low Income Taxpayer Clinics, our Volunteer Income Tax Assistance (VITA) partners, IRS Taxpayer Advocates , and others.
We took the additional step of mailing letters to nearly 9 million people who we think could be eligible for an EIP and urged them to use our Non-Filers Tool by the November 21st deadline to register for a payment. Finally, as part of a last push to encourage everyone who doesn't normally file a tax return to register to receive an EIP, we designated November 10 as "National EIP Registration Day" and worked with

Appendix XII: Accessible Data
Page 544 GAO-21-191
partners across the country to spread the word about the November 21st deadline and provide special support for people who still need to register for the payments.
If, despite these extensive efforts, we have not reached someone who may be eligible and they miss the November deadline to use the Non-Filers Tool, they can still claim the benefit on next year's tax return. We will provide related reminder messages and outreach throughout the 2021 filing season.
To protect the public from scams and other financial schemes involving EIPs, the IRS Criminal Investigation division has issued numerous press releases and has worked with law enforcement agencies domestically and abroad to educate taxpayers about these scams and investigate the criminals perpetrating them during this challenging time.
The IRS has also been working to make sure businesses know about important tax relief available to them, and we continue to provide guidance about business tax relief. The relief measures include:
· Credit for Sick and Family Leave. Eligible employers are entitled to receive a credit in the full amount of the required sick leave and family leave that the law provides to employees dealing with health and family issues related to the coronavirus
Page 3
between April 1 and December 31, 2020. The amount of this credit claimed on returns processed thus far is more than $296 million.
· Employee Retention Credit. This credit is designed to encourage businesses to keep employees on their payroll. The refundable tax credit is 50 percent of up to $10,000 in qualified wages paid by employers financially affected by COVID-19. Qualifying wages - including health plan expenses - are those paid after March 12, 2020 and before January 1, 2021. The amount of this credit claimed on returns processed thus far is more than $2.8 billion.
· Carryback for Net Operating Losses. The CARES Act includes a provision allowing businesses to carry back net operating losses over five years. The IRS has issued Revenue Procedures 2020-23 and 2020-24 and Notice 2020-26 to clarify this provision and help businesses and partnerships take advantage of the relief it provides.

Appendix XII: Accessible Data
Page 545 GAO-21-191
· Implementation of the Presidential Memorandum on employee tax deferral. The IRS, working with Treasury, issued Notice 2020-65 on Aug. 28 implementing the memorandum to provide information to the payroll community, employers and others.
Details pertaining to the recommendations and our response are contained in the attachment.
If you have any questions, please contact me at [email protected].
Thank you.
Sincerely,
Thomas A. Brandt IRS Chief Risk Officer
Attachment

Appendix XII: Accessible Data
Page 546 GAO-21-191
Accessible Text for Appendix VII: Comments from the Department of Labor
Page 1
November 5, 2020
Cindy S. Brown Barnes Director Education, Workforce, and Income Security Issues U.S. Government Accountability Office 441 G. Street, N.W. Washington, D.C. 20548
Dear Ms. Brown Barnes:
Thank you for providing the Department of Labor (Department) with a draft copy of the Government Accountability Office’s (GAO) draft report titled, COVID-19: Urgent Actions Needed to Better Ensure an Effective Federal Response (GAO-21-191). GAO’s report makes the following recommendations for the Department:
· The Secretary of Labor should ensure that the Office of Unemployment Insurance revises its weekly news releases to clarify that in the current unemployment environment, the numbers it reports for weeks of unemployment claimed do not accurately reflect the number of unique individuals claiming benefits. (Recommendation 6)
· The Secretary of Labor should ensure the Office of Unemployment Insurance pursues options to report the actual number of distinct individuals claiming benefits, such as by collecting these already available data from states, starting from January 2020 onward. (Recommendation 7)
The Department agrees with these recommendations, with the exception of the retroactive effective date in Recommendation 7. Regarding Recommendation 6, the Department plans to provide a clarification in its weekly news releases as GAO recommends. With regard to Recommendation 7, the Department notes that the unemployment insurance (UI) provisions of the Coronavirus Aid, Relief, and Economic Security (CARES) Act (P.L.116-136) are set to expire in December 2020. In addition, as GAO itself has noted in its previous reports, state UI

Appendix XII: Accessible Data
Page 547 GAO-21-191
programs face challenges with antiquated data systems and an insufficient level of staff in the midst of historic claims levels, and will face challenges in implementing any new reporting requirements particularly retroactively. We also note that Paperwork Reduction Act requirements to provide notice and comment for this new collection of data are anticipated to
Page 2
take approximately nine months to a year to complete, further reducing the utility of retroactive reporting.
The Department appreciates the opportunity to review and provide feedback on the draft report. Please let me know if you have any questions.
Sincerely,
John Pallasch Assistant Secretary for Employment and Training

Appendix XII: Accessible Data
Page 548 GAO-21-191
Accessible Text for Appendix VIII: Comments from the Small Business Administration
November 4, 2020
William B. Shear Director, Financial Markets and Community Investment Government Accountability Office 441 G Street, NW Washington, DC 20548
Dear Mr. Shear:
I write in regard to the Government Accountability Office’s (“GAO”) draft report entitled COVID-19: Urgent Actions Needed to Better Ensure an Effective Federal Response (“Draft Report”). As you know, the U.S. Small Business Administration (“SBA”) provided technical comments on the Draft Report last week under separate cover. This letter concerns only GAO’s recommendation that SBA should estimate and report on improper payments.
SBA takes improper payments very seriously and works diligently to minimize them in its loan programs. SBA conducts comprehensive improper payment testing in each loan program on an annual basis. SBA is doing the same for the Paycheck Protection Program. As GAO knows from its interviews with SBA senior staff, plans to conduct improper payment testing in the Paycheck Protection Program were underway before GAO made the recommendation in the Draft Report. SBA also is going far beyond simply testing for and estimating improper payments; SBA actively is working to prevent improper payments before they occur through a sophisticated loan review process. SBA is working to protect taxpayer dollars and ensure that the Paycheck Protection Program benefits only eligible borrowers. SBA is pleased that its work in this regard aligns with GAO’s recommendation.
SBA appreciates GAO’s efforts and looks forward to ongoing engagement with GAO on these and other matters.
Sincerely,
William M. Manger

Appendix XII: Accessible Data
Page 549 GAO-21-191
William M. Manger Associate Administrator Office of Capital Access

Appendix XII: Accessible Data
Page 550 GAO-21-191
Accessible Text for Appendix IX: Comments from the Social Security Administration
November 4, 2020
Ms. Elizabeth Curda Director, Education, Workforce, and Income Security Issues United States Government Accountability Office 441 G Street, NW Washington, DC 20548
Dear Director Curda,
Thank you for the opportunity to review the draft report, "COVID-19: Urgent Actions Needed to Better Ensure an Effective Federal Response" (GAO-21-191). Our primary challenge during the pandemic is to maintain service delivery while protecting our employees and the public, many of whom may be at increased risk for serious COVID-19 outcomes.
During your review of our Disability Service Delivery, you noted that Disability Determination Services (DDS) administrators cited challenges with scheduling consultative examinations (CE). While in March 2020 we instructed DDSs to temporarily cancel all CEs due to the impact of the pandemic on the medical community, we issued instructions for safely resuming in-person CEs based on local guidance in May. By the third week in June, 33 DDSs had resumed scheduling in-person CEs, and by September all DDSs were doing so.
In addition, you cited challenges with conducting hearings during the COVID-19 pandemic. Despite organizational and business process shifts that temporarily impacted productivity, we have held over 270,000 telephone hearings and continued to reduce the average wait time and number of pending hearings each month since March 2020. We ended fiscal year 2020 with a national average wait time of 386 days, only 6 days short of our goal of 380 days.
If you have any questions, please contact me at (410) 965-9704. Your staff may contact Trae Sommer, Director of the Audit Liaison Staff, at (410) 965-9102.
Sincerely,

Appendix XII: Accessible Data
Page 551 GAO-21-191
Stephanie Hall Chief of Staff
Appendix XII: Accessible Data
Page 552 GAO-21-191
Accessible Text for Appendix X: Comments from the Department of the Treasury
Page 1
November 6, 2020
Jessica Lucas-Judy Director, Tax Issues Government Accountability Office 441 G Street, NW Washington, DC 20548
Dear Ms. Lucas-Judy:
I write in regard to the Government Accountability Office's (GAO) draft report entitled COVID- 19: Urgent Actions Needed to Better Ensure an Effective Federal Response (Draft Report). The U.S. Department of the Treasury appreciates GAO's efforts and has provided technical comments under separate cover.
The bipartisan CARES Act-the largest economic relief package in American history-was enacted to provide emergency assistance in response to the unprecedented challenges presented by the COVID-19 public health emergency. In the eight months since the CARES Act became law, Treasury has played a major role in implementing many of its core provisions, including Economic Impact Payments (EIPs); Federal Reserve lending facilities; assistance to the aviation industry, including the Payroll Support Program (PSP); the Coronavirus Relief Fund; and the Paycheck Protection Program. These efforts have had a tremendous positive impact on the economy, contributing to increases in jobs, retail sales, business activity, and home sales.
The Draft Report makes two recommendations to Treasury. First, with respect to EIPs, the Draft Report calls for Treasury, in coordination with the Internal Revenue Service (IRS), to immediately begin tracking and publicly reporting the number of individuals who were mailed an EIP notification letter and ultimately received an EIP and use that information to inform outreach and communication efforts. Treasury fully shares the recommendation's underlying goal of encouraging as many non-filers as possible to claim their EIPs online before the non-filer portal closes on November 21, 2020. Indeed, the IRS has undertaken one of the most

Appendix XII: Accessible Data
Page 553 GAO-21-191
extensive public awareness campaigns in its history with respect to EIPs. Most recently, it has designated November 10, 2020, as National EIP Registration Day, in a push to encourage non-filers to meet the November 21 deadline. Treasury has also created and shared state-by-state and ZIP Code by-ZIP Code counts of individuals who were mailed a notice, in order to assist the IRS's outreach partners in appropriately scaling and targeting their outreach and communication efforts to individuals who may be eligible for an EIP. These counts are also publicly available on the IRS website.1 The IRS will continue to perform outreach well into the 2021 filing season, when
1 See https://www.irs.gov/newsroom/irs-releases-state-by-state-breakdown-of-nearly-9-million-non-filers-who-will be-mailed-letters-about-economic-impact-payments, and https://www.irs .gov/pub/irs-utl/number-of-eip-letter recipients-by-state-and-zip-code.xlsx.
Page 2
eligible EIP recipients who have not previously claimed a payment may claim a recovery rebate credit on their Tax Year 2020 return.
Treasury intends to begin tracking and publicly reporting the number of individuals who were mailed an EIP notification letter and subsequently filed for and received an EIP. Beginning in January 2021, Treasury expects to use that information to inform outreach and communication efforts so that all individuals eligible for an EIP receive an EIP.
The Draft Report's second recommendation to Treasury calls for the development and implementation of a compliance monitoring system that identifies and responds to risks of noncompliance with Payroll Support Program (PSP) agreement terms. Treasury agrees that compliance monitoring is a critical element of the PSP, and Treasury structured the PSP to enable it to oversee program participants' compliance and to take action in the event of violations. The PSP agreement that Treasury required every participant to execute mandates extensive regular reporting to Treasury or other relevant oversight bodies, and it enables Treasury to take action against any participant in the event of noncompliance.
Compliance monitoring has been underway for several months. Over the summer, Treasury established a dedicated portal to collect and store recipients' certified compliance information. On a quarterly basis, PSP recipients file certified reports in the portal that provide data on employee levels, terminations or furloughs, compensation data, uses of PSP funds,

Appendix XII: Accessible Data
Page 554 GAO-21-191
and financial statements. The filings provide timely insights for Treasury regarding compliance with PSP agreements. Each report goes through an automated review to assess compliance, followed by an in-depth review of any information indicating potential violations. Treasury communicates on a regular basis with PSP recipients to help them understand their obligations, troubleshoot technical difficulties, clarify information in their quarterly reports, and achieve compliance. To date, 489 recipients have been tested for compliance with agreement terms and conditions for the second quarter of 2020 in the areas of involuntary terminations or furloughs, involuntary compensation reduction, inappropriate use of PSP funds, dividend payments, buybacks, SAM.gov registration, submission of IRS Form 941, and financial statements. While Treasury's compliance monitoring program is already robust, Treasury is reviewing additional measures that may further enhance testing compliance and ensure that PSP funds are used as intended.
Thank you again for the opportunity to review the Draft Report and for your consideration of our comments.
Sincerely,
Frederick W. Vaughan Principal Deputy Assistant Secretary Office of Legislative Affairs

Appendix XII: Accessible Data
Page 555 GAO-21-191
Accessible Text for Appendix XI: Comments from the Department of Veterans Affairs
Page 1
November 4, 2020
Ms. A. Nicole Clowers Managing Director Health Care U.S. Government Accountability Office 441 G Street, NW Washington, DC 20548
Dear Ms. Clowers:
The Department of Veterans Affairs (VA) has reviewed the Government Accountability Office (GAO) draft report, COVID-19: Urgent Actions Needed to Better Ensure Effective Federal Response (GAO-21-191).
The enclosure provides general and technical comments and sets forth the actions to be taken to address the draft report recommendations.
Sincerely,
Brooks D. Tucker Assistant Secretary for Congressional and Legislative Affairs, Performing the Delegable Duties of the Chief of Staff
Enclosure
Page 2
Recommendation 1: The Department of Veterans Affairs Under Secretary for Health should develop a plan to ensure inspections of state veterans homes— which may include using in-person, a mix of virtual and in-person, or fully virtual inspections—occur during the COVID-19 pandemic.
VA Response: Concur. The Veterans Health Administration’s (VHA) Office of Geriatrics and Extended Care (GEC) has developed a draft plan,

Appendix XII: Accessible Data
Page 556 GAO-21-191
State Veterans Homes (SVH) Moving Forward Surveys, considering various types of survey modalities under a pandemic. The plan includes options of a full on-site review with modification as necessary, a hybrid virtual model, as well as a fully virtual model. GEC has been coordinating with other VA stakeholders to address how these modalities can be accomplished given the limitations of the current scope of work in the contract.
Target Completion Date: November 2021
Recommendation 2: The Department of Veterans Affairs Under Secretary for Health should collect timely data on COVID-19 cases and deaths in each state veterans home, which may include using data already collected by the Centers for Medicare & Medicaid Services.
VA Response: Concur in principle. VHA agrees that data on COVID-19 deaths are important to understanding the impact of Coronavirus Disease 2019 (COVID-19) on Veterans living in SVHs. From the onset of the first SVH to report a COVID-19 positive case on March 11, 2020, several SVHs and/or states have been very responsive to voluntarily reporting suspected and confirmed positive cases to VA medical centers (VAMC) of jurisdiction. GEC will continue to request data that will assist us in understanding how to optimize the support and guidance we provide to SVHs. In addition, VHA will continue to evaluate the present process in an attempt to identify any potential modifications to better enable reporting. SVHs have a duty to report all sentinel events to VA within 24 hours. 38 C.F.R. 51.120, 51.320, 51.430. A sentinel event is an adverse event that results in the loss of life or limb or permanent loss of function. VA has not considered COVID-19-related deaths to be sentinel events; therefore, we have not required states to report all COVID-19 deaths. However, some states have volunteered this information. As a result, VA has collected some COVID-19 data for both residents and employees.
Target Completion Date: April 2021
Page 3
General Comments:
During the COVID-19 pandemic, VHA reached out to state government partners to coordinate efforts to keep residents healthy and living safely in their SVHs.

Appendix XII: Accessible Data
Page 557 GAO-21-191
VHA responded to many states’ requests for consultative guidance to their facilities on how to best protect their patients. Additionally, local VAMCs admitted patients from SVHs who tested positive for COVID-19 who needed higher-level care than their facility could provide.
VHA’s GEC hosted Town Hall meetings in March and May 2020 where VHA leadership and subject matter experts could address SVH questions right away. These events were well attended by SVHs – 90 participants in March and 70 participants in May.
Also, in March 2020, GEC began working with VHA’s Office of Connected Care on a process for loaning iPads to VHA Community Living Centers and SVHs to help connect patients with their families and coordinate appointments at VA. This effort culminated in 73 separate SVHs requesting 92 loaner iPads from VHA.
On June 5, 2020, VHA’s Office of Nursing Services provided a program review to VHA staff on “Crisis Skills Clinical Training: Education for State Veterans Homes & Contract Nursing Homes.” Content from this virtual session and other COVID-19-related information is publicly available at the following link: https://www.va.gov/covidtraining/.

Contacts
Page 558 GAO-21-191
Contacts Report Director(s)
A. Nicole Clowers Managing Director, Health Care, [email protected], (202) 512-7114
Congressional Relations
Orice Williams Brown, Managing Director, [email protected], (202)-512-4400 U.S. Government Accountability Office 441 G Street NW, Room 7125, Washington, DC 20548
Public Affairs
Chuck Young, Managing Director, [email protected], (202)-512-4800 U.S. Government Accountability Office 441 G Street NW, Room 7149, Washington, DC 20548
Strategic Planning and External Liaison
Stephen J. Sanford, Acting Managing Director, [email protected], (202)-512-4707 U.S. Government Accountability Office 441 G Street NW, Room 7814, Washington, DC 20548
Obtaining Copies of GAO Reports and Testimony
The fastest and easiest way to obtain copies of GAO documents at no cost is through our website. Each weekday afternoon, GAO posts on its website newly released reports, testimony, and correspondence. You can also subscribe to GAO’s email updates to receive notification of newly posted products.
Order by Phone
The price of each GAO publication reflects GAO’s cost of production and distribution. Pricing and ordering information is posted on our website.
To Report Fraud, Waste, and Abuse in Federal Programs

Contacts
Page 559 GAO-21-191
Website: https://www.gao.gov/fraudnet/fraudnet.htm Automated answering system: (800) 424-5454 or (202) 512-7470
Connect with GAO
Connect with GAO on Facebook, Flickr, LinkedIn, Twitter, and YouTube. Subscribe to our RSS Feeds or E-mail updates. Listen to our Podcasts. Visit GAO on our website and read the Watchblog.
GAO’s Mission
The Government Accountability Office, the audit, evaluation, and investigative arm of Congress, exists to support Congress in meeting its constitutional responsibilities and to help improve the performance and accountability of the federal government for the American people. GAO examines the use of public funds; evaluates federal programs and policies; and provides analyses, recommendations, and other assistance to help Congress make informed oversight, policy, and funding decisions. GAO’s commitment to good government is reflected in its core values of accountability, integrity, and reliability.
Copyright
This is a work of the U.S. government and is not subject to copyright protection in the United States. The published product may be reproduced and distributed in its entirety without further permission from GAO. However, because this work may contain copyrighted images or other material, permission from the copyright holder may be necessary if you wish to reproduce this material separately.
(104351)