gao-21-556, u.s. postal service: further analysis could
TRANSCRIPT

U.S. POSTAL SERVICE
Further Analysis Could Help Identify Opportunities to Reduce Injuries among Non-Career Employees
Report to Congressional Requesters
August 2021
GAO-21-556
United States Government Accountability Office

United States Government Accountability Office
Highlights of GAO-21-556, a report to congressional requesters
August 2021
U.S. POSTAL SERVICE Further Analysis Could Help Identify Opportunities to Reduce Injuries among Non-Career Employees
What GAO Found The United States Postal Service (USPS) uses both career employees and non-career employees to accomplish its mission. Career employees are considered permanent and are entitled to a range of benefits and privileges; non-career employees receive lower pay and fewer benefits and are often hired on renewable contracts that offer a pathway to a career position. GAO found that non-career employees’ turnover rates were significantly higher than career turnover rates, both before and after GAO controlled for numerous factors such as employee tenure. GAO found that non-career status was the most significant factor associated with turnover. Postal employee groups identified features, including unpredictable hours, of non-career positions that may contribute to turnover, though USPS officials noted some of these features are governed by negotiated agreements. USPS has taken steps, and described other initiatives in its March 2021 strategic plan, to reduce non-career turnover rates.
With regard to injuries, non-career employees had higher injury rates in the study period, for both definitions of injury used in GAO’s analyses (see figure), but USPS does not analyze injury data by career status. USPS officials attributed higher rates of injuries among non-career employees to differences other than career status such as less tenure among non-career employees. However, GAO analysis controlled for tenure and other factors and found that non-career employees had higher injury rates than career employees by about 16 percent and 22 percent, depending on the definition of injury used. Moreover, average workers’ compensation costs were higher for non-career employees than for career employees with limited tenure, driven primarily by differences in injury rates. USPS regularly collects and analyzes workplace accident and injury data across its workforce and has taken steps in recent years to improve safety through training and other actions. However, USPS does not identify key differences between career and non-career employees in its analyses. Without conducting analyses by career status, USPS may be unable to identify some causes of non-career employee injuries and miss opportunities to reduce them.
Rates of Reported Injuries and of Federal Employees’ Compensation Act (FECA) Injuries by Career Status, Fiscal Years 2016 through 2020
Note: FECA injuries refer to USPS employee incidents associated with workers’ compensation claims, regardless of whether the claims have been determined to be eligible.
View GAO-21-556. For more information, contact Jill Naamane at (202) 512-2834 or [email protected]
Why GAO Did This Study From fiscal year 2016 through 2018, USPS saved an estimated $6.6 billion by increasing its use of non-career employees; this increase is an important accomplishment given USPS’s financial challenges. Compared to career employees, non-career employees are compensated less and USPS has more flexibility in setting their schedules.
GAO was asked to review the effects of USPS’s increased use of non-career employees. This report examines the rates of non-career employees: (1) turnover and (2) injuries, as well as factors and costs associated with each and USPS’s efforts to manage these issues. GAO analyzed USPS data from fiscal years 2016 through 2020 to determine turnover and injury rates, conducted analyses to determine associated factors, and calculated costs, including workers compensation costs using Department of Labor data. GAO also interviewed officials representing USPS, postal unions, postal management associations, and the USPS Office of Inspector General.
What GAO Recommends GAO recommends that USPS analyze employee injuries by career status to identify opportunities for reducing injuries, particularly among non-career employees. USPS accepted this recommendation and noted that future analysis of injuries by career status can enhance accident analysis and the development of training initiatives.

Page i GAO-21-556 U.S. Postal Service
Letter 1
Background 8 Non-Career Employees Had Higher Turnover, Controlling for
Other Factors, Resulting in Costs, and USPS Has Taken Steps to Reduce Turnover 13
Non-Career Employees Had Higher Injury Rates, But USPS Does Not Analyze this Information 28
Conclusions 38 Recommendation for Executive Action 38 Agency Comments 39
Appendix I GAO Analyses of U.S. Postal Service Employee Turnover, Injuries, and Workers’ Compensation 40
Appendix II Comments from U.S. Postal Service 95
Appendix III GAO Contact and Staff Acknowledgments 97
Tables
Table 1: Data Sets Used 3 Table 2: Negotiated Caps on U. S. Postal Service’s (USPS) Non-
Career Employees 10 Table 3: U.S. Postal Service’s (USPS) Non-Career and Career
Employee-Initiated Fiscal Year 2020 Turnover Rates by Tenure 16
Table 4: Data Sets Used 41 Table 5: Data Reliability Steps 41 Table 6: Summary of Variables Related to Pay and Hours for U.S.
Postal Service (USPS) Employees 42 Table 7: Summary of Variables Related to Benefits Hours for U.S.
Postal Service (USPS) Employees 43 Table 8: Summary of Variables Related to U.S. Postal Service
(USPS) Employee Separations 44 Table 9: Summary of Variables from Department of Labor Federal
Employees’ Compensation Act Data 46
Contents

Page ii GAO-21-556 U.S. Postal Service
Table 10: Summary of Variables Related to Injuries from U.S. Postal Service (USPS) Enterprise Data Warehouse 47
Table 11: U.S. Postal Service’s (USPS) Annual Employee Turnover Rates, Fiscal Years 2016 through 2020 50
Table 12: USPS Non-Career and Career Employee Turnover Rates, Fiscal Years 2016 through 2020 51
Table 13: U.S. Postal Service (USPS) Non-Career and Career Employee-Initiated Turnover by Tenure, Fiscal Year 2020 52
Table 14: U.S. Postal Service’s (USPS) Average Non-career Turnover Rates in Mid-Sized and Large Lead Finance Units, Fiscal Years (FY) 2016 through 2020 55
Table 15: U.S. Postal Service’s (USPS) Average Non-career Turnover Rates in Large Lead Finance Units, Fiscal Years 2016 through 2020 56
Table 16: Probability of Separation by U.S. Postal Service (USPS) Employee Characteristics, Fiscal Years 2016 through 2020 64
Table 17: Probability of Separation by U.S. Postal Service (USPS) Employee Characteristics and Occupation Type, Fiscal Years 2016 through 2020 67
Table 18: U.S. Postal Service (USPS) Employees’ Reported Injury Rates by Occupation Type and Career Status, Fiscal Years 2016 through 2020 72
Table 19: U.S. Postal Service (USPS) Employees’ Federal Employee Compensation Act (FECA) Injury Rates by Occupation Type and Career Status, Fiscal Years 2016 through 2020 72
Table 20: Probability of U.S. Postal Service (USPS) Reported Injury by Employee Characteristics, Fiscal Years 2016 through 2020 75
Table 21: Probability of a Federal Employee Compensation Act (FECA) Injury, Fiscal Years 2016 through 2020 79
Table 22: Discount Rate from Department of Labor Actuarial Liability Report, Fiscal Years 2016 through 2019 83
Table 23: Annual Total Federal Employees’ Compensation Act (FECA) Cost for U.S. Postal Service (USPS) Non-career Employees, Fiscal Years 2016 through 2020 84
Table 24: Average Per-Employee Federal Employees’ Compensation Act (FECA) Costs (Total, Medical, and Compensation) for U.S. Postal Service (USPS) Non-Career Employees by Tenure, Fiscal Year 2019 84

Page iii GAO-21-556 U.S. Postal Service
Table 25: Probability of Lost Time by U.S. Postal Service (USPS) Employees from Injury and the Number of Lost Hours 86
Table 26: Probability of Lost Time by U.S. Postal Service (USPS) Employees from Injury and the Number of Lost Hours, Conditional on Having Lost Time (Marginal Effects Reported) 88
Figures
Figure 1: The Four Main Occupation Types at U.S. Postal Service (USPS) 9
Figure 2: Average Annual Rates of U.S. Postal Service Employees’ Reported Injuries and Federal Employees’ Compensation Act (FECA) Injuries by Career Status, Fiscal Years 2016 through 2020 29
Figure 3: Average Per-Employee Federal Employees’ Compensation Act (FECA) Costs for U.S. Postal Service Employees, Fiscal Year 2019, by Career Status 34
Figure 4: U.S. Postal Service’s Non-Career Employee-Initiated Annual Turnover Rates by Occupation Type, Fiscal Years 2016 through 2020 54
Figure 5: Overtime and Workhour Utilization by Uninjured Employees in U.S. Postal Service (USPS) Facilities with Employees Who Lost Time Due to Reported Injuries 93

Page iv GAO-21-556 U.S. Postal Service
Abbreviations COSO Framework Committee of Sponsoring Organizations of the
Treadway Commission Internal Control-Integrated Framework
COVID-19 Coronavirus Disease 2019 FECA Federal Employees’ Compensation Act FY Fiscal Year OIG Office of Inspector General OSHA Occupational Safety and Health Administration RPP regional price parity USPS U.S. Postal Service USPS HR USPS human resources
This is a work of the U.S. government and is not subject to copyright protection in the United States. The published product may be reproduced and distributed in its entirety without further permission from GAO. However, because this work may contain copyrighted images or other material, permission from the copyright holder may be necessary if you wish to reproduce this material separately.

Page 1 GAO-21-556 U.S. Postal Service
441 G St. N.W. Washington, DC 20548
August 17, 2021
The Honorable Carolyn B. Maloney Chairwoman Committee on Oversight and Reform House of Representatives
The Honorable Gerald E. Connolly Chairman Subcommittee on Government Operations Committee on Oversight and Reform House of Representatives
The Honorable Stephen F. Lynch Chairman Subcommittee on National Security Committee on Oversight and Reform House of Representatives
The Honorable Brenda L. Lawrence House of Representatives
The U.S. Postal Service (USPS) has a mission to provide prompt, reliable, and efficient1 universal mail service to the public.2 At the same time, USPS is expected to be financially self-sufficient by covering its own expenses through revenues generated from the sale of its products and services. However, over the past 14 fiscal years, USPS has not generated enough revenue to cover its costs, losing about $87 billion. According to USPS, most of its annual costs are related to the 644,000 employees who, on a typical day, process and deliver hundreds of millions of pieces of mail and packages.
In response to financial pressures, USPS has taken actions to reduce its employee costs, including negotiating with its employee unions to use more “non-career” employees. Non-career employees receive fewer benefits and lower pay than career employees, and they may be hired on
1 39 U.S.C. § 101(a).
2 39 U.S.C. §§ 101(a), 403(a), 3691(b)(1)(B).
Letter

Page 2 GAO-21-556 U.S. Postal Service
a temporary basis.3 By using more non-career employees, USPS saved about $6.6 billion in fiscal years 2016 through 2018, according to our prior report.4 USPS’s savings from using more non-career employees have been substantial and improved its financial situation. However, our prior report identified costs that USPS did not factor into its cost-savings estimates, such as costs associated with non-career employee turnover.5
You asked us to review the impact of USPS’s increased use of non-career employees, including the effects of these employees on turnover and employee injuries. This report compares the rates of career and non-career employee (1) turnover and (2) injuries, as well as factors and costs associated with each, and USPS efforts to manage turnover and injuries.
To address these objectives, we conducted data analysis, reviewed relevant documentation, and interviewed officials, as described below.
To address our research objectives, we used a variety of data sets as detailed in table 1. Unless otherwise noted, we used data for fiscal years 2016 through 2020.
3 Career employees receive a range of benefits (e.g., health and retirement) and privileges, and they are considered permanent employees. Throughout this report, we refer to the career and non-career employee classification as “career status.”
4 GAO, U.S. Postal Service: Additional Guidance Needed to Assess Effect of Changes to Employee Compensation, GAO-20-140 (Washington, D.C.: Jan. 17, 2020).
5 While there are multiple valid approaches for estimating cost savings based on policy changes, we found that USPS did not account for some significant factors and, therefore, potentially overstated the savings achieved. Specifically, USPS did not account for the effects of changes in work hours or tenure of employees. We recommended that USPS develop guidance for cost-savings estimates related to employee compensation. In comments on our report, USPS disagreed that the lack of such formal guidance adversely affected its ability to develop appropriate cost estimates. USPS also disagreed with some of our assumptions and analyses in the report. Nevertheless, USPS implemented our recommendation in 2020 by issuing guidance about cost-savings estimates, noting that significant factors such as work hours, tenure, and turnover be utilized, as appropriate. See GAO-20-140.
Data Analyses

Page 3 GAO-21-556 U.S. Postal Service
Table 1: Data Sets Used
Data Set Agency Brief Description Payroll data U.S. Postal Service
(USPS) Individual-level data (by 2-week pay period) on employees’ earnings and benefits, hours of work (including overtime), career status, start and separation dates
Human resources data USPS Employees’ demographics and reasons for separation Integrated Federal Employees’ Compensation System Data
Department of Labor Compensation for medical expenditures and lost work time through the Federal Employees’ Compensation Act programa
Injury data from the Enterprise Data Warehouse
USPS Date of injury, cause of incident, incident classification, incident type, lost time due to injury
Source: GAO analysis of data from USPS and the Department of Labor. | GAO-21-556 aThe Federal Employees’ Compensation Act (FECA) program is a workers’ compensation program that provides compensation and other benefits to federal employees who sustain work-related injuries or diseases. These benefits and compensation include monetary compensation for lost wages, medical expenses, and vocational rehabilitation services.
To determine that these data sets were sufficiently reliable for the purposes of our study, we used a combination of reviewing related documentation, interviewing knowledgeable officials, conducting electronic data testing, and reviewing data reliability testing from a prior GAO review, depending on the data source. For additional information on data reliability, see appendix I.
Using these data sets, we conducted a series of analyses, described below. For more information on each of these analyses, see the corresponding section in appendix I.
Actuarial analysis of annual employee turnover. To calculate annual career and non-career employee turnover rates for fiscal years 2016 through 2020, we conducted actuarial analysis of the total USPS workforce population using USPS payroll data and USPS human resources data.6 Our analysis used USPS’s business rules to exclude certain employees such as employees with short-term holiday contracts.7 6 Specifically, we conducted an actuarial experience study. Actuarial experience studies typically involve examining recent historical experience to help inform the selection of assumptions to be used in estimating future experience. The object of study could be any of a variety of factors, such as turnover, mortality, or pay increases. For this report, we are not estimating future experience and instead focus solely on the historical component.
7 Specifically, we excluded holiday workers, non-career rural carriers hired for weekend and Amazon package delivery relief, and a small number of employees in discontinued positions, according to USPS business rules. We also excluded retirements and deaths from the turnover rates.

Page 4 GAO-21-556 U.S. Postal Service
These annual turnover rates count the number of employees who separated within each fiscal year. We categorized employee separations into employer-initiated turnover and employee-initiated turnover using USPS codes associated with separations.8 We also analyzed turnover rates in fiscal year 2020 by tenure, and for the purposes of this report, we measured an employee’s tenure by using the earliest start date that appeared in our data.9 In addition, because we heard from employee groups that employees’ prospects for converting to career positions may affect non-career turnover, we analyzed USPS human resources data on conversions to determine employee tenure at time of conversion for conversions occurring in fiscal year 2019.
Regression analysis of employee turnover. To further examine factors associated with employee turnover, we conducted a regression analysis—a multivariate statistical method that accounts for certain individual and occupational factors other than career status that could be associated with rates of turnover—using USPS pay-period payroll and human resources data.10 As with our actuarial turnover analysis, we used USPS’s business rules to exclude certain employees as described above.11 This regression analysis controlled for numerous factors—career status, occupation type, age, tenure, gender, race, ethnicity, overtime work, night work, benefits, local unemployment rates, and cost-of-living differences across workplaces—and enabled us to determine the strength of association between each of these factors and turnover. Because we were unable to account for some factors such as an individual’s health
8 We define employer-initiated turnover as USPS-initiated for reasons such as for work quality, personal conduct, or lack of work from reduced mail volume. We define employee-initiated turnover to include resignations and separations arising for reasons such as from an employee declining relocation or reassignment, or transferring to other agencies.
9 According to USPS officials, new start dates are recorded at various times, including when (1) USPS renews a non-career employee’s 360-day contract (with the exception of non-career rural carriers, who are not on 360-day contracts), and (2) a non-career employee switches to a different occupation type, for example, from city carrier to postal clerk. A new start date is not recorded when an employee converts from a non-career position to a career position.
10 We examined turnover for each pay period in order to capture the effect of factors that vary each pay period, which are associated with turnover. Based on this approach, we account for employees who separated multiple times during a given year.
11 In addition, we excluded records for which the separation data we reviewed did not record a separation date within 6 weeks before or after the employee’s last recording working payroll period.

Page 5 GAO-21-556 U.S. Postal Service
status, which may affect an employee’s decision to separate, our analysis should be interpreted as correlational.
Estimated new-hire costs. To examine costs associated with non-career employee turnover, we obtained USPS onboarding and training costs for fiscal years 2018 through 2020 (the most recent data available). We estimated new-hire costs based on the amount of non-career employee turnover for each fiscal year.
Numbers and rates of employee injuries. To calculate injury numbers and rates by career status, we first defined “injuries” for purposes of our review. Specifically, our review examines two types of injuries—reported injuries and Federal Employees’ Compensation Act (FECA) injuries. Reported injuries refer to incidents in which the associated USPS accident report indicates that an employee was injured. FECA injuries refer to incidents associated with workers’ compensation claims, regardless of whether the claims have been adjudicated by Department of Labor. By comparison, USPS considers injuries to be incidents reported to the Occupational Safety and Health Administration (OSHA)—incidents that result in fatalities, days away from work, or medical treatment beyond first aid, among other things.12 We examined reported injuries and FECA injuries rather than incidents reported to OSHA because we were interested in a broader look at injuries that create challenges for employees and USPS. We calculated numbers and rates of reported injuries and FECA injuries by career status and occupation type using USPS injury data (for career status and reported injuries); USPS payroll data (for career status and occupation type); and FECA workers’ compensation data (for FECA injuries).
Regression analysis on examining the probability of injury. To examine factors associated with reported injuries and FECA injuries, we conducted regression analyses using these same data sources along with USPS human resources data for demographic information. Our regression analysis controlled for numerous factors—career status,
12 OSHA generally describes a recordable injury or illness as: (1) any work-related fatality; (2) any work-related injury or illness that results in loss of consciousness, days away from work, restricted work, or transfer to another job; (3) any work-related injury or illness that results in medical treatment beyond first aid; and (4) any work-related case that involves significant injury or illness diagnosed by a physician or other licensed healthcare professional such as cancer, chronic irreversible diseases, fractured or cracked bones or teeth, and punctured eardrums. In addition, there are special recording criteria for work-related cases involving: “needlesticks” and sharp-object injuries, medical removal, hearing loss, and tuberculosis. See 29 C.F.R. Part 1904.

Page 6 GAO-21-556 U.S. Postal Service
occupation type, tenure, overtime work, night work, postal facility, age, gender, race, and ethnicity—and enabled us to determine the strength of association between each of these factors and both reported injuries and FECA injuries. However, we were unable to account for factors that may affect injury rates such as an individual’s willingness to take workplace risks, so our analyses should be interpreted as correlational.
Actuarial analysis of workers’ compensation costs. To calculate average workers’ compensation costs for career and non-career employees, we conducted actuarial analysis of Department of Labor data from the Integrated Federal Employees’ Compensation System, which includes information on workers’ compensation payments, together with USPS payroll. This process enabled us to identify career status of individuals who received workers’ compensation payments. We further analyzed these data to examine the effect of tenure on these costs.
Regression analysis on lost time (lost productivity). To examine labor productivity losses associated with reported injuries, we conducted regression analysis, controlling for the same factors we controlled for in the regression analyses examining injuries. We used USPS injury data, which included data on lost work hours due to injury.
Regression analysis on overtime and total workhour utilization by uninjured employees after reported injury. To examine additional costs associated with reported injuries, we used USPS payroll data to conduct regression analysis of overtime and total work hours charged by uninjured employees in facilities and occupation types where an employee lost time from a reported injury.
We reviewed documents related to employee turnover and injuries including:
• USPS policies; • Occupational Safety and Health Administration safety practices;
Documents Reviewed and Interviews Conducted

Page 7 GAO-21-556 U.S. Postal Service
• The Committee of Sponsoring Organizations of the Treadway Commission Internal Control-Integrated Framework (COSO Framework);13
• negotiated agreements between USPS and postal employee unions; • USPS Office of the Inspector General (OIG) reports on non-career
employees, employee turnover, injuries, workers’ compensation, service performance, overtime use, and mail delivery;
• GAO reports on USPS workforce issues; and • studies on turnover, injuries, and safety incidents among contingent
workers that we identified through a literature review.
We compared USPS’s operational policies and procedures related to assessing employee injuries to standards on control activities and internal communication in the COSO framework.
We conducted interviews with officials from USPS, USPS OIG, and Department of Labor. We also conducted semi-structured interviews about the factors, costs, and USPS efforts associated with non-career employee turnover and injuries with six postal employee groups—the four postal unions that represent non-career employees as well as career employees and the two postal management associations that represent employees in managerial and supervisory positions.14 In addition, we obtained USPS and postal employee group perspectives on the preliminary results of our data analyses. We also interviewed officials from UPS, a package-delivery company, for a private-sector perspective on employee turnover and injuries.
We conducted this performance audit from February 2020 to August 2021 in accordance with generally accepted government auditing standards. Those standards require that we plan and perform the audit to obtain 13 COSO Internal Control – Integrated Framework (2013). The Committee of Sponsoring Organizations of the Treadway Commission Internal Control-Integrated Framework is recognized as a leading framework for designing, implementing, and conducting internal control and assessing the effectiveness of internal control. It provides a means to apply internal control to any type of entity and requirements for an effective system of internal control. The USPS OIG and we have applied the COSO Framework in evaluating USPS’s operational internal controls in recent reports.
14 The four employee unions we interviewed were National Association of Letter Carriers, National Rural Letter Carriers Association, National Postal Mail Handlers Union, and American Postal Workers Union. The two postal management associations we interviewed were National Association of Postal Supervisors and United Postmasters and Managers of America.

Page 8 GAO-21-556 U.S. Postal Service
sufficient, appropriate evidence to provide a reasonable basis for our findings and conclusions based on our audit objectives. We believe that the evidence obtained provides a reasonable basis for our findings and conclusions based on our audit objectives.
USPS’ workforce is vast, but it is concentrated in four occupation types. Ninety-two percent of the USPS workforce is composed of career and non-career employees represented by the four postal unions, which are roughly organized along occupation types—city letter carriers (hereafter “city carriers”), rural letter carriers (hereafter “rural carriers”), mail handlers, and postal clerks. Career and non-career employees within each occupation type perform many of the same duties. (See fig. 1.)
Background USPS Workforce

Page 9 GAO-21-556 U.S. Postal Service
Figure 1: The Four Main Occupation Types at U.S. Postal Service
Beginning in 2010 and 2011, USPS negotiated with three of the four postal employee unions to increase the percentage of the workforce that could be non-career. As of July 2021, these caps were as high as 20 percent per USPS district for non-career postal clerks and 24.5 percent
Page 10 GAO-21-556 U.S. Postal Service
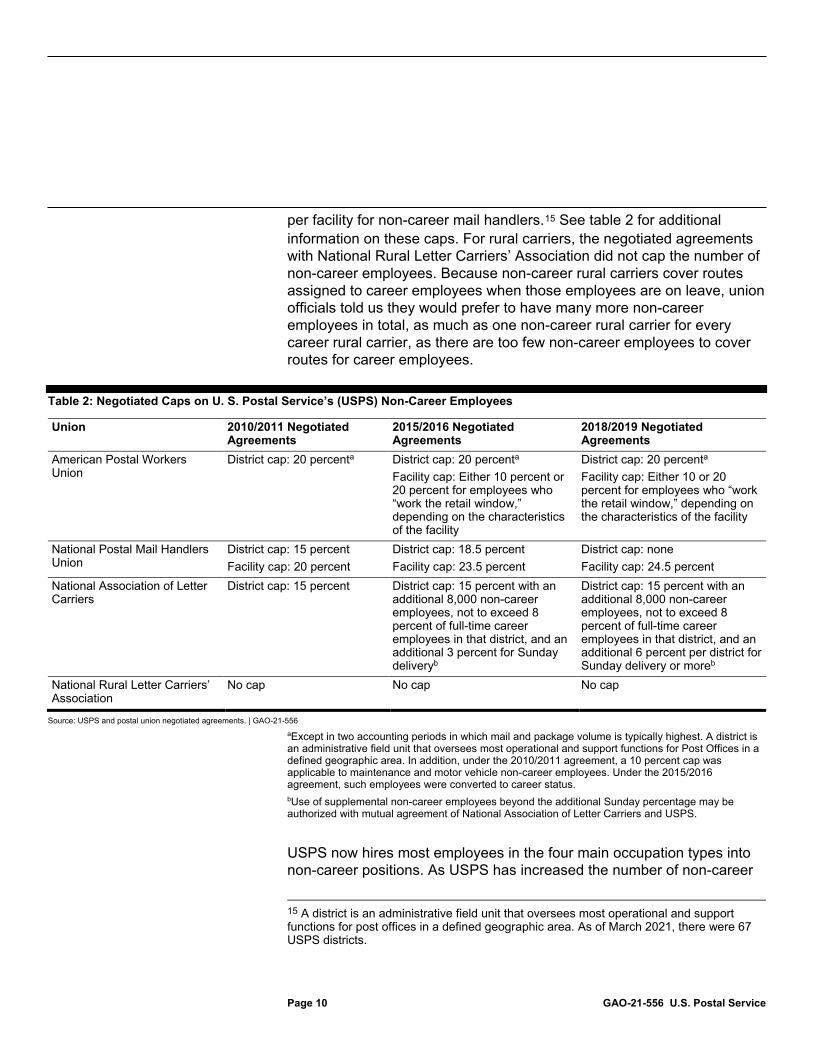
per facility for non-career mail handlers.15 See table 2 for additional information on these caps. For rural carriers, the negotiated agreements with National Rural Letter Carriers’ Association did not cap the number of non-career employees. Because non-career rural carriers cover routes assigned to career employees when those employees are on leave, union officials told us they would prefer to have many more non-career employees in total, as much as one non-career rural carrier for every career rural carrier, as there are too few non-career employees to cover routes for career employees.
Table 2: Negotiated Caps on U. S. Postal Service’s (USPS) Non-Career Employees
Union 2010/2011 Negotiated Agreements
2015/2016 Negotiated Agreements
2018/2019 Negotiated Agreements
American Postal Workers Union
District cap: 20 percenta District cap: 20 percenta Facility cap: Either 10 percent or 20 percent for employees who “work the retail window,” depending on the characteristics of the facility
District cap: 20 percenta Facility cap: Either 10 or 20 percent for employees who “work the retail window,” depending on the characteristics of the facility
National Postal Mail Handlers Union
District cap: 15 percent Facility cap: 20 percent
District cap: 18.5 percent Facility cap: 23.5 percent
District cap: none Facility cap: 24.5 percent
National Association of Letter Carriers
District cap: 15 percent District cap: 15 percent with an additional 8,000 non-career employees, not to exceed 8 percent of full-time career employees in that district, and an additional 3 percent for Sunday deliveryb
District cap: 15 percent with an additional 8,000 non-career employees, not to exceed 8 percent of full-time career employees in that district, and an additional 6 percent per district for Sunday delivery or moreb
National Rural Letter Carriers’ Association
No cap No cap No cap
Source: USPS and postal union negotiated agreements. | GAO-21-556 aExcept in two accounting periods in which mail and package volume is typically highest. A district is an administrative field unit that oversees most operational and support functions for Post Offices in a defined geographic area. In addition, under the 2010/2011 agreement, a 10 percent cap was applicable to maintenance and motor vehicle non-career employees. Under the 2015/2016 agreement, such employees were converted to career status. bUse of supplemental non-career employees beyond the additional Sunday percentage may be authorized with mutual agreement of National Association of Letter Carriers and USPS.
USPS now hires most employees in the four main occupation types into non-career positions. As USPS has increased the number of non-career
15 A district is an administrative field unit that oversees most operational and support functions for post offices in a defined geographic area. As of March 2021, there were 67 USPS districts.

Page 11 GAO-21-556 U.S. Postal Service
employees in the four main occupation types, the organization has also reduced the number of employees hired directly into career positions. Instead, most non-career employees are hired on renewable contracts that offer a pathway to career position, in which employees have greater schedule certainty and receive higher compensation. For example, we previously reported that the difference in pay between career and non-career employees to be, on average, $25 per hour, without adjusting for mix of hours worked and tenure.16 However, the timing of converting from a non-career to a career position may vary widely.17 For example, a small percentage of employees are hired into career positions, others may convert after a few months if a vacancy arises, others may be guaranteed conversions after 2 years from collective-bargaining agreements, while others may wait years to be converted. In addition, some non-career employees are hired on short-term contracts, such as during the holiday season, according to USPS officials.
We previously reported that the increased use of non-career employees has reduced compensation costs (from lower pay and benefits) by billions of dollars and provided USPS with a more flexible workforce.18 Using non-career employees gives USPS managers and supervisors more flexibility in setting non-career employee schedules and routes, as set forth in the negotiated agreements with unions. For example, managers and supervisors can assign hours on short notice to non-career employees. Further, non-career mail handlers and postal clerks have no weekly work-hour guarantees, and they are only guaranteed a minimum of 2 to 4 hours of work for days they are scheduled. In addition, we previously reported that USPS management officials told us that they use non-career employees for much of the Sunday package delivery service and to make extra trips needed to deliver packages to meet service targets.19 Moreover, whereas managers and supervisors assign career carriers
16 After adjusting for tenure and mix of workhours, we found the difference in pay to be, on average, $8.27 per hour. We based this analysis on data from fiscal years 2016 through 2018. GAO-20-140.
17 According to USPS officials, USPS hires most non-career employees, except for rural carriers, to work for 360 days, after which they are to take a 5-day break before being eligible for reappointment. USPS officials told us that these obligatory breaks in service are excluded from their calculations of turnover, and we followed this practice in calculating turnover.
18 GAO-20-140.
19 GAO-20-140.

Page 12 GAO-21-556 U.S. Postal Service
regular routes, they can assign non-career city and rural carriers to different routes on different days, according to USPS officials.
Employee turnover is either employer-initiated or employee-initiated. USPS initiates separations for various reasons, such as employee work quality, employee personal conduct, or a reduction in mail volume. In contrast, employee turnover may occur even if USPS would have preferred to retain the employee. Such reasons may include a lack of fit or the job being different than the employee expected in terms of schedule, physical requirements, or other factors.
USPS’s Occupational Safety and Health Department uses a safety reporting system to track accidents and near-misses. According to USPS officials, USPS tracks these incidents to determine the cause and, if necessary, take remedial action. Starting in fiscal year 2015, USPS reduced its total number of accidents each year through fiscal year 2020, according to the USPS annual report for fiscal year 2020.20 Accident reports, which may be filed by involved employees, supervisors, or union officials, are to indicate whether an incident resulted in property damage, employee injury, or both. If an accident report indicates that an employee was injured, we refer to the injury as a “reported injury.” For fiscal years 2016 through 2020, the most frequent causes of reported injuries included dog bites, repetitive motions, and slip, trip, and fall injuries, according to our analysis. USPS’s safety reporting system also includes information on injuries that USPS is required to submit to OSHA, referred to as “OSHA-recordable injuries.” OSHA-recordable injuries include fatalities, injuries that result in days away from work, and injuries requiring medical treatment beyond first aid.
Reported injuries, whether or not they are OSHA-recordable, may lead to a workers’ compensation claim. The FECA program provides compensation and other benefits to federal employees, including USPS career and non-career employees, 21 who sustain work-related injuries or diseases. These benefits and compensation include monetary compensation for wage loss, medical expenses, and vocational rehabilitation services. The Department of Labor’s Office of Workers Compensation Program administers the FECA program and reviews
20 U.S. Postal Service, Fiscal Year 2020 Annual Report to Congress (Washington, D.C.). 21 Under 39 U.S.C. § 1005(c), officers and employees of USPS are to be covered by FECA’s provisions relating to compensation for work injuries.
Employee Turnover
Employee Injuries and Worker’s Compensation

Page 13 GAO-21-556 U.S. Postal Service
FECA claims to determine eligibility. USPS employees are the largest group of FECA recipients and are responsible for the largest share of FECA payments, according to the Congressional Research Service.22 For example, in fiscal year 2019, USPS employees accounted for 52 percent of injuries, illnesses, and fatalities that resulted in FECA cases even though they constituted just 22 percent of the federal civilian workforce.23
According to both our actuarial analysis and regression analysis of USPS data from fiscal years 2016 through 2020, non-career employees had higher turnover rates than career employees even when we controlled for
22 Congressional Research Service, The Federal Employees’ Compensation Act (FECA): Workers’ Compensation for Federal Employees, R42107 (Mar. 17, 2021).
23 Department of Labor, Occupational Safety and Health Administration, Federal Injury and Illness Statistics for Fiscal Year 2019. Overall workers’ compensation cost containment was out of the scope of our study. The USPS OIG recommended in 2020 that USPS “management evaluate workers’ compensation cost containment options based on private sector practices and determine a strategy forward.” See USPS Office of the Inspector General, Workers’ Compensation Program Cost Containment Activities, 19-031-R20 (Arlington, Va.: Aug. 6, 2020).
Non-Career Employees Had Higher Turnover, Controlling for Other Factors, Resulting in Costs, and USPS Has Taken Steps to Reduce Turnover
Unpredictable Schedules, Lower Compensation, and Other Factors Specific to Non-Career Employees Are Associated with Higher Non-Career Turnover

Page 14 GAO-21-556 U.S. Postal Service
employee tenure and other factors.24 Our actuarial analysis allowed us to describe overall annual turnover rates and compare turnover rates for career and non-career employees both overall and when considering employees with similar tenure. In the actuarial analysis, we distinguished between employer- and employee-initiated separations. Our regression analysis, which focused on employee-initiated separations, enabled us to examine the relative strength of association between employee-initiated turnover and the factors we examined—career status, occupation type, tenure, overtime work, night work, benefits, local unemployment rates, cost-of-living differences across workplaces, age, gender, race, and ethnicity.
The overall average annual turnover for non-career employees was 28.6 percent and 1.7 percent for career employees, according to our actuarial analysis of USPS data for fiscal years 2016 through 2020. Overall turnover rates between non-career and career employees, though, are not strictly comparable because of demographic differences between these two populations, as discussed further below.25 (For more information, see appendix I.) We excluded turnover associated with employees hired for holiday periods and employees hired for weekend deliveries, among others.26
Our further analyses first categorized separations as employer- or employee-initiated.27 While both employer- and employee-initiated turnover affect USPS’ workforce and costs, our analyses focused on non-
24 Our study period included fiscal year 2020, which included disruptions related to the Coronavirus Disease 2019 (COVID-19), beginning in March 2020, through the end of the fiscal year. Our analysis of data on turnover rates found a small enough difference compared to prior fiscal years—and represented just over half of the fiscal year—that we present the fiscal year 2020 findings together with the other fiscal years in the study.
25 To calculate annual turnover rates, we calculated the ratio of the employees who separated from USPS within the fiscal year to the total number of employees for the same fiscal year. The total number of employees is the sum of the number of employees appearing in the payroll data from the beginning of the fiscal year or who were hired during the fiscal year.
26 In addition, we excluded retirements because this type of separation is not associated with non-career employees, and including career retirements would make non-career and career employee turnover less comparable. We also excluded deaths and a small number of employees in discontinued positions.
27 We defined employee-initiated turnover to include resignations, separations from an employee declining relocation or reassignment, and transfers to other agencies.

Page 15 GAO-21-556 U.S. Postal Service
career employee-initiated separations because they represent employees USPS would likely have preferred to retain.
When examining just employee-initiated turnover, which accounted for over 72 percent of non-career turnover, non-career employee turnover was still much higher than career employee turnover. Specifically, the 5-year average employee-initiated turnover for employees of all tenure was 20.7 percent for non-career employees and 1.3 percent for career employees.
Because of the many differences between non-career and career employees—particularly that non-career employees tend to have less experience at USPS than career employees—we conducted additional analysis to control for tenure, thereby isolating features of non-career positions and other factors not related to tenure.
We conducted actuarial analysis of employee-initiated annual turnover rates for non-career and career employees by tenure.28 According to USPS officials involved in workforce planning, non-career turnover is primarily driven by incompatibility with the position and being new to the agency (low tenure). In this analysis, we focused on employees with between 12 and less than 48 months of tenure because there are relatively few career employees with fewer than 12 months of tenure and relatively few non-career employees with 48 or more months of tenure.29 This approach also enabled us to avoid the effect of long experience at USPS and the anticipation of retirement benefits.
We found that the difference between non-career and career employee turnover narrowed considerably when considering tenure, but remained 28 We found a sufficient number of career and non-career employees with the same amount of tenure for our comparison. We define tenure to represent the total length of time the employee has worked for USPS in order to reflect their total work experience with USPS. In the event a non-career employee converts to career status, the tenure reflects the employee’s experience as both a career and non-career employee. For example, if a non-career employee with 30 months of tenure converted to a career employee and worked for another 6 months, we would consider the employee’s tenure as 36 months. The career status of an employee was that as of fiscal year 2020.
29 For example, in fiscal year 2020, of employees in the four main occupation types with fewer than 12 months of tenure, just 6 percent were career employees, according to our analysis. In the same fiscal year, of employees in the four main occupation types with 48 or more months of tenure, just 7 percent were non-career employees. Similarly, in fiscal year 2020, 80 percent of career employees had 5 or more years of tenure, compared to only 8 percent of non-career employees.

Page 16 GAO-21-556 U.S. Postal Service
substantial, indicating that features distinct to career status may affect turnover (see table 3).30 For example, non-career turnover in fiscal year 2020 for employees with 12 to less than 24 months of tenure was 14.1 percentage points higher than for career employees in the same tenure group.31 The percentage-point gap between career and non-career turnover narrowed for employees with between 24 and less than 48 months of tenure but, for example, the turnover rate for non-career employees was more than double that for career employees. As tenure increased, the non-career portion of the USPS workforce diminishes in size because an increasing number of non-career employees will have converted to career positions or will have separated from USPS. For example, most non-career city carriers convert within 2 years of employment, according to USPS officials.32
Table 3: U.S. Postal Service’s (USPS) Non-Career and Career Employee-Initiated Fiscal Year 2020 Turnover Rates by Tenure
Tenure in Months
Non-Career Turnover (Percentage)
Career Turnover (Percentage)
Percentage-Point Difference
12 to < 24 22.9 8.8 14.1 24 to < 36 12.6 5.6 6.9 36 to < 48 11.1 4.6 6.5
Source: GAO analysis of USPS data. | GAO-21-556
Our regression analysis also found that less tenure was associated with higher employee-initiated turnover, and in examining the relative association between employee-initiated turnover and a number of factors,
30 We conducted our actuarial analysis of turnover rates by tenure for all employees in fiscal year 2020 based on USPS fiscal year 2016 through 2020 payroll data. (For more details on the actuarial analysis of turnover rates by tenure, see appendix I.)
31 We focused our actuarial analysis of turnover rates by tenure on fiscal year 2020 so that we could measure tenure for employees that separated in the latest fiscal year in our study period by tracking their employment history from the previous 5 years. We selected this approach because, according to USPS officials, the start dates for its employees may change for various reasons we described above. Because of data limitations, our analyses controlling for tenure was limited to fiscal year 2020, and controlling for tenure may have differed in the prior 4 fiscal years. However, we did find that overall turnover rates, including employee-initiated turnover rates, were quite similar across all 5 fiscal years.
32 USPS officials told us this prior to the ratification of the 2019 through 2023 negotiated agreement between USPS and National Association of Letter Carriers, which provides for automatic conversions of non-career city carriers to career positions after 24 months of employment.

Page 17 GAO-21-556 U.S. Postal Service
we identified that non-career status was more influential than tenure in predicting employee-initiated turnover.33
Specifically, we found that, when examining employees with up to 5 years of tenure, career status had a greater association with turnover than did tenure.34 Thus, features distinct to non-career positions may contribute to employee-initiated non-career turnover. This finding aligns with academic literature we reviewed that found contingent workers typically have higher turnover rates than permanent employees.35 Moreover, the postal employee groups we interviewed identified features distinct to non-career positions beyond tenure that could drive turnover.36
• Variable schedules. All of the six postal employee groups we interviewed told us that non-career employees often leave their positions because their schedules are unpredictable. In particular, non-career employees may be required to work schedules that vary significantly from day to day or week to week. For example, non-career postal clerks are guaranteed a minimum of just 2 to 4 hours each day that they are scheduled, depending on the size of their facility. But according to the postal clerk union, some postal clerks may be assigned a large number of hours in a week, sometimes as much as 70 hours in a week. According to officials from one postal
33 We conducted our regression analysis based on 2-week pay period data in order to capture the effect of factors that vary each pay period and which are associated with turnover, such as the amount of overtime worked. Because the regression analysis was based on pay-period data, the analysis accounts for employees who were hired and separated multiple times during a given year.
34 Among employees with more than 5 years of tenure, there is a lower proportion of non-career employees because many will have converted to career positions or left USPS. Turnover is also more prevalent in the first few years of employees’ tenure.
35 The term “contingent worker” refers to a variety of workers, including temporary workers and contract workers. The non-career positions within USPS generally fit within the broader term of contingent worker. Seven of 13 articles we reviewed addressing employee turnover stated that contingent workers are more likely to have higher turnover than “permanent” employees, including those with standard schedules. This was due to several reasons, including higher work demands, unpredictable schedules, lower motivation, and lower organizational commitment.
36 Postal employee groups also identified features related to tenure that they associated with turnover, including managerial relationships. While managerial relationships for non-career employees is linked to being new and learning about the work, according to postal management associations these relationships are also defined by the work requirements of non-career employees, such as with how managers assign non-career employees schedules and routes.

Page 18 GAO-21-556 U.S. Postal Service
union, schedule uncertainty can make it difficult for employees to attend to personal responsibilities, such as childcare, or meet financial responsibilities, with some having to plan around a second job. Literature we reviewed also identified unpredictable schedules as a feature associated with higher turnover among “contingent workers.”37
Postal union officials also told us that, compared to career employees, non-career employees have less ability to choose work shifts; the same situation applies to the amount of overtime they work. According to collective-bargaining agreements, non-career employees work overtime at supervisory discretion. Overtime provides additional pay to employees, an outcome that may explain the willingness to work up until a certain point, but too much overtime may result in employees feeling overworked. According to officials from one of the carrier unions, non-career employees might work from 7 a.m. until 9 p.m. or even later to complete work from multiple routes. In our January 2020 report, we found that, on average, a non-career employee worked an additional 30 straight hours, 73 overtime hours, and 23 night and Sunday hours per year relative to a career employee.38
• Challenges accruing and scheduling leave. According to four of the six postal employee groups that we interviewed, non-career employees face challenges in accruing and scheduling leave, challenges that can affect their willingness to remain at USPS. Non-career employees generally accrue 1 hour of annual leave for each unit of 20 hours worked, up to 4 hours a pay period, and six paid federal holidays, which is comparable to career employees with less than 3 years of tenure.39 Career employees with 3 years or more of tenure, however, accrue leave at a faster rate.40 In addition, most non-career employees cannot carry over leave from one year to the next—
37 See, for example, J.E. Martin, Robert R. Sinclair, Ariel M. Leichook, Jenell L.S. Wittmer, and Kristin E. Charles, “Non-standard work schedules and retention in the entry-level hourly workforce,” Journal of Occupational and Organizational Psychology, vol. 85, issue 1 (2012): 1-22.
38 GAO-20-140.
39 Non-career rural carriers accrue leave benefits when serving a vacant route or in the absence of the regular carrier in excess of 90 days and when assigned to an auxiliary route in excess of 90 days. They generally do not receive holiday pay.
40 Career employees with between 3 and 15 years of tenure accrue 6 hours for each biweekly pay period plus 4 hours in the last full pay period in the calendar year. Career employees with 15 or more years of tenure accrue 8 hours for each biweekly pay period.

Page 19 GAO-21-556 U.S. Postal Service
at the end of the year, they are compensated for any unpaid leave and they start the next year with no accrued leave. According to representatives from two postal unions, leave takes time to accrue, so until non-career employees accrue leave, they may face challenges scheduling appointments or taking time off for personal events. Having leave accrual reset each year, which applies to three of the four postal unions, can exacerbate these challenges.41 Moreover, according to representatives from two postal unions, even if non-career employees accrue leave, they may not always be able to take leave due to work demands, particularly around the holiday season or due to low staffing levels.
• Lower compensation. Four of the six postal employee groups we interviewed identified lower pay and benefits as key features in driving non-career turnover. USPS generally does not adjust pay or benefits based on the location of employment, making the relatively lower pay of non-career positions less competitive in certain geographic areas.42 Our analysis found that areas with higher costs of living than the national average were associated with higher rates of turnover than areas at or below the national average.43
USPS officials stated that they expect non-career employees in high-cost areas with competitive markets to separate at higher rates because they seek jobs with better pay. Indeed, USPS has faced challenges filling non-career positions in some high-cost areas. For example, in 2018 USPS OIG reported that the San Francisco District had been unable to hire or retain sufficient non-career carriers because the hourly pay rate was insufficient to sustain the cost of
41 For non-career city carriers, mail handlers, and postal clerks, unused annual leave is paid out at the end of each year.
42 USPS OIG previously recommended that USPS consider instituting locality pay–adjusting pay based on local market conditions–to save expenses in some areas and enhance the quality and stability of its workforce in others. However, USPS OIG reported that implementing such a system would be challenging, require careful planning, and may not reduce costs. See U.S. Postal Service Office of Inspector General, Locality Pay, RARC-WP-14-008 (Arlington, Va.: Feb. 7, 2014).
43 We selected high cost of living as a negative proxy measure for employee pay because using a direct pay measure could skew the reliability of the model’s estimation. For additional technical details about our analysis, see appendix I.

Page 20 GAO-21-556 U.S. Postal Service
living in the San Francisco area. 44 Employees may partially offset some of the challenges associated with the lower pay by working assigned overtime hours or night work hours for which USPS provides additional pay.45 According to our analysis, working night hours past 6 p.m. was also associated with less turnover.
• Conversion uncertainty. Uncertainty for some non-career employees about when they may convert to a career position can contribute to higher turnover. As noted above, USPS relies on its non-career employees to convert to career employees, but these employees may have waited for variable amounts of time. All of the six postal employee groups we interviewed told us uncertainty regarding the timing of conversion to career status could make non-career employees less likely to stay with USPS. Conversions from non-career to career within each occupation type occur in response to one of several triggering events, all of which are outside of non-career employees’ control and none of which occur at regular intervals.46
According to USPS and postal employee groups, non-career employees convert to career positions at varying rates. For example, USPS officials told us that most non-career city carriers converted to a career position within 2 years of employment, prior to the agreement ratified in March 2021 that would provide automatic conversions after 2 years of employment. In comparison, non-career rural carriers take
44 The hourly pay rates for non-career city carriers was $15.68 in November 2014 and increased in increments to $16.78 by December 2017. U.S. Postal Service Office of Inspector General, Sunday Operations – San Francisco District, DR-AR-18-003 (Arlington, Va.: May 1, 2018). In July 2019, USPS OIG also reported that a post office in Denver had constant challenges filling letter carrier vacancies due in part to USPS’s inability to offer competitive compensation. U.S. Postal Service Office of Inspector General, Mail Delivery Issues – Bear Valley Station, Denver, CO, DRT-AR-19-009 (Arlington, Va.: July 12, 2019).
45 Career employees who want to work overtime hours are placed on the “overtime desired list.” Managers assign overtime hours to employees on the overtime desired list based on seniority. After the list is exhausted, managers can assign overtime hours to non-career employees. USPS does not maintain an overtime desired list for non-career employees.
46 According to USPS officials, four circumstances may trigger conversions from non-career to career: (1) career employee attrition creates a vacancy, (2) creation of a new route requires additional employees, (3) USPS hiring in excess of the number of non-career employees allowable per union contracts requires conversion of some non-career employees, or (4) a union-negotiated agreement provides for one-time conversions of non-career employees who meet certain criteria. In addition, the 2019 through 2023 negotiated agreement with National Association of Letter Carriers provides for automatic conversions of non-career city carriers to career positions after 24 months of employment.

Page 21 GAO-21-556 U.S. Postal Service
longer to convert to a career position. According to the rural carriers’ postal union, non-career rural carriers convert to career positions after on average 6.7 years of employment. In analyzing conversion data for fiscal year 2019, we found that 4.6 percent of non-career rural carriers with between 12 and less than 24 months of tenure converted to a career position and that some non-career rural carriers converted to a career position after 20 years of tenure.47
• Manager relationships. According to all of the four postal unions we interviewed, managers do not consistently support new employees, a factor that can affect turnover. In particular, representatives from three of these postal unions said busy managers sometimes do not provide adequate attention to new employees, such as allowing questions or easing them into new delivery routes. When examining turnover rates at the facilities level, we found wide variability in turnover. Specifically, when we examined facilities or groups of facilities with 150 or more non-career employees in fiscal years 2016 through 2020, non-career annual employee-initiated turnover rates ranged from as low as 7.1 percent to as high as 39.7 percent in a given year.48 This variability could not be explained by local cost of living or unemployment rates and could be associated with factors such as local management practices and facility size.49
Representatives from both postal management associations we spoke with said that when non-career employees cite poor managerial relationships as a reason for resigning, the underlying cause might be how managers assign their work schedules. These schedules are
47 We analyzed USPS payroll data to determine employee tenure at time of conversion for conversions occurring in fiscal year 2019.
48 We conducted an analysis of lead finance units, facilities or groups of facilities, with at least 150 non-career employees, at least 50 non-career employee-initiated separations and at least 70 non-career total (employee- and employer-initiated) separations in a fiscal year. We chose facilities with a larger number of non-career employees to ensure that turnover rates would not be disproportionately affected by lead finance units that only have a few employees or that may be missing data for a few employees. In addition, we selected facilities experiencing a certain degree of employee- and employer- initiated turnover to represent both types of turnover. See appendix I.
49 Our analysis of lead finance units with 150 or more non-career employees found some lead finance units in low-cost-of-living areas in the Midwest or mountainous regions had high turnover rates comparable to lead finance units in high-cost-of-living areas. In addition, some lead finance units in high-cost-of-living regions on both the East and West coasts had among the lowest turnover rates. We also analyzed turnover in lead finance units with 60 or more non-career employees. For additional information on these analyses and results, see appendix I.

Page 22 GAO-21-556 U.S. Postal Service
governed by the agreements negotiated with the unions and informed by workload demands. In addition, representatives from one postal union told us that due to uncertain work schedules some non-career employees may take time off to address personal issues and, as a result, face disciplinary measures.
USPS officials noted that some of the features identified as affecting non-career turnover—especially work schedules and compensation—are governed by the negotiated agreements with employee unions and represent both parties’ best efforts to balance competing priorities. In addition, the officials noted that lower compensation was not among the top reasons identified by employees in recent exit surveys. A 2020 USPS OIG report, which reviewed data from employee exit surveys with an overall response rate of about 28 percent, identified top reasons non-career employees gave for resigning as—”lack of schedule flexibility,” “didn’t like supervisor,” “physical demands,” “not enough hours,” and “too many hours.”50 USPS has identified ways to address non-career turnover, discussed below; some of them are associated with distinct characteristics of non-career positions.
Non-career turnover, whether initiated by an employee or by USPS, creates a variety of costs and operational challenges for USPS, according to USPS and postal employee groups. While acknowledging these costs, USPS officials we spoke with stated that any such costs are much lower than the costs of filling these positions with career employees. In response to a USPS OIG report calling for USPS to measure costs related to non-career employee turnover, USPS officials told us they were in the process of estimating the cost of hiring non-career employees.51 We used USPS new-hire cost data along with the non-career employee turnover rates we calculated to identify the new-hire costs associated with non-career turnover. In addition, we reviewed analysis from the USPS OIG to identify overtime and premium pay costs associated with non-career turnover.
50 U.S. Postal Service Office of Inspector General, Effectiveness of the Postal Service’s Efforts to Reduce Non-Career Employee Turnover, 19POG001SAT000-R20 (Arlington, Va.: Feb. 12, 2020). 51 U.S. Postal Service Office of Inspector General, Effectiveness of the Postal Service’s Efforts to Reduce Non-Career Employee Turnover, 19POG001SAT000-R20 (Arlington, Va.: Feb. 12, 2020).
Non-Career Employee Turnover Resulted in Costs and Operational Challenges

Page 23 GAO-21-556 U.S. Postal Service
• New-hire costs. Between fiscal years 2016 and 2020, USPS spent an estimated average of about $120.9 million annually on new-hire costs associated with non-career turnover, based on our analysis of USPS data.52 We calculated these costs based on the assumption that USPS would generally replace a non-career employee who separates and, as a result, incur new-hire costs. New-hire costs included background checks, onboarding, and upfront training and, in fiscal year 2019, ranged from an average of $1,112 per mail handler to $3,073 per rural carrier, according to USPS’s estimates.53 These costs do not include on-the-job or refresher training. USPS officials stated that they do not track such costs and that such information would be difficult to collect, given the variability among different positions. According to USPS officials, such training is less structured for postal clerks and mail handlers than for carriers.
• Overtime and premium pay. USPS documentation identified non-career employee turnover as a factor in overtime costs. According to a USPS OIG report on the Northeast area, non-career employee turnover may require other employees to work overtime to accomplish the work of the employee who left.54 In 2017, USPS OIG related vacant positions to turnover and reported that if management filled 435 vacant non-career city carrier positions in the Northeast area, USPS could have mitigated at least 781,695 overtime hours at a cost of over $6.3 million based on the annual average number of workhours per employee.55 Although overtime costs may be offset by
52 For each fiscal year, using the number of non-career employee separations from our actuarial analysis, we applied the new-hire cost per employee for that occupation type. According to USPS officials, employees who separate and return within a year will not incur any new-hire costs, and that approach is how we conducted our analysis. USPS provided cost data for only fiscal years 2018 through 2020, so we took the average costs for fiscal year 2018 to calculate the costs for fiscal years 2016 and 2017. We then adjusted the new-hire costs we calculated per fiscal year to fiscal year 2020 dollars. This calculation analysis excluded holiday workers and non-career employees outside of the four main occupation types because they are outside of the scope of our turnover analysis.
53 On average, rural carriers accounted for 46 percent of the annual new-hire costs of turnover between fiscal years 2016 and 2020. According to USPS officials, USPS hires non-career rural carriers more frequently than other occupation types, in part due to turnover, but also, unique to the occupation type, so that rural non-career employees can cover for career employees when they take leave.
54 U.S. Postal Service Office of Inspector General, Management of Overtime in the Northeast Area, HR-AR-17-014 (Arlington, Va.: Sept. 14, 2017).
55 U.S. Postal Service Office of Inspector General, Management of Overtime in the Northeast Area, HR-AR-17-014 (Arlington, Va.: Sept. 14, 2017).

Page 24 GAO-21-556 U.S. Postal Service
the compensation cost savings associated with a vacant position, they underscore an indirect cost associated with turnover-caused vacancies. The extent of the non-career vacancies can be sizable; in fiscal year 2019, the number of non-career delivery employees, which included non-career city carriers, in the Pacific Area was 23 percent below the authorized staffing level.56 While overtime costs associated with these vacancies may not all be attributed to turnover, some overtime costs may result from the non-career employee recruitment and retention challenges USPS has identified.
Besides new-hire, overtime, and premium pay costs, non-career turnover also results in challenges to USPS operations, which USPS officials told us are difficult to assign a cost. According to postal employee groups, USPS, and the USPS OIG, non-career turnover can affect USPS productivity, efficiency, and service.
• Productivity. All six postal employee groups we interviewed stated that high non-career turnover affects the continuity of operations and employee productivity for experienced non-career and career employees. For example, experienced employees often informally train newer employees on how to perform tasks, which can reduce the trainer’s productivity. In addition, experienced employees may have to work harder or longer to fix mistakes made by less-experienced employees.
• Efficiency. Four of the six postal employee groups we interviewed stated that high non-career turnover results in a greater proportion of new and, consequently, less-efficient employees. Newly hired employees are less efficient and more likely to make mistakes because of their inexperience with the work or unfamiliarity with delivery routes. These factors can lead to service issues such as mistakes in processing, forwarding, or holding mail.
• Service. High non-career employee turnover can also reduce service performance, particularly mail delivery. According to USPS documentation we reviewed, USPS cited that improving non-career retention could improve service performance. Turnover of these
56 U.S. Postal Service Office of Inspector General, Assessment of Overtime Activity, 20-209-R20 (Arlington, Va.: Aug. 25, 2020).

Page 25 GAO-21-556 U.S. Postal Service
employees can be associated with mail delay, according to USPS OIG, for the time that these positions are unfilled.57
USPS has established metrics to monitor non-career employee turnover. Specifically, in fiscal year 2016, USPS established non-career turnover rate goals at the “lead finance” level, based on prior performance, in its National Performance Assessment.58 When asked how USPS holds field managers and local supervisors accountable to these turnover goals, USPS officials told us non-career turnover rates are linked to compensation for non-bargaining-unit employees, a category that includes managers and supervisors. We found that USPS did not meet its target rates each fiscal year from 2016 through 2020.59 USPS officials stated that, overall, the cost savings realized by increasing the proportion of non-career employees in the USPS workforce—billions of dollars—outweighs the costs incurred. However, USPS has acknowledged that it has not met its non-career employee turnover reduction targets and has taken steps in recent years to monitor and reduce this turnover.
In response to high non-career employee turnover rates, USPS implemented a variety of initiatives as early as fiscal year 2014, according to USPS officials and documentation we reviewed.
• Recruiting and onboarding. According to USPS officials, USPS took steps to help both prospective employees and USPS determine their level of compatibility for the non-career position. USPS began showing prospective hires new videos intended to provide realistic depictions of working conditions. They also began administering an entry-level assessment tool to better identify prospective hires with valued traits such as resilience, and they updated new-hire training.
57 U.S. Postal Service Office of Inspector General, Delivery and Customer Service Operations – New Hampshire, 20-205-R21 (Arlington, Va.: Dec. 14, 2020).
58 “Lead finance” units are USPS facilities or groups of facilities (such as post offices). 59 We compared USPS’s National Performance Assessment target rates to USPS’s calculated turnover rates for fiscal years 2016 through 2020. USPS target rates were weighted based on prior year performance, with the exception of fiscal year 2020. USPS calculates both for the last month of the fiscal year, whereas we calculated turnover rates based on the number of employees who separated within each fiscal year. USPS OIG also reported that USPS non-career turnover was higher than its target turnover rates for fiscal years 2016 through 2019. See U.S. Postal Service Office of Inspector General, Effectiveness of the Postal Service’s Efforts to Reduce Non-Career Employee Turnover, 19POG001SAT000-R20 (Arlington, Va.: Feb. 12, 2020).
USPS Monitors Turnover and Has Taken Steps to Reduce Non-Career Employee Turnover

Page 26 GAO-21-556 U.S. Postal Service
• Compensation and benefits: USPS has been increasing non-career compensation and benefits and adjusting its overtime rules in favor of non-career employees since 2014 as part of its collective-bargaining process with the postal unions. For example, according to the postal clerks’ collective-bargaining agreement for 2018 through 2021, non-career postal clerks earn overtime after working 8 hours in a day, whereas they were previously required to work 40 hours in a week before receiving overtime pay.
• Union-negotiated conversions to career. Since 2016, national agreements and settlements between USPS and the postal unions have provided for conversion of over 11,000 non-career employees to career positions. In addition, in March 2021, USPS officially reached a national agreement with the city carrier postal union to convert non-career city carriers to career positions after 2 years of employment. According to USPS officials, providing a certain timeline for conversion could help mitigate some non-career city carrier turnover.
• Task forces. USPS and the rural carrier postal union established two task forces to address retention and the workplace environment. According to union representatives, this work will specifically target issues related to rural carriers and can address high turnover. According to USPS officials, USPS has similar but less formal efforts with other postal unions.
Our analysis found that non-career employee turnover rates have decreased slightly over our study period of fiscal years 2016 through 2020, and postal employee groups had mixed views of the efficacy of USPS’s initiatives to decrease turnover. Overall, from fiscal year 2016 through 2020, the rate of non-career employee-initiated turnover fell by 0.1 percentage point, from 20.4 percent to 20.3 percent. In addition, the decrease was greater according to our analysis of lead finance units (facilities or groups of facilities) representing 150 or more non-career employees, for which the rate decreased by 3.8 percentage points, from 26.6 percent to 22.8 percent. (For more information on non-career employee-initiated turnover by fiscal year, see appendix I.) When asked about the efficacy of USPS’s turnover-related initiatives, postal employee groups provided mixed views. For example, representatives from two postal unions stated that these efforts could help prevent hiring people who are not compatible for the position, whereas a representative from a postal management association stated that expectations could be better managed by being clearer about the realities of the position.

Page 27 GAO-21-556 U.S. Postal Service
In addition to the initiatives discussed above, in March 2021, USPS issued a new strategic plan that made it a priority to reduce non-career turnover over the next ten years. Specifically, USPS set a goal to reduce non-career turnover by half, implement programs that improve the non-career experience, and expand programs that support training, career planning, and opportunities for advancement.
Furthermore, according to USPS officials and two postal unions, as of April 2021, USPS is working toward a national initiative to improve the new-hire experience for non-career employees. USPS officials told us that in the past they generally have deferred managing turnover to local management due to variable local conditions. However, the officials said this national initiative would provide best practices for locales in which high levels of non-career turnover and absences had been particularly problematic, situations that have been further exacerbated by COVID-19.60
Thus far, USPS has conducted four focus groups across the country to determine best practices on retention, and participants were included from both low- and high-retention postal offices, according to the two carrier postal unions. In preliminary documentation we reviewed about the initiative, USPS had identified strategies to respond to challenges non-career employees raised from exit surveys and plans for a workforce- planning committee to review the results of the initiative and identify lessons learned. USPS has previously established retention strategies targeting the initial phase of the non-career experience, but USPS OIG reported that USPS did not hold areas and districts accountable for implementing these strategies.61 These efforts demonstrate USPS leadership’s recognition of the non-career turnover challenge, its efforts to include stakeholders in the process to identify strategies to improve the 60 USPS’ strategic plan Delivering for America reported that during the COVID-19 pandemic the cumulative number of employees quarantined reached 122,913 out of 644,000, and the non-career employee turnover rate was 40 percent. See, U.S. Postal Service, Delivering for America: Our Vision and Ten-Year Plan to Achieve Financial Sustainability and Service Excellence (March 2021). We calculated turnover rates only through the end of fiscal year 2020, examining turnover based on employee status at the beginning and throughout each fiscal year.
61 USPS reported that it had established a comprehensive strategy addressing retention of non-career employees, including focusing on the employee experience during the first 90 days. In 2014, USPS had established a plan to support non-career city carriers, but did not hold areas and districts accountable for its implementation. Further, USPS OIG pointed out that the plan included only a short-term measure around scheduling. See U.S. Postal Service Office of Inspector General, Non-Career Employee Turnover, HR-AR-17-002 (Arlington, Va.: Dec. 20, 2016).

Page 28 GAO-21-556 U.S. Postal Service
non-career experience, and its plan to evaluate the results of its strategies.
According to our analysis of USPS and FECA data from fiscal years 2016 through 2020, non-career employees had higher injury rates than career employees even when we controlled for employee tenure and other factors.62 We will first present overall, descriptive findings from our analysis of injury rates. Then we will present findings from our regression analysis, which enabled us to examine the strength of association between injury rates and a variety of factors—career status, occupation type, tenure, overtime work, night work, postal facility, age, gender, race, and ethnicity.
Non-career employee injury rates were higher than career injury rates whether we examined USPS data on reported injuries or FECA injury data.63 Specifically, non-career employee rates of reported injury and FECA injury were about 50 percent higher and 43 percent higher,
62 Our study period included fiscal year 2020, which included disruptions related to COVID-19 beginning in March 2020. Our analysis of data on reported injuries and FECA injuries found lower injury rates in fiscal year 2020 as compared to prior fiscal years. For example, rates of reported injury were 12 percent and 9 percent lower in fiscal year 2020 compared to fiscal year 2019 for non-career and career employees, respectively. Accordingly, we presented the fiscal year 2020 findings together with the other fiscal years in the study.
63 We examined both reported and FECA injuries because reported injuries are more likely to include minor injuries such as scrapes and small bruises, whereas FECA injuries are more likely to be associated with more severe injuries that have created significant costs for the employee, USPS, or both.
Non-Career Employees Had Higher Injury Rates, But USPS Does Not Analyze this Information Non-Career Employees Had Higher Injury Rates than Career Employees Even after Controlling for Tenure and Other Factors

Page 29 GAO-21-556 U.S. Postal Service
respectively (see fig. 2).64 Overall, reported injuries and FECA injuries for all career and non-career employees were about 273,000 and 230,000, respectively, for our 5-year study period.
Figure 2: Average Annual Rates of U.S. Postal Service Employees’ Reported Injuries and Federal Employees’ Compensation Act (FECA) Injuries by Career Status, Fiscal Years 2016 through 2020
Note: FECA injuries refer to incidents associated with workers’ compensation claims, regardless of whether the claims have been adjudicated by Department of Labor.
Non-career city carriers, mail handlers, and postal clerks consistently had higher rates of reported and FECA injuries than career employees in the same occupation type, though the gaps between career and non-career
64 According to USPS officials, rates of reported injuries may be higher among newer employees—the vast majority of whom are non-career—because new-employee training emphasizes the importance of reporting all accidents and injuries, no matter how minor. Employees with more tenure, many of whom are career employees, may be less likely to report minor injuries.

Page 30 GAO-21-556 U.S. Postal Service
employees within each occupation type varied through the study period.65 The gap between non-career and career employees was greatest for city carriers, with an average annual difference of 78 percent for reported injuries (21 percent and 12 percent, respectively) and 71 percent for FECA injuries (18 percent and 11 percent, respectively). (For more information on reported injuries and FECA injuries by occupation type, see appendix I.)
Representatives of postal unions and management associations, as well as USPS, told us that these higher injury rates, at least in part, can be attributed to the fact that non-career employees are often new. Specifically, officials from four of the six postal employee groups we interviewed noted that newer employees—who are almost all non-career—have less experience on the job, which can lead to injuries. For example, officials from a union representing city carriers told us that relatively new city carriers are more likely to be unfamiliar with hazards on their routes such as dangerous intersections. In addition, they told us that newer employees are less physically ready for the job and therefore more susceptible to injury. USPS officials we spoke with also attributed higher injury rates among non-career employees to relative inexperience. They told us that newer employees are more likely to make mistakes that lead to injury. They also told us that newer employees are more likely to report injuries—even minor injuries—because reporting all accidents and injuries is highly emphasized in training for new employees.
Non-career employees also had higher injury rates when we controlled for other factors, such as tenure on the job, for fiscal years 2016 through 2020. To understand whether higher injury rates among non-career employees were mostly due to relative inexperience or other factors, we conducted regression analyses to control for a variety of factors that may affect injury rates, including tenure, age, health insurance, occupation type, overtime work, night work, and postal facility. We found that status as a non-career employee was associated with a 22 percent higher rate of reported injuries and a 16 percent higher rate of FECA injuries when
65 Injury rates among career rural carriers were slightly higher than among non-career rural carriers. Specifically, career rural carriers had a 6 percent higher rate of reported injuries than non-career rural carriers (8.3 percent and 7.8 percent, respectively) and a 13 percent higher rate of FECA injuries (7.2 percent and 6.4 percent, respectively). According to the union representing rural carriers, rural carriers often face short-staffing situations and have fewer non-career employees than desired. A shortage of non-career employees can necessitate that career employees work their relief days, in some cases for many weeks in a row. Without regular relief days, career employees may be more susceptible to injury.

Page 31 GAO-21-556 U.S. Postal Service
we controlled for those factors. As a result, it is likely that features of the non-career position contribute to higher injury rates among non-career employees. (For more detail on our regression analyses along with more detailed results, see appendix I.)
Our finding that non-career employees are more likely, when controlling for tenure and other factors, to be injured aligns with literature we reviewed that also controlled for tenure. Of the five articles we reviewed addressing employee safety incidents and injuries, one controlled for company, age, and tenure and found that contractors were a third more likely to be involved in a safety incident than permanent employees. The other four articles found that temporary employees were more likely to be involved in an injury or safety incident but did not control for factors other than employee type.66
Employee postal groups we spoke with suggested reasons for why, in addition to low tenure, non-career employees have higher injury rates. In particular, postal unions and management associations identified features of non-career positions that may drive higher injury rates.
• Work hours. Officials from all six postal employee groups we interviewed stated that some non-career employees work longer shifts and more night work than career employees, which can contribute to injuries. For example, officials from the city carrier union stated that non-career employees are often required to work routes in the dark, which can be particularly dangerous if hazards such as broken steps or cracks in sidewalks are more difficult to see. Moreover, officials from the rural carrier union indicated that some non-career employees may start work at 7 a.m. and still be working at 9 p.m. when required to split routes. Our analysis supported a connection between night work and injuries. Specifically, we conducted a regression analysis and found that night work during the pay period of injury was
66 We identified five articles that addressed likelihood or severity of employee safety incidents or injuries. Among these articles, there was variation in the types of employees studied (temporary workers, contractors) and in the types of injuries studied (safety incidents, accepted workers compensation claims, and OSHA-recordable injuries). The four articles that addressed likelihood of injury or safety incident found that temporary employees or contractors were more likely to be involved in an injury or safety incident, and one of these controlled for company, employee age, tenure in industry, and tenure with current employer. One article addressed injury severity rather than likelihood of injury and found that employees with a temporary contract, if subject to a workplace accident, were more likely to face severe injuries than permanent employees.

Page 32 GAO-21-556 U.S. Postal Service
associated with higher rates of reported injury, controlling for other factors.67
• Manager expectations. Officials from five of the six postal employee groups told us that some non-career employees may face more pressure from managers than career employees. For example, officials from one union told us that in a short-staffing situation, managers may require a single non-career employee to operate a machine that should be operated by two people while still expecting the employee to meet timeliness requirements. According to these officials, having a single person operate a machine that should be operated by two people is risky and can lead to higher rates of injuries. Officials from another union stated that managerial pressure may come in the form of unrealistic expectations—telling a non-career employee that a task should take 4 hours instead of 6 hours—either intentionally to accelerate work speed or because the manager does not account for an employee’s relative lack of experience. Non-career employees may be particularly susceptible to such pressure because they want to keep their job. Officials from postal employee groups provided several examples of risks employees may take under management pressure—failure to curb wheels, failure to put on seat belts, running instead of walking, and jumping fences.
• Building expertise. Officials from five of the six postal employee groups told us that non-career employees may be more susceptible to injury because it can be more challenging for them to build expertise. Specifically, non-career employees are more likely to be moved around among a broad variety of tasks and are more likely than career employees to be required to work unfamiliar routes. For example, non-career city carriers may be required to work sections of 40 or more different routes, depending on the size of the office, according to union officials. These officials stated that working unfamiliar routes, which non-career employees are required to do much more frequently than career employees, can expose non-career carriers to hazards they may not know about such as dogs, broken steps, or cracks in sidewalks.
67 Research has found that shift work, including night work, carries a substantial increased risk of accidents. Anthony Sverre Wagstaff and Jenny-Anne Sigstad Lie, “Shift and night work and long working hours—a systemic review of safety implications,” Scandinavian Journal of Work, Environment & Health (2011): 173-185. Our analysis also found that reported injuries were higher at certain times of the year—specifically in December and January. December and January include the holiday season, during which USPS experiences peak mail volume and a greater share of the workforce being relatively inexperienced due to the influx of holiday workers.

Page 33 GAO-21-556 U.S. Postal Service
USPS officials noted that the work rules that govern the non-career and career employee experiences—including hours worked and the degree to which employees are required to move around among different tasks and routes—are the result of the collective-bargaining process between USPS and employee unions, and represent both parties’ best efforts to balance competing priorities. They provide USPS operational flexibility and cost savings that USPS views as essential to continuing to function, especially given its financial situation.
Higher rates of injury among non-career employees led to higher average workers’ compensation costs per employee for employees with limited tenure, according to our analysis of fiscal year 2019 data.68 When USPS employees—including career employees and non-career employees (including holiday employees)—are injured in a workplace-related incident, they may receive workers’ compensation payments, including those for medical expenses, compensation for lost work hours, and others. We examined average workers’ compensation costs—that is, total workers’ compensation costs in a group (career or non-career) divided by the number of employees in that group (career or non-career). For our analysis of fiscal year 2019 data, we limited our analysis to FECA costs associated with injuries incurred in that fiscal year.69 We found that the workers’ compensation average incurred costs per employee with limited tenure were higher for non-career employees than for career
68 We compared employees with between 12 and less than 48 months of tenure because there are relatively few career employees with fewer than 12 months of tenure and relatively few non-career employees with 48 months or more of tenure. Specifically, in fiscal year 2019, of employees with 12 or fewer months of tenure, just 8 percent were career employees, according to our analysis. In the same fiscal year, of employees with 48 or more months of tenure, about 3 percent were non-career employees. We examined fiscal year 2019 data rather than fiscal year 2020 data because the 2020 experience may be unique because of the effects of COVID-19 on postal operations and workforce. For example, our analysis of reported and FECA injuries found that injury rates were lower in fiscal year 2020 when compared to fiscal years 2016 through 2019. Using fiscal year 2019 data enabled us to examine 4 years of data—fiscal years 2016 through 2019—for employee start dates. We did not examine costs associated with continuation of pay, which is separate from FECA payments and which USPS pays for a maximum of 45 calendar days under certain circumstances associated with job-related traumatic injuries. See 20 C.F.R. § 10.205 for continuation of pay eligibility conditions.
69 For example, when calculating average FECA costs for fiscal year 2019, we only included FECA costs associated with injuries that occurred in fiscal year 2019, and we excluded FECA costs associated with injuries incurred in prior years. Incurred costs included claim payments made in the year of injury and any future payments made in subsequent years for the same claim.
Non-Career Employees’ Injuries Resulted in Higher Workers’ Compensation and Other Costs

Page 34 GAO-21-556 U.S. Postal Service
employees.70 This effect was most pronounced when examining employees with from between 24 and less than 36 months of tenure (see fig. 3). The tenure group with between 12 and less than 48 months included over 72,000 career employees and about 62,000 non-career employees, and workers’ compensation costs for employees in this tenure group alone were about $142 million, from our analysis of fiscal year 2019 data.
Figure 3: Average Per-Employee Federal Employees’ Compensation Act (FECA) Costs for U.S. Postal Service Employees, Fiscal Year 2019, by Career Status
Note: This figure presents information on FECA incurred costs related to injuries that occurred in fiscal year 2019. Incurred costs included claim payments made in the year of injury, plus payments made in fiscal year 2020 for the same claim, plus any case reserve for the estimated value of future payments associated with the claim. We compared employees with between 12 and less than 48 months of tenure because there are relatively few career employees with fewer than 12 months of tenure and relatively few non-career employees with 48 or more months of tenure.
70 Because of data limitations, our workers compensation analyses by career status and tenure was limited to fiscal year 2019, and costs per employee may vary from year to year.

Page 35 GAO-21-556 U.S. Postal Service
According to our analysis, the higher average workers’ compensation costs for non-career employees with between 12 and less than 48 months of tenure is driven largely by the generally higher injury rates for non-career employees, despite factors that might suggest higher workers’ compensation costs per injury for career employees.71 Specifically, the wage-loss portion of worker’s compensation benefits are primarily calculated based on the employee’s wage or salary compensation, and career employees generally receive higher pay than non-career employees with similar tenure. In addition, injured non-career employees may feel less able to take leave to recuperate or rehabilitate due to the relative insecurity of their position. Accordingly, they might return to work sooner, lose fewer days of work, and therefore receive lower wage-loss compensation.
In addition to workers’ compensation costs, employee injuries—whether career or non-career—may result in a variety of additional costs to USPS and employees. Additional USPS costs may include lost work time, overtime costs incurred by employees who fill in for injured employees, and elevated risk of injury for employees who step in for an injured colleague.
• Lost work time. We examined the likelihood that employees with reported injuries lost work time due to the injury. For employees who lost work time due to a reported injury, we calculated the average number of lost hours. We found that non-career employees are about 2 percentage points less likely to lose time than career employees. For those who do lose work time, non-careers lose about 5 percent fewer work hours than career employees, controlling for other factors.
• Overtime and increased work-hour costs. When an employee is injured and loses work time, USPS may need to have others within the same occupation type fill in for the injured employee. This process can require increased workhours, overtime, or both. We reviewed overtime hours in facilities where an employee sustained an injury that led to lost time. We found that overtime and overall workhours increased in the period of the injury and in the period immediately after.
• Elevated risk of injury for other employees. As discussed above, overtime work is associated with higher rates of injury, and more hours of work provides more opportunity for an employee to be
71 The two primary factors affecting average workers’ compensation costs are injury rate and average cost per injury.

Page 36 GAO-21-556 U.S. Postal Service
injured. Accordingly, to the extent injuries lead to lost work time, they also elevate the risk of injury for employees required to fill in for the injured employee.
Costs to employees may include the injury itself as well as less tangible effects such as effects on employee self-confidence and strained relations with colleagues and supervisors, according to a Department of Labor report.72 In addition, injured employees who are out of work for significant time also lose job-specific experience.
While USPS collects data on injuries and takes action to reduce injuries, USPS does not conduct analysis to identify differences in injury rates between career and non-career employees. USPS officials stated that they believe there are no differences between employees based on career status alone. Instead, they believe that any differences between career and non-career employees are primarily attributable to differences in tenure. Nevertheless, as discussed above, our analyses found that non-career employees were injured at higher rates than career employees, even when controlling for tenure.
The USPS process for collecting data on injuries begins with accident reports. According to USPS officials, reporting all workplace accidents, including near misses, is highly encouraged during new-employee orientation. Accident reports include information on the date of the incident, the nature of the incident, and whether the incident involved a personal injury. Some of these reported injuries are OSHA-recordable, such as those leading to medical treatment or lost work hours.73 Once completed, the accident report remains unchanged, but USPS personnel may update the file with information such as medical treatment and lost work time to inform the determination of whether the injury was OSHA-recordable.
72 Occupational Safety and Health Administration, Department of Labor, Adding Inequality to Injury: The Costs of Failing to Protect Workers on the Job (June 2015).
73 OSHA generally describes a recordable injury or illness as: (1) any work-related fatality; (2) any work-related injury or illness that results in loss of consciousness, days away from work, restricted work, or transfer to another job; (3) any work-related injury or illness requiring medical treatment beyond first aid; and (4) any work-related diagnosed case of cancer, chronic irreversible diseases, fractured or cracked bones or teeth, and punctured eardrums. In addition, there are also special recording criteria for work-related cases involving: “needlesticks” and sharp-object injuries, medical removal, hearing loss, and tuberculosis. See 29 C.F.R. Part 1904.
USPS Monitors Employee Injury Data but Does Not Consider Differences between Career and Non-Career Employees in Its Analyses, Limiting Its Ability to Develop Injury-Reduction Strategies

Page 37 GAO-21-556 U.S. Postal Service
Data associated with accident reports feed into a safety dashboard that allows headquarters and field leadership to analyze accident and OSHA-recordable injury data. The dashboard facilitates analysis based on years of service, type and cause of accident, occupation type, and other factors, but not career status. According to USPS officials, they investigate all accidents reported, including near misses, so they can take preventive measures and improve workplace safety. For example, employees involved in accidents may be required to complete mandatory training and supervisors may hold “stand-up talks” if they identify safety issues. USPS headquarters officials believe the dashboard is adequate for these purposes.
In addition to monitoring accident data and addressing specific safety incidents, USPS plans to take additional steps to improve safety. As part of USPS’s national retention initiative, USPS plans to secure adequate driver instructors and emphasize workplace safety checklists. In addition, the strategic plan issued in March 2021 indicates that USPS plans to update its Safety Intervention and Recognition Program to provide insight into best practices and areas of opportunity to address risks and hazards.
While we did not review the efficacy of these actions, USPS’ 2020 annual report stated that the number of employee accidents has fallen each year since fiscal year 2015,74 and our analyses of reported and FECA injuries also show a decline in injury rates over the study period. However, the difference in injury rates—whether reported injuries or FECA injuries—between non-career and career employees remained steady through this time, with non-career injury rates consistently higher by similar amounts each year.
As discussed above, while some of the difference in injury rates may be attributable to tenure, our regression analysis shows that some of the difference is attributable to features of non-career positions. While USPS efforts to identify and respond to accidents and injuries—including collecting and analyzing data, investigating accidents, taking preventative measures, improving training, and more—are internal control activities, those efforts are limited by a lack of clarity regarding the effect of career status on injury rates. According to COSO internal control principles, an organization should obtain or generate and use relevant, quality
74 U.S. Postal Service, Fiscal Year 2020 Annual Report to Congress (Washington, D.C.).

Page 38 GAO-21-556 U.S. Postal Service
information to support the functioning of internal control.75 Further, USPS policy states that “from the standpoint of both efficiency and economy, preventing personal injuries on and off the job is good business. Injuries cost money, reduce efficiency, and cause human suffering.”76
Without conducting analyses of injuries by career status, USPS may be unable to identify key causes of non-career employee injuries, which may limit its ability to reduce those injuries. For example, USPS may not be aware that non-career city carriers have a significantly higher rate of reported injuries than career city carriers with similar tenure and other characteristics, and so may miss opportunities to target its strategies to reduce injuries.
USPS’s increased use of non-career employees has resulted in billions of dollars of cost savings and has provided the organization with a flexible workforce that can better accommodate changing work demands. However, our analyses suggest that, even controlling for key factors such as tenure, non-career employees have higher rates of turnover and injury, and this circumstance can reduce cost savings and efficiency. USPS has taken and continues to take steps to monitor and potentially reduce turnover among its non-career employees. USPS has also taken steps to monitor and reduce employee injuries in general, but it has not analyzed injury data specific to non-career employees. As a result, it may be hindered in developing and targeting effective strategies to minimize injuries, among these workers. While USPS would be in a much worse financial situation if it had not used more non-career employees in recent years, preventing injuries—aside from the obvious benefit to employees—is also good business. In particular, by analyzing injury data by career status, USPS could help mitigate some of the costs and operational challenges associated with injuries among non-career employees.
The Postmaster General should ensure that executive leaders analyze employee injuries by career status to identify opportunities for reducing employee injuries, particularly among non-career employees. (Recommendation 1)
75 COSO Framework (2013).
76 U.S. Postal Service, Supervisor’s Safety Handbook, Handbook EL-801 (July 2020).
Conclusions
Recommendation for Executive Action

Page 39 GAO-21-556 U.S. Postal Service
We provided a draft of this report to USPS and DOL for review and comment. DOL did not provide any comments. USPS provided written comments that are reprinted in appendix II. In its written comments, USPS accepted our recommendation. USPS noted that future analysis of injuries by career status can enhance accident analysis and the development of training initiatives.
As agreed with your offices, unless you publicly announce the contents of this report earlier, we plan no further distribution until 30 days from the report date. At that time, we will send copies to the appropriate congressional committees, the Postmaster General, the Secretary of Labor, and other interested parties. In addition, the report will be available at no charge on the GAO website at http://www.gao.gov.
If you or your staff have any questions about this report, please contact me at (202) 512-2834 or [email protected]. Contact points for our Offices of Congressional Relations and Public Affairs may be found on the last page of this report. GAO staff making key contributions to this report are listed in appendix III.
Jill Naamane, Acting Director Physical Infrastructure Issues
Agency Comments

Appendix I: GAO Analyses of U.S. Postal Service Employee Turnover, Injuries, and Workers’ Compensation
Page 40 GAO-21-556 U.S. Postal Service
This appendix describes the analyses we performed to examine the relationships between U.S. Postal Service (USPS) employees and turnover, injury, and workers’ compensation outcomes. Ninety-two percent of the USPS workforce is composed of employees represented by the four postal unions, which are roughly organized along occupation types—city letter carriers (hereafter “city carriers”), rural letter carriers (hereafter “rural carriers”), mail handlers, and postal clerks. Within each occupation type, employees are either “career” or “non-career” employees.77 Career employees are considered permanent and receive a range of benefits (e.g., health and retirement) and privileges. Non-career employees receive fewer benefits and lower pay than career employees. Most non-career employees are hired on renewable contracts that offer a pathway to a career position. Some non-career employees are hired on short-term contracts, such as during the holiday season.78
The factors we chose for analysis were selected based on academic studies examining turnover and injuries as well as extensive interviews with USPS and other stakeholders. Data came from a variety of sources and include employee-level information on workhours, pay and benefits, and career status from USPS payroll data; demographic characteristics as well as hire and separation data from USPS human resources (USPS HR) data; Department of Labor Integrated Federal Employees’ Compensation System data (FECA data); and USPS injury data.
The following sections provide information on the primary data sets used and the data reliability steps associated with each of these data sets. Tables 4 and 5 summarize this information.
77 We refer to the career and non-career employee classification as “career status.”
78 According to USPS officials, USPS hires most non-career employees, except for rural carriers, to work for 360 days, after which they are to take a 5-day break before being eligible for reappointment. USPS officials told us that these obligatory breaks in service are excluded from their calculations of turnover, and we followed this practice in calculating turnover; see below.
Appendix I: GAO Analyses of U.S. Postal Service Employee Turnover, Injuries, and Workers’ Compensation
Introduction
Primary Data Sources and Reliability

Appendix I: GAO Analyses of U.S. Postal Service Employee Turnover, Injuries, and Workers’ Compensation
Page 41 GAO-21-556 U.S. Postal Service
Table 4: Data Sets Used
Data Set Agency Brief Description Payroll data U.S. Postal Service
(USPS) Individual-level data (by 2-week pay period) on employees’ earnings and benefits, hours of work (including overtime), career status, start and separation dates
Human resources data USPS Employees’ demographics and reasons for separation Integrated Federal Employees’ Compensation System Data
Department of Labor Payment amounts for medical expenditures and compensation through the Federal Employees’ Compensation Act program
Injury Data from the Enterprise Data Warehouse
USPS Date of injury, cause of incident, incident classification, incident type, lost time due to injury
Source: GAO analysis of data from USPS and the Department of Labor. | GAO-21-556
Table 5: Data Reliability Steps
Data Set Data Reliability Steps Data Reliability Determination U.S. Postal Service (USPS) Payroll data
Reviewed related documentation, interviewed knowledgeable officials, conducted electronic data testing, and reviewed data reliability testing from a prior GAO review
We found these data to be sufficiently reliable to identify employee career status, link individual employees to employees in other data sets, and describe differences between career and non-career employees related to work hours, pay, benefits, and compensation.
USPS Human resources data Interviewed knowledgeable officials and conducted electronic data testing
We found these data to be sufficiently reliable to identify employee demographics and separation types.
Department of Labor Integrated Federal Employees’ Compensation System Data
Reviewed related documentation, interviewed knowledgeable officials, and reviewed data reliability testing from other GAO reviews that used these data
We found these data to be sufficiently reliable to describe differences between career and non-career employees related to workers’ compensation costs.
USPS Injury Data from the Enterprise Data Warehouse
Interviewed knowledgeable officials and conducted electronic data testing
We found these data to be sufficiently reliable to describe differences between career and non-career employees related to rates of reported injury.
Source: GAO analysis of data from USPS and the Department of Labor. | GAO-21-556
We received USPS National Payroll data from fiscal years 2016 through 2020 for individual employees with a detailed summary of an employee’s pay, benefits, and hours worked. Payroll data includes employee pay for standard work time, overtime, and other time with pay differentials (Sundays, nights, holidays, and Christmas), as well as leave, including annual, sick, holiday, military, and other types of leave. See table 6 for a summary description of the types of pay and hours. For each pay category (e.g., straight time, overtime), USPS provided information on the number of hours worked by each employee in a given fiscal year.
Payroll Data

Appendix I: GAO Analyses of U.S. Postal Service Employee Turnover, Injuries, and Workers’ Compensation
Page 42 GAO-21-556 U.S. Postal Service
Table 6: Summary of Variables Related to Pay and Hours for U.S. Postal Service (USPS) Employees
Variable Description Straight time Straight time pay is the total earnings of an employee for hours of work or authorized paid leave in a
service week excluding overtime, Executive Administration Schedule additional pay, and other premium pay.
Overtime work Overtime work is paid at one and one-half times the basic hourly rate for actual work hours in excess of 8 paid hours in a day, 40 paid hours in a service week or, if a full-time bargaining unit employee, on a nonscheduled day.
Penalty overtime Penalty overtime is compensation paid to eligible personnel at two times the employee’s basic straight hour rate for hours described in applicable labor agreements.
Holiday work Holiday work is paid to eligible employees for the hours worked on a recognized holiday or for the hours worked on the employee’s designated holiday, except Christmas. Eligible employees are paid (in addition to any pay for holiday leave to which they may be entitled) their basic hourly straight time rate for each hour worked up to 8 hours.
Night work Night work is a premium pay to eligible employees for all work and paid training or travel time performed between 6:00 pm and 6:00 am.
Sunday work Sunday work is a premium pay for all work and paid training or travel time performed during a scheduled tour that includes any part of a Sunday.
Holiday leave Employees receive holiday leave pay for the number of hours equal to their regular daily work schedule, not to exceed 8 hours. Holiday Leave pay is received instead of other paid leave to which employees might otherwise be entitled on their holiday.
Christmas work Christmas work is paid to eligible employees for the hours worked on Christmas day or the day designated as the employee’s Christmas holiday. Eligible employees are paid at 50 percent of their basic straight hour rate, in addition to authorized holiday leave pay and holiday work pay. Work performed beyond 8 hours is treated as overtime for bargaining unit employees. The Christmas work premium is not paid for overtime hours.
Annual leave Annual leave is provided to employees for rest, for recreation, and for personal and emergency purposes.
Sick leave Sick leave insures employees against loss of pay if they are incapacitated for the performance of duties because of illness, injury, pregnancy and confinement, and medical (including dental or optical) examination or treatment.
Military leave Military leave is authorized absence from postal duties for hours employee would have worked during his or her regular schedule, without loss of pay, time, or performance rating, granted to eligible employees who are members of the National Guard or reserve components of the armed forces.
Continuation of pay leave Federal Employees’ Compensation Act (FECA), as amended provides that employees who suffer job–related disabilities are entitled to continuation of pay for the period of the disability up to 45 days, and compensation for survivors. While USPS employees are not, however, generally entitled to compensation or continuation of pay for the first 3 days of temporary disability, for disability exceeding 14 days or followed by permanent disability, such employees may have any leave used during that 3-day period reinstated or receive pay for that time.
Source: GAO presentation of USPS information. | GAO-21-556
The payroll data contained detailed information on employees’ age, start date, separation date (if applicable), hours of work, earnings, and benefits. See table 7 for a summary description of the types of benefits hours.

Appendix I: GAO Analyses of U.S. Postal Service Employee Turnover, Injuries, and Workers’ Compensation
Page 43 GAO-21-556 U.S. Postal Service
Table 7: Summary of Variables Related to Benefits Hours for U.S. Postal Service (USPS) Employees
Variable Description Health Insurance USPS contribution to health insurance premium for employees. USPS participates in the Federal
Employees Health Benefits Program. We did not include required payments to fund retiree health benefits, even though these required payments include an amount for benefits accruing for current employees.
Life Insurance USPS contribution to life insurance. USPS offers coverage through the Federal Employees’ Group Life Insurance Program. The cost of Basic coverage is fully paid by USPS.
Defined Benefit Pension USPS contributions to the federal defined benefit pension program. USPS participates in the federal retirement program, which provides a defined benefit (e.g., Federal Employees Retirement System), as well as disability coverage. Eligibility is determined by age and number of years of creditable service. We only included the contributions for “normal cost” (the cost of benefits accruing for current employees), not amortization payments designed to fund unfunded liabilities.
Thrift Savings Plan USPS contribution to Thrift Savings Plan (TSP) for eligible employees. Social Security Social Security tax paid by USPS for employee. Newly hired postal employees are covered under Social
Security and Medicare. Medicare Medicare tax paid by USPS for employee. Newly hired postal employees are covered under Social
Security and Medicare. Benefits The sum of health insurance, life insurance, retirement normal cost, TSP, Social Security, and Medicare
taxes. Compensation The sum of dollars from worked hours and benefits.
Source: GAO presentation of USPS information. | GAO-21-556
We separated employees into their respective occupation type and career or non-career status based on their Designation Activity Code.79 We used these individual-level data and linked them with other data, including USPS human resources data, USPS injuries data, and Department of Labor data to estimate the likelihood of turnover and injuries, turnover and injury rates, and workers’ compensations costs, along with any associated productivity losses.
We conducted a data reliability assessment and found the individual-level payroll data for the fiscal years 2016 through 2020 and provided at the postal facility level was sufficient for our purposes. Prior to fiscal year 2016, USPS payroll data could not be used to distinguish between career and non-career employees. For this review, we reviewed technical documentation for the dataset, interviewed knowledgeable officials to discuss known limitations and issues with the data. We conducted
79 Designation Activity Code is the combination of the two-digit designation code that indicates an employee’s type of position and workforce designation (such as full-time or part-time) followed with the one-digit activity code that indicates functional area in which the employee is assigned.

Appendix I: GAO Analyses of U.S. Postal Service Employee Turnover, Injuries, and Workers’ Compensation
Page 44 GAO-21-556 U.S. Postal Service
electronic testing of the data by examining missing values and data errors that could affect the validity of analyses using these data. We also obtained clarification from agency officials regarding variable definitions and codes in the data and requested additional data. As a result, we found the individual-level payroll data provided for fiscal years 2016 through 2020 were reliable to identify employee career status, link individual employees to employees in other data sets, and describe differences between career and non-career employees related to work hours, pay, and benefits.
We received USPS human resources data (HR data) with information on employee demographics and separations for fiscal years 2016 through 2020. The data related to demographic characteristics include date of birth, gender, race, and ethnicity.
The HR data related to employee separations include the reason for separation, date of separation, and the most recent designation activity code before the separation. The most common reasons USPS non-career employees separate included resignations, retirements, and terminations. USPS documents the reason for separation by recording the personnel action for an employee, referred to as the nature of action. These nature-of-action codes include the categories of death; removal; resignation (for reasons such as military or charges pending); retirement; separation (for reasons such as disability or transfer); and termination (for reasons cited such as lack of work). See table 8 for descriptions of these variables.
Table 8: Summary of Variables Related to U.S. Postal Service (USPS) Employee Separations
Variable Description Effective date of separation Effective date of the separation action. Personnel number Unique identifier for each employee. Position type Description of employee’s position. For example, City
Carrier Assistant. Nature of action Type of action that took place such as resignations,
terminations, removals, separations due to disability, injury, and transfer.
Process date The calendar date when USPS processed the separation.
Source: GAO presentation of USPS information. | GAO-21-556
We conducted a data reliability assessment and found the HR data for fiscal years 2016 through 2020 were sufficiently reliable for our purposes.
Human Resources Data

Appendix I: GAO Analyses of U.S. Postal Service Employee Turnover, Injuries, and Workers’ Compensation
Page 45 GAO-21-556 U.S. Postal Service
We interviewed knowledgeable officials to discuss known limitations and issues with the data and conducted electronic testing of the data by examining missing values and data errors that could affect the validity of analyses using these data. We interviewed USPS officials regarding the validity of these data. To clarify and document reasons for missing values that we identified, we obtained clarification from agency officials and requested additional data. USPS provided most of the missing values to fill in the gaps we identified in the previous data set USPS had provided. Remaining missing values occurred because the employees never took up the position at USPS following the offer or because of various administrative reasons, according to USPS officials.
We also clarified with USPS the variable definitions and codes used in the data. We examined that the “categorical variables”—such as gender, race and ethnicity—had appropriate Census-defined categories. We also checked that we could match employee identification numbers provided in the demographic file to employee identification numbers in the payroll and crosswalk files. We found the USPS human resources data sufficiently reliable and valid to identify employee demographics and separation types.
We received from the Department of Labor, Office of Workers’ Compensation Programs Federal Employees’ Compensation Act (FECA) data for 2009 through 2020. The FECA program provides compensation and other benefits to federal employees, including USPS employees, who sustain work-related injuries or diseases.80 These data are collected and maintained in the Integrated Federal Employees’ Compensation System.
FECA data include a wide variety of work-related injuries, including cause, type of injury, date that the injury was sustained, compensated medical expenditures (if any), and additional compensation provided. See table 9 for a summary description of variables in the FECA dataset.
80 Under 39 U.S.C. § 1005(c), officers and employees of USPS are to be covered by FECA’s provisions relating to compensation for work injuries.
Integrated Federal Employees’ Compensation System Data

Appendix I: GAO Analyses of U.S. Postal Service Employee Turnover, Injuries, and Workers’ Compensation
Page 46 GAO-21-556 U.S. Postal Service
Table 9: Summary of Variables from Department of Labor Federal Employees’ Compensation Act Data
Variable Definition Case Number Unique numeric identifier for each case Record Type Appropriate record type Date Of Injury Employee’s date of injury Total Amount Paid Total amount paid for medical bill pay and compensation
payments Medical Bills Paid Total amount of medical bills paid Compensation Payments Paid
Total amount of compensation paid, fatal and non-fatal
Gender Claimant’s gender Date Of Birth Claimant’s date of birth Date Of Death Employee’s date of death
Source: GAO presentation of information from the Department of Labor’s Office of Workers’ Compensation Programs. | GAO-21-556
These data contain Personally Identifiable Information on individuals or their survivors who file claims seeking benefits under FECA for sustaining injuries while in the performance of their work. These data include reports of injury by employee or employing agency, claim forms, bills and payment records, compensation payment records, records related to employment, dates of birth and death, social security number of claimant, surviving eligibility data, pay information, and government benefits data.
We matched FECA data with USPS payroll and human resources data from 2016 through 2020 to create a dataset to compare USPS employees, classified as career or non-career, among other characteristics, who received FECA benefits from fiscal years 2016 through 2020. To safeguard the Personally Identifiable Information, we assigned a unique self-generated identifier to each claimant’s records to eliminate the Social Security number from further data manipulation or testing.
We conducted a data reliability assessment and found the FECA data sufficiently reliable and valid for the purposes of our analysis. For this review, we reviewed related information, such as from Department of Labor and previous GAO reports and interviewed knowledgeable officials, among other steps to assess the data reliability. In addition, we reviewed data reliability testing from other GAO reviews that used these data. As a

Appendix I: GAO Analyses of U.S. Postal Service Employee Turnover, Injuries, and Workers’ Compensation
Page 47 GAO-21-556 U.S. Postal Service
result, we found the FECA data sufficiently reliable to describe differences between career and non-career employees related to workers’ compensation costs.
We received USPS employee-level data for job-related accidents or injuries occurring in fiscal years 2016 through 2020. According to USPS officials, USPS tracks approximately 90,000 employee accidents and injuries each year through its Enterprise Data Warehouse. USPS officials told us that multiple data systems feed into the Enterprise Data Warehouse, and USPS uses a dashboard to analyze and visualize up to 5 years of data as needed. These data also include information on dates and type of injury (see table 10).
Table 10: Summary of Variables Related to Injuries from U.S. Postal Service (USPS) Enterprise Data Warehouse
Variable Description Employee ID Unique identification number for each employee. Position Type The employee’s position—such as city carrier or mail handler—or designation activity code on date of
injury. Work Location Provided city and state of work location. Time in service at time of injury
Provided number of years and months with USPS at the time of injury.
Date of Injury In the format MMDDYYYY or similar. Cause of Incident For example, dog bite, fall from porch, or slip. Incident Classification The incident classification includes information of whether the injury involved (1) a personal injury (2)
property injury, or (3) personal and property injury. Incident Type Motor vehicle, industrial, natural event, or some other event. Injury Location For example, lower arm, lower leg, or back. USPS indicated that this variable is likely to have
embedded blanks because the field is not mandatory. Injury Severity Includes what the injury was, if any since no injury is a field. For example, “strain”, “sprain” etc. Lost time due to injury (two variables, hours and days)
Hour and days of lost time. The days are calculated as hours/8. However, there is a cap of 180 days of reportable injury, past which all injuries exceeding 180 days are coded as 180 days.
Source: GAO presentation of USPS information. | GAO-21-556
We created a dataset of all reported employee injuries for fiscal years 2016 through 2020. The USPS injury data that we used include information on injuries that USPS is required to report to the Occupational Safety and Health Administration (OSHA), referred to as “OSHA-recordable injuries.” OSHA-recordable injuries include fatalities, injuries that result in days away from work, and injuries requiring medical
Injury Data from the Enterprise Data Warehouse
Appendix I: GAO Analyses of U.S. Postal Service Employee Turnover, Injuries, and Workers’ Compensation
Page 48 GAO-21-556 U.S. Postal Service
treatment beyond first aid.81 We matched USPS injury data with USPS payroll data and HR data to compare differences in injury rates and injury types between career and non-career employees, and to examine factors that may affect likelihood of injury, such as work hours, occupation type, geographic location, tenure, and demographic characteristics.
To assess data reliability, we interviewed knowledgeable officials and conducted electronic testing of these data by examining missing values and data errors that could affect the validity of analyses. We found USPS injury data to be sufficiently reliable to describe differences between career and non-career employees related to rates of reported injury.
This section describes the quantitative actuarial analysis methods we used to determine overall annual USPS employee turnover rates by career status, separation type, tenure, occupation type, and facility size for fiscal years 2016 through 2020.
This analysis used USPS payroll data (career status, occupation type, date of entering service); USPS HR data (demographics, separations, new hires, career status, conversions); and data on the relationships between postal facility locations (finance numbers) and corresponding higher-level facilities or facility groups (lead finance numbers). To create a robust data set and enable our analyses, we matched data on new hires and separations from the human resources data to USPS payroll data. This step enabled us to associate employee information—career status, occupation type, occupation code, date of entering duty, and geographic data such as lead finance unit, among other information—with each new hire and separation.
81 OSHA generally describes a recordable injury or illness as: (1) any work-related fatality; (2) any work-related injury or illness that results in loss of consciousness, days away from work, restricted work, or transfer to another job; (3) any work-related injury or illness requiring medical treatment beyond first aid; and (4) any work-related diagnosed case of cancer, chronic irreversible diseases, fractured or cracked bones or teeth, and punctured eardrums. In addition, there are special recording criteria for work-related cases involving: “needlesticks” and sharp-object injuries, medical removal, hearing loss, and tuberculosis. See 29 C.F.R. Part 1904.
Actuarial Analysis of Annual Employee Turnover
Introduction
Data

Appendix I: GAO Analyses of U.S. Postal Service Employee Turnover, Injuries, and Workers’ Compensation
Page 49 GAO-21-556 U.S. Postal Service
USPS calculates employee turnover rates monthly, excluding separations of certain employees such as employees with short-term holiday contracts (holiday employees); employees hired for weekend and Amazon package delivery; and a small number of employees in discontinued positions. We applied these USPS business rules to determine which employees to include in our calculations.
To calculate annual employee turnover rates, we performed an actuarial experience study.82 Specifically, we analyzed separation data for fiscal years 2016 through 2020 to develop turnover rates by career status, occupation type, age band, geographic area (lead finance unit), and tenure. For the purposes of this report, we calculated tenure using the earliest start date that appeared in our data.83
We calculated the average annual turnover rate using the total number of employees separated throughout the fiscal year divided by a measure of the total number of employees for that fiscal year for any employee group. The measure we used is the sum of the employee count at the beginning of the fiscal year and the total new hires within that year.
We counted only one separation for employees that separated repeatedly within the same year. In these situations where a single employee had many separations or entrances within a year, we used the most recent personnel action (using nature of action data) to determine the type of separation or the new-hire status. We did not include deaths or retirements. We found that retirements were associated with career employees and that including them would have made non-career and career employee turnover less comparable.
We then calculated the number of employee separations by type (employer-initiated or employee-initiated) using nature of action data. When there were multiple employee records, we used the latest 82 Actuarial experience studies typically involve examining recent historical experience to help inform the selection of assumptions to be used in estimating future experience. The object of study could be any of a variety of factors, such as turnover, mortality, or pay increases. For this report, we are not estimating future experience, instead solely focusing on the historical component of the experience study.
83 According to USPS officials, new “start” dates are recorded at various times, including when (1) USPS renews a non-career employee’s 360-day contract (with the exception of rural carriers, who are not on short-term contracts), and (2) a non-career employee switches to a different occupation type, for example, from city carrier to postal clerk. A new start date is not recorded when an employee converts from a non-career position to a career position.
Methodology

Appendix I: GAO Analyses of U.S. Postal Service Employee Turnover, Injuries, and Workers’ Compensation
Page 50 GAO-21-556 U.S. Postal Service
information to determine career status, date of entering service, occupation type, and office location.
USPS provided us their turnover calculations for fiscal years 2016 through 2020, which we referred to for comparison. However, our annual turnover rate calculations were based on unique employee counts, whereas USPS’s turnover rates were higher likely due to a number of non-career employees separating multiple times throughout the year.
The actuarial analyses for this report, both of turnover and of workers’ compensation costs, were performed by Lijia Guo, Senior Actuary, with review by Joseph Silvestri, Assistant Director and Actuary, and all under the direction of Frank Todisco, Chief Actuary. All three actuaries are Members of the American Academy of Actuaries and collectively meet the Qualification Standards of the Academy to render the actuarial findings contained in this report.
The average annual turnover rate for career employees was 1.7 percent and 28.6 percent for non-career employees for fiscal years 2016 through 2020, as shown in table 11. However, this comparison is influenced by the different demographic make-up of the career and non-career populations, particularly regarding tenure, as shown further below, and should not be viewed as reflective of only the effect of career status on turnover. We report on turnover rates by separation type and tenure below.
Table 11: U.S. Postal Service’s (USPS) Annual Employee Turnover Rates, Fiscal Years (FY) 2016 through 2020
Career Status FY 2016 FY 2017 FY 2018 FY 2019 FY 2020 5-Year
Average Career 1.2% 1.4% 1.9% 2.2% 2.0% 1.7% non-career 29.8% 27.9% 27.7% 27.7 28.1 28.6%
Source: GAO analysis of USPS data. | GAO-21-556
Between fiscal years 2016 and 2020, the annual turnover rates for non-career employees ranged from 298 per 1,000 to 277 per 1,000, while the career employee turnover rates ranged from 12 per 1,000 to 22 per 1,000.
Results
Overall Turnover Rates
Turnover by Separation Type

Appendix I: GAO Analyses of U.S. Postal Service Employee Turnover, Injuries, and Workers’ Compensation
Page 51 GAO-21-556 U.S. Postal Service
We also examined turnover by whether the employee or the employer (USPS) initiated the turnover. While both employee- and employer-initiated turnover affect USPS’s workforce and costs, we considered non-career employee-initiated turnover as representing employees USPS would have preferred, for the most part, to retain. We defined employee-initiated turnover as resignations and separations arising for reasons such as from an employee declining relocation, declining a reassignment, or transferring to another agency. We defined employer-initiated turnover as terminations for reasons such as work quality, personal conduct, or lack of work because of reduced mail volume. For non-career and career employee turnover rates by separation type, see table 12.
Table 12: U.S. Postal Service (USPS) Non-Career and Career Employee Turnover Rates, Fiscal Years (FY) 2016 through 2020
FY 2016 FY 2017 FY 2018 FY2019 FY 2020 5-Year
Average Non-career employee-initiated 20.4% 20.4% 20.9% 20.1% 20.3% 20.7% Non-career employer-initiated 9.4% 7.5% 6.8% 7.6% 7.8% 7.9% Non-career Total 29.8% 27.9% 27.7% 27.7% 28.1% 28.6% Career employee-initiated 0.7% 1.1% 1.4% 1.6% 1.6% 1.3% Career employer-initiated 0.5% 0.4% 0.5% 0.6% 0.5% 0.5% Career Total 1.2% 1.4% 1.9% 2.2% 2.0% 1.7%
Source: GAO analysis of USPS data. | GAO-21-556
Among non-career employees, employee-initiated separations accounted for, on average, over 72 percent of total turnover for fiscal years 2016 through 2020, a figure that was on average three times higher than the employer-initiated separation rates.
Over the study period, the annual employer-initiated turnover rates for non-career employees decreased by 1.6 percentage points, from 9.4 percent to 7.8 percent. The employee-initiated turnover rate decreased by just 0.1 percentage point, from 20.4 percent to 20.3 percent.
The annual turnover rates varied significantly by employee tenure regardless of career status, and recently hired employees had much higher turnover rates than employees with longer tenure, for both career and non-career employees. We focused our actuarial analysis of turnover rates by tenure on fiscal year 2020 so that we could measure tenure for employees who separated in the latest fiscal year in our study period by
Turnover by Tenure

Appendix I: GAO Analyses of U.S. Postal Service Employee Turnover, Injuries, and Workers’ Compensation
Page 52 GAO-21-556 U.S. Postal Service
tracking their employment history from the previous 5 years.84 We selected this approach because, according to USPS officials, the start dates for its employees may change for various reasons we described above. For non-career employees, the turnover rates were less for those with between 12 and less than 60 months of tenure compared to non-career employees with less tenure, while the career employee turnover rates were also greater for those with shorter tenures, as shown in table 13.
Table 13: U.S. Postal Service (USPS) Non-Career and Career Employee-Initiated Turnover by Tenure, Fiscal Year 2020
Source: GAO analysis of USPS data. | GAO-21-556 aThe numbers of employees were counted at the end of fiscal year 2020. bEmployees with 5 or more years of tenure represents a longer timeframe than the other tenure categories, which may affect the lower turnover rates. Retirements are excluded from these turnover rates.
We found that the difference between non-career and career employee turnover narrowed when considering tenure, but remained, indicating that features distinct to career status may affect turnover. For example, non-career turnover in fiscal year 2020 for employees with between 12 and less than 24 months of tenure was 14.1 percentage points higher than for career employees in the same tenure group. The gap between career and non-career turnover narrowed for employees with between 24 and less than 48 months of tenure.
We analyzed career and non-career employee turnover by USPS’s four main occupation types—city carrier, rural carrier, mail handler, and postal clerk. City carriers and rural carriers perform similar duties of preparing, 84 We conducted our actuarial analysis of turnover rates by tenure for all employees in fiscal year 2020 based on USPS fiscal year 2016 through 2020 payroll data.
Tenure in Months
Numbera of Non-career Employees
Numbera of Career
Employees
Non-Career Turnover
(Percentage)
Career Turnover
(Percentage)
Percentage-Point
Difference 0 to < 12 80,676 5,298 28.0 17.8 10.2
12 to < 24 51,118 8,556 22.9 8.8 14.1
24 to < 36 28,640 12,711 12.6 5.6 6.9
36 to < 48 19,128 21,673 11.1 4.6 6.5
48 to < 60 14,659 52,536 11.2 3.6 7.7
60 and overb 17,313 413,766 0.3 0.7 -0.4
All 211,534 514,540 20.3 1.6 18.7
Turnover by Occupation Type

Appendix I: GAO Analyses of U.S. Postal Service Employee Turnover, Injuries, and Workers’ Compensation
Page 53 GAO-21-556 U.S. Postal Service
delivering, and collecting mail. Mail handler duties include moving and processing mail, and postal clerk duties may include mail-processing functions or selling postal products and services. While city and rural carriers perform their work outdoors under varying road and weather conditions, mail handlers and postal clerks perform their work indoors, and except postal clerks who work at a retail window, are more likely than carriers to work night shifts.
Our analysis of non-career employee turnover by occupation type found that non-career city carriers had the highest annual employee-initiated turnover rates during the study period at an average of 23.7 percent, with annual turnover rates decreasing by 1.1 percentage points over the study period. Non-career rural carriers had the second highest annual employee-initiated turnover rates over the study period at 20.1 percent, but the turnover rate increased by 0.9 percentage points. For annual non-career employee-initiated turnover rates for each of the four occupation types see fig. 4.
According to USPS officials, city and rural carriers have higher turnover rates because the positions are physically demanding and their work outdoors subjects them to inclement weather. Specifically, postal union and management association officials described carrier work as potentially involving climbing steep hills or working in freezing conditions. Unlike the other non-career positions, non-career rural carriers function as replacements for career employees on leave based on union negotiations. In addition, in many offices, non-career rural carriers are required to supply their own vehicle to deliver mail on routes.

Appendix I: GAO Analyses of U.S. Postal Service Employee Turnover, Injuries, and Workers’ Compensation
Page 54 GAO-21-556 U.S. Postal Service
Figure 4: U.S. Postal Service’s Non-Career Employee-Initiated Annual Turnover Rates by Occupation Type, Fiscal Years 2016 through 2020
To understand the geographic variation in employee-initiated turnover rates, we calculated non-career employee-initiated turnover rates by lead finance units for mid-size and large lead finance units.85 There were more than 8,800 lead finance units with non-career employees, but many of these units had very few non-career employees or non-career employee separations. We chose facilities with a large enough number of non-career employees to ensure that having few employees, or missing data
85 We defined mid-sized lead finance units as those with (1) at least 60 non-career employees, (2) at least 20 non-career employee-initiated separations, and (3) at least 30 non-career total (employee- and employer-initiated) separations in a fiscal year. We defined large lead finance units as those with (1) at least 150 non-career employees, (2) at least 50 non-career employee-initiated separations, and (3) at least 70 non-career total (employee- and employer-initiated) separations in a fiscal year.
Employee-initiated Non-career Turnover by Lead Finance Unit

Appendix I: GAO Analyses of U.S. Postal Service Employee Turnover, Injuries, and Workers’ Compensation
Page 55 GAO-21-556 U.S. Postal Service
on a few employees, would not have a disproportionate effect on the turnover rates. We characterized these facilities as either mid-size and large lead finance units combined, which were on average 259 units per fiscal year (about 3 percent of all lead finance units), or large lead finance units only, which were on average 67 units per fiscal year (less than 1 percent of lead finance units).86
Taken together, mid-size and large lead finance units had annual non-career employee-initiated turnover rates ranging from 6 to 68 percent. Table 14 presents the average turnover rates for each year in the study period. Compared to annual turnover rates of all lead finance units, these mid-size and large lead finance units combined had higher annual employee-initiated turnover rates and higher annual total turnover rates. However, employee-initiated turnover rates decreased by 3.8 percentage points from fiscal years 2016 through 2020, with the most noticeable decrease between fiscal year 2019 and fiscal year 2020 (a 2.2 percentage-point decrease). The total average annual turnover rates for mid-size and large lead finance units combined also decreased by 7.0 percentage points in the study period from 41.5 percent to 34.5 percent, with an average annual decrease of 1.4 percentage points.
Table 14: U.S. Postal Service’s (USPS) Average Non-career Turnover Rates in Mid-Sized and Large Lead Finance Units, Fiscal Years (FY) 2016 through 2020
Employer-Initiated Turnover Rate
Employee-Initiated Turnover Rate
Total Turnover Rate
Number of Lead Finance Units
FY20 11.9% 22.6% 34.5% 279 FY19 12.4% 24.8% 37.2% 241 FY18 9.8% 24.5% 34.4% 243 FY17 10.9% 24.3% 35.2% 246 FY16 15.1% 26.4% 41.5% 284 5-year average 11.8% 24.2% 36.0% 259
Source: GAO analysis of USPS data. | GAO-21-556
Note: We defined mid-sized and large lead finance units combined as those with (1) at least 60 non-career employees, (2) at least 20 non-career employee-initiated separations, and (3) at least 30 non-career total (employee- and employer-initiated) separations in a fiscal year.
Among large lead finance units, the annual employee-initiated turnover rates ranged from 7.1 percent to 39.7 percent, with the average turnover
86 In fiscal year 2020, the percentage of employees in mid-size and large lead finance units combined was 33.5 percent, and the percentage of employees in only large lead finance units was 16.2 percent.

Appendix I: GAO Analyses of U.S. Postal Service Employee Turnover, Injuries, and Workers’ Compensation
Page 56 GAO-21-556 U.S. Postal Service
rates for each year shown in Table 15, below. As with mid-sized and large lead finance units combined, large lead finance units had higher annual employee-initiated turnover rates and higher annual total turnover rates compared to the national average for each year in the study period—indicative of lower turnover rates at smaller lead finance units. However, the annual turnover rates for large lead finance units had larger decreases in non-career turnover in recent years than USPS annual turnover rates for all lead finance units. Specifically, the non-career employee-initiated turnover rates for large lead finance units decreased by 3.8 percentage points from fiscal years 2016 to 2020, whereas over this same period the employee-initiated turnover rates for all lead finance units decreased by 0.1 percentage point.
Table 15: U.S. Postal Service’s (USPS) Average Non-career Turnover Rates in Large Lead Finance Units, Fiscal Years 2016 through 2020
Fiscal Year (FY) Non-career Employer-
Initiated Turnover Rates Non-career Employee-
Initiated Turnover Rates Total Non-career
Turnover Rates Number of Lead
Finance Units FY 2020 11.2% 22.8% 34.0% 76 FY 2019 10.6% 23.8% 34.4% 63 FY 2018 9.7% 24.9% 34.6% 61 FY 2017 10.1% 25.3% 35.3% 65 FY 2016 13.5% 26.6% 40.1% 68 5-year Average 10.8% 24.2% 35.0% 67
Source: GAO analysis of USPS data. | GAO-21-556
Note: We defined large lead finance units as those with (1) at least 150 non-career employees, (2) at least 50 non-career employee-initiated separations, and (3) at least 70 non-career total (employee- and employer-initiated) separations in a fiscal year.
We also examined lead finance units with the highest and lowest levels of non-career employee-initiated turnover for characteristics distinct to geography. Specifically, for the lead finance units with the top five and bottom five employee-initiated turnover rates, we looked at the corresponding geographic region, regional prices differences at the metropolitan level (the Regional Price Parities Index) from the Bureau of Economic Analysis;87 the average county-level monthly unemployment 87 Regional price parities (RPP) measure the differences in price levels across states and metropolitan areas for a given year and are expressed as a percentage of the overall national price level. For example, if the RPP for area A is 120 and the RPP for area B is 90, then on average, prices are 20 percent higher and 10 percent lower than the U.S. average for A and B, respectively. The all-items RPP covers all consumption goods and services, including housing rents. Areas with high/low RPPs typically correspond to areas with high/low price levels for rents. https://www.bea.gov/news/2020/real-personal-income-state-and-metropolitan-area-2019.

Appendix I: GAO Analyses of U.S. Postal Service Employee Turnover, Injuries, and Workers’ Compensation
Page 57 GAO-21-556 U.S. Postal Service
rate from the Bureau of Labor Statistics; and the Median Family Income from Census data for fiscal year 2019. We found that none of these geographic characteristics were strong indicators for the high or low levels of turnover at these particular lead finance units. For example, some lead finance units in low cost-of-living areas in the Midwest or Mountain regions had higher turnover rates compared to lead finance units in high cost-of-living areas. In addition, some lead finance units in high cost-of-living regions on both the East and West coasts had among the lowest turnover rates.
This analysis relied on data and other listings provided by various personnel at USPS. We reviewed the data provided for reasonableness but did not audit it for accuracy. All data-related analyses and procedures were performed in accordance with Actuarial Standard of Practice No. 23, Data Quality. To the extent that there are material deficiencies in completeness and accuracy in the data, the turnover rate estimate may be materially different than that shown in this report had these deficiencies not been present.
This section describes the regression analysis methods we used to assess factors related to USPS employee turnover, such as employee, job, and local labor market characteristics. We selected factors based on academic studies examining turnover and interviews with USPS and other stakeholders. Whereas our actuarial analysis calculated end-of-year turnover—based on the number of employees that separated within each fiscal year—our regression analysis calculated turnover rates based on pay-period data. In particular, we used these methods to consider and isolate the degree to which individual factors, including tenure, were associated with non-career employee turnover.
Academic literature we reviewed identifies several determinants of job separation including: characteristics of employees, job-specific characteristics, and factors specific to the local labor market in which an employee participates.
• Employee characteristics include variables such as: age, gender, race and ethnicity, and job tenure. For example, employees with significant tenure are less likely to take a new job (separate) and are more likely
Limitations
Regression Analysis of Employee Turnover Introduction

Appendix I: GAO Analyses of U.S. Postal Service Employee Turnover, Injuries, and Workers’ Compensation
Page 58 GAO-21-556 U.S. Postal Service
to stay with the firms where they have developed significant firm-specific skills.
• Job characteristics include factors such as workhours, union membership, and occupational status. Previous analyses from USPS Office of the Inspector General (OIG) also found that low pay, lack of benefits, and lack of flexibility over schedules are reported reasons why USPS non-career employees leave their jobs.88
• Characteristics of local labor markets capture, among other things, local-level unemployment and cost-of-living differences across the around 34,000 physical locations of USPS facilities. We would expect that USPS may experience higher turnover rates and difficulty hiring and retaining employees where unemployment rates are low as USPS competes with other employers for a limited number of employees. Similarly, employees may be less likely to seek a new job during recessions, when unemployment rates are high, because available alternative jobs may not be particularly appealing or because there are simply fewer jobs. USPS, however, does not adjust employee pay for differences in cost of living across different US geographic locations. Accordingly, turnover rates may be higher in high cost-of-living markets where USPS wages have less purchasing power than in low cost-of-living areas.
This analysis used USPS pay-period payroll data (workhours, benefits, pay, occupation type, tenure career status); USPS HR data (demographics, hire, and separation data); the Bureau of Labor Statistics Local Area Unemployment Statistics data; and the Bureau of Economic Analysis Regional Price Parties to describe differences in local labor market conditions.
We examined turnover for each pay period to capture additional details for employees, including those who separate multiple times during a given year. As a result, these turnover rates accounted for employees separating more than once each year and were higher turnover rates when annualized.
USPS calculates non-career employee turnover rates monthly excluding separations from certain employees such as employees with short-term holiday contracts (holiday employees), employees hired for weekend and Amazon relief, and a small number of employees in discontinued
88 U.S. Postal Service Office of the Inspector General, Non-Career Employee Turnover, HR-AR-17-002 (Arlington, Va: Dec. 20, 2016).
Data
Methodology

Appendix I: GAO Analyses of U.S. Postal Service Employee Turnover, Injuries, and Workers’ Compensation
Page 59 GAO-21-556 U.S. Postal Service
positions. As with our actuarial turnover analysis, we applied USPS business rules to determine which employees to include in our calculations. In addition, we excluded employees who separated more than 10 times and employees for whom we had insufficient data.89
Our analysis focused on an unbalanced panel of USPS employee payroll data in fiscal years 2016 through 2020. The data consisted of detailed employee-pay-period observations, which allowed us to track workhours, benefits, pay, occupation type, tenure, and employees’ career status over the 131 pay periods spanning our study period. Payroll data also allowed us to determine time periods when employees were no longer active in payroll.
We merged these pay-period payroll data with information on the employee’s separation actions from USPS human resources data, which contained information on the type of action that took place at the time of separation. We categorized employee separations into employer-initiated turnover and employee-initiated turnover using USPS codes associated with separations. We defined employer-initiated turnover as terminations for reasons such as for work quality, personal conduct, or lack of work from reduced mail volume. We defined employee-initiated turnover as resignations and separations arising from an employee declining relocation or reassignment, or transferring to other agencies.
We included in the analysis employee characteristics such as gender, race, ethnicity, and age from USPS HR data. To capture local-level unemployment rates in a given pay period, we merged Local Area
89 Our calculations excluded retirements, holiday employees, employees hired for weekend and Amazon package delivery relief, and a small number of employees in discontinued positions, according to USPS business rules. In addition, we excluded employees that separated because of death, separated more than 10 times, or whose date of separation in human resources data did not match with sufficient accuracy to the payroll data. Specifically, we dropped any matches where human resources data were not recorded within 6 weeks before or 6 weeks after the employee’s last recorded working payroll period. According to USPS OIG, unit managers do not always submit non-career separation forms in a timely manner. A 2017 study found that 55.4 percent of non-career separation forms were submitted from 1 to 38 days after employees separated and not the day of separation as required. U.S. Postal Service Office of Inspector General, Non-Career Employee Turnover, HR-AR-17-002 (Arlington, VA.: Dec. 20, 2016). We used this threshold to determine how many weeks a plausible separation could take to process, which explains our choice of 6 weeks after separation.

Appendix I: GAO Analyses of U.S. Postal Service Employee Turnover, Injuries, and Workers’ Compensation
Page 60 GAO-21-556 U.S. Postal Service
Unemployment Statistics from the Bureau of Labor Statistics.90 We also merged in an index of regional price parities to control for differences in purchasing power across different geographic locations. Price levels are expressed as a percentage of the overall national level. The Bureau of Economic Analysis produces these estimates annually at the state and metropolitan area.
We examined the probability of employee separations as a function of employee characteristics based on the following framework.
𝑃𝑃(𝑆𝑆𝑆𝑆𝑆𝑆𝑆𝑆𝑆𝑆𝑆𝑆𝑆𝑆𝑆𝑆𝑆𝑆𝑆𝑆𝑖𝑖𝑖𝑖 = 1) = 𝛼𝛼 + 𝛽𝛽1 ∗ 𝑁𝑁𝑆𝑆𝑆𝑆𝐶𝐶𝑆𝑆𝑆𝑆𝑆𝑆𝑆𝑆𝑆𝑆𝑖𝑖𝑖𝑖 + 𝛽𝛽2 ∗ 𝑋𝑋𝑖𝑖 + 𝛽𝛽3 ∗ 𝐶𝐶𝑆𝑆𝑆𝑆𝐶𝐶𝑆𝑆𝑖𝑖𝑖𝑖 + 𝛽𝛽4 ∗𝑂𝑂𝑂𝑂𝑆𝑆𝑆𝑆𝑆𝑆𝑆𝑆𝑂𝑂𝑆𝑆𝑖𝑖𝑖𝑖 + 𝛽𝛽5 ∗ 𝑁𝑁𝑆𝑆𝑁𝑁ℎ𝑆𝑆𝑖𝑖𝑖𝑖 + 𝛽𝛽6𝐵𝐵𝑆𝑆𝑆𝑆𝑆𝑆𝐶𝐶𝑆𝑆𝑆𝑆𝐵𝐵𝑖𝑖𝑖𝑖 + 𝛽𝛽7𝑈𝑈𝑆𝑆𝑆𝑆𝑂𝑂𝑆𝑆𝑈𝑈𝑆𝑆𝑈𝑈𝑂𝑂𝑆𝑆𝑆𝑆𝑆𝑆𝑐𝑐𝑖𝑖 +𝛽𝛽8𝐻𝐻𝑆𝑆𝑁𝑁ℎ 𝐶𝐶𝑆𝑆𝐵𝐵𝑆𝑆 𝐴𝐴𝑆𝑆𝑆𝑆𝑆𝑆𝑖𝑖𝑡𝑡 + 𝑂𝑂𝑆𝑆𝑆𝑆𝑆𝑆ℎ𝑖𝑖 + 𝐹𝐹𝐹𝐹𝑖𝑖 + 𝜀𝜀𝑖𝑖𝑖𝑖 (1)
• The outcome variables (𝑆𝑆𝑆𝑆𝑆𝑆𝑆𝑆𝑆𝑆𝑆𝑆𝑆𝑆𝑆𝑆𝑆𝑆𝑆𝑆𝑖𝑖𝑖𝑖) captured employer-initiated and employee-initiated turnover or a combination of both types of turnover (separations).
• The variable of interest 𝑁𝑁𝑆𝑆𝑆𝑆𝐶𝐶𝑆𝑆𝑆𝑆𝑆𝑆𝑆𝑆𝑆𝑆𝑖𝑖𝑖𝑖 identifies differences in turnover between non-career and career employees.
• 𝑋𝑋𝑖𝑖 includes age, tenure, gender, race, and ethnicity. We included age and tenure as categorical variables. Age groupings included those under age 30, those aged 30 to 39, those 40 to 49, and those 50 to 64. Employees 65 and older were the excluded comparison group. We subdivided tenure to those with fewer than 5 years of USPS experience, those with 5 to 9 years of tenure, 10 to 19, and 20 to 29. Those with 30 or more years of tenure were the excluded comparison group.
• To capture occupational differences across USPS workforce, we controlled for USPS’s main occupation types (referring to the craft variable that includes city carrier, postal clerk, mail handler, and rural carriers). All other occupation types were included under a larger grouping denoted by “other.” Variables were coded as binary indicators, and the excluded comparison group was city carriers.
• To examine the relationship between workhours and separations, we included controls for participation in night work and overtime. Night work is a premium pay category available for work and paid training or travel time performed between 6:00 pm and 6:00 am. We coded night
90 USPS payroll data included information in the postal facility that is the employee’s primary work location. For each facility, we have detailed information on the facility’s address, which we matched to specific counties in the U.S. though a Department of Housing and Urban Development crosswalk of ZIP codes to Counties.

Appendix I: GAO Analyses of U.S. Postal Service Employee Turnover, Injuries, and Workers’ Compensation
Page 61 GAO-21-556 U.S. Postal Service
work as equal to 1 if an employee worked any night work hours in the pay period immediately prior (periodt-1) and zero otherwise. Overtime work is paid at one and one-half times the basic hourly rate for actual work hours in excess of 8 paid hours in a day, 40 paid hours in a service week or, if by a full-time bargaining unit employee, on a nonscheduled day. We defined a series of categorical variables capturing differing degrees of overtime per pay period (1 to 10, 11 to 20, 21 to 40, and more than 40 hours of overtime). We defined this overtime variable based on the average number of overtime hours an employee worked in the four pay periods before separation.
• To examine if lack of benefits is correlated with higher separation rates for USPS non-career employees, we controlled for the per-hour dollar value of benefits an employee receives. We defined benefits in each pay period to include per-hour payments for health insurance, life insurance, retirement normal cost, Thrift Savings Plan, and Social Security and Medicare taxes. Benefits vary based on year. For example, USPS has made changes to its health insurance premium contributions during the study period.
• We also examined local labor market conditions by controlling for local-level unemployment rates and whether an employee lives in a high cost-of-living area (𝑈𝑈𝑆𝑆𝑆𝑆𝑂𝑂𝑆𝑆𝑈𝑈𝑆𝑆𝑈𝑈𝑂𝑂𝑆𝑆𝑆𝑆𝑆𝑆𝑐𝑐𝑖𝑖, 𝐻𝐻𝑆𝑆𝑁𝑁ℎ 𝐶𝐶𝑆𝑆𝐵𝐵𝑆𝑆 𝐴𝐴𝑆𝑆𝑆𝑆𝑆𝑆𝑡𝑡𝑖𝑖). We merged in county-level monthly unemployment data from the Bureau of Labor Statistics. We also controlled for an index capturing regional price differences (or regional price parities, (RPP)) from the Bureau of Economic Analysis produced at the metropolitan area level.91 We defined three indicator variables for regional price parities ranging from 100 to 120, greater than 120 to 140, and greater than 140.92
• We controlled for fiscal year indicators (FY 2016 through 2020) and month indicators (January through December). In some specifications, we excluded local-level unemployment and RPP and instead controlled for facility-specific indicators. Estimates from these models
91 We merged in the metropolitan area estimates based on the physical address of a USPS facility. We converted RPP to fiscal years from calendar years. RPPs for calendar year 2020 were not yet publicly available at the time of this analysis; we assigned the first-quarter estimate for fiscal year 2020 estimates to the rest of 2020.
92 U.S. Bureau of Economic Analysis, Real Personal Income by State and Metropolitan Area, 2019, BEA 20-64 (December 2020). “Regional price parities (RPPs) measure the differences in price levels across states and metropolitan areas for a given year and are expressed as a percentage of the overall national price level. For example, if the RPP for area A is 120 and the RPP for area B is 90, then on average, prices are 20 percent higher and 10 percent lower than the U.S. average for A and B, respectively.”

Appendix I: GAO Analyses of U.S. Postal Service Employee Turnover, Injuries, and Workers’ Compensation
Page 62 GAO-21-556 U.S. Postal Service
are very close to observed estimates from models accounting for local labor market conditions.
• To account for missing values in our control variables, we generated missing indicators for demographics, tenure, and workhours. This approach ensured our analysis made use of all available data and avoided the assumption that missing values are missing at random.
• 𝜀𝜀𝑖𝑖𝑖𝑖 is a normally distributed, error term with mean zero. • We ran separate models for different occupation types to examine
difference by occupation type, and in some specifications, we ran estimates for only non-career employees to examine the differential impact of our analysis variables on these employees.
• All standard errors from these models were clustered at the facility level. We estimated our models using a linear probability model.93
We present our findings in table 16 below. Columns (1), (4), and (7) present differences in turnover rates each pay period between career and non-career employees, without accounting for any characteristics. The overall turnover rate for career employees was 0.07 percent per pay period, or 1.9 percent per year (0.07*26). These figures combined employee-initiated turnover at 0.06 percent (annualized rate of 1.5 percent) and employer-initiated turnover of 0.01 percent per pay period (0.4 percent per year). These numbers may appear low, but our analyses removed from estimation retirements and other types of turnover that may have increased estimates among career employees.
By comparison, non-career turnover was much higher, even though in this case we also removed employees who worked the holiday season rush in mail—although our analysis indicated that the much higher non-career turnover can be explained in part by factors other than career status. For non-career employees, the combined turnover (separations), which included both employer- and employee-initiated turnover, stood at an annual rate of 44.8 percent—1.7 percent each pay period—consistent with findings from USPS OIG that reported a turnover rate of 42.7 percent in fiscal year 2016. Most of this turnover was employee-initiated (1.3 percent per pay period, 33.7 percent annual rate), rather than employer-initiated (0.42 percent per pay period, 11.1 percent annual rate).
93 We estimated the model using a linear probability model instead of logit/probit because of the difficulty of estimating models with many fixed effects using nonlinear models.
Results

Appendix I: GAO Analyses of U.S. Postal Service Employee Turnover, Injuries, and Workers’ Compensation
Page 63 GAO-21-556 U.S. Postal Service
Columns (2), (5), and (8) controlled for all individual characteristics, month and fiscal year effects, and local labor market conditions, whereas estimates in columns (3), (6), and (9) removed local labor market conditions and instead controlled for facility-specific fixed-effects.
Our analysis indicated that differences in turnover can be explained in part by other characteristics such as tenure, workhours, benefits, and local labor market conditions. Though inclusion of additional controls did not quantitatively change the effect of the non-career parameter in predicting employer-initiated turnover, it reduced the association of non-career status for employee-initiated turnover. Our conditional model indicated that employee-initiated turnover remained high at about 1 percent per pay period or 27.1 percent per year.
The main determinants of employee-initiated turnover were: non-career status (higher turnover); having fewer than 5 years of tenure (higher turnover); being 30-39 years (lower turnover); and the performance of overtime and night work (lower turnover).
• The effect of tenure was expected. Those with the least amount of tenure (less than 5 years) at USPS were most likely to leave. Tenure of less than 5 years was about one-quarter of the effect size of non-career status, and emerged as the second most important determinant of turnover. This finding is consistent with the economic literature that accumulating job-specific experience makes employees less likely to separate from job. The tenure group with the lowest turnover was those having 5 to 9 years of experience at USPS.
• The age group with the lowest turnover was those between the ages of 30 and 39, followed by those younger than 30.
• The performance of night and overtime work reduced the likelihood an employee will separate.
• Finally, the effect of local market conditions was as expected—higher local level unemployment rates reduced the incentive for employees to separate—but the effect was small. However, living in a high cost-of-living location (defined as a location above the US national average) increased the likelihood that the employee would separate. Postal facilities in areas with cost of living above the national level were associated with a reduction in the likelihood an employee would separate in any given pay period by 0.12 percent—an effect which is about half the size of being in the lowest tenure category. This finding is consistent with what USPS told us, that higher-cost locations tend to have higher turnover rates.

Appendix I: GAO Analyses of U.S. Postal Service Employee Turnover, Injuries, and Workers’ Compensation
Page 64 GAO-21-556 U.S. Postal Service
• Benefits were also negatively related to turnover, but the effect was small relative to other determinants. For example, increasing benefits by $2 per hour would have about the same effect on turnover as increasing local level unemployment rates by 1.4 percentage points. Though small, our estimates are consistent with research findings that employees are less likely to leave a job that provides them benefits.
Additional specifications of the model among only non-career employees uncovered similar findings to those reported in table 16.
Table 16: Probability of Separation by U.S. Postal Service (USPS) Employee Characteristics, Fiscal Years 2016 through 2020
Employer-initiated Employee-initiated Separations (1) (2) (3) (4) (5) (6) (7) (8) (9) Non-Career 0.414** 0.398** 0.430** 1.237** 0.996** 1.070** 1.651** 1.394** 1.500** (0.008) (0.009) (0.009) (0.010) (0.009) (0.010) (0.010) (0.010) (0.011) Younger than 30 years
0.084** 0.061**
-0.038** -0.112**
0.047** -0.051**
(0.005) (0.005)
(0.006) (0.007)
(0.008) (0.009) Age 30-39
0.019** 0.004
-0.098** -0.156**
-0.079** -0.151**
(0.003) (0.003)
(0.005) (0.005)
(0.006) (0.007) Age 40-49
0.025** 0.018**
-0.019** -0.063**
0.006 -0.045**
(0.002) (0.003)
(0.004) (0.004)
(0.005) (0.006) Age 50-65
0.027** 0.022**
-0.000 -0.031**
0.027** -0.009+
(0.002) (0.002)
(0.004) (0.004)
(0.005) (0.005) Less than 5 years of tenure
0.047** 0.057**
0.269** 0.266**
0.316** 0.323**
(0.002) (0.002)
(0.005) (0.005)
(0.005) (0.006) Tenure 5-9
-0.011** -0.003+
-0.041** -0.036**
-0.052** -0.039**
(0.002) (0.002)
(0.004) (0.004)
(0.004) (0.005) Tenure 10-19
0.023** 0.031**
0.005* 0.002
0.028** 0.033**
(0.002) (0.002)
(0.002) (0.003)
(0.003) (0.003) Tenure 20-29
0.009** 0.012**
0.010** 0.007**
0.019** 0.019**
(0.001) (0.001)
(0.002) (0.002)
(0.002) (0.002) Female
-0.010** 0.002
-0.024** -0.019**
-0.034** -0.017**
(0.001) (0.001)
(0.002) (0.002)
(0.002) (0.002) Hispanic
0.008** 0.002
0.010** 0.022**
0.018** 0.024**
(0.002) (0.002)
(0.004) (0.004)
(0.005) (0.005) African American or Black
0.058** 0.049**
-0.017** 0.004
0.041** 0.053**
(0.002) (0.002)
(0.003) (0.003)
(0.004) (0.004)

Appendix I: GAO Analyses of U.S. Postal Service Employee Turnover, Injuries, and Workers’ Compensation
Page 65 GAO-21-556 U.S. Postal Service
Employer-initiated Employee-initiated Separations (1) (2) (3) (4) (5) (6) (7) (8) (9) Multiple Races
0.062** 0.052**
0.084** 0.071**
0.147** 0.122**
(0.005) (0.005)
(0.009) (0.009)
(0.011) (0.011) American Indian or Alaskan Native/Native Hawaiian or Other Pacific Islander
0.026** 0.014*
-0.000 -0.013+
0.026** 0.001
(0.006) (0.006)
(0.007) (0.007)
(0.010) (0.010) Asian
0.023** 0.007*
0.045** 0.034**
0.068** 0.041**
(0.002) (0.003)
(0.004) (0.005)
(0.005) (0.006) Benefits
0.001** 0.001**
-0.009** -0.009**
-0.008** -0.008**
(0.000) (0.000)
(0.000) (0.000)
(0.000) (0.000) Night Work Indicator
-0.022** -0.062**
-0.019** -0.056**
-0.041** -0.117**
(0.002) (0.003)
(0.002) (0.003)
(0.003) (0.004) Overtime 1-10
-0.036** -0.042**
-0.234** -0.256**
-0.270** -0.298**
(0.002) (0.002)
(0.003) (0.004)
(0.004) (0.005) Overtime 11-20
-0.083** -0.092**
-0.342** -0.380**
-0.425** -0.472**
(0.002) (0.002)
(0.006) (0.007)
(0.008) (0.009) Overtime 21-40
-0.120** -0.135**
-0.437** -0.493**
-0.557** -0.627**
(0.003) (0.004)
(0.010) (0.011)
(0.012) (0.014) Overtime more than 40
-0.100** -0.122**
-0.384** -0.466**
-0.484** -0.588**
(0.007) (0.008)
(0.014) (0.017)
(0.018) (0.022) Clerks
0.035** 0.034**
-0.120** -0.037**
-0.085** -0.002
(0.005) (0.003)
(0.005) (0.004)
(0.006) (0.005) Mail Handlers
0.020** -0.042**
-0.100** 0.026**
-0.080** -0.016
(0.005) (0.007)
(0.008) (0.007)
(0.011) (0.011) Other
0.007** -0.012**
-0.027** 0.053**
-0.020** 0.041**
(0.002) (0.002)
(0.003) (0.003)
(0.004) (0.004) Rural Carriers
-0.062** -0.060**
0.052** 0.052**
-0.010 -0.009
(0.002) (0.002)
(0.005) (0.005)
(0.006) (0.006) Cost of living 1% to 20% higher
0.007+
0.021**
0.028**
(0.004)
(0.005)
(0.007)
Cost of living 21 to 40% higher
0.008+
0.050**
0.058**
(0.004)
(0.009)
(0.010)
Cost of living more than 40% higher
0.010*
0.044**
0.054**

Appendix I: GAO Analyses of U.S. Postal Service Employee Turnover, Injuries, and Workers’ Compensation
Page 66 GAO-21-556 U.S. Postal Service
Employer-initiated Employee-initiated Separations (1) (2) (3) (4) (5) (6) (7) (8) (9)
(0.004)
(0.006)
(0.007)
Unemployment Rate
-0.007**
-0.013**
-0.020**
(0.001)
(0.000)
(0.001)
Mean of Career Employees
0.014**
0.058**
0.072**
(0.000)
(0.001)
(0.001)
Observations 67,359,626 67,313,943 67,359,626 67,359,626 67,313,943 67,359,626 67,359,626 67,313,943 67,359,626 Standard errors in parentheses
+ p<0.1,* p<0.05, ** p<0.01
Source: GAO analysis of USPS National Payroll and Human Resources data. | GAO-21-556
Note: The reported table excludes indicators for missing values, which were included when estimating results. We reported marginal effects.
Table 17 presents findings by occupation type. We present results from the model specification that includes all individual characteristics, month and fiscal year effects, and local labor market conditions. Estimates from models with postal facility controls were quantitatively similar. Overall findings indicated that for each occupation type separations resulted primarily from employee-initiated separations. Of the four occupation types, conditional on characteristics, city carriers had the highest turnover rates relative to the other occupation types. Implied annual turnover rates for city carriers were 12.6 percent, 36.4 percent, and 48.9 percent for employer-initiated, employee-initiated and overall separations, respectively. Clerks had the second highest overall separation rate at 42.4 percent and the highest employer-initiated separation rate of 19.3 percent. The lowest conditional separation rates were observed for rural carriers at 22.6 percent overall, 20.9 percent employee-initiated, and 3.1 percent employer-initiated separations.94 Similar to the combined effects, effects by occupation type point to the same factors affecting turnover including non-career status, the availability of overtime and night work, benefits, and local labor market conditions.
94 Unconditional estimates of employee-initiated separations, employer-initiated separations and overall separations in the regression sample tracked findings from our actuarial analysis. The groups with the highest turnover were carriers. For example, overall turnover rates were 49.9 percent for city carriers and 42.9 percent for rural carriers, 40.9 percent for mail handlers, and 40.1 percent for clerks. We examined turnover for each pay period to capture additional details for employees, including those that separated multiple times during a given year. As a result, these turnover rates accounted for employees who separated more than once each year and produced higher turnover rates when annualized.

Appendix I: GAO Analyses of U.S. Postal Service Employee Turnover, Injuries, and Workers’ Compensation
Page 67 GAO-21-556 U.S. Postal Service
Table 17: Probability of Separation by U.S. Postal Service (USPS) Employee Characteristics and Occupation Type, Fiscal Years 2016 through 2020
City Carrier
Clerk Mail Handler
Rural Carrier
City Carrier
Clerk Mail Handler
Rural Carrier
City Carrier
Clerk Mail Handler
Rural Carrier
USPS-Initiated Employee-Initiated Separation Non-Career 0.469** 0.724** 0.470** 0.112** 1.341** 0.823** 0.710** 0.759** 1.810** 1.547** 1.180** 0.871** (0.006) (0.031) (0.021) (0.003) (0.012) (0.016) (0.026) (0.014) (0.016) (0.030) (0.037) (0.016) Younger than 30 years
-0.048** 0.151** 0.127** 0.003 -0.209** -0.059** 0.055** -0.233** -0.257** 0.093** 0.181** -0.230**
(0.007) (0.012) (0.011) (0.008) (0.013) (0.011) (0.015) (0.026) (0.017) (0.017) (0.019) (0.029) Age 30-39 -0.051** 0.043** 0.034** -0.052** -0.208** -0.095** 0.012 -0.442** -0.260** -0.052** 0.046** -0.494** (0.006) (0.008) (0.008) (0.006) (0.012) (0.009) (0.010) (0.020) (0.016) (0.013) (0.013) (0.022) Age 40-49 -0.004 0.037** 0.014* -0.034** -0.059** -0.051** 0.017* -0.304** -0.063** -0.014 0.030** -0.337** (0.005) (0.006) (0.006) (0.005) (0.011) (0.007) (0.007) (0.018) (0.014) (0.011) (0.011) (0.020) Age 50-65 0.013** 0.036** 0.014** -0.016** -0.007 -0.032** 0.011+ -0.213** 0.006 0.004 0.025** -0.230** (0.005) (0.005) (0.005) (0.005) (0.010) (0.006) (0.006) (0.017) (0.013) (0.009) (0.009) (0.019) Less than 5 years of tenure
0.076** 0.015* 0.015* 0.124** 0.277** 0.133** 0.114** 0.864** 0.353** 0.147** 0.129** 0.989**
(0.003) (0.006) (0.007) (0.005) (0.007) (0.007) (0.011) (0.016) (0.009) (0.009) (0.014) (0.018) Tenure 5-9 0.038** -0.042** -0.022** -0.029** 0.160** 0.052** 0.026* -0.104** 0.199** 0.010 0.004 -0.133** (0.003) (0.008) (0.008) (0.003) (0.006) (0.009) (0.011) (0.011) (0.008) (0.010) (0.015) (0.012) Tenure 10-19 0.023** 0.034** -0.002 -0.007* 0.078** -0.022** -0.002 -0.023** 0.101** 0.011 -0.004 -0.030** (0.002) (0.007) (0.006) (0.003) (0.005) (0.006) (0.008) (0.008) (0.006) (0.008) (0.011) (0.010) Tenure 20-29 0.007** 0.005 -0.008+ -0.003 0.035** -0.010** 0.007 -0.015* 0.042** -0.005 -0.001 -0.018* (0.002) (0.004) (0.004) (0.002) (0.004) (0.003) (0.006) (0.007) (0.005) (0.005) (0.009) (0.008) Female -0.006** 0.002 0.001 0.001 -0.002 -0.031** 0.020** -0.031** -0.008+ -0.029** 0.021** -0.030** (0.002) (0.003) (0.004) (0.002) (0.004) (0.003) (0.005) (0.007) (0.004) (0.005) (0.007) (0.007) Hispanic 0.007* -0.011+ -0.005 0.020** 0.006 0.002 -0.006 0.089** 0.013+ -0.008 -0.011 0.109**

Appendix I: GAO Analyses of U.S. Postal Service Employee Turnover, Injuries, and Workers’ Compensation
Page 68 GAO-21-556 U.S. Postal Service
City Carrier
Clerk Mail Handler
Rural Carrier
City Carrier
Clerk Mail Handler
Rural Carrier
City Carrier
Clerk Mail Handler
Rural Carrier
USPS-Initiated Employee-Initiated Separation (0.003) (0.006) (0.007) (0.006) (0.006) (0.007) (0.012) (0.016) (0.007) (0.010) (0.017) (0.018) African American or Black
0.057** 0.033** 0.018** 0.118** -0.020** -0.019** -0.028** 0.234** 0.037** 0.014+ -0.010 0.352**
(0.003) (0.006) (0.005) (0.006) (0.005) (0.005) (0.007) (0.015) (0.007) (0.008) (0.009) (0.017) Multiple Races 0.054** 0.056** 0.024 0.075** 0.072** 0.047** 0.016 0.207** 0.126** 0.103** 0.040 0.282** (0.009) (0.013) (0.019) (0.014) (0.017) (0.016) (0.023) (0.039) (0.020) (0.021) (0.029) (0.044) American Indian or Alaskan Native/Native Hawaiian or Other Pacific Islander
0.009 0.022 -0.016 0.006 -0.015 -0.031* -0.009 -0.017 -0.006 -0.009 -0.025 -0.011
(0.006) (0.021) (0.012) (0.009) (0.012) (0.013) (0.020) (0.027) (0.014) (0.029) (0.024) (0.029) Asian 0.031** -0.016+ 0.005 0.033** 0.020** -0.000 -0.014 0.125** 0.050** -0.017 -0.009 0.157** (0.004) (0.009) (0.007) (0.007) (0.008) (0.008) (0.012) (0.019) (0.009) (0.011) (0.015) (0.022) Benefits -0.001** 0.001** 0.003** -0.000** -0.015** -0.006** -0.004** -0.006** -0.016** -0.005** -0.001 -0.006** (0.000) (0.000) (0.000) (0.000) (0.000) (0.000) (0.001) (0.000) (0.000) (0.001) (0.001) (0.000) Night Work Indicator
-0.027** -0.091** -0.058** 1.363 -0.037** -0.061** -0.088** -0.042 -0.064** -0.153** -0.146** 1.322
(0.002) (0.006) (0.006) (1.643) (0.004) (0.004) (0.007) (1.685) (0.004) (0.008) (0.011) (2.360) Overtime 1-10 -0.086** -0.048** -0.044** -0.071** -0.311** -0.167** -0.122** -0.454** -0.397** -0.215** -0.166** -0.524** (0.002) (0.005) (0.005) (0.002) (0.004) (0.005) (0.008) (0.006) (0.005) (0.008) (0.011) (0.007) Overtime 11-20 -0.167** -0.079** -0.045** -0.133** -0.547** -0.222** -0.145** -0.795** -0.714** -0.300** -0.190** -0.928** (0.003) (0.007) (0.006) (0.004) (0.007) (0.006) (0.010) (0.011) (0.009) (0.010) (0.015) (0.012) Overtime 21-40 -0.244** -0.113** -0.054** -0.184** -0.789** -0.263** -0.164** -1.088** -1.034** -0.376** -0.219** -1.272** (0.005) (0.011) (0.008) (0.005) (0.010) (0.009) (0.013) (0.017) (0.013) (0.014) (0.019) (0.019) Overtime more than 40
-0.235** -0.111** -0.037** -0.245** -0.844** -0.236** -0.155** -1.352** -1.079** -0.346** -0.192** -1.597**

Appendix I: GAO Analyses of U.S. Postal Service Employee Turnover, Injuries, and Workers’ Compensation
Page 69 GAO-21-556 U.S. Postal Service
City Carrier
Clerk Mail Handler
Rural Carrier
City Carrier
Clerk Mail Handler
Rural Carrier
City Carrier
Clerk Mail Handler
Rural Carrier
USPS-Initiated Employee-Initiated Separation (0.008) (0.029) (0.011) (0.014) (0.016) (0.017) (0.017) (0.045) (0.021) (0.037) (0.027) (0.048) Cost of living 1% to 20% higher
-0.014 0.024 -0.042+ -0.019+ 0.021 0.006 0.001 -0.068+ 0.007 0.030 -0.040 -0.087*
(0.009) (0.043) (0.023) (0.011) (0.019) (0.018) (0.023) (0.035) (0.024) (0.054) (0.038) (0.040) Cost of living 21-40% higher
-0.047** 0.014 -0.071* -0.058** 0.028 0.022 0.058+ -0.177** -0.019 0.036 -0.013 -0.235**
(0.013) (0.065) (0.031) (0.018) (0.029) (0.025) (0.033) (0.052) (0.035) (0.079) (0.044) (0.060) Cost of living more than 40% higher
-0.060** 0.021 -0.133+ -0.073* -0.005 0.070* 0.128* -0.317** -0.064 0.091 -0.006 -0.390**
(0.023) (0.068) (0.075) (0.037) (0.040) (0.034) (0.058) (0.086) (0.054) (0.085) (0.073) (0.106) Unemployment Rate
-0.003** -0.026** -0.005** -0.001** -0.003** -0.010** -0.011** -0.016** -0.005** -0.036** -0.016** -0.017**
(0.000) (0.002) (0.002) (0.000) (0.001) (0.001) (0.001) (0.001) (0.001) (0.002) (0.002) (0.001) Mean of Career Employees
0.014** 0.017** 0.028** 0.008** 0.058** 0.068** 0.052** 0.043** 0.071** 0.084** 0.080** 0.051**
(0.000) (0.001) (0.002) (0.000) (0.001) (0.002) (0.002) (0.001) (0.001) (0.002) (0.003) (0.001) Observations 23578864 16465834 4971410 11462851 23578864 16465834 4971410 11462851 23578864 16465834 4971410 11462851 Standard errors in parentheses + p<0.1,* p<0.05, ** p<0.01
Source: GAO analysis of USPS National Payroll and Human Resources data. | GAO-21-556
Note: The reported table excludes indicators for missing values, which were included when estimating results. We reported marginal effects.

Appendix I: GAO Analyses of U.S. Postal Service Employee Turnover, Injuries, and Workers’ Compensation
Page 70 GAO-21-556 U.S. Postal Service
We were unable to control for many factors that may affect turnover rates. For example, we did not observe the individual’s educational attainment and marital status, factors that may affect labor market outcomes including turnover.
To examine the financial costs related to USPS non-career employee turnover, we estimated the costs associated with hiring non-career employees (new-hire costs). We used the following data sources for this analysis: (1) USPS payroll data (for employee career status, occupation type, date of entering service) from fiscal years 2016 to 2020; (2) USPS HR data (for employee demographics, separation and hiring, and career status conversions) from fiscal years 2016 through 2020; and (3) USPS average costs of new hires by occupation type for fiscal years 2018 through 2020.95
Our calculations exclude retirements, holiday employees, employees hired for weekend and Amazon package delivery, and a small number of employees in discontinued positions, according to USPS business rules. For each fiscal year, using the number of non-career employee separations from our actuarial analysis, we applied the new-hire cost per employee for that occupation type. According to USPS officials, employees who separate and return within a year will not incur any new-hire costs, which is how we conducted our analysis. USPS provided cost data for only fiscal years 2018 through 2020, so we took the average costs for fiscal year 2018 to calculate the costs for fiscal years 2016 and 2017. We then adjusted the new-hire costs we calculated per fiscal year to fiscal year 2020 dollars. This analysis excluded non-career employees outside of the four main occupation types. While USPS incurs new-hire costs for these employees, they are outside of the scope of our turnover analysis.
According to our analysis, from fiscal year 2016 through 2020, USPS would have spent an estimated average of $120.9 million annually on new-hire costs associated with non-career turnover. Among the occupation types, the average cost of new hires was much higher for the rural carrier. According to USPS data, in fiscal year 2020, the rural carrier
95 According to USPS officials, they were unable to provide data from fiscal years 2016 and 2017. These new-hire costs included salary during training, testing costs, “Welcome to USPS” facilitator salary, field recruiter annual salary, and costs for background screening, drug screening, vehicle background checks, motor vehicle reports, and criminal background checks. In addition, USPS provided distinct costs by occupation type for carrier academy or postal clerk window training facilitators.
Limitations
Estimated New-Hire Costs

Appendix I: GAO Analyses of U.S. Postal Service Employee Turnover, Injuries, and Workers’ Compensation
Page 71 GAO-21-556 U.S. Postal Service
new-hire cost was 36.9 percent higher than the average cost of all new hires. These costs do not include on-the-job or refresher training. USPS officials stated that they do not track such costs and that such information would be difficult to collect, given the variability among different positions. According to USPS officials, such training is less structured for postal clerks and mail handlers than for carriers.
To calculate the numbers and rates of employee injuries by career status, we first defined “injuries” for purposes of our review. Specifically, we examined two types of injuries—reported injuries and FECA injuries. Reported injuries refer to incidents in which the associated USPS accident report indicates that an employee was injured. FECA injuries refer to incidents associated with workers’ compensation claims, regardless of whether the claims have been adjudicated by Department of Labor. By comparison, USPS considers injuries to be incidents reported to OSHA—incidents that result in fatalities, days away from work, or medical treatment beyond first aid.96 We then calculated numbers and rates of reported injuries and FECA injuries by career status and occupation type using USPS injury data (for information on reported injuries); USPS payroll data (for career status and occupation type); and FECA workers’ compensation data (for information on FECA injuries).
Table 18 presents annualized reported injury rates by career status and by occupation type, and table 19 presents annualized FECA injury rates by career status and by occupation type. Regardless of fiscal year, reported injury rates and FECA injury rates for all occupation types except rural carriers are higher for non-career workers, though these rates have fallen from fiscal year 2016 through 2020. For rural carriers, the relationship between non-career status and injury rates is inverted and does not follow observed patterns of higher injury rates for non-career we see for the entire USPS workforce.
96 OSHA generally describes a recordable injury or illness as: (1) Any work-related fatality; (2) Any work-related injury or illness that results in loss of consciousness, days away from work, restricted work, or transfer to another job; (3) Any work-related injury or illness that results in medical treatment beyond first aid; and (4) Any work-related case that involves significant injury or illness diagnosed by a physician or other licensed healthcare professional such as cancer, chronic irreversible diseases, fractured or cracked bones or teeth, and punctured eardrums. In addition, there are special recording criteria for work-related cases involving: "needlesticks” and sharp-object injuries, medical removal, hearing loss, and tuberculosis. See 29 C.F.R. Part 1904.
Numbers and Rates of Employee Injuries

Appendix I: GAO Analyses of U.S. Postal Service Employee Turnover, Injuries, and Workers’ Compensation
Page 72 GAO-21-556 U.S. Postal Service
Table 18: U.S. Postal Service (USPS) Employees’ Reported Injury Rates by Occupation Type and Career Status, Fiscal Years (FY) 2016 through 2020
Occupation type Career Status FY 2016 FY 2017 FY 2018 FY 2019 FY 2020 City carrier Career 13% 12% 12% 11% 10%
Non-career 22% 22% 21% 20% 19% Rural carrier Career 9% 9% 8% 8% 7%
Non-career 8% 8% 8% 7% 7% Mailhandler Career 9% 9% 8% 8% 7%
Non-career 13% 11% 13% 12% 11% Postal clerk Career 6% 5% 5% 5% 4%
Non-career 8% 7% 8% 6% 6%
Source: GAO analysis of USPS injury and payroll data. | GAO-21-556
Table 19: U.S. Postal Service (USPS) Employees’ Federal Employee Compensation Act (FECA) Injury Rates by Occupation Type and Career Status, Fiscal Years (FY) 2016 through 2020
Occupation type Career Status FY 2016 FY 2017 FY 2018 FY 2019 FY 2020 City carrier Career 11% 11% 11% 11% 9%
Non-career 19% 19% 19% 18% 15% Rural carrier Career 7% 8% 7% 7% 6%
Non-career 7% 7% 7% 6% 6% Mailhandler Career 8% 8% 8% 7% 5%
Non-career 10% 9% 11% 9% 8% Postal clerk Career 5% 5% 5% 4% 3%
Non-career 6% 6% 6% 6% 5%
Source: GAO analysis of Department of Labor FECA data and USPS payroll data. | GAO-21-556
Note: FECA injuries refer to incidents associated with workers’ compensation claims, regardless of whether the claims have been adjudicated by Department of Labor.
This section describes the regression analysis methods we used to assess factors related to USPS employee injuries. In particular, we used these methods to assess whether factors beyond tenure could account for some non-career employee injuries.
Academic literature we reviewed identifies several factors correlated with job-related injury. These factors include long workhours, overtime, low tenure, poor health status prior to injury, demographic characteristics, occupational characteristics, and the physical demands of the job. Our previous work showed that non-career employees work a larger number
Regression Analyses on Examining the Probability of Injury

Appendix I: GAO Analyses of U.S. Postal Service Employee Turnover, Injuries, and Workers’ Compensation
Page 73 GAO-21-556 U.S. Postal Service
of overtime and night shift hours.97 Additionally, non-career employees are on average much younger (median age 34 for non-career and 54 for career in 2018) and have shorter tenures with USPS relative to career workers.98 Long tenure on the job reduces the likelihood of job-related injuries, both because employees may be promoted to safer jobs as they gain seniority and because tenure can serve as a proxy for experience and better ability to assess risk resulting from on-the-job training. Furthermore, some jobs are riskier, and injury rates may differ by occupation.
We used several data sources to conduct regression analyses of reported injuries and FECA injuries.
• From USPS payroll data, we obtained career status at the time of injury, the physical location of their postal facility, which may provide an idea of approximate service area, and the worker’s tenure with USPS.
• From USPS HR data, we obtained detailed information on the worker’s age, sex, race, and ethnicity. These data also allowed us to link USPS data with workers’ compensation data because they include identifiers such as Social Security number.
• From USPS injury data, we obtained detailed data for job-related injuries occurring in fiscal years 2016 through 2020.
• Department of Labor FECA Data for USPS in years 2016 through 2020.99 FECA data include a wide variety of work related injuries, including cause, type of injury, date the injury was sustained, compensated medical expenditures (if any), additional compensation provided, and work outcomes after the injury occurred.
Our analysis consisted of detailed employee-pay-period observations from payroll data, which allowed us to track workhours, occupation type, tenure, and career status over the 131 pay periods in our study period. We supplemented payroll data with employees’ demographic characteristics from USPS HR data. Finally, we linked these data with
97 GAO, U.S. Postal Service: Additional Guidance Needed to Assess Effect of Changes to Employee Compensation, GAO-20-140 (Washington, D.C.: Jan.17, 2020).
98 GAO-20-140.
99 DOL data on FECA years run from July 1 to June 30 of the following year.
Data
Methodology

Appendix I: GAO Analyses of U.S. Postal Service Employee Turnover, Injuries, and Workers’ Compensation
Page 74 GAO-21-556 U.S. Postal Service
USPS accident data, which included detailed information whether accident involved a reported injury.
Unadjusted summary statistics did not account for the plethora of factors that could affect injury rates. They rather assumed that other characteristics (not included in cross tabulations) were similar between career and non-career workers. As we have previously stated, observed characteristics were different between career and non-career employees. Regression analyses accounted for multiple factors that could be driving injury rates, allowing us to identify the effect of these factors, but also assuring us that differences between career and non-career injury rates were not driven by omitted other factors.
Our analysis predicted the probability of injury for an employee in a given pay period controlling for several observed characteristics.
𝑃𝑃(𝐼𝐼𝑆𝑆𝐼𝐼𝐼𝐼𝑆𝑆𝑈𝑈𝑖𝑖𝑖𝑖 = 1) = 𝛼𝛼 + 𝛽𝛽1 ∗ 𝑁𝑁𝑆𝑆𝑆𝑆𝐶𝐶𝑆𝑆𝑆𝑆𝑆𝑆𝑆𝑆𝑆𝑆𝑖𝑖𝑖𝑖 + 𝛽𝛽2 ∗ 𝑋𝑋𝑖𝑖 + 𝛽𝛽3 ∗ 𝐶𝐶𝑆𝑆𝑆𝑆𝐶𝐶𝑆𝑆𝑖𝑖𝑖𝑖 + 𝛽𝛽4 ∗𝑂𝑂𝑂𝑂𝑆𝑆𝑆𝑆𝑆𝑆𝑆𝑆𝑂𝑂𝑆𝑆𝑖𝑖𝑖𝑖 + 𝛽𝛽5 ∗ 𝑁𝑁𝑆𝑆𝑁𝑁ℎ𝑆𝑆𝑖𝑖𝑖𝑖 + 𝑂𝑂 + 𝐹𝐹𝐹𝐹 + 𝑃𝑃𝑂𝑂𝐶𝐶𝑆𝑆𝑆𝑆𝑆𝑆𝑆𝑆𝑆𝑆𝑈𝑈𝐵𝐵(2)
• 𝑋𝑋𝑖𝑖 includes characteristics such as age, tenure, gender, and race/ethnicity. We accounted for basic demographics such as gender, race, and ethnicity by coding these variables as binary indicators. The excluded comparison groups were male, non-Hispanic, and White.
• Age and tenure were included as categorical variables (age categories and tenure categories). Age over 65 and more than 30 years of tenure were the excluded comparison groups.
• To capture occupational differences across USPS workforce, we controlled for USPS’s main occupation types (city carrier, postal clerk, mail handler, and rural carrier). All other occupation types are included under a larger grouping denoted by ‘other.’ Variables were coded as binary indicators. City carrier was the excluded comparison group.
• To examine the relationship between workhours and injuries, we included controls for participation in night work and overtime. We accounted for whether an employee works overtime (more than 80 hours per pay period) in the period right before getting injured and conducts any work at night in the period of injury—coded as binary variables.
• We controlled for postal facility (PO controls) to account for differences in unobservable characteristics at the postal facility that could determine injuries.

Appendix I: GAO Analyses of U.S. Postal Service Employee Turnover, Injuries, and Workers’ Compensation
Page 75 GAO-21-556 U.S. Postal Service
• We control for fiscal year indicators (2016 to 2020), and month indicators (January through December). The number of packages that USPS delivers has increased in recent years, and the change in mail composition from letter to packages in recent years may be correlated with injury rates over time.
• To account for missing values in our control variables, we generated missing indicators for demographics, tenure, and workhours. This approach ensured our analysis made use of all available data and avoids the assumption that missing values are missing at random.
• All results were calculated using a linear probability model with standard errors clustered at the postal facility level.
Table 20 present results of a regression predicting the likelihood an employee has a reported injury during a particular pay period.
Table 20: Probability of U.S. Postal Service (USPS) Reported Injury by Employee Characteristics, Fiscal Years 2016 through 2020
All City Carriers Clerks Mail Handlers Rural Carriers Non-Career 0.067** 0.205** 0.055** 0.056** -0.032** (0.003) (0.006) (0.006) (0.013) (0.005) Younger than 30 years
-0.115** -0.142** -0.118** -0.152** -0.131**
(0.005) (0.011) (0.008) (0.016) (0.010) Age 30-39 -0.113** -0.145** -0.082** -0.098** -0.135** (0.004) (0.010) (0.007) (0.016) (0.009) Age 40-49 -0.083** -0.097** -0.037** -0.060** -0.100** (0.004) (0.009) (0.006) (0.014) (0.008) Age 50-65 -0.033** -0.044** 0.004 -0.012 -0.040** (0.003) (0.008) (0.005) (0.012) (0.008) Less than 5 years of tenure
0.216** 0.326** 0.149** 0.186** 0.129**
(0.004) (0.008) (0.007) (0.014) (0.009) Tenure 5-9 0.115** 0.180** 0.103** 0.094** 0.067** (0.004) (0.010) (0.008) (0.018) (0.009) Tenure 10-19 0.080** 0.104** 0.058** 0.033** 0.050** (0.003) (0.006) (0.005) (0.009) (0.007) Tenure 20-29 0.041** 0.048** 0.031** 0.015+ 0.035** (0.002) (0.005) (0.004) (0.008) (0.007)
Results
Likelihood of Reported Injury

Appendix I: GAO Analyses of U.S. Postal Service Employee Turnover, Injuries, and Workers’ Compensation
Page 76 GAO-21-556 U.S. Postal Service
All City Carriers Clerks Mail Handlers Rural Carriers Female 0.190** 0.307** 0.124** 0.212** 0.179** (0.002) (0.004) (0.004) (0.008) (0.004) Hispanic 0.020** 0.022** 0.020** 0.001 0.027** (0.003) (0.006) (0.005) (0.010) (0.007) African American or Black
-0.006* -0.011* 0.003 -0.038** 0.004
(0.003) (0.005) (0.004) (0.008) (0.006) Multiple Races 0.037** 0.051** 0.030** 0.026 0.038** (0.007) (0.015) (0.011) (0.020) (0.014) American Indian or Alaskan Native/
Native Hawaiian or Other Pacific Islander
-0.010+ -0.037** -0.016+ -0.045* 0.018
(0.006) (0.011) (0.009) (0.019) (0.013) Asian -0.095** -0.105** -0.084** -0.114** -0.066** (0.004) (0.007) (0.006) (0.012) (0.010) Night Work Indicator 0.061** 0.051** 0.080** 0.091** (0.002) (0.004) (0.004) (0.010) Overtime Indicator -0.006** -0.056** -0.020** -0.031** 0.029** (0.002) (0.003) (0.003) (0.006) (0.004) Clerks -0.369** (0.004) Mail Handlers -0.270** (0.007) Other -0.363** (0.004) Rural Carriers -0.189** (0.004) Mean of Career Employees
0.295** 0.449** 0.197** 0.320** 0.318**
(0.002) (0.003) (0.003) (0.008) (0.003) Observations 83794756 27705533 20424051 6247231 15933812 Standard errors in parentheses
+ p<0.1 * p<0.05 ** p<0.01
Source: GAO analysis of USPS data. | GAO-21-556
Note: Models include missing indicators for demographics, tenure, overtime and night work. We reported marginal effects.
Appendix I: GAO Analyses of U.S. Postal Service Employee Turnover, Injuries, and Workers’ Compensation
Page 77 GAO-21-556 U.S. Postal Service
• Non-career employees had higher injury rates relative to career employees. The inclusion of demographics and work characteristics reduced the difference in reported injury rates between career and non-career employees, indicating that part of this difference can be explained by the factors such as tenure, age, the use of overtime, etc. Our model would predict that the probability of reported injury is 0.30 percent per pay period for career employees and 0.36 percent for non-career employees. Converting these figures to annual rates would imply the likelihood of injury would be 7.7 percent for career employees and 9.4 percent for non-career employees, or a relative difference in reported injuries of 22 percent ([9.4-7.7]/7.7) between career and non-career employees, conditional on characteristics.
• The effect of non-career status was about 31 percent in magnitude as the effect of being in the lowest tenure category of less than 5 years (0.067 vs 0.216 for non-career and less than years of tenure), an effect that USPS identified to be the single most important factor in determining injuries.
• Less experience was associated with increased risk of injury. Reported injury rates were highest among those with limited tenure (less than 5 years) but fell as an employee attained more tenure.
• Night work during the pay period of injury was associated with higher reported injury rates and the effect was large–it suggested increases in reported injury rates of 21 percent for career employees and 17 percent for non-career employees.
• Overtime work in the period before the injury period in models without post office controls was associated higher injury rates, though the effect was modest (parameter estimates are 0.005 and 0.008). However, controlling for post office effects caused the parameter estimate to change signs, though the overall size of the estimate is close to zero, indicating that conditional on all other controls, the effects attributed to overtime may be driven by postal facility specific characteristics, such as location. There was one exception: the inclusion of postal facility controls does not change the sign of parameter estimates for overtime for rural carriers, where participation in overtime was associated with higher rates of reported injuries.
• City carriers had the highest reported injury rates among USPS’s main occupation types.
• Injuries tended to rise with age. Females had higher probability of injury than males. Hispanics had higher rates of injury than non-Hispanics, though this effect is not observed for Hispanic mail handlers. Generally, those who were more than one race have higher

Appendix I: GAO Analyses of U.S. Postal Service Employee Turnover, Injuries, and Workers’ Compensation
Page 78 GAO-21-556 U.S. Postal Service
injury rates, and Asians, and African Americans/Blacks had lower injury rates than Whites, though these effects were not present in every occupation type. For example, we observed no difference in injury rates between African Americans/Blacks and Whites in the clerk and rural carrier occupation types.
Overall, the results for the combined effects were confirmed by estimated effects from the four main USPS occupation types. Rates were higher for non-career versus career employees by 46 percent for city carriers, 28 percent for clerks, and 18 percent for mail handlers. The only exception existed for non-career rural carriers, who experienced relatively lower injury rates of about 10 percent.
Table 21 summarizes the likelihood that employees experience FECA injuries. To identify employees with FECA injuries, we merged FECA injuries from Department of Labor data back into the population of USPS employees from payroll based on Social Security identifiers and date of injury. The results from the analysis do not track claim rates, but rather examine whether different groups of USPS employees systematically experience more FECA injuries—or injuries that could be considered serious enough by the employee to prompt a request for FECA compensation, conditional on other characteristics.
In our analysis, we examined these effects for a model that includes controls for demographics, tenure, occupation type, overtime and night work, fiscal year and month effects, and postal facility location. We found that non-career employees are also more likely to experience these types of injuries by approximately 16 percent. Conditional on characteristics, the implied annual rates for FECA injuries in our data are 6.9 percent for career employees and 8.0 percent for non-career employees. The effects of other controls are similar to those observed for the injury model in table 21; FECA injuries also generally tend to rise with age, fall with tenure, and are higher for females, Hispanics, and those performing night work. These injuries are significant for city carriers, with implied annual rates of 14.8 percent for non-career and 10.6 percent for career employees, or 40 percent higher for non-career city carriers.
Likelihood of FECA Injuries

Appendix I: GAO Analyses of U.S. Postal Service Employee Turnover, Injuries, and Workers’ Compensation
Page 79 GAO-21-556 U.S. Postal Service
Table 21: Probability of a Federal Employee Compensation Act (FECA) Injury, Fiscal Years 2016 through 2020
All City Carriers Clerks Mail Handlers
Rural Carriers
Probability of FECA Injury
Non-Career 0.043** 0.163** 0.037** 0.015 -0.037** (0.003) (0.006) (0.006) (0.012) (0.005) Younger than 30 years -0.101** -0.132** -0.102** -0.126** -0.114** (0.005) (0.011) (0.007) (0.016) (0.009) Age 30-39 -0.094** -0.128** -0.063** -0.072** -0.116** (0.004) (0.010) (0.007) (0.015) (0.008) Age 40-49 -0.067** -0.086** -0.023** -0.036** -0.084** (0.003) (0.009) (0.006) (0.012) (0.008) Age 50-65 -0.025** -0.039** 0.009+ -0.001 -0.030** (0.003) (0.008) (0.005) (0.011) (0.007) Less than 5 years of tenure 0.191** 0.296** 0.128** 0.154** 0.112** (0.004) (0.008) (0.006) (0.014) (0.009) Tenure 5-9 0.105** 0.159** 0.089** 0.086** 0.065** (0.004) (0.009) (0.007) (0.017) (0.008) Tenure 10-19 0.073** 0.098** 0.053** 0.026** 0.048** (0.003) (0.006) (0.005) (0.009) (0.007) Tenure 20-29 0.039** 0.047** 0.029** 0.008 0.035** (0.002) (0.005) (0.004) (0.008) (0.007) Female 0.174** 0.288** 0.108** 0.184** 0.161** (0.002) (0.004) (0.003) (0.008) (0.003) Hispanic 0.025** 0.027** 0.025** 0.019* 0.025** (0.003) (0.005) (0.005) (0.009) (0.007) African American or Black 0.005* 0.001 0.016** -0.018* 0.016** (0.003) (0.005) (0.004) (0.007) (0.006) Multiple Races 0.035** 0.051** 0.029** 0.029 0.030* (0.006) (0.014) (0.010) (0.021) (0.013) American Indian or Alaskan Native/ Native Hawaiian or Other Pacific Islander
-0.004 -0.027** -0.005 -0.042* 0.020
(0.006) (0.010) (0.009) (0.017) (0.013) Asian -0.083** -0.090** -0.069** -0.090** -0.063** (0.004) (0.006) (0.006) (0.011) (0.009) Night Work Indicator 0.044** 0.024** 0.067** 0.071**
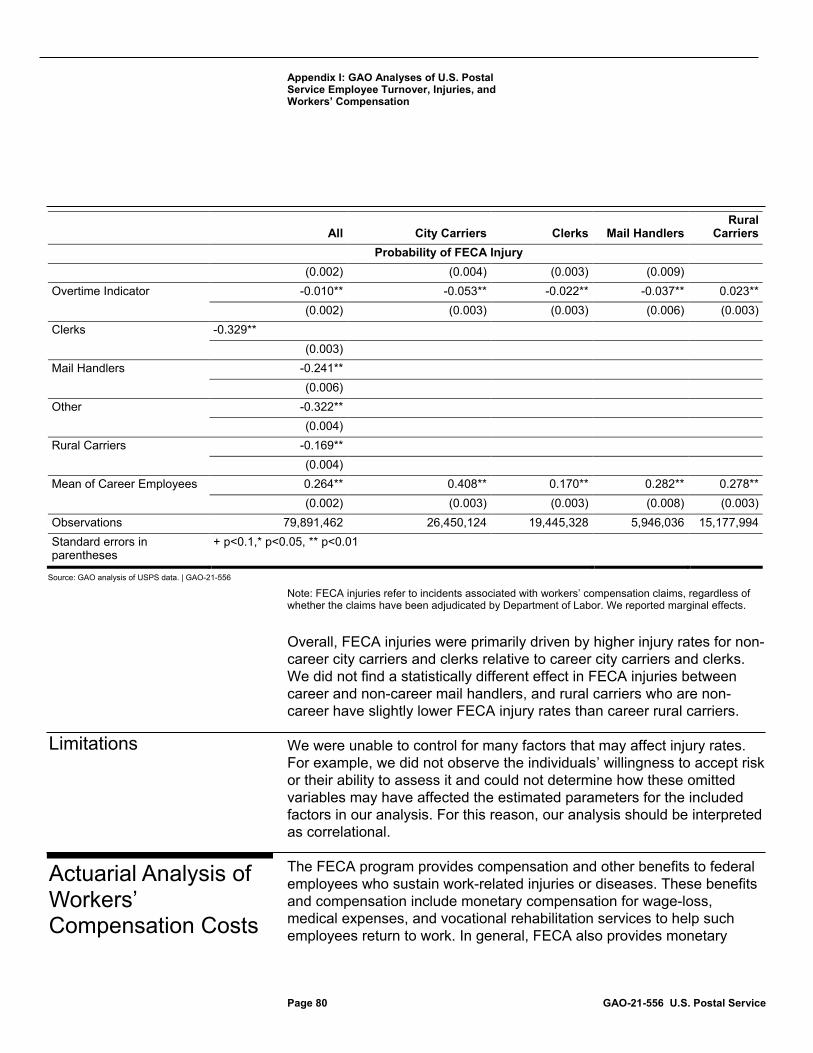
Appendix I: GAO Analyses of U.S. Postal Service Employee Turnover, Injuries, and Workers’ Compensation
Page 80 GAO-21-556 U.S. Postal Service
All City Carriers Clerks Mail Handlers
Rural Carriers
Probability of FECA Injury
(0.002) (0.004) (0.003) (0.009) Overtime Indicator -0.010** -0.053** -0.022** -0.037** 0.023** (0.002) (0.003) (0.003) (0.006) (0.003) Clerks -0.329**
(0.003)
Mail Handlers -0.241**
(0.006)
Other -0.322**
(0.004)
Rural Carriers -0.169**
(0.004)
Mean of Career Employees 0.264** 0.408** 0.170** 0.282** 0.278** (0.002) (0.003) (0.003) (0.008) (0.003) Observations 79,891,462 26,450,124 19,445,328 5,946,036 15,177,994 Standard errors in parentheses
+ p<0.1,* p<0.05, ** p<0.01
Source: GAO analysis of USPS data. | GAO-21-556
Note: FECA injuries refer to incidents associated with workers’ compensation claims, regardless of whether the claims have been adjudicated by Department of Labor. We reported marginal effects.
Overall, FECA injuries were primarily driven by higher injury rates for non-career city carriers and clerks relative to career city carriers and clerks. We did not find a statistically different effect in FECA injuries between career and non-career mail handlers, and rural carriers who are non-career have slightly lower FECA injury rates than career rural carriers.
We were unable to control for many factors that may affect injury rates. For example, we did not observe the individuals’ willingness to accept risk or their ability to assess it and could not determine how these omitted variables may have affected the estimated parameters for the included factors in our analysis. For this reason, our analysis should be interpreted as correlational.
The FECA program provides compensation and other benefits to federal employees who sustain work-related injuries or diseases. These benefits and compensation include monetary compensation for wage-loss, medical expenses, and vocational rehabilitation services to help such employees return to work. In general, FECA also provides monetary
Limitations
Actuarial Analysis of Workers’ Compensation Costs

Appendix I: GAO Analyses of U.S. Postal Service Employee Turnover, Injuries, and Workers’ Compensation
Page 81 GAO-21-556 U.S. Postal Service
compensation to dependents of employees who die from personal injury sustained while in the performance of their duties. USPS employees currently comprise the largest group of FECA beneficiaries and are responsible for the largest share of FECA benefits, according to the Congressional Research Service.100
We conducted actuarial analysis to compare average annual FECA cost for USPS employees by career status for fiscal years 2016 through 2020. In addition, we conducted actuarial analysis to compare average annual FECA costs by career status and tenure for fiscal year 2019.101
For the analysis by career status, we used fiscal year 2016 through 2020 USPS payroll data for employee career status, and we used fiscal year 2016 through 2020 FECA data for workers’ compensation cost information. In addition, we used case reserve estimates for all the open cases as of September 30, 2020, (fiscal year 2020) from the Department of Labor’s Office of Workers Compensation Programs. When linking FECA data to USPS data (fiscal years 2016 through 2020), we found many individuals who appeared in the FECA data but not in the USPS payroll data. These mismatches were most likely due to employees’ deaths, separations, or retirements. When limited our analysis to individuals in the FECA data with injuries in the most recent fiscal year (fiscal years 2016 through 2020), there were few individuals for which we could not find USPS payroll data.
For the analysis by career status and tenure, we used fiscal year 2016 through 2019 USPS payroll data for employee career status and start date, and we used fiscal year 2019 and 2020 FECA data for workers’ compensation cost information. In addition, we used case reserve estimates as described above.
The costs of workers’ compensation benefits for USPS include the claims paid for work-related injuries and the potential future payments for the 100 Congressional Research Service, The Federal Employees’ Compensation Act (FECA): Workers’ Compensation for Federal Employees, R42107 (Mar. 17, 2021).
101 For the analysis by career status and tenure, we examined fiscal year 2019 data because we needed multiple years of data to examine employee start dates. We were informed by USPS officials that non-career employees start dates (“enterondutydate”) are reset every year as they start new contracts. By examining start dates for fiscal years 2016 through 2019, we were able to obtain better information on non-career employees’ tenure with USPS. Although we obtained fiscal year 2020 data, we examined fiscal year 2019 data because fiscal year 2020 data may be unique due to the effects of COVID-19 on postal operations and workforce.
Data
Methodology

Appendix I: GAO Analyses of U.S. Postal Service Employee Turnover, Injuries, and Workers’ Compensation
Page 82 GAO-21-556 U.S. Postal Service
same injuries, because, depending on the severity of the injury, workers’ compensation payments are sometimes made for many years following the year in which the claim was incurred. Actuarial estimates of the present value of these future claims is also known as the reported but not paid claims cost liability. Actuaries develop what are known as case reserves to estimate the reported but not paid claims cost.
For both analyses, we calculated the annual cost of FECA benefits for USPS employees who made FECA claims in a given year as the sum of the claims paid in that year and the case reserve for those claims at the end of the year. Because one employee can incur more than one case, we first calculated the FECA cost for all cases before calculating an average annual FECA cost per claimant. For the analysis of fiscal year 2016 through 2020 FECA costs by career status, we started with calculating fiscal year 2020 FECA cost.
For fiscal year 2020, the total cost for fiscal year 2020 injuries was calculated as:
• For claims that were closed by the end of fiscal year 2020, total cost = claim payments made in fiscal year 2020
• For claims that were still open at the end of fiscal year 2020, total cost = claim payments made in fiscal year 2020 plus the case reserve, which is the present value of estimated future claim payments as of the end of fiscal year 2020
For the cost of claims incurred in fiscal year 2019, the total cost for each case was calculated as:
• For claims that were closed by the end of fiscal year 2019, total cost = claim payments made in fiscal year 2019
• For claims that were still open at the end of fiscal year 2019, total cost = claim payments made in fiscal year 2019 plus claim payments made in fiscal year 2020 plus the case reserve, which is the present value of estimated future claims payments as of the end of fiscal year 2020
Similarly, for the cost of claims incurred in fiscal year 2018, the total cost for each case is calculated as:
• For claims that were closed by the end of fiscal year 2018, total cost = claim payments made in fiscal year 2018
• For claims that were still open at the end of fiscal year 2018, total cost = claim payments made in fiscal year 2018 plus claim payments made

Appendix I: GAO Analyses of U.S. Postal Service Employee Turnover, Injuries, and Workers’ Compensation
Page 83 GAO-21-556 U.S. Postal Service
in fiscal year 2019 plus the case reserve we calculated for 2019, which is the present value of estimated future claims payments as of the end of fiscal year 2019, all discounted back to 2018.
We followed similar steps for calculating the cost of claims incurred in fiscal years 2016 and 2017.
For fiscal year 2016 to 2019, the present value was calculated using the discount rates for compensation and medical from the DOL Annual Actuarial Report on Estimate of FECA Liabilities for these years,102 as shown in Table 22 below.
Table 22: Discount Rate from Department of Labor Actuarial Liability Report, Fiscal Years 2016 through 2019
Discount Rate Fiscal Year Compensation Medical 2019 2.610% 2.350% 2018 2.716% 2.379% 2017 2.683% 2.218% 2016 2.781% 2.261%
Source: Department of Labor, Annual Actuarial Report on Estimate of Federal Employees’ Compensation Liabilities. | GAO-21-556
The average annual FECA cost per employee for an employee group (such as non-career employee) was calculated using the total FECA cost for all the employees in each fiscal year divided by the total number of employees at the end of that fiscal year.
We then we linked individuals in the FECA data to individuals in the USPS payroll to determine career status, occupation type, and start date.
The estimated total FECA benefit cost for USPS non-career employees was $386.7 million for fiscal years 2016 through 2020, with an annual average of about $77 million, as shown in table 23.
102 Department of Labor, Annual Actuarial Report on Estimate of FECA Liabilities.
Results

Appendix I: GAO Analyses of U.S. Postal Service Employee Turnover, Injuries, and Workers’ Compensation
Page 84 GAO-21-556 U.S. Postal Service
Table 23: Annual Total Federal Employees’ Compensation Act (FECA) Cost for U.S. Postal Service (USPS) Non-career Employees, Fiscal Years 2016 through 2020
Fiscal Year Annual Total FECA Cost for
Non-career Employees 2016 $61.7 million 2017 $74.5 million 2018 $75.9 million 2019 $97.8 million 2020 $76.8 million Total $386.7 million
Source: GAO analysis of USPS and Department of Labor data. | GAO-21-556
The average FECA cost for non-career employees varied by employee tenure. In our analysis of fiscal year 2019 claimants, non-career employees with less than 48 months of tenure had higher average FECA costs than career employees in the same tenure group, as shown in table 24. At 48 months and more of tenure, the average FECA cost for career employees was higher than for non-career employees. Our analysis found that most (89 percent) of non-career employees had less than 48 months of tenure. Conversely, most career employees had longer tenures and only a few (5 percent) had less than 48 months of tenure.
Table 24: Average Per-Employee Federal Employees’ Compensation Act (FECA) Costs (Total, Medical, and Compensation) for U.S. Postal Service (USPS) Non-Career Employees by Tenure, Fiscal Year 2019
Total Medical Compensation Number of employees Tenure in Months Career Non-career Career Non-career Career Non-career Career Non-career 0 to > 12 $270 $473 $105 $242 $165 $230 4,582 51,170 12 to > 24 $1,043 $1,125 $529 $598 $514 $527 8,725 29,548 24 to > 36 $895 $1,087 $449 $557 $446 $530 17,567 20,057 36 to > 48 $1,038 $1,148 $524 $571 $514 $577 45,949 12,629 48 to > 60 $952 $291 $473 $184 $479 $107 48,619 5,182 60 and over $1,014 $274 $407 $131 $608 $144 346,385 6,890
Source: GAO analysis of USPS and Department of Labor data. | GAO-21-556
These analyses relied on data and other listings provided by various personnel at USPS. We reviewed these data for reasonableness but did not audit these data for accuracy. All data-related analyses and procedures were performed in accordance with Actuarial Standard of Practice No. 23, Data Quality. To the extent that there are material deficiencies in completeness and accuracy in the data, the FECA cost

Appendix I: GAO Analyses of U.S. Postal Service Employee Turnover, Injuries, and Workers’ Compensation
Page 85 GAO-21-556 U.S. Postal Service
estimates may be materially different than that shown in this report had these deficiencies not been present.
USPS Injury data allowed us to examine whether a particular employee lost time because of a job-related injury. We then determined the number of lost hours, conditional on an employee having lost time.
To conduct this analysis we merged USPS injury data with demographic characteristics from USPS HR Data, and the employee’s tenure and occupation from payroll data.
We modeled lost time in a two-step model. In the first step, we modeled the likelihood an employee lost time due to a reported injury. In the second step, we examined the number of hours lost due to injury among those employees reporting lost time. We estimated these models based on equations (3) and (4) below.
Probability of lost time
𝑃𝑃(𝐿𝐿𝑆𝑆𝐵𝐵𝑆𝑆 𝑇𝑇𝑆𝑆𝑂𝑂𝑆𝑆 = 1)𝑖𝑖 = 𝛼𝛼 + 𝛽𝛽1 ∗ 𝑁𝑁𝑆𝑆𝑆𝑆𝐶𝐶𝑆𝑆𝑆𝑆𝑆𝑆𝑆𝑆𝑆𝑆𝑖𝑖 + 𝛽𝛽2 ∗ 𝑋𝑋𝑖𝑖 + 𝛽𝛽3 ∗ 𝐶𝐶𝑆𝑆𝑆𝑆𝐶𝐶𝑆𝑆𝑖𝑖 +𝑂𝑂𝑆𝑆𝑆𝑆𝑆𝑆ℎ𝑆𝑆 + 𝐹𝐹𝐹𝐹𝑆𝑆 + 𝑃𝑃𝑂𝑂𝐶𝐶𝑆𝑆𝑆𝑆𝑆𝑆𝑆𝑆𝑆𝑆𝑈𝑈𝐵𝐵𝑆𝑆𝑆𝑆 + 𝜀𝜀𝑆𝑆𝑆𝑆 (3) Conditional on having lost time, we model number of hours lost.
𝑁𝑁𝐼𝐼𝑂𝑂𝑁𝑁𝑆𝑆𝑆𝑆 𝑆𝑆𝐶𝐶 𝐿𝐿𝑆𝑆𝐵𝐵𝑆𝑆 𝐻𝐻𝑆𝑆𝐼𝐼𝑆𝑆𝐵𝐵𝑆𝑆 = 𝛼𝛼 + 𝛽𝛽1 ∗ 𝑁𝑁𝑆𝑆𝑆𝑆𝐶𝐶𝑆𝑆𝑆𝑆𝑆𝑆𝑆𝑆𝑆𝑆𝑆𝑆 + 𝛽𝛽2 ∗ 𝑋𝑋𝑆𝑆 + 𝛽𝛽3 ∗ 𝐶𝐶𝑆𝑆𝑆𝑆𝐶𝐶𝑆𝑆𝑆𝑆 +𝑂𝑂𝑆𝑆𝑆𝑆𝑆𝑆ℎ𝑆𝑆 + 𝐹𝐹𝐹𝐹𝑆𝑆 + 𝑃𝑃𝑂𝑂𝐶𝐶𝑆𝑆𝑆𝑆𝑆𝑆𝑆𝑆𝑆𝑆𝑈𝑈𝐵𝐵𝑆𝑆𝑆𝑆 + 𝜀𝜀𝑆𝑆𝑆𝑆 (4) Equations (3) and (4) control for career status and the same demographic characteristics and postal facility characteristics as in equation (2).103 We used a fixed effects logit to estimate equation (3) and a fixed effects negative binomial model for equation (4).104
103 We controlled for age, gender, race, ethnicity, and job tenure. We accounted for USPS’ main occupation types (city carrier, postal clerk, mail handler, and rural carriers). All other occupation types are included under a larger grouping denoted by ‘other.’ We controlled for fiscal year indicators (2016 to 2020), and month indicators (January through December), and facility specific indicators. To account for missing values in our control variables we generated missing indicators for demographics, and tenure. 𝜀𝜀𝑖𝑖𝑖𝑖 is a normally distributed error term with mean zero.
104 We performed testing to determine the relationship between the mean and variance of lost hours, which informed the choice of a negative binomial model.
Regression Analysis on Lost Time (Loss of Productivity)
Data
Methodology
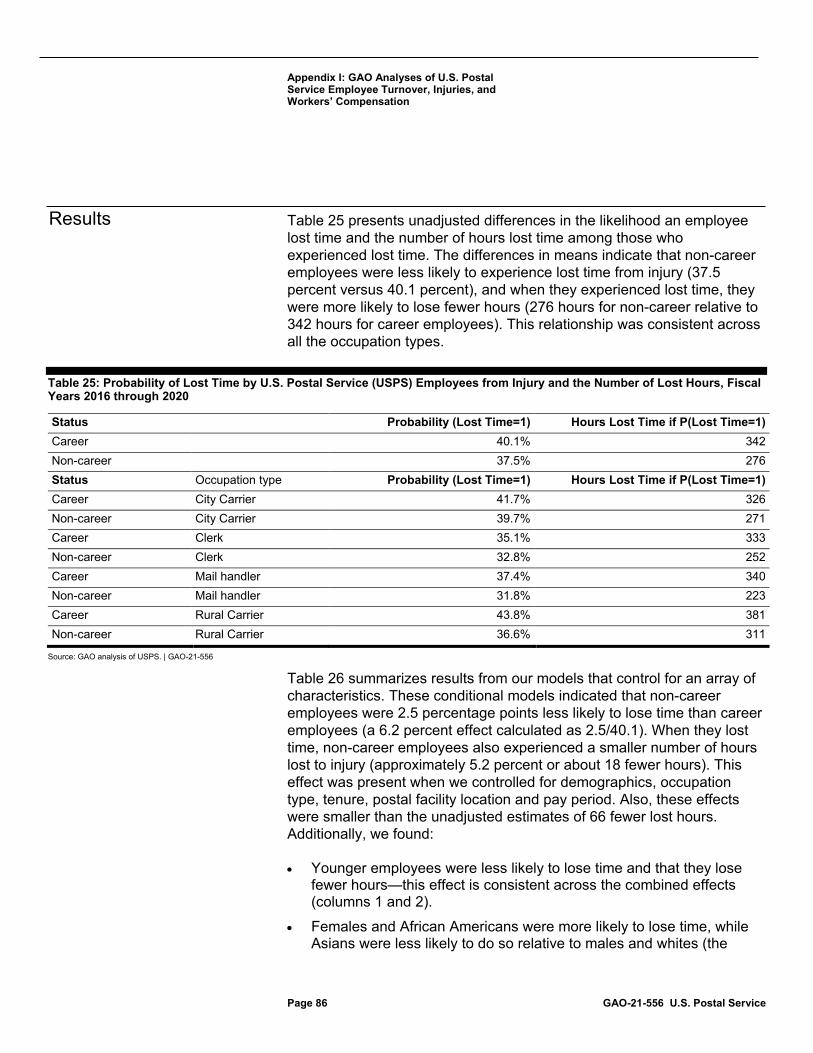
Appendix I: GAO Analyses of U.S. Postal Service Employee Turnover, Injuries, and Workers’ Compensation
Page 86 GAO-21-556 U.S. Postal Service
Table 25 presents unadjusted differences in the likelihood an employee lost time and the number of hours lost time among those who experienced lost time. The differences in means indicate that non-career employees were less likely to experience lost time from injury (37.5 percent versus 40.1 percent), and when they experienced lost time, they were more likely to lose fewer hours (276 hours for non-career relative to 342 hours for career employees). This relationship was consistent across all the occupation types.
Table 25: Probability of Lost Time by U.S. Postal Service (USPS) Employees from Injury and the Number of Lost Hours, Fiscal Years 2016 through 2020
Status Probability (Lost Time=1) Hours Lost Time if P(Lost Time=1) Career
40.1% 342
Non-career
37.5% 276 Status Occupation type Probability (Lost Time=1) Hours Lost Time if P(Lost Time=1) Career City Carrier 41.7% 326 Non-career City Carrier 39.7% 271 Career Clerk 35.1% 333 Non-career Clerk 32.8% 252 Career Mail handler 37.4% 340 Non-career Mail handler 31.8% 223 Career Rural Carrier 43.8% 381 Non-career Rural Carrier 36.6% 311
Source: GAO analysis of USPS. | GAO-21-556
Table 26 summarizes results from our models that control for an array of characteristics. These conditional models indicated that non-career employees were 2.5 percentage points less likely to lose time than career employees (a 6.2 percent effect calculated as 2.5/40.1). When they lost time, non-career employees also experienced a smaller number of hours lost to injury (approximately 5.2 percent or about 18 fewer hours). This effect was present when we controlled for demographics, occupation type, tenure, postal facility location and pay period. Also, these effects were smaller than the unadjusted estimates of 66 fewer lost hours. Additionally, we found:
• Younger employees were less likely to lose time and that they lose fewer hours—this effect is consistent across the combined effects (columns 1 and 2).
• Females and African Americans were more likely to lose time, while Asians were less likely to do so relative to males and whites (the
Results

Appendix I: GAO Analyses of U.S. Postal Service Employee Turnover, Injuries, and Workers’ Compensation
Page 87 GAO-21-556 U.S. Postal Service
excluded categories). Conditional on experiencing lost time, females and African Americans lost more hours, while Asians lost fewer hours, relative to males and Whites.
• Comparing within occupation type, non-career clerks lost 24 fewer hours and mail handlers lost 46 fewer hours than their respective career colleagues, estimated at the mean number of hours for those who lost hours. The gap in the likelihood of lost time was about 3.9 and 5.2 percentage points lower relative to career clerks and mail handlers respectively. The gap in the probability of lost time was 5 percentage points smaller for non-career rural carriers, but the number of lost hours was no different for non-career rural carriers than their respective career colleagues. Finally, non-career city carriers experienced the same probability of losing time as career city carriers, but they lost 3.6 percent fewer hours (12 fewer hours).

Appendix I: GAO Analyses of U.S. Postal Service Employee Turnover, Injuries, and Workers’ Compensation
Page 88 GAO-21-556 U.S. Postal Service
Table 26: Probability of Lost Time by U.S. Postal Service (USPS) Employees from Injury and the Number of Lost Hours, Conditional on Having Lost Time, Fiscal Years 2016 through 2020
All City Carriers Clerks Mail Handlers Rural Carriers P(Lost time=1) Hours Lost P(Lost time=1) Hours Lost P(Lost time=1) Hours Lost P(Lost time=1) Hours Lost P(Lost time=1) Hours Lost Non-Career -0.025** -0.052** -0.007+ -0.036** -0.039** -0.073** -0.052** -0.135** -0.050** -0.037 (0.003) (0.008) (0.004) (0.010) (0.009) (0.025) (0.011) (0.032) (0.010) (0.026) Younger than 30 years
-0.094** -0.231** -0.103** -0.235** -0.087** -0.161** -0.078** -0.116+ -0.111** -0.324**
(0.007) (0.019) (0.012) (0.031) (0.018) (0.051) (0.022) (0.060) (0.017) (0.047) Age 30-39 -0.051** -0.135** -0.065** -0.135** -0.016 -0.045 -0.027 -0.031 -0.061** -0.239** (0.007) (0.018) (0.012) (0.030) (0.017) (0.049) (0.021) (0.057) (0.016) (0.043) Age 40-49 -0.023** -0.068** -0.035** -0.069* 0.017 0.020 0.004 0.032 -0.039* -0.164** (0.007) (0.017) (0.012) (0.029) (0.016) (0.046) (0.020) (0.053) (0.015) (0.041) Age 50-65 -0.014* -0.017 -0.019+ -0.011 -0.007 0.003 -0.011 0.075 -0.011 -0.076* (0.006) (0.016) (0.011) (0.028) (0.015) (0.041) (0.018) (0.048) (0.015) (0.038) Less than 5 years of tenure
0.037** -0.062** 0.036** -0.058** 0.059** -0.097** 0.028 -0.030 -0.014 -0.050
(0.005) (0.013) (0.007) (0.019) (0.012) (0.034) (0.018) (0.048) (0.018) (0.046) Tenure 5-9 0.032** -0.037* 0.036** -0.028 -0.000 -0.085 0.017 0.036 -0.012 -0.004 (0.007) (0.017) (0.010) (0.026) (0.021) (0.062) (0.027) (0.072) (0.017) (0.044) Tenure 10-19 0.023** -0.043** 0.021** -0.048** 0.026* -0.073* 0.006 -0.016 -0.020 -0.006 (0.005) (0.012) (0.007) (0.017) (0.012) (0.035) (0.016) (0.043) (0.015) (0.039) Tenure 20-29 0.016** -0.031** 0.015* -0.023 0.018+ -0.060* -0.005 -0.021 -0.016 -0.020 (0.005) (0.012) (0.007) (0.017) (0.010) (0.029) (0.015) (0.041) (0.015) (0.040) Female 0.042** 0.061** 0.044** 0.056** 0.029** 0.064** 0.020* 0.047* 0.063** 0.083** (0.002) (0.006) (0.003) (0.008) (0.007) (0.020) (0.008) (0.022) (0.006) (0.017) Hispanic 0.004 0.002 -0.003 -0.013 0.011 -0.020 0.022 0.011 0.015 0.065*

Appendix I: GAO Analyses of U.S. Postal Service Employee Turnover, Injuries, and Workers’ Compensation
Page 89 GAO-21-556 U.S. Postal Service
All City Carriers Clerks Mail Handlers Rural Carriers P(Lost time=1) Hours Lost P(Lost time=1) Hours Lost P(Lost time=1) Hours Lost P(Lost time=1) Hours Lost P(Lost time=1) Hours Lost (0.004) (0.009) (0.005) (0.012) (0.011) (0.031) (0.014) (0.037) (0.011) (0.029) African American or Black
0.018** 0.019** 0.011* 0.020* 0.030** -0.005 0.010 -0.015 0.032** -0.023
(0.003) (0.007) (0.004) (0.010) (0.008) (0.022) (0.010) (0.026) (0.009) (0.022) Multiple Races 0.019* 0.024 0.027** 0.003 0.044* -0.008 -0.036 -0.043 -0.017 0.100+ (0.008) (0.021) (0.007) (0.027) (0.022) (0.061) (0.027) (0.077) (0.022) (0.060) American Indian or Alaskan Native
0.009 -0.015 0.003 -0.012 0.001 0.016 0.009 -0.064 0.041* -0.040
(0.007) (0.019) (0.010) (0.025) (0.022) (0.061) (0.028) (0.076) (0.021) (0.055) Asian -0.017** -0.058** -0.027** -0.071** 0.007 -0.059+ -0.001 -0.039 -0.035+ -0.094+ (0.005) (0.013) (0.007) (0.018) (0.013) (0.034) (0.017) (0.044) (0.018) (0.050) Clerk -0.073** -0.086**
(0.004) (0.009)
Mail Handler -0.051** -0.103**
(0.006) (0.012)
Other -0.041** 0.019
(0.006) (0.013)
Rural Carrier 0.018** 0.016+
(0.004) (0.009)
Observations 267849 105448 141212 58170 34355 11811 21236 7633 43537 17775 Standard errors in parentheses
+ p<0.1 * p<0.05 ** p<0.01
Source: GAO analysis of USPS and Department of Labor data. | GAO-21-556
Note: Marginal effects reported.

Appendix I: GAO Analyses of U.S. Postal Service Employee Turnover, Injuries, and Workers’ Compensation
Page 90 GAO-21-556 U.S. Postal Service
One limitation of this analysis was that severity of injury should determine the likelihood and number of lost hours. However, we were unable to control for severity of injury from our data.
USPS injury data and USPS payroll data allowed us to examine the extent to which lost time due to injury led to more overtime hours for the injured employee’s co-workers. Injuries that lead to lost time for the injured employee could affect the number of overtime hours charged within his or her occupation type as some coworkers pick up these additional hours. This adjustment likely affects employees in the same occupation type as the injured employee and could have less of an effect on employees in unaffected occupation types. For example, injuries sustained by city carriers may affect the overtime and total workhours of other city carriers in a given postal facility but less so the hours of other occupation types such as clerks, mail handlers, or rural carriers. This analysis examines the utilization of overtime and total work hours by uninjured employees after a workplace injury.
We extracted workhours from USPS payroll data and merged lost time information from USPS injury data.
To model overtime usage at facilities after an employee sustains an injury, we aggregated per-employee charged overtime hours and total workhours in postal facilities and occupation types where an employee sustained an injury that led to lost time. For example, if a city carrier was injured and lost time the “treated” group would be other uninjured city carriers in the same postal facility. The “control” are employees in the same postal facility in the other occupation types (mail handlers, clerks, and rural carriers) who did not experience an injury and are unlikely to pick up slack from the injured city carrier. This methodology is similar to a standard difference-in-differences. The post period is the period after the injury and the “treated” group is the occupation type of the employee that lost time from an injury. Since we examined the sample of postal facilities
Limitations
Regression Analysis on Overtime and Total Workhour Utilization by Uninjured Employees after Reported Injury Introduction
Data
Methodology

Appendix I: GAO Analyses of U.S. Postal Service Employee Turnover, Injuries, and Workers’ Compensation
Page 91 GAO-21-556 U.S. Postal Service
where an injury occurred, the “control group” are non-injured employees in other occupation types in those same postal facilities. This model also assumes underlying trends in demand for mail delivery are common at the postal facility and occupation type, thus differential trends are not driving results. We provide some evidence that this assumption in pre-trends is satisfied in our data. We estimated this relationship for the five pay periods before and up to eight pay periods after an injury occurs using USPS data from fiscal years 2015 through 2020.105 We estimated the model outlined in equation (5).
𝑁𝑁𝐼𝐼𝑂𝑂𝑁𝑁𝑆𝑆𝑆𝑆 𝑆𝑆𝐶𝐶 𝐶𝐶ℎ𝑆𝑆𝑆𝑆𝑁𝑁𝑆𝑆𝑎𝑎 𝐻𝐻𝑆𝑆𝐼𝐼𝑆𝑆𝐵𝐵 𝑃𝑃𝑆𝑆𝑆𝑆 𝑈𝑈𝑆𝑆𝑆𝑆𝑆𝑆𝐼𝐼𝐼𝐼𝑆𝑆𝑆𝑆𝑎𝑎 𝑊𝑊𝑆𝑆𝑆𝑆𝑘𝑘𝑆𝑆𝑆𝑆𝑖𝑖𝑖𝑖 = 𝛼𝛼 + ∑ 𝛽𝛽𝑖𝑖 ∗𝑖𝑖=8𝑖𝑖=−5
𝑇𝑇𝑆𝑆𝑆𝑆𝑆𝑆𝑆𝑆𝑆𝑆𝑎𝑎𝑖𝑖𝑖𝑖 ∗ 𝐶𝐶𝑆𝑆𝑆𝑆𝐶𝐶𝑆𝑆𝑖𝑖 + 𝑃𝑃𝑂𝑂 𝐶𝐶𝑆𝑆𝑆𝑆𝑆𝑆𝑆𝑆𝑆𝑆𝑈𝑈𝐵𝐵𝑖𝑖 ∗ 𝐶𝐶𝑆𝑆𝑆𝑆𝐶𝐶𝑆𝑆𝑖𝑖 + 𝑃𝑃𝑆𝑆𝑈𝑈 𝑃𝑃𝑆𝑆𝑆𝑆𝑆𝑆𝑆𝑆𝑎𝑎 𝐶𝐶𝑆𝑆𝑆𝑆𝑆𝑆𝑆𝑆𝑆𝑆𝑈𝑈𝐵𝐵𝑖𝑖 + 𝜀𝜀𝑖𝑖𝑖𝑖 (5)
• The outcome variable captures the average number of overtime or total workhours for uninjured employees in the same occupation type as the injured worker.
• The variables of interest are a series of binary variables for the period before and after an injury occurs for a given occupation type. These variables will be 1 only for affected occupation types in the 5 pay periods before and 8 pay periods after an injury. These variables capture differences in average overtime or total workhours among non-injured employees in the treated group relative to the control groups, which include all employees in unaffected occupations in the same postal facility.
• Postal facility (PO Controls) by occupation type will control for level differences in workhours in a postal facility for each occupation.
• Pay period controls adjust for variation in hours that are a function of time.
• 𝜀𝜀𝑖𝑖𝑖𝑖 is a normally distributed, error term with mean zero. • We specify two versions of equation (5). First we examine workhours
in occupations and postal facilities, and we code occupations where an employee lost time as a binary variable (0/1). In another specification, we examine the percentage of injured employees in an occupation within a postal facility. We expect that the higher the
105 Because we looked at five pay periods prior to the date of injury, we analyzed some data from fiscal year 2015 even though our study period was fiscal year 2016 through fiscal year 2020.

Appendix I: GAO Analyses of U.S. Postal Service Employee Turnover, Injuries, and Workers’ Compensation
Page 92 GAO-21-556 U.S. Postal Service
percentage of injured employees, the more overtime and workhours other employees have to service.
The way our model was specified, the parameters 𝛽𝛽𝑖𝑖 capture average differences in overtime and workhours between affected and unaffected occupation types. We expected that before the injury (𝛽𝛽−5 to 𝛽𝛽−1) would be close to zero. Intuitively, there should be no differences in overtime utilization between “treated” and “control” units before an injury. Periods from zero to 8 capture the period of the injury (period zero) and the eight pay periods after the injury. If USPS experiences adjustments costs after an injury we should observe that overtime and workhours increase for uninjured employees (𝛽𝛽1 to 𝛽𝛽8 are positive). The effect on workhours was largest right after the injury and abates over time, reverting back toward zero after a few periods. This reversion to zero was expected because the injured employee eventually may return to work and because USPS may pursue hiring to fill in the vacant positon on a temporary basis.
We found that overtime and total workhours increased among employees whose coworker was injured, in the specification where the affected variable is coded as a binary indicator. Differences between affected and unaffected occupation types before the injury are close to zero. By contrast, overtime and overall workhours increase in the period of the injury and the immediate period after, and dissipated as time passed, reverting close to zero several periods after the injury. This specification suggests that experiencing a coworker injury increases workhours and overtime by 1.1 and 0.7 hours respectively in the pay period right after injury for each non-injured employee. Figure 5 presents the graphical results of our estimated models.
Results

Appendix I: GAO Analyses of U.S. Postal Service Employee Turnover, Injuries, and Workers’ Compensation
Page 93 GAO-21-556 U.S. Postal Service
Figure 5: Overtime and Workhour Utilization by Uninjured Employees in U.S. Postal Service (USPS) Facilities with Employees Who Lost Time Due to Reported Injuries, Fiscal Years 2016 through 2020
As a robustness check, we defined the variable of interest as the percentage of employees who lost time in a particular occupation type and postal facility. We expected that the effect in workhours estimated under a model where we capture percentage of employees injured to be larger. Intuitively, if an uninjured employee has to pick up hours from multiple injured coworkers, the effects on the employee’s workhours should be larger. We found that the estimated effect is larger, and increases with the percentage of injured employees in one’s occupation. Temporarily losing 10 percent of the employees in an occupation type due to injury implies that workhours rise by 0.7 for overtime and 1.6 total workhours in the first period after the injury for uninjured coworkers. The cumulative effects imply that as higher shares of employees were affected by injury, overtime and workhours demands increased for their coworkers, as did the expenditures that USPS must pay for these overtime hours.

Appendix I: GAO Analyses of U.S. Postal Service Employee Turnover, Injuries, and Workers’ Compensation
Page 94 GAO-21-556 U.S. Postal Service
This analysis assumed no spillovers across occupation types. However, some tasks may spill over to other occupation types. If spillovers existed, the effects identified in our analysis may be overstated or understated.
Limitations

Appendix II: Comments from U.S. Postal Service
Page 95 GAO-21-556 U.S. Postal Service
Appendix II: Comments from U.S. Postal Service

Appendix II: Comments from U.S. Postal Service
Page 96 GAO-21-556 U.S. Postal Service

Appendix III: GAO Contact and Staff Acknowledgments
Page 97 GAO-21-556 U.S. Postal Service
Jill Naamane, (202) 512-2834 or [email protected]
In addition to the individual named above, Kyle Browning (Assistant Director); Rebecca Rygg (Analyst-in-Charge); Geoff Hamilton; Lijia Guo; Bonnie Ho; Shylene Mata; Silda Nikaj; Malika Rice; Kelly Rubin; Amy Rosewarne; Joe Silvestri; and Frank Todisco made key contributions to this report.
Appendix III: GAO Contact and Staff Acknowledgments
GAO Contact Staff Acknowledgments
104094

The Government Accountability Office, the audit, evaluation, and investigative arm of Congress, exists to support Congress in meeting its constitutional responsibilities and to help improve the performance and accountability of the federal government for the American people. GAO examines the use of public funds; evaluates federal programs and policies; and provides analyses, recommendations, and other assistance to help Congress make informed oversight, policy, and funding decisions. GAO’s commitment to good government is reflected in its core values of accountability, integrity, and reliability.
The fastest and easiest way to obtain copies of GAO documents at no cost is through our website. Each weekday afternoon, GAO posts on its website newly released reports, testimony, and correspondence. You can also subscribe to GAO’s email updates to receive notification of newly posted products.
The price of each GAO publication reflects GAO’s actual cost of production and distribution and depends on the number of pages in the publication and whether the publication is printed in color or black and white. Pricing and ordering information is posted on GAO’s website, https://www.gao.gov/ordering.htm.
Place orders by calling (202) 512-6000, toll free (866) 801-7077, or TDD (202) 512-2537.
Orders may be paid for using American Express, Discover Card, MasterCard, Visa, check, or money order. Call for additional information.
Connect with GAO on Facebook, Flickr, Twitter, and YouTube. Subscribe to our RSS Feeds or Email Updates. Listen to our Podcasts. Visit GAO on the web at https://www.gao.gov.
Contact FraudNet:
Website: https://www.gao.gov/about/what-gao-does/fraudnet
Automated answering system: (800) 424-5454 or (202) 512-7700
Orice Williams Brown, Managing Director, [email protected], (202) 512-4400, U.S. Government Accountability Office, 441 G Street NW, Room 7125, Washington, DC 20548
Chuck Young, Managing Director, [email protected], (202) 512-4800 U.S. Government Accountability Office, 441 G Street NW, Room 7149 Washington, DC 20548
Stephen J. Sanford, Managing Director, [email protected], (202) 512-4707 U.S. Government Accountability Office, 441 G Street NW, Room 7814, Washington, DC 20548
GAO’s Mission
Obtaining Copies of GAO Reports and Testimony Order by Phone
Connect with GAO
To Report Fraud, Waste, and Abuse in Federal Programs
Congressional Relations
Public Affairs
Strategic Planning and External Liaison
Please Print on Recycled Paper.