gao-22-104079, fema flood maps: better planning and
TRANSCRIPT

FEMA FLOOD MAPS
Better Planning and Analysis Needed to Address Current and Future Flood Hazards
Report to Congressional Committees
October 2021
GAO-22-104079
United States Government Accountability Office

United States Government Accountability Office
Highlights of GAO-22-104079, a report to congressional committees
October 2021
FEMA FLOOD MAPS Better Planning and Analysis Needed to Address Current and Future Flood Hazards
What GAO Found The Federal Emergency Management Agency’s (FEMA) Risk Mapping, Assessment, and Planning (Risk MAP) program has increased its development of flood maps and other flood risk products, but faces challenges ensuring they comprehensively reflect current and future flood hazards. For example, its flood risk products do not reflect hazards such as heavy rainfall and the best available climate science. These products include maps—known as Flood Insurance Rate Maps—and nonregulatory flood risk products such as estimates of flood damage in an area. FEMA’s Risk MAP program is addressing some of these challenges, but many may require years to address. However, Risk MAP has been operating under an out-of-date plan that does not reflect new goals, objectives, activities, performance measures, and associated timeframes. Updating its program plan to include these elements could help FEMA effectively manage and coordinate its efforts to incorporate current and future flood hazards in a timely way.
Example of River Flooding
FEMA does not periodically assess the usefulness of its nonregulatory flood risk products, which are intended to help communities increase their resilience to floods. According to FEMA, it has invested millions of dollars in developing Risk MAP nonregulatory products; however, the agency has not assessed the usefulness of these products in increasing community resilience since 2016. Establishing mechanisms for periodically assessing the usefulness of its nonregulatory products could help FEMA ensure it is investing in products that address community need and have a meaningful impact on enhancing flood resilience.
FEMA prioritizes mapping projects with input from all levels of government and FEMA regional offices, but could better use available data to inform its mapping efforts. FEMA’s decision-making process has emphasized directing resources to areas with greatest flood risks. Additionally, in 2020, FEMA established a strategic priority for considering socially-vulnerable populations as part of disaster resilience. According to GAO’s statistical analyses of data from the Risk MAP program and FEMA’s publicly available disaster risk assessment tools, FEMA’s mapping investments for fiscal years 2012 to 2020 were greater where flood risks were higher, but were lower for areas of higher socially-vulnerable populations. By considering ways to leverage available data into its annual process for prioritizing its flood mapping investments, FEMA could enhance its ability to make well-informed decisions that meet agency and federal priorities and disaster resilience goals.
View GAO-22-104079. For more information, contact Chris Currie at 404-679-1875 or [email protected]
Why GAO Did This Study FEMA is responsible for producing and updating Flood Insurance Rate Maps and nonregulatory products to show areas of greatest flood hazards and help guide floodplain management actions under the National Flood Insurance Program. While FEMA has mapped millions of miles of the nation’s streams and coastlines, questions have been raised about whether its flood risk products provide a comprehensive picture of flood risk.
The Additional Supplemental Appropriations for Disaster Relief Act of 2019 required GAO to review issues related to 2018 disasters. As part of this body of work, this report addresses (1) the extent FEMA has developed Flood Insurance Rate Maps and nonregulatory products that reflect current and future flood hazards, (2) the extent FEMA has assessed its efforts to enhance flood resilience, and (3) how FEMA prioritizes its mapping resources to create and update Flood Insurance Rate Maps. GAO reviewed agency documents and strategic plans; analyzed FEMA data; and interviewed FEMA, selected states and localities, and flood mapping experts.
What GAO Recommends GAO recommends that FEMA (1) update its Risk MAP program plan to identify goals, time frames, and other elements related to its efforts to reflect current and future flood hazards; (2) develop mechanisms to assess the usefulness of its nonregulatory flood risk products; and (3) consider ways to leverage its flood risk data to help prioritize its mapping investment decisions. The Department of Homeland Security concurred with our recommendations.

Page i GAO-22-104079 FEMA Flood Maps
Letter 1
Background 6 FEMA Developed More FIRMs and Nonregulatory Products, but
Has Not Updated its Multiyear Plan to Fully Reflect Flood Hazards 11
FEMA Has Not Assessed Usefulness of Nonregulatory Products for Enhancing Flood Resilience 26
FEMA Collaborates with Stakeholders to Prioritize Mapping Investments, but Has Not Leveraged Available Data to Inform Decisions 37
Conclusions 41 Recommendations for Executive Action 42 Agency Comments and Our Evaluation 42
Appendix I Statistical Analyses of FEMA’s Mapping, and Map Prioritization Process 46
Appendix II Comments from the U.S. Department of Homeland Security 59
Appendix III GAO Contact and Staff Acknowledgments 63
Related GAO Products 64
Tables
Table 1: GAO Linear Regression Model with Dependent Variable: The Number of Mapped Miles, as of Fiscal Year 2012 54
Table 2: GAO Linear Regression Model with Dependent Variable: Miles with Digital Flood Insurance Rate Maps, as of Fiscal Year 2012 55
Table 3: GAO Linear Regression Model with Dependent Variable: Percent Change in Miles That Met FEMA’s New, Validated, or Updated Engineering (NVUE) Standard, Fiscal Years 2012 to 2020 56
Contents

Page ii GAO-22-104079 FEMA Flood Maps
Table 4: GAO Linear Regression Model with Dependent Variable: Change in Cycle Times at Each Stage of FEMA’s Mapping Process, Fiscal Years 2012 to 2020 57
Figures
Figure 1: FEMA’s Flood Risk Database Nonregulatory Products 29 Figure 2: FEMA Stand-Alone Nonregulatory Products 30 Figure 3: Summary of Observations from Each Local, State, and
FEMA Regional Office Interviewed on FEMA’s Nonregulatory Products for Floodplain Management Activities 32
Abbreviations Biggert-Waters Act Biggert-Waters Flood Insurance Reform Act of
2012 CNMS Coordinated Needs Management Strategy DHS Department of Homeland Security FEMA Federal Emergency Management Agency FIMA Flood Insurance and Mitigation Administration FIRM Flood Insurance Rate Map LIDAR Light Detection and Ranging NFIP National Flood Insurance Program NVUE New, Validated, or Updated Engineering Risk MAP Risk Mapping, Assessment, and Planning TMAC Technical Mapping Advisory Council
This is a work of the U.S. government and is not subject to copyright protection in the United States. The published product may be reproduced and distributed in its entirety without further permission from GAO. However, because this work may contain copyrighted images or other material, permission from the copyright holder may be necessary if you wish to reproduce this material separately.

Page 1 GAO-22-104079 FEMA Flood Maps
441 G St. N.W. Washington, DC 20548
October 25, 2021
Congressional Committees
Flooding is the costliest natural disaster annually in the United States, causing over $155 billion in property damages in the last decade, according to the Federal Emergency Management Agency (FEMA). Hurricane Ida in August 2021 is a recent example of a natural disaster that resulted in flood damages and lives lost across multiple states. Disaster costs are projected to increase as some extreme weather events become more frequent and intense due to climate change, as observed and projected by the U.S. Global Change Research Program and the National Research Council.1 Due to the rising number of natural disasters and increasing reliance on federal assistance to address them, GAO has included climate change on our list of high risk federal program areas since 2013.2
FEMA, within the Department of Homeland Security (DHS), is the primary federal agency tasked with managing all aspects of the National Flood Insurance Program (NFIP), which was established in 1968 to mitigate against future losses from floods.3 As part of the program, FEMA maps areas of greatest flood hazards—called Special Flood Hazard Areas—and other flood hazard areas through a regulatory rule-making process.4 These maps are known as Flood Insurance Rate Maps (FIRM). FEMA provides other supplementary flood risk information—known as nonregulatory products—that are not subject to the regulatory rule- 1The U.S. Global Change Research Program is a research coordinating body that spans 13 federal agencies. The National Research Council is a private, nonprofit society of distinguished scholars that provides independent, objective analysis and advice to the nation and conducts other activities to solve complex problems and inform public policy decisions. See U.S. Global Chance Research Program, Impacts, Risks, and Adaptation in the United States: Fourth National Climate Assessment, vol. 2 (Washington, D.C.: 2018) and The National Research Council, Committee on Extreme Weather Events and Climate Change Attribution, Attribution of Extreme Weather Events in the Context of Climate Change (Washington, D.C.: 2016).
2GAO, High Risk Series: Dedicated Leadership Needed to Address Limited Progress in Most High Risk Areas, GAO-21-119SP (Washington, D.C.: Mar. 2, 2021).
3National Flood Insurance Act of 1968, Pub. L. No. 90-448, Tit. XIII, §1301, 82 Stat. 476, 572 (1968).
4A Special Flood Hazard Area represents land areas that would be submerged by the floodwaters of the “base flood” (i.e., a flood that has a 1 percent chance of being equaled or exceeded in any given year). 44 C.F.R. § 59.1.
Letter

Page 2 GAO-22-104079 FEMA Flood Maps
making process. Both FIRMs and FEMA’s nonregulatory products are intended to provide flood hazard information to help guide flood mitigation actions of property owners, emergency management and floodplain management officials, community planners and developers, and real estate and insurance specialists
In 2009, FEMA established its Risk Mapping, Assessment, and Planning (Risk MAP) program. The program is responsible for producing both FIRMs and FEMA’s nonregulatory flood risk products, along with maintaining policies, standards, and guidance for developing flood map information. While FEMA has mapped millions of miles of the nation’s streams and coastlines under the Risk MAP program, congressional committees and others have raised questions about the agency’s continued progress in developing new maps or updating existing ones and the extent they provide a comprehensive picture of all flood risk, including current and future flood hazards. Additionally, in February 2020, a FEMA official testified that from 2017 to 2019, over 40 percent of flood insurance claims were for properties located either in areas that FEMA had not mapped or that fell outside of the designated flood hazard boundaries in the associated FIRM.5
The Additional Supplemental Appropriations for Disaster Relief Act, 2019, includes a provision for us to review the federal response to disasters that occurred in 2018.6 This report, which is one in a series of reports in response to this mandate, addresses the following questions:
1. To what extent has FEMA developed FIRMs and nonregulatory products that reflect current and future flood hazards?
2. To what extent has FEMA assessed the Risk MAP program’s efforts to enhance flood resilience, including its nonregulatory products?
3. How has FEMA prioritized its mapping resources in determining where to create and update FIRMs and nonregulatory flood risk products?
To address all our questions, we interviewed FEMA officials at headquarters to understand the steps FEMA has taken to enhance the 5See Michael Grimm, Assistant Administrator for Risk Management, Federal Insurance and Mitigation Administration, Federal Emergency Management Agency, U.S. Department of Homeland Security, testimony before the House of Representatives, Committee on Science, Space, and Technology, Subcommittee on Investigations and Oversight, and Subcommittee on the Environment, 116th Cong., 1st sess., February 27, 2020.
6Pub. L. No. 116-20, Title IX, 133 Stat. 871, 892.

Page 3 GAO-22-104079 FEMA Flood Maps
Risk MAP program and its future direction. We also interviewed floodplain management and flood map engineering officials from a nongeneralizable sample of four states—Michigan, North Carolina, Oregon, and South Dakota—and a total of five local jurisdictions from these states about FEMA’s flood mapping efforts. We selected these states and local jurisdictions to represent a range of differences, such as geographies and types of flooding experienced; roles and responsibilities in the flood mapping process; and losses and claims experienced in past-flooding events, including flood disasters during 2018. We then interviewed officials from the corresponding four FEMA regional offices to obtain their perspectives on their process to develop and update FIRMs within their regions. We performed semistructured interviews with these states, local jurisdictions, and FEMA regions, which included both close-ended and open discussion questions related to our three objectives. In addition, we also reviewed studies from flood modeling organizations; and flood industry trade organizations; industry specialists; academic researchers; and state, local, and private sector officials who served on FEMA’s Technical Mapping Advisory Council (TMAC). We also interviewed these officials and subject matter experts to obtain their perspectives on each of our above objectives. We also leveraged our body of work on the NFIP, flood hazard mapping, and climate change and disaster resilience, as appropriate.
To address our first question, we reviewed relevant laws and regulations, such as the National Flood Insurance Act, as amended, including the Biggert-Waters Act of 2012; and relevant Code of Federal Regulations pertaining to the NFIP flood hazard mapping requirements.7 We also reviewed FEMA documentation about its flood mapping efforts, such as strategic planning documents from FEMA’s Flood Insurance and Mitigation Administration (FIMA); Risk MAP documents, including its multiyear plan, policies, mapping process standards and guidance, and training materials that describe flood mapping procedures and practices; and reports and related documents from TMAC. Additionally, we analyzed FEMA’s data, including Risk MAP’s inventory of existing, ongoing, and planned FIRM mapping projects, from fiscal years 2012 to 2020.
We compared Risk MAP procedures and practices these offices had implemented with FEMA’s own policies, goals, and objectives for enhancing resilience against flood hazards. We also compared Risk MAP practices against the principle from the Disaster Resilience Framework
7Pub. L. No. 112–141, § 100216, 126 Stat. 405, 927; and 44 C.F.R. Parts 59-72.

Page 4 GAO-22-104079 FEMA Flood Maps
related to conducting resilience activities in an integrated and coordinated manner; selected Standards for Internal Control in the Federal Government related to strategic planning; and practices we have identified in our prior work related to organizational transformation.8
To address our second question, we reviewed FEMA documents related to the Risk MAP program. These included FEMA’s strategic and multiyear plans; Risk MAP product descriptions and user guides for nonregulatory products; the results of FEMA’s survey efforts regarding Risk MAP nonregulatory products and community resilience against floods; TMAC tasking memorandums from FEMA and associated TMAC reports; and past GAO reports.9 We also reviewed the actions FEMA has taken to assess Risk MAP efforts to increase community resilience. We also interviewed officials from FEMA headquarters and the above-mentioned regions about any efforts to assess the usefulness of the Risk MAP nonregulatory products in enhancing community resilience to floods. Additionally, we obtained perspectives from our above-described nongeneralizable sample of officials from state and local jurisdictions in the four FEMA regions on how, if at all, the extent to which Risk MAP’s nonregulatory products are useful. We tallied the responses to our closed-ended questions and performed content analysis across each type of government official. We evaluated FEMA’s Risk MAP assessment efforts against community resilience principles identified in GAO’s Disaster Resilience Framework related to defining community resilience efforts, as well as, practices identified by the National Research Council for assessing community resilience efforts.10
8GAO, Disaster Resilience Framework: Principles for Analyzing Federal Efforts to Facilitate and Promote Resilience to Natural Disasters, GAO-20-100SP (Washington, D.C.: Oct. 23, 2019); Standards for Internal Control in the Federal Government, GAO-14-704G (Washington, D.C.: Sept. 2014); and Results-Oriented Cultures: Implementation Steps to Assist Mergers and Organizational Transformations, GAO-03-669 (Washington, D.C.: July 2, 2003).
9Specifically, we reviewed past reports that discuss mechanisms for periodically assessing and tracking the effectiveness and usefulness of projects and actions that can help FEMA identify how specific actions are contributing to disaster resilience. See GAO, Disaster Resilience: FEMA Should Take Additional Steps to Streamline Hazard Mitigation Grants and Assess Program Effects, GAO-21-140 (Washington, D.C.: Feb. 2, 2021); and Hurricanes and Wildfires: Initial Observations on the Federal Response and Key Recovery Challenges, GAO-18-472 (Washington, D.C.: Sept. 4, 2018).
10GAO-20-100SP; and The National Research Council, Disaster Resilience: A National Imperative (Washington, D.C.: The National Academies Press, 2012).

Page 5 GAO-22-104079 FEMA Flood Maps
To address our third question, we reviewed documents FEMA uses to prioritize how it develops and updates FIRMs and nonregulatory products. These documents included Risk MAP annual budget documents and headquarters’ memorandums to FEMA regions. Further, we developed a series of statistical models to compare FEMA’s flood mapping resource allocation decision process with Risk MAP’s goals and objectives, and disaster resilience goals within FIMA strategic plans and the Administration’s executive orders. We analyzed FEMA data, those from its (1) Risk MAP’s inventory of existing, ongoing, and planned FIRM mapping projects; and (2) publicly available, national disaster risk assessment tools, such as the National Risk Index and its Resilience Assessment Planning Tool. We assessed the reliability of FEMA’s data by testing the data for potential reliability concerns, such as outliers or missing values. We also interviewed FEMA officials with knowledge of the datasets and methods used to produce these data, reviewed FEMA data management guidance and procedures, and performed tests to assure data reliability. We determined that the data were sufficiently reliable for the purposes of describing changes in the extent of flood mapping from fiscal years 2012 to 2020 and for our statistical analysis of flood mapping by risks and FEMA program goals and objectives. We also interviewed FEMA headquarters officials and the four FEMA regions described above, as well as the officials from the four selected states and five local jurisdictions to understand their roles, responsibilities, and practices for prioritizing and allocating resources for flood mapping. For a further description of our statistical analyses, see appendix I.
We conducted this performance audit from February 2020 to October 2021, in accordance with generally accepted government auditing standards. Those standards require that we plan and perform the audit to obtain sufficient, appropriate evidence to provide a reasonable basis for our findings and conclusions based on our audit objectives. We believe that the evidence obtained provides a reasonable basis for our findings and conclusions based on our audit objectives.

Page 6 GAO-22-104079 FEMA Flood Maps
The National Flood Insurance Act of 1968 established the NFIP to address the increasing amount of flood damage and the lack of available insurance for property owners.11 FEMA’s Federal Insurance and Mitigation Administration manages the NFIP.12 Specifically, the NFIP enables property owners in participating state, local, territory, or tribal communities to purchase flood insurance. In exchange, the community agrees to adopt and enforce minimum floodplain management regulations and building construction standards to help reduce future flood losses.13
One such requirement for participating communities is to adopt FIRMs—flood hazard maps designed by FEMA that identify areas within a community with the greatest flood hazards (Special Flood Hazard Areas), and other flood hazard zones within a community.14 Within Special Flood Hazard Areas, certain floodplain management regulations and insurance
11Pub. L. No. 90-448, Tit. XIII, §1301, 82 Stat. 476, 572 (1968).
12See GAO, Flood Insurance: Comprehensive Reform Could Improve Solvency and Enhance Resilience, GAO-17-425 (Washington, D.C.: Apr. 27, 2017); and National Flood Insurance Program: Fiscal Exposure Persists Despite Property Acquisitions, GAO-20-509 (Washington, D.C.: June 25, 2020). Within FIMA, the Risk Management Division produces, assesses, and communicates flood hazard and risk data; the Federal Insurance Division provides flood insurance for property owners; and the Floodplain Management Division works with states and communities to adopt and enforce floodplain management regulations intended to mitigate the effects of flooding.
13Participating communities must adopt and enforce minimum floodplain management regulations that: (1) require all new development proposals in the special flood hazard area to obtain a permit, (2) prohibit new development in floodways if it increases flood heights, and (3) require all new construction or substantially improved or damaged structures in the special flood hazard area to be elevated so that the lowest floor is at or above base flood elevation (44 C.F.R. § 60.3). NFIP uses an elevation certificate to provide elevation information necessary to ensure compliance with community floodplain management ordinances and to assist with other aspects of NFIP (44 C.F.R. § 60.2 and 60.3). For additional information on FEMA’s enforcement of key NFIP requirements for communities, see GAO, National Flood Insurance Program: FEMA Can Improve Community Oversight and Data Sharing, GAO-20-396 (Washington, D.C.: May 5, 2020).
14NFIP flood zones can be divided into three main categories: low- to moderate-risk areas, high-risk areas, and high-risk coastal areas. Both high-risk areas and high-risk coastal areas are Special Flood Hazard Areas. Most FIRMs also indicate how high a flood event will reach, referred to as the Base Flood Elevation.
Background The National Flood Insurance Program

Page 7 GAO-22-104079 FEMA Flood Maps
requirements apply.15 As of April 2021, there were over 22,500 participating NFIP communities. In 2020, FEMA estimated that local governments’ compliance with the program’s floodplain management standards had resulted in more than $100 billion in flood damage avoided over the last 40 years.16
In 2009, FEMA established the Risk Mapping, Assessment, and Planning (Risk MAP) program within FIMA’s Risk Management Directorate. The program’s mission is to deliver flood hazard data that increase public awareness and lead to action that reduces risk to life and property. In addition, FEMA established Risk MAP to improve FEMA’s mapping processes to further emphasize community engagement and partnerships to ensure a whole community approach to flood mapping.
As part of the Risk MAP program, FEMA develops and updates FIRMs, as well as various nonregulatory products. FEMA’s Risk MAP program has officials in both FEMA headquarters and each of FEMA’s 10 regional offices. FEMA’s 10 regional offices are responsible for managing flood map production for their geographic areas. FEMA headquarters and regional staff are to monitor and report on the progress of flood hazard mapping using program management data. FEMA’s Risk MAP program received approximately $414 million in annual funding in fiscal years 2019 and 2020.17 According to our analysis of FEMA data, from fiscal years 2014 through 2020, the program spent about $2.3 billion on flood hazard mapping.
15For example, the Flood Disaster Protection Act of 1973, which amended the National Flood Insurance Act, created the mandatory purchase requirement, whereby homeowners of certain properties located in Special Flood Hazard Areas must purchase and maintain flood insurance. Pub. L. No. 93-234, §102, 87 Stat. 975, 978. FEMA has used the flood zones in FIRMs to calculate a property’s NFIP insurance premium rate. However, as explained later in this report, FEMA is implementing a new methodology for setting NFIP rates that will no longer use FIRMs. See GAO, National Flood Insurance Program: Congress Should Consider Updating the Mandatory Purchase Requirement, GAO-21-578 (Washington, D.C.: July 30, 2021). 42 U.S.C. §4101.
16Michael Grimm, testimony, February 27, 2020.
17Risk MAP is supported through two funding sources. The first source is through discretionary funds appropriated within the Federal Assistance Appropriation; the second source is through a flat discretionary fee levied on NFIP insurance policies. See Department of Homeland Security, Federal Emergency Management Agency, Budget Overview, Fiscal Year 2021.
Risk Mapping, Assessment, and Planning

Page 8 GAO-22-104079 FEMA Flood Maps
Developing and adopting a FIRM is a regulatory process that can be resource intensive, involving collection and analysis of environmental data, as well as a lengthy public review and acceptance period.18 According to FEMA, this process can take 7 years on average to complete.19 Flood hazard mapping requires the collection and statistical analyses of
• elevation of the terrain—topographic data, • hydrologic conditions that affect the amount of water that flows
downstream during a flood, and • hydraulic conditions that affect the height of floodwaters in streams or
waterways.
The results of the analyses of the topographic and flood hazard engineering data above are then combined and integrated into digital maps that describe how far the floodplain boundary extends and how high floodwaters will reach. FEMA maintains over 500 standards, guidance, and technical reference documents to help ensure mapping quality, as developing or updating a FIRM requires some professional judgment.
Further, stakeholders from all levels of government and the private sector may participate in all stages of the mapping process.20 For instance, at the beginning of the mapping process, FEMA relies on local jurisdictions to inform FEMA about changes in a community that could pose new or changed flood hazards—and then to work with its state, territory, or tribal government and others to collect the information needed to create or update FIRMs. Later, FEMA and governmental leaders are to meet to 18The FIRM is a map set that graphically depicts identified flood hazards areas in a community. In addition, FEMA provides a community with a Flood Insurance Study, which is a report that documents the underlying detailed information and data analysis used to produce the FIRM. Both the FIRM and its corresponding Flood Insurance Study are developed through FEMA’s regulatory rule-making process. For the purpose of this report, we will refer to both FEMA products as “a FIRM” or “FIRMs.” 42 U.S.C. § 4101 and 44 C.F.R. Parts 65 and 67.
19Michael Grimm, testimony, February 27, 2020.
20Stakeholders in the mapping process include FEMA’s national Production and Technical Services contractors, as well as agencies from state, local, tribal, and territorial governments. For more on the roles and responsibilities of FEMA, the mapping partners, and other actors in the flood map production process, see GAO, FEMA Flood Maps: Some Standards and Processes in Place to Promote Map Accuracy and Outreach, but Opportunities Exist to Address Implementation Challenges, GAO-11-17 (Washington, D.C.: Dec. 2, 2010).
FIRM Development

Page 9 GAO-22-104079 FEMA Flood Maps
review these data and preliminary maps to understand the area’s flood risk, and potential impact and to guide local mitigation and outreach efforts. The regulatory process for developing a FIRM also provides a 90-day period for local government officials or individuals to review and the opportunity to appeal the scientific or technical accuracy of preliminary maps.21 Finally, after all appeals are resolved, FEMA sends a Letter of Final Determination to the community to say the maps are now “final,” and the local jurisdictions must update its floodplain land use and construction ordinances within 6 months.22
Throughout various stages of the mapping process, FEMA regions, in consultation with its stakeholders, determine the FIRM’s level of accuracy and precision. In making this decision, required costs and resources, budget priorities, and communities’ flood hazard identification needs are considered.23 The level of detail and the associated costs of a FIRM are based on an agreement between FEMA, its mapping contractors, and state, territory, tribal, and local governments. Finally, even when floodplains are mapped with high accuracy, land development and natural changes to the landscape or hydrologic systems create the need for continuous map maintenance and updates.24
As described earlier, the Risk MAP program also develops products and services beyond the FIRMs (nonregulatory products) and is responsible for working with states, territories, tribes, and local officials to support their use of these and other tools. These nonregulatory products are to further communicate flood risks by leveraging new science and technologies to deliver more comprehensive flood risk data, such as estimates and models, to help increase community resilience against floods. For example, FEMA developed Risk MAP nonregulatory products 2144 C.F.R. § 65.9.
2244 C.F.R. § 67.10(b).
23GAO-11-17. A detailed FIRM will incorporate greater amounts of more precise data. In contrast, “approximate” FIRMs generally require less precision in flood hazard data. Approximate FIRMs are used for areas that are less subject to development and do not require the establishment of a regulatory base flood elevation, although base flood elevations may be identified.
24Effective FIRMs can be amended by local jurisdictions or individuals who can file a “Letter” to modify or update an individual property or parcels of land within the flood maps. In addition, map maintenance may also include a reanalysis and revision of map, using either information provided by local jurisdictions or FEMA’s identification of an update need.
Nonregulatory Products

Page 10 GAO-22-104079 FEMA Flood Maps
to provide communities with information on the likelihood of an area flooding over a 30-year period or to display a range of possible flood depths across a floodplain.25
In 2012, Congress passed the Biggert-Waters Flood Insurance Reform Act (Biggert-Waters Act), which directed that FEMA include more accurate and comprehensive flood hazard data in FIRMs.26 For example, the Biggert-Waters Act requires FEMA to identify, review, update, maintain, and publish FIRMs with respect to (1) all populated areas and areas of possible population growth located within the Special Flood Hazard Area (100-year floodplain) as well as the 500-year floodplain; (2) additional types of flood hazards, including residual risk, such as flood hazards in areas that are protected by levees, dams, and other flood control structures; and (3) use of the most accurate topography and elevation data available.27 The act also directed FEMA, when updating FIRMs, to include any relevant information or data from the National Oceanic and Atmospheric Administration, and the U.S. Geological Survey, relating to the best available science regarding future changes in sea levels, precipitation, and hurricane intensity.
Further, the act established an advisory council of subject-matter experts—known as the Technical Mapping Advisory Council—to provide recommendations to improve FEMA’s mapping processes.28 For example, the act directed TMAC to develop recommendations on how to ensure that (a) FIRMs include the best available climate science to assess flood risks and (b) FEMA uses the best available methodology to consider the impact of rising sea levels and future development on flood risk. The act states that FEMA shall incorporate any future risk assessment developed by TMAC in any revision or update of FIRMs.
25FEMA produces nonregulatory products during regulatory flood map updates, in accordance with current standards and the project scope.
26Pub. L. No. 112–141, § 100216, 126 Stat. 405, 927.
27The term “100-year floodplain” is term used interchangeably with the “Special Flood Hazard Area” – the area that is subject to inundation from a flood having a 1-percent chance of being equaled or exceeded in any given year. The term “500-year floodplain” means that area which is subject to inundation from a flood having a 0.2-percent chance of being equaled or exceeded in any given year. 42 U.S.C.§4101b(b)(1)(A)(i) and (ii).
28According to TMAC, since its establishment in 2014, the council has delivered seven reports that include 37 recommendations and 13 implementation actions.
Biggert-Waters Act

Page 11 GAO-22-104079 FEMA Flood Maps
We have an extensive body of work reviewing all aspects of the NFIP. The NFIP program has been on GAO’s High Risk List since 2006, and 14 recommendations involving the NFIP have not been addressed, as of August 2021. In addition, we have previously recommended that Congress should consider comprehensive reform of the NFIP to improve the program’s solvency and the nations flood resilience.29 As of September 2021, Congress had not passed comprehensive reform.
Further, we have done extensive work on climate change, which has been on our High Risk List since 2013. We have found that to reduce its fiscal exposure to climate change, the federal government needs a cohesive, strategic approach with strong leadership and the authority to manage risks across the entire range of related federal activities. In March 2021, we noted that actions such as the passage and implementation of Biggert-Waters in 2012 and FEMA’s establishment of performance targets doubling the number of properties covered by flood insurance and quadrupling the amount of predisaster mitigation by 2022 have partially addressed federal fiscal exposure from climate change. See the list of Related GAO Products at the end of this report.
Since the Biggert-Waters Act was passed in 2012, FEMA’s Risk MAP program has developed more FIRMs and nonregulatory products and made some improvements to FIRMs but faces challenges in ensuring that FIRMs reflect more types of current and future flood hazards. The Risk MAP program has efforts underway to help address some of these challenges and transition to what it calls a future vision of the flood hazard mapping program. However, it has been over a decade since FEMA last updated its multiyear plan for the Risk MAP program to identify program goals, activities, performance measures, and timeframes for each of these efforts to help ensure that FEMA carries them out in an effective, coordinated, and timely manner.30
29GAO-17-425.
30In 2009, FEMA issued a multiyear plan that outlined the goals, objectives, and strategies of Risk MAP for the next 5 years. See Federal Emergency Management Agency, Risk MAP Multi-Year Plan: Fiscal Years 2010-2014, Fiscal Year 2009 Report to Congress (Washington, D.C.: Mar. 16, 2009).
GAO’s Prior Work
FEMA Developed More FIRMs and Nonregulatory Products, but Has Not Updated its Multiyear Plan to Fully Reflect Flood Hazards

Page 12 GAO-22-104079 FEMA Flood Maps
Since 2012, FEMA’s Risk MAP program has (1) developed more FIRMs, (2) made some improvements to FIRMs, and (3) developed other nonregulatory flood risk products. Specifically, our analysis of FEMA’s data found that FEMA increased the total number of miles mapped in FIRMs by approximately 9 percent—from about 1.1 million miles in fiscal year 2012 to 1.2 million miles in fiscal year 2020. According to FEMA, the current inventory of FIRMs covers about 98 percent of the nation’s population.
The Risk MAP program has made some improvements to FIRMs and other nonregulatory products by leveraging advancements in technology. For example, FEMA has been able to improve the resolution of FIRMs through advances in LIDAR, which is a technology that provides high-resolution topography.31 In 2016, FEMA began requiring that new maps and map updates use LIDAR topographic data. According to FEMA officials, the agency has coordinated with the U.S. Geological Survey and other entities to obtain more LIDAR data. Our analysis of FEMA data found that, as of the end of fiscal year 2020, almost half—49 percent—of mapped miles use LIDAR elevation data, including almost 14 percent of mapped miles that use a higher-quality LIDAR elevation data, according to U.S. Geological Survey standards.32
In addition, FEMA has made progress in ensuring that more of its mapped miles meet FEMA’s quality standard, known as the New, Validated, or Updated Engineering (NVUE) metric.33 FEMA uses its NVUE metric to help meet the statutory requirement to assess, at least once every 5 years, whether all FIRMs and their underlying data are valid
31According to the National Oceanic and Atmospheric Administration, LIDAR, which stands for light detection and ranging, is a remote sensing method that uses light in the form of a pulsed laser to measure ranges (variable distances) to the Earth. These light pulses—combined with other data recorded by the airborne system—generate precise, three-dimensional information about the shape of the Earth and its surface characteristics.
32The high-quality elevation data meet the U.S. Geological Survey’s LIDAR Base Specification Quality Level 2 equivalence or higher.
33FEMA’s NVUE metric identifies the miles of FIRM studies that adequately identify the level of flood risk backed by technical credibility and do not warrant updating. The NVUE metric includes new or updated FIRM miles that have attained the NVUE standard (“NVUE attained”) and those that have been funded for new or updated engineering but have not yet been issued as part of a preliminary FIRM (“NVUE initiated”).
FEMA Has Developed More FIRMs and Nonregulatory Products and Made Some Improvements since 2012
Page 13 GAO-22-104079 FEMA Flood Maps
and current.34 According to our analysis of FEMA data, approximately 50 percent of mapped miles met the NVUE metric in fiscal year 2012, and the agency reached its target of 80 percent of mapped miles meeting its NVUE metric, as of the end of fiscal year 2020.35
In addition, since 2012, the Risk MAP program has also produced nonregulatory products—such as Flood Depth Grids that display the variability of flood depths in flood-prone areas—to assist communities in mitigating flood risk. According to FEMA, these nonregulatory products are to be used alongside the regulatory FIRMs to provide additional flood risk information and to support a community’s hazard mitigation strategies and official actions related to zoning and construction. These nonregulatory products, however, are not available in all cases or to all communities, which we discuss later in this report.
FIRMs are designed to show Special Flood Hazard Areas, that is, the areas that would be inundated by the 1 percent annual chance flood.36 The result is that FIRMs provide a binary, in-or-out portrayal of an area’s risk of flooding—that is, the impression that either a structure is located within a Special Flood Hazard Area and at risk of flooding, or it is outside of the boundary and not at risk. According to FEMA, the in-or-out nature of the FIRM makes it more difficult for FEMA to drive flood mitigation actions in flood-prone areas outside of the Special Flood Hazard Area.
3442 U.S.C. § 4101(e). According to this requirement, FEMA is to assess the need to revise and update all floodplain areas and flood risk zones identified, delineated, or established, using an analysis of all-natural hazards affecting flood risks at least once every 5 years. Revisions to floodplain risk zones are dependent upon the identification of instances where information on FIRMs does not reflect current risks in flood-prone areas.
35GAO-11-17. In December 2010, we reported that FEMA’s current rate of national NVUE compliance was 52 percent.
36As previously noted, Special Flood Hazard Areas represents land areas that would be submerged by the floodwaters of the “base flood” or “1 percent chance flood” (i.e., a flood that has a 1 percent chance of being equaled or exceeded in any given year). 44 C.F.R. § 59.1. Within these designated areas, certain floodplain management regulations and insurance requirements apply.
FEMA Faces Challenges in Reflecting Flood Hazards and Has Some Efforts to Address Them
FIRMs Focus on a Binary Depiction of Flood Hazards

Page 14 GAO-22-104079 FEMA Flood Maps
FEMA officials have recognized that the Special Flood Hazard Area depicts just one flood hazard (the 1 percent annual chance flood) and is not a comprehensive indicator of flood risk. As discussed, a senior FEMA official testified before Congress in February 2020 that over 40 percent of NFIP insurance claims from 2017 to 2020 were for properties that were either located outside of a Special Flood Hazard Area or were in areas that FEMA has not mapped.37
In 2019, FEMA initiated an effort to develop a more comprehensive picture of the country’s flood hazards and risk—known as the Future of Flood Risk Data—to provide communities with additional information for understanding their flooding risks beyond what is available in FIRMs. A key component of this effort is exploring how FEMA can transition from a binary, in-or-out approach to flood hazard mapping to a graduated approach that distinguishes incremental levels of risk for properties.38 According to FEMA, this more detailed and nuanced information will provide a broader range of flood scenarios than the current method used to determine the Special Flood Hazard Areas in FIRMs. The initiative seeks to leverage new technologies to include more efficient, accurate, and consistent flood risk information across the nation. According to officials, FEMA aims to use the initiative to understand the ways its mapping program should evolve to improve national understanding of flood risk.39
Similarly, in April 2021, FEMA finalized a new insurance rating methodology to better reflect variations in flood risk, called “Risk Rating
37According to our analysis of FEMA data, an average of 31 percent of NFIP insurance claims from 2000 to 2020 was for properties mapped outside of the Special Flood Hazard Area.
38The other three components of Risk MAP’s Future of Flood Risk Data initiative are to (a) ensure a significant and appropriate role for the private sector and state, local, tribal and territorial entities; (b) increase access to flood hazard data to improve resulting mitigation and insurance actions; and (c) modernize the management and delivery of flood hazard mapping.
39According to FEMA, the Future of Flood Risk Data will enable FEMA to provide a more comprehensive and dynamic picture of the country’s flood hazards that can serve as a basis for a range of outcome-oriented regulatory and nonregulatory products.

Page 15 GAO-22-104079 FEMA Flood Maps
2.0—Equity in Action,” to establish new risk-informed rates.40 The new methodology uses a larger range of variables than the current methodology, both in terms of modeling the flood risk and in assessing the risk to each property.41 FEMA officials stated that Risk Rating 2.0 demonstrates that FEMA can do more to represent flood risks in some locations, particularly in areas outside of the Special Flood Hazard Area. New NFIP policies became subject to the new rating methodology beginning on October 1, 2021, and all remaining NFIP policies renewing on or after April 1, 2022, will be subject to the new rating methodology. In our July 2021 report on the National Flood Insurance Program, we recommended that FEMA evaluate how the information available through its new insurance rating methodology could be used for decisions on which properties are required to purchase insurance.42
FEMA’s new flood insurance rating methodology, Risk Rating 2.0, takes into account more variables—including flood frequency and multiple flood types, such as heavy rainfall (i.e., pluvial flooding) that can overwhelm existing storm water drainage systems, and tsunami.43 However, FEMA has not incorporated these additional flood risk variables into FIRMs. Officials from two of the four states and four of the five local jurisdictions we interviewed stated that heavy rainfall and the increased frequency and durations of storms from climate change were factors that contributed to flooding outside of the Special Flood Hazard Areas designated on their
40In 2008, we recommended that FEMA take steps to ensure that its rate-setting methods and the data it uses to set rates result in full-risk premiums that accurately reflect the risk of losses from flooding, including the effects of long-term and ongoing development, as well as climate change. In 2013, we recommended that FEMA develop and implement a plan, including a time line, to obtain needed structural elevation information as soon as practicable. Through its efforts to develop and implement Risk Rating 2.0, FEMA has implemented both of these recommendations. See GAO-09-12; and Flood Insurance: More Information Needed on Subsidized Properties, GAO-13-607 (Washington, D.C.: July 3, 2013). In addition, in its 2015 annual report, TMAC recommended that FEMA transition from identifying the 1-percent-annual-chance floodplain and associated base flood elevation as the basis for insurance rating purposes to a structure-specific flood frequency determination and associated flood elevations. See Technical Mapping Advisory Council, TMAC 2015 Annual Report (Washington, D.C.: December 2015).
41In the new methodology, the flood zones delineated in FIRMs will no longer be used to calculate a property’s flood insurance rate.
42GAO-21-578.
43Pluvial flooding occurs when an extreme rainfall event creates a flood independent of an overflowing water body. Increased urbanization can lead to a decrease in permeable surfaces, such as grass, which creates higher flood risk from heavy rainfall.
FIRMs Do Not Identify All Current Flood Hazards

Page 16 GAO-22-104079 FEMA Flood Maps
FIRMs. FEMA officials stated that, through the Future of Flood Risk Data initiative, the agency is exploring ways to more consistently demonstrate the hazards and associated risks included in FEMA’s Risk Rating 2.0 calculations. They stated that this exploration will play out in the coming years and inform any of FEMA’s potential changes or enhancements to the FIRM.
In addition, FIRMs currently do not identify some flood hazards required by the Biggert-Waters Act. For example, they do not identify all existing hazards related to “residual risk”—including possible flood hazards in areas that are presumed to be protected by levees, dams, and other flood control structures.44 According to FEMA, the primary challenges to implementing this requirement have been both the lack of consistently available data on these structures and a consistent methodology for assessing the risk of their failure. According to FEMA officials, FEMA has made progress in implementing this requirement by collaborating with the U.S. Army Corps of Engineers to improve data in its National Levee Database and National Dam Safety Program and to evaluate and develop methods to better estimate flood risk in areas behind levees and downstream of dams.45
As we reported in October 2008, because one of the primary purposes of FIRMs has been to inform flood insurance rates, FEMA designed FIRMs to reflect existing conditions, and does not map flood hazards from ongoing and planned development, erosion trends, and climate change.46 However, since 2012, the following actions have been taken towards
44In 2012, the Biggert-Waters Act required FEMA to identify, review, update, maintain, and publish FIRMs with respect to areas of residual risk, including areas that are protected by levees, dams, and other flood control structures; areas that could be inundated as a result of the failure of a levee, dam, or other flood control structure; and the level of protection provided by flood control structures. Sec. 100216(b)(1)(A)(iii) of the Act.
45TMAC has made recommendations regarding how FEMA can more effectively deliver and communicate residual flood risk related to dams, levees, and other flood control structures. For example, TMAC recommended that, for nonaccredited levees, FEMA should replace the Zone D designation in levee-protected areas with risk zones that are more appropriate for the level of risk, and FEMA should develop a series of mapping prototype products to more effectively communicate residual flood risk. See Technical Mapping Advisory Council, TMAC 2016 Program Review Report (Washington, D.C.: June 2016); and TMAC 2017 Annual Report (Washington, D.C.: December 2017).
46GAO-09-12. Because NFIP premium rates are assessed yearly, the rate is designed to assess and insure against current—not future—risks. This is consistent with standard actuarial practice for pricing 1-year term insurance.
Most FIRMs Do Not Reflect How Flood Hazards Will Likely Change

Page 17 GAO-22-104079 FEMA Flood Maps
ensuring that the best available climate science and future development are incorporated into FEMA’s flood risk analyses. Specifically,
• The Biggert-Waters Act. As previously discussed, in 2012, the Biggert-Waters Act required TMAC to develop recommendations to FEMA about how to ensure that FIRMs include the best available climate science to assess flood risks, and that FEMA uses the best available methodology to consider the impacts of the rise in sea level and future development on flood risk.47 The act also required FEMA to include any relevant information or data from the National Oceanic and Atmospheric Administration and the U.S. Geological Survey relating to the best available science regarding future changes in sea levels, precipitation, and hurricane intensity when updating FIRMs.48
• TMAC recommendations. In 2015, TMAC recommended that FEMA develop flood risk products, tools, and information to convey future conditions data and modeling on an advisory, or nonregulatory, basis.49 TMAC recommended that the future conditions information be provided to communities on a nonregulatory basis, in part, because of some limitations with the data at the time.50 However, TMAC noted that communities should be allowed—and encouraged—to adopt the future conditions flood hazard products, tools, and information for local regulatory purposes and decision-making on the local level. In the 2015 report, TMAC recommended that FEMA implement the
47The act states that FEMA shall incorporate any future risk assessment developed by TMAC in any revision or update of FIRMs. §100215 (d)(2)) of the Biggert-Waters Act.
48§ 100216(b)(3) of the Biggert-Waters Act.
49Technical Mapping Advisory Council, Future Conditions Risk Assessment and Modeling Report (Washington, D.C.: December 2015). As previously stated, FIRMs are designed to identify areas within a community with the greatest flood hazards—or Special Flood Hazard Areas—and base flood elevations through a regulatory rule-making process. Under the NFIP, within these designated areas, certain federal floodplain management regulations and insurance requirements apply. In addition to these maps, FEMA provides other supplementary flood risk information—known as nonregulatory products—that are not subject to the regulatory rule-making process.
50For example, TMAC determined that “no actionable science existed at the current time to address climate change impacts to watershed hydrology and hydraulics. If undertaken, interim efforts to incorporate climate change impacts in flood risk products and information should be based on existing methods, informed by historical trends, and incorporate uncertainty based upon sensitivity analyses.” However, TMAC also recommended that FEMA should begin using certain existing climate change data and models, such as global sea level rise scenarios (adjusted to reflect local conditions), to determine future coastal flood hazard estimates and to consult communities to determine which scenarios and time horizons to map based on risk tolerance and criticality.

Page 18 GAO-22-104079 FEMA Flood Maps
majority of its recommendations for developing flood risk products to convey future conditions data in the “short-term,” or within 2 years.
• Administration priorities. On January 27, 2021, the President issued an executive order that established a National Climate Task Force composed of heads of several agencies, including the Secretary of Homeland Security. It directed task force members to prioritize action on climate change in their policy-making and budget processes.51 The order also called for National Oceanic and Atmospheric Administration, FEMA, and the White House Office of Science and Technology Policy, in coordination with the heads of other agencies, as appropriate, to provide to the Task Force a report on ways to expand and improve climate forecast capabilities and information products for the public.52 On May 20, 2021, the President reinstated the Federal Flood Risk Management Standard, which required that the planning and design of federally-funded projects located in flood-prone areas account for future risk from climate change.53
According to our analysis of FEMA data, as of September 2020, less than 1 percent of mapped miles on FIRMs included information on likely future conditions. Moreover, FEMA has made limited progress in addressing TMAC’s 2015 recommendations to develop flood risk information that reflects future conditions. In its 2017 report to Congress on the status of TMAC recommendations, FEMA reported that the agency has been conducting pilot studies on sea level rise and was working to identify the specific remaining research gaps to inform the design of additional pilot
51Specifically, the order stated, to the extent permitted by law, that task force members should prioritize action on climate change in their policy-making and budget processes; in their contracting and procurement; and in their engagement with state, local, tribal, and territorial governments; workers and communities; and leaders across all the sectors of our economy. Executive Order 14008, Tackling the Climate Crisis at Home and Abroad. 86 Fed. Reg. 7619 (Feb. 1, 2021).
52Additionally, the executive order called for the Secretary of the Interior and the Deputy Director for Management of the Office of Management and Budget, in their capacities as the Chair and Vice-Chair of the Federal Geographic Data Committee, to assess and provide to the task force a report on the potential development of a consolidated federal geographic mapping service that can facilitate public access to climate-related information that will assist federal, state, local, and tribal governments in climate planning and resilience activities. Sec 211(d) of the Executive Order.
53Executive Order 14030, Climate-Related Financial Risk, reinstated Executive Order 13690 establishing a Federal Flood Risk Management Standard. 86 Fed. Reg. 27967 (May 25, 2021).

Page 19 GAO-22-104079 FEMA Flood Maps
projects on future conditions.54 FEMA officials and subject-matter experts told us that future conditions and climate change data are estimates subject to more uncertainty than other hazard data. They stated that including such data in a regulatory FIRM—on which minimum federal floodplain management and insurance purchase requirements are currently based—may lead to appeals and delays to the final approval of FIRMs.
Nevertheless, in August 2020, a FEMA contractor completed a study for how FEMA could incorporate future conditions into its flood hazard mapping activities over the next 10 years.55 However, FEMA headquarters officials told us that they are still determining how to apply the study’s results, in consideration of and in concert with its Risk Rating 2.0 and the Future of Flood Risk Data initiatives. In February 2021, FEMA asked TMAC to review its 2015 recommendations related to future conditions to identify those that are still applicable and any new recommendations and to include them in its 2021 annual report.
Further, in January 2021, the Natural Resources Defense Council and the Association of State Floodplain Managers jointly petitioned FEMA to amend its regulations implementing the NFIP to account for future conditions and climate change in FIRMs and minimum federal floodplain
54Federal Emergency Management Agency, Report to Congress on the Technical Mapping Advisory Council’s Recommendations from 2015 (Washington, D.C.: June 8, 2017).
55The study identifies five types of future conditions—Land Use; Precipitation; Sea-level Rise; Coastal Erosion; and Riverine Erosion—and the methodologies, technical guidance, and policy and data development activities that would be needed to incorporate them into flood hazard maps. See: STARR II, The Best Available Science: An Implementation Plan for Future-Condition Flood Hazard Mapping (Washington, D.C.: Aug. 31, 2020).

Page 20 GAO-22-104079 FEMA Flood Maps
management standards.56 On October 12, 2021, FEMA published a notice in the Federal Register seeking public input on possible changes to its floodplain management standards for land use and construction code regulations to “better align with the current understanding of flood risk and flood risk reduction approaches.”57 However, the agency has yet to address whether it will begin a rulemaking process for including future conditions and climate change in FIRMs.
Because FEMA generally does not incorporate flood hazards related to likely future conditions into FIRMs, this information is not used to inform which NFIP communities and properties are subject to minimum federal floodplain management requirements. Therefore, the requirement may not be helping to build flood resilience for communities and properties that may experience challenges posed by climate change—such as increasing storm intensities, frequent heavy precipitation, extreme flooding, and higher sea levels. In 2014, FEMA concurred with our recommendation that it consider amending NFIP minimum standards for floodplain management to incorporate, as appropriate, forward-looking standards, similar to the minimum standard adopted by the Hurricane Sandy Rebuilding Task Force.58 As of April 2021, FEMA had not fully implemented the recommendation. Without incorporating forward-looking minimum standards into NFIP’s requirements, NFIP policyholders and local jurisdictions may continue to build and rebuild structures to current community standards that may not reflect the changing weather-related
56For example, the petition proposed that FEMA (1) amend FEMA’s definition of “future conditions hydrology” to include flood discharges associated with climate change impacts, such as sea level rise and changing precipitation patterns, and projected land-use conditions. 44 C.F.R. § 59.1; (2) incorporate multiple future conditions flood elevations as one or more advisory layers on FIRMs; and (3) amend its regulations to incorporate the Biggert-Waters Act’s requirements for mapping flood control structures. 44 C.F.R. Part 64 and 65. The petition also echoed TMAC’s 2015 report recommendations by stating that the National Oceanic and Atmospheric Administration has produced extensive data on sea level rise projections and that, for coastal areas, FEMA should use the National Oceanic and Atmospheric Administration’s most recent global mean sea level rise scenarios and regional variations to determine future coastal flood hazard estimates out to the year 2100. Natural Resources Defense Council and Association of State Floodplain Managers, Inc., Petition Requesting That The Federal Emergency Management Agency Amend Its Regulations Implementing the National Flood Insurance Program (Jan. 5, 2021).
5786 Fed. Reg. 56713 (Oct. 12, 2021).
58GAO, Climate Change: Better Management of Exposure to Potential Future Losses Is Needed for Federal Flood and Crop Insurance, GAO-15-28 (Washington, D.C.: Oct. 29, 2014).

Page 21 GAO-22-104079 FEMA Flood Maps
risks faced over structures’ designed life spans—thereby exacerbating the federal financial risk to climate change. We continue to believe in the importance of FEMA implementing the recommendation.
The Biggert-Waters Act required FEMA to provide FIRMs for all populated areas and areas of possible population growth located within the “100-year and 500-year floodplains.”59 Additionally, FEMA’s Assistant Administrator for Risk Management and subject matter experts we interviewed stated that it is important to develop FIRMs for areas of potential population growth to identify flood hazards and floodplain management requirements before an area is developed.
According to FEMA, as of December 2020, its FIRMs covered 98 percent of the nation’s population and a total of approximately 1.2 million miles of flooding sources (i.e., rivers, streams, and coastline). However, according to FEMA, there are an additional 1.3 million miles of rivers and streams that require flood hazard mapping—specifically, 329,000 miles with population, and about 1 million miles with possible population growth. FEMA officials stated they are working to expand the mapping inventory and analyze areas of population growth. In July 2020, House Report 116-458, accompanying the Department of Homeland Security Appropriations bill, the House Appropriations Committee asked FEMA to brief the committee on whether additional stream miles should be incorporated into the program.60 In October 2021, FEMA officials told us that a draft of their report to Congress was going through the agency’s internal review process.
FIRMs represent a snapshot of flood hazards at a particular moment in time. Thus, they can become outdated for a variety of reasons, such as erosion or community growth and development that can affect the drainage patterns over time. As stated earlier, FEMA is statutorily
59The Biggert-Waters Act states that FEMA shall identify, review, update, maintain, and publish FIRMs for all populated areas and areas with potential population growth located within the 100-year and 500-year floodplains. 42 U.S.C.§ 4101b(b)(1)(A)(i) and (ii).
60House of Representatives, Committee on Appropriations, H.Rep. No. 116-458, Report to Accompany H.R. 7669, Department of Homeland Security Appropriations Bill, 2021 (2020).
Some Areas Are Not Mapped
Some FIRMs May Not Be Current
Page 22 GAO-22-104079 FEMA Flood Maps
required to assess the need to update flood maps every 5 years.61 According to our analysis of FEMA data, as of September 2020,
• maps for about 3,300 of 22,500 communities are over 15 years old; • only about one-third—34 percent—of all mapped stream and coastal
miles were new or updated and attained the NVUE standard;62
• approximately 60 percent of all mapped miles required updating or were currently being studied; and
• FEMA was planning, assessing, or deferring study of the remaining approximately 6 percent.
Moreover, FEMA’s Assistant Administrator for Risk Management testified in February 2020 that it takes 7 years, on average, to develop a new map.63 Officials from two of the four states and three of the five local jurisdictions we interviewed stated that the process to produce and update FIRMs is lengthy, in part because of regulatory due process requirements, which can cause FIRMs to be outdated by the time they are released. Officials from two of the five local jurisdictions told us that their FIRMs do not reflect the latest data or current conditions, such as development or flood mitigation projects, which affects the accuracy and credibility of their FIRMs.
The Risk MAP program has taken steps to address the above challenges but has not updated its multiyear plan in over a decade to reflect its ongoing efforts. Specifically, it has not updated its 2009 plan with updated goals, activities, performance measures, and time frames. Developing 61To help meet statutory requirements to assess the need to update FIRMs every 5 years (42 USC 4101(e)), FEMA conducts validation assessments of the flood hazard studies underlying FIRMs every 5 years. During this process, FEMA is to determine the validity of flood hazard studies by identifying study attributes and change indicators related to the physical environment, climate patterns, and engineering methods since the date of the effective analysis.
62As noted earlier, FEMA’s NVUE metric consists of new or updated engineering study miles that have attained the NVUE standard (“NVUE attained”), as well as those that have been funded for new or updated engineering but have not yet been issued as part of a preliminary FIRM (“NVUE initiated”). According to our analysis of FEMA data, as of September 2020, 80 percent of mapped stream and coastal miles had met the NVUE metric, but only 34 percent of mapped stream and coastal miles had attained the NVUE standard (“NVUE attained”).
63Michael Grimm, testimony, February 27, 2020. This time line includes the initial discovery process, data development, the preliminary map issuance, due process, and final map production and distribution. The complete timeframe involves a number of Federal Register and other administrative requirements.
Risk MAP Multiyear Plan Does Not Reflect Current Efforts

Page 23 GAO-22-104079 FEMA Flood Maps
such elements for each of its current efforts would help FEMA manage and coordinate the efforts and ensure they are done in a timely way.
As described above, FEMA’s efforts to address these challenges include
1. exploring how to transition from a binary, in-or-out approach to flood hazard mapping to a graduated approach that distinguishes incremental levels of risk;
2. identifying current hazards (such as pluvial/rainfall flooding and residual risk);
3. addressing TMAC’s recommendations related to mapping future conditions;
4. developing and maintaining FIRMs for all populated areas and areas of possible population growth; and
5. updating outdated maps to ensure they reflect current conditions.
While these are important steps, they involve multiple activities to address complex challenges and may require years to complete, according to FEMA officials. FEMA has a Fiscal Year 2010-2014 Multi-Year Plan that includes goals and objectives for the Risk MAP program; however, it has not updated the plan since 2009 to reflect new goals or identify timeframes for these various efforts and to transition to a future flood hazard mapping and flood risk information program.64
In March 2021, FEMA headquarters officials told us that the Risk MAP program continued to operate on its Fiscal Year 2010-2014 Multi-Year Plan because its goals and objectives had not changed. In 2020, they told us that, since the plan was developed, the Risk MAP program has focused on its metric of having 80 percent of mapped miles meet the NVUE standard, as it is their way to help meet the statutory requirement to assess the need to update map data every 5 years.
However, in 2019 FEMA began the Future of Flood Risk Data initiative to explore transitioning to a future vision of the national flood hazard mapping program. Further, since fall 2020, FEMA has developed three documents that provide a new strategic direction for FIMA and the Risk Management Directorate, which oversee Risk MAP. The first two
64Federal Emergency Management Agency, Risk Mapping, Assessment, and Planning (Risk MAP) Multi-Year Plan: Fiscal Years 2010-2014.
Page 24 GAO-22-104079 FEMA Flood Maps
documents—FIMA’s Fiscal Year 2021-2023 Leadership Intent, and the Risk Management Directorate’s Fiscal Year 2021-2023 Strategy—identify new goals and objectives to “achieve a modern, risk-based NFIP” and “be the trusted, authoritative source of flood risk data.”65 They also identify two, new crosscutting principles—equity and future conditions—that are to be reflected in all of FIMA’s programs and activities, including Risk MAP.66 In June 2021, the Risk Management Directorate issued a third document—an internal 10-year operational plan—that identifies how the Risk Management Directorate, including Risk MAP, will support the new goals and objectives. One of the objectives of the 10-year operational plan is to establish updated goals for the Risk MAP program by the end of calendar year 2022.67
In June 2021, FEMA headquarters officials told us that they intend to develop an updated multiyear plan for the Risk MAP program that supports the new goals and objectives from the Leadership Intent and Strategy, but they could not provide documentation on this effort. Risk MAP officials stated that, since achieving its program objective that 80 percent of mapped miles meet the NVUE metric, they can now focus program resources on (1) the Future of Flood Risk Data initiative, (2) further addressing Biggert-Waters’ requirements regarding mapping future conditions and residual risk, and (3) reporting to Congress on mapping additional stream miles. However, FEMA officials could not provide documentation about when they would update the Risk MAP multiyear plan and whether the plan would include these new focus areas or identify goals and timeframes for their other efforts to address the challenges we identified above.
In its 2020 annual report, TMAC stated that a lack of long-term planning will likely prolong current flood hazard mapping and flood risk data
65Federal Emergency Management Agency, Federal Insurance Mitigation Administration, Fiscal Year 2021-2023 Federal Insurance and Mitigation Administration Leadership Intent (Washington, D.C.: Oct. 1, 2020); and Risk Management Directorate Fiscal Year 2021-2023 Strategy (Washington, D.C.: Sept. 25, 2020).
66Specifically, FIMA’s cross-cutting principles are to (a) deliver our programs with equity to increase resilience of all communities, and (b) incorporate future conditions. We discuss FIMA’s efforts related to equity and mapping later in this report.
67The 10-year plan also includes objectives to (a) define requirements for developing and delivering graduated flood hazard and risk information by the end of calendar year 2023; and (b) determine the final year for initiating current, binary Risk MAP products no later than fiscal year 2024.

Page 25 GAO-22-104079 FEMA Flood Maps
challenges that will carry forth into any future flood hazard and risk mapping program.68 TMAC stated that this highlights the need to develop a sound strategy to address currently unmapped areas, urban (pluvial) flooding, and areas of residual risk. In addition, TMAC concluded in its 2017 annual report that FEMA also needs to consider how such a transition to a future flood hazard mapping and flood risk information program will also support floodplain management and mitigation planning.69
GAO’s Disaster Resilience Framework states that integrated analysis and planning—in this case, for current efforts to address challenges in flood hazard mapping—can help decision makers take coherent and coordinated resilience actions.70 In addition, in our 2021 High Risk report, we identified that the federal government has yet to make measurable progress to reduce its fiscal exposure to climate change, including publishing metrics and milestones to assess its progress with incorporating future conditions into flood map products.71
Additionally, Standards for Internal Control in the Federal Government state that an entity determines its mission, sets a strategic plan, establishes entity objectives, and formulates plans to achieve its objectives.72 Management defines objectives in specific and measurable terms. This involves clearly defining what is to be achieved, who is to achieve it, how it will be achieved, and the time frames for achievement. Management also determines whether performance measures for the defined objectives are appropriate for evaluating the entity’s performance in achieving those objectives.73 Our prior work has also found that setting implementation goals and a time line to build momentum and show progress from day one, and making them public, is a key practice and
68Technical Mapping Advisory Council, TMAC 2020 Annual Report (Washington, D.C.: March 2021).
69Technical Mapping Advisory Council, TMAC 2017 Annual Report (Washington, D.C.: December 2017).
70GAO-20-100SP.
71GAO-21-119SP.
72GAO-14-704G.
73For quantitative objectives, performance measures may be a targeted percentage or numerical value. For qualitative objectives, management may need to design performance measures that indicate a level or degree of performance, such as milestones.

Page 26 GAO-22-104079 FEMA Flood Maps
implementation step for organizational transformations. Goals and a time line are essential because the transformation could take years to complete.74
During this time of transformation for NFIP and Risk MAP, updating Risk MAP’s multiyear plan to reflect its various current and future hazards initiatives could provide a roadmap to guide FEMA’s efforts to enhance FIRMs and nonregulatory products. Specifically, identifying goals, objectives, activities, performance measures, and time frames related to these initiatives could help FEMA effectively manage and coordinate the various efforts and transition, through the Future of Flood Risk Data initiative, to a future flood hazard mapping and flood risk identification program.
The Risk MAP program aims to help build a national culture of preparedness and resilience around flood hazards by providing communities with information that can enhance hazard mitigation planning and risk awareness.75 In its 2010-2014 Risk MAP Multi-Year Plan, FEMA identified three operational objectives linked to assessing Risk MAP’s efforts to enhance community resilience.76 The Risk MAP
74GAO, Results-Oriented Cultures: Implementation Steps to Assist Mergers and Organizational Transformations, GAO-03-669 (Washington, D.C.: July 2, 2003).
75Federal Emergency Management Agency, Risk Mapping, Assessment, and Planning (Risk MAP) Multi-Year Plan: Fiscal Years 2010-2014.
76The three operational objectives FEMA identified are to: 1) develop a process to conduct risk assessments routinely and measure the reduction of current and future vulnerability; 2) establish a baseline, and measure progress annually, of local understanding of flood risk; and 3) evaluate hazard mitigation plans to demonstrate that mitigation actions are being effectively implemented at the state, local, and tribal levels, resulting in risk reduction. Operational objectives relate to program operations that achieve an entities mission.
FEMA Has Not Assessed Usefulness of Nonregulatory Products for Enhancing Flood Resilience Risk MAP Has Ongoing Efforts to Assess Resilience and Is Exploring New Approaches

Page 27 GAO-22-104079 FEMA Flood Maps
program has taken steps and has ongoing efforts to meet these operational objectives. For instance, according to FEMA headquarters officials, one ongoing effort involves the Risk MAP program working to develop an evaluation plan as an approach to better understand, evaluate, and identify pathways to improve the Risk MAP’s impact on governments’ hazard mitigation plans toward reducing risk.77
In addition, according to FEMA headquarters officials, they are exploring a new approach to flood risk management that includes their Future of Flood Risk Data initiative. Specifically, the Future of Flood Risk Data initiative is focused on managing flood impacts and increasing community and individual resilience. FEMA headquarters officials said they also plan to develop measures to evaluate the effectiveness of the Future of Flood Risk Data initiative but have not done so because the initiative is still in the early phase of development. In January 2020, FEMA requested that TMAC provide a framework for FEMA to transition to the Future of Flood Risk Data initiative. TMAC provided a framework in its 2020 annual report highlighting four areas FEMA should focus on during the transition. In addition, as discussed earlier, FEMA headquarters officials told us that the Risk Management Directorate’s internal 10-year operational plan has a goal to establish updated goals for the Risk MAP program by the end of calendar year 2022.78 The same officials told us they are waiting to fully draft these updated Risk MAP goals before exploring additional community resilience objectives and measurement efforts.
FEMA has several nonregulatory products but does not periodically assess the usefulness of these nonregulatory products in enhancing community resilience to flooding. To assist communities in enhancing resilience against floods, Risk MAP developed nonregulatory products that go beyond the basic flood hazard information found in FIRMs. Each FEMA nonregulatory product is intended to help communities enhance their resilience against floods by providing information to further their understanding of their specific flood risks within the floodplain. According to FEMA documents, the agency has spent $18.4 million from fiscal years
77GAO’s Disaster Resilience Framework Principles defines hazard mitigation as actions taken to lessen the impact of a disaster and enhance disaster resilience by reducing disaster risk. A hazard mitigation plan identifies a community’s risks and planned mitigation actions and projects associated with those risks before a disaster even has a chance of occurring, making it easier to recover from future events. See GAO-20-100SP.
78Federal Emergency Management Agency, Risk Management Directorate, Risk Management Fiscal Years 2022-2031 Strategic Plan (Washington, D.C.: June 2021).
Risk MAP Developed Several Nonregulatory Products for Communities, but Has Not Assessed Their Usefulness

Page 28 GAO-22-104079 FEMA Flood Maps
2014 to 2020 on developing and maintaining these nonregulatory products.
As of June 2021, FEMA had six nonregulatory products accessible through its Flood Risk Database, which is intended to be used to analyze flood risk in a geographic information system format.79 See figure 1 for information on the features of the Flood Risk Database products and examples of how they can help increase community resilience against floods.
79FEMA also includes its “Changes Since Last FIRMs” product in the Flood Risk Database. However, for the purposes of this report we did not classify Changes Since Last FIRMs as a nonregulatory product because it is only provided to communities for one-time use when they receive a new FIRM to highlight the changes made to the regulatory floodplain and floodway boundaries during a flood mapping update or revision. The other nonregulatory products are developed for continual use.
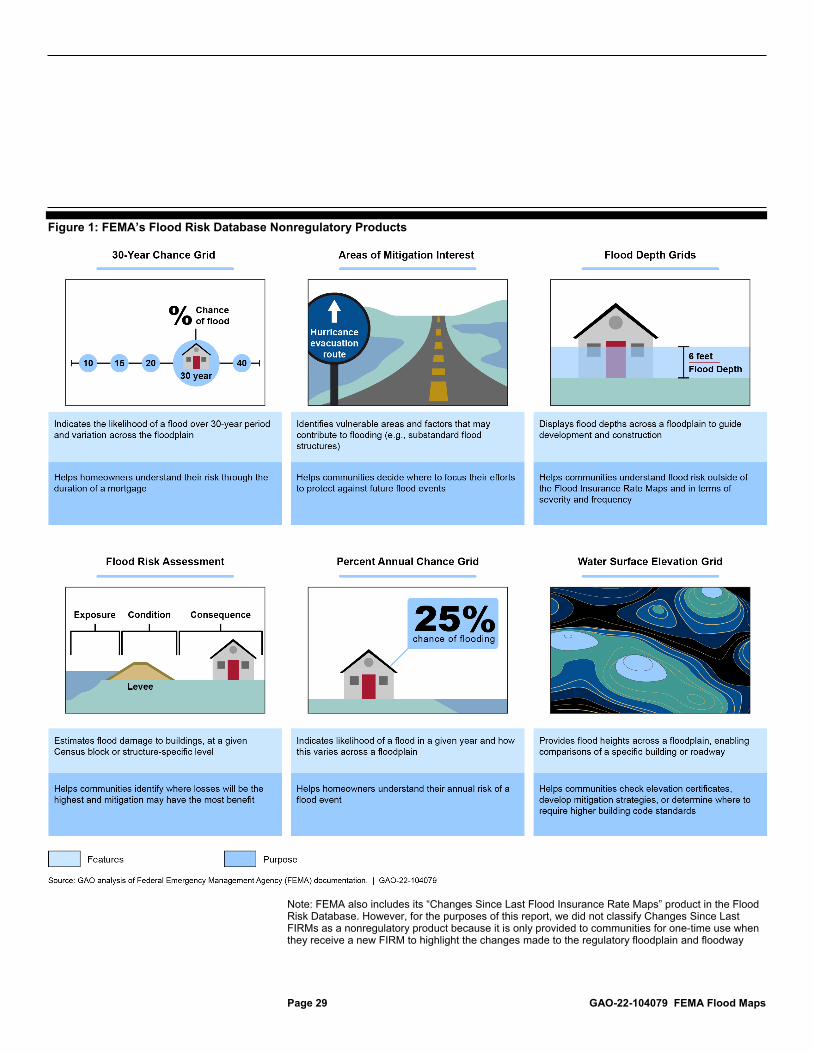
Page 29 GAO-22-104079 FEMA Flood Maps
Figure 1: FEMA’s Flood Risk Database Nonregulatory Products
Note: FEMA also includes its “Changes Since Last Flood Insurance Rate Maps” product in the Flood Risk Database. However, for the purposes of this report, we did not classify Changes Since Last FIRMs as a nonregulatory product because it is only provided to communities for one-time use when they receive a new FIRM to highlight the changes made to the regulatory floodplain and floodway

Page 30 GAO-22-104079 FEMA Flood Maps
boundaries during a flood mapping update or revision. The other nonregulatory products are developed for continual use.
FEMA provides three other nonregulatory products that are available as stand-alone products to support mitigation planning decisions. See figure 2 for more information on the features of these products and how they can help increase community resilience against floods.
Figure 2: FEMA Stand-Alone Nonregulatory Products
According to FEMA, nonregulatory products have advantages over the regulatory FIRM products discussed earlier in this report. These include helping communities understand where flood risk is changing and the broader spectrum of flood risk, including flood conditions that are not currently included in the regulatory FIRMs. FEMA officials stated that the agency has been able to develop nonregulatory products more quickly for the public than it is able to do with FIRM updates. Further, nonregulatory products are not intended to be used as the basis for official NFIP actions and, therefore, do not need to go through the same public notification processes that are required for FIRMs.

Page 31 GAO-22-104079 FEMA Flood Maps
However, the nonregulatory products may not be available in all cases or to all communities. For example, in our interviews with FEMA regions, officials told us that the availability of the nonregulatory products is based on when the community’s regulatory map was last updated, as well as what products the community requested or had the funding and staff capacity to maintain and the technical capability to use. FEMA and communities discuss these considerations during FEMA’s mapping process. For example, a community could request from FEMA a nonregulatory product during a mapping process step to help improve risk communication and outreach to the public. Additionally, FEMA officials from three of the four FEMA regions we interviewed said that, at times, the availability of nonregulatory products may be limited, due to resource constraints. For example, FEMA may only have enough resources to focus on the regulatory FIRMs products rather than the nonregulatory products, which require more updating than the FIRMs, according to officials in one FEMA region.
Further, although FEMA intends for these nonregulatory products to help communities enhance their resilience against floods, it is unclear how useful or accessible each product is to all communities. According to information we obtained from officials from FEMA regional offices and state and local officials from four states and five local jurisdictions, knowledge and observations on the usefulness of the nonregulatory products varied. Figure 3 summarizes the observations of these officials with respect to how valuable the nonregulatory products were for regular floodplain management activities.

Page 32 GAO-22-104079 FEMA Flood Maps
Figure 3: Summary of Observations from Each Local, State, and FEMA Regional Office Interviewed on FEMA’s Nonregulatory Products for Floodplain Management Activities
Note: The above summarizes responses to the question: “We are interested in your perspectives on the extent to which the following FEMA Risk Mapping, Assessment, and Planning products are valuable as part of your floodplain management activities.” Each square represents one interview with state, local, or FEMA region officials.

Page 33 GAO-22-104079 FEMA Flood Maps
According to our analysis of state and local officials interview responses, the usefulness of FEMA’s nonregulatory flood risk products may vary given a community’s need. For instance, officials from one local jurisdiction told us that the value of the Water Surface Elevation Grid depends on the area and scenario it is being used for—noting the grid may be more useful for determining how high to place a house on piers rather than determining how high a bridge should be built. In another interview, officials from one state said that the Water Surface Elevation Grid was more valuable in areas that were populated than in areas that were more rural.
Moreover, as shown in figure 3, officials from one of the five local jurisdictions and one of the four states said that they had never heard of one or more of the nonregulatory products. For example, one local jurisdiction noted that their community did not have enough staff to utilize or become familiar with the nonregulatory products. Additionally, officials in four of the five local jurisdictions and all four of the states we interviewed told us that they did not find some of the nonregulatory products to be of value. For instance, officials in one state told us that the Flood Depth Grid was not valuable for half of the state due to the topography and hydrology on that side of the state. As another example, officials in one local jurisdiction told us that the FEMA products were not of value to them because they produced their own products that were more specific to their area, so they did not need the FEMA-produced products. The same local jurisdiction did, however, indicate that some of the products were most likely valuable to other communities. In addition, officials from one of the FEMA regions said that some of the products may be confusing to state and local communities, especially if they do not have access to other corresponding data. Officials from another FEMA region indicated that some products, such as the 30-year Chance Grid, have not been described well enough to communities for them to understand how to use it.
Since 2015, TMAC has made several recommendations to FEMA related to ensuring that its flood risk products meet the needs of end users.80 For example:
• In 2015, TMAC recommended that FEMA establish a process to assess the present and anticipated flood hazard and flood risk
80TMAC provides recommendations for the entire Risk MAP program. However, for this section, we only reviewed TMAC recommendations relevant to the program’s nonregulatory products.

Page 34 GAO-22-104079 FEMA Flood Maps
products to meet the needs of various users. According to FEMA’s 2016 Report to Congress, FEMA concurred with this 2015 TMAC recommendation. FEMA headquarters officials stated they were conducting a research effort to improve understanding of how internal and external stakeholders use FEMA flood risk products. The agency refers to this research effort as the 2016 Customer Experience for Communities Survey. The research effort was developed to further analyze the nonregulatory products FEMA was providing to communities as part of the Risk MAP Program and to identify areas for improvements.81 For example, survey results indicated that end users need clarity around the importance and role of each flood risk product in regard to helping people understand flood risk, specifically the Flood Risk Report, Areas of Mitigation Interest, Percent 30-Year Chance Grid, and Flood Risk Assessment nonregulatory products. According to FEMA headquarters officials, the agency continuously considers alternate ways to develop and deliver products to end users.
• In TMAC’s 2017 and 2018 annual reports, TMAC recommended that FEMA identify ways to refine existing and future nonregulatory products with the end community user in mind. As of June 2021, the agency had yet to fully implement TMAC’s 2017 and 2018 recommendations related to nonregulatory products, according to FEMA headquarters officials.
• According to its 2020 annual report, TMAC conducted an extensive public engagement process from July through December 2020 with federal, state, local, and private floodplain management stakeholders.82 The process consisted of a survey, webinars, and focus groups. TMAC reported the key findings of this engagement process in its 2020 annual report—some of which related to Risk MAP’s nonregulatory products. For instance, TMAC found that stakeholders lacked clarity on how all elements of the Risk MAP program are working together, including how nonregulatory products will impact floodplain management. TMAC also reported that stakeholders said new products should be developed with end users in mind; that is, how they think and behave, and what will lead to
81The 2016 Customer Experience for Communities Survey yielded four main recommendations: (1) more useful products for nontechnical experts, (2) an active community role in defining the process, (3) a faster process and 4) transparency into the process for communities. According to FEMA, as of June 2021, the recommendations have been partially addressed.
82Technical Mapping Advisory Council, TMAC 2020 Annual Report (Washington, D.C.: March 2021).

Page 35 GAO-22-104079 FEMA Flood Maps
mitigation actions. As a result of the TMAC engagement process findings, TMAC recommended that FEMA develop more products that focus on floodplain management and incentivize mitigation efforts to help stakeholders enhance resilience to exceed the federal minimum standards. In June 2021, FEMA headquarters officials told us they have not yet begun to implement the TMAC 2020 recommendations.
FEMA does not have a full picture of the impacts of its nonregulatory products because it does not have an approach for periodically assessing their usefulness or availability to communities in enhancing their resilience to flooding. FEMA headquarters officials told us that they have not conducted any measurement efforts since 2016. They told us that they do not plan to establish another effort or process for assessing its nonregulatory products until they address the internal 10-year operational plan’s goal of establishing updated goals for the Risk MAP program.83 Officials also told us that the goals need to be developed prior to developing metrics and measures to assess whether the products are useful or available to end users. However, FEMA officials could not provide a timeframe for when these metrics and measures would be developed. Moreover, the agency has been providing nonregulatory products to communities since 2012, and FEMA headquarters officials told us that the agency is planning to continue doing so, as TMAC recommended.
While FEMA finalizes its goals for the broader Risk MAP program, there are ways for FEMA to assess and inform the usefulness of its nonregulatory products. For example, FEMA could track floodplain management enforcement activities such as areas where building codes were strengthened as a result of a community using a nonregulatory
83Federal Emergency Management Agency, Risk Management Directorate, Risk Management Fiscal Years 2022-2031 Strategic Plan.

Page 36 GAO-22-104079 FEMA Flood Maps
product.84 Further, FEMA could conduct loss avoidance studies in areas where nonregulatory products are used.85
According to GAO’s Disaster Resilience Framework Principles, standardized approaches to define disaster resilience goals and help the nation monitor progress toward them could inform where future resilience investments are needed and will provide the most benefit.86 Further, a 2012 report by the National Research Council noted that without some quantitative means for assessing community resilience, it would be impossible to identify the priority needs for improvement, to monitor changes, to show that resilience had improved, or to compare the benefits of increasing resilience with the associated costs.87 In addition, Risk MAP guidance identified that the program supports community resilience by providing data, building partnerships, and supporting floodplain management enforcement activities and long-term hazard mitigation planning.
As described earlier, FEMA has invested millions of dollars in developing Risk MAP nonregulatory products to support communities’ efforts to improve their flood resilience. By establishing mechanisms for periodically assessing the usefulness of these nonregulatory products, FEMA could better ensure it is investing in products that address community needs and that have a meaningful impact on enhancing flood resilience.
84For example, in 2018 we reported that FEMA officials said Hurricane Harvey demonstrated how prior hazard mitigation projects prevented greater damages (e.g. elevated homes and equipment sustained less damages. See, GAO, Hurricanes and Wildfires: Initial Observations on the Federal Response and Key Recovery Challenges, GAO-18-472 (Washington, D.C.: Sept. 4, 2018).
85A loss avoidance study estimates how much damage was prevented by mitigation and compares the value of the avoided losses with the cost of the mitigation. In 2021, we recommended that FEMA take additional actions to develop common metrics such as through conducting loss avoidance studies, on the cost-effectiveness of hazard mitigation projects, helping FEMA, state, and local governments make better-informed resilience investment decisions. In response to our 2021 recommendations, DHS concurred and stated that it is leveraging ongoing initiatives to enhance hazard risk assessment tools and methodologies by the end of January 2022. See GAO-21-140.
86GAO-20-100SP.
87The National Research Council, Disaster Resilience: A National Imperative (Washington, D.C., The National Academies Press: 2012)

Page 37 GAO-22-104079 FEMA Flood Maps
FEMA uses a collaborative process to prioritize Risk MAP resources by collecting input from states, local jurisdictions, and FEMA regional offices about where to create or update FIRMs and nonregulatory products. FEMA regions annually prepare multiyear mapping plans that identify their respective region’s budget, priorities, and projects to be funded. Each FEMA region is to consult with its states, territories, tribes, and localities to obtain their input about their flood risks and where flood mapping resources are most needed. States annually are to create multi-year plans to communicate their greatest flood hazard mapping needs. FEMA regions use these plans to support how they prioritize the flood mapping needs of each state, territory, tribe, or local jurisdictions, according to FEMA regional and state officials we interviewed.
The officials we spoke with in the four states we contacted said that FEMA regions do a good job of working with them to coordinate and identify mapping priorities. For example, officials from one state noted that its state mapping priorities are based on their state’s 5-year plan, which state officials find to be an effective way to annually assess their risks and needs. Officials from another state noted that its FEMA region communicates with both local and state officials, and—from an engineering perspective—the data and maps FEMA is producing are better and more accurate than ever before.
FEMA headquarters also plays a role in allocating its annual mapping budget. FEMA headquarters publishes an annual funding memorandum using the results of this collaborative process. The annual memo communicates funding amounts for each FEMA region on the basis of where the highest risk from flooding may occur. Further, this annual memo identifies Risk MAP program objectives, for example, to ensure that all FIRMs meet FEMA’s NVUE quality standard that the maps and its underlying data are valid and up to date every 5 years.
FEMA Collaborates with Stakeholders to Prioritize Mapping Investments, but Has Not Leveraged Available Data to Inform Decisions
FEMA Collaborates with State and Local Governments to Prioritize Where to Create or Update New Flood Maps and Products

Page 38 GAO-22-104079 FEMA Flood Maps
The Risk MAP program’s mapping priorities are also to be guided by national-level initiatives, including new strategic priorities and executive orders, which may affect what FEMA considers during future budget processes. For example, as previously stated, in October 2020, FIMA published its “Fiscal Year 2021-2023 Leadership Intent,” a strategic-level document that identified how the NFIP’s program implementation helps address disaster resilience. For example, FIMA states that FEMA must also consider underserved communities most often suffering disproportionally during and after a disaster, directing its divisions to be “more intentional about how we deliver our programs in a way that considers social disparities on a local, state, and national level.”88 Further, Executive Order 13985—”Advancing Racial Equity and Support for Underserved Communities Through the Federal Government”—was released in January 2021.89 Section 6 states that the federal government should, “consistent with applicable law, allocate resources to address the historic failure to invest sufficiently, justly, and equally in underserved communities, as well as individuals from those communities.” In response to recent executive orders, FEMA published a Federal Register notice on April 2021, requesting public input on ways FEMA can modify its policies, programs and activities to further its goals of “bolstering resilience from the impacts of climate change” and “advancing equity for all including those in underserved communities.”90
While FEMA considers input from various stakeholders to inform its Risk MAP investments, it has not made use of a variety of additional available data that could inform its decision-making process. For example, the Risk MAP program maintains project management information systems to track its inventory of existing, ongoing, and planned FIRM maps, and to estimate costs and resource needs. In addition, FEMA maintains publicly available disaster risk assessment tools that are designed to help government officials, emergency managers, floodplain managers, and other stakeholders understand the risk to their communities posed by hazards such as floods.
88Federal Emergency Management Agency, Federal Insurance Mitigation Administration, Federal Insurance and Mitigation Administration Leadership Intent (Washington, D.C.: Oct. 1, 2021).
89Executive Order No. 13985, Advancing Racial Equity and Support for Underserved Communities Through the Federal Government, 86 Fed. Reg. 7009 (Jan. 25, 2021).
9086 Fed. Reg. 21325 (Apr. 22, 2021).
Opportunities Exist for FEMA to Leverage Available Data to Inform Its Flood Mapping Investment Decisions

Page 39 GAO-22-104079 FEMA Flood Maps
We conducted a series of statistical analyses using FEMA’s data to identify the extent to which past Risk MAP investments for fiscal years 2012 to 2020 have aligned with selected strategic priorities, such as targeting areas with (1) a high risk for flooding, and (2) vulnerable and underserved populations.91 For a further description of our statistical analyses, see appendix I.
We found that FEMA’s mapping investments for fiscal years 2012 to 2020 were greater where flood risks were higher, even while controlling for a selected set of factors. For example:
• Communities with higher flood risks had more miles of digital maps than communities with lower flood risks, other identified factors being equal. This includes both unmapped miles for which a digital map was created as well as miles for which the map was converted from paper to digital;
• Communities with higher flood risks had a greater increase in the percentage of mapped miles that met the NVUE standard than communities with lower flood risks; and
• Communities with higher flood risks had shorter cycle times between the stages of FEMA’s mapping process than communities with lower flood risks.
We found that FEMA’s mapping investments for fiscal years 2012 to 2020 were lower for communities with higher levels of social vulnerability and underserved populations than communities with lower levels of social
91Our results were statistically significant even after accounting for other factors that might influence the extent of mapping. These factors include the size of the population in the community, the region of the country, and other demographics from U. S. Census estimates. We selected these factors because they are factors that FEMA identified through its disaster risk assessment tools as being associated with flood risks, social vulnerability, and underserved populations, and community resilience to disasters. For additional information on the scope of our analysis and the data we analyzed, see app I.
Analysis of Past Map Investments: Flood Risks
Analysis of Past Mapping Investments: Vulnerable and Underserved Communities
Page 40 GAO-22-104079 FEMA Flood Maps
vulnerability and underserved populations, other identified factors being equal. 92 For example:
• Communities with higher levels of social vulnerability and underserved populations had more unmapped miles or paper FIRMs in fiscal year 2012 than communities with lower levels of social vulnerability and underserved populations.93
• Communities with higher levels of social vulnerability and underserved populations had a smaller increase in the percentage of mapped miles that met the NVUE standard than communities with lower levels of social vulnerability and underserved populations.
• Communities with higher levels of social vulnerability and underserved populations had longer cycle times between the stages of FEMA’s mapping process than communities with lower levels of social vulnerability and underserved populations.
While FEMA’s process for prioritizing its mapping investments accounts for agency priorities and stakeholder input, Risk MAP officials told us they have not leveraged data, such as levels of social vulnerability—the social, economic, demographic, and housing characteristics of a community—to inform their annual mapping investment decisions. FEMA officials stated that their existing decision-making process has achieved the Risk MAP program’s goal to further emphasize community engagement and partnerships, while focusing on areas of greatest flood risk. However, FEMA officials said that our analysis was helpful and noted that FEMA leadership is interested in examining ways the agency could use such data, including the use of statistical analysis of the data, to inform future annual mapping investment decisions. FEMA officials stated that data from its internal Risk MAP inventory, which has information on existing, 92For purposes of this report, we measure ‘“social vulnerability and underserved populations” by using the Social Vulnerability Index, developed by the Centers for Disease Control and Prevention to help public health officials and local planners better prepare for and respond to emergencies and disasters. Social vulnerability is broadly defined as the susceptibility of social groups to the adverse impacts of natural hazards, including disproportionate death, injury, loss, or disruption of livelihood. Social vulnerability considers the social, economic, demographic, and housing characteristics of a community that influence its ability to prepare for, respond to, cope with, recover from, and adapt to environmental hazards.
93Our analysis found that FEMA’s mapping investments since fiscal year 2012 had converted more miles of unmapped areas or paper FIRMs. This increase covered both communities with higher levels of social vulnerability and underserved populations and communities with lower levels of social vulnerability and underserved populations.

Page 41 GAO-22-104079 FEMA Flood Maps
ongoing, and planned FIRM mapping projects could be useful for this purpose.
Standards for Internal Control in the Federal Government states that organizations should consider methods such as qualitative and quantitative ranking activities, and forecasting, as part of their risk identification and assessment activities.94 Further, GAO’s Disaster Resilience Framework emphasizes the value of integrated analysis and planning, which can help decision makers take coherent and coordinated resilience actions.95
By considering ways to leverage and integrate available data, such as through statistical analyses, into its annual process for prioritizing its flood mapping investments, FEMA could enhance its ability to make targeted, well-informed decisions that meet the agency’s strategic priorities and disaster resilience goals, as well as broader White House priorities.
Flooding is the costliest natural disaster annually in the United States, and more frequent and intense flooding from climate change directly threatens the nation in the future. To help ensure resilience against flooding, FEMA envisions a transition to what it calls a future vision of the national flood mapping program in which its flood maps will reflect more nuanced risk information and will improve NFIP program efforts like floodplain management. FEMA’s Risk MAP program has efforts underway to help address various challenges it faces in incorporating current and future flood hazards in its maps and other products. During this time of transformation for the NFIP and Risk MAP program, updating the Risk MAP program’s multiyear plan to clearly identify goals, objectives, activities, performance measures, and time frames for each of its ongoing efforts could help ensure they are managed and coordinated effectively and carried out in a timely manner
FEMA’s Risk MAP program has taken steps since 2012 to help enhance community resilience through its nonregulatory flood risk products. According to FEMA documents, the agency has spent $18.4 million from fiscal years 2014 through 2020 on developing and maintaining these nonregulatory products. However, the agency has not assessed the usefulness of these products in increasing community resilience since 2016. Establishing mechanisms for periodically assessing the usefulness 94GAO-14-704G.
95GAO-20-100SP.
Conclusions

Page 42 GAO-22-104079 FEMA Flood Maps
of its nonregulatory products could help FEMA ensure it is investing in products that address community need and that have a meaningful impact on enhancing flood resilience.
FEMA prioritizes mapping projects with input from states, territories, tribes and local jurisdictions, and FEMA regional offices. Our statistical analyses showed that FEMA’s mapping investments were greater where flood risks were higher, but lower for areas of higher socially-vulnerable populations. By considering ways to leverage and integrate available data, such as through statistical analyses, into its annual process for prioritizing its flood mapping investments, FEMA could enhance its ability to make targeted, well-informed decisions that meet agency and federal priorities and disaster resilience goals.
We are making the following three recommendations to FEMA:
The Administrator of FEMA should update its multiyear plan for the Risk MAP program to identify program goals, objectives, activities, performance measures, and time frames for its various efforts to address challenges in reflecting current and future flood hazards and to transition to a future program. (Recommendation 1)
The Administrator of FEMA should establish mechanisms for periodically assessing the usefulness of its Risk MAP nonregulatory products for communities in increasing their flood resilience. Such mechanisms could include tracking increases in building standards among those communities that use nonregulatory products, or conducting periodic loss avoidance studies. (Recommendation 2)
The Administrator of FEMA should consider ways to leverage and integrate available flood risk data, such as through statistical analyses, into its annual process for prioritizing flood mapping investments. Such available data sources include its Risk MAP’s inventory of FIRM mapping projects and FEMA’s national disaster risk assessment tools. (Recommendation 3)
We provided a draft of our report to the FEMA Administrator for comment. DHS provided written comments, which are reproduced in appendix II of this report. In its written response, DHS concurred with our three recommendations and described actions planned to address them. FEMA also provided technical comments, which we incorporated as appropriate.
Recommendations for Executive Action
Agency Comments and Our Evaluation

Page 43 GAO-22-104079 FEMA Flood Maps
In response to our first recommendation, DHS stated that FEMA will update its “Risk MAP Multi-Year Plan” to address the recommended items we identified. DHS estimated that FEMA will complete the update of this plan by December 30, 2022. This action, if fully implemented, should address the intent of our recommendation.
In response to our second recommendation, DHS stated that FEMA will clarify its approach for routinely assessing the usefulness of its nonregulatory flood risk data and products. DHS estimated that FEMA will perform these efforts as part of the update to its “Risk MAP Multi-Year Plan,” by December 30, 2022. This action, if fully implemented, should address the intent of our recommendation.
In response to our third recommendation, DHS stated that FEMA is currently investigating different datasets to assist with FEMA’s annual flood mapping investment process. DHS stated that FEMA will analyze other data sets that may be valuable in determining where to make investments each year and will clarify the approach to routinely assess what data sets to use when making investments. DHS estimated that FEMA will complete these efforts by December 30, 2022. These actions, if fully implemented, should address the intent of our recommendation.
We are sending copies of this report to the appropriate congressional committees, the Secretary of Homeland Security, and other interested parties. In addition, the report is available at no charge on the GAO website at https://www.gao.gov.
If you or your staff have any questions about this report, please contact me at (404) 679-1875 or [email protected]. Contact points for our Offices of Congressional Relations and Public Affairs may be found on the last page of this report. GAO staff who made key contributions to this report are listed in appendix III.
Chris P. Currie Director, Homeland Security and Justice

Page 44 GAO-22-104079 FEMA Flood Maps
List of Committees
The Honorable Sherrod Brown Chairman The Honorable Patrick J. Toomey Ranking Member Committee on Banking, Housing, and Urban Affairs United States Senate
The Honorable Gary C. Peters Chairman The Honorable Rob Portman Ranking Member Committee on Homeland Security and Government Affairs United States Senate
The Honorable Chris Murphy Chairman The Honorable Shelley Moore Capito Ranking Member Subcommittee on Homeland Security Committee on Appropriations United States Senate
The Honorable Maxine Waters Chairwoman The Honorable Patrick McHenry Ranking Member Committee on Financial Services House of Representatives
The Honorable Bennie G. Thompson Chairman The Honorable John Katko Ranking Member Committee on Homeland Security House of Representatives

Page 45 GAO-22-104079 FEMA Flood Maps
List of Committees continued
The Honorable Peter A. DeFazio Chairman The Honorable Sam Graves Ranking Member Committee on Transportation and Infrastructure House of Representatives
The Honorable Lucille Roybal-Allard Chair The Honorable Chuck Fleischmann Ranking Member Subcommittee on Homeland Security Committee on Appropriations House of Representatives

Appendix I: Statistical Analyses of FEMA’s Mapping, and Map Prioritization Process
Page 46 GAO-22-104079 FEMA Flood Maps
The Federal Emergency Management Agency’s (FEMA) Risk Mapping, Assessment and Planning (Risk MAP) program develops and updates regulatory flood maps—specifically, Flood Insurance Rate Maps (FIRM)—as well as various supplementary flood risk information—known as nonregulatory product. These FIRMs are intended to enable FEMA to perform its responsibilities under the National Flood Insurance Program (NFIP) to increase awareness of flood risk through identification and publication of flood hazard information. This information is used by all states, territories, tribal governments, and 22,500 communities that participate in the NFIP. FEMA’s 10 regional offices are each responsible for managing flood map production for their geographic areas. FEMA headquarters and regional staff monitor and report on flood hazard mapping progress, using Risk MAP’s inventory of flood hazard mapping needs.
This appendix details our efforts to statistically analyze the results of Risk MAP’s allocation decision process for developing FIRMs and nonregulatory products, and how the results aligned with the program’s goals and objectives, as well as to selected aspects of disaster resilience goals within FEMA’s Flood Insurance and Mitigation Administration (FIMA) strategic plans and White House executive orders.
The Risk MAP program relies on project management information systems for tracking its inventory of existing, ongoing, and planned FIRM mapping projects and to estimate costs and resource needs on a project-by-project basis. According to Risk MAP guidance, these internal project management systems are designed to improve analysis and reporting by maintaining data that are current, readily available, and reliable.
The Coordinated Needs Management Strategy (CNMS) is the Risk MAP program’s internal project management tool that organizes, stores, and analyzes flood hazard mapping needs information for communities. According to CNMS guidance, the tool is designed to help identify flood hazard mapping needs by each mile of a FIRM, supporting Risk MAP’s data-driven flood hazard information planning process. The CNMS establishes a geospatially-enabled platform for each FEMA region to enter, monitor, and update its inventory of FIRM in its various stages of the mapping process. In addition, the CNMS is the sole source for reporting Risk MAP’s performance metric—New, Validated, or Updated
Appendix I: Statistical Analyses of FEMA’s Mapping, and Map Prioritization Process
Data Used in Our Analyses
Risk MAP’s Inventory of FIRM Mapping Projects

Appendix I: Statistical Analyses of FEMA’s Mapping, and Map Prioritization Process
Page 47 GAO-22-104079 FEMA Flood Maps
Engineering (NVUE).1 The NVUE metric enables FEMA to identify the portion of its inventory that meets FEMA’s NVUE engineering standard, as well as those FIRMs that do not and would warrant an additional study. The CNMS also includes the validation status of approximate FIRMs and those unmapped areas that have been considered for a new FIRM.2
From fiscal years 2012 through 2017, CNMS classified its map inventory within three categories: (a) unmapped, (b) paper, or (c) digital. Starting in fiscal year 2018, CNMS also included classification fields that describe the maturity of FIRMs,3 falling into one of the following six tiers:
• Tier 0: Is known to be flood prone (i.e., draining greater than 1 square mile) but any Special Flood Hazard Area is not yet identified as on a regulatory FIRM.
• Tier 1: Paper FIRM; Special Flood Hazard Area is not available in digital format.
• Tier 2: FIRM is available as a digital product, but is not known to include automated engineering modeling.
• Tier 3: FIRM is available as a digital product, includes automated engineering modeling, and may not be consistent with high-quality elevation data (i.e., utilizes elevation data inferior to the U.S. Geologic Survey’s Quality Level 2 equivalence or better.
• Tier 4: Is available as a digital product, includes automated engineering modeling, and consistent with high-quality elevation data. According to FEMA officials, this tier indicates that a FIRM meets all current Risk MAP technical requirements.
1FEMA uses its NVUE metric to help meet the statutory requirement that all FIRMs and their underlying data are valid and up to date every 5 years.
2GAO, FEMA Flood Maps: Some Standards and Processes in Place to Promote Map Accuracy and Outreach, but Opportunities Exist to Address Implementation Challenges, GAO-11-17 (Washington, D.C.: Dec. 2, 2010). Approximate FIRMs generally require less precision in flood hazard data. They are used for areas that are less subject to development and do not require the establishment of a regulatory base flood elevation, although base flood elevations may be identified on the FIRM. In contrast, a detailed FIRM will incorporate greater amounts of data or more precise data to provide greater granularity of information.
3The CNMS inventory includes approximately 4 million miles of stream and coastlines that drain greater than 1 square mile, as referenced by the U.S. Geological Survey.

Appendix I: Statistical Analyses of FEMA’s Mapping, and Map Prioritization Process
Page 48 GAO-22-104079 FEMA Flood Maps
• Tier 5: FIRM and any Special Flood Hazard Area is available as a digital product and includes enhanced analyses, such as future land use or future climate-informed analyses.
To perform our multiple regression models needed to analyze the results of Risk MAP’s allocation decision process for developing and updating flood maps, we used Risk MAP’s CNMS data provided from fiscal years 2012 through 2020. Specifically,
• fiscal year 2020 (4th quarter) data include stream maps, coastal maps, and miles that are unmapped for each of the 10 FEMA regions; and
• fiscal year 2012 (4th quarter) data include stream maps, and miles that are unmapped for each of the 10 FEMA regions.
FEMA maintains various nationwide, Geographic Information System-based disaster risk assessment tools. FEMA developed these tools to help state, territorial, tribal, and local officials, emergency managers, and other stakeholders assess their own hazards and risks so that stakeholders may improve their resilience to disasters.
• Community Engagement Prioritization Tool. FEMA’s Floodplain Management Division developed this tool for use by FEMA regions and state NFIP coordinators. The Community Engagement Prioritization Tool is designed to help users monitor compliance with the NFIP’s minimum land use ordinances and construction codes. The tool was developed to prioritize NFIP communities on the basis of measures of risk and is designed to direct FEMA regions’ and states’ resources to those communities with the greatest need for technical assistance, training, outreach, and additional compliance. The following are some of the datasets included in this tool: • Social Vulnerability Index, developed by the Centers for Disease
Control and Prevention;4
4For purposes of this report, we measure ‘“social vulnerability and underserved populations” by using the Social Vulnerability Index, developed by the Centers for Disease Control and Prevention to help public health officials and local planners better prepare for and respond to emergencies and disasters. Within FEMA’s National Risk Index, social vulnerability is broadly defined as the susceptibility of social groups to the adverse impacts of natural hazards, including disproportionate death, injury, loss, or disruption of livelihood. Social vulnerability considers the social, economic, demographic, and housing characteristics of a community that influence its ability to prepare for, respond to, cope with, recover from, and adapt to environmental hazards.
FEMA’s Open-Source, Risk Assessment Tools

Appendix I: Statistical Analyses of FEMA’s Mapping, and Map Prioritization Process
Page 49 GAO-22-104079 FEMA Flood Maps
• Estimated population growth in Special Flood Hazard Area; • Estimated population growth rate; • Number of NFIP flood insurance policies; • Population within a Special Flood Hazard Area; and • Total area population.
• National Risk Index. FEMA developed this publicly available tool to help public officials, emergency managers, and other stakeholders identify the most at-risk areas for natural hazards. The National Risk Index develops a baseline relative risk measurement down to the U.S. Census tract. This risk assessment tool leverages available source data for 18 natural hazards, and data to identify social factors and resilience capabilities. The National Risk Index was designed to support activities such as updating emergency management response, recovery and mitigation plans; enhancing risk communications, education and public engagement; identifying the need for enhanced floodplain management standards and building codes; and prioritizing and allocating resources. The following are some of the datasets included this tool: • Agricultural value (in dollars), • Land area (square miles), • Building value (in dollars), • Coastal flooding - individual hazard risk score, • Expected annual loss – score, • Population (2016),5
• Community resilience – rating, • Annual riverine flooding frequency, • Number of riverine flooding events, • Riverine flooding - expected annual loss score, • Riverine flooding - exposure - agricultural value (in dollars), • Riverine flooding - historic loss ratio – agriculture, • National Risk Index – score,
5FEMA uses population estimates from the U.S. Census Bureau’s American Community Survey.

Appendix I: Statistical Analyses of FEMA’s Mapping, and Map Prioritization Process
Page 50 GAO-22-104079 FEMA Flood Maps
• Riverine flooding - individual hazard risk score, and • Social vulnerability – rating.
• Resilience Analysis and Planning Tool. FEMA’s National Integration Center released this publicly available tool to help emergency managers and local leaders visually assess challenges to resilience. The tool includes hazard and infrastructure information, as well as 20 community resilience indicators. The following are some of the datasets included in this tool: • Median household income, • Percent of population aged over 65, • Percent of households with limited English language proficiency, • Percent of labor force unemployed, • Percent of mobile homes, • Percent of owner-occupied housing units, • Percent of single parent households, and • Percent of population without health insurance.
We took several steps to assess the reliability of the data we used in our analysis. As a result of the efforts we describe below, we determined that the data were sufficiently reliable for the purposes of describing trends in mapped miles and their relationship with current flood risks and FEMA program goals and objectives.
We conducted a data reliability assessment to determine how the data will be used as part of the analytic basis for our findings and conclusions, and any limitations, given the intended use of the data.
For each of the FEMA datasets we used in our analyses, we reviewed supporting documentation, such as user guides, data dictionaries, or training-related documents. We also interviewed FEMA officials with knowledge of each of the datasets we analyzed. We asked FEMA officials about the sources and methods used to produce these data, the timeliness of data entries and updates, the steps they take to assure data quality, and what potential analytics uses and limitations might affect our intended analyses. To evaluate the completeness of each dataset, we performed electronic testing for issues such as missing data, outliers, or obvious errors, and we determined whether either the type or number of any anomalies identified could bias our statistical estimates.
Data Reliability

Appendix I: Statistical Analyses of FEMA’s Mapping, and Map Prioritization Process
Page 51 GAO-22-104079 FEMA Flood Maps
We then compared our preliminary results with published data when available, and discussed our preliminary data analysis results with FEMA officials. For example, we compared our analysis of CNMS data with FEMA’s NVUE reports for fiscal year 2020 (4th quarter). We calculated the percentage of mapped miles that attained the NVUE standard using FEMA’s NVUE reporting methodology with CNMS fiscal year 2020 (4th quarter) data.
We performed a series of statistical analyses to assess the relationship between the extent of FIRMs in FEMA communities and the characteristics of those communities. The type of statistical analysis we used is referred to as Ordinary Least Square multiple regression. This analysis estimated the strength of the relationship between each community characteristic and the extent of flood mapping while holding each of the other characteristics constant. For example, our analysis allowed us to determine whether communities with relatively high flood risks had significantly more (or less) extensive flood mapping than communities with relatively low risks, while holding other factors constant. Similarly, the analysis allowed us to determine whether communities with relatively high percentages of socially vulnerable populations had significantly more (or less) extensive flood mapping than those with relatively low percentages, given that they have the same flood risks.
We developed four regression models based on four measures of the change in flood mapping from fiscal years 2012 to 2020. These measures were (1) the mapped miles in fiscal year 2012, as well as (2) the miles mapped in digital form in fiscal year 2012; (3) the change in the percentage of FIRM miles that met FEMA’s NVUE standard for map quality from fiscal years 2012 to 2020; and (4) the change in the cycle time at each stage of FEMA’s mapping process from fiscal years 2012 to 2020. We calculated measures of change as differences between the value in 2020 and the value in 2012 for each community. For example, we subtracted the percent of maps that met the NVUE standard in 2012, from the percent of maps that met the NVUE standard in 2020; and the number of and elapsed time of changes at each stage of FEMA’s mapping process since the map had last been updated as of 2012, from those changes as of 2020, respectively. We calculated these measures for each community using data from CNMS for the corresponding year’s measure. We used these measures as the outcome variables in our four regression models.
Our regression models estimated the relationship between each of the four flood mapping measures and the (1) flood risk and (2) social
Multiple Regression Models
Methodology

Appendix I: Statistical Analyses of FEMA’s Mapping, and Map Prioritization Process
Page 52 GAO-22-104079 FEMA Flood Maps
vulnerability of communities. To measure flood risk, we used data from the National Risk Index data. To measure community social vulnerability, we used data from the National Risk Index, and the Community Engagement Prioritization Tool. In addition, we also used data from the Resilience Analysis and Planning Tool data to assess any changes in community resilience. We selected these explanatory variables to represent FEMA’s objectives of prioritizing areas with the highest risks and areas with the most vulnerable populations.
The unit of analysis for our models was a FEMA community. A FEMA community is a geographic region delineated for the purposes of flood mapping, such as an incorporated city or the unincorporated part of a county. For comparison reasons, our analysis started with 13,949 communities in the continental United States that had maps in both fiscal years 2012 and 2020, and compared the map progress of these communities from fiscal years 2012 to 2020. We supplemented these data from the CNMS databases for the corresponding years that National Risk Index and Resilience Analysis and Planning Tool data were available at the level of U.S. Census tract rather than at the level of community. U.S. Census tracts are statistical subdivisions of counties whose borders follow geographic features, such as streams, highways, railroads, and legal boundaries and that generally contain between 1,200 and 8,000 people. Some NFIP communities encompass more than one U.S. Census tract, and some U.S. Census tracts are split across more than one community.
To aggregate data from the National Risk Index and Resilience Analysis and Planning Tool from the level of U.S. Census tracts to the level of FEMA communities, we conducted a geospatial analysis. Specifically, we used GIS software to overlay the boundaries of U.S. Census tracts onto the boundaries of communities. We calculated the area of each U.S. Census tract that was contained within each community. We then calculated a weighted average for National Risk Index and Resilience Analysis and Planning Tool data for each community on the basis of the proportion of the underlying U.S. Census tracts contained within it. We then merged data from the Resilience Analysis and Planning Tool, the National Risk Index, and the Community Engagement Prioritization Tool into the CNMS data by community identification numbers for the multivariate regression analysis.
The results of our regression models indicate how changes in flood mapping in FEMA communities was associated with communities’ flood risk and social vulnerability, as shown in tables 1-4 below. In these tables,
Results

Appendix I: Statistical Analyses of FEMA’s Mapping, and Map Prioritization Process
Page 53 GAO-22-104079 FEMA Flood Maps
the direction (positive or negative) and magnitude of statistical association is determined by the coefficient estimates for the effects. The p-value indicates the degree of statistical significance of the coefficient estimates. Overall, our analysis shows that there are statistically significant associations between the communities’ flood risk and the social vulnerability with the mapping resources made from fiscal years 2012 to 2020
• Number and type of FIRM miles — Table 1 and table 2 contain the results of our regression models of the number of total miles mapped or the number of miles of digital maps. In table 1, the parameter estimates indicate whether each explanatory variable had a positive or a negative association with the change in the percentage of newly mapped miles as of fiscal year 2012. Positive values indicate that communities with higher levels of the explanatory variable tended to have a larger increase in the percentage of unmapped miles or paper FIRMs. Negative values indicate that communities with greater levels of the explanatory variable tended to have a smaller number of miles mapped in fiscal year 2012. The results of this model show that changes in the percentage of miles with a paper map were significantly associated with communities’ flood risk and social vulnerability. In particular, they show the following: • Communities with higher flood risks had more mapped FIRM
miles than communities with lower flood risks, as indicated by the results for explanatory variables Riverine Flooding Hazard Risk Score in table 1.
• Communities with higher levels of social vulnerability and underserved populations had more unmapped miles than communities with lower social vulnerability and underserved populations, as indicated by the results for explanatory variable Social Vulnerability Rating in table 1.

Appendix I: Statistical Analyses of FEMA’s Mapping, and Map Prioritization Process
Page 54 GAO-22-104079 FEMA Flood Maps
Table 1: GAO Linear Regression Model with Dependent Variable: The Number of Mapped Miles, as of Fiscal Year 2012
Explanatory variable Parameter
estimate Standard
error t value p value Intercept 2.2350 0.2961 7.55 <.0001 Riverine Flooding Hazard Risk Score 0.0108 0.0027 4.02 <.0001 Social Vulnerability - Rating -0.1332 0.0152 -8.78 <.0001 Community Resilience - Rating -0.4206 0.1043 -4.03 <.0001 Population (2016) 0.0001 0.0000 7.61 <.0001 Area (square miles) 0.0003 0.0000 6.28 <.0001 Population in Special Flood Hazard Area 0.0005 0.0000 65.39 <.0001 Estimated population growth rate 0.0083 0.0017 5.01 <.0001 Percent Labor Force Unemployed 0.0316 0.0087 3.62 0.0003 Percent of Mobile Homes 0.0073 0.0025 2.87 0.0041
Source: GAO analysis of Federal Emergency Management Agency (FEMA) data. | GAO-22-104079
Similarly, table 2 contains the results of our regression model of the number of miles for digital maps in fiscal year 2012. In this table, the parameter estimates indicate whether each explanatory variable had a positive or a negative association with the number of miles of digital maps in a community, as of fiscal year 2012. Positive values indicate that communities with higher levels of the explanatory variable tended to have a greater number of miles with digital maps. Negative values indicate that communities with greater levels of the explanatory variable tended to have a smaller number of miles with digital maps. The results of this model show that the number of miles mapped in 2012 was significantly associated with its flood risk and social vulnerability of communities. In particular, they show the following:
• Communities with higher flood risks had more mapped FIRM miles with digital form than communities with lower flood risks, as indicated by the results for explanatory variables Riverine Flooding Hazard Risk Score in table 2.
• Communities with higher levels of social vulnerability and underserved populations had lower numbers of FIRM miles with digital maps than communities with lower social vulnerability and underserved populations, as indicated by the results for explanatory variable Social Vulnerability Rating in table 2.

Appendix I: Statistical Analyses of FEMA’s Mapping, and Map Prioritization Process
Page 55 GAO-22-104079 FEMA Flood Maps
Table 2: GAO Linear Regression Model with Dependent Variable: Miles with Digital Flood Insurance Rate Maps, as of Fiscal Year 2012
Explanatory variable Parameter
estimate Standard
error t value p value Intercept 1.7089 0.3032 5.64 <.0001 Riverine Flooding Hazard Risk Score 0.0126 0.0028 4.57 <.0001 Social Vulnerability Rating -0.1633 0.0155 -10.51 <.0001 Community resilience - Rating -0.4694 0.1069 -4.39 <.0001 Population (2016) 0.0002 0.0000 11.39 <.0001 Area (square miles) 0.0001 0.0000 2.69 0.0071 Estimated population in Special Flood Hazard Area 0.0005 0.0000 65.13 <.0001 Estimated population growth rate 0.0107 0.0017 6.29 <.0001 Percent Labor Force Unemployed 0.0471 0.0090 5.26 <.0001 Percent of Mobile Homes 0.0073 0.0026 2.82 0.0048
Source: GAO analysis of Federal Emergency Management Agency (FEMA) data. | GAO-22-104079
• Meeting FEMA’s NVUE standard - Table 3 contains the results of our regression model of the change in the percentage of FIRM miles that met FEMA’s NVUE standard for map quality. In this table, the parameter estimates indicate whether each explanatory variable had a positive or a negative association with the change in the percentage of FIRM miles in a community that became NVUE compliant from 2012 to 2020. Positive values indicate that communities with higher levels of the explanatory variable tended to have a larger increase in the percentage of miles that became NVUE compliant. Negative values indicate that communities with greater levels of the explanatory variable tended to have a smaller increase in the percentage of miles that became NVUE compliant. The results of this model show that changes in NVUE compliance were significantly associated with its flood risk, social vulnerability, and social resilience. In particular, they show the following: • Communities with higher flood risks had a larger increase in the
percentage of FIRM miles that met the NVUE standard than communities with lower flood risks, as indicated by the results for explanatory variables Number of Riverine Flooding Event and the Coastal Flooding Hazard Risk Score in table 3.
• Communities with higher levels of social vulnerability and underserved populations had a smaller increase in the percentage of FIRM miles that met the NVUE standard than communities with lower social vulnerability and underserved populations, as

Appendix I: Statistical Analyses of FEMA’s Mapping, and Map Prioritization Process
Page 56 GAO-22-104079 FEMA Flood Maps
indicated by the results for explanatory variable Social Vulnerability Index in table 3.
Table 3: GAO Linear Regression Model with Dependent Variable: Percent Change in Miles That Met FEMA’s New, Validated, or Updated Engineering (NVUE) Standard, Fiscal Years 2012 to 2020
Explanatory variable Parameter
estimate Standard
error t value p value Intercept 0.0223 0.0265 0.84 0.3994 Number of riverine flooding event 0.0014 0.0001 10.07 <.0001 Coastal flooding risk score 0.0229 0.0023 10.13 <.0001 Expected annual loss score -0.0042 0.0006 -7.29 <.0001 Social Vulnerability Index -0.1220 0.0172 -7.10 <.0001 Estimated population growth in Special Flood Hazard Area
-0.0006 0.0003 -2.06 0.0396
Estimated population growth rate 0.0187 0.0050 3.71 0.0002 Percent of owner occupied housing units -0.0016 0.0003 -5.08 <.0001 Percent of single parent household 0.0021 0.0005 3.94 <.0001
Source: GAO analysis of Federal Emergency Management Agency (FEMA) data. | GAO-22-104079
• Change in cycle times between stages of FEMA’s mapping process. Table 4 contains the results of our regression analysis of the changes that occurred in the stages within FEMA’s mapping process during the time a map was last updated. In this table, the parameter estimates indicate whether each explanatory variable had a positive or a negative association with the change in the years since a map was last updated from 2012 through 2020. The year since the map was last updated reflects the cycle times between the stages of FEMA’s mapping process. Positive values indicate that communities with higher levels of the explanatory variable tended to have a larger increase in the cycle times of FEMA’s mapping process stages, negative values indicate that communities with greater levels of the explanatory variable tended to have a smaller increase in the cycle time. The results of this analysis show that changes in cycle times between the stages of FEMA’s mapping process were significantly associated with its flood risk, social vulnerability, and social resilience. In particular, they show the following: • Communities with higher flood risks had less change in the cycle
times than communities with lower flood risks, as indicated by the results for explanatory variables Riverine Flooding Hazard Risk Score and the Annual Riverine Flooding Frequency in table 4.

Appendix I: Statistical Analyses of FEMA’s Mapping, and Map Prioritization Process
Page 57 GAO-22-104079 FEMA Flood Maps
• Communities with a higher level of social vulnerability had a larger increase in the cycle times than communities with lower social vulnerability and underserved populations, as indicated by the results for explanatory variable Social Vulnerability Index in table 4.
Table 4: GAO Linear Regression Model with Dependent Variable: Change in Cycle Times at Each Stage of FEMA’s Mapping Process, Fiscal Years 2012 to 2020
Explanatory variable Parameter estimate
Standard error
t value p value
Intercept 1.5920 0.1134 14.04 <.0001 Riverine Flooding Hazard Risk Score -0.0117 0.0022 -5.33 <.0001 Annual riverine flooding frequency -0.0751 0.0145 -5.19 <.0001 Social Vulnerability Index 0.1918 0.0854 2.24 0.0248 Population (2016) -0.0001 0.0000 -5.63 <.0001 Building value (in dollars) 0.0000 0.0000 6.75 <.0001 Area (square miles) 0.0002 0.0000 4.19 <.0001 National Risk Index - Score -0.0053 0.0030 -1.79 0.0735 Historic agriculture loss ratio from riverine flooding 39.3824 3.6130 10.90 <.0001 Historic agriculture loss from riverine flooding 0.0000 0.0000 3.16 0.0016 Percent of population without health insurance 0.0119 0.0042 2.82 0.0049 Percent of households with limited English proficiency
-0.0204 0.0074 -2.77 0.0055
Percent of labor force unemployed 0.0207 0.0071 2.92 0.0035 Percent of population with age over 65 -0.0110 0.0040 -2.74 0.0062 Percent of mobile homes -0.0051 0.0025 -2.03 0.0424
Source: GAO analysis of Federal Emergency Management Agency (FEMA) data. | GAO-22-104079
This analysis studies the relationships of community characteristics for which there are data; there could be other characteristics not identified that could be related to update frequency or funding that are not identified in the analysis. Moreover, there could be other characteristics that are related to our identified factors and the outcome that could be driving some of the relationships. For example, there could be other unmeasured factors that may be correlated with both social vulnerability and the extent of flood mapping. Also, some of the characteristics could be correlated with others, which would reduce the precision of the estimates, and we would be less likely to find statistically significant relationships. This analysis relies on data and other listings provided by various personnel at FEMA. Some of the data in this analysis are based on statistical estimates from sample surveys and indices that were developed by
Limitations of the Analysis

Appendix I: Statistical Analyses of FEMA’s Mapping, and Map Prioritization Process
Page 58 GAO-22-104079 FEMA Flood Maps
FEMA using data from the American Community Survey and other sources. Like all sample surveys, these estimates are subject to sampling error.

Appendix II: Comments from the U.S. Department of Homeland Security
Page 59 GAO-22-104079 FEMA Flood Maps
Appendix II: Comments from the U.S. Department of Homeland Security

Appendix II: Comments from the U.S. Department of Homeland Security
Page 60 GAO-22-104079 FEMA Flood Maps

Appendix II: Comments from the U.S. Department of Homeland Security
Page 61 GAO-22-104079 FEMA Flood Maps

Appendix II: Comments from the U.S. Department of Homeland Security
Page 62 GAO-22-104079 FEMA Flood Maps

Appendix III: GAO Contact and Staff Acknowledgments
Page 63 GAO-22-104079 FEMA Flood Maps
Christopher P. Currie at (404) 679-1875, [email protected].
In addition to the contact named above, Joel Aldape (Assistant Director), John Vocino (Analyst-in-Charge), Mark A. Braza, Jennifer Bryant, Lilia Chaidez, Benjamin Crossley, Laura Gibbons, Lijia Guo, David Hooper, Susan Hsu, Christine McGinty, Hadley Nobles, and Nadine Garrick Raidbard made key contributions to this report.
Appendix III: GAO Contact and Staff Acknowledgments
GAO Contact
Staff Acknowledgments

Related GAO Products
Page 64 GAO-22-104079 FEMA Flood Maps
National Flood Insurance Program: Congress Should Consider Updating the Mandatory Purchase Requirement. GAO-21-578. Washington, D.C.: July 30, 2021.
The Nation’s Fiscal Health: After Pandemic Recovery, Focus Needed on Achieving Long-Term Fiscal Sustainability. GAO-21-275SP. Washington, D.C.: March 23, 2021.
Disaster Resilience: FEMA Should Take Additional Steps to Streamline Hazard Mitigation Grants and Assess Program Effects. GAO-21-140. Washington, D.C.: February 2, 2021.
High Risk Series: Dedicated Leadership Needed to Address Limited Progress in Most High-Risk Areas. GAO-21-119SP. Washington, D.C.: March 2, 2021.
National Flood Insurance Program: Fiscal Exposure Persists Despite Property Acquisitions. GAO-20-509. Washington, D.C.: June 25, 2020.
National Flood Insurance Program: Fiscal Exposure Persists Despite Property Acquisitions. GAO-20-508. Washington, D.C.: June 25, 2020.
National Flood Insurance Program: FEMA Can Improve Community Oversight and Data Sharing. GAO-20-396. Washington, D.C.: May 5, 2020.
Priority Open Recommendations: Department of Homeland Security. GAO-20-355PR. Washington, D.C.: April 30, 2020.
Priority Open Recommendations: Department of Homeland Security. GAO-19-360SP. Washington, D.C.: April 26, 2019.
Disaster Resilience Framework: Principles for Analyzing Federal Efforts to Facilitate and Promote Resilience to Natural Disasters. GAO-20-100SP. Washington, D.C.: October 23, 2019.
Fiscal Exposures: Federal Insurance and Other Activities That Transfer Risk or Losses to the Government. GAO-19-353. Washington, D.C.: March 27, 2019.
High Risk Series: Substantial Efforts Needed to Achieve Greater Progress on High-Risk Areas. GAO-19-157SP. Washington, D.C.: March 6, 2019.
Related GAO Products

Related GAO Products
Page 65 GAO-22-104079 FEMA Flood Maps
Hurricanes and Wildfires: Initial Observations on the Federal Response and Key Recovery Challenges. GAO-18-472. Washington, D.C.: September 4, 2018.
Flood Insurance: Comprehensive Reform Could Improve Solvency and Enhance Resilience. GAO-17-425. Washington, D.C.: April 27, 2017.
High Risk Series: Progress on Many High-Risk Areas, While Substantial Efforts Needed on Others. GAO-17-317. Washington, D.C.: February 15, 2017.
Flood Insurance: FEMA Needs to Address Data Quality and Consider Company Characteristics When Revising Its Compensation Methodology. GAO-17-36. Washington, D.C.: December 8, 2016.
Flood Insurance: Review of FEMA Study and Report on Community-Based Options. GAO-16-766. Washington, D.C.: August 24, 2016.
Flood Insurance: Potential Barriers Cited to Increased Use of Private Insurance. GAO-16-611. Washington, D.C.: July 14, 2016.
National Flood Insurance Program: Continued Progress Needed to Fully Address Prior GAO Recommendations on Rate-Setting Methods. GAO-16-59. Washington, D.C.: March 17, 2016.
National Flood Insurance Program: Options for Providing Affordability Assistance. GAO-16-190. Washington, D.C.: February 10, 2016.
Climate Information: A National System Could Help Federal, State, Local, and Private Sector Decision Makers Use Climate Information. GAO-16-37. Washington, D.C.: December 8, 2015.
Hurricane Sandy: An Investment Strategy Could Help the Federal Government Enhance National Resilience for Future Disasters. GAO-15-515. Washington, D.C.: July 30, 2015.
Flood Insurance: Status of FEMA’s Implementation of the Biggert-Waters Act, as Amended. GAO-15-178. Washington, D.C.: February 19, 2015.
Flood Insurance: Forgone Premiums Cannot Be Measured and FEMA Should Validate and Monitor Data System Changes. GAO-15-111. Washington, D.C.: December 11, 2014.

Related GAO Products
Page 66 GAO-22-104079 FEMA Flood Maps
Climate Change: Better Management of Exposure to Potential Future Losses Is Needed for Federal Flood and Crop Insurance. GAO-15-28. Washington, D.C.: October 29, 2014.
National Flood Insurance Program: Additional Guidance on Building Requirements to Mitigate Agricultural Structures’ Damage in High-Risk Areas Is Needed. GAO-14-583. Washington, D.C.: June 30, 2014.
Overview of GAO’s Past Work on the National Flood Insurance Program. GAO-14-297R. Washington, D.C.: April 9, 2014.
High-Risk Series: An Update. GAO-13-283. Washington, D.C.: February 14, 2013.
Flood Insurance: Participation of Indian Tribes in Federal and Private Programs. GAO-13-226. Washington, D.C.: January 4, 2013.
Flood Insurance: More Information Needed on Subsidized Properties. GAO-13-607. Washington, D.C.: July 3, 2013.
FEMA and the Corps Have Taken Steps to Establish a Task Force, but FEMA Has Not Assessed the Costs of Collecting and Reporting All Levee-Related Concerns. GAO-11-689R. Washington, D.C.: July 29, 2011.
FEMA: Action Needed to Improve Administration of the National Flood Insurance Program. GAO-11-297. Washington, D.C.: June 9, 2011.
FEMA Flood Maps: Some Standards and Processes in Place to Promote Map Accuracy and Outreach, but Opportunities Exist to Address Implementation Challenges. GAO-11-17. Washington, D.C.: December 2, 2010.
Financial Management: Improvements Needed in National Flood Insurance Program’s Financial Controls and Oversight. GAO-10-66. Washington, D.C.: December 22, 2009.
Information on Proposed Changes to the National Flood Insurance Program. GAO-09-420R. Washington, D.C.: February 27, 2009.

Related GAO Products
Page 67 GAO-22-104079 FEMA Flood Maps
Natural Hazard Mitigation and Insurance: The United States and Selected Countries Have Similar Natural Hazard Mitigation Policies but Different Insurance Approaches. GAO-09-188R. Washington, D.C.: December 22, 2008.
Flood Insurance: FEMA’s Rate-Setting Process Warrants Attention. GAO-09-12. Washington, D.C.: October 31, 2008.
National Flood Insurance Program: Financial Challenges Underscore Need for Improved Oversight of Mitigation Programs and Key Contracts. GAO-08-437. Washington, D.C.: June 16, 2008.
National Flood Insurance Program: Greater Transparency and Oversight of Wind and Flood Damage Determinations Are Needed. GAO-08-28. Washington, D.C.: December 28, 2007.
GAO’S High-Risk Program. GAO-06-497T. Washington, D.C.: March 15, 2006.
Federal Emergency Management Agency: Improvements Needed to Enhance Oversight and Management of the National Flood Insurance Program. GAO-06-119. Washington, D.C.: October 18, 2005.
Flood Map Modernization: Program Strategy Shows Promise, but Challenges Remain. GAO-04-417. Washington, D.C.: March 31, 2004.
(104079)

The Government Accountability Office, the audit, evaluation, and investigative arm of Congress, exists to support Congress in meeting its constitutional responsibilities and to help improve the performance and accountability of the federal government for the American people. GAO examines the use of public funds; evaluates federal programs and policies; and provides analyses, recommendations, and other assistance to help Congress make informed oversight, policy, and funding decisions. GAO’s commitment to good government is reflected in its core values of accountability, integrity, and reliability.
The fastest and easiest way to obtain copies of GAO documents at no cost is through our website. Each weekday afternoon, GAO posts on its website newly released reports, testimony, and correspondence. You can also subscribe to GAO’s email updates to receive notification of newly posted products.
The price of each GAO publication reflects GAO’s actual cost of production and distribution and depends on the number of pages in the publication and whether the publication is printed in color or black and white. Pricing and ordering information is posted on GAO’s website, https://www.gao.gov/ordering.htm.
Place orders by calling (202) 512-6000, toll free (866) 801-7077, or TDD (202) 512-2537.
Orders may be paid for using American Express, Discover Card, MasterCard, Visa, check, or money order. Call for additional information.
Connect with GAO on Facebook, Flickr, Twitter, and YouTube. Subscribe to our RSS Feeds or Email Updates. Listen to our Podcasts. Visit GAO on the web at https://www.gao.gov.
Contact FraudNet:
Website: https://www.gao.gov/about/what-gao-does/fraudnet
Automated answering system: (800) 424-5454 or (202) 512-7700
A. Nicole Clowers, Managing Director, [email protected], (202) 512-4400, U.S. Government Accountability Office, 441 G Street NW, Room 7125, Washington, DC 20548
Chuck Young, Managing Director, [email protected], (202) 512-4800 U.S. Government Accountability Office, 441 G Street NW, Room 7149 Washington, DC 20548
Stephen J. Sanford, Managing Director, [email protected], (202) 512-4707 U.S. Government Accountability Office, 441 G Street NW, Room 7814, Washington, DC 20548
GAO’s Mission
Obtaining Copies of GAO Reports and Testimony Order by Phone
Connect with GAO
To Report Fraud, Waste, and Abuse in Federal Programs
Congressional Relations
Public Affairs
Strategic Planning and External Liaison
Please Print on Recycled Paper.