gap analysis of virginia’s policy … · web viewgap analysis of virginia’s policy landscape...
TRANSCRIPT
Attachment A - Section A
THE NGA CENTER FOR BEST PRACTICES SCIENCE, TECHNOLOGY, ENGINEERING AND MATH CENTER GRANT PROGRAM
GAP ANALYSIS OF VIRGINIA’S POLICY LANDSCAPE
SECTION A: REVIEW OF ECONOMIC AND EDUCATION INDICATORS
I. Introduction
As noted in NGA’s Building a Science, Technology, Engineering and Math Agenda, a key to developing a workforce with the knowledge and skills to compete is to strengthen science, technology, engineering and math (STEM) competencies in every K-12 student. Virginia has excelled at developing programs for gifted and talented students through outstanding Governor’s Schools, specialty centers and various acceleration and enrichment programs. We have also done a good job of producing and attracting college-educated scientists, engineers and other knowledge workers. However, we have fallen short in developing these core skills in the general student population, as evidenced by postsecondary remediation data and reports from college faculty and employers regarding the lack of core skills and abilities among high school graduates. We have identified career and technical education as a promising avenue for developing STEM literacy and other critical 21st Century skills through applied learning.
Virginia has serious gaps between workforce demand and supply in technical fields. The workforce shortages in these fields are hampering our ability to attract and retain traditional and new economy businesses throughout industry sectors and geographic areas. While knowledge workers at the upper end of the educational spectrum are needed to fuel innovation, skilled workers at pre-baccalaureate levels are needed to support the very businesses and industries in which innovation occurs.
We have targeted Virginia’s proposal to the National Governors Association toward development of model programs in career and technical education (CTE) to raise the quality of programs and to improve alignment with postsecondary expectations in education and the workplace. These programs will expand options for all students to acquire the knowledge and skills that will prepare them for multiple postsecondary pathways, especially for training toward high-wage, high-skill occupations in growing industries.
II. General economic and innovation indicators
Monitor Group: A Competitive Benchmarking of the Virginia Economy
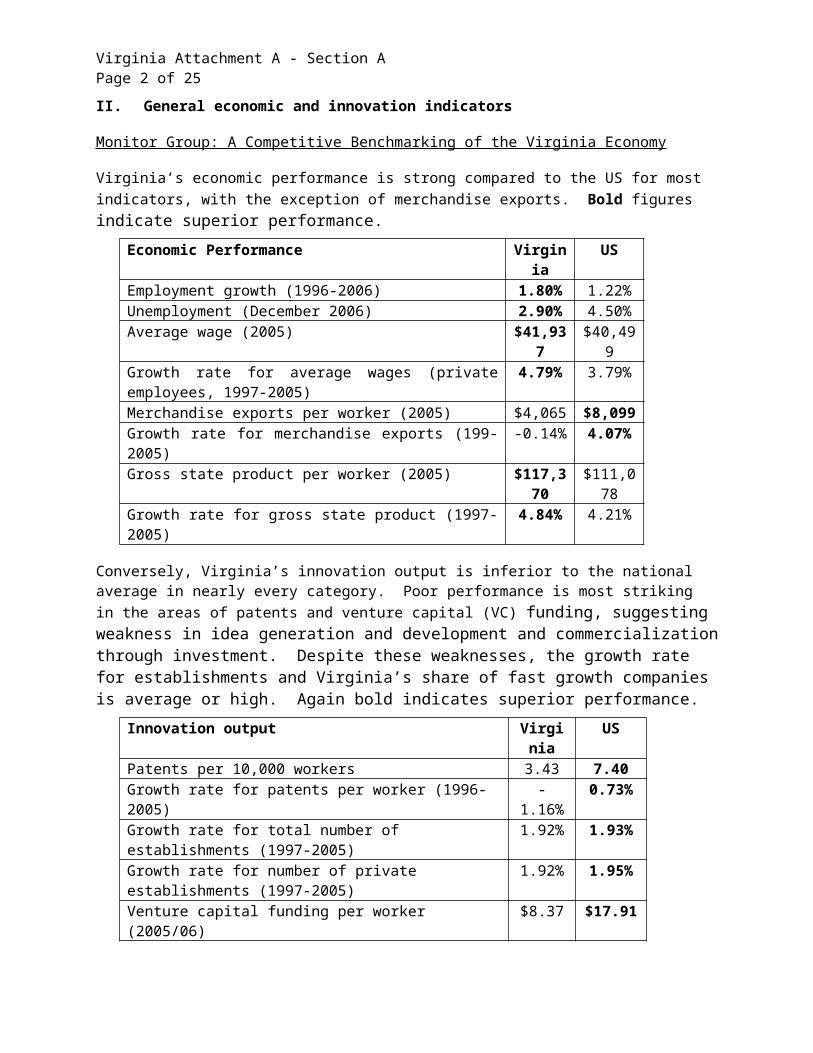
Virginia’s economic performance is strong compared to the US for most indicators, with the exception of merchandise exports. Bold figures indicate superior performance.
Economic Performance Virginia USEmployment growth (1996-2006) 1.80% 1.22%Unemployment (December 2006) 2.90% 4.50%Average wage (2005) $41,937 $40,499Growth rate for average wages (private employees, 1997-2005)
4.79% 3.79%
Merchandise exports per worker (2005) $4,065 $8,099Growth rate for merchandise exports (199-2005) -0.14% 4.07%Gross state product per worker (2005) $117,370 $111,078Growth rate for gross state product (1997-2005) 4.84% 4.21%
Virginia Attachment A - Section APage 2 of 16
Conversely, Virginia’s innovation output is inferior to the national average in nearly every category. Poor performance is most striking in the areas of patents and venture capital (VC) funding, suggesting weakness in idea generation and development and commercialization through investment. Despite these weaknesses, the growth rate for establishments and Virginia’s share of fast growth companies is average or high. Again bold indicates superior performance.
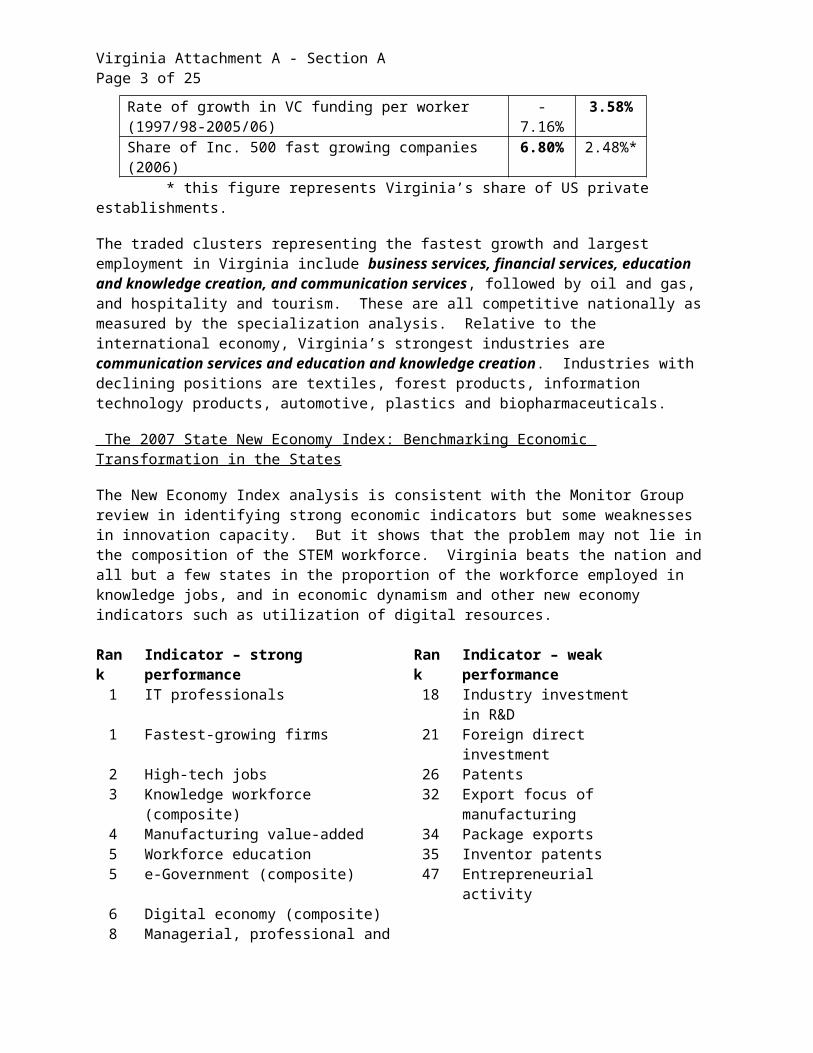
Innovation output Virginia USPatents per 10,000 workers 3.43 7.40Growth rate for patents per worker (1996-2005) -1.16% 0.73%Growth rate for total number of establishments (1997-2005) 1.92% 1.93%Growth rate for number of private establishments (1997-2005) 1.92% 1.95%Venture capital funding per worker (2005/06) $8.37 $17.91Rate of growth in VC funding per worker (1997/98-2005/06) -7.16% 3.58%Share of Inc. 500 fast growing companies (2006) 6.80% 2.48%*
* this figure represents Virginia’s share of US private establishments.
The traded clusters representing the fastest growth and largest employment in Virginia include business services, financial services, education and knowledge creation, and communication services, followed by oil and gas, and hospitality and tourism. These are all competitive nationally as measured by the specialization analysis. Relative to the international economy, Virginia’s strongest industries are communication services and education and knowledge creation. Industries with declining positions are textiles, forest products, information technology products, automotive, plastics and biopharmaceuticals.
The 2007 State New Economy Index: Benchmarking Economic Transformation in the States
The New Economy Index analysis is consistent with the Monitor Group review in identifying strong economic indicators but some weaknesses in innovation capacity. But it shows that the problem may not lie in the composition of the STEM workforce. Virginia beats the nation and all but a few states in the proportion of the workforce employed in knowledge jobs, and in economic dynamism and other new economy indicators such as utilization of digital resources.
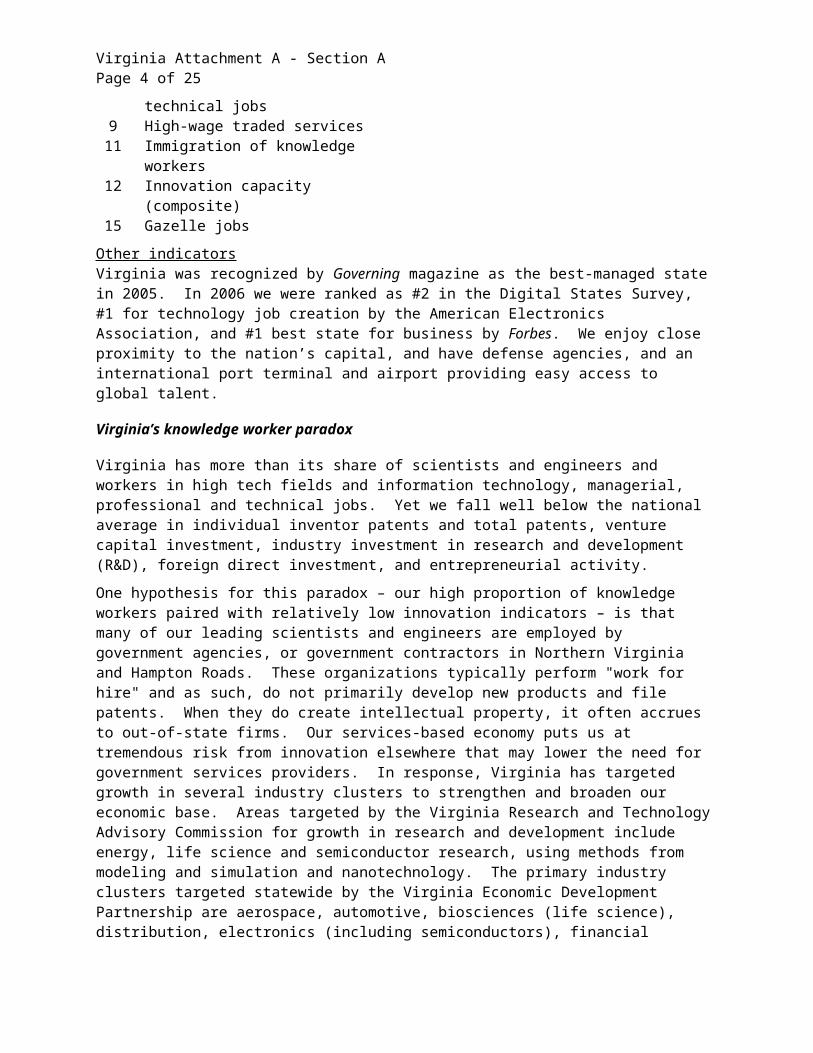
Rank Indicator – strong performance Rank Indicator – weak performance1 IT professionals 18 Industry investment in R&D1 Fastest-growing firms 21 Foreign direct investment2 High-tech jobs 26 Patents3 Knowledge workforce (composite) 32 Export focus of manufacturing4 Manufacturing value-added 34 Package exports5 Workforce education 35 Inventor patents5 e-Government (composite) 47 Entrepreneurial activity6 Digital economy (composite)8 Managerial, professional and technical
jobs9 High-wage traded services11 Immigration of knowledge workers12 Innovation capacity (composite)15 Gazelle jobs
Other indicatorsVirginia was recognized by Governing magazine as the best-managed state in 2005. In 2006 we were ranked as #2 in the Digital States Survey, #1 for technology job creation by the American Electronics Association, and #1 best state for business by Forbes. We enjoy close proximity to the nation’s capital,
Virginia Attachment A - Section APage 3 of 16
and have defense agencies, and an international port terminal and airport providing easy access to global talent.
Virginia’s knowledge worker paradox
Virginia has more than its share of scientists and engineers and workers in high tech fields and information technology, managerial, professional and technical jobs. Yet we fall well below the national average in individual inventor patents and total patents, venture capital investment, industry investment in research and development (R&D), foreign direct investment, and entrepreneurial activity.
One hypothesis for this paradox – our high proportion of knowledge workers paired with relatively low innovation indicators – is that many of our leading scientists and engineers are employed by government agencies, or government contractors in Northern Virginia and Hampton Roads. These organizations typically perform "work for hire" and as such, do not primarily develop new products and file patents. When they do create intellectual property, it often accrues to out-of-state firms. Our services-based economy puts us at tremendous risk from innovation elsewhere that may lower the need for government services providers. In response, Virginia has targeted growth in several industry clusters to strengthen and broaden our economic base. Areas targeted by the Virginia Research and Technology Advisory Commission for growth in research and development include energy, life science and semiconductor research, using methods from modeling and simulation and nanotechnology. The primary industry clusters targeted statewide by the Virginia Economic Development Partnership are aerospace, automotive, biosciences (life science), distribution, electronics (including semiconductors), financial services, food processing, motorsports and plastics. Regional industry clusters have also been identified and targeted for development, as noted in the following section. Virginia’s efforts to reinvigorate career and technical education will address these targeted industries as well as the immediate needs of Virginia’s leading employers in each region.
III. Education indicators related to STEM education agenda
Monitor Group: A Benchmarking of the Virginia Educational System
Virginia performs significantly better than the national average but below top states in most indicators of educational quality and educational attainment. This is true for graduation rates, postsecondary completion rates, NAEP test scores, SAT scores controlled for participation rates, and AP participation rates. Virginia’s high school graduation requirements match the State Scholars Core in number of years of math and science required, but Virginia does not identify the specific courses required for graduation in math (beyond Algebra I) and science (beyond “2 lab science courses”).
Measuring Up 2006: The State Report Card on Higher Education
The National Center for Public Policy and Higher Education identified the following strengths in Virginia’s higher education system, and in its K-12 system as it relates to college preparation:
Preparation
Eighth graders in Virginia perform well on national assessments in math, science, and reading. Over the past nine years, 8th graders’ performance on the science assessments has improved substantially, exceeding the nationwide increase on this measure.
Virginia has consistently been a top performer on the very large proportions of 11th and 12th graders who take and score well on Advanced Placement tests.
Completion
Virginia Attachment A - Section APage 4 of 16
Compared with other states, a large percentage of first-year students at community colleges return for their second year. Virginia has consistently performed very well on the percentage of freshmen at four-year colleges returning for their sophomore year.
Benefits
Compared with other states, a very high proportion of residents have a bachelor’s degree, and this substantially strengthens the state economy. Virginia does a good job in both producing and attracting highly educated citizens.
The Center identified the following weaknesses:
Preparation
Low-income 8th graders perform very poorly on national math assessments.
Only fair percentages of 11th and 12th graders score well on college entrance exams, but these percentages have increased substantially over the past 12 years.
Participation
Compared with other states, the chance of a 9th grader enrolling in college within four years is mediocre, primarily because relatively few high school graduates go on to college directly after high school.
The percentage of working-age adults enrolled in college-level education or training has declined over the past decade—exceeding the nationwide decline on this measure.
Among young adults (ages 18-24), there are still substantial gaps in college participation between whites and non-whites. In addition, young adults from high-income families are about four times as likely as those from low-income families to attend college—the widest gap in the nation on this measure.
Affordability
Net college costs for students from low- and middle-income families to attend community colleges represent about one-third of their annual family income. (Net college costs equal tuition, room, and board after financial aid.) For these students at public four year colleges and universities, net college costs represent 41% of their annual family income. These two sectors enroll 82% of the state’s college students.
The state’s investment in need-based financial aid is very low, even though Virginia has increased this investment since 1992.
Virginia ranks high for educational attainment, with 35% of the working-age population holding bachelors degrees or higher, placing us sixth in the nation.
The College Board: 2007 AP Report to the Nation
Virginia has joined a select handful of states in which 20 percent or more of high school seniors earned a grade of 3 or more on an Advanced Placement (AP) examination, as reported in the College Board’s third annual Advanced Placement Report to the Nation. Last year, 20.7 percent of the Commonwealth’s public high school seniors earned a grade of 3 or better on at least one AP exam, compared with 19.3 in 2005, and 15.9 percent in 2000. Only three states, New York, Maryland, and Utah, had a higher percentage of seniors earning grades of 3 or better on AP tests during 2006. The national average was 14.8 percent.
Education Week: Quality Counts
Virginia Attachment A - Section APage 5 of 16
Virginia ranked first in the nation on the new “Chance for Success” index, indicating that the typical student in the commonwealth “enjoys higher achievement and is more likely to finish high school and continue on to college than in other states.” The component indicators most relevant to Virginia’s STEM agenda include middle school math, high school graduation, postsecondary participation, and adult educational attainment.
The report also notes that Virginia does well with alignment of K-12 with workforce expectations (defines workforce readiness as distinct from college readiness, offers high school diploma with career specialization, has K-12 path for industry-recognized certificate or license, and has K-12 pathway to earn career-tech credits for postsecondary credit. However, the report identified deficiencies in alignment with postsecondary education (college readiness definition, college-prep requirement for high school graduation, alignment of high school credits with postsecondary system, alignment of high school assessments with postsecondary system, and use of high school assessments for postsecondary decisions.) Overall, Virginia is one of 10 states with 9 or more of 15 recommended policies in place for alignment of K-12 with early education, postsecondary education and workplace expectations.
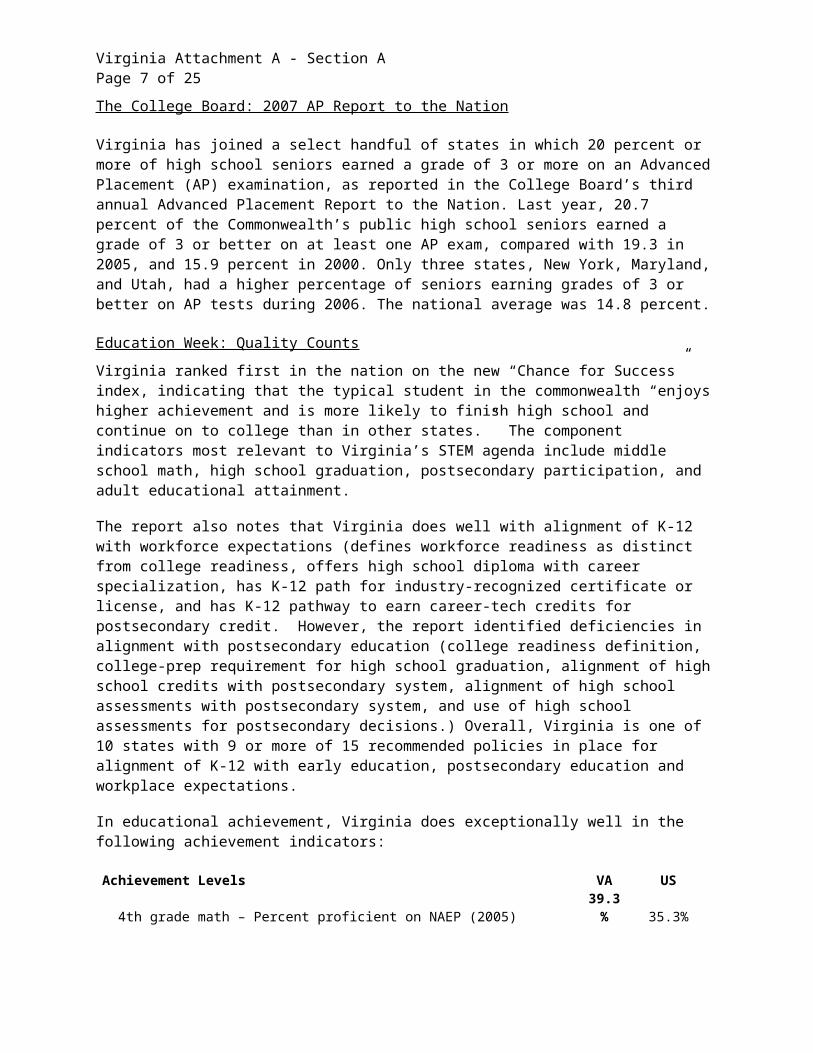
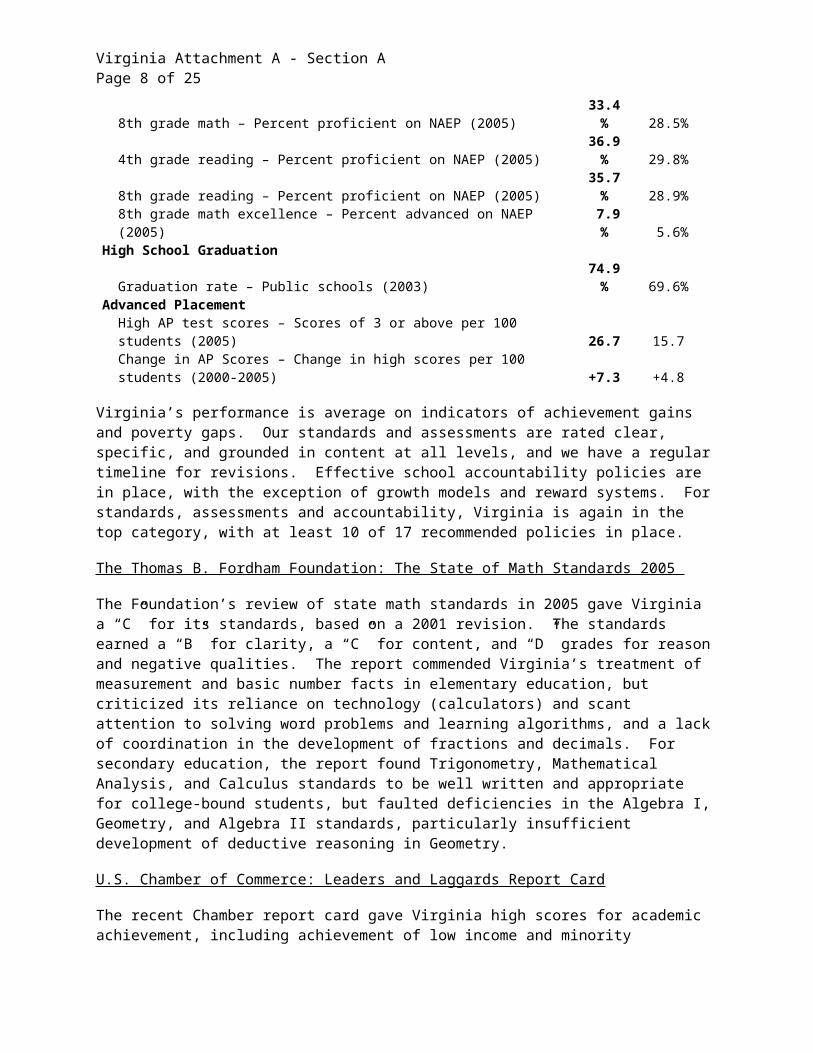
In educational achievement, Virginia does exceptionally well in the following achievement indicators:
Achievement Levels VA US4th grade math – Percent proficient on NAEP (2005) 39.3% 35.3%8th grade math – Percent proficient on NAEP (2005) 33.4% 28.5%4th grade reading – Percent proficient on NAEP (2005) 36.9% 29.8%8th grade reading – Percent proficient on NAEP (2005) 35.7% 28.9%8th grade math excellence – Percent advanced on NAEP (2005) 7.9% 5.6%
High School GraduationGraduation rate – Public schools (2003) 74.9% 69.6%
Advanced PlacementHigh AP test scores – Scores of 3 or above per 100 students (2005) 26.7 15.7Change in AP Scores – Change in high scores per 100 students (2000-2005) +7.3 +4.8
Virginia’s performance is average on indicators of achievement gains and poverty gaps. Our standards and assessments are rated clear, specific, and grounded in content at all levels, and we have a regular timeline for revisions. Effective school accountability policies are in place, with the exception of growth models and reward systems. For standards, assessments and accountability, Virginia is again in the top category, with at least 10 of 17 recommended policies in place.
The Thomas B. Fordham Foundation: The State of Math Standards 2005
The Foundation’s review of state math standards in 2005 gave Virginia a “C” for its standards, based on a 2001 revision. The standards earned a “B” for clarity, a “C” for content, and “D” grades for reason and negative qualities. The report commended Virginia’s treatment of measurement and basic number facts in elementary education, but criticized its reliance on technology (calculators) and scant attention to solving word problems and learning algorithms, and a lack of coordination in the development of fractions and decimals. For secondary education, the report found Trigonometry, Mathematical Analysis, and Calculus standards to be well written and appropriate for college-bound students, but faulted deficiencies in the Algebra I, Geometry, and Algebra II standards, particularly insufficient development of deductive reasoning in Geometry.
U.S. Chamber of Commerce: Leaders and Laggards Report Card

Virginia Attachment A - Section APage 6 of 16
The recent Chamber report card gave Virginia high scores for academic achievement, including achievement of low income and minority students, return on investment, rigor of standards, postsecondary and workforce readiness, 21st Century teaching force, and flexibility in management and policy. Virginia was awarded a “C” for data quality and a “D” for truth-in-advertising about student proficiency, based on discrepancies between proficiency rates on state math and reading assessments and the comparable NAEP assessments.
IV. Demand vs. supply of STEM educated workforce
State reports: targeted occupations and demand
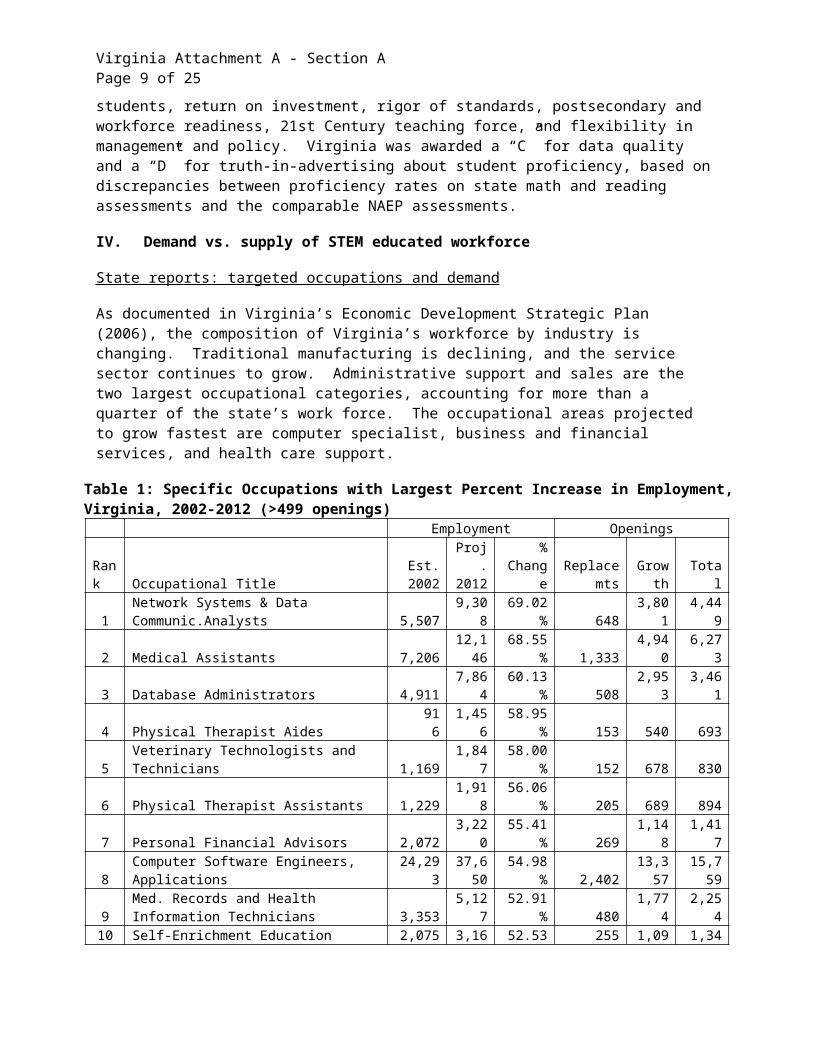
As documented in Virginia’s Economic Development Strategic Plan (2006), the composition of Virginia’s workforce by industry is changing. Traditional manufacturing is declining, and the service sector continues to grow. Administrative support and sales are the two largest occupational categories, accounting for more than a quarter of the state’s work force. The occupational areas projected to grow fastest are computer specialist, business and financial services, and health care support.
Table 1: Specific Occupations with Largest Percent Increase in Employment, Virginia, 2002-2012 (>499 openings)Employment Openings
Rank Occupational Title
Est.2002
Proj.2012
% Change Replacemts Growth Total
1 Network Systems & Data Communic.Analysts 5,507 9,308 69.02% 648 3,801 4,449 2 Medical Assistants 7,206 12,146 68.55% 1,333 4,940 6,273 3 Database Administrators 4,911 7,864 60.13% 508 2,953 3,461 4 Physical Therapist Aides 916 1,456 58.95% 153 540 693 5 Veterinary Technologists and Technicians 1,169 1,847 58.00% 152 678 830 6 Physical Therapist Assistants 1,229 1,918 56.06% 205 689 894 7 Personal Financial Advisors 2,072 3,220 55.41% 269 1,148 1,417 8 Computer Software Engineers, Applications 24,293 37,650 54.98% 2,402 13,357 15,759 9 Med. Records and Health Information Technicians 3,353 5,127 52.91% 480 1,774 2,254
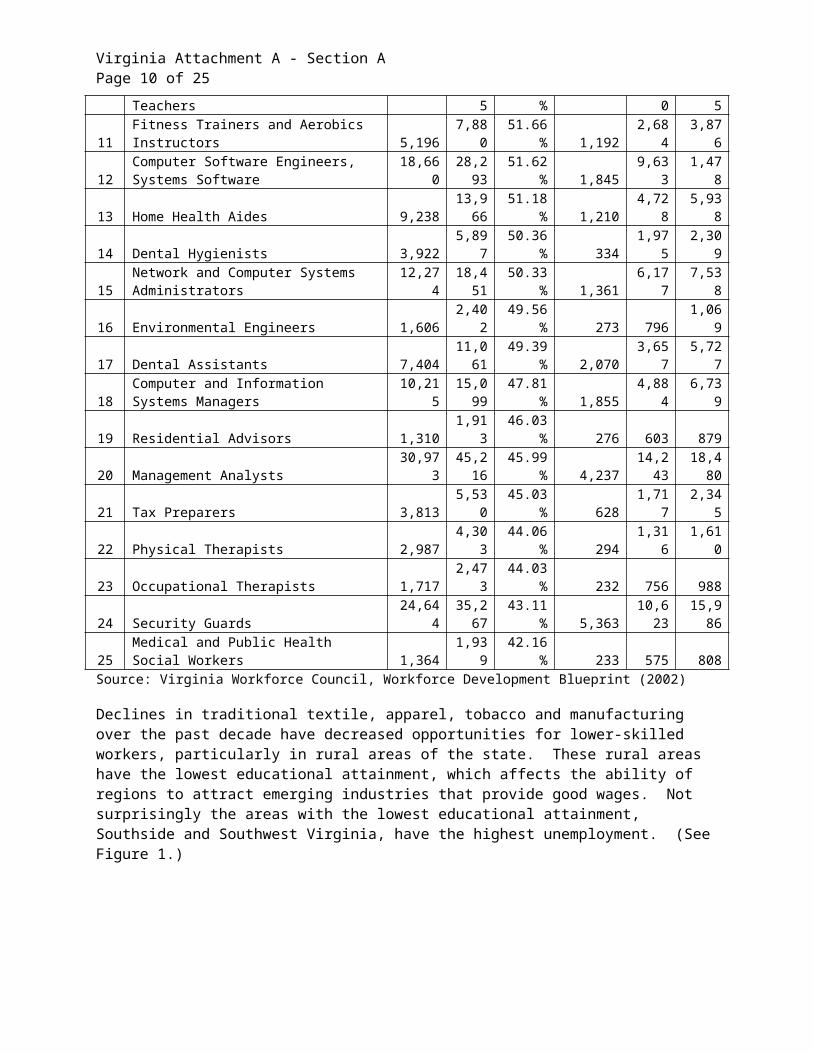
10 Self-Enrichment Education Teachers 2,075 3,165 52.53% 255 1,090 1,345 11 Fitness Trainers and Aerobics Instructors 5,196 7,880 51.66% 1,192 2,684 3,876 12 Computer Software Engineers, Systems Software 18,660 28,293 51.62% 1,845 9,633 1,478 13 Home Health Aides 9,238 13,966 51.18% 1,210 4,728 5,938 14 Dental Hygienists 3,922 5,897 50.36% 334 1,975 2,309 15 Network and Computer Systems Administrators 12,274 18,451 50.33% 1,361 6,177 7,538 16 Environmental Engineers 1,606 2,402 49.56% 273 796 1,069 17 Dental Assistants 7,404 11,061 49.39% 2,070 3,657 5,727 18 Computer and Information Systems Managers 10,215 15,099 47.81% 1,855 4,884 6,739 19 Residential Advisors 1,310 1,913 46.03% 276 603 879 20 Management Analysts 30,973 45,216 45.99% 4,237 14,243 18,480 21 Tax Preparers 3,813 5,530 45.03% 628 1,717 2,345 22 Physical Therapists 2,987 4,303 44.06% 294 1,316 1,610 23 Occupational Therapists 1,717 2,473 44.03% 232 756 988 24 Security Guards 24,644 35,267 43.11% 5,363 10,623 15,986 25 Medical and Public Health Social Workers 1,364 1,939 42.16% 233 575 808 Source: Virginia Workforce Council, Workforce Development Blueprint (2002)
Declines in traditional textile, apparel, tobacco and manufacturing over the past decade have decreased opportunities for lower-skilled workers, particularly in rural areas of the state. These rural areas have the lowest educational attainment, which affects the ability of regions to attract emerging industries that
Virginia Attachment A - Section APage 7 of 16
provide good wages. Not surprisingly the areas with the lowest educational attainment, Southside and Southwest Virginia, have the highest unemployment. (See Figure 1.)
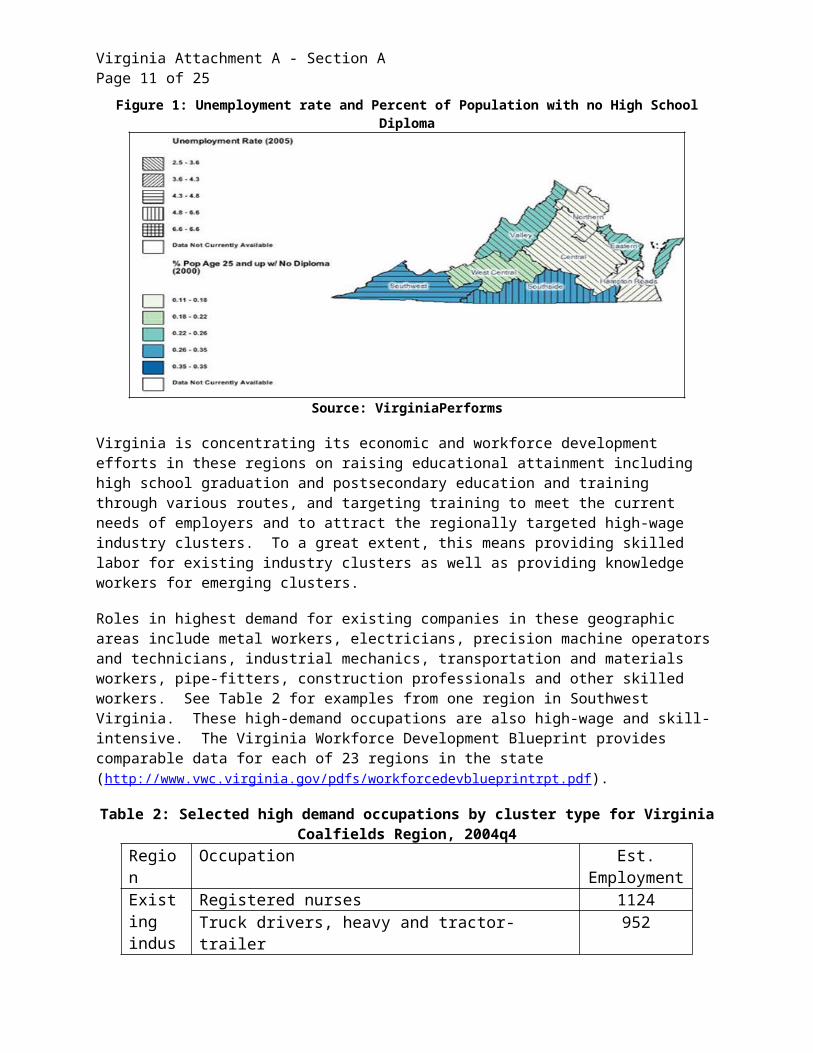
Figure 1: Unemployment rate and Percent of Population with no High School Diploma
Source: VirginiaPerforms
Virginia is concentrating its economic and workforce development efforts in these regions on raising educational attainment including high school graduation and postsecondary education and training through various routes, and targeting training to meet the current needs of employers and to attract the regionally targeted high-wage industry clusters. To a great extent, this means providing skilled labor for existing industry clusters as well as providing knowledge workers for emerging clusters.
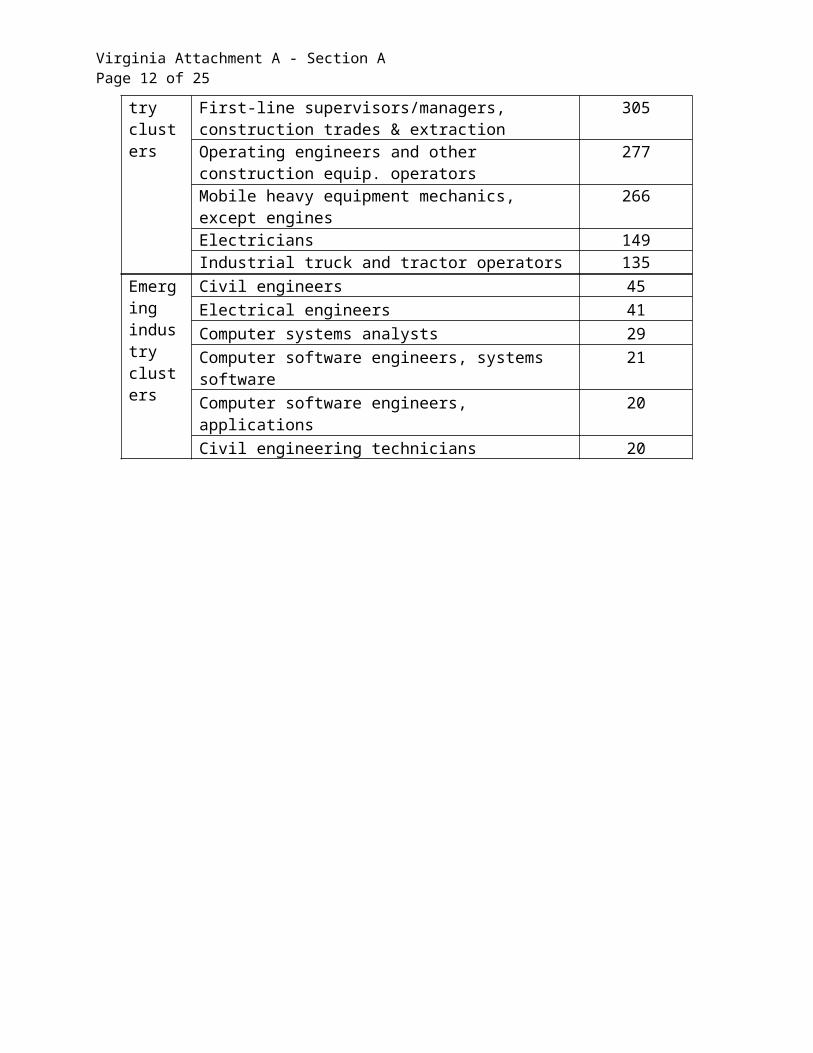
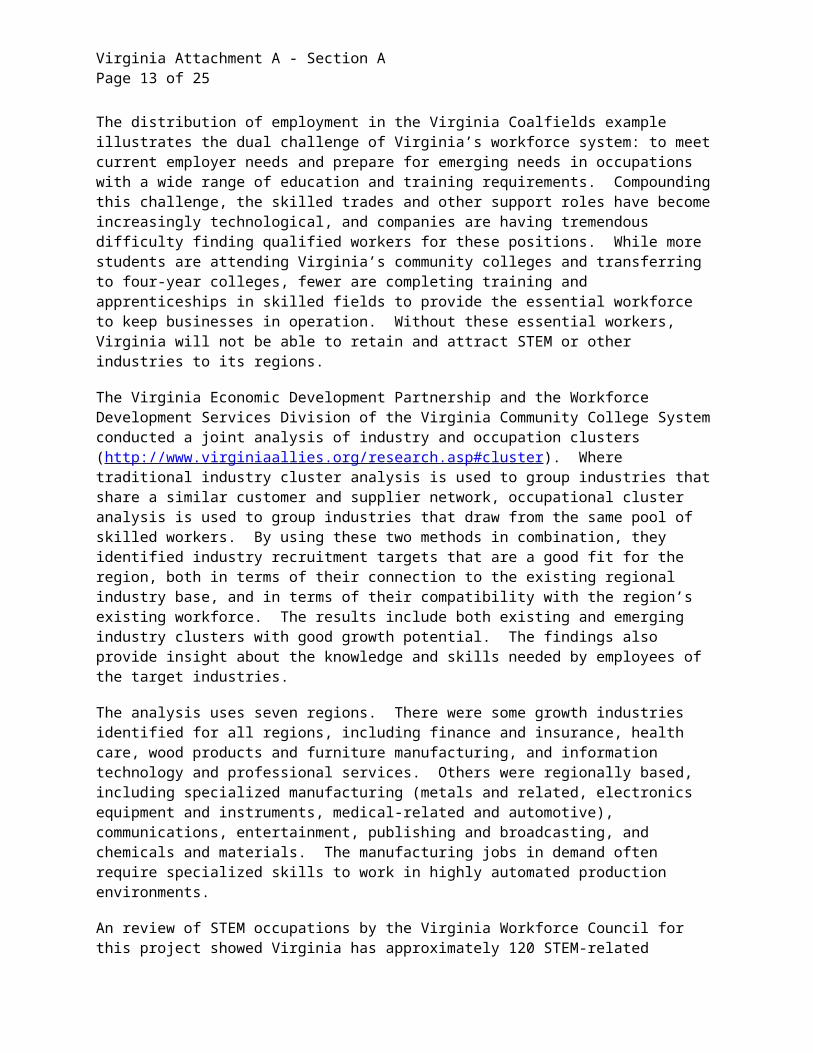
Roles in highest demand for existing companies in these geographic areas include metal workers, electricians, precision machine operators and technicians, industrial mechanics, transportation and materials workers, pipe-fitters, construction professionals and other skilled workers. See Table 2 for examples from one region in Southwest Virginia. These high-demand occupations are also high-wage and skill-intensive. The Virginia Workforce Development Blueprint provides comparable data for each of 23 regions in the state (http://www.vwc.virginia.gov/pdfs/workforcedevblueprintrpt.pdf).
Table 2: Selected high demand occupations by cluster type for Virginia Coalfields Region, 2004q4Region Occupation Est. EmploymentExistingindustry clusters
Registered nurses 1124Truck drivers, heavy and tractor-trailer 952First-line supervisors/managers, construction trades & extraction
305
Operating engineers and other construction equip. operators 277Mobile heavy equipment mechanics, except engines 266Electricians 149Industrial truck and tractor operators 135
Emergingindustry clusters
Civil engineers 45Electrical engineers 41Computer systems analysts 29Computer software engineers, systems software 21Computer software engineers, applications 20
Virginia Attachment A - Section APage 8 of 16
Civil engineering technicians 20
Virginia Attachment A - Section APage 9 of 16
The distribution of employment in the Virginia Coalfields example illustrates the dual challenge of Virginia’s workforce system: to meet current employer needs and prepare for emerging needs in occupations with a wide range of education and training requirements. Compounding this challenge, the skilled trades and other support roles have become increasingly technological, and companies are having tremendous difficulty finding qualified workers for these positions. While more students are attending Virginia’s community colleges and transferring to four-year colleges, fewer are completing training and apprenticeships in skilled fields to provide the essential workforce to keep businesses in operation. Without these essential workers, Virginia will not be able to retain and attract STEM or other industries to its regions.
The Virginia Economic Development Partnership and the Workforce Development Services Division of the Virginia Community College System conducted a joint analysis of industry and occupation clusters (http://www.virginiaallies.org/research.asp#cluster). Where traditional industry cluster analysis is used to group industries that share a similar customer and supplier network, occupational cluster analysis is used to group industries that draw from the same pool of skilled workers. By using these two methods in combination, they identified industry recruitment targets that are a good fit for the region, both in terms of their connection to the existing regional industry base, and in terms of their compatibility with the region’s existing workforce. The results include both existing and emerging industry clusters with good growth potential. The findings also provide insight about the knowledge and skills needed by employees of the target industries.
The analysis uses seven regions. There were some growth industries identified for all regions, including finance and insurance, health care, wood products and furniture manufacturing, and information technology and professional services. Others were regionally based, including specialized manufacturing (metals and related, electronics equipment and instruments, medical-related and automotive), communications, entertainment, publishing and broadcasting, and chemicals and materials. The manufacturing jobs in demand often require specialized skills to work in highly automated production environments.
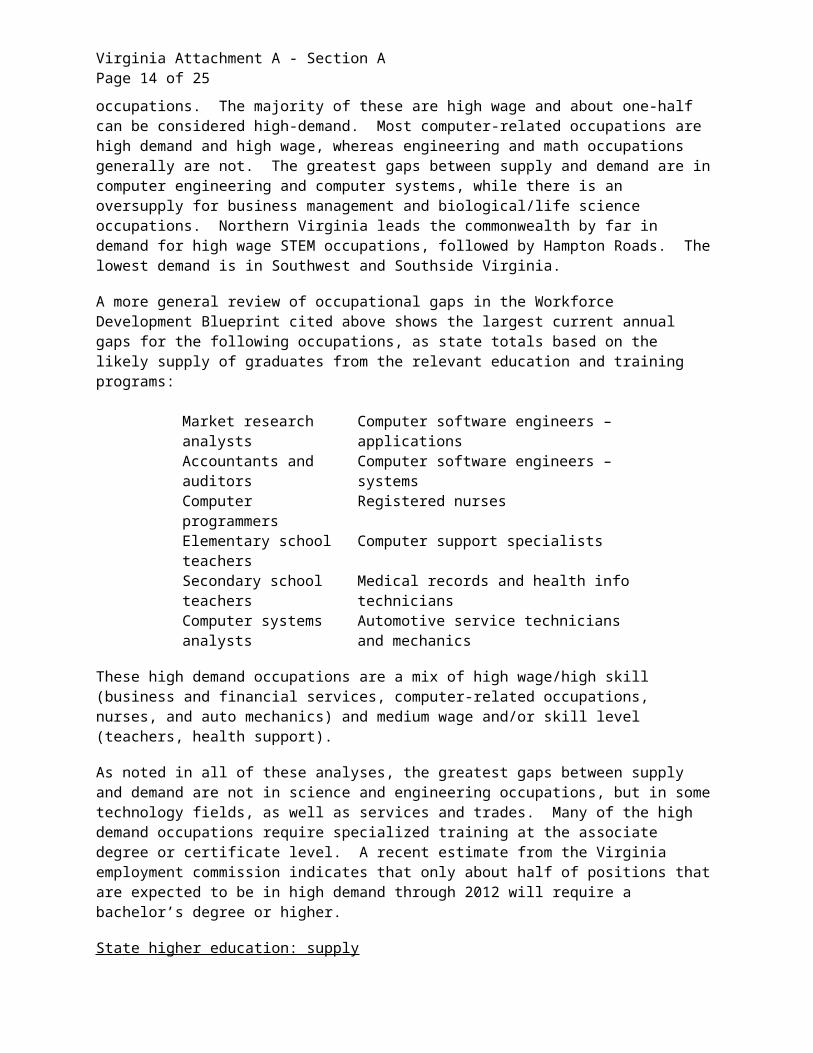
An review of STEM occupations by the Virginia Workforce Council for this project showed Virginia has approximately 120 STEM-related occupations. The majority of these are high wage and about one-half can be considered high-demand. Most computer-related occupations are high demand and high wage, whereas engineering and math occupations generally are not. The greatest gaps between supply and demand are in computer engineering and computer systems, while there is an oversupply for business management and biological/life science occupations. Northern Virginia leads the commonwealth by far in demand for high wage STEM occupations, followed by Hampton Roads. The lowest demand is in Southwest and Southside Virginia.
A more general review of occupational gaps in the Workforce Development Blueprint cited above shows the largest current annual gaps for the following occupations, as state totals based on the likely supply of graduates from the relevant education and training programs:
Market research analysts Computer software engineers – applications Accountants and auditors Computer software engineers – systems Computer programmers Registered nursesElementary school teachers
Computer support specialists
Secondary school teachers Medical records and health info techniciansComputer systems analysts Automotive service technicians and mechanics
Virginia Attachment A - Section APage 10 of 16
These high demand occupations are a mix of high wage/high skill (business and financial services, computer-related occupations, nurses, and auto mechanics) and medium wage and/or skill level (teachers, health support).
As noted in all of these analyses, the greatest gaps between supply and demand are not in science and engineering occupations, but in some technology fields, as well as services and trades. Many of the high demand occupations require specialized training at the associate degree or certificate level. A recent estimate from the Virginia employment commission indicates that only about half of positions that are expected to be in high demand through 2012 will require a bachelor’s degree or higher.
State higher education: supply
According to NSF analyses of U.S. Department of Education data, Virginia is in the top quartile of states for science and engineering degrees as a percent of all degrees conferred (2000). Between 2001 and 2005 the number of college students enrolled in science, technology, and mathematics-related subjects graduating within three years after choosing their major has remained relatively constant. Also constant has been the attrition in these majors – approximately half of students who declare STEM majors do not graduate in those disciplines within 3 years of declaring.
Although Virginia ranks well relative to other states in its production and supply of scientists and engineers, we also realize that in comparison to international competitors we are far behind. Virginia’s colleges and universities have initiated several programs to encourage students to select and persevere in STEM fields, especially underrepresented populations, and some of these show promising results. In addition to the efforts of Virginia’s public and private four-year colleges, our community colleges play a large role in preparation of the STEM and related workforce, often closely tied to local and regional industry needs. STEM programs comprise a significant part of the offerings at all 23 community colleges, with over 25 academic programs in STEM-related disciplines. In 2005-06, almost 19,000 students were enrolled in Math, Science and Technology degree programs, and in 2004-05 over 1,500 students completed programs in Science and Engineering. The community colleges also offer certificates and diplomas in closely related program areas including biomedical technology, engineering technology and modeling and simulation. Additional efforts are underway to examine and improve the preparation of students in K-12 education for additional study in STEM disciplines.
Misalignment: skilled workforce
As noted above, Virginia does a relatively good job of producing and attracting workers at the most highly educated levels in STEM fields, including scientists and engineers. We are less successful in developing workers with specialized postsecondary and occupational training such as technicians, technologists and skilled labor. At a recent Governor’s Manufacturing Summit researchers projected that approximately 40% of the skilled labor workforce is expected to retire in the next five years, and the pipeline to replace these workers is inadequate. The Virginia Biotechnology Association notes that Virginia anticipates more than 100,000 retirements among advanced manufacturing workers (including 45,000 technically skilled workers) over the coming decade and a major surge of demand for skilled labor as our state’s bioscience, pharmaceutical, and semiconductor companies continue to expand their operations.
Virginia Attachment A - Section APage 11 of 16
V. Student achievement and attainment in STEM education vs. postsecondary and workplace expectations
Several efforts are underway in Virginia to identify gaps between K-12 student achievement and postsecondary education and workplace expectations.
Virginia has joined the American Diploma Project Network (ADP) and is in the process of aligning state Mathematics and English/Language Arts Standards of Learning with Achieve’s ADP benchmarks. We are currently participating in the Alignment Institutes, and completed the first institute in March. The remaining institutes will take place in July and September. As part of this process, 30 colleges including ten public four-year institutions, ten independent four-year institutions and ten community colleges are providing feedback on the areas in which they identify weakness in student preparation, skills and abilities. Survey responses and results of faculty discussions have been collected and are now in process of being analyzed. The alignment team’s work will conclude this fall with recommendations to the state Board of Education for revisions to the Standards of Learning.
Virginia has also entered a partnership with NASA to review state science and engineering program standards. NASA has provided a scientist on loan to the office of the Secretary of Education to convene review panels of industry, federal lab and higher education representatives to identify the expectations for all students in science and engineering, to compare those expectations with existing competencies and standards, and to identify any gaps between the two.
As part of our NGA Honor States Grant funded by the Bill and Melinda Gates Foundation, we are undertaking a study of remediation in community colleges. This study is designed to identify the weaknesses in high school preparation that result in the need for developmental coursework in math and English at the college level.
The Board of Education has directed the Department of Education to conduct a study of the association between student scale scores on Standards of Learning assessments in high school and the successful completion of first-semester college courses, to determine whether there is a scale score that represents readiness for credit-bearing college-level work.
All three of these efforts are currently in progress and results are not yet available. However, the following data shed some light on the gap, and recent progress, in meeting postsecondary expectations:
Remediation rates for entering college students were 21.6% in 2005 and 18.5% in 2006 (Percentage of recent high school graduates entering higher education requiring remediation in reading, writing, or mathematics).
The proportion of high school students graduating with an Advanced Studies Diploma was 46.7% in 2005 and 48.2% in 2006. The Advanced Studies Diploma exceeds the State Scholars Core.
The percentage of students taking college-level coursework in high school rose from 17% in 2005 to 19% in 2006 and continues to grow, with more students taking Advanced Placement, dual enrollment and International Baccalaureate programs.
The number of students earning industry credentials in high school rose from less than 6,400 to over 10,000 from 2005 to 2006.
Virginia Attachment A - Section APage 12 of 16
Researchers at the Weldon Cooper Center at the University of Virginia interviewed over 500 employers in Virginia to find out which skills employers looked for in their entry-level employees. Over a period of 3 ½ years, a study was conducted that captured the thoughts of employers regarding entry-level jobs requiring less than a four-year college degree. The results of that study were summarized in Virginia’s Changing Workplace: Employers Speak. This study provided the foundation for the Virginia’s Workplace Readiness Skills, developed by the Virginia Beach City Public Schools’ Office of Technical and Career Education through a grant from Opportunity Inc., Hampton Roads’ Workforce Development Board. The 13 Workplace Readiness Skills cover reading, writing, math, speaking and listening, computer literacy, reasoning, problem-solving and decision-making, “big picture” understanding, work ethic, attitude, independence and initiative, self-presentation, attendance and teamwork. Detailed standards for each skill, along with strategies, exercises and many related resources, are available at http://www.thecapcenter.com/workplace/ and http://www.cteresource.org/publications/featured/wpr/index.html. These skills have been incorporated into the required competencies in Virginia’s career and technical education programs for public schools.
VI. Evaluation of current policies governing K-12 STEM education
The data presented above point to several strengths and weaknesses in Virginia’s STEM education system and policy framework.
Readiness for postsecondary STEM education: course requirements, standards and assessments
Virginia’s Advanced Studies Diploma requirements provide solid preparation for postsecondary STEM education. Current initiatives underway to promote readiness for all students include participation in the American Diploma Project Network to develop a common standard for college readiness across K-12, higher ed and the business community; and the State Scholars Initiative to increase the number of students taking a rigorous course of study in high school. The Board of Education’s study of the predictive value of SOL scale scores for success in the first semester of college will also help students and educators peg the level of achievement for which they are aiming. Alignment of assessments with revised standards will follow adoption of the standards. The minimum requirements for graduation with a Standard Diploma do not match up well with college readiness standards.
The commonwealth is currently setting the bar higher for Standard Diploma students with Commonwealth Scholars and newly-authorized Technical and Advanced Technical Diplomas, but has yet to grapple with whether to raise the floor so that all students graduate ready for postsecondary education and training. The Board of Education will also have to determine whether to adjust passing scores on standardized assessments to align required knowledge for college courses with graduation requirements.
Readiness for the STEM workforce: academic and technical preparation through CTE
Many of Virginia’s career and technical education (CTE) programs are adopting the tech-prep model of integrated academics and career and technical education, work-based learning, and transition agreements to postsecondary education, in the context of well-articulated career pathways. This approach will be the focus of our Perkins proposal under the new reauthorization. CTE programs use industry-validated competency lists, crosswalk competencies with Standards of Learning, and incorporate Virginia’s Workplace Readiness Skills in their competencies. There is an increased emphasis in our CTE programs on achievement of a degree, certificate or credential, and a focus on high skill, high wage, high demand occupations.
The General Assembly passed legislation this year requiring the Board of Education to approve a new Technical Diploma, with requirements at or above the level of the current Standard Diploma plus a CTE
Virginia Attachment A - Section APage 13 of 16
course sequence. The Governor amended the legislation to include a second new diploma, the Advanced Technical, which would mirror the current Advanced Studies Diploma requirements and add a CTE sequence. The Governor is encouraging the Board of Education to set the requirements for the Standard Technical Diploma at least at the level of the State Scholars Core, to ensure that students who earn this diploma will be prepared for multiple postsecondary pathways. These new diplomas will help Virginia raise the profile of career and technical education, will encourage students to strive for higher academic achievement along with CTE course completion, and will help to populate career pathways in high-demand fields for the commonwealth. However, there continues to be significant unmet demand for skilled workers throughout the commonwealth, and concerted efforts to encourage more students to gain high-demand skills will be needed to bridge this gap.
The P-16 Council recommended that the Board of Education consider requiring all graduates, not only those in CTE programs, to demonstrate mastery of Virginia’s 13 Workplace Readiness Skills. In addition, Virginia pioneered the Career Readiness Certificate that has been adopted by ACT nationally, using the Work Keys assessments. These assessments and certificates, accepted by many Virginia employers, are administered through our community colleges and other sites and are available to high school students.
Participation in postsecondary education
Participation of young adults in postsecondary education is low (34%) relative to top states (41%), and as noted above there are troubling gaps in participation between whites and other ethnic groups, and between high-income and low-income students. Efforts are underway to encourage all high school graduates to pursue postsecondary education and training, through communications, financial aid, college awareness programs, college transition programs, career pathways, career coaches in high schools, and articulation and transfer agreements, in addition to improved preparation. More efforts are needed in these areas.
Higher education research infrastructure
Virginia recognizes the importance of a well-developed infrastructure for scientific research, with close collaboration between leading research centers and industry. We have invested in seed grant programs to help universities strengthen promising research programs in strategic areas of investigation, with the assistance of experts from the National Science Foundation and leading research institutes nationally. Governor Mark Warner convened a blue ribbon panel to review Virginia’s top academic research programs for their potential to be national and international leaders in their fields. The most promising programs received funds for faculty recruitment packages, graduate student aid, laboratory equipment, and new research facilities in a $500 million public-private partnership in 2006. Governor Kaine has continued funding the research initiative, with investments targeted to strategic industries and regions.
The Commonwealth Technology Research Fund was established to attract public and private research funding for institutions of higher education, in order to increase technological and economic development in Virginia. The Fund has four components:
1) Matching Funds Program to leverage federal and private research dollars. Awards from this program shall be contingent upon the approval of the applicant’s grant proposal for federal or private funds;
2) Strategic Enhancement Program to upgrade the research capacity of those academic departments that have demonstrated the ability to perform innovative research in technology fields with strong potential to contribute to economic development in the Commonwealth;
3) Industry Inducement Program to upgrade research capacity in key departments of the institutions in order to attract specific companies to locate or expand in Virginia; and
Virginia Attachment A - Section APage 14 of 16
4) Technology Commercialization Program to enhance the capability of the institutions of higher education to commercialize technologies developed through their research.
The fund is administered by the Virginia Research and Technology Advisory Commission (VRTAC) and the Innovative Technology Authority. VRTAC ensures business input into allocation of research infrastructure funds, and encourages multi-university collaboration where synergies may exist. All awards from the fund must be matched at least 1-to-1 with private or institutional contributions. At present VRTAC is emphasizing opportunities in energy, life science and semiconductor research, using methods from modeling and simulation and nanotechnology.
Other policy considerations
Other policy gaps identified in national reviews include the lack of a formal definition of school readiness; the lack of a formal definition of college readiness; lack of alignment between secondary and postsecondary systems in credits, course requirements and assessments; failure to use growth models in state accountability system; lack of rewards for high performing schools; lack of vertically-equated scores across elementary grades, and the absence of a graduation rate measure in individual school and division accountability measures. Virginia is currently developing definitions for school readiness and college readiness through our early childhood and P-16/American Diploma Project efforts. Alignment between secondary and postsecondary sectors is central to the ADP commitments. Governor Kaine and the Board of Education are currently developing incentive and reward systems for excellence in school performance. And the Board of Education has re-opened the Standards of Accreditation regulations that govern the state accountability system. There will be significant open discussion over the next year on the accountability provisions, including consideration of the use of growth models and graduation rates in accreditation decisions, as these rules proceed through the regulatory process.
VII. STEM education redesign agenda
A. Align K-12 STEM standards and assessments with postsecondary and workforce expectations for what high school graduates know and can do.
1. Align standards with international benchmarks through state-level participation in international assessments. Virginia is exploring a 2009 commitment to participate in the 2011 TIMSS administration.
2. Align K-12 expectations with all postsecondary pathways. Virginia is participating in the American Diploma Project Network to align K-12 standards and assessments with postsecondary and workplace expectations, and in a partnership with NASA to review science (starting with physics and chemistry) and engineering standards.
3. Align STEM expectations between elementary, middle and high school levels to create a coherent K-12 system. Virginia’s Standards of Learning standards, curriculum frameworks and assessments serve to align instruction vertically among grade levels.
B. Examine and increase the state’s internal capacity to improve teaching and learning.
1. Support the continued development of a virtual P-16 longitudinal data system to track preparation of students, including those in STEM fields. Virginia continues to pursue resolution to legal barriers in sharing data across educational agencies. Significant progress has been made in overcoming technical barriers and in developing a robust K-12 longitudinal data system. Robust higher education and teacher preparation information systems are also in place.
Virginia Attachment A - Section APage 15 of 16
2. Develop a communication strategy to engage the public in the urgency of improving STEM education. Virginia will develop a multi-faceted communication plan to reach key audiences with this message.
3. Support the P-16 Education Council in its leadership of the alignment of expectations throughout the education system and the workplace, including STEM expectations. Governor Kaine has announced his intention to submit legislation to continue the P-16 Council in statute. The Council will be charged with overseeing the implementation of the commonwealth’s STEM agenda.
4. Support promising new models of recruiting, preparing, certifying, compensating and evaluating teachers in STEM content areas. Virginia’s Career Switchers alternative route to licensure program has grown steadily since its inception in 2000. The Governor’s budget will include expanded support for the critical mentoring component of this program, which will expand the capacity of the program to accept new candidates. Since 2003 the Mathematics and Science Partnership (MSP) Grant has funded 25 projects that provide high-quality professional development in mathematics and science to K-12 teachers. The state also provides teacher recruitment and retention incentives for hard-to-staff schools, a Virginia Middle School Teachers Corps to improve math instruction in middle schools, a teaching scholarship loan program for students who are preparing to teach in a critical shortage area, and fee assistance and incentive rewards for National Board Certification. (Additional details in Section B.)
5. Support extra learning opportunities to support STEM teaching and learning in the schools. Virginia schools support innovative teaching and learning opportunities including FIRST Robotics, FIRST Lego League, and Virginia Junior Academy of Science.
C. Identify best practices in STEM education and bring them to scale.
1. Virginia will continue to support specialized STEM schools including our outstanding Governor’s Schools and other specialty programs.
2. Maintain standards and assessments in technology and engineering as well as math and science. Virginia’s Technology Education curricula are correlated to the International Technology Education Association (ITEA) Standards for Technological Literacy. Possible standards for engineering education are being studied by the National Center for Engineering and Technology Education, and recommendations regarding standards for engineering in education are being studied by the National Academy of Engineering. Virginia has partnered with NASA to examine the alignment of science and engineering curricula to current and emerging postsecondary and industry expectations.
3. Support the development of high quality STEM curricula for voluntary use by districts. Available curricula addressing STEM education for K-8 include: Children's Engineering, Introduction to Technology, Inventions and Innovations, and Technological Systems. These programs are open to all students.
4. Develop standards for rigorous and relevant CTE programs that prepare students for STEM related occupations.

Virginia Attachment A - Section APage 16 of 16
This is the focus of Virginia’s grant proposal to the National Governor’s Association.
a. Develop career pathways for students from K-12 through postsecondary and graduate education that prepare students for current high demand, high skill and high wage jobs at various levels of education. Work is underway to accelerate development of relevant secondary to postsecondary career pathways, utilizing the flexibility and framework in Perkins IV.
b. Develop career pathways for students from K-12 through postsecondary and graduate education that prepare students for careers strategically targeted for growth to ensure Virginia’s success in innovation and knowledge-based industries. Work is underway as noted in a.
c. Develop Governor’s Exemplary Standards for Career and Technical Education as a high standard for CTE programs in schools, localities and regional centers to achieve. Provide Governor’s Exemplary Standard Awards to programs meeting the high standard.
d. Create Governor’s Academies for Career and Technical Education, modeled on Virginia’s very successful Governor’s Schools program, to raise the rigor and quality of career and technical education in the commonwealth. Up to three Academies will be created in the first phase of development. Academies will offer career pathways addressing both a. and b. above, commit to meeting exemplary standards, work closely with local and regional employers and workforce developers to meet industry needs, and offer acceleration options for students including dual enrollment, industry certification and licensure and work-based learning. They will serve as model programs for the transformation of career and technical education throughout Virginia and the nation.