gap inc. equity valuation and analysis valued at...
TRANSCRIPT
1
Gap Inc. Equity Valuation and Analysis Valued at November 1, 2006
Brian Vance: [email protected] Jonathan Applegate: [email protected]
Kyle Reynolds: [email protected] Chance Baucum: [email protected]
Matt Loyd: [email protected]
2
Table of Contents
Executive Summary…………………………………………………6
Industry Overview and Analysis…………………………………8
Company Overview………………………………………………….8
Competitive Advantage Analysis…………………………………15
Accounting Flexibility………………………………………………..23
Accounting Strategy Evaluation…………………………………..24
Quality of disclosure…………………………………………………………………………………..25
Potential “Red flags”………………………………………………………………………………...26
3
Ratio Analysis and Forecast Financials…………………………28
Liquidity Analysis……………………………………………………..29
Profitability Analysis…………………………………………………30
Capital Structure Analysis………………………………………….31
Benchmark Analysis………………………………………………....31
Liquidity…………………………………………………………………………………………………...32
Profitability ………………………………………………………………………………………………35
Capital structure………………………………………………………………………………………..38
Financial Statement Forecasting…………………………………39
Valuation Analysis……………………………………………………42
Method of comparables Valuation…………………………………………………………….43
Cost of Capital Estimation………………………………………………………………………..44
Summary of Valuations…………………………………………….45
Altman’s Z-Score……………………………………………………..49
References…………………………………………………………….51
Appendices…………………………………………………………….52
4
GAP INC.
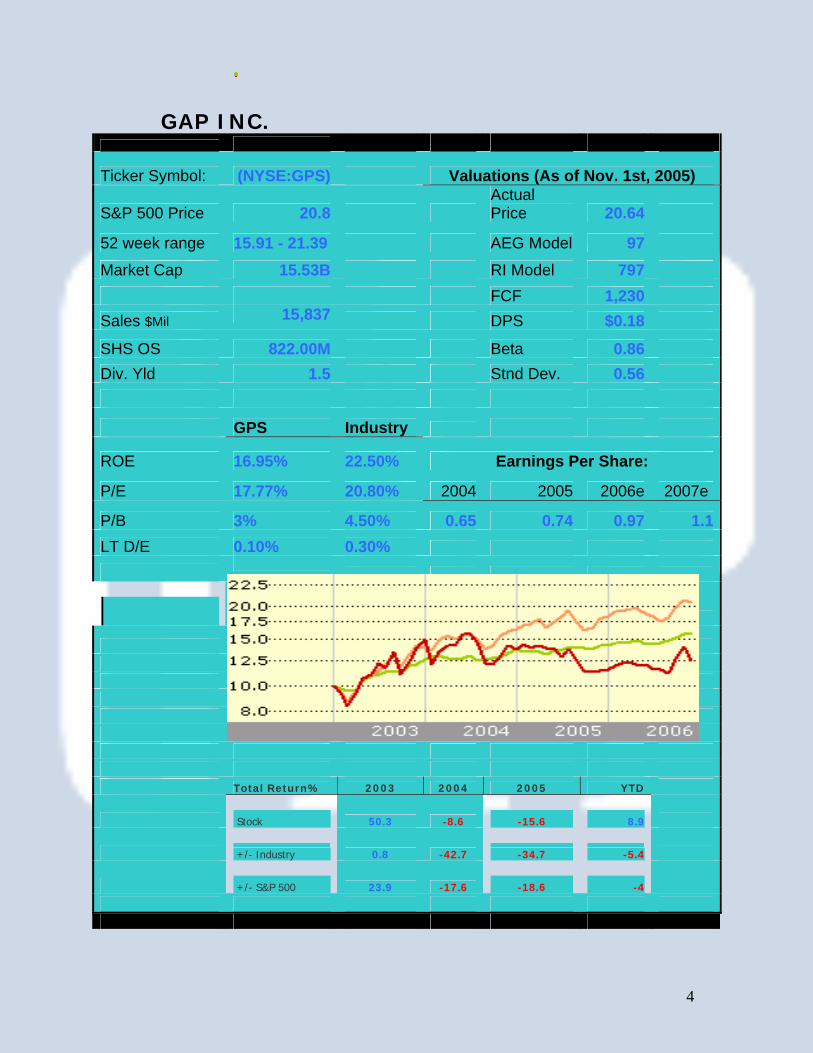
Ticker Symbol: (NYSE:GPS) Valuations (As of Nov. 1st, 2005)
S&P 500 Price 20.8 Actual Price 20.64
52 week range 15.91 - 21.39 AEG Model 97
Market Cap 15.53B RI Model 797 FCF 1,230 Sales $Mil 15,837 DPS $0.18
SHS OS 822.00M Beta 0.86 Div. Yld 1.5 Stnd Dev. 0.56
GPS Industry
ROE 16.95% 22.50% Earnings Per Share:
P/E 17.77% 20.80% 2004 2005 2006e 2007e
P/B 3% 4.50% 0.65 0.74 0.97 1.1LT D/E 0.10% 0.30%
Total Return% 2003 2004 2005 YTD
Stock 50.3 -8.6
-15.6
8.9
+/- Industry 0.8 -42.7
-34.7
-5.4
+/- S&P 500 23.9 -17.6
-18.6
-4
5
Executive Summary Recommendation: Overvalued firm
Through detailed research and valuation, we have concluded that we are
a selling opportunity. The clothing retail industry is very competitive with a high
number of competitors. This large number of competitors creates strong
earnings potential compared to other industries. The industry is characterized by
emphasizing differentiation and not cost leadership, which results in the firms not
having to have a price war. Along with differentiation, most of the competitors
within this industry tend to rely on their brand image. The biggest firms within
the industry also tend to create subsidiaries in order to compete with rival firms.
The threat of new competitors is relatively low due to the high start up costs of
entering the market. Since Gap Inc. and other firms in this industry tend to have
a high quality brand image, most firms have power over their suppliers, due to
manufacturers competing for business.
After analysis, Gap’s accounting practices and policies were found to be
fairly aggressive. However, their disclosure and reporting of relevant material is
seemingly very transparent. Gap discloses all accounting methods concerning
everything from leases and pension plans to inventory and tax methods. They
also outline all accounting statements and opinions affecting their business. We
found no distortions or discrepancies in their accounting.
6
After computing our firm’s core ratios, we felt we were able to grasp Gap’s
overall performance as compared to its competitors within the industry.
Inventory turnover tended to be lower while gross profit was high throughout
the industry. This is most likely due to the fact that most firms in our industry
compete with differentiation and brand name.
To understand what the future holds for Gap Inc., we forecasted the
company’s financial statements through 2015. By analyzing trends, we have
concluded that Gap will continue to grow at a current rate; much like the firm
has been doing the last 3 years without any unforeseen abnormalities. It was
extremely important that our forecasts be calculated as accurately as possible
due to the fact that forecasting was the base upon which all valuation methods
rested.
After thorough evaluation, we have found that Gap Inc. is overvalued in
the market. All of our valuation models showed Gap Inc.’s stock to be
considerably overvalued. The most accurate valuation model for us was the free
cash flows valuation. Using our free cash flow model, we found an estimated
price per share at the end of 2005 to be $15.72 while our actual price per share
was $17.64. The only model which we considered to be unreliable was the
discounted dividend valuation. We feel this was due to our low dividend payout
rate in forecasted years. The discounted dividends valuation model is flawed
because it values companies based on what they pay per dividend, and many
companies pay little or no dividends at all. Based on this all-inclusive, in-depth
7
analysis and valuation, we find Gap Inc. to be overvalued and strongly
recommend selling.
Business and Industry Analysis
Firm Overview
Gap Inc. is one of the largest specialty retailers while leading the world in
specialty retail clothing. Gap Inc. owns Banana Republic, Old Navy, and Forth &
Towne. They specialize in apparel design while offering clothing and accessories
for the whole family. Gap Inc. owns more than 3,000 stores and is reported to
have accumulated $16 billion in fiscal year 2005. Their main headquarters is
located in the San Francisco Bay Area but their product design offices are located
in New York City, San Francisco, and London. As far as what the company does,
Gap.com says, “We try to put out affordable, casual designs of shirts and jeans
while providing value to the shareholders and making a positive impact in the
community.” Abercrombie and Fitch, American Eagle, and Buckle are some of
Gap’s competitors within the industry. They all aim to design their clothing
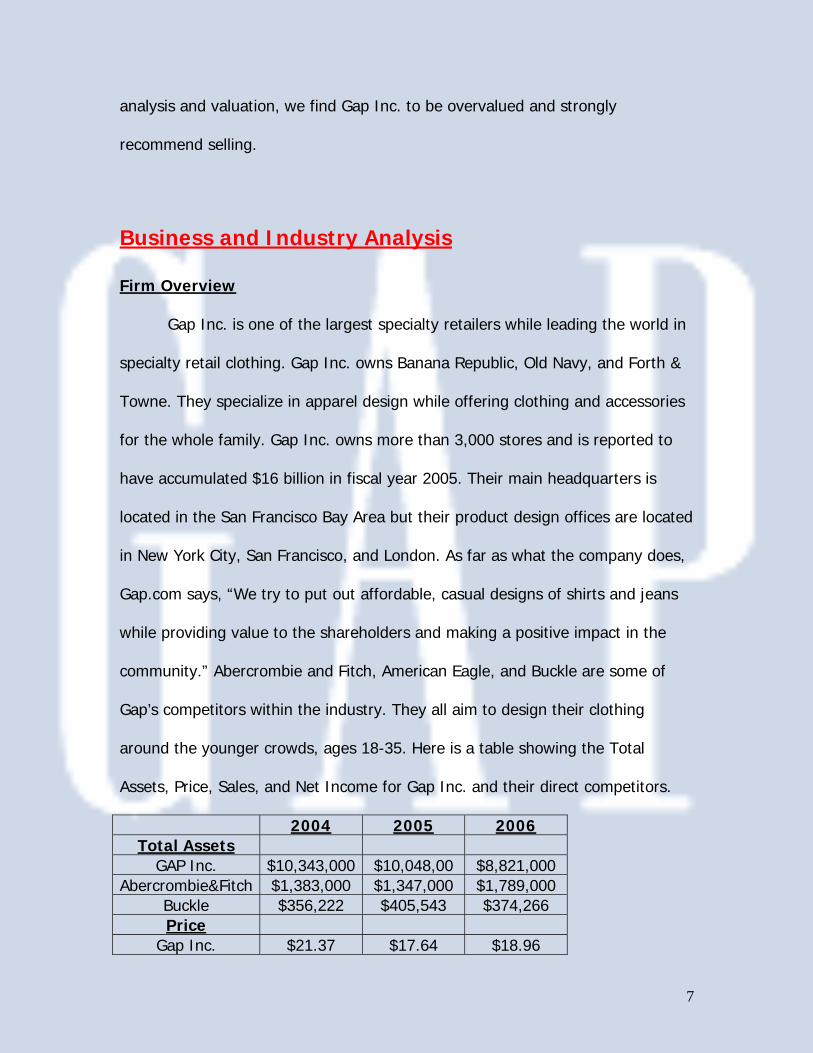
around the younger crowds, ages 18-35. Here is a table showing the Total
Assets, Price, Sales, and Net Income for Gap Inc. and their direct competitors.
2004 2005 2006 Total Assets
GAP Inc. $10,343,000 $10,048,00 $8,821,000 Abercrombie&Fitch $1,383,000 $1,347,000 $1,789,000
Buckle $356,222 $405,543 $374,266 Price
Gap Inc. $21.37 $17.64 $18.96
8
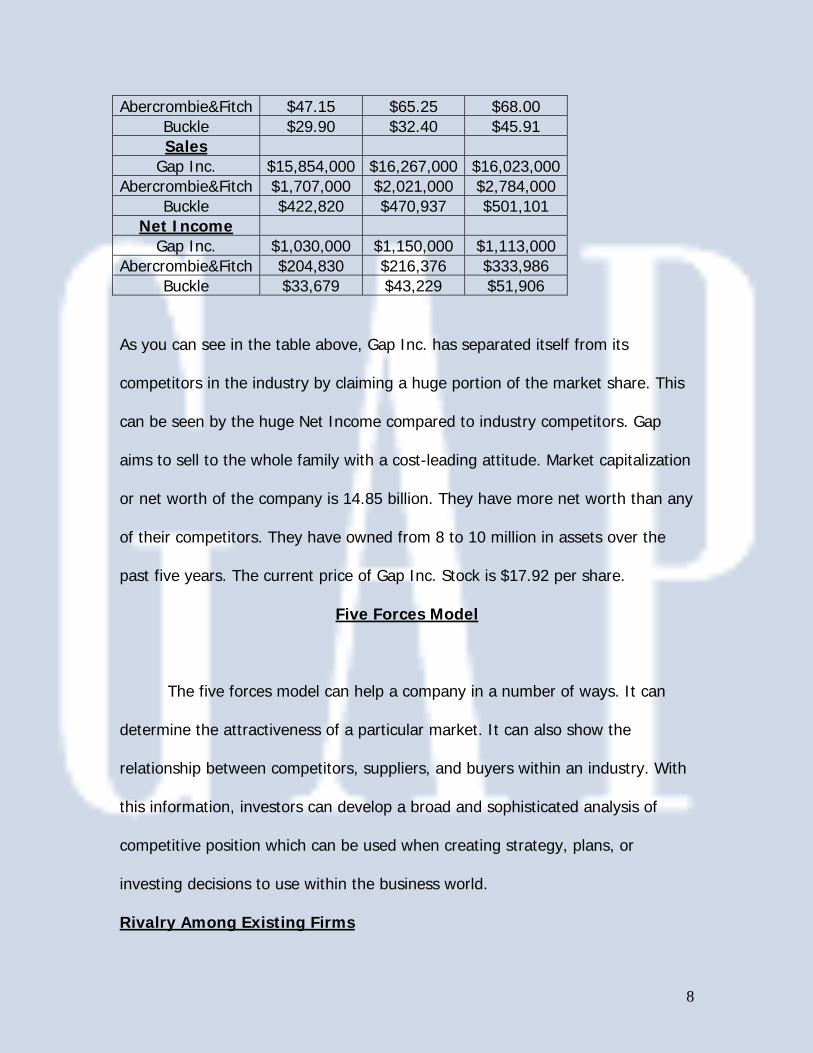
Abercrombie&Fitch $47.15 $65.25 $68.00 Buckle $29.90 $32.40 $45.91 Sales
Gap Inc. $15,854,000 $16,267,000 $16,023,000Abercrombie&Fitch $1,707,000 $2,021,000 $2,784,000
Buckle $422,820 $470,937 $501,101 Net Income
Gap Inc. $1,030,000 $1,150,000 $1,113,000 Abercrombie&Fitch $204,830 $216,376 $333,986
Buckle $33,679 $43,229 $51,906
As you can see in the table above, Gap Inc. has separated itself from its
competitors in the industry by claiming a huge portion of the market share. This
can be seen by the huge Net Income compared to industry competitors. Gap
aims to sell to the whole family with a cost-leading attitude. Market capitalization
or net worth of the company is 14.85 billion. They have more net worth than any
of their competitors. They have owned from 8 to 10 million in assets over the
past five years. The current price of Gap Inc. Stock is $17.92 per share.
Five Forces Model
The five forces model can help a company in a number of ways. It can
determine the attractiveness of a particular market. It can also show the
relationship between competitors, suppliers, and buyers within an industry. With
this information, investors can develop a broad and sophisticated analysis of
competitive position which can be used when creating strategy, plans, or
investing decisions to use within the business world.
Rivalry Among Existing Firms
9
Some aspects of rivalry among firms that make this model so important
would be the number and size of firms, industry size and trends, product/service
range, and differentiation and strategy. The clothing stores industry, which has
done extremely well over the last 5-10 years, has a large number of competitors.
A few of the competing companies include American Eagle, Abercrombie & Fitch,
and TJ Maxx. This large number of competitors creates strong earnings potential
compared to other industries. In the clothing store industry there is room to
grow, but start up costs can be high. While Gap is definitely looking to gain a
larger share of the market, switching costs for consumers is low. This is
especially true with one of Gap’s top competitors TJ Maxx. TJ Maxx competes
solely on price. In response, Gap is looking to reestablish a larger core of
consumers who are brand loyalists. To compete with all these different
competitors in the market, Gap Inc. created such higher end clothing lines as
Banana Republic, Old Navy, and Forth & Towne. In an industry where the right
mix of product differentiation and price play a key role, these three brands allow
them to be competitive.
Threat of New Entrants
Some important factors surrounding the threat of new entrants section of
the five forces model include: barriers to entry, brand equity, switching costs,
access to distribution and government policies. Understanding these concepts
will help a firm understand the industry at a higher level. The popularity of the
internet has brought more sales opportunities for all companies within this
10
industry, which in turn, has increased the development of online marketing.
While Gap and its competitors compete in the clothing store industry, they also
have a number of competitors in the fashion industry which includes brands such
as Polo, Tommy Hilfiger, and Lacoste. These industries differ slightly because
these fashion companies sell their clothing to department stores like Dillard’s,
while Gap Inc. operates their own stores. They compete with these companies
because switching costs are so low. However, within their own industry, start up
costs can be high. Even though there is room to grow within the industry, the
threat of new entrants is relatively low. This is largely due to large economies of
scale in this industry in which new entrants will initially suffer from a cost
disadvantage from existing firms such as GAP Inc. The risk of investing so much
to start up deters most new entrants. In conclusion, there will always be the
threat of new entrants, but it will be extremely hard and expensive to match
Gap’s share in the market.
Threat of Substitute Products
Some key concepts that go along with the threat of substitute products
are buyer propensity to substitute, relative price performance of substitutes,
buyer switching cost, and perceived level of product differentiation.
Understanding this section will allow a firm to know how to handle any substitute
products that is thrown at them by competitors. The threat of substitute
products for Gap is very real. This is the main reason they are trying to
reestablish a larger group of brand loyalists with their “back to basics” simplistic
11
style that consumers had known and loved. Another way Gap Inc. can overcome
this problem is with their other brands, especially Old Navy. Brand loyalists will
generally buy a particular brand regardless of the price. However, consumers
who are not brand loyal tend to seek out substitute products largely because of
high prices. This is where Old Navy is able to tap into the industry. Old Navy
offers trendier styles with a lower cost, which lessens the threat of substitute
products. In an industry as diverse as the clothing industry, every move you
make determines when and how many substitute products could possibly enter
your market. This is why having more than one line of clothing, an online shop,
and sales in more than just the United States is so important.
Bargaining Power of Buyers/Customers
Understanding the bargaining power of your customers will help a firm
decide on the price it wants to sell its products for. Since our industry is, on
average, not a price competitive industry, this section is not as important as
others in the five forces model. Simply due to the low switching costs of the
industry, buyers do have some power. Price sensitivity plays a small role but the
majority of buyers are willing to pay for Gap’s moderately priced clothing. Sales
at retail locations tend to attract customers with less spending power, but
customers generally know what to expect with regard to prices in the industry.
On the average, Gap Inc.’s prices are lower than both Abercrombie & Fitch, and
Buckle. The Gap brand or Banana Republic may lose a few customers due to
prices, but Old Navy was created to appease the price shoppers. In this market,
12
it is important to compete on both quality and brand name, as well as price. This
is why, for example, Abercrombie & Fitch launched Abercrombie Kids, Hollister
Co., and RUEHL 925 campaigns. In conclusion, the customers do not have much
bargaining power within this industry. An example of an industry that would have
high bargaining power of customers would be lower quality outlets such as K-
mart, Payless, and Wal-Mart.
Bargaining Power of Suppliers
Bargaining power of suppliers is an extremely important aspect of our
firm, and the industry in general. If not properly calculated, excess cost and high
inventory can occur. There are numerous suppliers of fabrics and other materials
like cotton to choose from. Most firms actually shop for manufacturers of clothes
and hand their designs over to them. Since the firms in our industry have a high
quality brand image, most have real power over their suppliers, due to
manufacturer’s vying for their business.
In conclusion, there is an extremely high degree of competition within this
clothing retail industry. Since these brands rely on the latest fashions, quarterly
changes in seasonal products must happen as much as possible. Technology,
including online shopping, must be up to date. Branching out to places other
than the United States is important. Overall, these firms are relying on brand
image and differentiation to gain as much market share as possible.
Key Success Factors
13
Every firm in America has to decide, when it first starts, how it wants to
position itself in the industry. Our firm, Gap Inc., is no different. Gap had to
make the decision of how it wanted to gain a competitive advantage over other
firms in its field. There are two strategies a firm can follow. It can either choose
a cost leadership plan or a differentiation plan. Cost leadership is essentially just
competing with other firms only on cost. A cost leader can offer the same
product as a competitor, only at a lower price. Differentiation on the other hand
is competing by offering a product that is different in some way. These plans are
important because a firm can gain an advantage over its competitors based on
either of these strategies. It is also important that a firm choose one or the other
and not get stuck in the middle. Not taking one side or the other can cause a
firm to earn low profits.
The objective of product differentiation is to develop a position that
potential customers will understand to be unique. There are two mechanisms for
which differentiation affects performance. First, differentiation will reduce price
sensitivity. This means that consumers might be willing to pay a higher price for
the differentiating factor(s). Second, differentiation should reduce directness of
competition. This can be defined by stating that the more your product differs
from the industry’s products, categorization becomes more difficult thus your
product draws fewer comparisons to competition.
At the market level, differentiation can be defined as improving the quality
of goods over time due to innovation. In an evolutionary sense, differentiation is
14
more of a strategy that is important in adapting to a moving environment and its
social groups. Since almost all the firms in our industry have name recognition,
success in this market must be achieved by adapting to a moving environment
that is obsessed with the latest trends, while producing comfortable and casual
styles of dress.
Competitive Analysis
Gap Inc. is in the highly competitive, ever changing, clothing retail
industry. The Gap is implementing technology into its stores which contain
certain intrinsic competitive advantages which give the corporation a head up on
the competition. Not only does this new technology allow for more cost effective
distribution, but it also offers a more time-efficient experience for both the
consumer and the employee. Instead of spending large amounts of money yearly
by manually taking inventory, The GAP will now be able to access inventory data
quickly and easily through a handheld device. If there is a situation where
merchandise is out of stock at a particular location, it can be dealt with quickly
and effectively, by communicating with other GAP stores to replenish the missing
units.
These measures taken to provide technological advantages over other
companies will pay off, simply because it is a more convenient way of shopping.
It literally bridges inventories from multiple stores in a region, giving the
customer a larger selection of sizes and styles. This allows for customers to try
15
on clothing at the store, as well as offer the large inventory the internet has
been able to offer for many years. These new ways of business improves The
GAP with an entirely different shopping experience. This experience in time will
increase customer retention and rapport, generating profits. The Gap Web
advancements will provide the base for more company expansion. If the GAP can
hold their customer base through outstanding customer satisfaction, then people
will be drawn to the unique shopping experience.
Gap Inc. has chosen a differentiation strategy. “Know who you are and be
it. Celebrate your uniqueness with passion and conviction.” That phrase has been
the philosophy that has driven GAP for the last three decades. Gap’s purpose has
been to appeal to people of all ages, not just teens and young adults in their
twenties. This process starts with Gap designers who travel to such fashion and
cultural capitals as New York, Paris, London, Milan, and Tokyo. Here, the
designers partake in fashion shows and get a feeling for what the target
audience’s preferences are. Once these concepts have been developed, the
merchants and designers work extremely close together to translate this
inspiration into reality. This process of creativity and innovation is very much
necessary to differentiate The Gap’s clothing line from such top competitors as
Abercrombie & Fitch and American Eagle.
Investment in brand image has had a huge impact on GAP Inc. For
around thirty years, GAP specialized in basic clothing and had a consistent core
group of customers. Around 2000, GAP launched a new campaign to start
16
making a newer, trendier style of clothing. GAP also created flashy commercials
that included choreographed dance numbers and singing. This change alienated
many of Gap’s core customers and as a result, the company lost a sufficient
amount of money. Around 2002, then CEP Millard Drexler launched a “back to
basic” campaign. This campaign consisted of going back to Gap’s roots and
specializing in items such as denim, T-shirts, hooded sweaters, and basic pants.
This has improved sales, but it has been an uphill battle. Essentially, Gap’s brand
image tries to differentiate itself from competitors by offering very high quality,
basic, casual clothing.
Differentiation companies require heavy investments in research and
development. At GAP Inc., each item is sold and then registered for analysis by
planners and distribution analysts. These analysts monitor weekly sales trend
reports and determine which stores need to be stocked with what products.
These “replenishment shipments” usually occur one to three times per week.
This process continues until the season ends. At this point, all customer
feedback, performance notes, and suggested improvements are analyzed so GAP
is ready to being this cycle again.
As far as differentiation goes, Gap’s investment in brand image is by far
the most important aspect of value chain management. A bad decision, such as
the one made in 2000, can cripple a company. GAP is just now recovering and it
has been a slow process. In order to achieve and sustain competitive advantage,
17
GAP Inc. needs to stick to its roots and structure its supply chain in a way that is
consistent.
Even with The Gap implementing a polished product differentiation
strategy, with strong focus on brand development and unique advertisement, it
is still not at the top of the market. Population groups like the baby boomers are
not tailored to by Gap Inc. or any of its subsidiaries. Expansion of Gap Inc. would
open up a whole new, highly lucrative, market share.
Although The Gap has gone from being a corner shop in California, to a
worldwide corporation, they have experienced many peaks and valleys. The
company has learned many lessons. First, when creating marketing campaigns,
they learned to create their own image and not rely on celebrity status. Second,
they have learned how to create their own image. Their image is broad, but
specific. It adheres strictly to high quality, basic, casual clothing. Third, The Gap
has learned to create sub-brands to tailor to various classifications of people.
Fourth, The Gap realizes that they operate within a niche where customers care
about fashion but only so long as it can be delivered at a moderate price. The
Gap has also learned early that they have to outsource labor in order to keep
costs down and remain competitive. The Gap’s commitment to customer
satisfaction and ability to reinvent themselves in the volatile fashion industry
provides for an expected strong future for the company.
18
Accounting Analysis
In the section we analyzed Gap Inc.’s accounting quality by six steps.
First, by identifying the key accounting policies that are used. Then, Assess
Accounting Flexibility for the firm, and evaluating the accounting strategy. Next,
we had to evaluate how easy or less easy managers made it analyst to look at
it’s financial statements, and point out any potential “red flags”. Finally, based on
this analyzes; we felt that there was no accounting distortions to undo. Gap Inc.
has disclosed all of its material very well, and we feel that their accounting
practices are not misleading or distorted based off of the ratio analyzes of Gap
Inc.’s financial results.
Key Accounting Policies
The Gap’s key success factors are attributed to their strict accounting
polices which coordinate with each other to create the present and future
financial performance of the company. The financial statements are consolidated
to include the accounts of the company and all its subsidiaries. All inter-company
transactions and balances have been eliminated. Translation adjustments result
from translating foreign subsidiaries’ financial statements into U.S. dollars.
Balance sheet accounts are translated at exchange rates in effect at the balance
sheet date. Income statement accounts are translated at average exchange rates
during the year. The resulting translation adjustments are included in
accumulated other comprehensive earnings in the Consolidated Statements of
Shareholders’ Equity (Gap 10-K).
19
Fiscal year for Gap Inc. ends on the Saturday closest to January 31. The
last three years have consisted of 52 weeks while fiscal 2006 will consist of 53
weeks.
Revenue and the related cost of goods sold (including shipping costs) is
recognized at the time the products are received by the customers in
compliance with the rules of Staff Accounting Bulletin No. (“SAB”) 101, “Revenue
Recognition in Financial Statements” as amended by SAB 104 (Gap 10-K). The
point at which the customer receives and pays for the merchandise is when the
revenue is accounted for by means of either cash or credit card. The Gap is in
the retail clothing sales industry where transactions are processed very rapidly
and easily, explaining their non-reporting of Accounts Receivable. Amounts
related to shipping and handling that are billed to customers are reflected in net
sales and the related costs are shown in cost of goods sold and occupancy
expenses. The Gap uses the historical return gross profit patterns to record its
allowances for estimated returns.
Cash and equivalents represent cash and short-term, highly liquid
investments with original maturities of three months or less. Cash and
equivalents are accumulated by finding all accounts in-transit from banks for
customer credit card, debit card and electronic transfer transactions that go
through or clear in less than a week, which are then classified as cash and
equivalents in the Consolidated Balance Sheets. Checks outstanding are classified
in accounts payable on the Consolidated Balance Sheets. The restricted cash
account serves as collateral for the insurance obligations and recently in 2005
held $55 million (Gap 10-K).
Property and equipment are stated at cost. Depreciation and amortization
are computed using the straight-line method over the estimated useful lives of
the related assets. The cost of assets sold or rendered useless and the
20
accumulated depreciation or amortization are removed from the accounts with
any records of gain or loss shown in net earnings.
The Statement of Financial Accounting Standards No. (“SFAS”) 133,
“Accounting for Derivative Instruments and Hedging Activities,” establishes the
accounting and reporting principles for hedging activities and derivative
instruments (Gap 10-K). Gap measures all derivative instruments at fair value
and distinguishes them as either other current assets or accrued expenses and
additional current liabilities in their Consolidated Balance Sheets.
Merchandise inventory is calculated using the first-in, first-out method
(“FIFO”) to determine cost. By means of the cost method the inventory is valued
at the lower of the actual cost or market. They also estimate and accrue
shortage for the period between the last physical inventory count and the
balance sheet date.
Gap inc. leases most of their store premises and some headquarter
facilities and distribution centers. These operating leases expire at various dates
through 2033. Most store leases are for a five year base period and include
options that allow Gap to extend the lease term beyond the initial base period,
subject to terms agreed to at lease birth. Some leases also include early
termination options, which can be exercised under specific conditions. Gap inc.
recognizes the related rental expense on a straight-line basis and records the
difference between the recognized rental expense and amounts payable under
the leases as deferred rent liability. Deferred rent liability was approximately
$342 million at January 28, 2006 and $361 million at January 29, 2005. As stated
in the initial terms of the lease, the minimal lease payment has no dependency
on factors such as future sales volume and contingent rentals. Future payments
for maintenance, insurance and taxes to which the Company is obligated are
excluded from minimum lease payments.
21
Gap Inc. has acquired three different pension plans for its employees, all
with different types of defined benefit or defined contribution plans. The First,
“GapShare,” is a qualified defined contribution plan, available to employees who
meet certain age and service requirements. This plan allows employees to make
contributions up to a maximum limit and Gap matches the contribution total
amount or a portion of it according to a predetermined formula. Gaps’
contributions to this plan averaged $30 million over the last three years.
Another pension plan of Gap is known as the (“Plan”). This is a non-
qualified executive deferred compensation plan. It allows eligible employees to
defer compensation up to a maximum amount. Gap does not match any
contributions under this plan. Established on January 1, 1999, the asset and
liability concerning the Plan was approximately $24 million and $30 million,
respectively. As of December 31, 2005 the plan was frozen for additional
contributions.
In January of 2006 a nonqualified Supplemental Deferred Compensation
Plan replaced the (“Plan”).This new nonqualified Supplemental Deferred
Compensation Plan now allows for employees and non-employees on the Board
of Directors to defer compensation up to a limit. However under this new plan
the employee members on the Board of Directors will have their contributions
matched under a predetermined formula.
Accrued expenses and other current liabilities consist of payroll and
related benefits, deferred rent liability and other current liabilities. They use a
combination of insurance and self-insurance for a number of risk management
activities including workers’ compensation, general liability,
automobile liability and employee-related health care benefits, some of which is
paid by their employees (GPS 2005 Annual Report).
22
Income taxes are recorded using the asset and liability method in
compliance with SFAS 109 “Accounting for Income Taxes” (Gap 10-K). Deferred
income taxes come from temporary differences between the tax part of assets
plus the liabilities under this method. The reported amounts from the calculations
are then shown in the Consolidated Financial Statements.
Accounting Flexibility
Gap Inc has a significant amount of flexibility in choosing their key
accounting policies. Gap Inc. prepares financial statements in accordance with
accounting principles commonly accepted in the United States of America.
Management is required to use accounting policies in order to make significant
judgments and estimates to develop amounts reflected and disclosed in the
financial statements. Gap Inc. has shown accounting flexibility in many areas on
the financial statements.
Merchandise Inventory is valued using the cost method. Cost method
values inventory at the lower of the actual cost or market. Gap Inc. determines
cost using FIFO method, and the market cost is estimated by the net realizable
value. Also, depreciation and amortization are calculated using straight-line
method. Cost of assets sold or retired and related accumulated depreciation or
amortization are removed from the accounts with any resulting gain or loss
included in net earnings. Under Financial Accounting Standards No.133,
“Accounting Instruments and Hedging Activities”, establishes the accounting and
reporting standards for derivative instruments and hedging activities. Gap Inc.
recognizes all derivatives instruments as either other current assets or accrued
expenses and other current liabilities in Gap’s Consolidated Balance Sheets and
measures those instruments at fair value.
23
Gap Inc.’s accounting reports seem to have a lot of flexibility for
managers.
Accounting Strategy Evaluation
Gap’s preparation of financial statements is in conformity with accounting
principles generally accepted in the U.S. Managements is responsible to make
estimates and assumptions that affect the reported amounts of assets and
liabilities. Gap Inc. reports any accounting methods they use or any areas in their
consolidated statements that might seem unclear to investors in the footnotes.
For example, during the fiscal year of 2005, Gap Inc. accounted for stock-based
awards to employees and directors using the intrinsic value method of
accounting required by APM, Accounting Principles Board Opinion. Under this
method when price of employee stock options equals the market price of the
stock on the day it was issued, no compensation expense is recognized in the
Consolidated Statements of Operations. Stock options that are less than fair
market value are amortized to operating expenses over the vesting period of the
stock award, using the straight-line method.
In the clothing retail industry, they all record Gift cards at different times.
For example, American Eagle, one of Gap Inc.’s competitors, records a gift card
as a current liability upon purchase and recognized when the gift card is
redeemed for merchandise. AE gives customers 24 months to redeem the gift
card or the Company assesses the holder of the card a one dollar per month
service fee, which is deducted from the value of the gift card. The fee is
recorded in selling, general and administrative expenses. Unlike Gap Inc., who
treats gift certificates or gift cards as a liability and income is recorded as net
sales upon redemption or as other income, but up to sixty months. After sixty
24
months is up, the redemption is remote, and the liability for gift cards and gift
certificates is recorded in accounts payable on the consolidated balance sheets.
Quality of Disclosure throughout Financial Statements
Every manager in a firm has the discretion to disclose information.
Accounting rules require a certain amount of disclosure, but beyond that it is up
to the manager how much information the firm will disclose. Quality of
disclosure is very important to an investor. A manager can make it easy for an
analyst to gain an insight into the firm by disclosing a lot of information. On the
other hand they can make it quite difficult to assess the business reality by only
disclosing the minimum amount required. As an investor you want as much
disclosure as possible without threatening the firm’s competitive advantage. If
you disclose too much information the competitors will be able to look through
the glass and see your strengths and weaknesses, of which they can then turn
around and use against you or copy your strengths and gain a profit like yours.
GAP does a good job of disclosing its’ business strategy. In the Letter to
Shareholders they do not try to sugar coat their performance. They are quite
liberal in disclosing bad news. Paul Pressler, CEO of GAP, makes no attempt to
explain the drop in Net Sales for 2005. Instead of excuses he clearly lays out a
plan to return to growing sales and to regain Gap Inc.’s competitive position.
One criticism of disclosure is that there is no real explanation of Gap Inc.’s
performance from 2005. Their net sales were down 2% from 2004. Gap Inc.
did not try to explain this decrease to any reason. They basically just said they
can do better and have a plan in place to return to its’ increased earnings.
Another good quality of Gap Inc.’s disclosure is that they break up their
finances by different companies. Gap Inc. owns Banana Republic, Old Navy, and
Forth and Towne. In their annual report they separate these businesses out so
25
all their performances aren’t lumped together. This can show the investor or
analyst which companies are doing well and which aren’t.
Gap Inc. is also very good with disclosing numbers that they think are
important. Free cash flow is a subject they spend a lot of time on in their
financial report. They believe that free cash flow is important because it
represents how much cash a company has after the deduction of capital
expenditures. Gap Inc. goes above and beyond disclosure for their cash flows to
show the analyst how important they feel these cash flows are. They also
explain in their footnotes all the forward looking statements that they include in
their annual report. In Gap Inc.’s report they use numbers and strategies with
forward looking statements that basically anticipate future effects on cash flows,
dividend payouts, cash balances vs. cash flows, and new store openings. They
explain how they came to these numbers, which makes it easier for the analyst
to determine if these numbers are accurate.
In conclusion, Gap Inc. does a great job of disclosing information for an
analyst or investor. This level of disclosure makes it very easy to determine the
reality of Gap Inc.’s position in the industry and to forecast future financial
results
Identification of Potential “ Red Flags”
As far as identifying red flags, we were unable to find any flags in GAP
Inc.’s financials statements. Even when performance was down, there were no
unexplained changes in the accounting process. There were no unexplained
transactions to boost profits. There were no unusual increases in accounts
receivable with respect to sales increases. There were no large fourth-quarter
adjustments. Inventories did not increase in relation to an increase in sales. After
26
analysis, GAP Inc.’s accounting is legitimate with no questionable accounting
quality.
Quantitative Indicators
When you study the quantitative indicators you can then effectively
analyze the past performance of Gap inc. The sales manipulation diagnostics
shows how sales relate to cash from sales, accounts receivable, and inventory.
The core expense manipulation diagnostics shows earnings related to expenses.
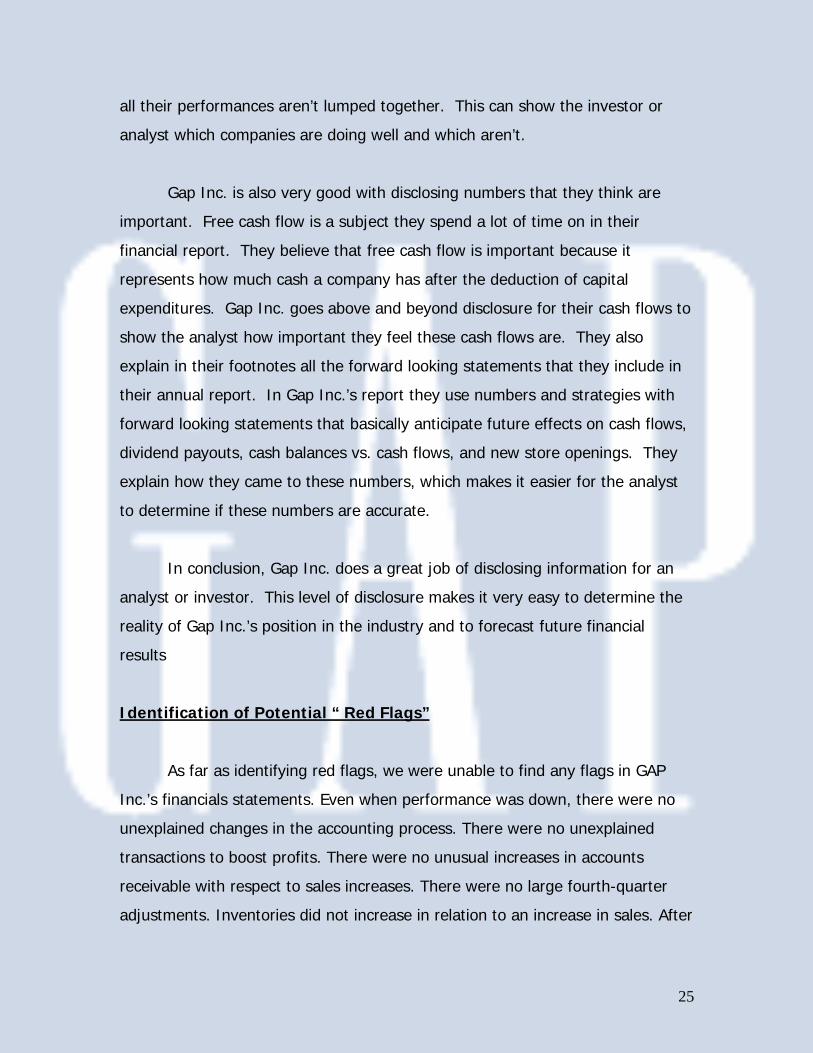
Sales Manipulation Diagnostics
GPS 2001 2002 2003 2004 2005
Net Sales/ Cash from Sales
10.51 11.63 7.34 10.04 10.33
Net Sales/ Net Accounts Receivable
N/A N/A N/A N/A N/A
Net Sales/ Inventory
8.26 7.05 9.3 8.97 9.45
Sales for Gap have been steady over the last few years. However, their
Net Sales/ Cash from Sales ratio has declined a little, meaning they have been
getting less cash from sales. Net sales to accounts receivables were N/A due to
the fact that the accounts receivable amounts for Gap Inc. were reported as
immaterial. Gap’s ratio of sales to inventory has increased from 2001 and 2002.
This shows that GAP has been making more profits while spending less on
inventory. This is a good sign for the future of the firm.
27
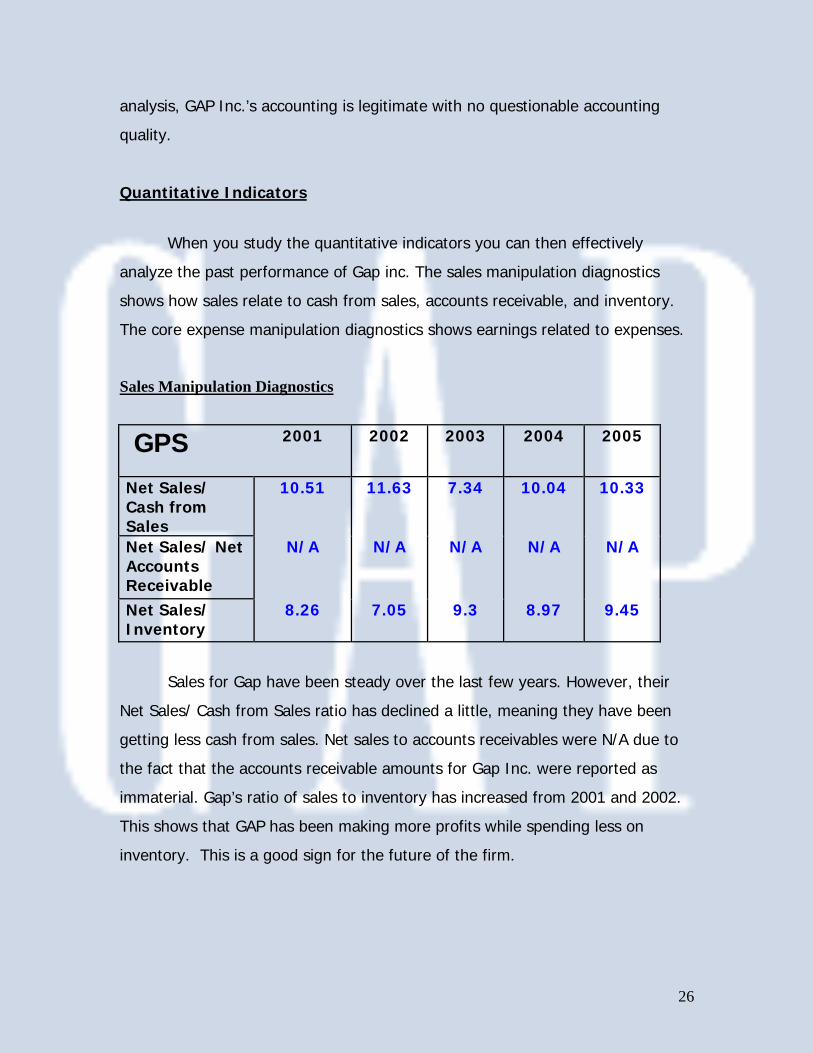
Core Expense Manipulation Diagnostics
GPS 2001 2002 2003 2004 2005
Asset Turnover (Sales/Assets)
1.82 1.46 1.48 1.62 1.82
CFFO/ OI 3.1 1.22 1.16 0.78 0.89
CFFO/ NOA 0.65 0.45 0.36 0.76 0.69
Gap’s asset turnover ratio shows that for every $1 of assets, GAP made
$1.82 in sales. GAP has increased its asset turnover after down years of 2002
and 2003. This shows that they are more efficiently using their assets CFFO/OI
for the most part remains steady aside from a decrease in 2002. If the CFFO/OI
number is smaller, more of the Cash Flow from Operations can be explained by
Operating Income. CFFO/NOA starts off relatively high, then dips for a couple
years, and finally levels off starting in 2004. The two years in which this figure is
low can be explained by GAP using more of their Operating Assets to bring about
their Operating Cash Flow.
Ratio Analysis & Forecast Financial
In the next step of evaluating Gap Inc., we have calculated financial ratios
to measure the performance of the company. We will attempt to forecast the
financial statements of the company for the next ten years. We will compare Gap
Inc. with the industry average as a whole in ratio analysis. By doing calculating
financial ratios we able to get a more in depth look into the companies,
profitability, liquidity, and capital structure. This could prove to be very valuable
to investors in the company.
Financial Ratio Analysis
28
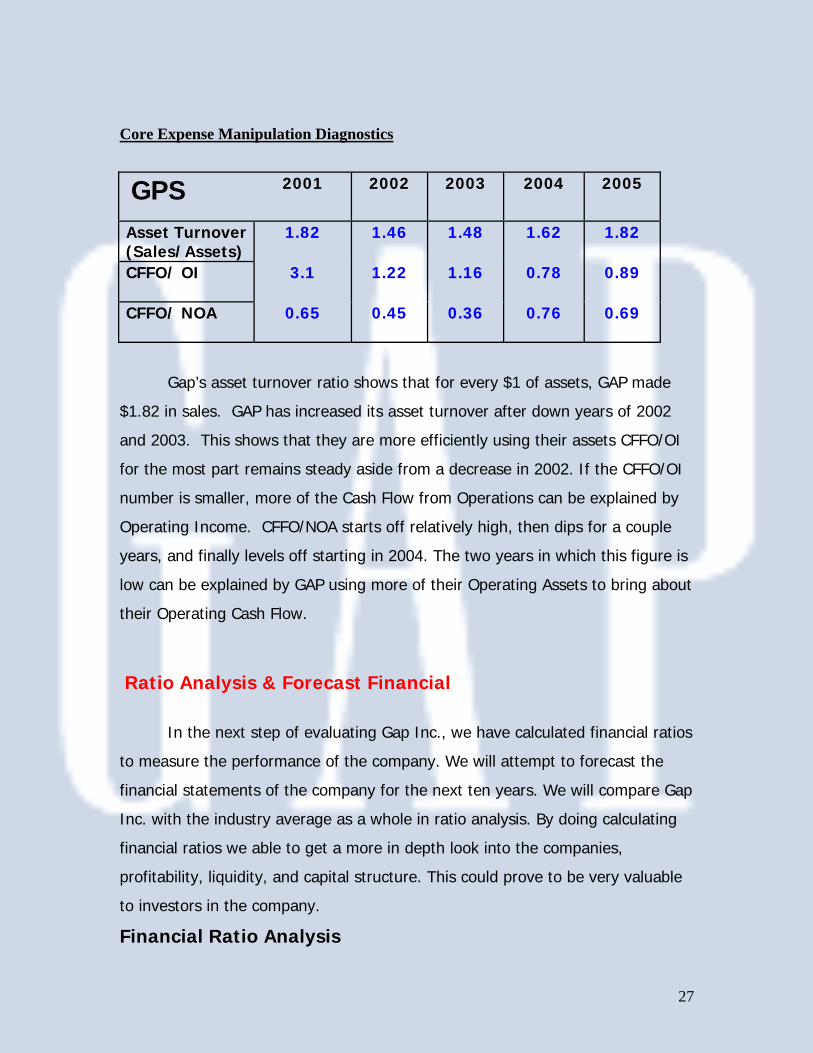
In order to analyze financial statements of a company we have to
calculate different ratio. These ratios can help determine where the cash comes
from and where it goes. We have calculated the financial ratios of Gap Inc. over
the last five year and compared them to three of our top competitors in the
industry. Ratio analysis can also provide us with background in figuring out
future performances. With this analysis we can predict future profitability for the
company and its shareholders. Financial Ratio Analysis is split into three parts.
First, we analyze the liquidity ratios, which determine the quick cash from assets
and the ability of a firm to turn assets into cash to meets its debt. Then, we
analyze profitability ratios, which tell us how much profit is earned from our sales
and assets, and how much of that profit goes to the shareholders. Finally, we
analyze the capital structure of a company, which determine where and how
much financing for a company is provided.
Liquidity Analysis 2001 2002 2003 2004 2005Current ratio 0.146 1.48 2.11 2.6842 2.8 Quick asset ratio 0.146 0.5 1.24 1.88 1.82
Accounts recevable turnover 113.95 153.63 125.69 226.48 242.79Days supply of inventory 3.2 2.38 2.9 1.612 1.5Inventory turnover 4.52 5.79 4.66 5.8 5.45Days supply of receivables 80.75 63 78 63 67Working capital turnover -90.496 14 4.79 3.77 4
Profitability Analysis 2001 2002 2003 2004 2005Gross profit margin 37.10% 30% 34% 37.64% 39.22%Operating expense ratio 26.5% 27.50% 27% 25.79% 26.4Net profit margin 6.40% -5.61% 3.30% 6.49% 7.06%Asset turnover 1.95 1.82 0.146 1.53 1.62Return on Assets 12.51% -0.10% 4.80% 9.95% 11.44%Return on equity 29.97% -0.26% 13% 21.50% 23.29%Debt to equity ratio 1.39 15.22 1.7 1.16 1.03Capital Structure Analysis 2001 2002 2003 2004 2005Times interest earned 19.29 3.09 4.07 8.02 11.856Debt service margin 1.66 31.46 N/A N/A N/A
29
Liquidity Analysis
2001 2002 2003 2004 2005Current ratio 0.146 1.48 2.11 2.6842 2.8Quick asset ratio 0.146 0.5 1.24 1.88 1.82
Accounts receivables turnover 113.95 153.63 125.69 226.48 242.79Days supply of receivables 80.75 63 78 63 67Inventory turnover 4.52 5.79 4.66 5.8 5.45Days supply of inventory 3.2 2.38 2.9 1.612 1.5Working capital turnover (90.5) 14 4.79 3.77 4
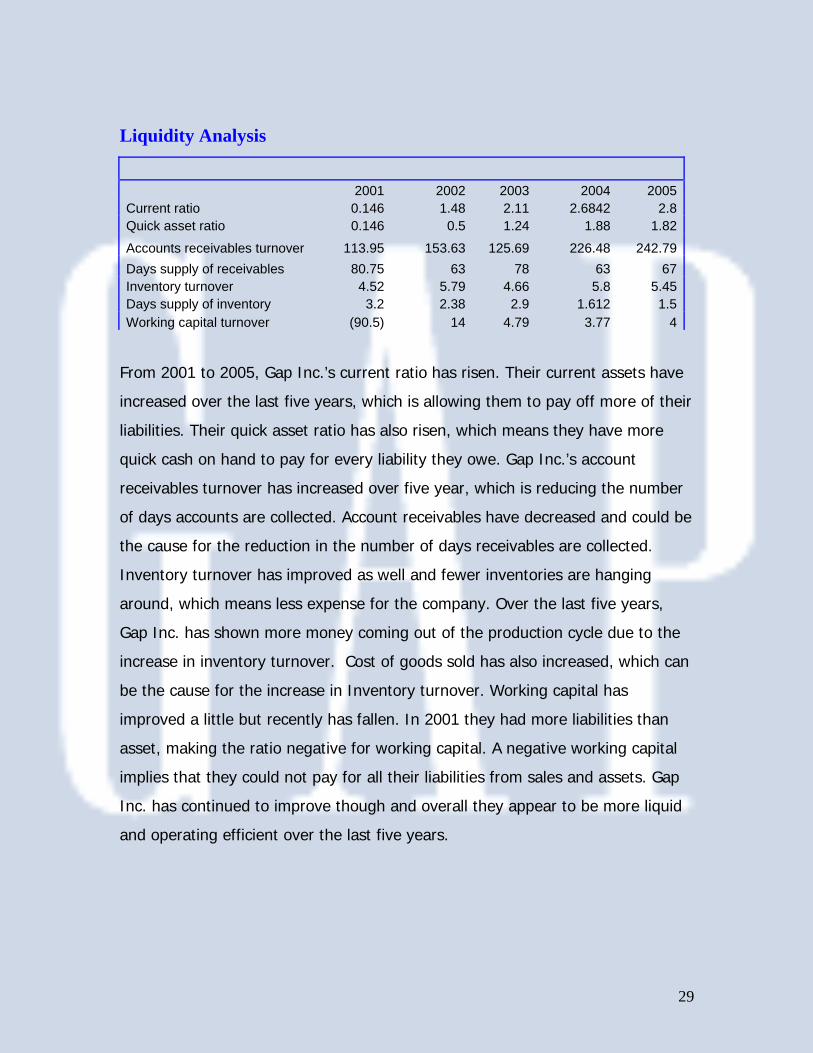
From 2001 to 2005, Gap Inc.’s current ratio has risen. Their current assets have
increased over the last five years, which is allowing them to pay off more of their
liabilities. Their quick asset ratio has also risen, which means they have more
quick cash on hand to pay for every liability they owe. Gap Inc.’s account
receivables turnover has increased over five year, which is reducing the number
of days accounts are collected. Account receivables have decreased and could be
the cause for the reduction in the number of days receivables are collected.
Inventory turnover has improved as well and fewer inventories are hanging
around, which means less expense for the company. Over the last five years,
Gap Inc. has shown more money coming out of the production cycle due to the
increase in inventory turnover. Cost of goods sold has also increased, which can
be the cause for the increase in Inventory turnover. Working capital has
improved a little but recently has fallen. In 2001 they had more liabilities than
asset, making the ratio negative for working capital. A negative working capital
implies that they could not pay for all their liabilities from sales and assets. Gap
Inc. has continued to improve though and overall they appear to be more liquid
and operating efficient over the last five years.
30
Profitability Analysis
2001 2002 2003 2004 2005Gross profit margin 37.10% 30.00% 34% 37.64% 39.22%Operating expense ratio 26.5% 27.50% 27% 25.79% 26.4Net profit margin 6.40% -5.61% 3.30% 6.49% 7.06%Asset turnover 1.95 1.82 0.146 1.53 1.62Return on Assets 12.51% -0.10% 4.80% 9.95% 11.44%Return on equity 29.97% -0.26% 13% 21.50% 23.29%
SGR 29.96% -26.99% 13% 21.50% 23.29% Sales Growth 1.28% 4.38% 9.68% 2.61% 4.49%
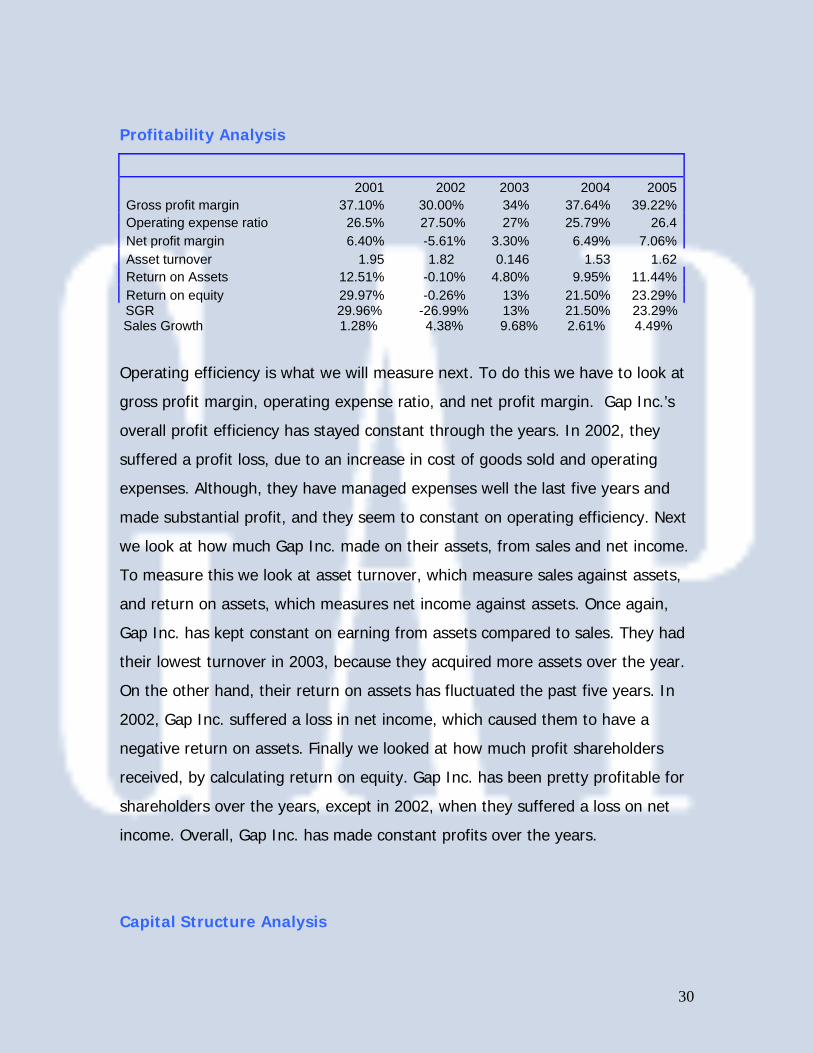
Operating efficiency is what we will measure next. To do this we have to look at
gross profit margin, operating expense ratio, and net profit margin. Gap Inc.’s
overall profit efficiency has stayed constant through the years. In 2002, they
suffered a profit loss, due to an increase in cost of goods sold and operating
expenses. Although, they have managed expenses well the last five years and
made substantial profit, and they seem to constant on operating efficiency. Next
we look at how much Gap Inc. made on their assets, from sales and net income.
To measure this we look at asset turnover, which measure sales against assets,
and return on assets, which measures net income against assets. Once again,
Gap Inc. has kept constant on earning from assets compared to sales. They had
their lowest turnover in 2003, because they acquired more assets over the year.
On the other hand, their return on assets has fluctuated the past five years. In
2002, Gap Inc. suffered a loss in net income, which caused them to have a
negative return on assets. Finally we looked at how much profit shareholders
received, by calculating return on equity. Gap Inc. has been pretty profitable for
shareholders over the years, except in 2002, when they suffered a loss on net
income. Overall, Gap Inc. has made constant profits over the years.
Capital Structure Analysis
31
Capital Structure Analysis 2001 2002 2003 2004 2005Debt to equity ratio 1.39 15.22 1.7 1.16 1.03Times interest earned 19.29 3.09 4.07 8.02 11.856Debt service margin 1.66 31.46 N/A N/A N/A
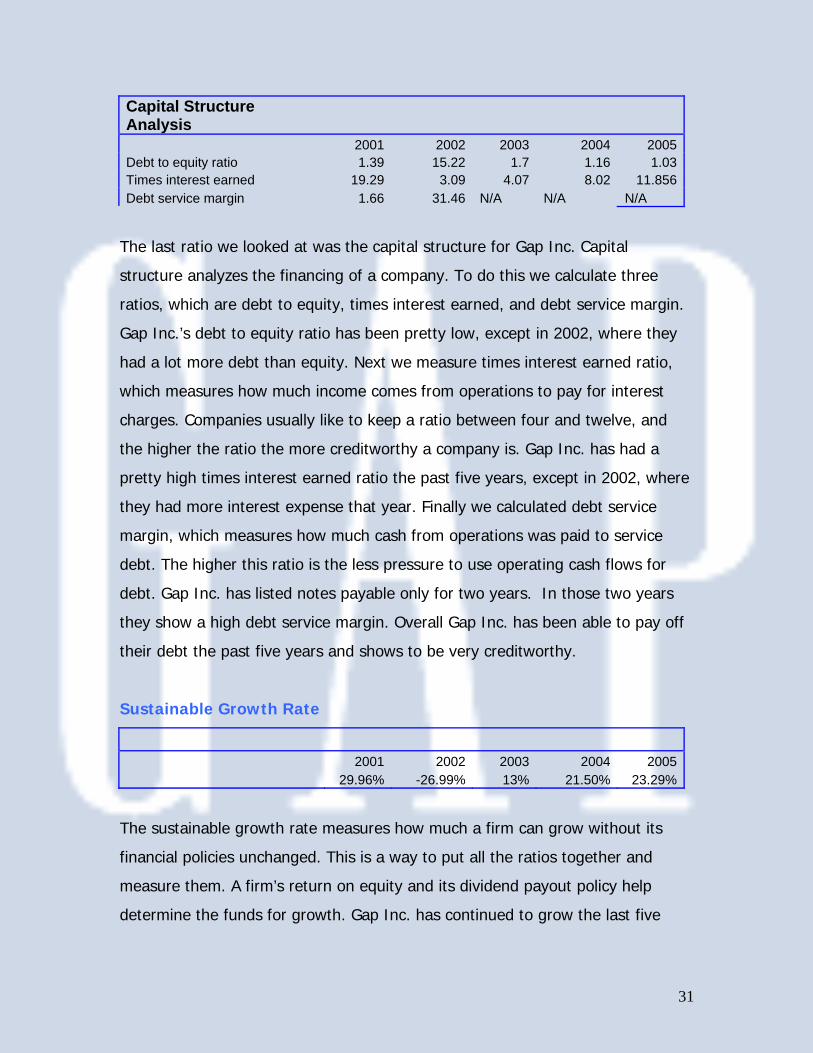
The last ratio we looked at was the capital structure for Gap Inc. Capital
structure analyzes the financing of a company. To do this we calculate three
ratios, which are debt to equity, times interest earned, and debt service margin.
Gap Inc.’s debt to equity ratio has been pretty low, except in 2002, where they
had a lot more debt than equity. Next we measure times interest earned ratio,
which measures how much income comes from operations to pay for interest
charges. Companies usually like to keep a ratio between four and twelve, and
the higher the ratio the more creditworthy a company is. Gap Inc. has had a
pretty high times interest earned ratio the past five years, except in 2002, where
they had more interest expense that year. Finally we calculated debt service
margin, which measures how much cash from operations was paid to service
debt. The higher this ratio is the less pressure to use operating cash flows for
debt. Gap Inc. has listed notes payable only for two years. In those two years
they show a high debt service margin. Overall Gap Inc. has been able to pay off
their debt the past five years and shows to be very creditworthy.
Sustainable Growth Rate
2001 2002 2003 2004 2005 29.96% -26.99% 13% 21.50% 23.29%
The sustainable growth rate measures how much a firm can grow without its
financial policies unchanged. This is a way to put all the ratios together and
measure them. A firm’s return on equity and its dividend payout policy help
determine the funds for growth. Gap Inc. has continued to grow the last five
32
years. They suffered a loss in 2002, which caused them to not grow. Overall they
have kept a constant growth rate around 20 % each year.
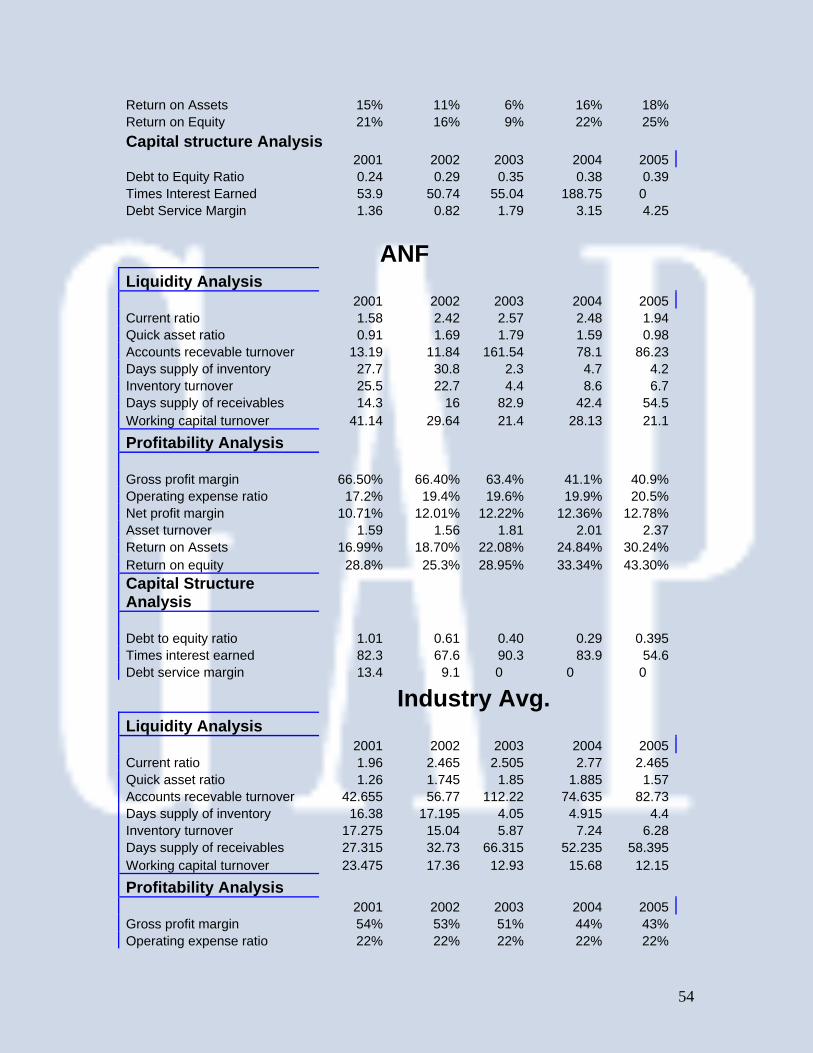
Benchmark Analysis
Liquidity
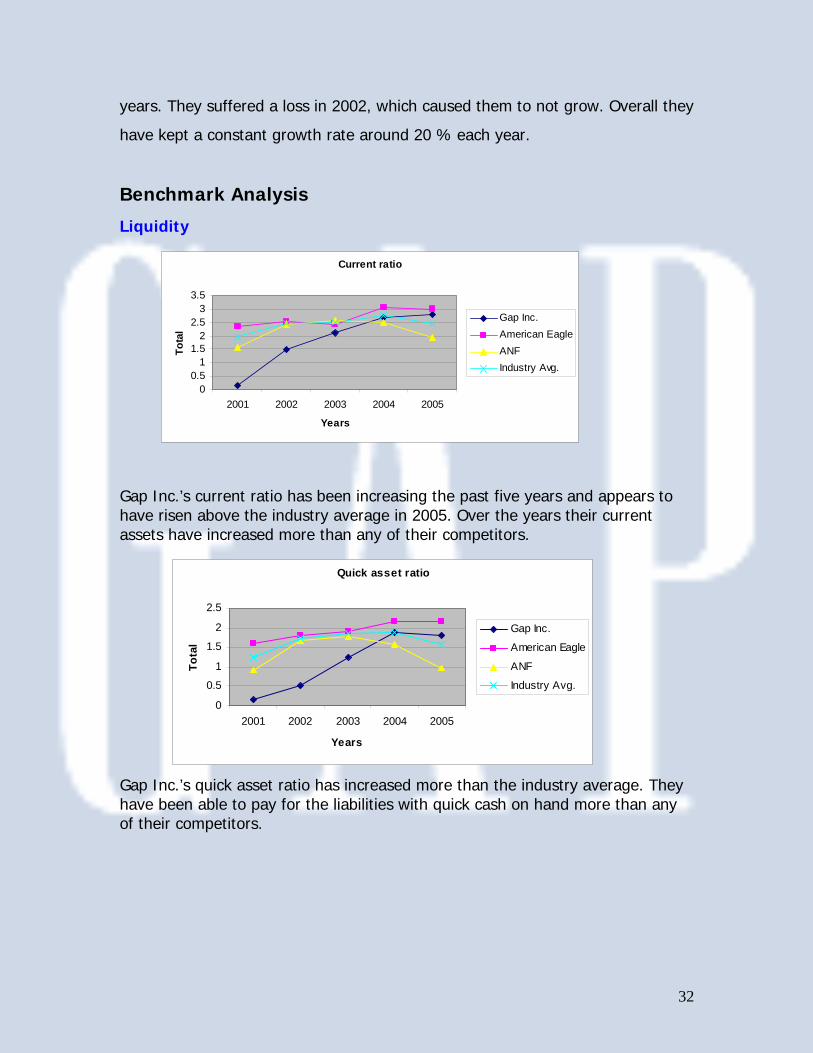
Gap Inc.’s current ratio has been increasing the past five years and appears to have risen above the industry average in 2005. Over the years their current assets have increased more than any of their competitors. Gap Inc.’s quick asset ratio has increased more than the industry average. They have been able to pay for the liabilities with quick cash on hand more than any of their competitors.
Current ratio
00.5
11.5
22.5
33.5
2001 2002 2003 2004 2005
Years
Tota
l
Gap Inc.American EagleANFIndustry Avg.
Quick asset ratio
0
0.5
1
1.5
2
2.5
2001 2002 2003 2004 2005
Years
Tota
l
Gap Inc.
American Eagle
ANF
Industry Avg.
33
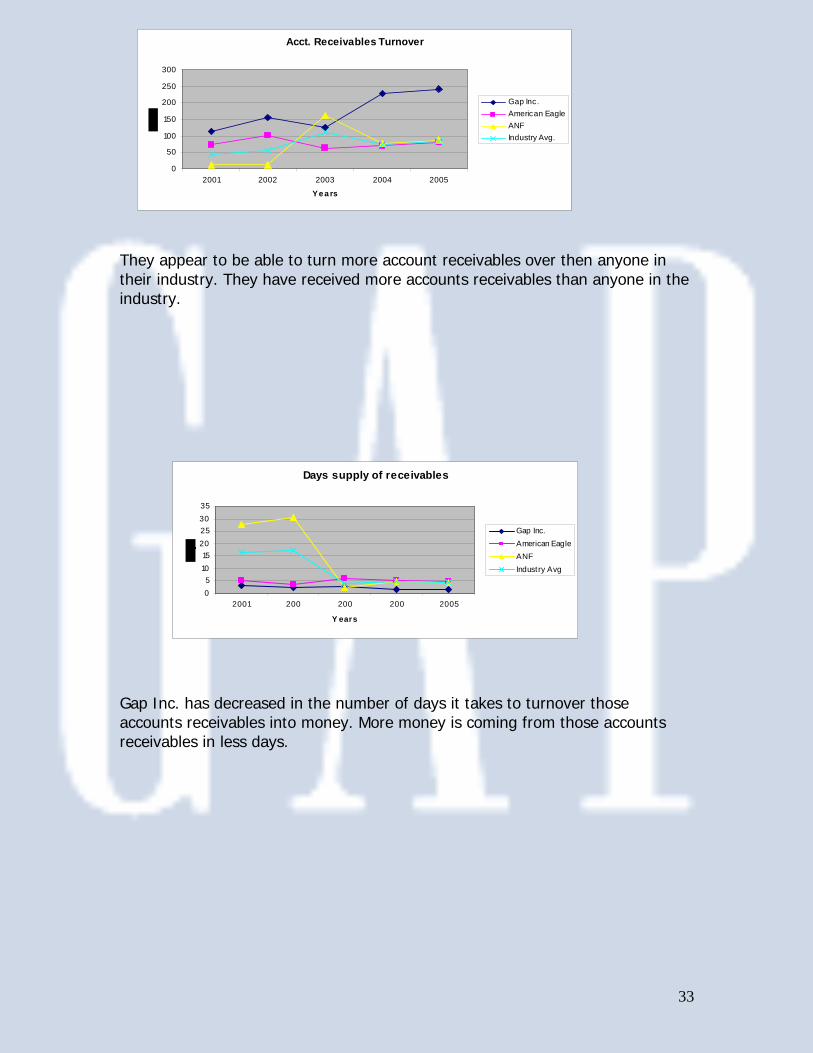
They appear to be able to turn more account receivables over then anyone in their industry. They have received more accounts receivables than anyone in the industry. Gap Inc. has decreased in the number of days it takes to turnover those accounts receivables into money. More money is coming from those accounts receivables in less days.
Acct. Receivables Turnover
0
50
100
150
200
250
300
2001 2002 2003 2004 2005
Ye a rs
Gap Inc.American EagleANFIndustry Avg.
Days supply of receivables
05
1015
20253035
2001 200 200 200 2005
Y ears
Gap Inc.American EagleANFIndustry Avg
34
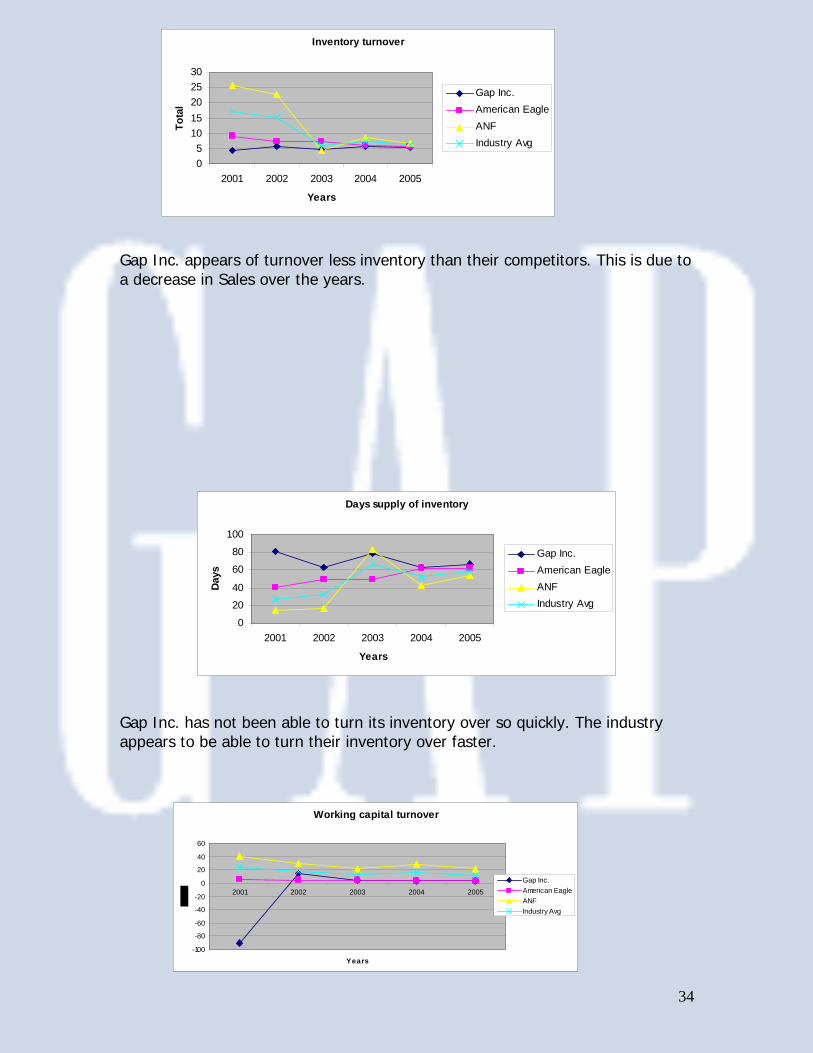
Gap Inc. appears of turnover less inventory than their competitors. This is due to a decrease in Sales over the years. Gap Inc. has not been able to turn its inventory over so quickly. The industry appears to be able to turn their inventory over faster.
Inventory turnover
05
1015202530
2001 2002 2003 2004 2005
Years
Tota
l
Gap Inc.American EagleANFIndustry Avg
Days supply of inventory
0
20
40
60
80
100
2001 2002 2003 2004 2005
Years
Days
Gap Inc.American EagleANFIndustry Avg
Working capital turnover
-100
-80
-60
-40
-20
0
20
40
60
2001 2002 2003 2004 2005
Years
Gap Inc.American EagleANFIndustry Avg
35
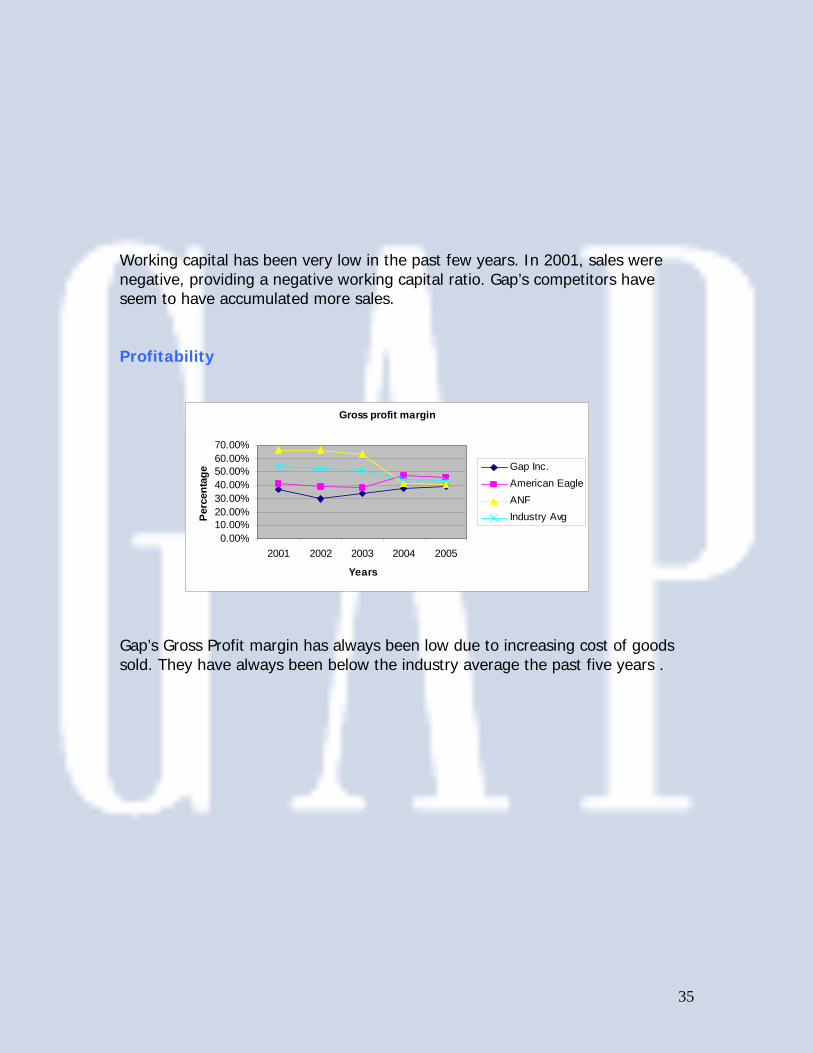
Working capital has been very low in the past few years. In 2001, sales were negative, providing a negative working capital ratio. Gap’s competitors have seem to have accumulated more sales. Profitability Gap’s Gross Profit margin has always been low due to increasing cost of goods sold. They have always been below the industry average the past five years .
Gross profit margin
0.00%10.00%20.00%30.00%40.00%50.00%60.00%70.00%
2001 2002 2003 2004 2005
Years
Perc
enta
ge
Gap Inc.American EagleANFIndustry Avg
36
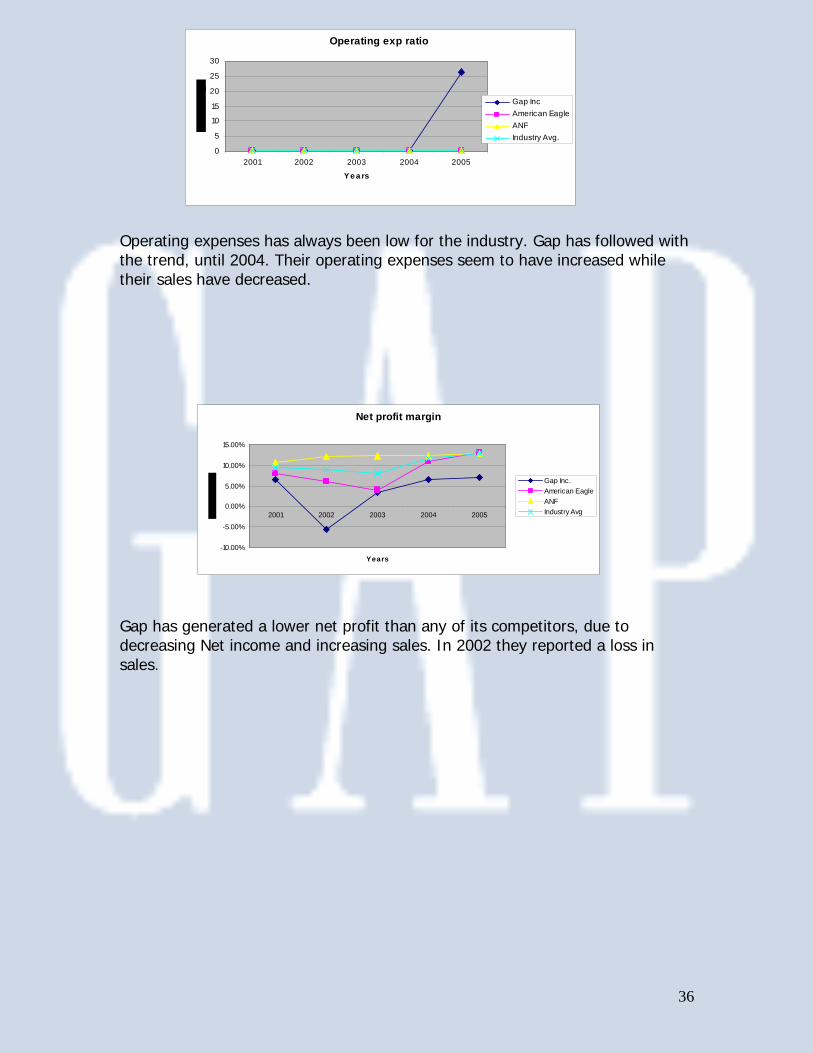
Operating expenses has always been low for the industry. Gap has followed with the trend, until 2004. Their operating expenses seem to have increased while their sales have decreased. Gap has generated a lower net profit than any of its competitors, due to decreasing Net income and increasing sales. In 2002 they reported a loss in sales.
Operating exp ratio
0
5
10
15
20
25
30
2001 2002 2003 2004 2005
Ye a rs
Gap IncAmerican EagleANFIndustry Avg.
Net profit margin
-10.00%
-5.00%
0.00%
5.00%
10.00%
15.00%
2001 2002 2003 2004 2005
Years
Gap Inc.American EagleANFIndustry Avg
37
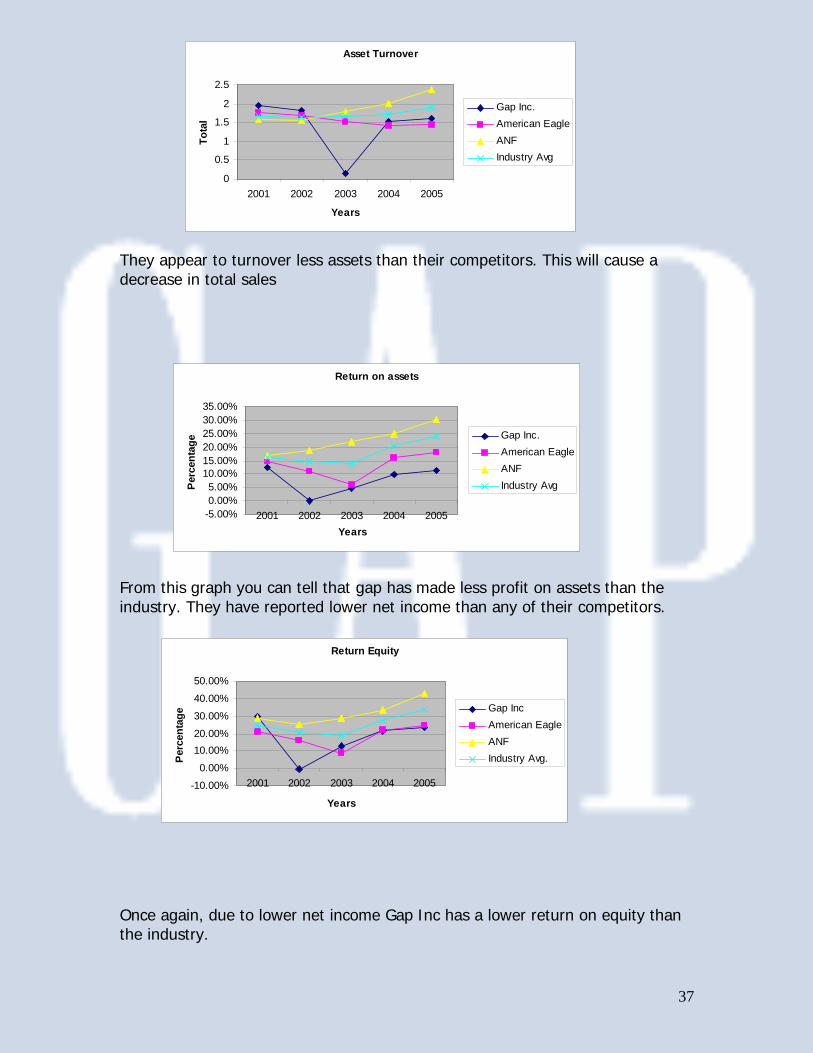
They appear to turnover less assets than their competitors. This will cause a decrease in total sales From this graph you can tell that gap has made less profit on assets than the industry. They have reported lower net income than any of their competitors. Once again, due to lower net income Gap Inc has a lower return on equity than the industry.
Asset Turnover
0
0.5
1
1.5
2
2.5
2001 2002 2003 2004 2005
Years To
tal
Gap Inc.American EagleANFIndustry Avg
Return on assets
-5.00%0.00%5.00%
10.00%15.00%20.00%25.00%30.00%35.00%
2001 2002 2003 2004 2005Years
Perc
enta
ge
Gap Inc.American EagleANFIndustry Avg
Return Equity
-10.00%
0.00%
10.00%20.00%
30.00%
40.00%
50.00%
2001 2002 2003 2004 2005
Years
Perc
enta
ge
Gap IncAmerican EagleANFIndustry Avg.
38
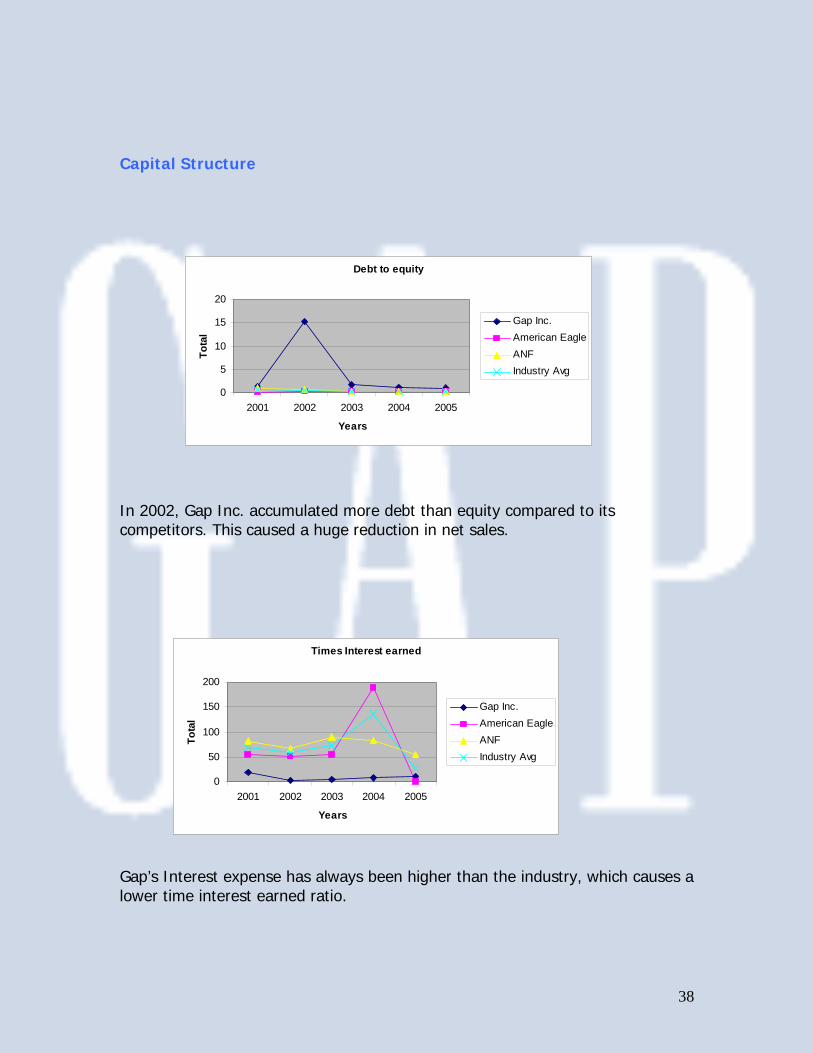
Capital Structure In 2002, Gap Inc. accumulated more debt than equity compared to its competitors. This caused a huge reduction in net sales. Gap’s Interest expense has always been higher than the industry, which causes a lower time interest earned ratio.
Debt to equity
0
5
10
15
20
2001 2002 2003 2004 2005
Years
Tota
l
Gap Inc.American EagleANFIndustry Avg
Times Interest earned
0
50
100
150
200
2001 2002 2003 2004 2005
Years
Tota
l
Gap Inc.American EagleANFIndustry Avg
39
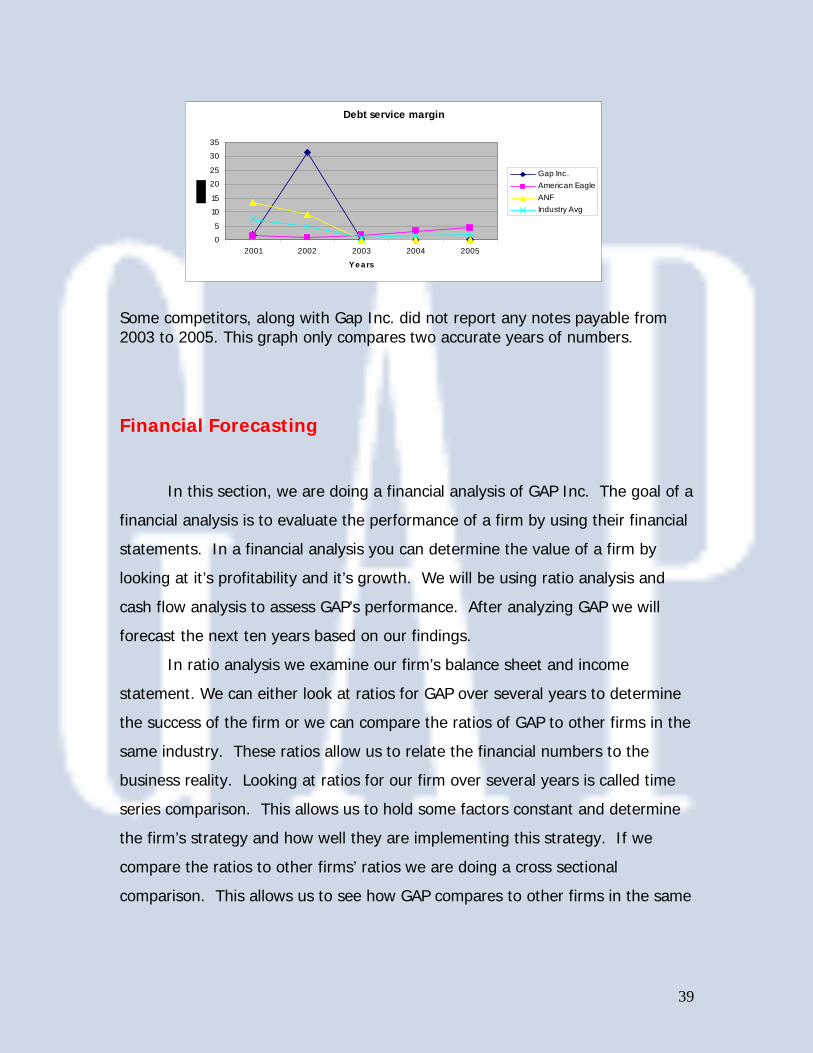
Some competitors, along with Gap Inc. did not report any notes payable from 2003 to 2005. This graph only compares two accurate years of numbers. Financial Forecasting In this section, we are doing a financial analysis of GAP Inc. The goal of a
financial analysis is to evaluate the performance of a firm by using their financial
statements. In a financial analysis you can determine the value of a firm by
looking at it’s profitability and it’s growth. We will be using ratio analysis and
cash flow analysis to assess GAP’s performance. After analyzing GAP we will
forecast the next ten years based on our findings.
In ratio analysis we examine our firm’s balance sheet and income
statement. We can either look at ratios for GAP over several years to determine
the success of the firm or we can compare the ratios of GAP to other firms in the
same industry. These ratios allow us to relate the financial numbers to the
business reality. Looking at ratios for our firm over several years is called time
series comparison. This allows us to hold some factors constant and determine
the firm’s strategy and how well they are implementing this strategy. If we
compare the ratios to other firms’ ratios we are doing a cross sectional
comparison. This allows us to see how GAP compares to other firms in the same
Debt service margin
0
5
10
15
20
25
30
35
2001 2002 2003 2004 2005
Ye a rs
Gap Inc.American EagleANFIndustry Avg
40
industry. This lets us determine in what areas they are lacking and what areas
they are excelling in compared to firms in the same industry.
In cash flow analysis we study the firm’s cash flow statements to get
further insights into the firm’s policies. By looking at the cash flow we can find a
number of things that are important to valuing our firm. We can see if our firm
has the ability to pay its interest and long term debt payments from the cash
generated from operations. We can also find if GAP is making a cash surplus
from operations or making enough cash to invest in long term growth. These
things can give us a better idea of the risk of our firm.
Finally after analyzing GAP’s financial statements, we can forecast the
future for the firm. It is important to forecast so we can determine the future of
the firm and if the firm is currently undervalued or overvalued. We can use a
number of methods to determine our forecasting values. You can average past
performances of the firm and assume this past performance will continue.
Sometimes this can provide inaccurate numbers. So values are mean-reverting,
which means that over time they go back to the industry average.
Our financial analysis and forecast of GAP should provide a clearer picture
of the performance of GAP then just scanning their financial statement. This will
allow us to determine the success that GAP has had in implementing strategies
and gaining profitability and growth.
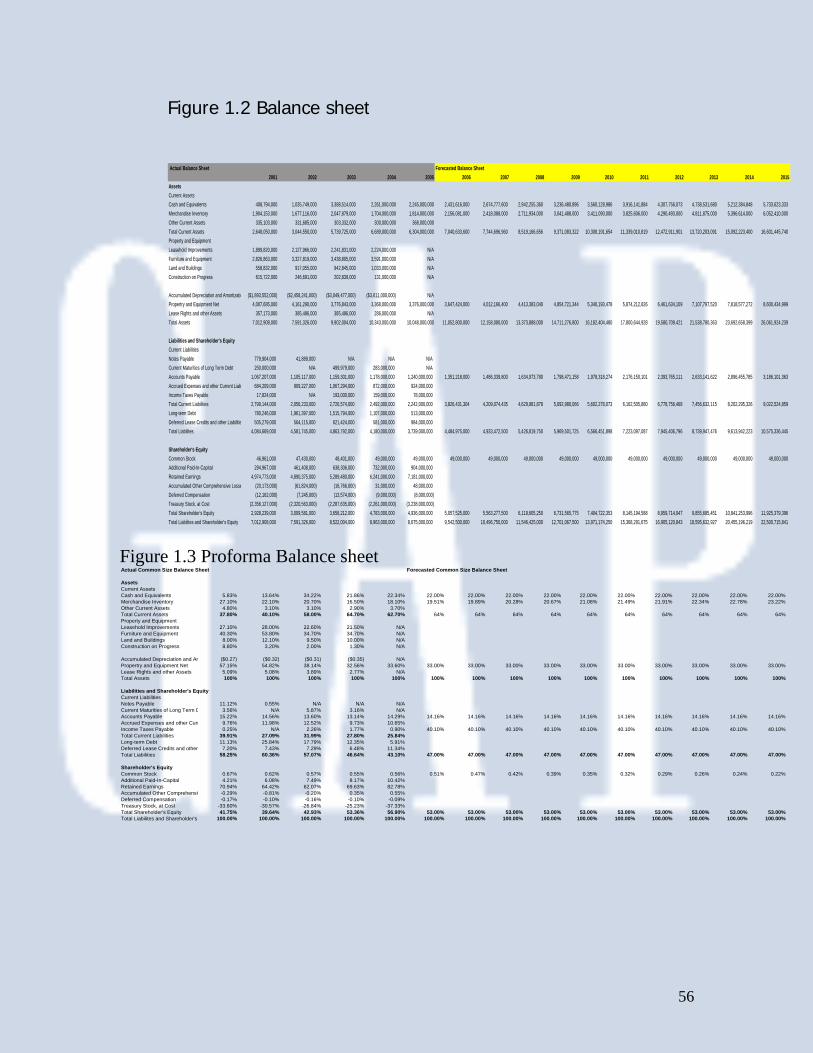
Balance Sheet Forecasting
The accounts on the balance sheet that we feel are the most important to
forecast are accounts payable, total current liabilities, total liabilities, common
stock, total shareholder’s equity, and sales growth. Accounts payable, current
liabilities, and total liabilities show us our debt. Common stock, and total
shareholder’s equity shows us how we are financing our firm through equity.
Sales growth is important because it is what drives our firm. We need a high
41
sales growth to continue creating value for our shareholders. We took the
averages of values off the common size balance sheet to forecast for our actual
balance sheet. The only account forecasted using another method was the total
current liabilities. For this account, we used the current ratio to forecast. While
these projections can prove to be extremely helpful, we realize that these
numbers may not be 100% accurate. If there are any major changes within the
company, the forecasts will deviate from the projections made when forecasted.
Even with the weaknesses in our forecasting method, we feel that the methods
used were the most appropriate for GAP Inc.( Refer to Exhibit B)
Income Statement Forecasting We were able to forecast every account in our income statement. The
most important ones for GAP are net sales, Cost of Goods Sold, Operating
Expenses, and Net Income. Net sales show us how much GAP is selling
throughout its many stores. Cost of Goods sold and operating expenses give us
an overview of the cost of doing business for GAP. We can analyze this and see
where their costs are too high. Net income is also important because it gives us
our final dollar amount that we earned for the year. All of the accounts were
forecasted by taking the average off the common size income statement. As
always the case with forecasting these numbers could be changed by any
change in GAP’s operations.
Cash Flow Forecasting The accounts used in forecasting some of Gap’s Cash Flows were net
earnings, depreciation and amortization, loss on disposable and other, accounts
payable, deferred lease credits and other long term liabilities, net cash provided
by operating activities, net purchase of property and equipment, net cash used
for investing activities, net increase/ decrease in cash and equivalents, and cash
and equivalents for beginning and year end. The majority of the values derived
42
upon forecasting cash flows come simply from the balance sheet and income
statements; either through subtraction of the trailing year, or an average of the
percentage change multiplied by a corresponding number in the balance sheet or
income statement. However, the loss on disposable and other account was
derived through and average of the trailing three years for each year forecasted.
Just as the methods used to forecast the balance sheet, the methods used to
forecast the cash flows can be helpful for figuring ballpark numbers and aid in
decision making. However this forecasting method is based mainly on recent
information and is not always a good predictor to future performance.
Valuation Analysis
So far we have calculated the financial ratios and forecasted financial
statements for the next ten years, which was the first stage of prospective
analysis. In this is section we will complete prospective analysis by valuing Gap
Inc. through different methods. Valuation is important because we can price an
initial public offering and be able to inform parties involved with Gap Inc. on their
actual sales, credit and other business concerns. In order to evaluate a company
we use many different methods, because one method alone cannot provide a
sound basis for a firm valuation. Intrinsic methods along with comparable ratios
must be calculated for the firm in order to get a true picture of what the
company is worth. Also, we need to create a sensitivity analysis which will make
sure that miscalculated costs of capital and growth rates will not give us bad
results. The cost of capital and equity will give us a weighted average cost of
43
capital, which is used in many of our intrinsic valuation models. The following
sections will demonstrate how we use each intrinsic valuation method to value
Gap Inc.
Method of Comparables
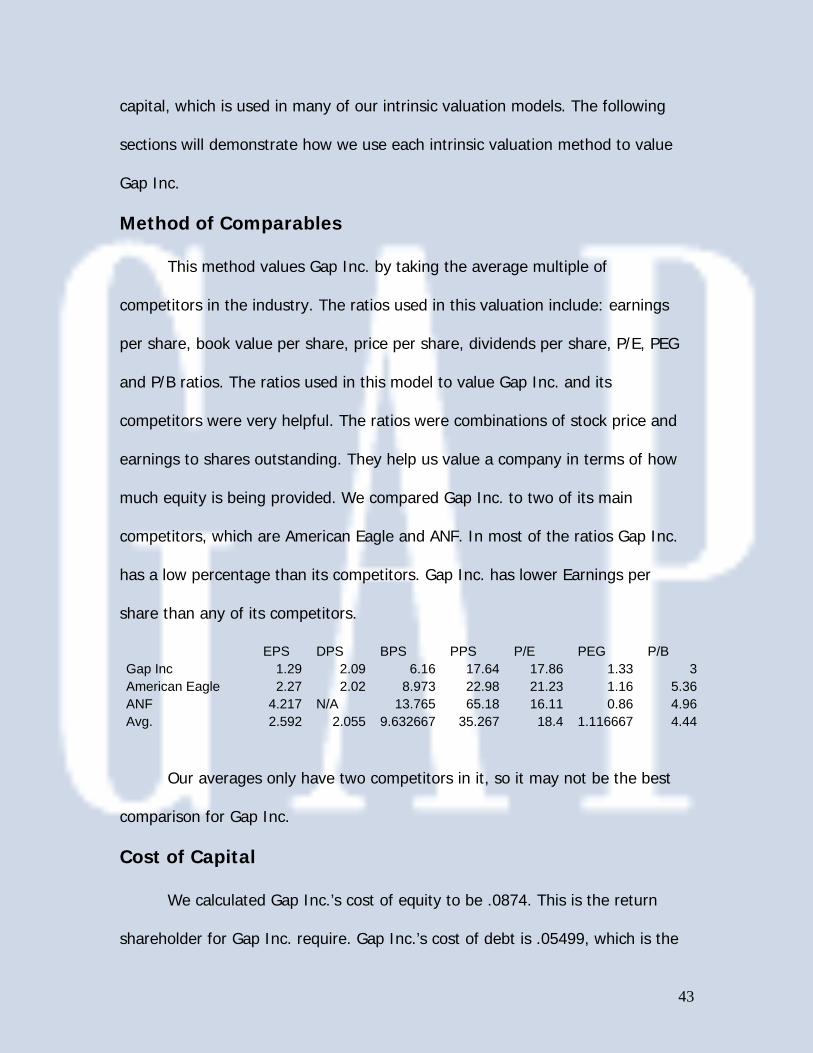
This method values Gap Inc. by taking the average multiple of
competitors in the industry. The ratios used in this valuation include: earnings
per share, book value per share, price per share, dividends per share, P/E, PEG
and P/B ratios. The ratios used in this model to value Gap Inc. and its
competitors were very helpful. The ratios were combinations of stock price and
earnings to shares outstanding. They help us value a company in terms of how
much equity is being provided. We compared Gap Inc. to two of its main
competitors, which are American Eagle and ANF. In most of the ratios Gap Inc.
has a low percentage than its competitors. Gap Inc. has lower Earnings per
share than any of its competitors.
EPS DPS BPS PPS P/E PEG P/B Gap Inc 1.29 2.09 6.16 17.64 17.86 1.33 3American Eagle 2.27 2.02 8.973 22.98 21.23 1.16 5.36ANF 4.217 N/A 13.765 65.18 16.11 0.86 4.96Avg. 2.592 2.055 9.632667 35.267 18.4 1.116667 4.44
Our averages only have two competitors in it, so it may not be the best
comparison for Gap Inc.
Cost of Capital
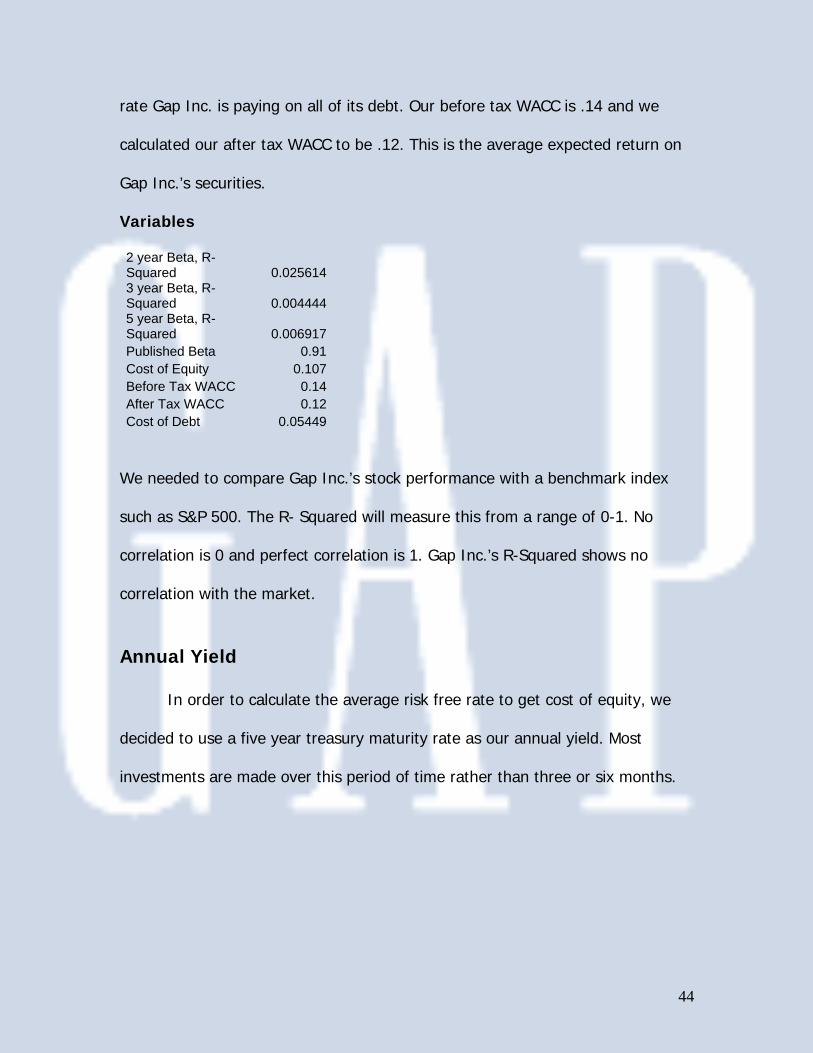
We calculated Gap Inc.’s cost of equity to be .0874. This is the return
shareholder for Gap Inc. require. Gap Inc.’s cost of debt is .05499, which is the
44
rate Gap Inc. is paying on all of its debt. Our before tax WACC is .14 and we
calculated our after tax WACC to be .12. This is the average expected return on
Gap Inc.’s securities.
Variables
2 year Beta, R-Squared 0.025614 3 year Beta, R-Squared 0.004444 5 year Beta, R-Squared 0.006917 Published Beta 0.91 Cost of Equity 0.107 Before Tax WACC 0.14 After Tax WACC 0.12 Cost of Debt 0.05449
We needed to compare Gap Inc.’s stock performance with a benchmark index
such as S&P 500. The R- Squared will measure this from a range of 0-1. No
correlation is 0 and perfect correlation is 1. Gap Inc.’s R-Squared shows no
correlation with the market.
Annual Yield In order to calculate the average risk free rate to get cost of equity, we
decided to use a five year treasury maturity rate as our annual yield. Most
investments are made over this period of time rather than three or six months.
45
Intrinsic Valuation Methods
Free Cash Flow
Free cash flows will give us an estimated share price for the firm. This
model uses the WACC based on a flow of free cash flows. We calculated the free
cash flows by adding the cash flow from operations and investing activities. We
discounted are WACC back to 2005. We calculated the total present value of
annual free cash flows to be $ 6,971,364,299.14. Next, we had to find the
present value of the continuing terminal value, and with no growth we found it
to be $ 19,710,569,476.92. To find the value of the firm we added the present
value of the annual cash flows and the present value of terminal value
perpetuity. We found the value of the firm for 2005 to be $ 13,532,713,935.34.
Finally, we needed to find the estimated price per share at the end of 2005. To
do this we first needed to find the market value of equity, which is calculated by
subtracting the estimated value of the firm by the liabilities. Our estimated
market value of equity came out to be $ 13,527,601,935.34. Finally, divide our
estimated market value of Equity by the number of outstanding shares, to find
an estimated price per share at the end of 2005 to be $15.72. Gap Inc.’s
observed share price at the end of 2005 was 17.64, which tells us that Gap Inc.
was slightly overvalued. (Refer to 1.8)
46
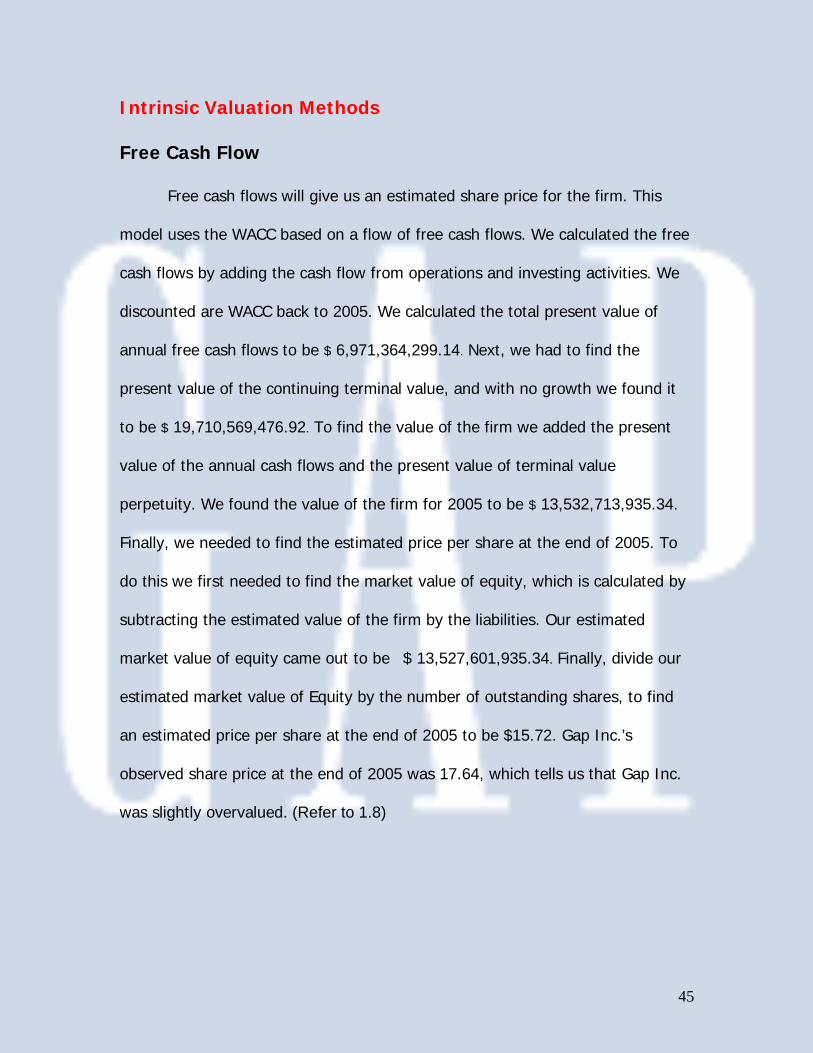
Sensitivity Analysis
WACC 0.095 0.1 0.105 0.11 0.115 0.12 0.125 0.13G 0 17.41 15.94 14.67 13.5 12.4 11.48 10.59 9.79 0.01 19.04 17.37 15.89 14.56 13.37 12.29 11.31 10.42 0.02 21.1 19.13 17.39 15.85 14.49 13.27 12.17 11.17 0.03 23.8 21.38 19.29 17.47 15.87 14.46 13.2 12.07 0.04 27.48 24.39 21.78 19.55 17.63 15.95 14.48 13.17
The sensitivity analysis shows varying WACC and growth estimates. This shows
that as WACC increases with zero growth the share price decreases. The higher
the growth rate the higher the share price varies. Gap Inc.’s observed share
price at the end of 2005 was 17.64, which tells us that Gap Inc. was slightly
overvalued.
Discounted Dividends
This method of valuation uses Ke and the forecasted dividends to value the
firm at a certain time. Gap Inc. kept there dividends constant at $.18 and used a
growth rate of zero, because dividends have not changed. Then, we discounted
back the dividends to 2005 using Ke. We calculated a share value of $0.17 at the
end of 2005. The observed price per share for Gap Inc., at end of 2005, was
$17.64. Using the discounted dividends method, Gap Inc. is way over-valued.
The reason for this maybe that Gap Inc. pays low dividends and this model only
values a company by their dividends. This is not a good model to value Gap Inc.

47
From the sensitivity analysis you can see the growth rate cannot be very high.
Just to get to price per share, the growth rate would have to be than 1 %. This
model is not very accurate in valuing Gap Inc., and should not be considered in
the final valuing of this company. (Refer to 1.7)
Residual Income
In this model we calculated a stream of residual incomes for the next 10
years, including a terminal value, and then discounted all the numbers back to
the present time. First we had to find the ending book value of equity which we
found by adding the book value of equity with the earning per share, then
subtracting the dividends per share. Then we needed to find the normal income,
which we did by multiplying Ke with the beginning book value of equity from the
previous years. The difference between earnings per share and normal income is
the residual income. We then discounted the residual income from forecast and
found present value of residual income. Adding the book value of equity, present
value of RI, and present value of terminal value at the end 2005 we estimated a
Ke g 0.07 0.08 0.0874 0.095 0.105 0.1150.000 2.5714 1.2857 2.05 1.894 1.714 1.5650.040 6 1.3846 4 3.27 2.769 2.40.060 18 1.5 6.569 5.14 4 3.270.080 -18 4.5 24.32 12 7.2 5.140.100 -6 -9 -14.3 -36 36 120.120 -3.6 -4.5 -5.52 -7.2 -12 -360.130 -3 -3.6 -4.225 -5.14 -7.2 -12
48
share price of $7.97. The actual share price was $17.64. Using this model, Gap
Inc. is way over valued. (Refer to 1.9)
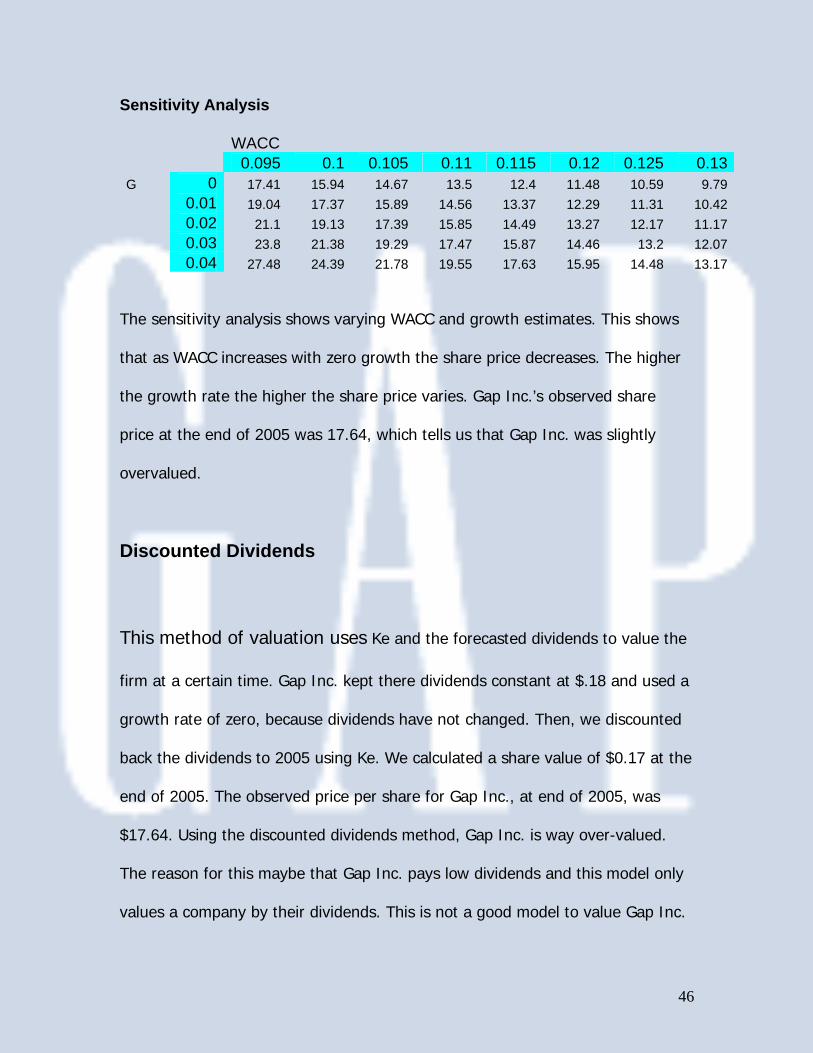
The sensitivity analysis for residual income measures Ke and growth rate.
The more growth and higher Ke the lower the share price.
0 0.05 0.1 0.15 Ke 0.08 $7.59 $7.54 $7.44 $7.29
0.1 $5.49 $5.44 $5.34 $5.19 0.12 $4.16 $4.11 $4.01 $3.86 0.14 $3.26 $3.21 $3.11 $2.96 0.16 $2.63 $2.58 $2.48 $2.33
This analysis does not have extreme changed in share price when
changing the growth rate. On the other hand, if our Ke increases by a lot then
Gap Inc. will have a lower share price.
Abnormal Earnings Growth
The abnormal earnings growth valuation involves calculating the
book value of equity plus the present value of expected future abnormal
earnings. Abnormal earnings are expected net income minus the normalized
income multiplied by the discount rate. The stock will be overvalued or
undervalued depending on whether expected earnings are more or less than
normal income. If there is a low value for abnormal earnings, then a firm shows
negative future stock returns. If there is a high value for abnormal earnings,
49
then the complete opposite, positive future stock returns, occurs. In our case,
GAP Inc. has a low value for AEG; therefore we can predict that there will be
negative future stock returns. ( Refer to 2.1)
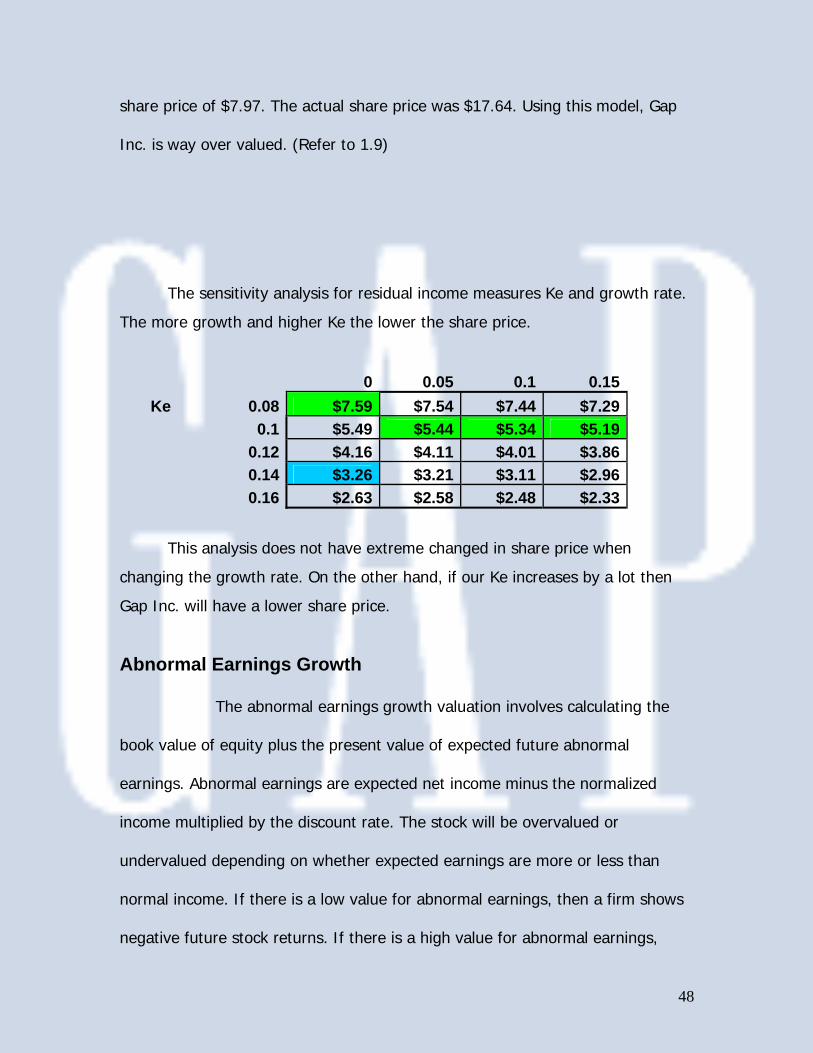
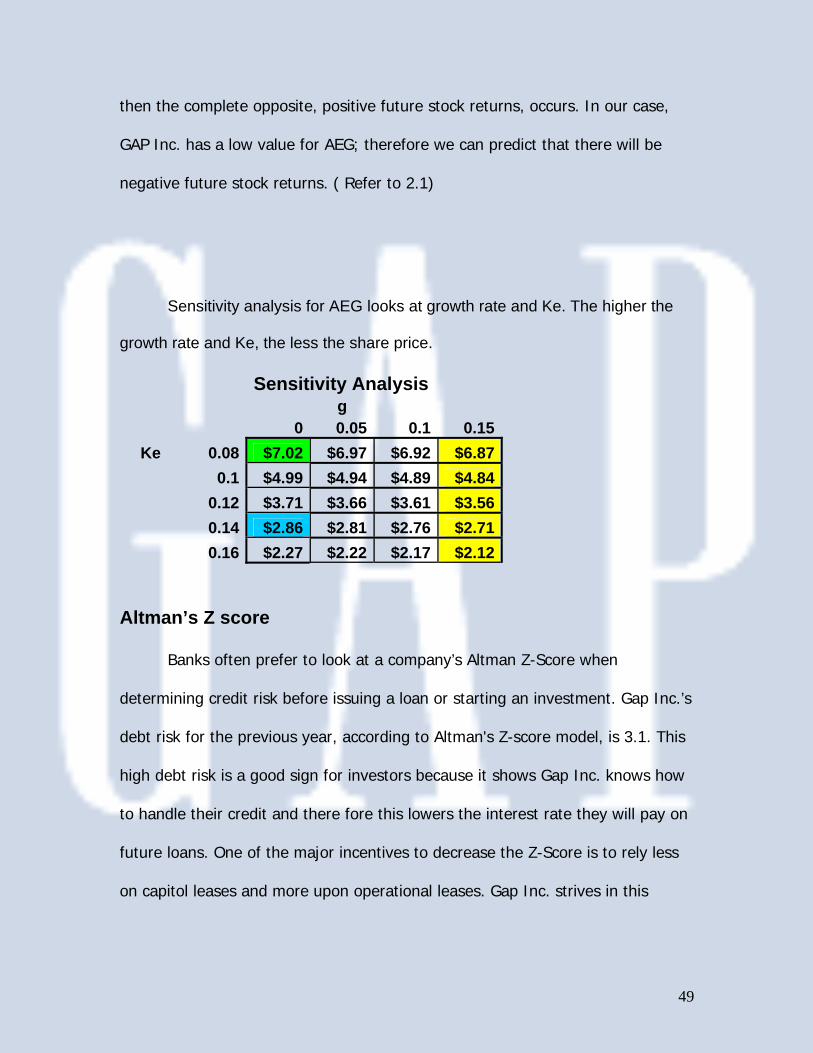
Sensitivity analysis for AEG looks at growth rate and Ke. The higher the
growth rate and Ke, the less the share price.
Sensitivity Analysis g 0 0.05 0.1 0.15
Ke 0.08 $7.02 $6.97 $6.92 $6.87 0.1 $4.99 $4.94 $4.89 $4.84 0.12 $3.71 $3.66 $3.61 $3.56 0.14 $2.86 $2.81 $2.76 $2.71 0.16 $2.27 $2.22 $2.17 $2.12
Altman’s Z score
Banks often prefer to look at a company’s Altman Z-Score when
determining credit risk before issuing a loan or starting an investment. Gap Inc.’s
debt risk for the previous year, according to Altman's Z-score model, is 3.1. This
high debt risk is a good sign for investors because it shows Gap Inc. knows how
to handle their credit and there fore this lowers the interest rate they will pay on
future loans. One of the major incentives to decrease the Z-Score is to rely less
on capitol leases and more upon operational leases. Gap Inc. strives in this
50
department because they use mainly operational leases for there stores and
warehouses.
Z score:
1.2(5239-1942/8821)+ 1.4(1113/8821)+ 3.3(1745/8821)+ 0.6(14.6/3396)+ 1.0(16023/8821) = 3.1
Summary of valuations
For Gap Inc., some of the intrinsic valuations do not resemble the
valuation for the company. The company appears to be way over valued by each
method. Free Cash Flow method comes the closest to valuing Gap Inc.
Free Cash Flows is clearly the best method to use when valuing Gap Inc. The
other methods valuate to much on dividends paid or earnings rather than cash
from operations or investments.
Estimated share price
Free Cash flow 11.48Residual Income 7.97Abnormal Earnings Growth 6.97LR ROI 11Actual Price 17.64
51
References 1. www.finance .yahoo.com 2. www.morngstar.com 3. www.edgarscan.pwcglobal.com 4. www.gapinc.com/public/Investors/investors.shtml
52
Appendix 1.1 Ratio Forecast 1.2 Balance Sheet 1.3 Proforma Balance Sheet 1.4 Income Statement 1.5 Proforma Income Statement 1.6 Cash Flows 1.7 Discounted Dividends 1.8 Free Cash Flows 1.9 Residual Income 2.0 LR ROI 2.1 AEG 2.2 Weighted Avg. cost of equity 2.3 Weighted Avg. cost of debt
53
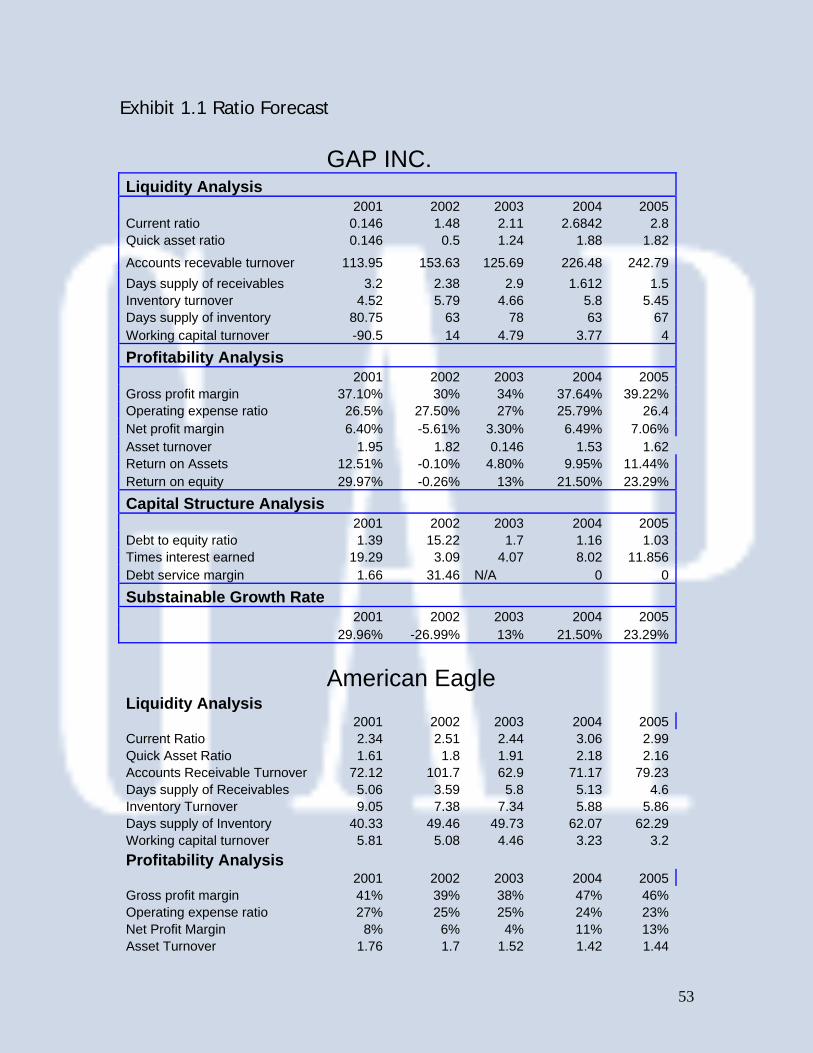
Exhibit 1.1 Ratio Forecast
GAP INC.
Liquidity Analysis 2001 2002 2003 2004 2005Current ratio 0.146 1.48 2.11 2.6842 2.8Quick asset ratio 0.146 0.5 1.24 1.88 1.82
Accounts recevable turnover 113.95 153.63 125.69 226.48 242.79Days supply of receivables 3.2 2.38 2.9 1.612 1.5Inventory turnover 4.52 5.79 4.66 5.8 5.45Days supply of inventory 80.75 63 78 63 67Working capital turnover -90.5 14 4.79 3.77 4
Profitability Analysis 2001 2002 2003 2004 2005Gross profit margin 37.10% 30% 34% 37.64% 39.22%Operating expense ratio 26.5% 27.50% 27% 25.79% 26.4Net profit margin 6.40% -5.61% 3.30% 6.49% 7.06%Asset turnover 1.95 1.82 0.146 1.53 1.62Return on Assets 12.51% -0.10% 4.80% 9.95% 11.44%Return on equity 29.97% -0.26% 13% 21.50% 23.29%
Capital Structure Analysis 2001 2002 2003 2004 2005Debt to equity ratio 1.39 15.22 1.7 1.16 1.03Times interest earned 19.29 3.09 4.07 8.02 11.856Debt service margin 1.66 31.46 N/A 0 0
Substainable Growth Rate 2001 2002 2003 2004 2005 29.96% -26.99% 13% 21.50% 23.29%
American Eagle Liquidity Analysis 2001 2002 2003 2004 2005Current Ratio 2.34 2.51 2.44 3.06 2.99Quick Asset Ratio 1.61 1.8 1.91 2.18 2.16Accounts Receivable Turnover 72.12 101.7 62.9 71.17 79.23Days supply of Receivables 5.06 3.59 5.8 5.13 4.6Inventory Turnover 9.05 7.38 7.34 5.88 5.86Days supply of Inventory 40.33 49.46 49.73 62.07 62.29Working capital turnover 5.81 5.08 4.46 3.23 3.2Profitability Analysis 2001 2002 2003 2004 2005Gross profit margin 41% 39% 38% 47% 46%Operating expense ratio 27% 25% 25% 24% 23%Net Profit Margin 8% 6% 4% 11% 13%Asset Turnover 1.76 1.7 1.52 1.42 1.44
54
Return on Assets 15% 11% 6% 16% 18%Return on Equity 21% 16% 9% 22% 25%Capital structure Analysis 2001 2002 2003 2004 2005Debt to Equity Ratio 0.24 0.29 0.35 0.38 0.39Times Interest Earned 53.9 50.74 55.04 188.75 0 Debt Service Margin 1.36 0.82 1.79 3.15 4.25
ANF
Liquidity Analysis 2001 2002 2003 2004 2005Current ratio 1.58 2.42 2.57 2.48 1.94Quick asset ratio 0.91 1.69 1.79 1.59 0.98Accounts recevable turnover 13.19 11.84 161.54 78.1 86.23Days supply of inventory 27.7 30.8 2.3 4.7 4.2Inventory turnover 25.5 22.7 4.4 8.6 6.7Days supply of receivables 14.3 16 82.9 42.4 54.5Working capital turnover 41.14 29.64 21.4 28.13 21.1
Profitability Analysis Gross profit margin 66.50% 66.40% 63.4% 41.1% 40.9%Operating expense ratio 17.2% 19.4% 19.6% 19.9% 20.5%Net profit margin 10.71% 12.01% 12.22% 12.36% 12.78%Asset turnover 1.59 1.56 1.81 2.01 2.37Return on Assets 16.99% 18.70% 22.08% 24.84% 30.24%Return on equity 28.8% 25.3% 28.95% 33.34% 43.30%Capital Structure Analysis Debt to equity ratio 1.01 0.61 0.40 0.29 0.395Times interest earned 82.3 67.6 90.3 83.9 54.6Debt service margin 13.4 9.1 0 0 0
Industry Avg.
Liquidity Analysis 2001 2002 2003 2004 2005Current ratio 1.96 2.465 2.505 2.77 2.465Quick asset ratio 1.26 1.745 1.85 1.885 1.57Accounts recevable turnover 42.655 56.77 112.22 74.635 82.73Days supply of inventory 16.38 17.195 4.05 4.915 4.4Inventory turnover 17.275 15.04 5.87 7.24 6.28Days supply of receivables 27.315 32.73 66.315 52.235 58.395Working capital turnover 23.475 17.36 12.93 15.68 12.15
Profitability Analysis 2001 2002 2003 2004 2005Gross profit margin 54% 53% 51% 44% 43%Operating expense ratio 22% 22% 22% 22% 22%
55
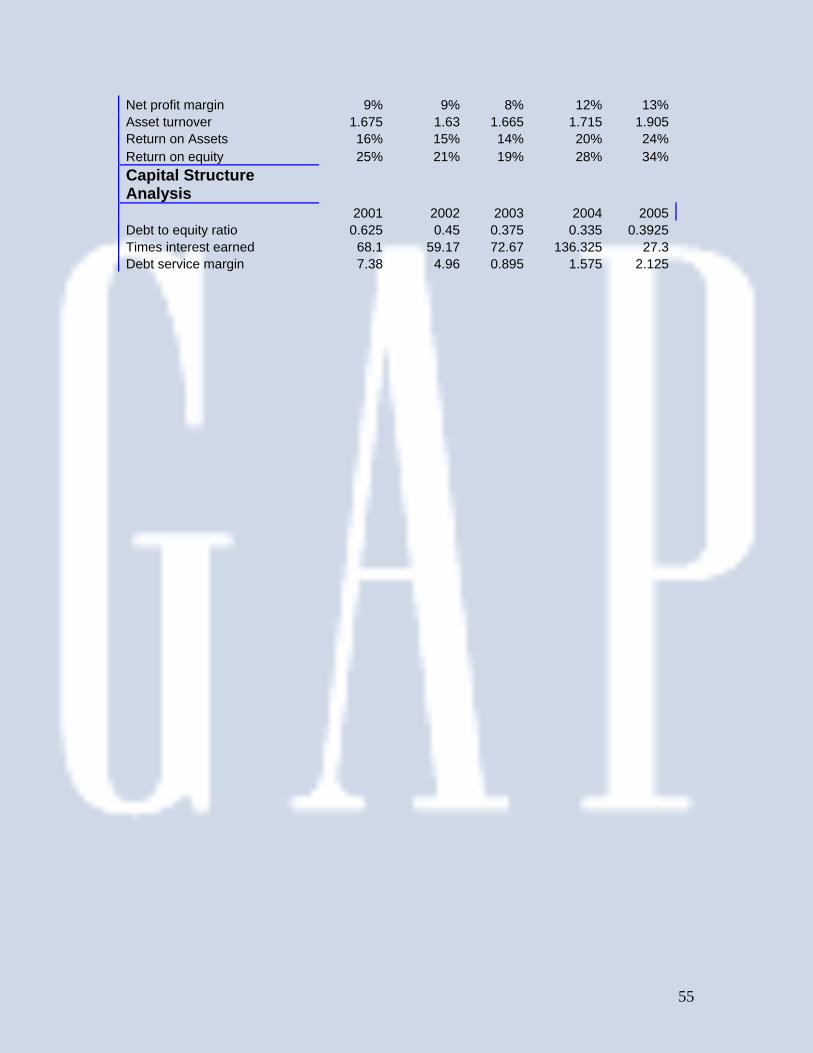
Net profit margin 9% 9% 8% 12% 13%Asset turnover 1.675 1.63 1.665 1.715 1.905Return on Assets 16% 15% 14% 20% 24%Return on equity 25% 21% 19% 28% 34%Capital Structure Analysis 2001 2002 2003 2004 2005Debt to equity ratio 0.625 0.45 0.375 0.335 0.3925Times interest earned 68.1 59.17 72.67 136.325 27.3Debt service margin 7.38 4.96 0.895 1.575 2.125
56
Figure 1.2 Balance sheet Actual Balance Sheet Forecasted Balance Sheet
2001 2002 2003 2004 2005 2006 2007 2008 2009 2010 2011 2012 2013 2014 2015AssetsCurrent AssetsCash and Equivalents 408,794,000 1,035,749,000 3,388,514,000 2,261,000,000 2,245,000,000 2,431,616,000 2,674,777,600 2,942,255,360 3,236,480,896 3,560,128,986 3,916,141,884 4,307,756,073 4,738,531,680 5,212,384,848 5,733,623,333 Merchandise Inventory 1,904,153,000 1,677,116,000 2,047,879,000 1,704,000,000 1,814,000,000 2,156,081,000 2,418,088,000 2,711,934,000 3,041,488,000 3,411,090,000 3,825,606,000 4,290,493,000 4,811,875,000 5,396,614,000 6,052,410,000 Other Current Assets 335,103,000 331,685,000 303,332,000 300,000,000 368,000,000Total Current Assets 2,648,050,000 3,044,550,000 5,739,725,000 6,689,000,000 6,304,000,000 7,040,633,600 7,744,696,960 8,519,166,656 9,371,083,322 10,308,191,654 11,339,010,819 12,472,911,901 13,720,203,091 15,092,223,400 16,601,445,740 Property and EquipmentLeasehold Improvements 1,899,820,000 2,127,966,000 2,241,831,000 2,224,000,000 N/AFurniture and Equipment 2,826,863,000 3,327,819,000 3,438,805,000 3,591,000,000 N/ALand and Buildings 558,832,000 917,055,000 942,845,000 1,033,000,000 N/AConstruction on Progress 615,722,000 246,691,000 202,839,000 131,000,000 N/A
Accumulated Depreciation and Amortizatio ($1,893,552,000) ($2,458,241,000) ($3,049,477,000) ($3,611,000,000) N/APropertry and Equipment Net 4,007,685,000 4,161,290,000 3,776,843,000 3,368,000,000 3,376,000,000 3,647,424,000 4,012,166,400 4,413,383,040 4,854,721,344 5,340,193,478 5,874,212,826 6,461,634,109 7,107,797,520 7,818,577,272 8,600,434,999 Lease Rights and other Assets 357,173,000 385,486,000 385,486,000 286,000,000 N/ATotal Assets 7,012,908,000 7,591,326,000 9,902,004,000 10,343,000,000 10,048,000,000 11,052,800,000 12,158,080,000 13,373,888,000 14,711,276,800 16,182,404,480 17,800,644,928 19,580,709,421 21,538,780,363 23,692,658,399 26,061,924,239
Liabilities and Shareholder's EquityCurrent LiabilitiesNotes Payable 779,904,000 41,889,000 N/A N/A N/ACurrent Maturities of Long Term Debt 250,000,000 N/A 499,979,000 283,000,000 N/AAccounts Payable 1,067,207,000 1,105,117,000 1,159,301,000 1,178,000,000 1,240,000,000 1,351,218,000 1,486,339,800 1,634,973,780 1,798,471,158 1,978,318,274 2,176,150,101 2,393,765,111 2,633,141,622 2,896,455,785 3,186,101,363 Accrued Expenses and other Current Liab 684,209,000 909,227,000 1,067,294,000 872,000,000 924,000,000 Income Taxes Payable 17,824,000 N/A 193,000,000 159,000,000 78,000,000 Total Current Liabilities 2,799,144,000 2,056,233,000 2,726,574,000 2,492,000,000 2,242,000,000 3,826,431,304 4,209,074,435 4,629,981,878 5,092,980,066 5,602,278,073 6,162,505,880 6,778,756,468 7,456,632,115 8,202,295,326 9,022,524,859 Long-term Debt 780,246,000 1,961,397,000 1,515,794,000 1,107,000,000 513,000,000 Deferred Lease Credits and other Liabilitie 505,279,000 564,115,000 621,424,000 581,000,000 984,000,000 Total Liabilites 4,084,669,000 4,581,745,000 4,863,792,000 4,180,000,000 3,739,000,000 4,484,975,000 4,933,472,500 5,426,819,750 5,969,501,725 6,566,451,898 7,223,097,087 7,945,406,796 8,739,947,476 9,613,942,223 10,575,336,445
Shareholder's EquityCommon Stock 46,961,000 47,430,000 48,401,000 49,000,000 49,000,000 49,000,000 49,000,000 49,000,000 49,000,000 49,000,000 49,000,000 49,000,000 49,000,000 49,000,000 49,000,000 Additional Paid-In-Capital 294,967,000 461,408,000 638,306,000 732,000,000 904,000,000 Retained Earnings 4,974,773,000 4,890,375,000 5,289,480,000 6,241,000,000 7,181,000,000 Accumulated Other Comprehensive Losse (20,173,000) (61,824,000) (16,766,000) 31,000,000 48,000,000 Deferred Compensation (12,162,000) (7,245,000) (13,574,000) (9,000,000) (8,000,000) Treasury Stock, at Cost (2,356,127,000) (2,320,563,000) (2,287,635,000) (2,261,000,000) (3,238,000,000) Total Shareholder's Equity 2,928,239,000 3,009,581,000 3,658,212,000 4,783,000,000 4,936,000,000 5,057,525,000 5,563,277,500 6,119,605,250 6,731,565,775 7,404,722,353 8,145,194,588 8,959,714,047 9,855,685,451 10,841,253,996 11,925,379,396 Total Liabilites and Shareholder's Equity 7,012,908,000 7,591,326,000 8,522,004,000 8,963,000,000 8,675,000,000 9,542,500,000 10,496,750,000 11,546,425,000 12,701,067,500 13,971,174,250 15,368,291,675 16,905,120,843 18,595,632,927 20,455,196,219 22,500,715,841
Figure 1.3 Proforma Balance sheet Actual Common Size Balance Sheet Forecasted Common Size Balance Sheet
AssetsCurrent AssetsCash and Equivalents 5.83% 13.64% 34.22% 21.86% 22.34% 22.00% 22.00% 22.00% 22.00% 22.00% 22.00% 22.00% 22.00% 22.00% 22.00%Merchandise Inventory 27.10% 22.10% 20.70% 16.50% 18.10% 19.51% 19.89% 20.28% 20.67% 21.08% 21.49% 21.91% 22.34% 22.78% 23.22%Other Current Assets 4.80% 3.10% 3.10% 2.90% 3.70%Total Current Assets 37.80% 40.10% 58.00% 64.70% 62.70% 64% 64% 64% 64% 64% 64% 64% 64% 64% 64%Property and EquipmentLeasehold Improvements 27.10% 28.00% 22.60% 21.50% N/AFurniture and Equipment 40.30% 53.80% 34.70% 34.70% N/ALand and Buildings 8.00% 12.10% 9.50% 10.00% N/AConstruction on Progress 8.80% 3.20% 2.00% 1.30% N/A
Accumulated Depreciation and Am ($0.27) ($0.32) ($0.31) ($0.35) N/APropertry and Equipment Net 57.15% 54.82% 38.14% 32.56% 33.60% 33.00% 33.00% 33.00% 33.00% 33.00% 33.00% 33.00% 33.00% 33.00% 33.00%Lease Rights and other Assets 5.09% 5.08% 3.89% 2.77% N/ATotal Assets 100% 100% 100% 100% 100% 100% 100% 100% 100% 100% 100% 100% 100% 100% 100%
Liabilities and Shareholder's EquityCurrent LiabilitiesNotes Payable 11.12% 0.55% N/A N/A N/ACurrent Maturities of Long Term D 3.56% N/A 5.87% 3.16% N/AAccounts Payable 15.22% 14.56% 13.60% 13.14% 14.29% 14.16% 14.16% 14.16% 14.16% 14.16% 14.16% 14.16% 14.16% 14.16% 14.16%Accrued Expenses and other Curr 9.76% 11.98% 12.52% 9.73% 10.65%Income Taxes Payable 0.25% N/A 2.26% 1.77% 0.90% 40.10% 40.10% 40.10% 40.10% 40.10% 40.10% 40.10% 40.10% 40.10% 40.10%Total Current Liabilities 39.91% 27.09% 31.99% 27.80% 25.84%Long-term Debt 11.13% 25.84% 17.79% 12.35% 5.91%Deferred Lease Credits and other 7.20% 7.43% 7.29% 6.48% 11.34%Total Liabilities 58.25% 60.36% 57.07% 46.64% 43.10% 47.00% 47.00% 47.00% 47.00% 47.00% 47.00% 47.00% 47.00% 47.00% 47.00%
Shareholder's EquityCommon Stock 0.67% 0.62% 0.57% 0.55% 0.56% 0.51% 0.47% 0.42% 0.39% 0.35% 0.32% 0.29% 0.26% 0.24% 0.22%Additional Paid-In-Capital 4.21% 6.08% 7.49% 8.17% 10.42%Retained Earnings 70.94% 64.42% 62.07% 69.63% 82.78%Accumulated Other Comprehensiv -0.29% -0.81% -0.20% 0.35% 0.55%Deferred Compensation -0.17% -0.10% -0.16% -0.10% -0.09%Treasury Stock, at Cost -33.60% -30.57% -26.84% -25.23% -37.33%Total Shareholder's Equity 41.75% 39.64% 42.93% 53.36% 56.90% 53.00% 53.00% 53.00% 53.00% 53.00% 53.00% 53.00% 53.00% 53.00% 53.00%Total Liabilites and Shareholder's 100.00% 100.00% 100.00% 100.00% 100.00% 100.00% 100.00% 100.00% 100.00% 100.00% 100.00% 100.00% 100.00% 100.00% 100.00%
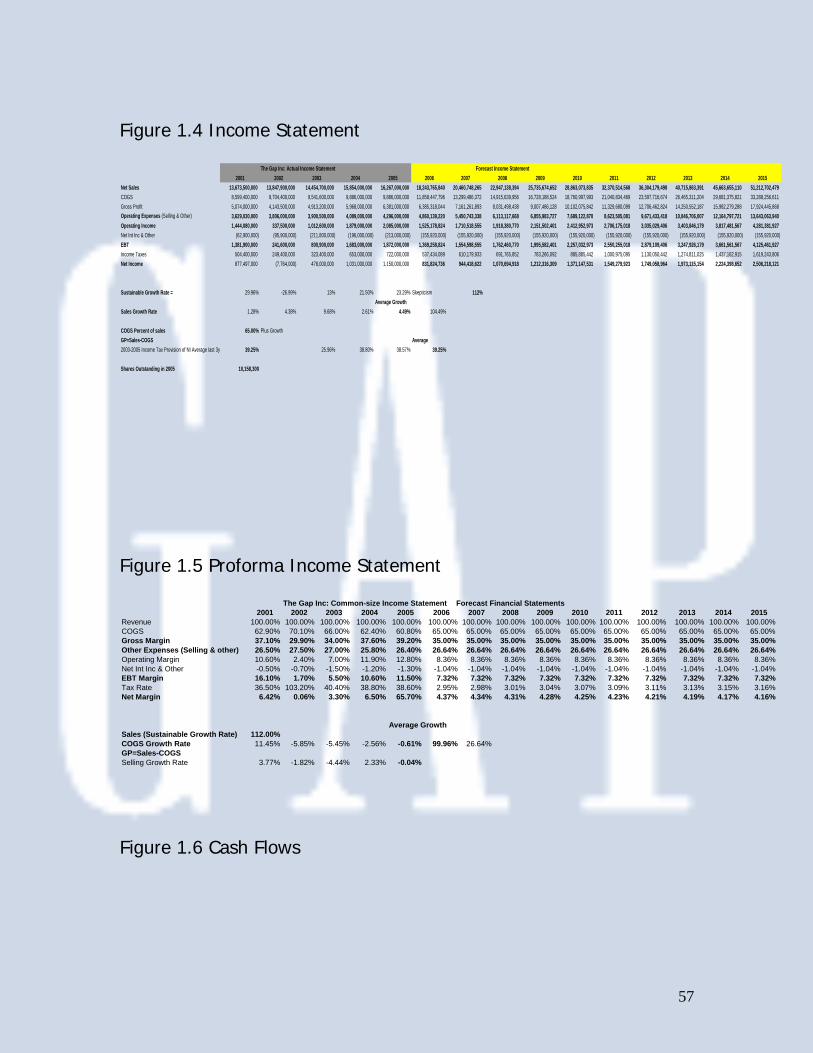
57
Figure 1.4 Income Statement
The Gap Inc: Actual Income Statement Forecast Income Statement2001 2002 2003 2004 2005 2006 2007 2008 2009 2010 2011 2012 2013 2014 2015
Net Sales 13,673,500,000 13,847,900,000 14,454,700,000 15,854,000,000 16,267,000,000 18,243,765,840 20,460,748,265 22,947,138,394 25,735,674,652 28,863,073,835 32,370,514,568 36,304,179,498 40,715,863,391 45,663,655,110 51,212,702,479 COGS 8,599,400,000 9,704,400,000 9,541,600,000 9,886,000,000 9,886,000,000 11,858,447,796 13,299,486,372 14,915,639,956 16,728,188,524 18,760,997,993 21,040,834,469 23,597,716,674 26,465,311,204 29,681,375,821 33,288,256,611 Gross Profit 5,074,000,000 4,143,500,000 4,913,200,000 5,968,000,000 6,381,000,000 6,385,318,044 7,161,261,893 8,031,498,438 9,007,486,128 10,102,075,842 11,329,680,099 12,706,462,824 14,250,552,187 15,982,279,288 17,924,445,868 Operating Expenses (Selling & Other) 3,629,030,000 3,806,000,000 3,900,500,000 4,089,000,000 4,296,000,000 4,860,139,220 5,450,743,338 6,113,117,668 6,855,983,727 7,689,122,870 8,623,505,081 9,671,433,418 10,846,706,007 12,164,797,721 13,643,063,940 Operating Income 1,444,080,000 337,500,000 1,012,600,000 1,879,000,000 2,085,000,000 1,525,178,824 1,710,518,555 1,918,380,770 2,151,502,401 2,412,952,973 2,706,175,018 3,035,029,406 3,403,846,179 3,817,481,567 4,281,381,927 Net Int Inc & Other (62,900,000) (95,900,000) (211,800,000) (196,000,000) (213,000,000) (155,920,000) (155,920,000) (155,920,000) (155,920,000) (155,920,000) (155,920,000) (155,920,000) (155,920,000) (155,920,000) (155,920,000) EBT 1,381,900,000 241,600,000 800,900,000 1,683,000,000 1,872,000,000 1,369,258,824 1,554,598,555 1,762,460,770 1,995,582,401 2,257,032,973 2,550,255,018 2,879,109,406 3,247,926,179 3,661,561,567 4,125,461,927 Income Taxes 504,400,000 249,400,000 323,400,000 653,000,000 722,000,000 537,434,089 610,179,933 691,765,852 783,266,092 885,885,442 1,000,975,095 1,130,050,442 1,274,811,025 1,437,162,915 1,619,243,806 Net Income 877,497,000 (7,764,000) 478,000,000 1,031,000,000 1,150,000,000 831,824,736 944,418,622 1,070,694,918 1,212,316,309 1,371,147,531 1,549,279,923 1,749,058,964 1,973,115,154 2,224,398,652 2,506,218,121
Sustainable Growth Rate = 29.96% -26.99% 13% 21.50% 23.29% Skepticism 112%Average Growth
Sales Growth Rate 1.28% 4.38% 9.68% 2.61% 4.49% 104.49%
COGS Percent of sales 65.00% Plus GrowthGP=Sales-COGS Average2003-2005 Income Tax Provision of NI Average last 3y 39.25% 25.96% 38.80% 38.57% 39.25%
Shares Outstanding in 2005 10,158,300
Figure 1.5 Proforma Income Statement
The Gap Inc: Common-size Income Statement Forecast Financial Statements2001 2002 2003 2004 2005 2006 2007 2008 2009 2010 2011 2012 2013 2014 2015
Revenue 100.00% 100.00% 100.00% 100.00% 100.00% 100.00% 100.00% 100.00% 100.00% 100.00% 100.00% 100.00% 100.00% 100.00% 100.00%COGS 62.90% 70.10% 66.00% 62.40% 60.80% 65.00% 65.00% 65.00% 65.00% 65.00% 65.00% 65.00% 65.00% 65.00% 65.00%Gross Margin 37.10% 29.90% 34.00% 37.60% 39.20% 35.00% 35.00% 35.00% 35.00% 35.00% 35.00% 35.00% 35.00% 35.00% 35.00%Other Expenses (Selling & other) 26.50% 27.50% 27.00% 25.80% 26.40% 26.64% 26.64% 26.64% 26.64% 26.64% 26.64% 26.64% 26.64% 26.64% 26.64%Operating Margin 10.60% 2.40% 7.00% 11.90% 12.80% 8.36% 8.36% 8.36% 8.36% 8.36% 8.36% 8.36% 8.36% 8.36% 8.36%Net Int Inc & Other -0.50% -0.70% -1.50% -1.20% -1.30% -1.04% -1.04% -1.04% -1.04% -1.04% -1.04% -1.04% -1.04% -1.04% -1.04%EBT Margin 16.10% 1.70% 5.50% 10.60% 11.50% 7.32% 7.32% 7.32% 7.32% 7.32% 7.32% 7.32% 7.32% 7.32% 7.32%Tax Rate 36.50% 103.20% 40.40% 38.80% 38.60% 2.95% 2.98% 3.01% 3.04% 3.07% 3.09% 3.11% 3.13% 3.15% 3.16%Net Margin 6.42% 0.06% 3.30% 6.50% 65.70% 4.37% 4.34% 4.31% 4.28% 4.25% 4.23% 4.21% 4.19% 4.17% 4.16%
Average GrowthSales (Sustainable Growth Rate) 112.00%COGS Growth Rate 11.45% -5.85% -5.45% -2.56% -0.61% 99.96% 26.64%GP=Sales-COGSSelling Growth Rate 3.77% -1.82% -4.44% 2.33% -0.04%
Figure 1.6 Cash Flows
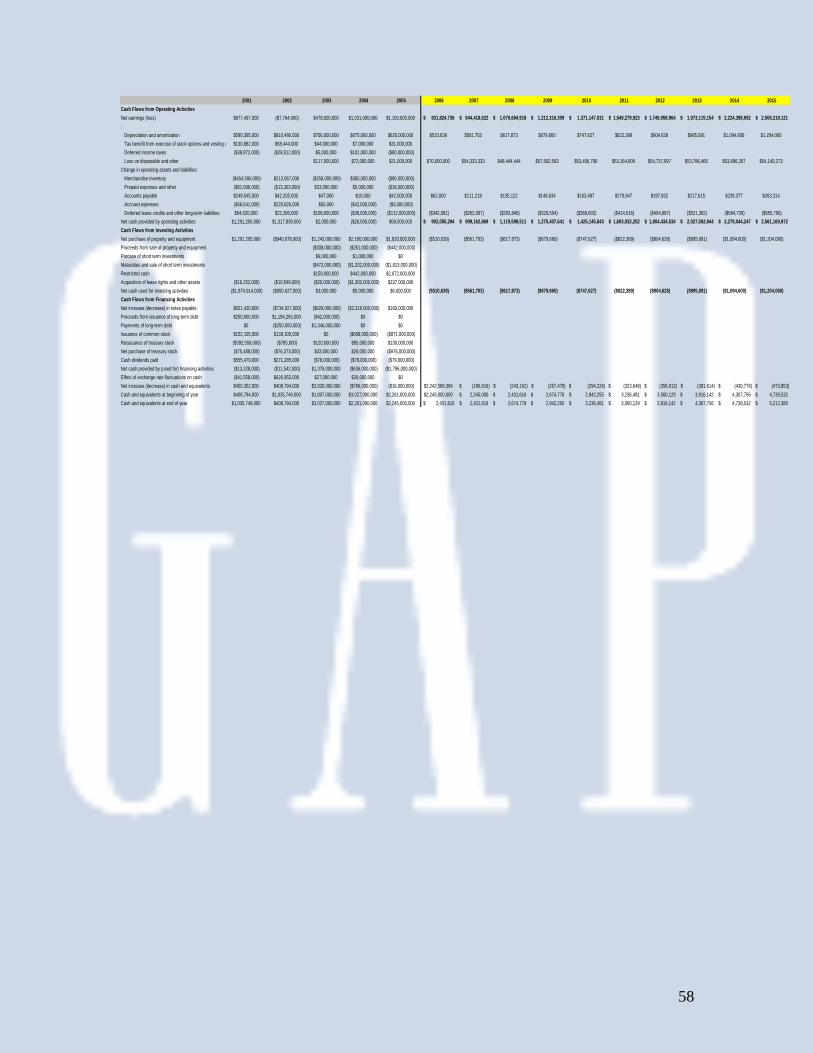
58
2001 2002 2003 2004 2005 2006 2007 2008 2009 2010 2011 2012 2013 2014 2015Cash Flows from Operating ActivitiesNet earnings (loss) $877,497,000 ($7,764,000) $478,000,000 $1,031,000,000 $1,150,000,000 831,824,736$ 944,418,622$ 1,070,694,918$ 1,212,316,309$ 1,371,147,531$ 1,549,279,923$ 1,749,058,964$ 1,973,115,154$ 2,224,398,652$ 2,506,218,121$ : Depreciation and amortization $590,365,000 $810,486,000 $706,000,000 $675,000,000 $620,000,000 $510,639 $561,703 $617,873 $679,660 $747,627 $822,389 $904,628 $995,091 $1,094,600 $1,204,060 Tax benefit from exercise of stock options and vesting o $130,882,000 $58,444,000 $44,000,000 $7,000,000 $31,000,000 Deferred income taxes ($38,872,000) ($28,512,000) $5,000,000 $101,000,000 ($80,000,000) Loss on disposable and other $117,000,000 $72,000,000 $21,000,000 $70,000,000 $54,333,333 $48,444,444 $57,592,593 $53,456,790 $53,164,609 $54,737,997 $53,786,465 $53,896,357 $54,140,273Change in operating assets and liabilities: Merchandise inventory ($454,595,000) $213,067,000 ($258,000,000) $385,000,000 ($90,000,000) Prepaid expenses and other ($61,096,000) ($13,303,000) $33,000,000 $5,000,000 ($18,000,000) Accounts payable $249,545,000 $42,205,000 $47,000 $10,000 $42,000,000 $62,000 $111,218 $135,122 $148,634 $163,497 $179,847 $197,832 $217,615 $239,377 $263,314 Accrued expenses ($56,541,000) $220,826,000 $55,000 ($42,000,000) ($3,000,000) Deferred lease credits and other long-term liabilities $54,020,000 $22,390,000 $108,000,000 ($38,000,000) ($112,000,000) ($342,081) ($262,007) ($293,846) ($329,554) ($369,602) ($414,516) ($464,887) ($521,382) ($584,739) ($655,796)Net cash provided by operating activities $1,291,205,000 $1,317,839,000 $2,000,000 ($26,000,000) $59,000,000 902,055,294$ 999,162,869$ 1,119,598,511$ 1,270,407,641$ 1,425,145,843$ 1,603,032,252$ 1,804,434,534$ 2,027,592,944$ 2,279,044,247$ 2,561,169,972$ Cash Flows from Investing ActivitiesNet purchase of property and equipment $1,291,205,000 ($940,078,000) $1,243,000,000 $2,160,000,000 $1,620,000,000 ($510,639) ($561,703) ($617,873) ($679,660) ($747,627) ($822,389) ($904,628) ($995,091) ($1,094,600) ($1,204,060)Proceeds from sale of property and equipment ($308,000,000) ($261,000,000) ($442,000,000)Purcase of short term investments $9,000,000 $1,000,000 $0Maturaties and sale of short term investments ($472,000,000) ($1,202,000,000) ($1,813,000,000)Restricted cash $159,000,000 $442,000,000 $2,072,000,000Acquisition of lease rights and other assets ($16,252,000) ($10,549,000) ($20,000,000) ($1,303,000,000) $337,000,000Net cash used for investing activities ($1,874,914,000) ($950,627,000) $3,000,000 $5,000,000 $6,000,000 ($510,639) ($561,703) ($617,873) ($679,660) ($747,627) ($822,389) ($904,628) ($995,091) ($1,094,600) ($1,204,060)Cash Flows from Financing ActivitiesNet increase (decrease) in notes payable $621,420,000 ($734,927,000) ($629,000,000) ($2,318,000,000) $160,000,000Proceeds from issuance of long-term debt $250,000,000 $1,194,265,000 ($42,000,000) $0 $0Payments of long-term debt $0 ($250,000,000) $1,346,000,000 $0 $0Issuance of common stock $152,105,000 $139,105,000 $0 ($668,000,000) ($871,000,000)Reissuance of treasury stock ($392,558,000) ($785,000) $120,000,000 $85,000,000 $130,000,000Net purchase of treasury stock ($75,488,000) ($76,373,000) $33,000,000 $26,000,000 ($976,000,000)Cash dividends paid $555,479,000 $271,285,000 ($78,000,000) ($79,000,000) ($79,000,000)Net cash provided by (used for) financing activities ($13,328,000) ($11,542,000) $1,379,000,000 ($636,000,000) ($1,796,000,000)Effect of exchange rate fluctuations on cash ($41,558,000) $626,955,000 $27,000,000 $28,000,000 $0Net increase (decrease) in cash and equivalents $450,352,000 $408,794,000 $2,020,000,000 ($766,000,000) ($16,000,000) $2,242,568,384 (186,616)$ (243,162)$ (267,478)$ (294,226)$ (323,648)$ (356,013)$ (391,614)$ (430,776)$ (473,853)$ Cash and equivalents at beginning of year $408,794,000 $1,035,749,000 $1,007,000,000 $3,027,000,000 $2,261,000,000 $2,245,000,000 2,245,000$ 2,431,616$ 2,674,778$ 2,942,255$ 3,236,481$ 3,560,129$ 3,916,142$ 4,307,756$ 4,738,532$ Cash and equivalents at end of year $1,035,749,000 $408,794,000 $3,027,000,000 $2,261,000,000 $2,245,000,000 2,431,616$ 2,431,616$ 2,674,778$ 2,942,255$ 3,236,481$ 3,560,129$ 3,916,142$ 4,307,756$ 4,738,532$ 5,212,385$
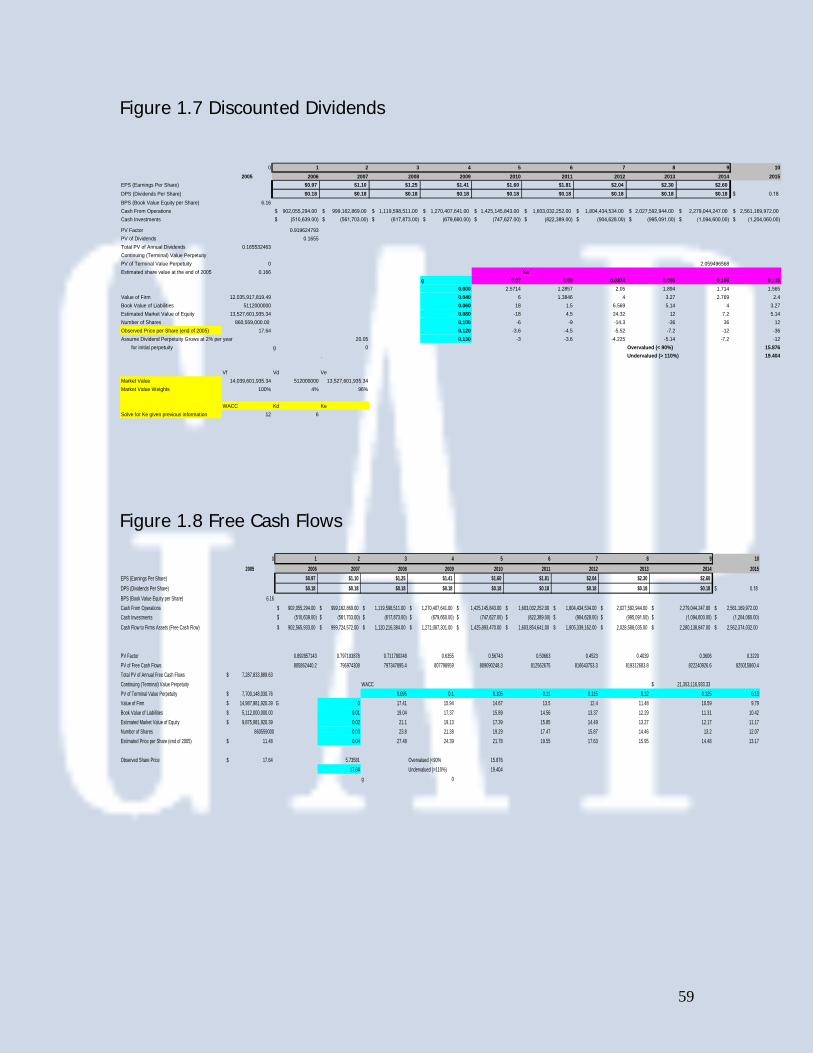
59
Figure 1.7 Discounted Dividends
0 1 2 3 4 5 6 7 8 9 102005 2006 2007 2008 2009 2010 2011 2012 2013 2014 2015
EPS (Earnings Per Share) $0.97 $1.10 $1.25 $1.41 $1.60 $1.81 $2.04 $2.30 $2.60DPS (Dividends Per Share) $0.18 $0.18 $0.18 $0.18 $0.18 $0.18 $0.18 $0.18 $0.18 0.18$ BPS (Book Value Equity per Share) 6.16Cash From Operations 902,055,294.00$ 999,162,869.00$ 1,119,598,511.00$ 1,270,407,641.00$ 1,425,145,843.00$ 1,603,032,252.00$ 1,804,434,534.00$ 2,027,592,944.00$ 2,279,044,247.00$ 2,561,169,972.00$ Cash Investments (510,639.00)$ (561,703.00)$ (617,873.00)$ (679,660.00)$ (747,627.00)$ (822,389.00)$ (904,628.00)$ (995,091.00)$ (1,094,600.00)$ (1,204,060.00)$
PV Factor 0.919624793PV of Dividends 0.1655Total PV of Annual Dividends 0.165532463Continuing (Terminal) Value PerpetuityPV of Terminal Value Perpetuity 0 2.059496568Estimated share value at the end of 2005 0.166 Ke
g 0.07 0.08 0.0874 0.095 0.105 0.1150.000 2.5714 1.2857 2.05 1.894 1.714 1.565
Value of Firm 12,035,917,819.49 0.040 6 1.3846 4 3.27 2.769 2.4Book Value of Liabilities 5112000000 0.060 18 1.5 6.569 5.14 4 3.27Estimated Market Value of Equity 13,527,601,935.34 0.080 -18 4.5 24.32 12 7.2 5.14Number of Shares 860,559,000.00 0.100 -6 -9 -14.3 -36 36 12Observed Price per Share (end of 2005) 17.64 0.120 -3.6 -4.5 -5.52 -7.2 -12 -36Assume Dividend Perpetuity Grows at 2% per year 20.05 0.130 -3 -3.6 -4.225 -5.14 -7.2 -12
for initial perpetuity g 0 Overvalued (< 90%) 15.876. Undervalued (> 110%) 19.404
Vf Vd VeMarket Value 14,039,601,935.34 512000000 13,527,601,935.34Market Value Weights 100% 4% 96%
WACC Kd KeSolve for Ke given previous information 12 6
Figure 1.8 Free Cash Flows
0 1 2 3 4 5 6 7 8 9 102005 2006 2007 2008 2009 2010 2011 2012 2013 2014 2015
EPS (Earnings Per Share) $0.97 $1.10 $1.25 $1.41 $1.60 $1.81 $2.04 $2.30 $2.60DPS (Dividends Per Share) $0.18 $0.18 $0.18 $0.18 $0.18 $0.18 $0.18 $0.18 $0.18 0.18$ BPS (Book Value Equity per Share) 6.16Cash From Operations 902,055,294.00$ 999,162,869.00$ 1,119,598,511.00$ 1,270,407,641.00$ 1,425,145,843.00$ 1,603,032,252.00$ 1,804,434,534.00$ 2,027,592,944.00$ 2,279,044,247.00$ 2,561,169,972.00$ Cash Investments (510,639.00)$ (561,703.00)$ (617,873.00)$ (679,660.00)$ (747,627.00)$ (822,389.00)$ (904,628.00)$ (995,091.00)$ (1,094,600.00)$ (1,204,060.00)$ Cash Flow to Firms Assets (Free Cash Flow) 902,565,933.00$ 999,724,572.00$ 1,120,216,384.00$ 1,271,087,301.00$ 1,425,893,470.00$ 1,603,854,641.00$ 1,805,339,162.00$ 2,028,588,035.00$ 2,280,138,847.00$ 2,562,374,032.00$
PV Factor 0.892857143 0.797193878 0.711780248 0.6355 0.56743 0.50663 0.4523 0.4039 0.3606 0.3220PV of Free Cash Flows 805862440.2 796974308 797347895.4 807798959 809090248.3 812562675 816643753.3 819312683.8 822240926.6 825015860.4Total PV of Annual Free Cash Flows 7,287,833,889.63$ Continuing (Terminal) Value Perpetuity WACC 21,353,116,933.33$ PV of Terminal Value Perpetuity 7,700,148,030.76$ 0.095 0.1 0.105 0.11 0.115 0.12 0.125 0.13Value of Firm 14,987,981,920.39$ G 0 17.41 15.94 14.67 13.5 12.4 11.48 10.59 9.79Book Value of Liabilities 5,112,000,000.00$ 0.01 19.04 17.37 15.89 14.56 13.37 12.29 11.31 10.42Estimated Market Value of Equity 9,875,981,920.39$ 0.02 21.1 19.13 17.39 15.85 14.49 13.27 12.17 11.17Number of Shares 860559000 0.03 23.8 21.38 19.29 17.47 15.87 14.46 13.2 12.07Estimated Price per Share (end of 2005) 11.48$ 0.04 27.48 24.39 21.78 19.55 17.63 15.95 14.48 13.17
Observed Share Price 17.64$ 5.73581 Overvalued (<90% 15.87617.64 Undervalued (>110%) 19.404
g 0
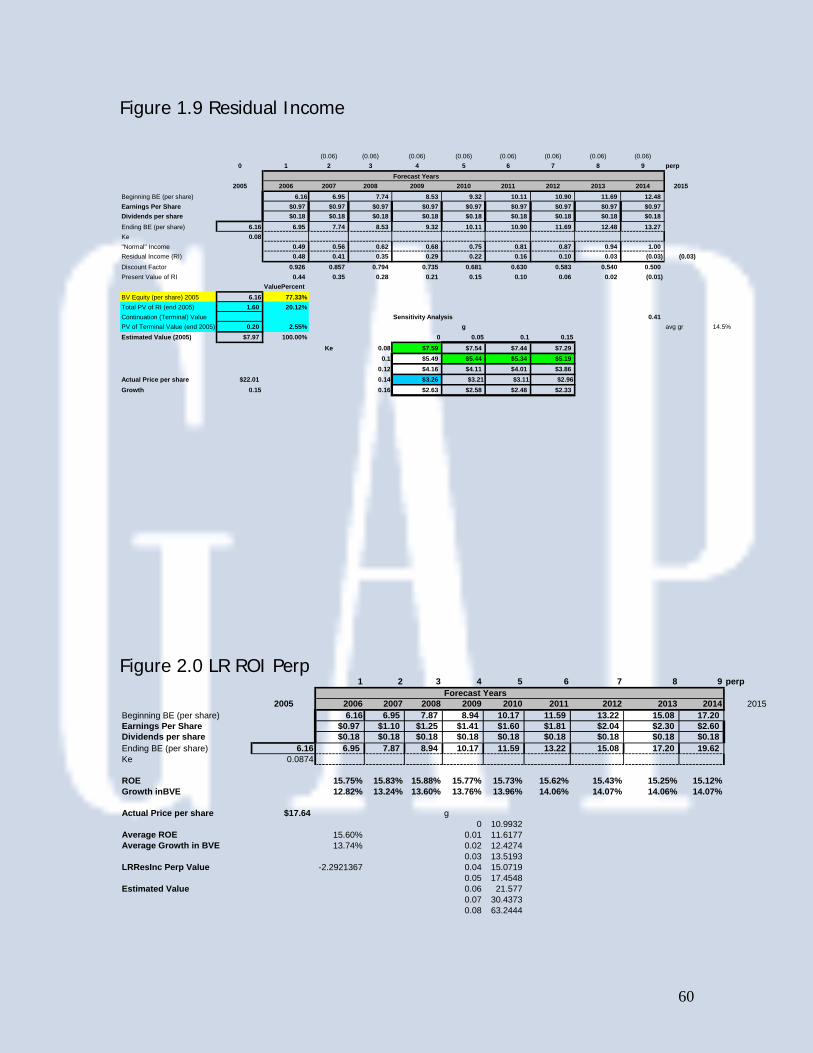
60
Figure 1.9 Residual Income
(0.06) (0.06) (0.06) (0.06) (0.06) (0.06) (0.06) (0.06)0 1 2 3 4 5 6 7 8 9 perp
Forecast Years2005 2006 2007 2008 2009 2010 2011 2012 2013 2014 2015
Beginning BE (per share) 6.16 6.95 7.74 8.53 9.32 10.11 10.90 11.69 12.48Earnings Per Share $0.97 $0.97 $0.97 $0.97 $0.97 $0.97 $0.97 $0.97 $0.97Dividends per share $0.18 $0.18 $0.18 $0.18 $0.18 $0.18 $0.18 $0.18 $0.18Ending BE (per share) 6.16 6.95 7.74 8.53 9.32 10.11 10.90 11.69 12.48 13.27Ke 0.08"Normal" Income 0.49 0.56 0.62 0.68 0.75 0.81 0.87 0.94 1.00Residual Income (RI) 0.48 0.41 0.35 0.29 0.22 0.16 0.10 0.03 (0.03) (0.03)Discount Factor 0.926 0.857 0.794 0.735 0.681 0.630 0.583 0.540 0.500Present Value of RI 0.44 0.35 0.28 0.21 0.15 0.10 0.06 0.02 (0.01)
ValuePercentBV Equity (per share) 2005 6.16 77.33%Total PV of RI (end 2005) 1.60 20.12%Continuation (Terminal) Value Sensitivity Analysis 0.41PV of Terminal Value (end 2005) 0.20 2.55% g avg gr 14.5%Estimated Value (2005) $7.97 100.00% 0 0.05 0.1 0.15
Ke 0.08 $7.59 $7.54 $7.44 $7.290.1 $5.49 $5.44 $5.34 $5.19
0.12 $4.16 $4.11 $4.01 $3.86Actual Price per share $22.01 0.14 $3.26 $3.21 $3.11 $2.96Growth 0.15 0.16 $2.63 $2.58 $2.48 $2.33
Figure 2.0 LR ROI Perp
1 2 3 4 5 6 7 8 9 perpForecast Years
2005 2006 2007 2008 2009 2010 2011 2012 2013 2014 2015Beginning BE (per share) 6.16 6.95 7.87 8.94 10.17 11.59 13.22 15.08 17.20Earnings Per Share $0.97 $1.10 $1.25 $1.41 $1.60 $1.81 $2.04 $2.30 $2.60Dividends per share $0.18 $0.18 $0.18 $0.18 $0.18 $0.18 $0.18 $0.18 $0.18Ending BE (per share) 6.16 6.95 7.87 8.94 10.17 11.59 13.22 15.08 17.20 19.62Ke 0.0874
ROE 15.75% 15.83% 15.88% 15.77% 15.73% 15.62% 15.43% 15.25% 15.12%Growth inBVE 12.82% 13.24% 13.60% 13.76% 13.96% 14.06% 14.07% 14.06% 14.07%
Actual Price per share $17.64 g0 10.9932
Average ROE 15.60% 0.01 11.6177Average Growth in BVE 13.74% 0.02 12.4274
0.03 13.5193LRResInc Perp Value -2.2921367 0.04 15.0719
0.05 17.4548Estimated Value 0.06 21.577
0.07 30.43730.08 63.2444
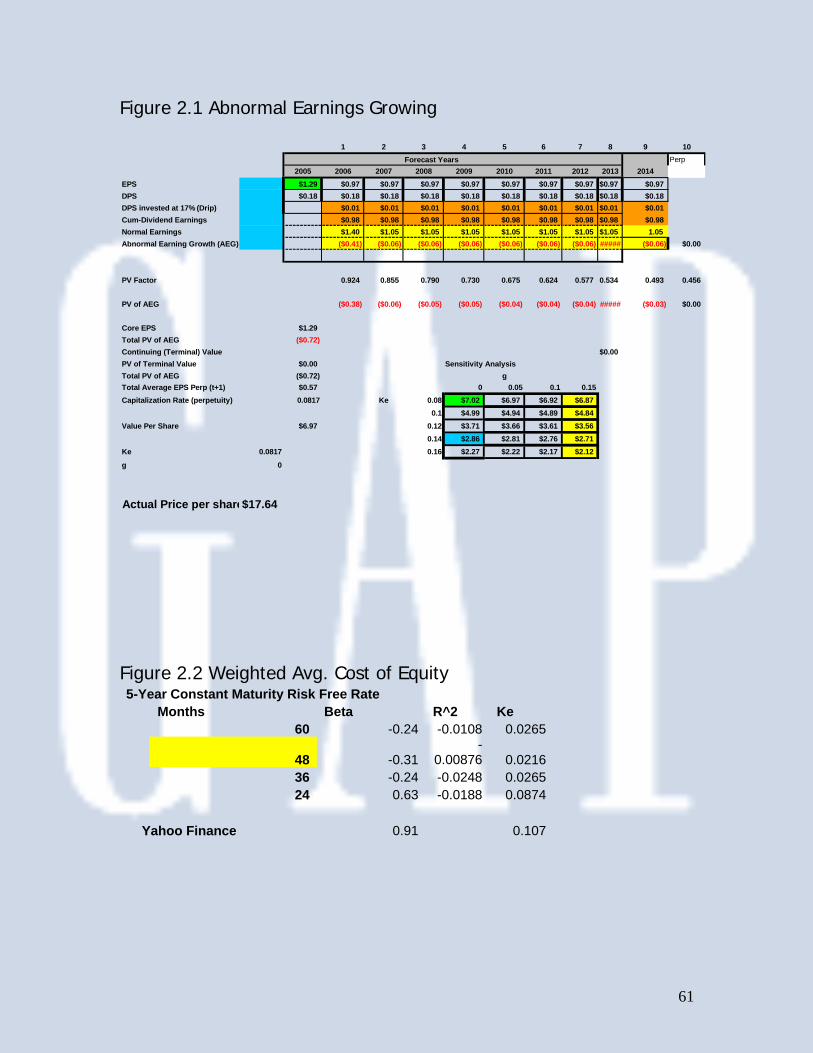
61
Figure 2.1 Abnormal Earnings Growing
1 2 3 4 5 6 7 8 9 10Forecast Years Perp
2005 2006 2007 2008 2009 2010 2011 2012 2013 2014EPS $1.29 $0.97 $0.97 $0.97 $0.97 $0.97 $0.97 $0.97 $0.97 $0.97DPS $0.18 $0.18 $0.18 $0.18 $0.18 $0.18 $0.18 $0.18 $0.18 $0.18DPS invested at 17% (Drip) $0.01 $0.01 $0.01 $0.01 $0.01 $0.01 $0.01 $0.01 $0.01Cum-Dividend Earnings $0.98 $0.98 $0.98 $0.98 $0.98 $0.98 $0.98 $0.98 $0.98Normal Earnings $1.40 $1.05 $1.05 $1.05 $1.05 $1.05 $1.05 $1.05 1.05Abnormal Earning Growth (AEG) ($0.41) ($0.06) ($0.06) ($0.06) ($0.06) ($0.06) ($0.06) ##### ($0.06) $0.00
PV Factor 0.924 0.855 0.790 0.730 0.675 0.624 0.577 0.534 0.493 0.456
PV of AEG ($0.38) ($0.06) ($0.05) ($0.05) ($0.04) ($0.04) ($0.04) ##### ($0.03) $0.00
Core EPS $1.29Total PV of AEG ($0.72)Continuing (Terminal) Value $0.00PV of Terminal Value $0.00 Sensitivity AnalysisTotal PV of AEG ($0.72) gTotal Average EPS Perp (t+1) $0.57 0 0.05 0.1 0.15Capitalization Rate (perpetuity) 0.0817 Ke 0.08 $7.02 $6.97 $6.92 $6.87
0.1 $4.99 $4.94 $4.89 $4.84Value Per Share $6.97 0.12 $3.71 $3.66 $3.61 $3.56
0.14 $2.86 $2.81 $2.76 $2.71Ke 0.0817 0.16 $2.27 $2.22 $2.17 $2.12
g 0
Actual Price per share$17.64
Figure 2.2 Weighted Avg. Cost of Equity 5-Year Constant Maturity Risk Free Rate Months Beta R^2 Ke 60 -0.24 -0.0108 0.0265
48 -0.31-
0.00876 0.0216 36 -0.24 -0.0248 0.0265 24 0.63 -0.0188 0.0874 Yahoo Finance 0.91 0.107
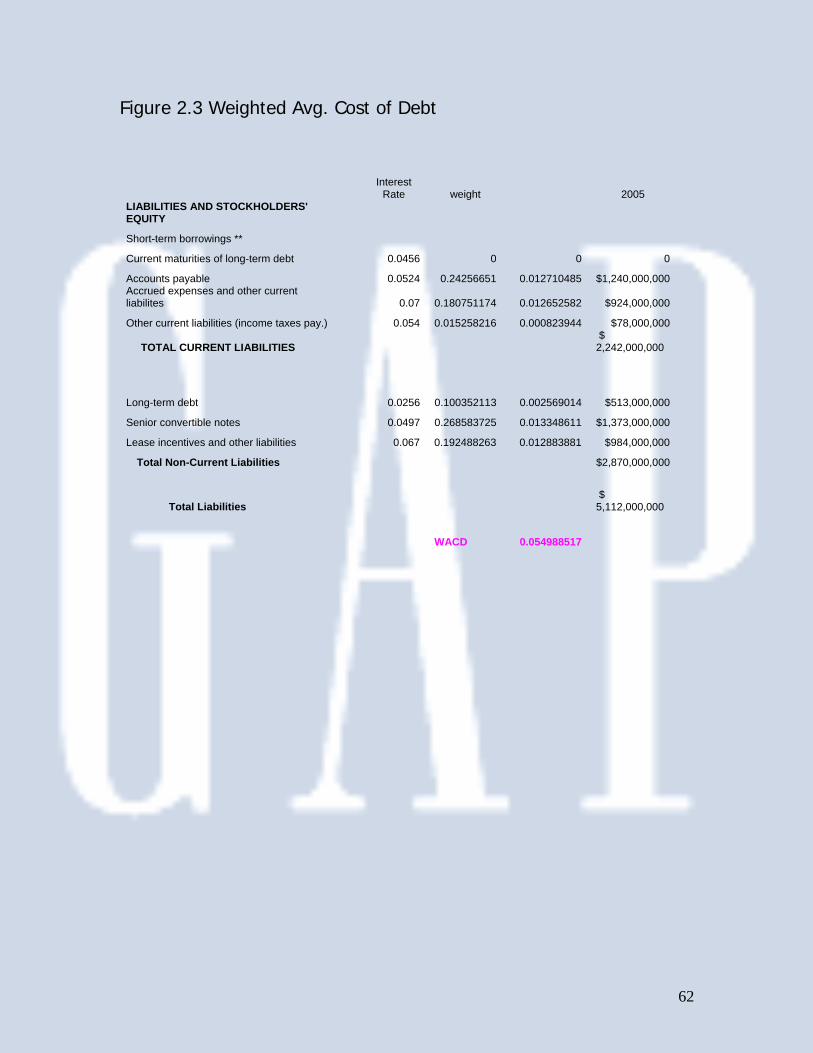
62
Figure 2.3 Weighted Avg. Cost of Debt
Interest
Rate weight 2005 LIABILITIES AND STOCKHOLDERS' EQUITY
Short-term borrowings **
Current maturities of long-term debt 0.0456 0 0 0
Accounts payable 0.0524 0.24256651 0.012710485 $1,240,000,000 Accrued expenses and other current liabilites 0.07 0.180751174 0.012652582 $924,000,000
Other current liabilities (income taxes pay.) 0.054 0.015258216 0.000823944 $78,000,000
TOTAL CURRENT LIABILITIES $ 2,242,000,000
Long-term debt 0.0256 0.100352113 0.002569014 $513,000,000
Senior convertible notes 0.0497 0.268583725 0.013348611 $1,373,000,000
Lease incentives and other liabilities 0.067 0.192488263 0.012883881 $984,000,000
Total Non-Current Liabilities $2,870,000,000
Total Liabilities $ 5,112,000,000
WACD 0.054988517