garda capital group ( asx code: gcm ) · gcm securityholder payments h1fy19 h2fy19 total fy19 cents...
TRANSCRIPT
GARDA CAPITAL GROUP ( ASX CODE: GCM )Annual Results Presentation
22 August 2019
2
Disclaimer
GARDA Capital Group Annual Results 2019
The information provided in and accompanying this presentation (Presentation) has been prepared on behalf of GARDA Capital Limited (ACN 095 039 366) (GARDA), and GARDA Funds Management
Limited (ACN 140 857 405) (AFSL 398764) (GFML), in its capacity as responsible manager of the GARDA Capital Trust, a registered managed investment scheme with ARSN 150 164 720 (the Fund),
together the GARDA Capital Group or GCM. The information and statements in this Presentation were prepared or are made only as of the date of this Presentation, unless otherwise stated.
This Presentation contains general and summary information about the current activities of the GARDA Capital Group. It does not purport to be complete, or contain all the information which would be
relevant to existing or prospective investors of GCM. No member of the GARDA Capital Group or any of their related entities and their respective directors, employees, officers and advisers give any
warranties in relation to the statements and information contained in or referred to in this Presentation.
This Presentation has been compiled from sources which the GARDA Capital Group believes to be reliable. However, it is not audited, and it is not a prospectus, product disclosure statement or other
disclosure document as defined in the Corporations Act 2001 (Disclosure Document), and has not been lodged with the Australian Securities and Investments Commission. It is not, nor does it purport to
be, complete or include all the information that a Disclosure Document may contain. Historical, financial and other ‘continuous disclosure’ information required by law can be found at the GARDA Capital
Group’s website www.gardacapitalgroup.com.au and in the audited financial statements (also on the website). All references to dollars or $ in this document are to Australian currency.
Nothing contained in the Presentation constitutes investment, legal, tax or other advice. It is not an offer of securities, or a recommendation to buy or sell securities in GCM. It has been prepared for general
information only, and without taking into account the investment objectives, financial situation or needs of individuals. Any existing or prospective investor should not rely on this Presentation, but consider
the appropriateness of the information in a Disclosure Document, having regard to their own objectives, financial situation and needs and seek appropriate independent advice, including financial, legal and
taxation advice appropriate to their jurisdiction. Neither GARDA nor GFML is licensed to provide financial product advice in respect of any securities, including the stapled securities comprising GCM. The
GARDA Capital Group does not guarantee any particular rate of return or performance of GCM or any securities, nor do they guarantee the repayment of capital or any particular tax treatment.
This Presentation contains certain “forward looking statements” (Forecasts) with respect to the financial condition, results of operations and business relating to the GARDA Capital Group. These Forecasts
may involve subjective judgments. The words “forecast”, “estimate”, “likely”, “anticipate”, “believe”, “expect”, “project”, “opinion”, “predict”, “outlook”, “guidance”, “intend”, “should”, “could”, “may”, "strategy",
“target”, “plan” and other similar expressions are intended to identify forward-looking statements.
The Forecasts are by their very nature subject to significant and unknown risks, uncertainties, vagaries and contingencies, many (if not all) of which are outside the control of members of the GARDA Capital
Group. Various risk factors may cause the actual results or performance of GCM to be materially different from any future results or performance expressed or implied by such Forecasts. There can be no
assurance that any Forecasts are attainable or will be realised. No representation, warranty or guarantee, whether express or implied, is made or given by any member of the GARDA Capital Group that any
Forecast will or is likely to be achieved. Except as required by law, the GARDA Capital Group is not liable to release updates to the Forecasts to reflect any changes.
To the maximum extent permitted by law, any and all liability in respect of the Presentation and Forecast is expressly excluded, including, without limitation, any liability arising from fault or negligence, for any
direct, indirect or consequential loss or damage arising whatsoever from the use of the information in this Presentation or otherwise arising in connection with it. GCM is listed on the ASX and all applicable
obligations and restrictions contained in (without limitation) the Listing Rules and Corporations Act apply accordingly. The acknowledgements referred to above apply accordingly. The acknowledgements
referred to above may be pleaded as a bar to any claim that a reader may bring.

3
Revenue and Fee Growth
Earnings and ROE
Balance Sheet Assets
Returns and Distributions
AUM increased to $363m with potential growth through future
projects to $405 million.
Revenue increased 98% with all key operating and investing
units increasing.
NPAT increased 200% to $8.4 million.
Return on starting equity of 42.7%.
Group assets increased to $39.9 million and net assets
increased to $25.8 million.
GDF investment valued at $30.7 million at 30 June 2019.
NTA of $1.07 per GCM security.
97.5% increased in distributions/dividends paid during FY19.
FY19 distributions total 9.875 cents per security.FY19 TSR of 51.1% following strong appreciation in the GCM
ASX security price.
FY19 Highlights
GARDA Capital Group Annual Results 2019
4
Revenue and Fee Growth
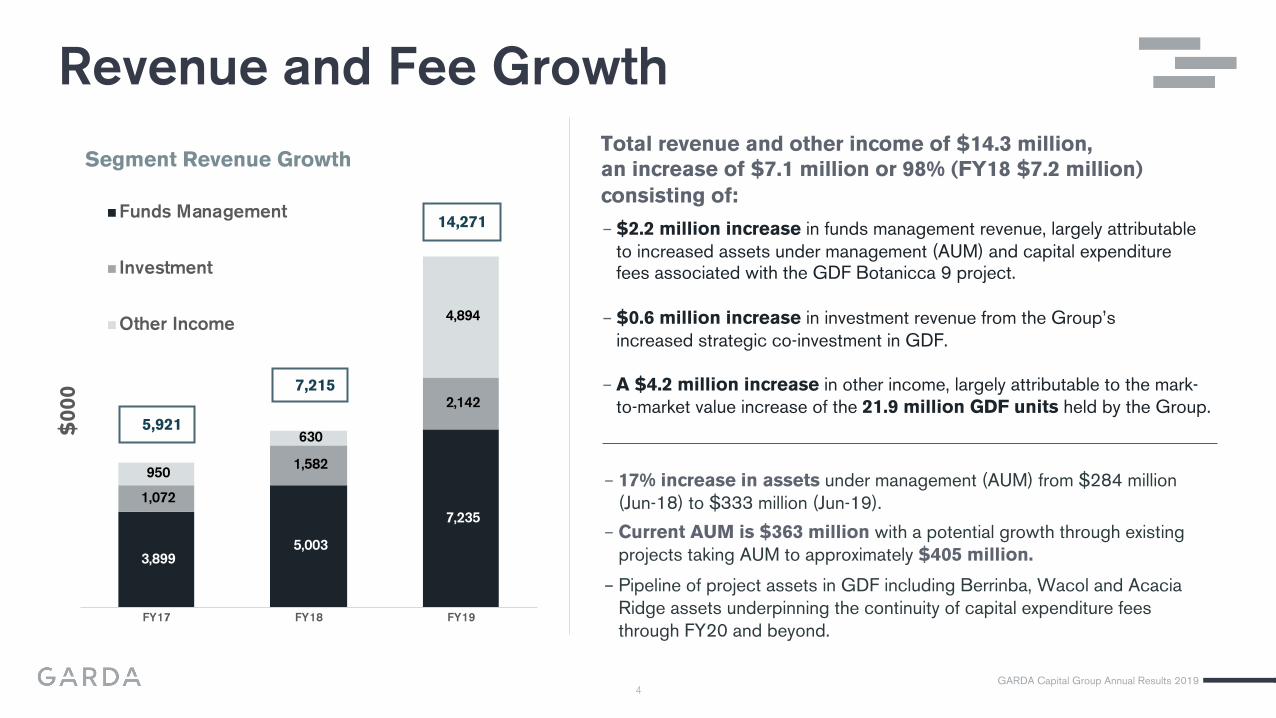
Total revenue and other income of $14.3 million,
an increase of $7.1 million or 98% (FY18 $7.2 million)
consisting of:
− 17% increase in assets under management (AUM) from $284 million
(Jun-18) to $333 million (Jun-19).
− Current AUM is $363 million with a potential growth through existing
projects taking AUM to approximately $405 million.
− Pipeline of project assets in GDF including Berrinba, Wacol and Acacia
Ridge assets underpinning the continuity of capital expenditure fees
through FY20 and beyond.
− $2.2 million increase in funds management revenue, largely attributable
to increased assets under management (AUM) and capital expenditurefees associated with the GDF Botanicca 9 project.
− $0.6 million increase in investment revenue from the Group’s
increased strategic co-investment in GDF.
− A $4.2 million increase in other income, largely attributable to the mark-
to-market value increase of the 21.9 million GDF units held by the Group.
GARDA Capital Group Annual Results 2019
3,899 5,003
7,235
1,072
1,582
2,142
950
630
4,894
FY17 FY18 FY19
$0
00
Segment Revenue Growth
Funds Management
Investment
Other Income
$5,921
$7,215
14,271

5
12.0%9.6%
31.6%
17.3% 16.1%
42.7%
FY17 FY18 FY19
Investment Return % Total Return (%)
Earnings and Return on Equity
− The Group produced net profit after tax (NPAT) of $8.4 million
(including both operating and investing activities) in FY19, representing a 200% increase on the prior financial year (FY18 $2.8 million).
− 83% increase in underlying operating activity earnings after tax of
$2.2 million (FY18 $1.2 million).
− 265% increase in underlying investment activity earnings after tax to
$6.2 million (FY18 $1.7 million).
− A total return for FY19 of $8.5 million or 42.7%1 was achieved on
30 June 2018 net assets of $19.8 million.
5
9.611.6
9.9
14.8
34.7
DPS Operating EPS Statutory EPS
FY18 FY19
Cents
/ S
ecurity
Distributions and Earnings per Security
1. Total return on security holders equity is measured, as the sum of the underlying operating activities earnings after tax
and the underlying investing activities earnings after tax, over the Group’s equity at the beginning of the financial period.
Return on Total Equity
GARDA Capital Group Annual Results 2019
6
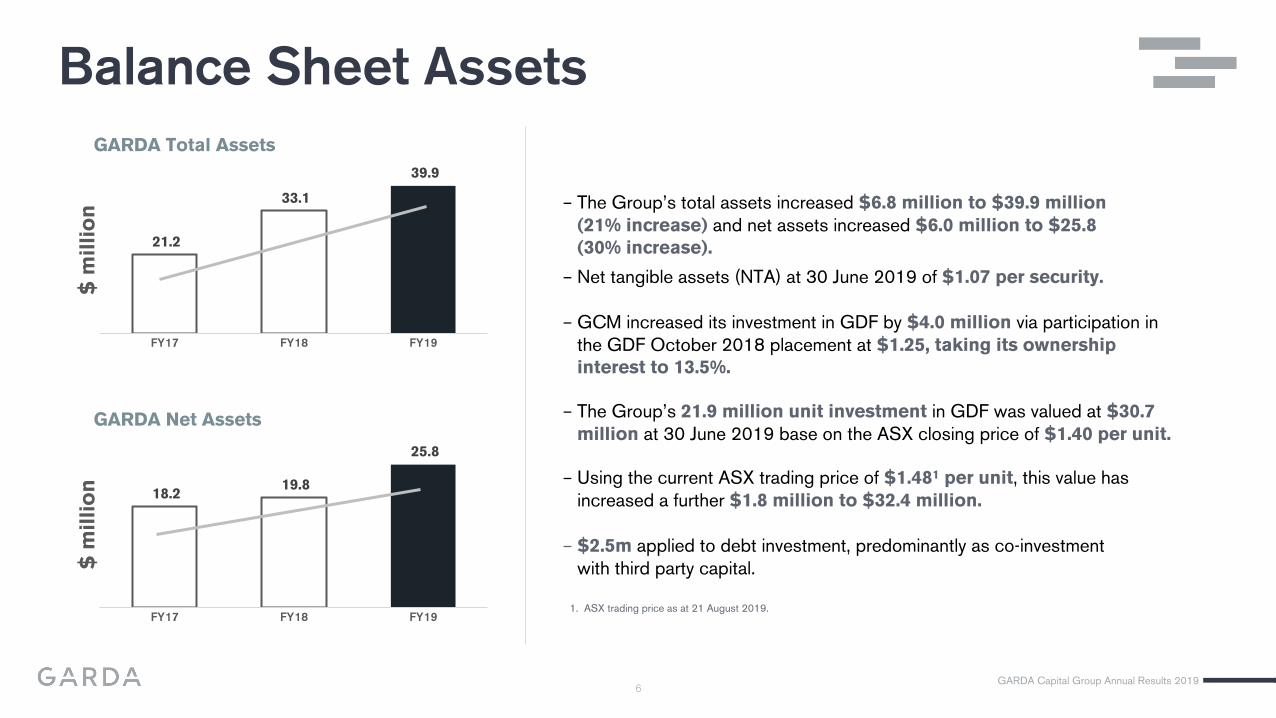
− The Group’s total assets increased $6.8 million to $39.9 million
(21% increase) and net assets increased $6.0 million to $25.8
(30% increase).
− Net tangible assets (NTA) at 30 June 2019 of $1.07 per security.
− GCM increased its investment in GDF by $4.0 million via participation in
the GDF October 2018 placement at $1.25, taking its ownership
interest to 13.5%.
− The Group’s 21.9 million unit investment in GDF was valued at $30.7
million at 30 June 2019 base on the ASX closing price of $1.40 per unit.
− Using the current ASX trading price of $1.481 per unit, this value has
increased a further $1.8 million to $32.4 million.
− $2.5m applied to debt investment, predominantly as co-investment
with third party capital.
Balance Sheet Assets
GARDA Capital Group Annual Results 2019
21.2
33.1
39.9
FY17 FY18 FY19
$ m
illi
on
GARDA Total Assets
18.2 19.8
25.8
FY17 FY18 FY19
$ m
illi
on
GARDA Net Assets
1. ASX trading price as at 21 August 2019.

7
Earnings and Return on Equity
Total securityholder payments of 9.875 centsper security for FY19, a 97.5% increase on FY18(5.0 cents per security) comprising:
− Fully franked 5.125 cents per security corporate
dividend; and
− 4.75 cents per security 100% tax advantaged
trust distributions.
− GCM ASX price increase from $1.25 per security to $1.79 per
security during FY19.
− FY19 total shareholder return (TSR)1 = 51.1%
$1.20
$1.30
$1.40
$1.50
$1.60
$1.70
$1.80
Jul 18 Oct 18 Jan 19 Apr 19 Jul 19
GCM ASX Price - FY19
GCM Securityholder PaymentsH1FY19 H2FY19 Total FY19
Cents per Stapled Security
Total quarterly trust distributions 2.250 2.500 4.750
Fully franked dividend 1.125 4.000 5.125
Total securityholder payments 3.375 6.500 9.875
GARDA Capital Group Annual Results 2019
1. TSR calculated as the change in GCM ASX, plus dividends and distributions paid during the
financial year, divided by GCM ASX price at the start of the year.

8
Operating Activities
− GARDA is the responsible entity and fund manager (and holds a 13.5% investment) of GARDA Diversified Property Fund (ASX: GDF).
− Fund management revenues are primarily derived from fees based on assets under management (AUM).
− Revenue for the year is driven from the average AUM, so a key metric is the starting AUM in FY20 compared to the average AUM for FY19.
− Additionally fund management revenues include capital expenditure fees (including project development), property and facilities management
and other real estate agency functions such as leasing and sales.
The Group’s operating activities generate revenues from funds management.
Equity Funds Management
− The Group’s debt activity is pivoting from traditional brokerage to a co-investment debt funds management model.
− Revenues consist of procurement, trail, establishment and line fees.
− GARDA completed its first syndicated advance during FY19, where it co-invested with external investors to provide debt funding.
− GARDA has identified and continues to work with wholesale investors to increase its exposure to this activity, however current limited free
capital is currently restricting the growth of this activity.
Debt Funds Management
GARDA Capital Group Annual Results 2019
9
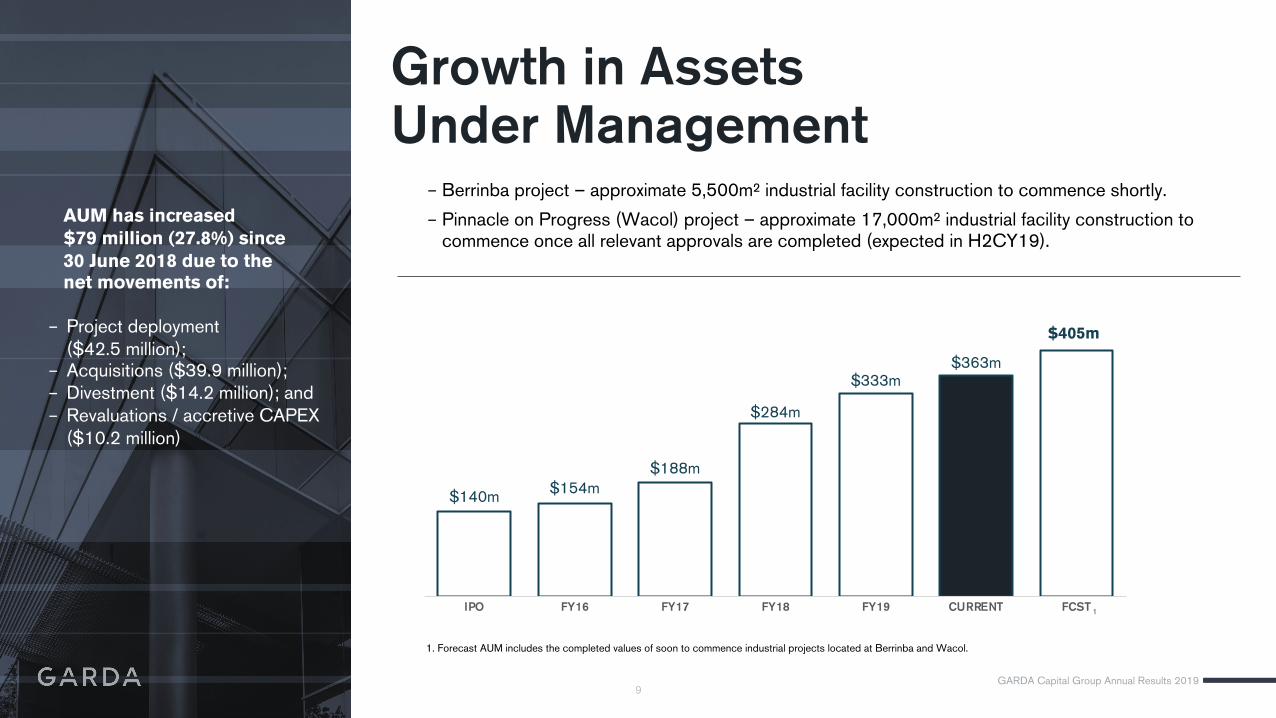
Growth in Assets Under Management
− Berrinba project – approximate 5,500m² industrial facility construction to commence shortly.
− Pinnacle on Progress (Wacol) project – approximate 17,000m² industrial facility construction to commence once all relevant approvals are completed (expected in H2CY19).
AUM has increased
$79 million (27.8%) since
30 June 2018 due to the
net movements of:
− Project deployment
($42.5 million);− Acquisitions ($39.9 million);
− Divestment ($14.2 million); and
− Revaluations / accretive CAPEX
($10.2 million)
GARDA Capital Group Annual Results 2019
1. Forecast AUM includes the completed values of soon to commence industrial projects located at Berrinba and Wacol.
$140m$154m
$188m
$284m
$333m$363m
IPO FY16 FY17 FY18 FY19 CURRENT FCST
$405m
1

10
$144m
$184m
$219m
$310m
FY16 FY17 FY18 FY19 CURRENT
$363m
Growth in Average Assets Under Management− Average AUM in any year more accurately reflects the basis upon which funds management
revenue has been derived for that year.
− AUM reported at year end provides the starting basis for funds management revenue for the future
period.
− GARDA has demonstrated sustained growth in AUM with FY20 commencing AUM of $333 million
being a 7% increase on average AUM of FY19.
− Current AUM of $363 million is 17% higher than average AUM for FY19 of $310 million.
GARDA Capital Group Annual Results 2019
11
Capital Expenditure fee revenue− A primary contributor to funds management fee revenue is the GDF capital expenditure fee.
− GARDA receives capital expenditure fees of 5% of capital works performed for GDF.
− GDF has two primary capital expenditure activities:
− new project construction; and
− capital reinvestment into existing assets (ongoing/recurring focus).
− GDF has a pipeline of Brisbane industrial assets where it intends to build modern industrial facilities
to retain as long term investments.
− The current projects pipeline provides a sound base to achieve similar revenue from capital expenditure
in future periods.
GARDA Capital Group Annual Results 2019
12
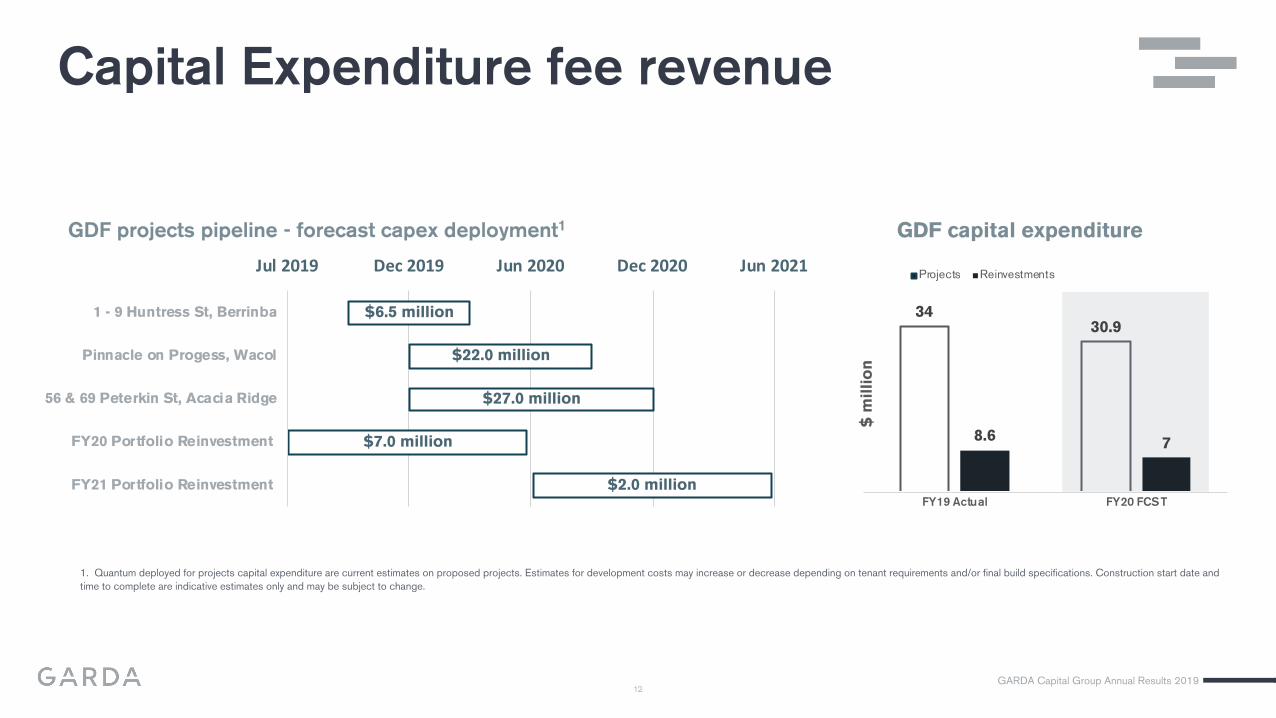
Capital Expenditure fee revenue
$6.5 million
$22.0 million
$27.0 million
$7.0 million
$2.0 million
Jul 2019 Dec 2019 Jun 2020 Dec 2020 Jun 2021
1 - 9 Huntress St, Berrinba
Pinnacle on Progess, Wacol
56 & 69 Peterkin St, Acacia Ridge
FY20 Portfolio Reinvestment
FY21 Portfolio Reinvestment
1. Quantum deployed for projects capital expenditure are current estimates on proposed projects. Estimates for development costs may increase or decrease depending on tenant requirements and/or final build specifications. Construction start date and
time to complete are indicative estimates only and may be subject to change.
3430.9
8.67
FY19 Actual FY20 FCST
Projects Reinvestments
GDF projects pipeline - forecast capex deployment1 GDF capital expenditure
$ m
illi
on
GARDA Capital Group Annual Results 2019

13
Investment Activities
− GARDA’s primary investment is its 21.9 million units in GDF, representing 13.5% of GDF units.
− The Group deployed a further $4.0 million into GDF as part of the $25 million placement announcedin October 2018.
− The Directors measure performance having regard to the distributions received, and the fair value movement
(increase or decrease in asset values) of its investment in GDF, over each financial period.
− GARDA also invests in property through debt positions.
− The Group made further investments in debt positions with the advancement of three new loans totalling$2.5 million during the financial year, with $2.0 million in loans and capitalised interest outstanding
at 30 June 2019.
− Debt investment generates both fees (accounted for in the operating revenues of the Group) and interest
(accounted for in the investing revenues of the Group).
GARDA invests in real estate via both equity and debt positions.
EQUITY
DEBT
GARDA Capital Group Annual Results 2019
14
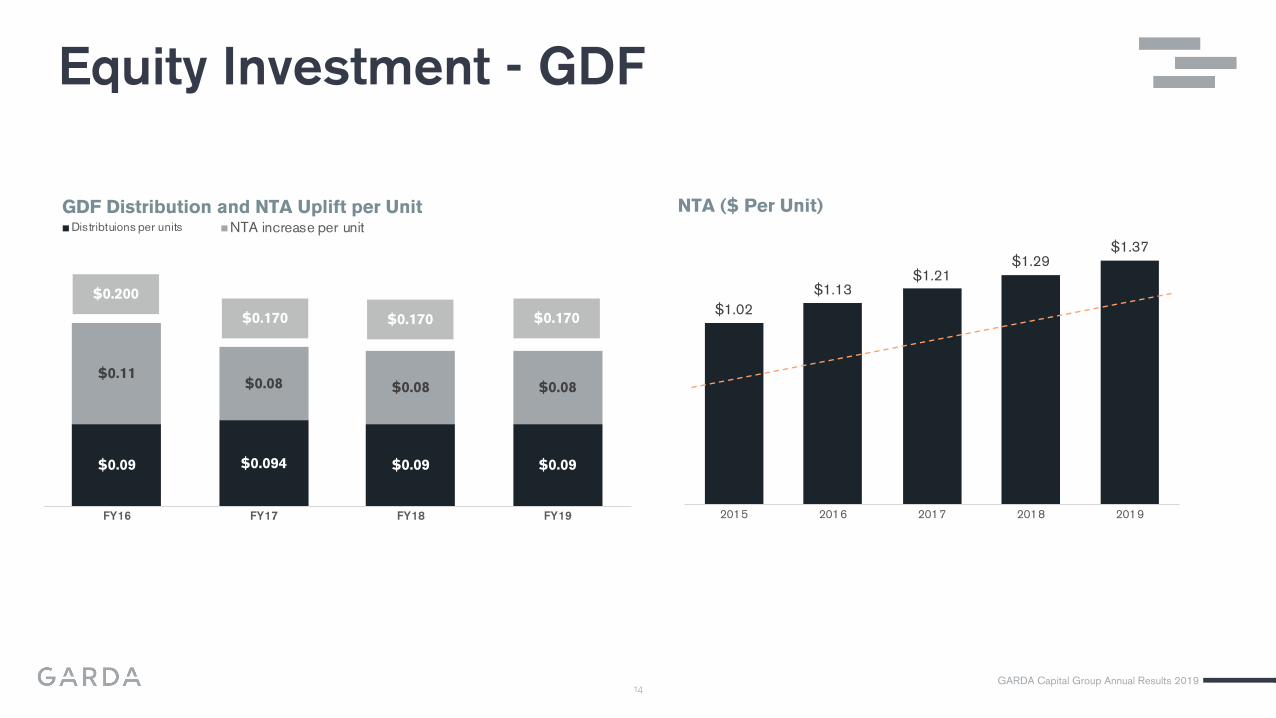
Equity Investment - GDF
$0.09 $0.094 $0.09 $0.09
$0.11$0.08 $0.08 $0.08
FY16 FY17 FY18 FY19
GDF Distribution and NTA Uplift per UnitDistribtuions per units NTA increase per unit
$0.200
$0.170 $0.170 $0.170$1.02
$1.13 $1.21
$1.29 $1.37
2015 2016 2017 2018 2019
NTA ($ Per Unit)
GARDA Capital Group Annual Results 2019

15
− The Group’s 21.9 million unit investment in GDF performed strongly during FY19 providing reliable
income yield and strong capital growth.
− GCM benefited from GDF’s strong year-on-year distribution return (FY19: 9 cents per unit) and
NTA per unit uplift (FY19: 8 cents per unit).
− FY19 GDF TSR1 was 26.9% and ROE2 was 13.2%.
− The Group’s investment in GDF was valued at $30.7 million at 30 June 2019 ASX closing price
of $1.40 per unit.
− GDF has since traded strongly with a current ASX price of $1.48 per unit.
− GDF is set to deliver 9 cents per unit income distribution during FY20 at a 100-105% payout ratio.
1. Total shareholder return calculated as (closing FY19 ASX unit price minus opening FY19 ASX unit price plus distributions) divided by opening FY19 ASX unit price.
2. Return of equity calculated as (closing NTA minus opening NTA plus distributions) divided by opening NTA.
Equity Investment - GDF
GARDA Capital Group Annual Results 2019
16
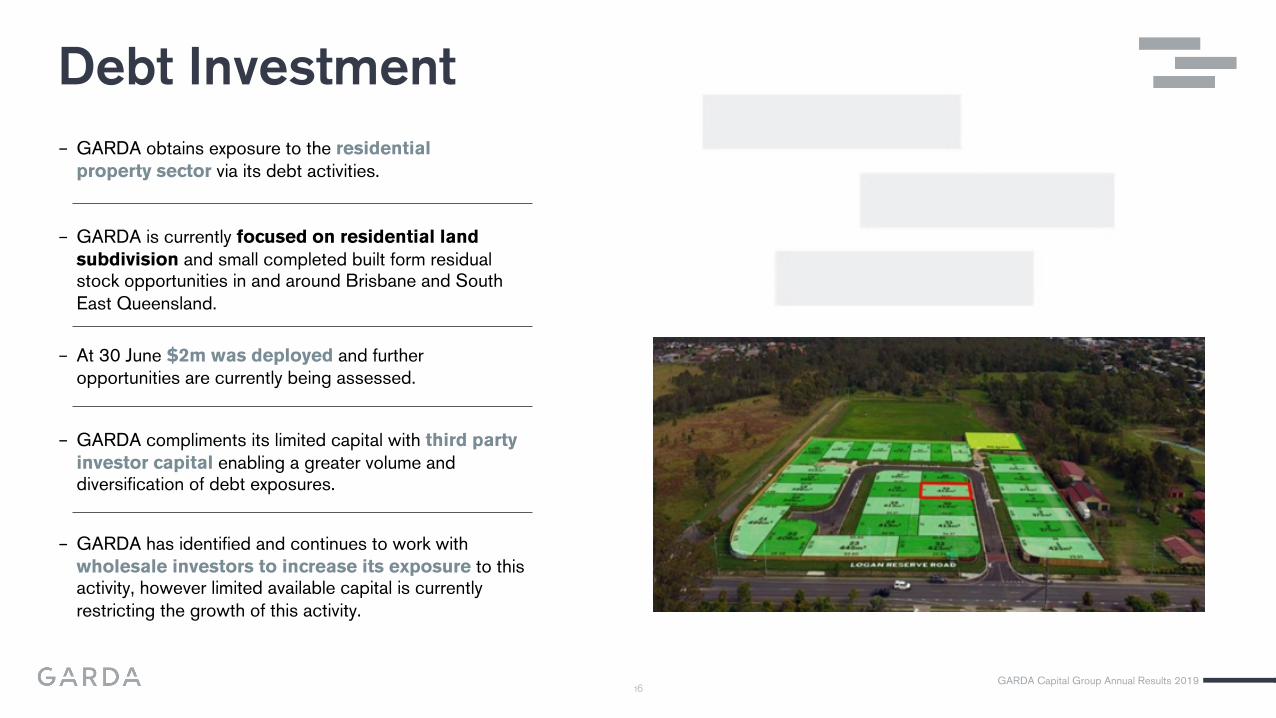
− GARDA obtains exposure to the residential
property sector via its debt activities.
− GARDA is currently focused on residential land
subdivision and small completed built form residual stock opportunities in and around Brisbane and South
East Queensland.
− GARDA compliments its limited capital with third party
investor capital enabling a greater volume and diversification of debt exposures.
− At 30 June $2m was deployed and further
opportunities are currently being assessed.
− GARDA has identified and continues to work with
wholesale investors to increase its exposure to this activity, however limited available capital is currently
restricting the growth of this activity.
Debt Investment
GARDA Capital Group Annual Results 2019

17
− The Group started FY20 with $333 million of AUM, compared to the FY19
average AUM of $310 million.
− Total immediate project pipeline of approximately $55 million may be delivered
over the next two years.
− AUM currently is $363 million following acquisitions by GDF on 5 July 2019.
− GDF continues to target net AUM growth of approximately $100 million per
annum through acquisitions of established assets and new projects.
− GARDA capital expenditure fee revenue continues to benefit from the pipeline
of development projects sitting within GDF, as part of it’s ‘asset creation’
strategy.
− GARDA will continue to focus on the procurement of third party capital for
debt opportunities in which the Group will also participate as a co-investor.
Capital Management Full Year Results 2019
Outlook
− Distributions will continue to
include a pass through of income
received from the Group’s
investment in GDF, forecast to be
$0.05 per GCM security.
− FY20 corporate dividends will be
considered at financial half and
full year reporting periods.
GARDA has historically targeted a
50-60% payout ratio.
Guidance
GARDA Capital Group Annual Results 2019
Financial
Information 01GARDA Capital Group Annual Results 2019
19
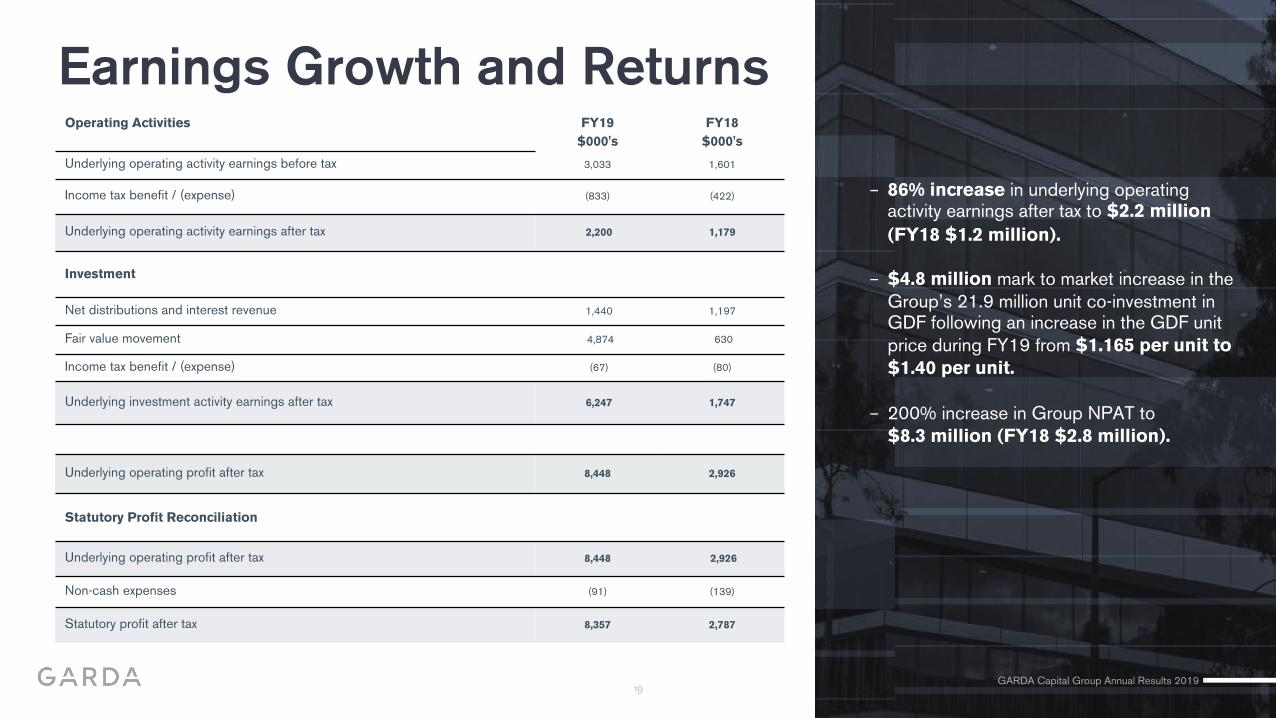
Earnings Growth and ReturnsOperating Activities FY19 FY18
$000's $000's
Underlying operating activity earnings before tax 3,033 1,601
Income tax benefit / (expense) (833) (422)
Underlying operating activity earnings after tax 2,200 1,179
Investment
Net distributions and interest revenue 1,440 1,197
Fair value movement 4,874 630
Income tax benefit / (expense) (67) (80)
Underlying investment activity earnings after tax 6,247 1,747
Underlying operating profit after tax 8,448 2,926
Statutory Profit Reconciliation
Underlying operating profit after tax 8,448 2,926
Non-cash expenses (91) (139)
Statutory profit after tax 8,357 2,787
− 86% increase in underlying operating activity earnings after tax to $2.2 million
(FY18 $1.2 million).
− $4.8 million mark to market increase in the
Group’s 21.9 million unit co-investment in GDF following an increase in the GDF unit
price during FY19 from $1.165 per unit to
$1.40 per unit.
− 200% increase in Group NPAT to
$8.3 million (FY18 $2.8 million).
GARDA Capital Group Annual Results 2019
20
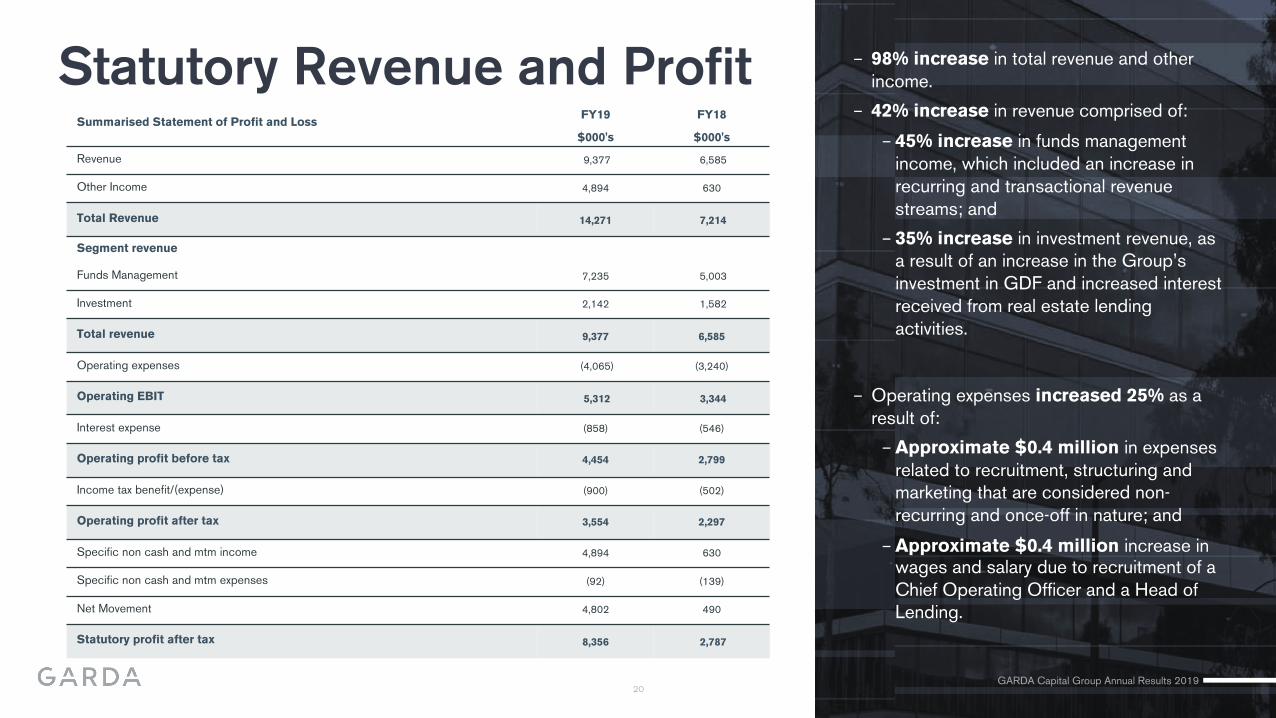
Statutory Revenue and ProfitSummarised Statement of Profit and Loss
FY19 FY18
$000's $000's
Revenue 9,377 6,585
Other Income 4,894 630
Total Revenue 14,271 7,214
Segment revenue
Funds Management 7,235 5,003
Investment 2,142 1,582
Total revenue 9,377 6,585
Operating expenses (4,065) (3,240)
Operating EBIT 5,312 3,344
Interest expense (858) (546)
Operating profit before tax 4,454 2,799
Income tax benefit/(expense) (900) (502)
Operating profit after tax 3,554 2,297
Specific non cash and mtm income 4,894 630
Specific non cash and mtm expenses (92) (139)
Net Movement 4,802 490
Statutory profit after tax 8,356 2,787
− 98% increase in total revenue and other
income.
− 42% increase in revenue comprised of:
− 45% increase in funds management
income, which included an increase in
recurring and transactional revenue
streams; and
− 35% increase in investment revenue, as
a result of an increase in the Group’s
investment in GDF and increased interest
received from real estate lending
activities.
− Operating expenses increased 25% as a
result of:
− Approximate $0.4 million in expenses
related to recruitment, structuring and
marketing that are considered non-
recurring and once-off in nature; and
− Approximate $0.4 million increase in wages and salary due to recruitment of a
Chief Operating Officer and a Head of
Lending.
GARDA Capital Group Annual Results 2019

21
Balance SheetSummarised Statement of Financial Position
Full Year 30 Jun 19 Full Year 30 Jun 18
$000's $000's
Assets
Cash and cash equivalents 3,878 8,547
Trade and other receivables 3,782 1,133
Financial assets 30,660 21,786
Investment properties 1,250 1,250
Deferred tax asset – –
Intangible asset 290 326
Other assets 64 84
Total Assets 39,924 33,126
Liabilities
Trade and other payables 1,167 1,153
Borrowings 11,970 11,970
Current tax liability 938 102
Deferred tax liability 19 57
Other liabilities 25 42
Total Liabilities 14,119 13,324
Net Assets 25,805 19,802
− The Group’s major balance sheet item is its
unitholding in GDF.
− This investment (financial assets) is carried
at the ASX closing price at 30 June 2019 of
$1.40 per unit, compared to $1.165 per
unit at 30 June 2018.
− Cash decreased from $8.5 million to
$3.9 million due to deployment into debt
and equity investments.
− Net Assets for the year increased $6.0
million or 30%, from $19.8 million to
$25.8 million.
− Borrowings consist of a $10.0 million loan
to fund increased GDF investment, and a
capital adequacy loan of $1.97 million
which is subject to an ASIC deed of
subordination.
GARDA Capital Group Annual Results 2019
GDF Investment 02
GARDA Capital Group Annual Results 2019
23
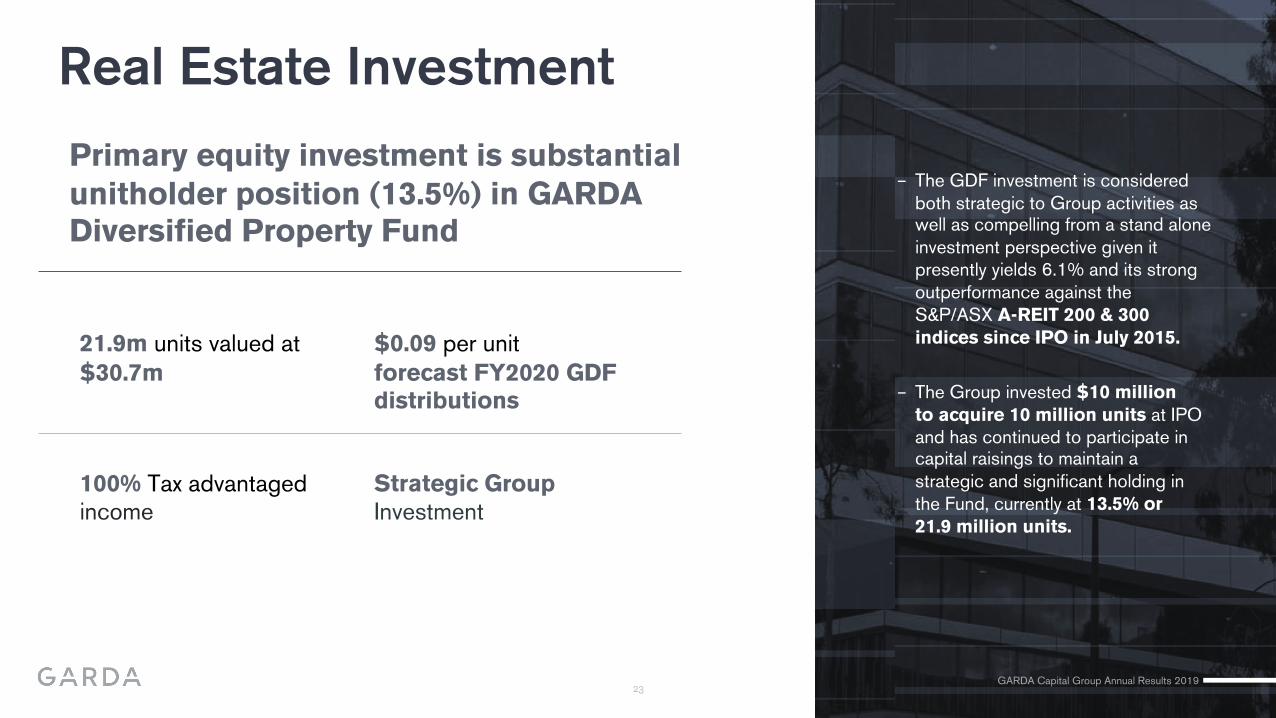
Real Estate Investment
Primary equity investment is substantial
unitholder position (13.5%) in GARDA
Diversified Property Fund
− The GDF investment is considered
both strategic to Group activities as well as compelling from a stand alone
investment perspective given it
presently yields 6.1% and its strong
outperformance against the
S&P/ASX A-REIT 200 & 300
indices since IPO in July 2015.
− The Group invested $10 million
to acquire 10 million units at IPO
and has continued to participate in capital raisings to maintain a
strategic and significant holding in
the Fund, currently at 13.5% or
21.9 million units.
21.9m units valued at
$30.7m
$0.09 per unit
forecast FY2020 GDF
distributions
100% Tax advantaged
income
Strategic Group
Investment
GARDA Capital Group Annual Results 2019

24GARDA Capital Group Annual Results 2019
GDF at a glance – August 2019
1. Includes the Acacia Ridge and Archerfield portfolio acquired on 5 July 2019.
2. Occupancy (by income) as at 1 July 2019 and includes the currently vacant Botanicca 9 office building, expected to contribute approximately $4.0 million net income when fully leased.3. WALE (by income) as at 1 July 2019 and includes rental support facilities totalling $2.0 million allocated to the Acacia Ridge and Archerfield industrial assets.
4. LVR calculated as total drawn debt facilities divided by total property assets as at 19 August 2019.5. NTA as at 31 July 2019.
6. Weighted average capitalisation rate includes Acacia Ridge and Archerfield portfolio acquired in 5 July 2019.
$363 million1
Commercial and industrial portfolio
83% occupancy2
98% excluding Botanicca 9
5.3 yearsWALE3
Weighted average rent reviews
3.14%FY2019 distribution
actual $0.09 /unit
38.5%LVR4
$1.356NTA Per Unit5
6.79%Weighted average cap rate6
Aligned ManagerGARDA Capital holds
13.5% of GDF units
$240 millionmarket capitalisation
