gas: asia’s confounding challenge - the lantau group asia’s confounding challenge. ... gmr 800...
TRANSCRIPT

The Lantau Group Confidential and Proprietary
Gas: Asia’s Confounding Challenge

The Lantau Group Confidential and Proprietary
Who we are
Office/Presence
Senior Advisors
Offerings:
• Strategic, commercial, and regulatory support
• Ability to connect the dots between fuel markets and power
• Analysis-based recommendations
• Highly relevant international experience
• Accessible experts focussed on the region
1
Economic and commercial consultants with expertise in regulatory economics, market development,
commercial transaction support, and strategy
TLG is the result of a
management buy-out of the
Asia Pacific energy practice of,
a US-based global
consultancy.
TLG is an independent
company with experts and
affiliates throughout the Asia
Pacific region.
Decisions Support Analysis
Asset Valuation
Strategy and Advanced Analytics
Competition, Markets, Regulation, Policy
Disputes
Market Analysis
Focussed on Energy

The Lantau Group Confidential and Proprietary
In the 1970s, oil prices shot up, creating a “coal window”
2
Oil
Coal
Up to that point, many Asian countries were using oil for power generation

The Lantau Group Confidential and Proprietary
Almost all of Asia shifted away from oil
3
It was a simple world from something expensive towards something cheaper
Almost everyone
moved away from oil
If you had no other choices, you
moved quickly towards coal
0
20
40
60
80
100
1978 1980 1982 1984 1986 1988
Hong Kong Malaysia
Thailand Philippines
Indonesia
Percent
0
20
40
60
80
100
1978 1980 1982 1984 1986 1988
Hong Kong Malaysia
Thailand Philippines
Indonesia
Percent
Hong Kong
Source: World Bank

The Lantau Group Confidential and Proprietary
The opening and closing of the coal window was followed by a period of growth
in use of natural gas
4
1991 Discovery of
Malampaya gas
field
1997 NPC/FirstGen sign GSPAs
with SPEX/OXY
2001 Commission of
Malampaya
2006 Singapore
commits to
LNG imports
1995 Hong Kong
first gas unit
commissioned
Decisions are easy when the same choice gives you: “green”, “cheaper”, and “local”
1993 Malaysia;s first
gas unit
commissioned
Thailand gas &
oil
development
Malaysia
gas and oil
development
Coal
Window #1
1992 Singapore’s
first gas unit
commissioned

The Lantau Group Confidential and Proprietary 5
Up to then….life was pretty straightforward….
Core generation
technologies
Keep up with
growth
Few
complicating
issues
Respond to
fuel
availability
and cost

The Lantau Group Confidential and Proprietary
Around 2005, a second Asian coal window opened…
6
0
5
10
15
20
25
30
1970 1974 1978 1982 1986 1990 1994 1998 2002 2006 2010 2014 2018
Fu
el
Pri
ce
(U
SD
/mm
btu
)
And so here we are….much of that gas is linked to the price of oil
Notes: Coal: 1970 to 2022: Australian Newcastle FOB coal. Historic from World Bank, futures from ICE.
Oil: 1970 to 1997: Dubai crude adjusted to approximate Brent. 1997 to 2022: Brent. Historic from World Bank, futures from ICE.
Coal window #1 Coal window #2

The Lantau Group Confidential and Proprietary
Oil-linked natural gas prices in Asia have fallen
7
0.0
2.0
4.0
6.0
8.0
10.0
12.0
14.0
16.0
18.0
20.0
Mar-
09
May-0
9
Jul-0
9
Sep-0
9
Nov-0
9
Jan-1
0
Mar-
10
May-1
0
Jul-1
0
Sep-1
0
Nov-1
0
Jan-1
1
Mar-
11
May-1
1
Jul-1
1
Sep-1
1
Nov-1
1
Jan-1
2
Mar-
12
May-1
2
Jul-1
2
Sep-1
2
Nov-1
2
Jan-1
3
Mar-
13
May-1
3
Jul-1
3
Sep-1
3
Nov-1
3
Jan-1
4
Mar-
14
May-1
4
Jul-1
4
Sep-1
4
Nov-1
4
Jan-1
5
US
D/m
mb
tu
Proxy long term Asian LNG price (slope at 0.135 with constant 0.8/mmbtu)

The Lantau Group Confidential and Proprietary
But so, too, have coal prices
• The Newcastle FOB coal price and
the FOB Indonesian coal reference
(HBA) price track each other
closely in terms of USD per tonne
• Also, as the calorific values are
very similar, the price per energy
unit (mmbtu) also exhibit a close
correlation
• In order to have a basis for a
forward price for Indonesian coal,
we have used forward prices for
Newcastle coal as a proxy
8
0
1
2
3
4
5
6
2009 2010 2011 2012 2013 2014 2015 (toMarch)
Co
al p
ric
e (
US
D/m
mb
tu)
FOB Newcastle
FOB Indonesian CoalReference Price
Sources: World Bank, Ministry of Energy and Mineral Resources

The Lantau Group Confidential and Proprietary
Before oil price drop in June 2014
9
To be economic -- every mmBtu of gas has to cover the cost of its spread vs coal
Notes: Imported LNG price is based on ICE Brent futures times a 13.5 percent slope plus shipping of USD 1.0/mmbtu and regas of USD 1.0/mmbtu.
Coal price is based on ICE futures for Newcastle coal and shipping of USD 10/tonne.
0
5
10
15
20
25
2009 2010 2011 2012 2013 2014 2015 2016 2017 2018 2019 2020
Fu
el P
rice
Re
al U
SD
per
mm
btu
Newcastle Delivered LNG Delivered + Regas
Futures
Coal
Brent
The Lantau Group Confidential and Proprietary
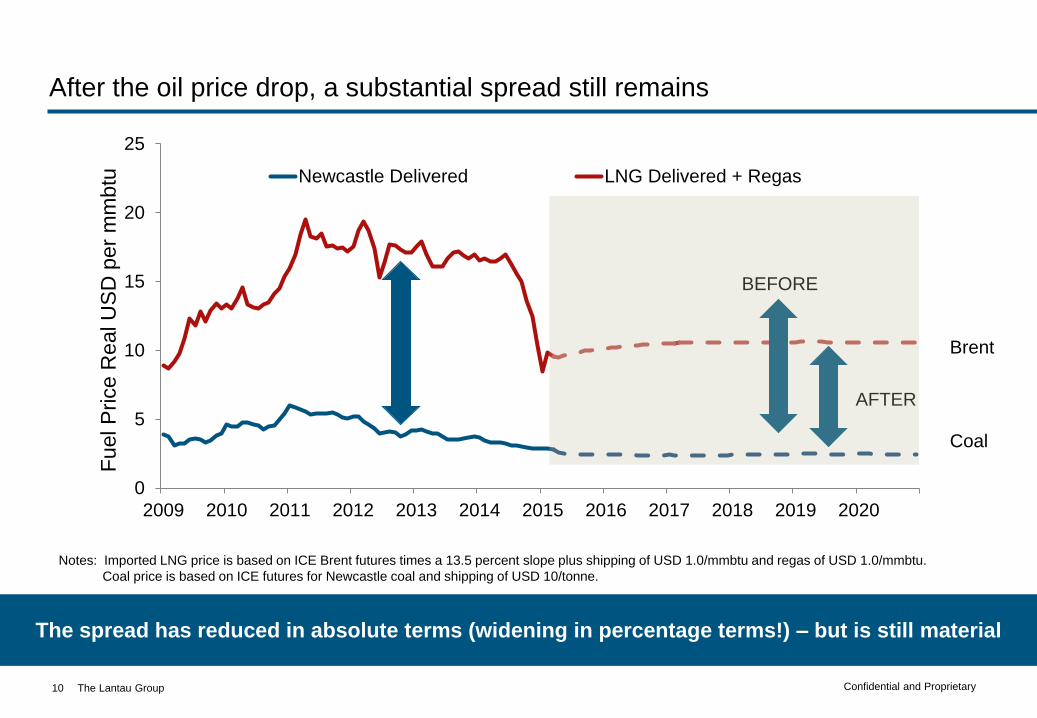
After the oil price drop, a substantial spread still remains
10
The spread has reduced in absolute terms (widening in percentage terms!) – but is still material
0
5
10
15
20
25
2009 2010 2011 2012 2013 2014 2015 2016 2017 2018 2019 2020
Fu
el P
rice
Re
al U
SD
per
mm
btu
Newcastle Delivered LNG Delivered + Regas
Notes: Imported LNG price is based on ICE Brent futures times a 13.5 percent slope plus shipping of USD 1.0/mmbtu and regas of USD 1.0/mmbtu.
Coal price is based on ICE futures for Newcastle coal and shipping of USD 10/tonne.
AFTER
BEFORE
Coal
Brent

The Lantau Group Confidential and Proprietary
Over time, the spreads remain a significant risk factor
11
Note: 2000 to present. Brent and Newcastle Coal from ICE.
LNG assumes 13.5 slope and shipping of USD 1/mmbtu and
regas of USD 1.0/mmbtu. Coal assumes shipping of USD
10/tonne.
0.00
2.00
4.00
6.00
8.00
10.00
12.00
14.00
16.00
0 20 40 60 80 100 120 140 160 180 200
Spread between gas and coal in Asia since 1/1/2000
Count
Current range (2015)

The Lantau Group Confidential and Proprietary
Did the Asian LNG price premium really disappear in the blink of an eye?
Forever?
12
0
5
10
15
20
25
20
00
20
01
20
02
20
03
20
04
20
05
20
06
20
07
20
08
20
09
20
10
20
11
20
12
20
13
20
14
20
15
Gas P
rice
(U
SD
/mm
btu
)
Henry Hub
NBP
Asia LNG price
(assuming 13.5
slope and USD 0.8
constant) JKM
Source: ICE, CME, Platts, TLG analysis

The Lantau Group Confidential and Proprietary
Not yet clear – oil futures still point to an Asian penalty unless contracting
changes
13
0
5
10
15
20
25
20
00
20
01
20
02
20
03
20
04
20
05
20
06
20
07
20
08
20
09
20
10
20
11
20
12
20
13
20
14
20
15
20
16
20
17
20
18
20
19
20
20
Gas P
rice
(U
SD
/mm
btu
)
Asian oil-indexed LNG prices
based on oil forward curve
Source: ICE, CME, Platts, TLG analysis

The Lantau Group Confidential and Proprietary
However, spot and short-term LNG trading clearly have increased, possibly
making regional gas prices become more correlated in the future
14
R² = 0.7461
0.0
5.0
10.0
15.0
20.0
25.0
0.0 5.0 10.0 15.0
JK
M p
ric
e (
As
ian
sp
ot
LN
G p
ric
e),
U
SD
/mm
btu
NBP price, USD/mmbtu
R² = 0.0481
0.0
5.0
10.0
15.0
20.0
25.0
0.0 2.0 4.0 6.0 8.0
JK
M p
ric
e (
As
ian
sp
ot
LN
G p
ric
e),
U
SD
/mm
btu
Henry hub, USD/mmbtu
Asian spot LNG prices correlated to UK gas prices but not the US gas price
Economic law of one price in action
Two markets – unable to converge due to
insufficient interconnection infrastructure

The Lantau Group Confidential and Proprietary
0
1,000
2,000
3,000
4,000
5,000
6,000
7,000
1 2 3 4 5 6 7 8 9 10 11 12 13 14 15 16 17 18 19 20 21 22 23 24
Time of day
MW
A typical generation day has a variety of requirements that typically support
generation technologies with different cost and performance characteristics
15
We divide demand into
three categories
• Baseload: always on
at full output
• Intermediate: often
on, generally for
extended periods of
time, though usually at
varying output levels
• Peaking: needed
sometimes, for varying
amounts. Often must
start and stop on short
notice`
Baseload or “always on”
Swing or Intermediate
Peaking
Source: PEMC
A typical daily load profile [electricity demand in Luzon on an illustrative day
(Friday, 10th January 2014)]
Evening peak Day peak

The Lantau Group Confidential and Proprietary
A stylised Asian example
16
Terminal
• Coal plants are very expensive to build but
relatively cheap to run.
Coal is a good baseload option for
Philippines even if LNG is imported.
• Gas plants are relatively lower cost to build
(even taking into account an LNG terminal
needed too) but expensive to run (in Asia)
Gas fits well into a mid-merit role. It
also provides flexibility for changes
in demand due to outages of other
fuels; hydro fluctuations; changes in
demand etc.
• Diesel and OCGT plants are lower cost to
build but expensive to run.
Displacing diesel for baseload and
peaking is value-adding; assuming
that “no diesel is good for the
system” is not.
The right mix is a blend of baseload, mid-merit and peaking plants to give overall least
system cost
Fixed costs - $/kW per year Variable costs - $/MWh
0
20
40
60
80
100
120
140
160
180
Oil Gas Coal
Fuel
Variable O&M
0
50
100
150
200
250
300
Oil Gas Coal
Capital
Fixed O&M

The Lantau Group Confidential and Proprietary
The value of flexibility and the role of gas:
examples
17

The Lantau Group Confidential and Proprietary
Gas demand, particularly for power, depends on price and availability of
alternatives
• Peninsular Malaysia sells gas to the
power sector at a price that is
approximately equal to coal in terms of
RM/GJ
• The market-price of gas, (whether
measured as the replacement cost, the
regional LNG price or the price paid by
the non-power sector or Singapore) is
much higher
• As Peninsular Malaysia moves to market-
priced gas, the ratio of gas price to coal
price will increase, changing the
economics of gas-fired power generation
from baseload to peaking duty
• Coal becomes the least-cost source of
baseload power supply
Reliance on gas-fired capacity for baseload power is expensive relative to coal
18
The Lantau Group
0
1
2
3
4
5
6
0% 20% 40% 60% 80% 100%
Market
Prices
Optimum Gas-Unit Capacity Factor
Regulated
Prices
“Today’s
Market Prices”
Gas/Coal Price Ratio
MALAYSIA EXAMPLE
GAS IS PREFERRED
COAL IS PREFERRED

The Lantau Group Confidential and Proprietary
As Singapore outgrew its available gas supplies, it sought to build an LNG
terminal to enhance energy security
2004 2005 2006 2007 2008 2009 2010 2011 2012 2013 2014
PNG supply
disruption
and partial
blackout
EMA launches
LNG terminal
feasibility study
Singapore
commits to
import LNG
EMA limits
PNG imports
Gas Act
amended
EMA appoints
PowerGas as
LNG terminal
developer
BG selected as
LNG Aggregator
Gas
market
formed
EMA takes
over LNG
terminal
EMA announces
LNG Vesting
Gencos
commit
to LNG
contracts
Terminal
breaks
ground
Terminal
begins
operation
CCGTs with new LNG
contracts come online
Keppel
840 MW
Senoko
860 MW
Tuas
406 MW
GMR
800 MW
Sembcorp
400 MW
Meanwhile…the gas vs coal price spread tripled….
The terminal provided security: but over-contracting for gas resulted in higher cost
19
Gas Price
Coal Price
SINGAPORE EXAMPLE

The Lantau Group Confidential and Proprietary
In this section, we consider an example based on Indonesia
• My intent is to identify the least-cost mix of Indonesian resources, based on fuel price
expectations as of June 2014
• In order to simplify presentation, I will focus on a “first-year” analysis of units coming
on line in 2018
• A key issue involves the determination of gas value, since there are three distinctly
different sources of gas in Indonesia:
– Piped gas. This gas is priced via existing contracts, whereby prices escalate with inflation
and defined indices
– Imported LNG. Prices for imported and exported LNG are largely tied to crude prices
(particularly Brent)
– Domestic market obligation (DMO) LNG. By law, gas producers seeking to export LNG
must set aside at least 25 percent of production for the domestic market, at prices that
represent roughly a 15 percent discount to imported LNG
• While the marginal source of gas for PLN is probably the DMO LNG, I argue that
imported LNG sets the opportunity cost of gas for Indonesia.
20
INDONESIA EXAMPLE
The Lantau Group Confidential and Proprietary
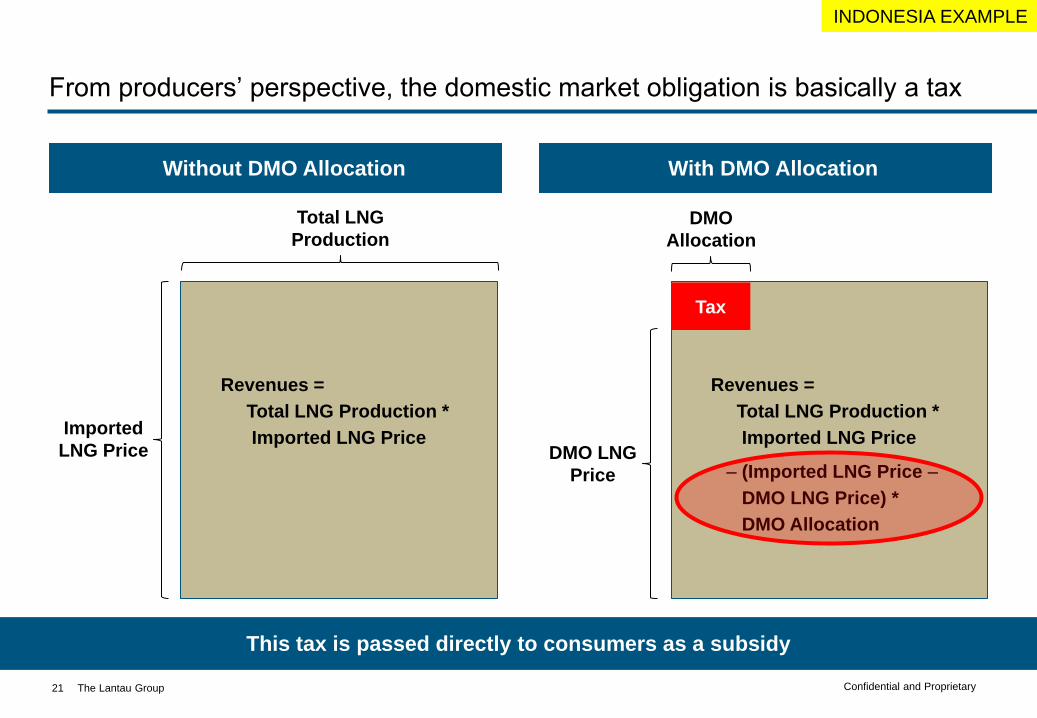
From producers’ perspective, the domestic market obligation is basically a tax
21
Without DMO Allocation With DMO Allocation
Imported
LNG Price
Total LNG
Production
Revenues =
Total LNG Production *
Imported LNG Price DMO LNG
Price
DMO
Allocation
Revenues =
Total LNG Production *
Imported LNG Price
Tax
– (Imported LNG Price –
DMO LNG Price) *
DMO Allocation
This tax is passed directly to consumers as a subsidy
INDONESIA EXAMPLE

The Lantau Group Confidential and Proprietary
Screening curve analysis is based on fixed and variable cost components for
each technology (using real dollars)
22
Plant Type Gas CCGT Greenfield Coal Geothermal
Capital Cost
Generic Cost (USD/kW) 900 1,600 3,475
Construction Time (years) 2.5 3.5 7.0
Total Cost (USD/kW) 976 1,832 5,754
Economic Life (years) 25 30 30
Station-Own Consumption (percent) 1.5 4.0 4.0
Annualized Capital Cost (USD/kW-year) 118 .220 999
Fixed Cost
Fixed O&M (USD/kW-year) 13 25 160
Fuel Costs
Gross Fuel Cost (HHV) (USD/mmbtu) 13.40 3.55
Heat Rate (mmbtu/MWh) 7.0 9.0 0.0
Variable Costs
Variable O&M (USD/MWh) 2 4 1
INDONESIA EXAMPLE

The Lantau Group Confidential and Proprietary
Given the fixed and variable cost components, the total cost of generation is
proportional to capacity factor
• Our analysis assumes a 2018 start date
for new plant
• We used the forward curve for Newcastle
coal plus delivery to approximate the
Indonesian Reference Coal Price, yielding
a real price of 3.55 USD/mmbtu in 2018
• We assumed that the imported LNG price
equals the Brent forward price times a
slope of 12.5 percent, plus shipping of
1.00 USD/mmbtu and regas cost of 0.70
USD/mmbtu, yielding a real gas price of
13.40 USD/mmbtu
23
Source: TLG analysis
0
200
400
600
800
1,000
1,200
1,400
0 10 20 30 40 50 60 70 80 90 100
To
tal C
ost
(US
D/k
W-y
ear)
Capacity Factor (percent)
Geothermal
CCGT
Coal
INDONESIA EXAMPLE

The Lantau Group Confidential and Proprietary
We can also express the results directly in terms of USD/MWh energy cost
• Coal-fired plant is clearly the
least expensive base load
option
• CCGTs are the least
expensive option for capacity
factors below 21-22 percent
• At our assumed costs
(consistent with breakeven
operation at the lower end of
the geothermal FiT),
geothermal is simply not
economic
24
Source: TLG analysis
Coal
0
40
80
120
160
200
240
280
320
0 10 20 30 40 50 60 70 80 90 100
Co
st
(US
D/M
Wh
)
Capacity Factor (percent)
Geothermal
CCGT
CCGT Coal
INDONESIA EXAMPLE

The Lantau Group Confidential and Proprietary
Even with CO2 priced at 50 USD/tonne, the optimal mix does not shift – but the
breakeven CCGT capacity factors rise to about 40 percent
25
Source: TLG analysis
0
40
80
120
160
200
240
280
320
0 10 20 30 40 50 60 70 80 90 100
Co
st
(US
D/M
Wh
)
Capacity Factor (percent)
Breakeven
Capacity Factor
Geothermal
CCGT
Coal
0
200
400
600
800
1,000
1,200
1,400
0 10 20 30 40 50 60 70 80 90 100
To
tal
Co
st
(US
D/k
W-y
ea
r)
Capacity Factor (percent)
Breakeven
Capacity Factor
Geothermal
CCGT
Coal
INDONESIA EXAMPLE

The Lantau Group Confidential and Proprietary
There was a time when the gas to coal spread supported higher utilisation
26
0
10
20
30
40
50
60
70
80
90
0.00 2.00 4.00 6.00 8.00 10.00 12.00 14.00 16.00
00-01
02-03
Simple Difference Between Gas and Coal Prices ($/mmBtu)
Gas Plant Capacity Factor (Optimal)

The Lantau Group Confidential and Proprietary
Some years, like 2008 and 2009 – are hugely variable
27
0
10
20
30
40
50
60
70
80
90
0.00 2.00 4.00 6.00 8.00 10.00 12.00 14.00 16.00
08-09
Simple Difference Between Gas and Coal Prices ($/mmBtu)
Gas Plant Capacity Factor (Optimal)

The Lantau Group Confidential and Proprietary
More recent experience is at the opposite end
28
0
10
20
30
40
50
60
70
80
90
0.00 2.00 4.00 6.00 8.00 10.00 12.00 14.00 16.00
12-13
14-15
Simple Difference Between Gas and Coal Prices ($/mmBtu)
Gas Plant Capacity Factor (Optimal)

The Lantau Group Confidential and Proprietary
Overall picture
29
0
10
20
30
40
50
60
70
80
90
0.00 2.00 4.00 6.00 8.00 10.00 12.00 14.00 16.00
00-01
02-03
04-05
06-07
08-09
10-11
12-13
14-15
Simple Difference Between Gas and Coal Prices ($/mmBtu)
Gas Plant Capacity Factor (Optimal)

The Lantau Group Confidential and Proprietary
Gas infrastructure is needed – but the operating regime is highly variable
• Variable operating profile
• Seasonality
• Responsiveness to outages or demand variation
• Long-period variation (El Nino vs La Nina)
30
The value of gas to the power sector in Asia is greatest (by far) when the arrangements for accessing it are highly flexible

The Lantau Group Confidential and Proprietary
It’s All About Uncertainty and Flexibility
31

The Lantau Group Confidential and Proprietary
Base Case
• Standard size FSRU running at less than ten
percent capacity factor or 30 percent at peak
times with all cost assigned to a power plant.
• Might be able to get by on only need five
deliveries a year – or more, smaller deliveries
at slightly higher cost
• An 800 MW gas fired plant could run at 30
percent capacity factor to serve mid merit
load.
32
Item Units
Terminal storage size 155,000 m3
Terminal capex USD 300 m
Max send out 500 mmscfd
Terminal charge USD 2.8/mmbtu
Shipping charge USD 0.5/mmbtu
Levelised Real LNG FOB USD 7.9/mmbtu
Regasified LNG USD 11.2/mmbtu
0
10
20
30
40
50
60
70
80
90
100
0
100
200
300
400
500
600
700
0 10 20 30 40 50 60 70 80 90 100
Lo
ad
as P
erc
en
t o
f P
eak
US
D M
Wh
Capacity Factor (Percent)
Standard FSRU Scenario

The Lantau Group Confidential and Proprietary
0
10
20
30
40
50
60
70
80
90
100
0
100
200
300
400
500
600
700
0 10 20 30 40 50 60 70 80 90 100
Lo
ad
as P
erc
en
t o
f P
eak
US
D M
Wh
Capacity Factor (Percent)
Base Case (plus $20 carbon charge)
• Standard size FSRU running at less than fifteen ten percent capacity factor or 30 percent at peak times with all cost assigned to a power plant.
• Might be able to get by on only need six deliveries a year – or more, smaller deliveries at slightly higher cost
• An 800 MW gas fired plant could run at 40 percent capacity factor to serve mid merit load.
33
Item Units
Terminal storage size 155,000 m3
Terminal capex USD 300 m
Max send out 500 mmscfd
Terminal charge USD 2.1/mmbtu
Shipping charge USD 0.4/mmbtu
Levelised Real LNG FOB USD 7.9/mmbtu
Regasified LNG USD 10.4/mmbtu
Standard FSRU Scenario
Significant rise in
capacity factor

The Lantau Group Confidential and Proprietary
Base Case with Smaller (Lower Cost) FSRU
• Reduced terminal size would lower the
terminal charge by about one USD per
mmbtu. But that would most likely mean
more partial cargos and higher shipping
costs
• An 800 MW CCGT plant could run at 32
percent capacity to serve mid merit load.
Not a lot of extra demand for LNG, but a
loss of flexibility
34
Item Units
Terminal storage size 80,000 m3
Terminal capex USD 200 m
Max send out 250 mmscfd
Terminal charge USD 1.9/mmbtu
Shipping charge USD 0.8/mmbtu
Levelised Real LNG FOB USD 7.9/mmbtu
Regasified LNG USD 10.6/mmbtu
0
10
20
30
40
50
60
70
80
90
100
0
100
200
300
400
500
600
700
0 10 20 30 40 50 60 70 80 90 100
Lo
ad
as P
erc
en
t o
f P
eak
US
D M
Wh
Capacity Factor (Percent)
Slight rise in
capacity factor
Smaller FSRU Scenario

The Lantau Group Confidential and Proprietary
Smaller FSRU means more trips for refilling higher cost & less flexibility
• As the size of the FSRU is scaled down the
greater the number of delivery trips, by
whatever size of carrier.
• If the shipping is by dedicated smaller LNG
carriers, this might increase the risk of an
interruption to deliveries. That is unless the
LNG supplier or LNG vessel charter can use
an alternative vessel temporarily.
• The number of days of inventory falls as the
FSRU gets smaller which means regular top
ups are required.
• If demand for peaking power suddenly picks
up then it is easier to call on LNG from the
spot market in more standard sized LNG
carriers.
35
0
5
10
15
20
0
50
100
150
200
1 2 3 4 5 6 7 8 9
Num
ber
of T
rips
FS
RU
Siz
e (
thousand m
3)
FSRU Size Number of Trips
0
20
40
60
80
100
0
50
100
150
200
1 2 3 4 5 6 7 8 9
Days o
f in
vento
ry
FS
RU
Siz
e (
thousand m
3)
FSRU Size Inventory

The Lantau Group Confidential and Proprietary
Being able to accommodate a wider range of (up-to) full-sized carriers cargoes
increases flexibility when sourcing short-term or spot
0
50
100
150
200
250
300
0 50 100 150 200 250 300 350
Th
ou
sa
nd
cu
bic
metr
es
36
Cumulative number of ships
Clear sweetspot of carrier size:
125,000m3 – 170,000m3
(56kt – 76kt)
Source: TLG research
Number of LNG carriers by size

The Lantau Group Confidential and Proprietary
55
14
1
28
1
0
10
20
30
40
50
60
70
80
90
100
1
Perc
ent
of to
tal le
velis
ed c
ost
Power Plant Opex
Power Plant Capex
Terminal Opex
Terminal Capex
Fuel
The terminal is the key source of flexibility – and its contribution to total cost is
comparatively small
37
• The main driver of changes in overall busbar
power cost are changes in the price of LNG.
• Size of the FSRU terminal does not have that
great an impact on costs.
• Dispatch against versus coal fired plants is
also mostly driven by the relative pricing of
LNG against coal.

The Lantau Group Confidential and Proprietary
What are the implications of mid-merit LNG-fired generation on associated
infrastructure investment
• Mid-merit LNG-fired generation will be subject to daily load variation, seasonal swings,
and long-term capacity factor uncertainty
– Cannot support high load factor for LNG terminals
– Costly to be constrained by inflexible, take-or-pay commitments
– Cannot sign bankable long-term supply contracts
• Fuel margins matter and vary widely over time
• Asian LNG terminals need to be able to recover their costs primarily via capacity
reservation charges, rather than throughput charges
– Throughput capacity will vary with circumstances
– Sizing of terminal storage capability will be the key design variable
– Break-bulk shipping and LNG trucking – both inherently more flexible – will supplant gas pipelines
• Needed: a new set of commercial and regulatory arrangements to enable decoupling of
capacity and usage….in Asia
38

The Lantau Group Confidential and Proprietary
Thank You
Contact
Mike Thomas [email protected]
By phone +852 2521 5501 (office)
By mail 4602-4606 Tower 1, Metroplaza
223 Hing Fong Road,
Kwai Fong, Hong Kong
Online www.lantaugroup.com
Rigour
Value
Insight
Energy Power Utilities
39