gas from devonian shales - princeton university - home
TRANSCRIPT

Chapter 9
Gas From Devonian Shales

Contents
Page
introduction. . . . . . . . . . . . . . . . . . . . . . . . . . . . . . . . . . . . . . . . . . . . . ... ... ... ..179
Characteristics of the Devonian Shale Resource . . . . . . . . . . . . . . . .. ... ... ...179
Gas-In-Place Resource Base . . . . . . . . . . . . . . . . . . . . . . . . . . . . . . . . . . . . . . . . . ..182Methodologies and Results . . . . . . . . . . . . . . . . . . . . . . . . . . . . . . . . . . . . . . . ...182Estimate Comparison and Uncertainties . . . . . . . . . . . . . . . . . . . . . . . . . . . . . . .186
Technology . . . . . . . . . . . . . . . . . . . . . . . . . . . . . . . .........................187Fracturing . . . . . . . . . . . . . . . . . . . . . . . . . . . . . ...........................187Deviated and Directional Drilling . . . . . . . . . . . . . . . . . . . . . . . . . . . . . . .. ....189Exploration . . . . . . . . . . . . . . . . . . . . . . . . . . . . . ..........................189
Recoverable Resources and Production Potential . ........................190Methodologies and Results . . . . . . . . . . . . . . . . . . . . . . . . . . . . . . . . . . . . . . . . . .191Estimates Comparison and Uncertainties. , . . . . . . . . . . . . . . . . . . . . . . . . . . . . .199Annual Production Estimates . . . . . . . . . . . . . . . . . . . . . . . . . . . . . . ... ... ....201
TABLES
Table No. Page
43.44.45.
46.47.
4849.50.51.
52.
53.
54.55.
Devonian Shale Resource Base Estimates (TCF) . .......................182Equation Parameters . . . . . . . . . . . . . . . . . . . . . . . . . . . . . . . . . . . . . . ........184Estimates of ln-Place Natural Gas Resources in the DevonianShale of the Appalachian Basin . . . . . . . . . . . . . . .......................184Devonian Shale Recoverable Resource Estimates (TCF) Appalachian Basin .191Summary of Major Differences Between Lewin Base and AdvancedCases in Devonian Shale Analysis . . . . . . . . . . . . . . . . . . . . . . . . . . . . . . . . . . . 193Lewin &Associates: Results of Economic Analysis, Summary Table . ......194Summary of Producible Gas Estimates, Appalachian Basin . . . . . . . . . . .. ...195Effect of Spacing on the Devonian Shale Recoverable Resource . . . . . . . ...196Results of Lewin Assessment of Technically Recoverable Gas in Ohio,By Stimulation Method After 40 Years . . . . . . . . . . . . . . . . . . . . . . . . . . . . . . .198Results of Lewin Assessment of Technically Recoverable Gas inWest Virginia, by Stimulation Method After 40 Years... . ...............198Comparison of Estimated Appalachian Devonian Shale ResourcesRecoverable With Borehole Shooting, Well Spacing of 150 to 160 Acres ..200Lewin &Associates Results for Annual production Estimates . ............202Potential Incremental Supply of Devonian Shale Gas in theAppalachian Basin: NPC -High Growth Drilling Schedule. . ..............200
FIGURES
Figure No. Page
39. Primary Area of Devonian Shale Gas Potential . .......................18040. Averaged Production Decline Curves for 50 Devonian Shale Gas Wells ...18141. Shale Gas Potential in the Appalachian Basin . ........................18542. Distribution of Devonian Shale Gas . . . . . . . . . . . . . . . . . . . . . . . . . . . . . . ...187

Chapter 9
Gas From Devonian Shales
INTRODUCTION
Although it is often presented as a gas sourceof the future, Devonian shale gas actually has along production history: the first Devonian shalegas well was drilled in 1821, near Fredonia, NY,and “modest” production from Devonian shalewells began around the 1920s and has continuedto the present.1 Cumulative production from theshales during all the years of production has beenless than 3 trillion cubic feet (TCF), most from the
‘Potential Gas Agency, “Potential Gas Resources From Non-conventional Sources, ” Potential Supply of Natural Gas in theUnited States, May 1981.
Big Sandy Field in Kentucky and adjacent WestVirginia, and current production is only about 0.1TCF/yr.
Because of its history, Devonian shale gas maybe thought of as a “conventional” gas resource.It is also an unconventional gas resource, how-ever, because of its complex geology and becauseadvanced exploration and extraction technol-ogies and higher prices may be able to transformit into an important component of U.S. gas supplyfrom its current status as a very limited, if stilllocally important, gas source.
CHARACTERISTICS OF THE DEVONIAN SHALE RESOURCEDevonian shale gas is defined as natural gas
produced from the fractures, pore spaces, andphysical matrix2 of shales deposited during theDevonian period of geologic time. As illustratedin figure 39, Devonian shales occur predominant-ly in the Appalachian, Illinois, and Michiganbasins. The shales formed approximately 350 mil-lion years ago in a shallow sea that covered theeastern half of what now constitutes the continen-tal United States. organic-rich muds and siltswere deposited in the sea and subsequentlyburied by younger sediments. The high pressuresand temperatures that accompanied burial of thesediments resulted in the formation of natural gasfrom the organic material.
The gas content of the shales is proportionalto the amount of organic material, and more pre-cisely the organic carbon, present in the rock.The organic material occurs as microscopicallythin layers, alternating with mineral layers. Theactual physical color of the shales is indicativeof their organic content: black and brown shalesgenerally have higher organic contents and there-fore more gas than gray shales.
‘That is, a portion of the gas is adsorbed, or bound, to the actualphysical structure of the shale.
Other determinants of the gas content are theorigin of the organic material, that is, the type oforganisms (algae, pollen, woody plants, etc.) thatformed the sedimentary layers which became theshale, and the physical conditions, especially thetemperature, to which the organic material wasexposed. For example, blooms of algae appearto be the major source of Devonion shale gas,whereas terrestrial organisms are less promisingsources of gas.3 And temperature conditions be-tween 60° C (140° F) and 150° C (3020 F) areoptimal for the formation of petroleum (oil andgas).4
Unlike accumulations of natural gas that areconsidered conventional, and unlike tight sandsgas, Devonian shale gas did not migrate fromsource rocks to reservoir rocks and accumulatein a trap. Instead, the low permeability of theDevonian shale prohibited most of the gas fromescaping. As such, the shale is effectively thesource, reservoir rock and trap for the gas. How-ever, some gas originally present in the shale may
3R. A. Struble, Evaluation ot’ the Devonian Shale Prospects in theEastern United States, U.S. Department of Energy ReportDOE/MC/19143-1305, undated.
4j. M. Hunt, Petroleum Geochemistry and Geology (New York:Freeman, 1979), p. 617. Cited in R. A. Struble, op. cit.
179

180 U.S. Natural Gas Availability: Gas Supply Through the Year 2000
Figure 39.— Primary Area of Devonian Shale Gas Potential
SOURCE: Johnston & Associates, OTA Contractor,
have migrated out of the formation, escaping tothe atmosphere or forming conventional gas ac-cumulations in nearby sandstones.
The reservoir characteristics of Devonian shalediffer substantially from those of conventionalreservoirs. Porosities range from 8 to 30 percentin conventional reservoirs; Devonian shale ma-
trix porosities are generally 1 to 2 percent. Thepermeability of the shales is also significantlylower. Conventional reservoirs have permeabil-ities in the range of 1 to 2,000 millidarcies (red),whereas Devonian shale matrix permeabilitiesgenerally range from 10 -5 to 10-6 md. Eventhough portions of the shale contain natural frac-tures, fracture permeabilities tend to be low, rang-

Ch. 9—Gas From Devonian Shale . 181
ing from about 0.001 to 1 md; in most cases, per-meabilities are less than about 0.1 md. s Assuggested by these statistics, gas flows much lessreadily from most Devonian shale reservoirs thanfrom conventional sandstone reservoirs.
The natural fractures in the shale, which mostoften occur in a vertical pattern, are critical tosuccessful production. Such production gener-ally requires intersecting these fractures to utilizethe increase in overall permeability that they pro-mote. Because the shale fracture systems in thegreat bulk of the Appalachian Basin are still quitetight, however, achieving high recovery efficien-cies generally also requires inducing new, proppedfractures in addition to connecting with the nat-ural system. Also, aside from their “tightness,”the shale fracture systems tend to be somewhatlined up rather than being random in direction–aproperty called “anisotropy.” Optimum fracturedesign and well spacing are affected by this prop-erty, e.g., a rectangular well spacing patternaligned with the direction of anisotropy will in-crease gas recovery over the usual squarepattern.6
Typically, production from Devonian shalewells is at first relatively high, followed by a steadydecline to a base level which can remain con-stant for over 50 years. Four production curvesrepresenting the averaged production of multi-ple wells are included in figure 40. The shape ofthe production curves probably is a result of themultiple ways in which the gas occurs in the rock:in pore spaces, in the fracture system and ad-sorbed to the shale matrix. The initial productionis composed primarily of the free gas containedin the fracture network immediately connectedto the wellbore and that pore gas which readilymigrates to the well bore. The base level then rep-resents the rate at which the gas diffuses throughand desorbs from the shale matrix. However, therelative contribution of each of the three distinct“sources” of gas in the shale is not completely
‘V. A. Kuuskraa and D. E. Wicks, “Devonian Shale Gas Produc-tion Mechanisms, ” 1984 International Gas Research Conference;V. A. Kuuskraa, et al., Technically Recoverable Devonian Shale Gasin Ohio, Lewin & Associates Report for Morgantown Energy Tech-
no logy Center , July 1982.
6V. A. Kuuskraa and D, E. Wicks , “Devon ian Shale Gas Produc-
t i o n M e c h a n i s m s , ” 1984 In ternat iona l Gas Research Conference.
Figure 40.—Averaged Production Decline Curves for
understood, and there are alternative interpreta-tions of the precise composition of the base pro-duction level. One interpretation is that the baselevel is primarily adsorbed gas that is being re-leased by the shale matrix as the pressure drops.An alternative explanation is that the base levelgas is primarily gas from other gas-bearing inter-vals that are connected to the primary (stimu-lated) interval by the vertical fracture network inthe shale.
Deciphering the relative roles of these twomechanisms is critical to estimating the recover-able resource. At one extreme, if the base levelof production is mostly adsorbed gas and thereis little communication between gas-bearing in-tervals, then the intervals that are not currentlybeing stimulated may be available for productionin the future. At the other extreme, if there is lit-tle resorption of gas and the base level is dueto vertical communication between intervals,
then the number of targets for economic produc-tion is drastically reduced and the recoverableresource will be far less. In the latter case, the

182 . U.S. Natural Gas Availability: Gas Supply Through the Year 2000
major part of the gas-in-place (Kuuskraa and The current available data appear to support theWicks estimate that adsorbed gas represents over “resorption, little vertical communication” inter-80 percent of the total7) will not be available for pretation, but these data are limited to a veryproduction with currently foreseen technology. small geographical area.8
BCharles Komar, Morgantown Energy Technology Center, per-7Kuuskraa and Wicks, op. cit. sonal communication, 1984.
GAS= IN-PLACE RESOURCE BASE
The Devonian shale resource is becoming in-creasingly well characterized as a result of recentefforts to better understand the geological char-acteristics of the resource and its size. Work per-formed as part of the Department of Energy’s(DOE) Eastern Gas Shales Project (EGSP) has pro-vided substantive geological and geochemicaldata.9
Methodologies and Results
As illustrated in table 43, several organizationshave estimated the size of the Devonian shale re-source base. The three most recent estimates ofthe in-place resource were made by the National
gThe results of the project are summarized in a report by R. A.
Struble, Evaluation of the Devonian Shale Prospects in the EasternUnited States, U.S. Department of Energy Report DOE/MC/19143-1305, undated. This report provides a comprehensive review ofthe “state-of-the-art” of Devonian shale resource analysis up toabout 1982.
petroleum Council (NPC) in June 1980 and theU.S. Geological Survey (USGS) and the MoundFacility (operated by Monsanto Research Corp.)in 1982. The NPC study evaluated the Devonianshale resource in the three shale basins, whereasthe other two restricted their estimates to the Ap-palachian Basin.
National Petroleum Council10
The NPC estimated the gas-in-place resourcefor each of the three major basins. The primaryvariables in the in-place resource calculationwere shale thickness, areal extent and gas con-tent, with gas content assumed to be uniformthroughout each basin. These parameters wereestablished differently for each basin, dependingon the type and quantity of information available.
locational Petroleum council, “Unconventional Ndtural Gas-Devonian Shales,” June 1980.
Table 43.-Devonian Shale Resource Base Estimates (TCF)
Organization Year Basin evaluated EstimateNational Petroleum Councila . . . . . . . . . . . . . . . 1980 Appalachian . . . . . . . . . . . . . . . . 225 to 1,861 (125 to 1040b)
Michigan . . . . . . . . . . . . . . . . . . 76Illinois. . . . . . . . . . . . . . . . . . . . . 86
U.S. Geological Surveyc . . . . . . . . . . . . . . . . . . . 1982 Appalachian . . . . . . . . . . . . . . . . 577 to 1,131Mound Facilityd . . . . . . . . . . . . . . . . . . . . . . . . . . 1982 Appalachian . . . . . . . . . . . . . . . . 2,579 (l,440b)Lewin & Associatese. . . . . . . . . . . . . . . . . . . . . . 1980 Appalachian . . . . . . . . . . . . . . . . 400 to 2,000Federal Energy Regulatory Commission f . . . . 1978 Appalachian . . . . . . . . . . . . . . . . 285Smith g . . . . . . . . . . . . . . . . . . . . . . . . . . . . . . . . . . 1978 Appalachian 206 to 903aNational Petroleum Council, Unconvenyional Gas Sources, Tight Gas Reservoirs Part 1, December 1980.bConsidering “drillable” area only.CR.R. Charpentier et al., Estimates of Unconventional Natural Gas Resources of the Devonian Shale Of the Appalachian Basin, USGS Open-File Report 82-474, 1982.dR, E, Zielinski and R D, Mclver, Resource and Exploration Assessment of the oiI and Gas Potential in the Devonian shales of the Appalachian Basin, DOE/DP/0053-1 125,
undated.eV. A. Kuuskraa and R. F. Meyer, “Review of World Resources of Unconventional Gas,” in IIASA Conference on Conventional and Unconventional World Natural Gas
Resources, Laxenburg, Austria, June 30-July 4, 1980.fU.S., Department of Energy, Nonconventional Natural Gas Resources, Report DOE/FERC-0010, 1978.gE. C. Smith, “A Practical Approach to Evaluating Shale Hydrocarbon Potential,” in Second Eastern Shales Symposium, Vol. II, U.S. Department of Energy, Report
METC/SP-7816, 1978, pp. 73-87.
SOURCE: Office of Technology Assessment.

Ch. 9—Gas From Devonian Shale ● 183
In each basin, the black and gray shale thick-nesses were multiplied by their respective gascontents and their areal extents to arrive at thegas-in-place estimate for the basin.
In the Appalachian Basin, the gas-bearing zoneincludes the gray and black shale units thatoverlie the Onandaga limestone and underlie theBerea sandstone. The thickness of the blackshales was determined in two ways: first, bygamma-ray well log data which detects the highradioactivity content characteristic of organic-richshales; second, by thicknesses determined visual-ly from core sample color. The two black shalethickness calculations yield substantially differentresults, which in turn yield very different gas-in-place estimates. The gas content of the shales wasdetermined through off-gassing data from rockcore samples.11 Values of 0.6 and 0.1 cubic feetof gas per cubic feet of Appalachian shale wereobtained for black and gray shales, respectively.The areal extent of the Appalachian shale wasdetermined to be 111,100 square miles.
The gas-bearing unit in the Michigan Basin isthe Antrim shale, which extends over 35,400square miles and contains both black and greyshales. The thickness of the Antrim was deter-mined strictly by well logs and is poorly definedwhere the Antrim grades into the barren Ellsworthshale in the western portion of the basin. Also,there were no core samples available for off-gassing experiments to determine the quantity ofgas present in the unit. In the absence of thesedata, the gas content of the Michigan Basin shaleswere assumed to be the same as those of the Ap-palachian Basin on the basis of similarities in thewell production data for the two basins.
The New Albany shale group, covering 28,150square miles, is the gas-bearing unit in the IllinoisBasin. Neither gamma-ray well log data nor coresample data were available to determine thethickness of the units, and therefore the black andgray shale thicknesses could not be differentiated.The thickness of the entire sequence was deter-mined from USGS maps and used in a simplevolumetric resource calculation. off-gassing datafrom cores were available to determine the gas
.-.——1 Ioff.gassing measures the amount of gas that desorbs from a
known volume of core over a specific period of time.
content. The thickness of the sampled units inproportion to the total group thickness was usedto establish a weighted average of 0.62 cubic feetof gas per cubic foot of shale for the entire NewAlbany group.
The results of the NPC study suggest that esti-mates of the quantity of gas present in the Ap-palachian Basin are sensitive to the assumedthickness of the black shale and to the inclusionor exclusion of the lower quality gray shales.Based on thicknesses determined by gamma-raylogs, and including only the black shales, the gas-in-place is estimated to be 225 TCF. Based onblack shale thickness determined visually fromUSGS samples and including the gray shales,1,861 TCF is estimated to be present. (The rangefor the black shales only is 225 to 1,102 TCF.) Ifareas that are not drillable12 are excluded, the gas-in-place estimate is reduced to 125 and 1,040 TCFfor the log and sample thicknesses, respectively,The gas-in-place estimates for the Michigan andIllinois basins are 76 and 86 TCF, respectively,but are more uncertain because of the lack ofdata.
U.S. Geological Survey13
The USGS estimate of Devonian shale gas inthe Appalachian Basin recognizes three catego-ries of shale gas: macrofracture gas, microporegas, and that gas which is adsorbed, or attached,to the clay matrix. Unlike the early Lewin & Asso-ciates study (1 978-79), the USGS attributes onlya small amount of the total volume of gas-in-placeto macrofractures; it assumes that most of the gasis in micropores or bound to the organic matterin the shale matrix.
The Appalachian Plateau province and a smallsegment of the Valley and Ridge province weredivided into 19 areas, termed plays. The charac-teristics of each play were described in terms ofphysical location, unit names, thickness, organiccontent, maturation level and type of hydrocar-bon present, tectonic or structural attributes, and,subsequently, a brief description of the produc-
I zBeCaUSe of difficult terrain, presence of buildings and other de-
velopment, designation of the land as protected parkland, etc.1 JR. R. Charpentier, et al,, Estimates of Unconventional Natural
Gas Resources of the Devonian Shale of the Appalachian Basin, ”U.S. Geological Survey Open-File Report 82-474 (preliminary), 1982,

184 ● U.S. Natural Gas Availability: Gas Supply Through the Year 2000
tion potential of the play. The volume of gas foreach of the 19 different areas was calculated usingEquation 1, below:
The parameters used in the equation are ex-plained in table 44. The volume of gas for eacharea was summed to obtain a total basin estimate.
The analysis explicitly recognizes two severedata problems:
● limited quantity of data for most of theassessed area, and
● large sampling errors and differences in inter-pretation.
Because of the limited quantity and quality ofdata, a range rather than a point estimate of thegas present was developed. The Monte Carlomethod of estimation was employed to acquirethe range.14
———lqln using a Monte Carlo method, appropriate variables in the
equation are specified by a probability distribution rather than bya point estimate. Then, the equation is “solved” for the depen-dent variable–in this case, gas-in-place–a large number of timesby randomly sampling the probability distributions. In this way, aprobability distribution is obtained for the dependent variable (gas-in-place). The “solution” to the equation can either be expressedby the probability distribution itself, by its mean or median, or per-haps by a range defined by some probability that the actual valueis within its borders (e. g., “there is an 80 percent probability thatthe correct value is in the range X to Y“).
Table 44.—Equation Parameters
Symbol Meaning
G . gas-in-place0 rnacro “ : : . average macrofracture porosity as a fraction
of total volumeTH s . . . . . . . average thickness of organic-rich shalesPr . . . . . . . . . average reservoir pressure (psi)P s . . . . . . . . standard pressure (14.73 psi)Tr . . . . . . . . . average reservoir temperature (oR)T s . . . . . . . . standard temperature (5200R)z . gas deviation factor (0.9)Area” ; ; ; ; . area (square miles)0 micro . . . . average content of microporosity gas at
standard temperature and pressure as afraction of rock volume
SOR . . . . . . average volume ratio of adsorbed gas toinorganic content
ORG . . . . . . average organic content as fraction of rockvolume
SOURCE U S. Geological Survey, “Estimates of the Unconventional Natural GasResources of the Devon Ian Shale of the Appalachian Basin, ” 1982
The data used were acquired from a variety ofsources. The configuration of the gas shales wastaken from geologic cross sections, isopachs(thickness maps), and other geological maps com-piled by the USGS. Maps were also used to esti-mate thickness, organic content and averagedepths, which when combined with temperatureand pressure gradients yielded average reservoirpressures and temperatures. Micropore gas esti-mates were achieved by plotting gas content—acquired from off-gassing data from canned coresamples—against the amount of organic matterin the sample. The slope of the resultant curverepresents the ratio of adsorbed gas to organicmatter. The intercept (gas content at the pointwhere organic matter is zero) represents themicropore gas content.
The results of the USGS study are compiled intable 45. The 95th fractile (F95is a low estimateand signifies that there is a 95 percent chance thatthere is more than 577.1 TCF present. The 5th
Table 45.—Estimates of In-Place Natural GasResources in the Devonial Shale of
the Appalachian Basin
Natural gas resources(trillions of cubic feet)
Low HighPlay F 9 5
a F 5
a Mean
1. North-Central Ohio . . . . . . . 17.9 34.22. Western Lake Erie . . . . . . . 21.7 31.33. Eastern Lake Erie . . . . . . . . 2.1 3.34. Plateau Ohio , . . . . . . . . . . . 44.4 76.25. Eastern Ohio . . . . . . . . . . . . 35.2 55.16. Western Penn-York. . . . . . . 20.4 28.27. Southern Ohio Valley. . . . . 19.7 36.28. Western Rome Trough. . . . 38.0 74.09. Tug Fork . . . . . . . . . . . . . . . 13.7 25.9
10, Pine Mountain . . . . . . . . . . . 10.7 18.711. Plateau Virginia . . . . . . . . . 3.9 10.212, Pittsburgh Basin . . . . . . . . . 76.8 129.913. Eastern Rome Trough . . . . 70.7 132.514. New River . . . . . . . . . . . . . . 38.5 91.715. Portage Escarpment . . . . . 8.5 21.316. Cattaraugus Valley . . . . . . . 10.4 23.217. Penn-York Plateau . . . . . . . 98.1 195.218. Western Susquehanna. . . . 24.1 67.719. Catskill . . . . . . . . . . . . . . . . . 22.1 75.8
25,926.5
2.759.944.724.327.756.019.714.6
7.1102.1100.363.114.616.6
146.044.947.6
Entire basin . . . . . . . . . . . 577.1 1,130.9 844.2NOTE: All tabulated values were rounded from original numbers. Therefore, totals
may not be precisely additive.aF 95 denotes the 95th fractile; the probability of more than the amount F95 is 95
percent. F5 is defined similarly. Because of dependency between plays, thesefractiles (unlike those in many other studies) are additive.
SOURCE U.S. Geological Survey, “Estimates of the Unconventional Natural GasResources of the Devonian Shale of the Appalachian Basin, ” 1982

Ch. 9—Gas From Devonian Shale ● 185
fractile (F5 is a high estimate and indicates thatthere is only a 5 percent chance of there beingmore than 1,130.8 TCF present.15 The mean esti-mate is 844.2 TCF. Although the USGS did notestimate recoverability, it compiled a map illus-trating shale gas potential (fig. 41) which qualita-tively indicates the potential for recovery in eacharea based on gas-in-place and the presence ofnatural fracture systems.
The Mound Facility16
The Mound study incorporates extensive geo-chemical data into its volumetric analysis of the
1 Sconseq Uently, there is a 90 percent probabi Iity that the gas-in-place is within the range 577.1 to 1,130.8 TCF.
IfJR, E. Zielinski and R. D. Mclver, “Resource and ExplorationAssessment of Oil and Gas Potential in the Devonian Gas Shalesof the Appalachian Basin, ” 1982.
gas-in-place in the Appalachian Basin. Organicgeochemical analyses were performed on over2,000 individual core samples and on an addi-tional several hundred well cuttings to evaluatethe quality of the shale units as sources of natu-ral gas and other hydrocarbons. In particular, theanalyses focused on three primary determinantsof gas content: the quantity of organic carbonpresent, its origin (i.e., the nature of the organicmaterial that provided the carbon, e.g., spores,pollen, herbaceous plants, algae, etc.), and itsthermal maturity .17
1 Thermal maturity is the extent to which the organic matter Inthe rocks has been “cracked” by heat. Cracking is the process bywhich long hydrocarbon chains are broken to form simplermolecules such as those comprising methane gas.
Figure 41 .—Shale Gas Potential in the Appalachian Basin
SOURCE USGS, “Estimates of Unconventional Natural Gas Resources of the Devonian Shale of the Appalachian Basin, ” 1982
3 8 - 7 4 2 0 - 8 5 - 1 3

186 ● U.S. Natural Gas Availability: Gas Supply Through the Year 2000
Several general conclusions were formulatedabout the resource potential of the AppalachianBasin. The most important conclusion is that theDevonian shales are exceptionally rich sourcerocks; were it not for their low porosity andpermeability, the shales would represent “oneof the greatest oil- and gas-producing provincesof the world.”18B Other conclusions point to thenonuniformity of the resource and establishwhere the generally rich nature of the sourcerocks may not apply. For example, the quantityof organic material in the basin decreased to theeast. The organic-rich rocks in the extreme north-western and western portion of the basin hadhigh potential for hydrocarbon development, butthey were only slightly thermally altered andnever reached their full gas-bearing potential. Inthe deeper portions of the basin, too much heatwas generated, thereby lessening the potentialfor finding hydrocarbons.
The gas-in-place analysis differed from the otherestimates in the way in which the gas content wasdetermined. Mound felt that a large portion ofthe gas escaped during the process of obtainingthe core and before the core could be sealed inthe gas-tight canister, To improve the accuracyof the measurement, Mound developed a con-trolled off-gassing experiment where the rate ofgas release from the core is measured. Data fromthese experiments were used in combination withother geologic and geochemical characteristicsof the formations to develop equations whichdetermined the “indigenous,” or original, gascontents of the rock. The methodology wasverified by the use of a pressurized core barrel,which extracts the core under in-situ pressure,thereby limiting premature gas release. Moundthus concluded that the revised values more ac-curately reflected the quantity of gas originallypresent in the rock.
The gas-in-place estimates were determined foreach of 17 separate stratigraphic intervals, or
lall. E. i!ielirlski and R. D. Mclver, ‘ ‘Syn thes is o f o rgan icGeochemical Data From the Eastern Gas Shales,” SPE/DOE 10793,in Proceedings of the Unconventional Gas Recovery Symposium,May 1618, 1982, Pittsburgh, PA.
units, in the Appalachian Basin by first combin-ing the indigenous gas contents (MCF/acre-foot)with the thicknesses of the gas-bearing shale toprovide the areal distribution of the total gas ineach unit. The data were contoured, as illustratedin figure 42. Next, the acreage contained withineach contour area was integrated, multiplied bythe appropriate gas areal density (MCF/acre), andsummed to yield the total gas-in-place for theunit. This methodology resulted in a gas-in-placeestimate for the 17 units composing the Appa-lachian Basin of 2,579 TCF.
Estimate Comparison and Uncertainties
The methodologies used by NPC, USGS, andMound to determine the gas-in-place are allvolumetric estimates based on multiplying gascontent, shale thickness, and areal extent, butthey differ substantially in their computationmethods and input data. The major difference ap-pears to be in the computation of gas content.NPC used a basin-wide average based on off-gassing data available at the time. Both theMound and USGS analyses use a more sophisti-cated, disaggregate approach, with USGS cal-culating separately the macrofracture, micro-porosity, and adsorbed (bound) gas for 19 areasin the Appalachian Basin, and Mound determin-ing gas contents for 17 stratigraphic units in thebasin using equations based on geochemicalanalysis, and contouring and integrating theresults across the basin. Both the USGS andMound estimates had access to new off-gassingdata developed by the Eastern Gas Shales Proj-ect. The Mound approach is the most optimisticof the three because it incorporates a calculationof gas lost in obtaining and measuring the coresamples, a factor not considered by the NPC andapparently not considered significant by theUSGS.
In OTA’s judgment, the physical evidence citedand calculations made in the Mound report ap-pear plausible; the Mound estimate of 2,579 TCFgas-in-place (1,440 TCF in “drillable” areas)seems a reasonable estimate given the availabledata.

Ch. 9—Gas From Devonian Shale ● 187
Figure 42.— Distribution of Devonian Shale Gas
[MCF Gas/Acre
100 )
I .“
● TENN-9o- 0
Stratigraphic interval: early marcellus time
SOURCE: Zielinskl and Mclver, 1982,
TECHNOLOGY
Fracturing
Because of the extremely low permeability ofthe shales, production of Devonian shale gasdepends on exploiting the natural fracture net-work in the rock and on enhancing gas flow byartificially stimulating the well. Over 90 percentof all Devonian wells require stimulation in or-der to yield gas in commercial quantities, andeven stimulated wells will not be successful unless
there is already a well-developed natural fracturenetwork.
For most of the Devonian shale’s productionhistory, wells were stimulated by filling large por-tions of the wellbore with explosives and allow-ing the detonation to shatter the rock surround-ing the well. This basic method was first used in1865 and is still in use. It generally is consideredless of a “fracturing” method than simply as a

— ——
188 . U.S. Natural Gas Availability: Gas Supply Through the Year 2000
means to overcome the formation damage causedby drilling in the shales. (Its primary structural ef-fect is to fragment the rock immediately surround-ing the well bore.)
As in the tight sands, hydraulic fracturing is be-coming increasingly used today in the shales. Thefractures being created in the shale formationsare small, however, not the massive 1,000-ft frac-tures becoming more popular in the Westerntight sands. They also generally carry less prop-pant than in the sands. The shales are extremelysensitive to formation damage during fracturing,especially because of the presence of water-sensi-tive clays in the shale that can be dislodged bythe fracturing fluids and plug pores and fractures.Although formation damage is a problem withtight sands and coal seams also, Devonian shalesmay be the most sensitive. Devonian shales have,as a consequence, served as a testing ground fora number of new fracturing fluids.
Many of the fluids developed to minimize for-mation damage are foamed, using a gas phaseto reduce the amount of water required. Foamedfluids are gas-in-water emulsions, where the sur-face tension of the bubbles holds the proppant–particles that become wedged in the fractures andhold them open–in suspension. Nitrogen (N2
is the most common gas used. Properties thatmake foam suitable for the Devonian shale in-clude low volumes of water, high efficiency increating fractures, high proppant-carrying capac-ity, low friction during pumping, and sufficientenergy within the gas phase to allow recovery ofmost of the fluid without pumping. By 1980-81,foam technology had advanced so rapidly thatit dominated fracturing in the Devonian shales.
Pure nitrogen has also been used as a fractur-ing fluid. It is not an efficient fracture fluid andcan only be used to fracture small depth inter-vals of 10 ft or s0.19 In addition, it is not an effec-tive carrier of proppants, and consequently is ef-fective only at shallow depths where the fracturesare less likely to close. However, nitrogen doesnot adversely affect the formation and it has prov-en very effective in increasing gas flow. As a re-
sult, nitrogen fracturing quickly became the pre-ferred method for many production situations.Because of the newness of this type of treatmentand its relative lack of propping effectiveness, theability of nitrogen fracturing to maintain produc-tion levels over the long-term is uncertain.
Current trends in fracturing technology are cen-tered on the developing of fluids that are bothnondamaging, like nitrogen, and can carry prop-pants more effectively. possibilities include:
●
●
●
●
Stabilized foam.–Although similar to theoriginal foams, water has been reduced from25 to 10 percent, and proppant-carrying ca-pability is enhanced by a gelling agent thatstiffens the foam. This is a high cost methodthat has been used only sparingly.Liquid carbon dioxide.–This method has theability to transport proppants. As the liquidC02 warms, it reverts to the gas phase andeasily flows back out of the hole with mini-mal damage to the formation. Liquid CO2
fracturing is a relatively expensive processand somewhat more dangerous to use thanfoamed fluids. In addition, the casing andpumping materials must be capable ofwithstanding very low temperatures.Shale oil.—This method combines a nitro-gen-driven fracture with the subsequent in-jection of shale oil—obtained from previousdrilling–as a proppant-carrying agent to pre-vent fracture closure.Water-based nonreactive solvents.–Thesesolvents can be used either after a fractureto clean the formation or as the fluid baseof a stabilized foam fracturing treatment. Thissystem is still experimental.
Finally, producers have attempted the use ofradically improved versions of the original ex-plosive fracturing used since the 1800s. In tailoredpulse loading, a propellant charge is ignited topressurize the wellbore at a much slower ratethan is achieved with conventional explosives.20
The loading rate, or rate at which the energystored in the propellant is released, can be con-trolled to create different types of fractures. For
lqFor example, a nitrogen fracture might affect only the reser-
voir rock between 900 and 910 ft in depth.20J. W. Crafton, “Fracturing Technologies for Gas Recovery From
Tight Sands, ” OTA contractor report, September 1983.

Ch. 9—Gas From Devonian Shale ● 189
example, at intermediate loading rates, multiplefractures form radially around the well bore.21 Atslow rates, fractures form in an analogous man-ner to hydraulic fractures, directionally controlledby the regional stress field.
This technique has only been used on a smallscale for prefracturing tests.22 However, it isthought to have significant potential for use ona larger scale, especially because it causes littleformation damage. Commercial application in theDevonian shales may occur in the near future.
The record of success of well stimulations inDevonian shales is mixed. Although new stimula-tion technologies have increased gas productionfrom a number of wells, many have not bene-fited from stimulation and the specific reasons fortheir lack of success are not well understood.
One problem is the local variability and unpre-dictability of fractured zones. Wells offset shortdistances from producing wells may not intersecta productive fracture system.23 Improved tech-nologies or exploration strategies to locate andcharacterize fracture systems are critical to eco-nomic development of Devonian shales.
Another problem is the difficulty in extrapolat-ing successful stimulation techniques from onesite to another. Although some producers havebeen quick to try the newest in technologies, noone has yet established criteria for choosing tai-lored pulse loading over nitrogen or perhaps liq-uid C02 injection. Most stimulations appear tobe conducted on a trial-and-error basis and in-adequate records are kept to determine the rea-sons for success or failure of a particulartechnique.
A third problem in successful Devonian shalegas production is accurately determining the payinterval. Because many wells do not have signif-icant gas shows prior to stimulation, it is difficult.———
zlThe radial fractures possible with tailored pulse loading mayhave special potential in areas where the natural fracture systemsin the shale display strong directional tendencies. Radial fracturesmay outperform long hydraulic fractures when these tendencies(permeability anlsotropies) are substantial (Kuuskraa and Wicks,1984, op. cit.).
Zzjohnston & Associates, inc., “The Status and Future of Produc-tion Technologies for Gas Recovery From Devonian Shales, ” OTAcontractor report, 1983.
231 bid,
to determine the interval within the shale se-quence which is most likely to contain recover-able gas. Consequently, fractures may not beproperly located to optimize production.
Finally, no technology now exists or is beingconsidered to produce gas from those portionsof the Devonian shales where the natural frac-ture system is not well developed. This severelylimits the overall production potential of the re-source.
Deviated and Directional Drilling
The only other technology that currently hasany potential for increasing production in un-conventional reservoirs is one that allows drillingwells that either intersect more of the reservoirrock or intersect more of the natural fracture sys-tem. Thus, if reservoirs lie in an essentiallyhorizontal plane and natural fracture systems ina more or less vertical plane, a well drilled atsome angle from the vertical would intersectmore gas-productive natural fractures.
Directional drilling has frequently been sug-gested as a technology applicable to Devonianshale gas production .24 Production requires in-tersection of natural fractures and most of thesefracture systems are vertical. The major drawbackis the problem of formation damage. A drill bitdrilling at an angle from the vertical encountersincreased frictional resistance and, if drilling ina fractured formation, runs a greater risk of hav-ing the wellbore collapse. Drilling muds areneeded to reduce friction and hold the holeopen; however, drilling muds may cause consid-erable formation damage. One experimental de-viated well has been drilled in the Devonianshale, in Meigs County, Ohio, but its intent wasmore to determine the natural fracture spacingthan to test a new production technique.25
Exploration
Unlike the sophisticated exploration techniquesused in frontier areas such as the Western Over-
.2qOffice of Tech rlology Assessment, ‘‘Status Report of the Gas
Potential From Devonian Shales of the Appalachian Basin, ” 1977.Z> Charles Komar, Morgantown Energy Technology center, per-
sonal communlcatlon, 1984.

190. U.S. Natural Gas Availability: Gas Supply Through the Year 2000
thrust Belt and offshore, the “exploration tech-niques” used for locating Devonian shale wellsare often little more than near-random selectionbased on the availability of land. The failure touse sophisticated exploration technology reflectsa number of factors. First, it is difficult to buildan exploration block of any size in the Appalach-ian shale basin because of the diversity of landownership. Second, leasing problems—e.g., thelack of well spacing requirements in some Statesin the shale area—aggravate the problem becausewells on adjacent properties can get as close toa successful well as the property line allows.There is little incentive to invest in expensiveseismic surveys if the costs cannot be recapturedby exclusive development of the surveyed area.Third, existing technology is not fully effective inlocating the subsurface features whose under-standing is critical to drilling success, and thesteep terrain drives up the cost of techniques suchas reflection seismology.
Aerial and satellite imagery may prove usefulin Devonian shale exploration because they canidentify Iineaments—characteristic topographicfeatures–which may be related to fault and frac-ture zones and may contain information on re-gional stress patterns. Concentrations of surfacefractures may indicate the presence of subsurfacefracture networks that could serve as potentialreservoirs. 26 Skeptics feel that surface expression————
Z6R. D. MCIVer, j. R. Kyle, and R. E. Zielinski, “Location Of Drilling
Sites in the Devonian Shales by Aerial Photography, ” SPE/DOE10794, SPE/DOE Unconventional Gas Recovery Symposium, pp.51-53.
of fractures does not accurately reflect subsur-face conditions (i.e., fractures may curve at depthor may not extend to the gas-bearing rocks). Tosupport their position, they cite failures of wellsoffset from producing wells along a surface linea-ment.27
Subsurface mapping of variations in the rockformations is also important in the shale region.A key mapping tool for the shales is well loggingusing a combination of gamma-ray and neutron-density logs. Induction logs, spectral logs, ther-mal decay logs, noise logs, and temperature logsare often run in combination with the gamma-ray and neutron-density logs. Some operators alsorely on a combination of gamma-ray, bulk-den-sity, and resistivity logs. (For a brief descriptionof the various types of well logs, see box B-1 inapp. B.) Unfortunately, current well logging tech-niques are not adequate to detect open fracturesthat do not actually intersect the boreholes, sothey are only of limited use in mapping fracturepatterns. Also, some States in the shale basins donot require full disclosure of well log data, andthis further limits the ability to construct usefulsubsurface maps from the existing data.
~johnston & Associates, inc., oP. cit.
RECOVERABLE RESOURCES AND PRODUCTION POTENTIAL
The Devonian shale gas-in-place resource inthe Appalachian Basin has been estimated at be-tween 225 TCF (the NPC low estimate) and 2,579TCF (the Mound estimate). As discussed above,the higher end of the range appears most credi-ble on the basis of existing data. However, muchof the gas-in-place is unlikely to contribute tofuture gas supply, for the most part because geo-logical conditions make the gas extremely diffi-
cult to produce. The quantity of gas likely to beproduced is a function of the price of the gas,the available technology, the associated costs ofproduction, and a variety of other factors, suchas institutional barriers, that will influence deci-sionmaking on production. Several organizationshave attempted to estimate the size of the recov-erable resource. Reports have been issued whichdescribe the resource and designate the most

Ch. 9—Gas From Devonian Shale ● 191
favorable areas for production.28 Production sce-narios have also been established by furtherassuming drilling and development schedules. Ingeneral, the estimates of recoverable resourcesand future production are based on extrapola-tion of past production, for which there is a siz-able amount of data due to the long productionhistory of the shales. However, the productiondata are limited in important ways. Available pro-duction histories are for the most part limited towells using traditional production technology,that is, “shooting” with explosives at wide wellspacing. Also, these histories are affected by a va-riety of factors aside from the nature of the gasresource. These factors include differences inmarket conditions, well operating practices, pro-duction techniques, the use of workover treat-ments, and pipeline pressures.29 Extrapolation ofproduction data therefore should account forthese variables, yet the lack of data and the com-plexity of the necessary analysis makes such anaccounting quite difficult. None of the existing
ZBFavorable areas are designated by State in DOE/METC reports118-124 and on a play basis in the USGS report entitled, “Estimatesof Unconventional Natural Gas Resources of Devonian Shale ofthe Appalachian Basin, ” 1982.
Z9R. E. Ziellnski and R. D. Mclver, Resource and hph?tionAssessment of the Oil and Gas Potential in the Devonian Gas Shalesof the Appalachian Basin, U.S. Department of Energy, MorgantownEnergy Technology Center Report DOE/DP/0053-l 125.
studies of recoverable resources have attemptedsuch an accounting. Also, it is not clear to whatextent the drilling represents a true unbiased sam-ple of what might occur on undrilled acreage ifthe same production techniques were used. Theseproblems with the available data are discussedlater.
Methodologies and Results
As illustrated in table 46, several estimates ofrecoverable resources have been made. Theseinclude early estimates by the Office of Technol-ogy Assessment (OTA), Lewin & Associates, andthe National Petroleum Council (NPC). Each esti-mator assumed economic and technologic pa-rameters to establish estimates of recoverable re-sources in the Appalachian Basin. Both Lewin &Associates and the NPC extended their analysisto include annual production estimates orscenarios.
More recently, Pulle and Seskus of Science Ap-plications, Inc. (SAI), Zielinski and Mclver ofMound, and Lewin & Associates also estimatedthe recoverable resource in the AppalachianBasin. Pulle and Seskus30 used past production
30C$ v. Pul[e and A. P. Sesktjs, “Quantitative Analysis of the Eco-
nomically Recoverable Resource, ” U.S. DOE-METC, 1981.
Table 46.—Devonian Shale Recoverable Resource Estimates (TCF): Appalachian Basin
Organization Year Estimate ConditionsOffice of Technology Assessment. . . . . 1977 15-25
23-38
Lewin & Associates . . . . . . . . . . . . . . . . . 1978-79 2-1o4-25
After 15 to 20 yearsAfter 30 to 50 yearsAt $2 to $3/MCF (1976), current technology
(borehole shooting or hydrofracturing),150-acre spacing
Base caseAdvanced case for prices between $1.75 to
$4.50traditional advanced
National Petroleum Council . . . . . . . . . . 1980 3.3 - 38.9
15.3 - 49.9Pulle and Seskus (SAI). . . . . . . . . . . . . . . 1981 17-23Zielinski and Mclver (Mound) . . . . . . . . . 1982 30-50
Lewin & Associates . . . . . . . . . . . . . . . . . 1983 6.2-22.5
Lewin & Associates . . . . . . . . . . . . . . . . . 1984 19-44
For price levels between $2.50 to $9, 160-acrespacing
Technically producible“Shot” wells, 160-acre spacingFor States of West Virginia, Ohio, and Kentucky
only, “shot” wells, 160-acre spacingTechnically recoverable, for most promising
formations in Ohio. Maximum represents80-acre spacing, advanced technology
Technically recoverable, for most promisingformations in West Virginia. Preliminaryvalues
SOURCE: ???

792 ● U.S. Natural Gas Availability: Gas Supply Through the Year 2000
data and Delphi estimation to compute a meanvalue of 20.2 TCF for the recoverable Ap-palachian resource using explosive fracturing at160-acre spacing. Zielinski and Mclver31 utilizedSAI data to estimate the recoverable resource,also based on explosive fracturing. They felt thatsufficient data were not available to make areliable estimate, but produced a preliminary esti-mate of 30 to 50 TCF for the minimum recover-able gas in West Virginia, Ohio, and Kentucky.The most recent estimation effort was performedby Lewin & Associates under contract to DOE’sMorgantown Energy Technology Center (METC)and was an estimate of the technically recover-able reserves in the most favorable Devonian for-mations in Ohio and West Virginia (the estimatesfor West Virginia were published only in draftform at the time of this report).32 To OTA’s knowl-edge, this estimate is the only one currentlyavailable to use reservoir simulation. Using thissimulation capability, the analysis explores theramifications of alternative fracture technologies,well spacing, and well patterns on the size of therecoverable resource.
Office of Technology Assessment33
The OTA report was published in 1977 and wasthe first study that attempted to evaluate therecoverable Devonian shale gas resource in theAppalachian Basin.
OTA established production estimates basedon 15 to 20 years of production data from 490wells in three productive areas of the AppalachianBasin. Wells from Cottageville and Clendenin,WV, and Perry County, KY, were grouped ac-cording to the quantity (high, medium, or low)of gas produced. Average production rates werecalculated for both shot and fractured wells ineach group and used to calculate the recoverableresource assuming a productive area of 16,300
..—3’R. E. Zielinski and R. D. Mclver, “Resource and Exploration
Assessment of the Oil and Gas Potential in the Devonian Gas Shalesof the Appalachian Basin, ” 1982.
32v. A. l(uuskraa, et al., Technically Recoverable Devonian shaleGas in Ohio, Lewin & Associates Report for Morgantown EnergyTechnology Center, July 1983; and V, A. Kuuskraa, et al., Tech-nica//y Recoverable Devonian Shale Gas in West Virginia, Summary,1984 (draft).
‘~office of Technology Assessment, “Status Report of the GasPotential From Devonian Shales of the Appalachian Basin, ” 1977.
square miles— 10 percent of the entire basin areaof 163,000 square miles. A well spacing of 150acres was assumed, yielding approximately69,000 wells. The economics were determinedusing an after tax net present value (ATNPV)model, a discount rate of 10 percent, and a well-head price for gas in the $2 to $3/MCF range(1976$).
The findings as reported by OTA are summa-rized below:
●
●
●
The Devonian shale resource could be pro-duced without developing new productionequipment and techniques.The Brown shaless34 (as they were called byOTA) could yield between 15 and 20 TCFduring the first Is to 20 years of production.After 30 to 50 years, cumulative productioncould reach 23 to 38 TCF.Because of the tremendous drilling effort andthe time required to develop the-necessarypipeline infrastructure, as many as 20 yearsmay be required before annual productionreached 1 TCF.
A critical factor in OTA’s analysis is the assump-tion that only 10 percent of the Appalachian Basinwill prove to contain gas recoverable at the as-sumed price using conventional technology. Thisassumption is based on the general argument thatpast drilling has not been random, but insteadhas been skewed to the high-quality areas–a uni-versal tendency in resource development—andalso upon observations of the clustered natureof existing development, the considerable depthsand/or thinness of the shales in some undevel-oped portions of the basin, the poorly developedfracture systems in other undeveloped areas, andthe lack of success of drilling in some of theseareas. This assumption that much of the unde-veloped acreage in the basin will not prove tobe productive is undoubtedly correct qualitative-ly, but there appears little quantitative basis forthe choice of 10 percent as the productive frac-tion; it is essentially an educated guess.
‘QBrOWn Shales are generally younger than black shales and have
more hydrocarbons in the organic material. The organics in theblack shales are closer to elemental carbon. (V. Kuuskraa, 1982,“Unconventional Natural Gas,” in Advances in Energy Systems andTechnology, vol. 3.) Brown and black shales are commonly referredto jointly as black shales.
Ch. 9—Gas From Devonian Shale ● 193
Lewin & Associates I35
Lewin & Associates addressed the gas poten-tial of Devonian shales in a series of 1978-79reports entitled “Enhanced Recovery of Uncon-ventional Gas. ” The purpose of the Devonianshale portion of the study was to estimate the eco-nomic potential of the resource, based on em-pirical data such as geology, reservoir perform-ance, and costs.
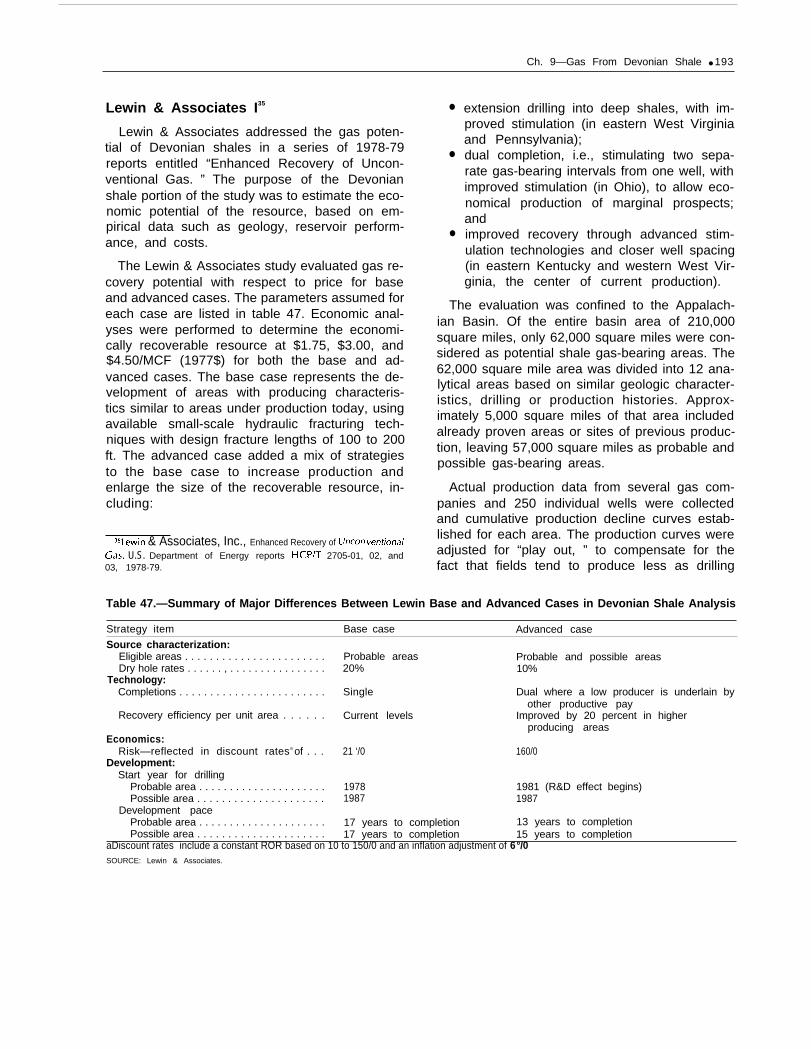
The Lewin & Associates study evaluated gas re-covery potential with respect to price for baseand advanced cases. The parameters assumed foreach case are listed in table 47. Economic anal-yses were performed to determine the economi-cally recoverable resource at $1.75, $3.00, and$4.50/MCF (1977$) for both the base and ad-vanced cases. The base case represents the de-velopment of areas with producing characteris-tics similar to areas under production today, usingavailable small-scale hydraulic fracturing tech-niques with design fracture lengths of 100 to 200ft. The advanced case added a mix of strategiesto the base case to increase production andenlarge the size of the recoverable resource, in-cluding:
jJLeWin & Associates, Inc., Enhanced Recovery of UnCOn VentiOna\
Gas, U.S. Department of Energy reports HCP/T 2705-01, 02, and03, 1978-79.
●
●
●
extension drilling into deep shales, with im-proved stimulation (in eastern West Virginiaand Pennsylvania);dual completion, i.e., stimulating two sepa-rate gas-bearing intervals from one well, withimproved stimulation (in Ohio), to allow eco-nomical production of marginal prospects;andimproved recovery through advanced stim-ulation technologies and closer well spacing(in eastern Kentucky and western West Vir-ginia, the center of current production).
The evaluation was confined to the Appalach-ian Basin. Of the entire basin area of 210,000square miles, only 62,000 square miles were con-sidered as potential shale gas-bearing areas. The62,000 square mile area was divided into 12 ana-lytical areas based on similar geologic character-istics, drilling or production histories. Approx-imately 5,000 square miles of that area includedalready proven areas or sites of previous produc-tion, leaving 57,000 square miles as probable andpossible gas-bearing areas.
Actual production data from several gas com-panies and 250 individual wells were collectedand cumulative production decline curves estab-lished for each area. The production curves wereadjusted for “play out, ” to compensate for thefact that fields tend to produce less as drilling
Table 47.—Summary of Major Differences Between Lewin Base and Advanced Cases in Devonian Shale Analysis
Strategy item Base case Advanced case
Source characterization:Eligible areas . . . . . . . . . . . . . . . . . . . . . . . Probable areas Probable and possible areasDry hole rates . . . . . . , . . . . . . . . . . . . . . . . 20% 10%
Technology:Completions . . . . . . . . . . . . . . . . . . . . . . . . Single Dual where a low producer is underlain by
other productive payRecovery efficiency per unit area . . . . . . Current levels Improved by 20 percent in higher
producing areasEconomics:
Risk—reflected in discount ratesa of . . . 21 ‘/0 160/0Development:
Start year for drillingProbable area . . . . . . . . . . . . . . . . . . . . . 1978 1981 (R&D effect begins)Possible area . . . . . . . . . . . . . . . . . . . . . 1987 1987
Development paceProbable area . . . . . . . . . . . . . . . . . . . . . 17 years to completion 13 years to completionPossible area . . . . . . . . . . . . . . . . . . . . . 17 years to completion 15 years to completion
aDiscount rates include a constant ROR based on 10 to 150/0 and an inflation adjustment of 6°/0SOURCE: Lewin & Associates.

194 . U.S. Natural Gas Availability: Gas Supply Through the Year 2000
moves into extension areas, and for stimulationtechnology improvement, to compensate for thedifferences between the old explosive fracturingand hydraulic fracturing. The adjusted curveswere then used to estimate 30-year cumulativerecovery per well for each area. These estimateswere then used in the analysis of the economicpotential.
The economic analysis used a discounted cashflow model. Net cash flow was calculated by sub-tracting investment costs, operating costs, and allother allocated costs from the cash flow acquiredfrom production revenues. The net cash flow forthe 30 years of production for each well consid-ered in the study was discounted to arrive at thenet present value. The areas with a positive netpresent value were assumed to be developed inaccordance with the timing schedule designatedfor each case.
The results of the economic evaluation aresummarized in table 48. The base case estimatesare quite pessimistic—at $4.50/MCF (1 977$), or$7/MCF (1 983$), a very high price in today’s mar-ket, total recoverable resources are only 10.5TCF. The somewhat more optimistic advancedcase, which reaches 18 to 25 TCF at the sameprice, obtains most of its added recovery fromthe deep drilling and dual completions, with im-proved recovery in existing producing areasyielding only 2.1 TCF at this price.
An important consideration in this analysis isthat Lewin considered there to be little differencein per well recovery efficiency between the baseand advanced case, despite the more effectivefracturing attainable in the advanced case. Themajor difference between the two cases is the
Table 48.- Lewin & Associates: Results of EconomicAnalysis, Summary Table
Economically recoverable
Price, 1977$ (1983$) Base case Advanced case
$1.75/MCF ($2.75/MCF) . . . . 2 TCF 5 TCF$3.00/McF ($4.70/MCF) . . . . 8 TCF 16 TCF$4.50/MCF ($7.00/MCF) . . . . 10.5 TCF 18 to 25 TCFb
aCurrent proved reserves are 1 TCF and the following estimates represent addi-tions to reserves.
bThe range reflects the geologic uncertainty with regard to natural fracture in-tensity.
SOURCE: Lewin & Associates.
more rapid drainage attainable with the improvedstimulation technology, which greatly improvesthe economics of recovery and moves marginalareas into the “economically recoverable” range.The source of this interpretation is the belief atthe time that the primary source of produciblegas is the fracture porosity.36 This was thoughtto imply that the recovery efficiency of even bore-hole shooting would be quite high, in the neigh-borhood of so percent, with little improvementobtainable from more effective fractures. It cur-rently is believed, however, that much of thelong-term well production is from the resorptionof gas bound to the shale matrix, and that theactual recovery efficiency of borehole shootingis only a few percent. Lewin’s new work, de-scribed later in this section, folds this new under-standing of the source of recoverable Devonianshale gas into its analysis (see the discussion of“Lewin & Associates 11”). An important implica-tion of this understanding is that improved frac-turing should increase ultimate recovery, not justaccelerate production.
National Petroleum Counci137
The NPC also estimated the quantity of pro-ducible gas in the Appalachian Basin for differentlevels of technology and price. Three levels oftechnology were considered in the analysis: tradi-tional (borehole shooting), conventional (conven-tional hydraulic fracturing), and advanced (uniquefracturing techniques and deviated drilling). Ad-vanced technology was assumed to double theproduction increase achievable from the use ofconventional technology.38 Conventional tech-nology was assumed to increase production overtraditional borehole shooting by O to 57 percentdepending on the open flow rates of the wells.39
MI n other words, it was thought that most of the recoverable gaswas free gas stored in the natural fracture systems.
jzNational petroleum COU nci 1, Unconventional Gas SOUrCt?S—
Devonian Shales, 1980.JaThis assumption was based on experiments performed i n
Kanawha County, WV. Three advanced technology wells had pro-duction increases of 230 percent over wells stimulated by tradi-tional shooting. Conventionally fractured wells showed 80 percentincreases in production over traditionally shot wells.
39 The advantages d fracturing over borehole shooting declineas the unstimulated flow rate increases; with flow rates above 300MCF/D, fracturing was assumed to be no better than shooting.
Ch. 9—Gas From Devonian Shale . 195
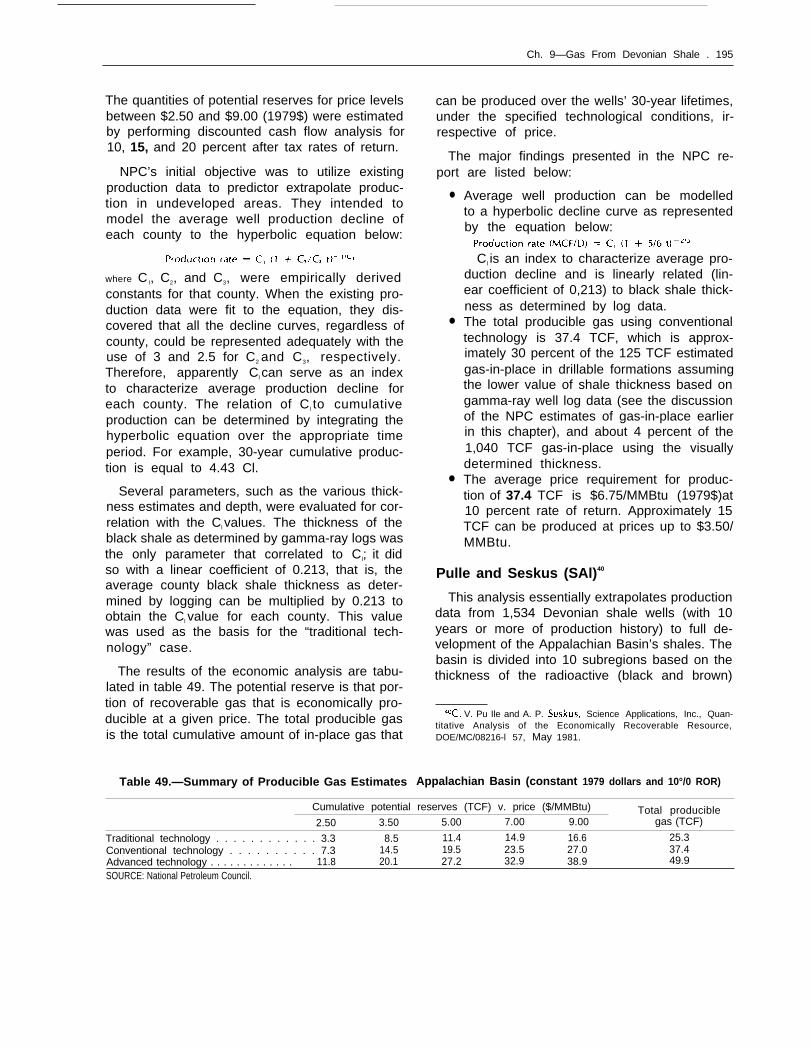
The quantities of potential reserves for price levelsbetween $2.50 and $9.00 (1979$) were estimatedby performing discounted cash flow analysis for10, 15, and 20 percent after tax rates of return.
NPC’s initial objective was to utilize existingproduction data to predictor extrapolate produc-tion in undeveloped areas. They intended tomodel the average well production decline ofeach county to the hyperbolic equation below:
where C l, C2, and C3, were empirically derivedconstants for that county. When the existing pro-duction data were fit to the equation, they dis-covered that all the decline curves, regardless ofcounty, could be represented adequately with theuse of 3 and 2.5 for C2 and C3, respectively.Therefore, apparently Cl can serve as an indexto characterize average production decline foreach county. The relation of C l to cumulativeproduction can be determined by integrating thehyperbolic equation over the appropriate timeperiod. For example, 30-year cumulative produc-tion is equal to 4.43 Cl.
Several parameters, such as the various thick-ness estimates and depth, were evaluated for cor-relation with the Cl values. The thickness of theblack shale as determined by gamma-ray logs wasthe only parameter that correlated to C l; it didso with a linear coefficient of 0.213, that is, theaverage county black shale thickness as deter-mined by logging can be multiplied by 0.213 toobtain the Cl value for each county. This valuewas used as the basis for the “traditional tech-nology” case.
The results of the economic analysis are tabu-lated in table 49. The potential reserve is that por-tion of recoverable gas that is economically pro-ducible at a given price. The total producible gasis the total cumulative amount of in-place gas that
Table 49.—Summary of Producible Gas Estimates
can be produced over the wells’ 30-year lifetimes,under the specified technological conditions, ir-respective of price.
The major findings presented in the NPC re-port are listed below:
●
●
●
Average well production can be modelledto a hyperbolic decline curve as representedby the equation below:
C l is an index to characterize average pro-duction decline and is linearly related (lin-ear coefficient of 0,213) to black shale thick-ness as determined by log data.The total producible gas using conventionaltechnology is 37.4 TCF, which is approx-imately 30 percent of the 125 TCF estimatedgas-in-place in drillable formations assumingthe lower value of shale thickness based ongamma-ray well log data (see the discussionof the NPC estimates of gas-in-place earlierin this chapter), and about 4 percent of the1,040 TCF gas-in-place using the visuallydetermined thickness.The average price requirement for produc-tion of 37.4 TCF is $6.75/MMBtu (1979$)at10 percent rate of return. Approximately 15TCF can be produced at prices up to $3.50/MMBtu.
Pulle and Seskus (SAl)40
This analysis essentially extrapolates productiondata from 1,534 Devonian shale wells (with 10years or more of production history) to full de-velopment of the Appalachian Basin’s shales. Thebasin is divided into 10 subregions based on thethickness of the radioactive (black and brown)
‘C. V. Pu Ile and A. P. Seskus, Science Applications, Inc., Quan-titative Analysis of the Economically Recoverable Resource,DOE/MC/08216-l 57, May 1981.
Appalachian Basin (constant 1979 dollars and 10°/0 ROR)
Cumulative potential reserves (TCF) v. price ($/MMBtu) Total producible2.50 3.50 5.00 7.00 9.00 gas (TCF)
Traditional technology . . . . . . . . . . . . 3.3 8.5 11.4 14.9 16.6 25.3Conventional technology . . . . . . . . . . 7.3 14.5 19.5 23.5 27.0 37.4Advanced technology . . . . . . . . . . . . . 11.8 20.1 27.2 32.9 38.9 49.9
SOURCE: National Petroleum Council.

196 ● U.S. Natural Gas Availability: Gas Supply Through the Year 2000
shales, the drilling depth of past production, anda measure of the thermal maturity of the shalecores that have been obtained. To obtain an esti-mate of the recoverable resource, wells are as-sumed to be drilled on 160-acre spacing, usingexplosive shooting for stimulation. Past produc-tion histories are used to estimate 30-year cumu-lative production for wells in half of the subre-gions; for the other subregions, production isestimated by combining the opinions of four ex-perts in a Delphi procedure. The percentages ofdry holes are estimated using the same Delphiprocedure.
The estimated mean recoverable gas under the160-acre spacing is 20.2 TCF, with an estimated95 percent probability that the total lies between17.06 and 23.34 TCF. However, the “95 percentprobability” is a statistical value based on theassumption that the distribution implied by thehistorical data is a perfect reflection of future pro-duction from new wells. This seemingly high levelof probability should not be treated too seriously.It does not account for errors introduced by theDelphi procedure, by changes over time in well“shooting” techniques, or by the possibility thatpast well locations were not random but insteadrepresent some selection on the basis of relativeprospects for success.
The analysis does not include an evaluation ofthe effect of price on well spacing, so it is not clearwhat gas price corresponds to the estimated 20,2TCF of recoverable resources. On the other hand,the authors show how total recovery is likely tovary with well spacing; table 50 shows the varia-tion of recoverable resources with assumed wellspacing. This estimate is based on a theoreticalmodel applied to only four wells, so the resultsshould be treated as very tentative. Also, the esti-mated recovery—and revenue—per well for 10-acre spacing is only one-fifth of the per wellrecovery and revenue for 160-acre spacing. Thisimplies that the gas price needed for economicrecovery of the 67,9 TCF resource for 10-acrespacing will be five times the price needed forrecovery at 160-acre spacing, all other things be-ing equal. A countervailing factor, however, isthat gathering costs are quite high in the Appa-lachian region, and closer well spacing and the
Table 50.—Effect of Spacing on theDevonian Shale Recoverable Resource
—Relative Ratio of Total
Spacing number increase in recoverable(acres) of wells resource resource (TCF)
160 . . . . . . . 1 1.00 20.280 . . . . . . . 2 1.68 34.040 . . . . . . . 4 2.44 49.320 . . . . . . . 8 3.10 63.010 . . . . . . . 16 3.36 67.9
SOURCE: C. V. Pulle and A. P. Seskus, Quantitative Analysis of the Economical.ly Recoverable Resource, US. Department of Energy Report DOE/MC/08216-157, May 1981.
resulting higher production levels per unit areawould lower these costs.
Mound Facility (Zielinski and Mclver)41
Zielinski and Mclver of the Monsanto Corp.’sMound Facility have reviewed the NPC and SAIestimates of recoverable resources in the Appa-lachian Basin and, using the SAI data, derived analternative, admittedly preliminary estimate of therecoverable resource in West Virginia, Ohio, andKentucky.
Zielinski and Mclver’s review of the NPC esti-mates noted the following:
1.
2.
3.
——
There are important numerical discrepanciesbetween well production values reported byNPC as derived from their equations, andvalues actually calculated using theseequations.The NPC analysis derived a relationship forthe initial production rate of a well by search-ing for correlations only with variables whichhave little to do with production, and pickeda variable (gamma-ray log response) for therelationship only by default. Neither gamma-ray log response nor any of the other varia-bles examined bear any relationship to theorganic matter type or thermal maturation,both critical factors in determining gas po-tential.The NPC found that a single equation couldrepresent well production for the entire Ap-
41 R. E. Zielinski and R. J. Mclver, Resource and Exploration Assess-ment of the Oi/ and Gas Potential in the Devonian Gas Shales ofthe Appalachian Basin, Mound Facility Report to U.S. Departmentof Energy, DOE/DP/0053-l 125, undated.

—
Ch. 9—Gas From Devonian Shale . 197
palachian Basin. This may imply that, for theshot well technology used in most of thewells in the production histories, the fairlyuniform porosity and permeability values ofthe shale dominate average gas production.This, in turn, implies to the reviewers thatcloser well spacing should significantly im-prove recovery if shooting is the method ofstimuIation.
The review of the SAI estimate noted the fol-lowing:
1. SAI divided the basin into 10 subregions byevaluating four variables—radioactive shalethickness, drilling depth, stress ratio, and ameasure of thermal alteration. Only the lat-ter variable has any documented relation-ship to gas production, and this relationshipis a limited one. Consequently, the extrap-olation of production data in a subregion toundeveloped portions of that region may notbe valid.
2. SAI assumed that well production in eachsubregion would be distributed Iognormally,but the actual production data in the fivesubregions where production data was avail-able did not tend to indicate a Iognormal dis-tribution.
Zielinski and Mclver also were concerned thatneither the NPC nor the SAI estimates accountedfor the effects of external influences–marketforces, operating policy, production practices–on production, but instead implicitly assumedthat past production was dependent only on thephysical nature of the resource.
Based on the above concerns, Zielinski andMclver’s conclusion was that “the two . . . studies
do not form a sound foundation for the esti-. . .mation of recoverable resource. ”
Zielinski and Mclver have developed a prelimi-nary estimate of recoverable resources in Ohio,Kentucky, and West Virginia based on the obser-vation, from SAI production data, that the pro-duction per unit area of the developed portionsof these States follow a clear pattern, i.e., Ken-tucky’s production tends towards 2.3 X 10 -3
TCF/mi2, Ohio’s towards 0.7 X 1 0-3 TCF/mi2,and West Virginia’s towards 1.5 X 10⁻³ TCF/mi 2.
Extrapolating these values to prospective butundeveloped acreage yields a total recoverableresource of 30 to 50 TCF for the three States, forthe same technology (“shooting”) and well spac-ing (160 acres). This estimate is based on theassumption that different market conditions, pro-duction practices, etc., did not affect the Stateproduction averages, and also that past well sitingwas random. The authors consider the 30 to 50TCF value to be a minimum for recoverableresources because improved stimulation technol-ogy, closer well spacing, or use of remote sens-ing techniques to improve well siting can indi-vidually or in combination increase total recoveryas well as production rates. For example, Zielinskiand Mclver predict that halving well spacing to80 acres will essentially double the recoverableresource.
Lewin & Associates II42
A recent estimate by Lewin & Associates makesuse of the extensive data collection and analysiseffort of DOE’s Eastern Gas Shales Project, e.g.,the geochemical analyses of Mound, and com-bines this with reservoir simulation to estimatethe technically recoverable gas resource of theLower and Middle Huron Intervals of the OhioDevonian shale.
The Lower and Middle Huron Intervals repre-sent only a portion of the resource base that po-tentially can be exploited; they contain about 50TCF of gas-in-place, compared to an estimatedgas-in-place of 390 TCF for Ohio and 2,579 TCFfor the Appalachian Basin .43 The Huron Intervalshave been the traditional targets for past drillingin Ohio, and the great majority of available drill-ing data applies only to these intervals. The re-covery potential of the remaining 340 TCF inOhio is unknown. However, nearly half of thegas-in-place in the entire basin is considered byMound to be undrillable because of surface con-straints such as roads and towns, and thus therecoverable resource for the remainder of Ohio
42V E Kuu5kraa, et al,, I-ew; rl & A s s o c i a t e s , Inc., T e c h n i c a l l y,.Recoverable Devonian Shale Gas in Ohio, prepared for the Morgan-town Energy Technology Center, U.S. Department of Energy, July1983.
4JFrom the Mound Study.

✑✙✘● U.S. Natural Gas Availability: Gas Supply Through the Year 2000
is unlikely to be as large, in relationship to its gas-in-place, as in the Huron Interval. Nevertheless,the Lewin estimates should be recognized as rep-resenting only a limited portion of Ohio’s Devo-nian shale gas potential, although the most pro-spective portion.
Selected results of the Lewin analysis are shownin table 51. The results should be interpretedcarefully because they refer to the expected phys-ical results of a specified quantity of drilling andstimulation without regard to economic feasibil-ity. In other words, they are comparable to the“technically recoverable” or “maximum produc-ible” resources of other estimates. The results areparticularly interesting, however, because Lewin’suse of reservoir simulation provides for a morecredible estimate of the effects of improved stimu-lation technologies and smaller well spacing. Asshown in the table, both methods of improvinggas recovery could be extremely successful in theAppalachian Basin. According to the report, 80-acre spacing has already started to supplant themore traditional 160-acre spacing in new drillingin the basin, Accordingly, the 8.7 to 10.5 TCF pro-jected as the result of improved but relatively con-ventional technology at 160-acre spacing prob-ably represents a pessimistic estimate of actualrecoverable resources assuming high gas prices.This result has interesting implications for thefuture potential of Devonian shale gas in view of
the limited portion of the total Appalachian re-source represented by this analysis.
A more recent Lewin study, available in draftat the publication close of this report, estimatesthe technically recoverable Devonian shale re-sources in West Virginia. Table 52 summarizesthe results, which apply to the Huron, Rhine-street, and Marcellus shale intervals. These inter-vals represent the most promising shale prospectsin the State, although only 70 TCF out of a totalof 125 TCF of gas-in-place for the intervals wasactually appraised. Insufficient reservoir datawere available for the nonappraised portions ofthese intervals. In addition, hundreds of TCF ex-ist in lower quality shale formations that may bedevelopable at some point, but not with simpleextensions of today’s technology.
The results of the West Virginia assessment areeven more optimistic than the Ohio results, giventhe estimated 25.4 to 32.7 TCF technically recov-erable resource based on improved but readilyattainable technology and 160-acre spacing.Coupled with the probability that Kentucky willprove to have recoverable resources somewherein-between those of Ohio and West Virginia,44
the Lewin results imply that the Devonian shalerecoverable resource is considerably greater thanimagined by all of the previous estimates re-viewed herein.
Table 51 .—Results of Lewin Assessment ofTechnically Recoverable Gas in Ohio, by
Stimulation Method After 40 Years
dqvel 10 I(u u5kraa, Lewin & Associates, Inc., personal Comm u n i-
cation, 1984.
1. Present technology, 160-acre spacing● Borehole shooting . . . . . . . . . . . . . . . . . . . . . . .6.2 TCF
Il. Improved but readily attainable technology,160-acre spacing:● Small radial stimulation (30 ft radius). .. ....8.7 TCF● Small vertical fracture (150 ft wings) . .....10.5 TCF
Ill. Advanced technology, speculative,160-acre spacing:● Large radial stimulation (60 ft radius). .. ...10.2 TCF. Large vertical fracture (600 ft wings) . .....15.2 TCF. Large vertical fracture, 80-acre spacing
(600 ft wings) . . . . . . . . . . . . . . . . . . . . . .....21.0 TCFIV. Changed well patterns (3 to 1 rectangle,
taking account of permeability anisotropy)with improved or advanced technology:yields added recovery of 5 to 10 percent/well.
SOURCE: V. A. Kuuskraa, et al., Technically Recoverable Devonian Shale Gas inOhio, Lewin & Associates Report for Morgantown Energy TechnologyCenter, July 1983.
Table 52.-Results of Lewin Assessment ofTechnically Recoverable Gas in West Virginia, by
Stimulation Method After 40 Years
1. Present technology, 160-acre spacing:● Borehole shooting . . . . . . . . . . . . . . . . . . . . . .19.1 TCF
Il. Improved but readily attainable technology,160-acre spacing:● Small radial stimulation (30 ft radius). .. ...25.4 TCF● Small vertical fracture (150 ft wings) . .....32.7 TCF
Ill. Advanced technology, speculative:● Large vertical fracture (600 ft wings) . .....88.4 TCF
SOURCE: V. A. Kuuskraa, et al., Technically Recoverable Devonian Shale Gas inWest Virginia, Summary, 1984 (draft).

Ch. 9—Gas From Devonian Shale ● 199
Estimates Comparison and Uncertainties
OTA’s examination of the several estimates ofDevonian shale recoverable resources estab-lished some important concerns:
First, with the exception of the latest Lewin &Associates reports on Ohio and West Virginia, theattributes of advanced recovery technologieswere described vaguely, and a reservoir simula-tion model that could predict the effect of longerfractures or other attributes of advanced technol-ogies was not available. Consequently, estimatesof the effects of advanced recovery technologieson recoverable resources should be consideredat best either “educated guesses” or extrapola-tions based on quite limited evidence.
Second, several of the estimates extrapolateavailable data on existing production to the en-tire Appalachian Basin by using methods that relyon guesswork, on arguable assumptions, or onapparent relationships with variables that do notseem likely to be strongly related to resourcerecovery potential. For example, the early OTAstudy did not formally relate well production tomeasurable physical attributes of the areas underdevelopment, presumably because there were in-adequate data. Instead, the study assumed that10 percent of the basin will be productive in thesame manner as the area now under production,and that the remainder of the basin will be un-productive; the choice of 10 percent was not ex-plained, but is essentially an “educated guess.”Both the Pulle and Seskus and the NPC estimatesrelied on predictive variables—in NPC’s case,shale thickness as measured by gamma-ray logs—which seem likely to be only limited predictorsof gas recovery. The Zielinski and Mclver estimatefor West Virginia, Ohio, and Kentucky, admit-tedly a preliminary, crude attempt, is based onthe assumption that the existing wells, used forextrapolation, were randomly sited, so that theirproduction would be representative of whatwould occur in the untested portions of the shalearea. This type of assumption is more tenable inthe Appalachian Basin than it would be else-where because sophisticated exploration tech-niques were not used to site the existing wells,the haphazard availability of land for drilling mayhave interfered with pattern drilling, and other
factors. In our view, however, the informationgained by earlier drilling is certain to have di-rected subsequent drilling to better-than-averageprospects, and the direct extrapolation used inthis study will tend to lead to an overestimate ofthe resource recoverable by borehole shooting.
Third, only a very small part of the Devonianshale has been tested by drilling, and conse-quently the available studies focus on the re-sources recoverable from the producing shale in-tervals, or those closely resembling them, i.e.,those with well-developed natural fracture sys-tems. Much of the gas-in-place exists in intervalswhich are not currently productive. For the mostpart, the large portion of this gas probably couldnot be produced with current technologies andprices. However, it may be possible to economi-cally recover much of this gas with new technol-ogy, especially at higher prices. The existingstudies cannot account for this possibility, andprobably there is no credible way at present todetermine the true potential of these intervals.Nevertheless, it must be made clear that the ex-isting estimates of the Devonian shale resourcepotential do not include this speculative portionof the resource, and that there is at least the pos-sibility that, with further technology develop-ment, the gas ultimately recoverable from theDevonian shales may be considerably larger thancurrently estimated.
Fourth, all of the estimates may suffer from theproblem that past production has been influ-enced by the market and by other external in-fluences on production. The studies all implicitlyassume either that the resource characteristics aredominant in determining production character-istics, or else that any external influences on pro-duction will remain essentially unchanged dur-ing the period of development of the resource.Zielinski and Mclver have noted that these pro-duction influences might have affected the ulti-mate recovery of past wells, and should be takenaccount of when extrapolating to future pro-duction.
Comparison of the resource estimates of thevarious studies is made difficult by the first prob-lem, the lack of clearly defined criteria for “ad-vanced technologies, ” and also by differences in

—
200 ● U.S. Natural Gas Availability: Gas Supply Through the Year 2000
assumed gas prices and study areas. However,relatively clear comparisons can be made of theresources recoverable by traditional boreholeshooting. Table 53 compares the resource esti-mates of six studies for borehole shooting at 150-to 160-acre spacing and, for three of the studies,at prices moderately higher than current marketprices for new gas. The estimates of Pulle andSeskus, Zielinski and Mclver, and the recentLewin study do not specify prices and are morein the nature of “technically recoverable gas. ”They are best compared to the NPC “total pro-ducible” resource of 25.3 TCF and the 1977Lewin estimate of 10.5 TCF for gas prices of$4.50/MCF ($7.00/MCF [1983$]); the latter shouldbe close to a “technically recoverable” limit be-cause of the rapidly diminishing returns for fur-ther price increases apparent in the Lewin analysis.
Because there has been extensive experiencewith borehole shooting, the estimates for recov-erable resources using this technology should bethe most reliable. There are serious differencesamong the estimates in table 53, however, andwe believe these differences reflect some of ourconcerns with the individual studies. The Zielin-ski and Mclver estimate, which should be con-sidered optimistic because it assumed that sitingof past wells was random and therefore that theirproduction experience would be representativeof undrilled acreage, is in fact the highest of theestimates of technically recoverable gas. The 1977OTA estimate is not based on a geological evalua-tion of the prospects of the undeveloped portionof the basin, and probably should be down-played; it is, in fact, at considerable variance with
the NPC and early Lewin estimates, which aremore pessimistic. On the other hand, the earlyLewin estimates also appear to be considerablymore pessimistic than the recent Lewin estimatesfor Ohio and West Virginia; it seems likely thata new Lewin estimate of the Appalachian gasrecoverable at about $4.70/MCF (1983$) wouldbe considerably higher than the 8 TCF predictedby the early study. The difference between theearly and more recent Lewin studies is empha-sized by the recognition that the early study in-cludes some hydraulic fracturing in its recover-able resource estimate; presumably, its estimatefor the resource recoverable with borehole shoot-ing only would have been even lower than 8 TCF.
In conclusion, OTA’s best resolution of existingresource studies is that the Devonian resourceultimately recoverable with borehole shooting at160-acre spacing and gas priced at $4 to $5/MCF(1983$) is at least 10 TCF and, based on the im-plications of the recent Lewin work, most prob-ably is somewhat higher. Ultimately, if the Lewinanalyses prove to be substantially correct, about30 to 50 TCF may be recovered with this tech-nology and spacing at very high prices. These areextremely conservative estimates of the actual gaspotential of the Appalachian Basin, however, be-cause neither the technology assumption nor thespacing assumption are realistic. Many producersin the basin have begun to use hydraulic fractur-ing, which increases ultimate recovery per well,and well spacing in the less permeable areas hasbegun to be decreased to 80 acres, which im-proves recovery per section. With boreholeshooting as the “baseline” technology, halving
Table 53.—Comparison of Estimated Appalachian Devonian Shale Resources Recoverable With Borehole Shooting,Well Spacing of 150 to 160 Acres
Gas price ($/MCF) Recoverable resource Total producibleStudy (data) study date (1983)a (TCF) (TCF)
OTA (1976) . . . . . . . . . . . . . . . . . . . . .... ... ... .. .$2 to $3 ($3.03 to $4.95) 23 NANPC (1979) . . . . . . . . . . . . . . . . . . . . . . . . . . . . . . . . . $3.50 ($4.70) 8.5 25.3Lewin I (1977). . . . . . . . . . . . . . . . . . . . . . . . . . . . . . . $3000 ($4.68) 8 b 10.5+Pulle and Seskus (1981) . . . . . . . . . . . . . . . . . . . . . . None 17-23Zielinski and Mclver (1982)
(West Virginia, Ohio, Kentucky) . . . . . . . . . . . . . None 30-50Lewin II (1983) (portions of
Ohio and West Virginia only) . . . . . . . . . . . . . . . None 25.3aThe 1983 gas price is obtained by applying the GNP Price Deflators published by the Bureau of Economic Analysis, Department of Commerce.blncludes hydraulic fracturing as well as borehole shooting.
SOURCE: Office of Technology Assessment.

Ch. 9—Gas From Devonian Shale ● 201
the spacing seems likely to yield at least a 70-percent increase in recoverable resources, pri-marily because the area of influence of each wellis smallest with this technology and thus the ad-ditional wells will interfere least with the adjacentwells. The incremental benefit of reduced spac-ing will decrease for recovery technologies thatcontact more of the formation because of inter-ference between adjoining wells; however, Lewinestimated that halving the spacing will still add40 percent to the recoverable resource in Ohioeven when the baseline technology achieves 600-ft fractures, which should maximize interferencebetween wells.
The use of conventional hydraulic fracturingand more advanced stimulation also can greatlyincrease the recoverable resource. The N PC esti-mates that conventional fracturing will yield a 50-to 70-percent increase in recovery over boreholeshooting. They project an additional 40-percentincrease over the conventional fracturing with themore advanced stimulation techniques, but thisestimate is based on very limited experience. Therecent Lewin study estimates that a stimulationachieving 600-ft fractures can more than doublethe recoverable resource over that obtainablewith borehole shooting, and that a combinationof this technology with 80-acre spacing can morethan triple the resource.
These estimates imply that the recoverable re-source in the Appalachian Devonian shales mayprove to be quite large, perhaps 80 or 100 TCFor even higher with high gas prices and substan-tial improvements in recovery technology. How-ever, the current limited capability in reservoirsimulation and our limited geologic understand-ing imply that estimates of recoverable resourcesusing advanced technology should be viewed ashaving quite high uncertainty.
Finally, as noted previously, none of the esti-mates consider the possibiIity of producing fromshale intervals that do not contain well-developednatural fracture networks. This portion of theshale is a highly speculative resource, and its gas-in-place may never become recoverable. Never-theless, it does present some potential for futurerecovery.
Annual Production Estimates
Annual production estimates may be calculatedby estimating the number of wells to be drilledand postulating a drilling schedule. The numberof wells drilled is determined by the area con-sidered to be drillable and the well spacingassumed. The larger the well spacing, the fewerthe number of wells that may be drilled in a givenarea. The USGS argues that drainage patterns ofDevonian shale wells are too variable to assumea constant spacing.
Lewin & Associates determined 1990 produc-tion estimates based on an available acreage of57,000 square miles, a well spacing of 150 acresper well and the drilling and development sched-ules outlined for the base and advanced technol-ogy cases. The resulting estimates are shown intable 54.
Annual production and additions to reserveswere also calcuIated in the NPC study. The num-ber of wells drilled were constrained by an avail-able acreage of 62,000 square miles, a well spac-ing of 160 acres per well and “low” and “high”drilling schedules. The low scenario assumedthere would be initially 12 rigs drilling in Devo-nian shale in 1980, and a 12-percent increaseeach year thereafter. The high scenario assumed15 rigs were active in 1980, with 15 rigs addedeach year through 2000. All rigs were assumedto drill 35 productive wells per year. The resultsof this analysis are included in table 55. As shownin the table, the high scenario depends on ex-tremely high gas prices into the 1990s. Even withadvanced technology, the year 2000 productionrate of 1.35 TCF/yr requires gas prices above$10.00/MCF (1983$).
It is not clear whether or not the annual pro-duction estimates projected by the NPC andLewin accounted for some important factors thatcan influence the rate at which the resource isdeveloped. The effects of these factors are notreadily quantifiable, but they can be used to qual-ify the production potential estimates.
One factor that definitely will affect the pro-
duction rate is the availability of adequate leasesfor exploration and drilling. In fact, in most ac-
38-74~ O - 8 5 - 1 4

202 U.S. Natural Gas Availability: Gas Supply Through the Year 2000
Table 54.—Lewin & Associates Results for Annual Production Estimates
Price, 1977$ (1983$) Production rates (TCF/yr)
($/MCF) Base case Advanced case
1.75 (2.75) . . . . . . . . . . . . . . . Peak 0.1 in 1990 Peak 0.3 in 1990declines thereafter declines thereafter
3.00 (4.70) . . . . . . . . . . . . . . . Peak 0.3 in 1990 0.6 in 1990, hold to 1995gradual decline thereafter declines thereafter
4.50 (7.00) . . . . . . . . . . . . . . . Remains constant at 0.3 Increases to 0.7 to 0.9 in 1990through 2000
SOURCE: Lewin &Associates, Inc., Enhanced Recovery of Unconventional Gas, U.S. Department of Energy Report HCP/T2705-01,02, and 03, 1978-79.
Table 55.—Potential Incremental Supply of Devonian Shale Gas In the Appalachian Basin:NPC High Growth Drilling Schedule (production and reserve volumes [BCF] and price [$/MMBtu]) (constant 1979 dollars)
1980 1985 1990 1995 2000Annual productive wells drilled. . . . . . . . . . . . .Cumulative wells . . . . . . . . . . . . . . . . . . . . . . . . .Traditional technology:
Annual production rate . . . . . . . . . . . . . . . . . .Annual reserve additions . . . . . . . . . . . . . . . .Cumulative additions . . . . . . . . . . . . . . . . . . .Incremental price at 10°/0 ROR . . . . . . . . . . .
Conventional technology:Annual production rate . . . . . . . . . . . . . . . . . .Annual reserve additions . . . . . . . . . . . . . . . .Cumulative additions . . . . . . . . . . . . . . . . . . .Incremental price at 10°/0 ROR . . . . . . . . . . .
Advanced technology:Annual production rate. . . . . . . . . . . . . . . . . .Annual reserve additions . . . . . . . . . . . . . . . .Cumulative additions . . . . . . . . . . . . . . . . . . .Incremental price at 10°/0 ROR . . . . . . . . . . .
770770
15200200
<2.50
17240240
<2.50
21290290
<2.50
3,40012,500
190890
3,300<2.50
2201,0403,800
<2.50
2701,2904,800
< 2 . 5 0
6,00037,300
4301,2508,800
<5.00
5501,660
11,000<3.50
7002,030
14,000<3.50
8,65075,300
6201,110
14,300<7.00
8651,690
19,600<7.00
1,1102,170
25,100<5.00
11,300126,400
690720
18,400<12.00
1,0051,140
26,100<9.00
1,3551,600
34,500<9.00
SOURCE: National Petroleum Council.
tive areas of Devonian shale drilling, perhaps 95percent of all wells drilled are located on the basisof the availability of Iand. Most of the Devonianshale in the Appalachian Basin occurs in theolder, more populated areas, which over theyears have been divided into small tracts (by oilindustry standards). Building an exploration blockof any size is difficult and expensive with manytitle problems. Also, a trend towards short-termleases of 1 year or less has made establishing anorderly exploration program difficult. Some Statesalso have no well spacing requirements, makingany tract capable of holding a potential drillingrig a drill site. As a result, a good well may bejeopardized by other wells that are placed tooclose to it.
The type of operators in the Devonian shalewill also influence the development of the re-source. The major oil companies have not in-vested in Devonian shale wells, due principally
to land problems and poor well performance.The majority of operators are small companiesfinanced by drilling funds or direct investmentgroups. Although these small operators can moveswiftly into “hot” acreage, their cash flows aregenerally not sufficient to allow much explora-tion. As a result, many wells are drilled with lit-tle regard to geological conditions. A lack of fundscould also inhibit the use of costly yet more ef-fective evaluation and stimulation techniques,thereby reducing the quantity of gas ultimatelyrecovered,
Aside from these uncertainties, and the obviousuncertainty introduced by our inability to projectfuture economic and market conditions such asgas prices, demand, and availability of capital,production projections share most of the uncer-tainties associated with the estimates of recov-erable resources discussed previously in thischapter. Of particular interest are uncertainties

Ch. 9—Gas From Devonian Shale ● 203
in the effects of improved stimulation technol-ogies, since increases in fracture areas will affectproduction rates as well as total cumulative pro-duction. Consequently, production projectionsassuming the use of advanced technologiesshould be considered substantially more uncer-tain than projections assuming explosive fractur-ing. In the latter case, extrapolating from historicproduction data should be an acceptable proce-dure for projecting future production, althoughour lack of data on production practices andother factors that might have influenced past pro-duction rates requires that a substantial errorband be placed around the results.
Production levels of about 1.0 TCF by the year2000 would seem to be readily supported by theavailable studies: the 1977 OTA study concludedthat 1.0 TCF/yr could be achieved 20 years aftercommencing an intensive drilling program, as-suming relatively moderate prices; the first Lewinstudy projected a maximum production rate of0,9 TCF/yr in 1990, with advanced technologyand $4.50/MCF gas (1 977$) ($7.00/MCF [1983$]);and the NPC study projected a 1.0 TCF/yr pro-duction rate in 2000 using available technology,although admittedly at a very high price ($9.00/MCF [1979$]). However, high production levels
of Devonian shale gas in the Appalachian Basinusing currently available or moderately improvedtechnology implies a massive expansion of drillingin an area where such an expansion is institu-tionally and physically difficult. Also, the produc-tion levels in the various studies were derived byassuming arbitrary drilling levels and extrapolat-ing production data from quite limited areas tothe basin as a whole. On the other hand, the re-cent Lewin work in Ohio and West Virginia im-plies that gas recovery (and production rates) persection can be increased substantially with re-duced spacing, tailoring of drilling patterns topermeability anisotropy, and improved fractur-ing. Increased recovery per section could allowa more rapid expansion of production by easingproblems of pipeline construction and land as-semblage. Consequently, if gas market conditionsin the Northeast improve very soon, institutionalbarriers to production are reduced or overcome,and exploration and production technology ad-vances are achieved, OTA considers a produc-tion rate of 1.0 to 1.5 TCF/yr from the Appa-lachian Devonian shales by the year 2000 to bequite plausible. Achievement of the prerequisiteconditions in the short time span involved is,however, still somewhat optimistic.