gas regional initiative - region south-south east 3rd implementation group meeting towards a...
TRANSCRIPT
Gas Regional Initiative - Region South-South East
3rd Implementation Group Meeting
Towards a Regional Entry-Exit System in the SSE Gas Market. A Preliminary Study
Sergio Ascari, Consultant, AEEG
Maribor, 9 October 2007

2
Objectives of current preliminary study
Overview of current tariff systems
Stylised simulation of a regional tariff system
Disclaimer: approximate though plausible data
Comparison between transport costs with current (national) tariffs and with regional tariffs
No change in total TSO revenue – same as with current national tariffs
Benefits and costs for countries, SSE
Inter-TSO Compensation (ITC) issues
3
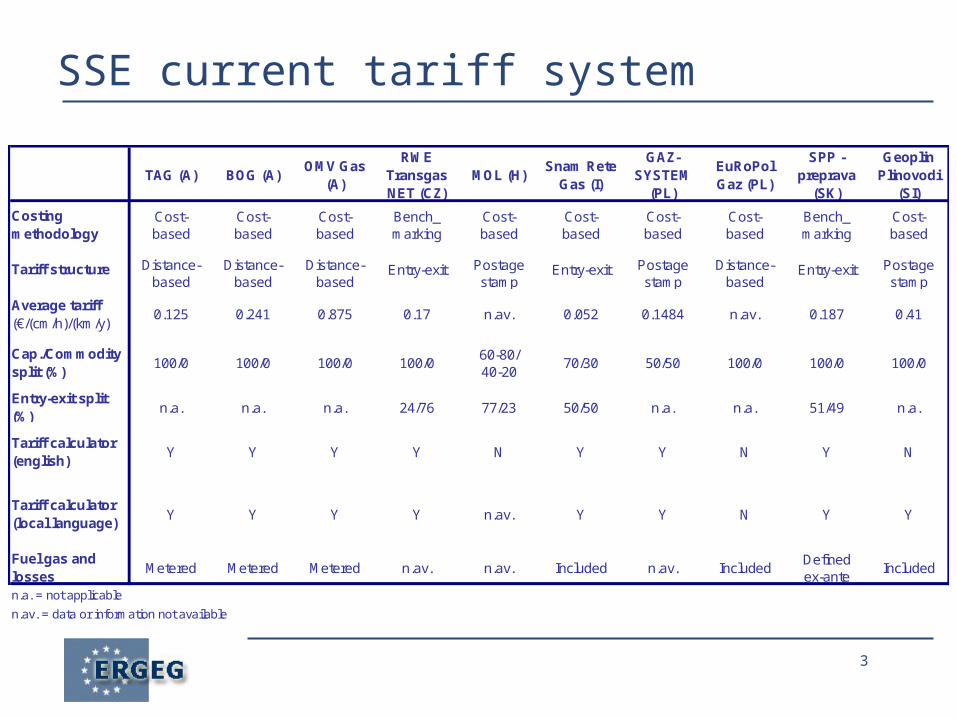
SSE current tariff system
TAG (A) BOG (A)OMV Gas
(A)
RWE Transgas NET (CZ)
MOL (H)Snam Rete
Gas (I)
GAZ-SYSTEM
(PL)
EuRoPol Gaz (PL)
SPP - preprava
(SK)
Geoplin Plinovodi
(SI)
Costing methodology
Cost-based
Cost-based
Cost-based
Bench_ marking
Cost-based
Cost-based
Cost-based
Cost-based
Bench_ marking
Cost-based
Tariff structure Distance-based
Distance-based
Distance-based
Entry-exit Postage stamp
Entry-exit Postage stamp
Distance-based
Entry-exit Postage stamp
Average tariff (€/(cm/h)/(km/y)
0.125 0.241 0.875 0.17 n.av. 0.052 0.1484 n.av. 0.187 0.41
Cap./Commodity split (%)
100/0 100/0 100/0 100/060-80/40-20
70/30 50/50 100/0 100/0 100/0
Entry-exit split (%)
n.a. n.a. n.a. 24/76 77/23 50/50 n.a. n.a. 51/49 n.a.
Tariff calculator (english)
Y Y Y Y N Y Y N Y N
Tariff calculator (local language)
Y Y Y Y n.av. Y Y N Y Y
Fuel gas and losses
Metered Metered Metered n.av. n.av. Included n.av. IncludedDefined ex-ante
Included
n.a. = not applicable
n.av. = data or information not available

4
Scope of the study: countries, routes
● Preliminary version includes A, CZ, I, SK, SLO
● Routes already considered in GRI for SSE-5:
1. UKR-SK-CZ-GER (Vel'ké Kapušany - Waidhaus or Hora S. Kateriny)
2. UKR-SK-A-SI-I (Vel'ké Kapušany – Baumgarten – Murfeld - Šempeter/Gorizia)
3. UKR-SK-A-I (Vel'ké Kapušany - Baumgarten - Tarvisio)
4. UKR-SK-A-GER (Vel'ké Kapušany – Baumgarten - Oberkappel)
5. ALGERIA-I-(SI)-A-SK (- CZ, -H) (Mazara-Tarvisio (Gorizia–SI) – Minerbio - Baumgarten – CZ/SK)

5
Scope of the study: other routes
● Other Routes included in this version:➢ CH-I-A/SI (Griespass-Minerbio-A/SI/CZ/SK)
➢ Italian LNG terminal connection (Panigaglia-Minerbio-A/SI/CZ/SK)
● Routes to be added when data are provided:➢ UKR–H-Austria (Beregdaroć-Mosonmagyarovar-Baumgarten)➢ BELARUS-PL-GER-CZ (Kondratki – Mallnow – HSK)➢ UKR-RO-BG-GR (Isaccea–Negru Voda-Kula-Revithoussa) ➢ UKR–H-Serbia (Beregdaroć-Szeged)

6
Scope of the study: TSOs, entry/exit points● TSOs
➢ RWE-TN, SPP-P, BOG, TAG, OMV(SOL), Geoplin-P, SRG
● Entry points➢ Import points (Vel'ké Kapušany, H.S. Kateriny, Overkappel,
Griespass, Panigaglia, Mazara/Gela)
➢Main domestic production and storage areas (S. Moravia, SW Slovakia, Lower Austria, Adriatic Sea, Po Valley, Basilicata)
● Exit points ➢Export points (H.S. Kateriny, Waidhaus, Overkappel, Rogatec, Griespass)
➢Virtual national consumption areas (Slovakia, Czech Rep., NE/NW/S Austria, Slovenia, N/S&Central Italy)
7
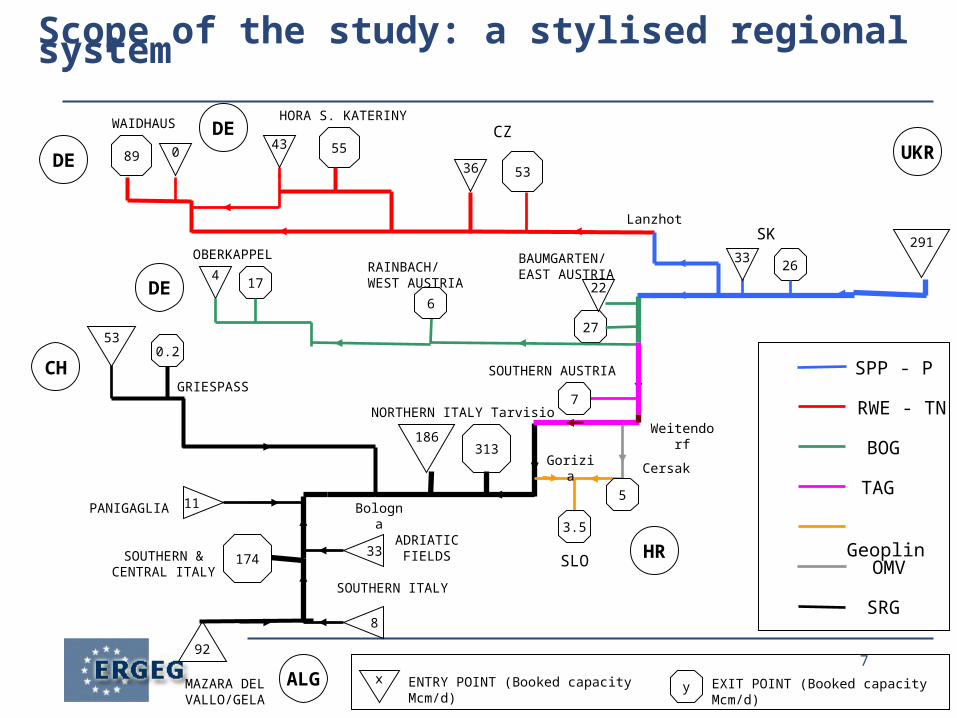
Scope of the study: a stylised regional system
PANIGAGLIA
ADRIATIC FIELDS
SOUTHERN ITALY
MAZARA DEL VALLO/GELA
GRIESPASS
NORTHERN ITALY
SOUTHERN & CENTRAL ITALY
313186
SK
2633
HORA S. KATERINY
55CZ
WAIDHAUS
27
22
BAUMGARTEN/ EAST AUSTRIA
174
OBERKAPPEL
SOUTHERN AUSTRIACH
DE
DE
DEUKR
RAINBACH/ WEST AUSTRIA
SLO
Lanzhot
WeitendorfTarvisio
CersakGorizia
Bologna
HR
291
5336
43089
6
7
530.2
3.5
5
17433
11
8
92
ALG
SPP - P
RWE - TN
BOG
TAG
SRG
Geoplin
OMV
yx ENTRY POINT (Booked capacity Mcm/d) EXIT POINT (Booked capacity Mcm/d)
8
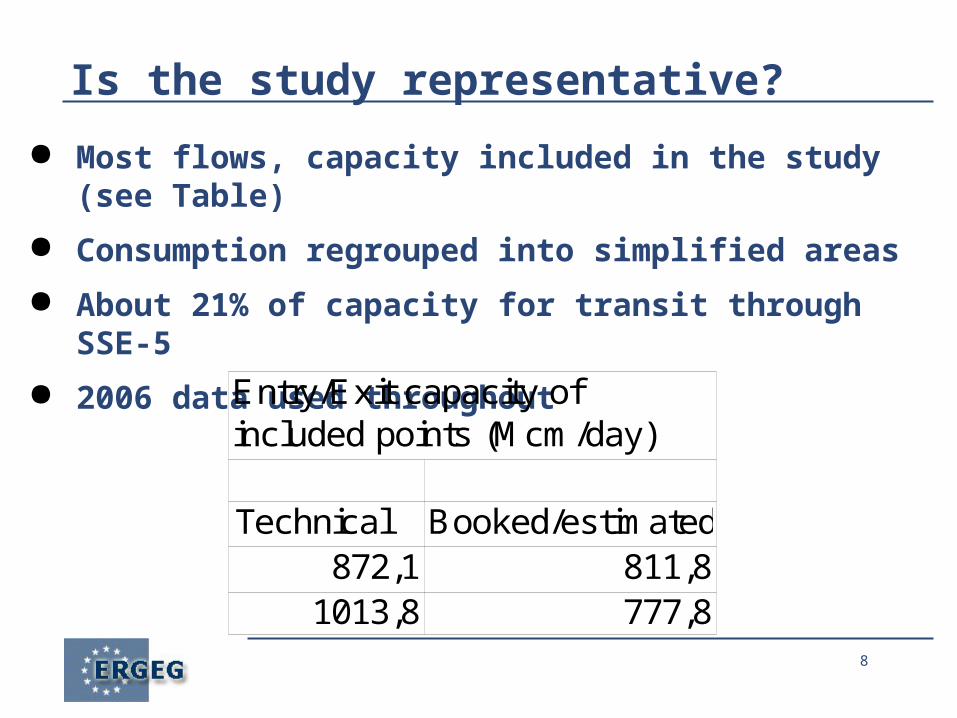
Is the study representative?
● Most flows, capacity included in the study (see Table)
● Consumption regrouped into simplified areas
● About 21% of capacity for transit through SSE-5
● 2006 data used throughout
Technical Booked/estimated872,1 811,8
1013,8 777,8
Entry/Exit capacity of included points (Mcm/day)

9
REETS costs and revenues
●Assumed that revenue = costs●Calculation of (approximate) revenue
requirements for each TSO based on:➢ current tariffs or methods, approved by NRAs ➢ applicable for standard long term contracts (15.6 Mcm/d; 5 Bcm/y, load factor 88%)➢ for considered routes only, secondary grid excluded ➢ for Geoplin-P primary grid cost estimated as 68% of total

10
REETS simulation: required revenues
SPP-Preprava 904.980.100RWE-Transgas Net 534.594.287BOG (WAG) 52.142.679TAG 172.766.806OMV (SOL) 6.812.659GEOPLIN-Plinovodi 24.814.518SnamReteGas 1.032.861.236
Total 2.728.972.286

11
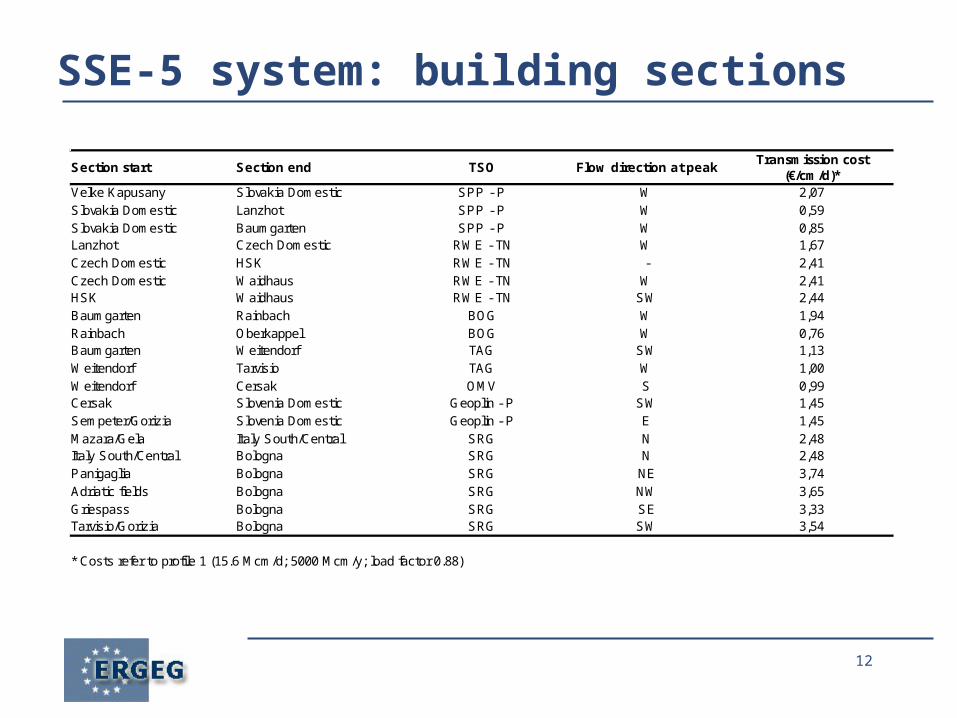
REETS simulation: building sections●Each routes split into “sections”●For each TSO, 2 or 3 sections on each route ● If no more information available TSOs with virtual
exits split into sections of the same size and exit point located between such sections (RWE-TN, SRG for South-Central Italy, Geoplin-P)
● If more precise information available sections may be different (Austrian TSOs, SPP-P)
●cost of each section = currently paid tariffs of standard LT contract for that section
●cost of sections when used “backhaul” = 10% of normal cost, 30%also simulated
12
SSE-5 system: building sections
Section start Section end TSO Flow direction at peak
Velke Kapusany Slovakia Domestic SPP - P W 2,07Slovakia Domestic Lanzhot SPP - P W 0,59Slovakia Domestic Baumgarten SPP - P W 0,85Lanzhot Czech Domestic RWE - TN W 1,67Czech Domestic HSK RWE - TN - 2,41Czech Domestic Waidhaus RWE - TN W 2,41HSK Waidhaus RWE - TN SW 2,44Baumgarten Rainbach BOG W 1,94Rainbach Oberkappel BOG W 0,76Baumgarten Weitendorf TAG SW 1,13Weitendorf Tarvisio TAG W 1,00Weitendorf Cersak OMV S 0,99Cersak Slovenia Domestic Geoplin - P SW 1,45Sempeter/Gorizia Slovenia Domestic Geoplin - P E 1,45Mazara/Gela Italy South/Central SRG N 2,48Italy South/Central Bologna SRG N 2,48Panigaglia Bologna SRG NE 3,74Adriatic fields Bologna SRG NW 3,65Griespass Bologna SRG SE 3,33Tarvisio/Gorizia Bologna SRG SW 3,54
* Costs refer to profile 1 (15.6 Mcm/d; 5000 Mcm/y; load factor 0.88)
Transmission cost (€/cm/d)*

13
REETS simulation: further work
● Simulation of increased cost (+20%) to pay for enhancement of selected congested pipelines – included in this version
●Cost data are being collected and will be used for benchmarking, further simulations
14
REETS simulation: tariff structure
● Single balancing zone
● Entry-exit, 100% capacity tariffs
● Gas fuels and losses not considered - to be provided in kind by shippers
● Entry-exit split as generated by the simulation (not constrained)
● Multiple balancing zones with interlinks may be considered in next version

15
REETS simulation: basic results (€/m3/d/y) Entries Exits
Velke
Kapušany 2.49SK 1.11CZ 0.85
HSK 0.85
Waidhaus0.74
Baumgarten0.76
Oberkappel 0.51Mazara del Vallo/Gela 3.05Panigaglia 2.38Griespass 1.91
N Italy0.00
S Italy1.40
Adriatic fields2.34
SK0.00
CZ 0.99HSK 2.34
Waidhaus 2.41Baumgarten/E
Austria 0.08Rainbach/N
Austria 1.27Oberkappel 1.73
Weitendorf/ S Austria 0.46
SLO 1.75Griespass 1.98Bologna/N
Italy 1.94South &
Central Italy 1.83
16
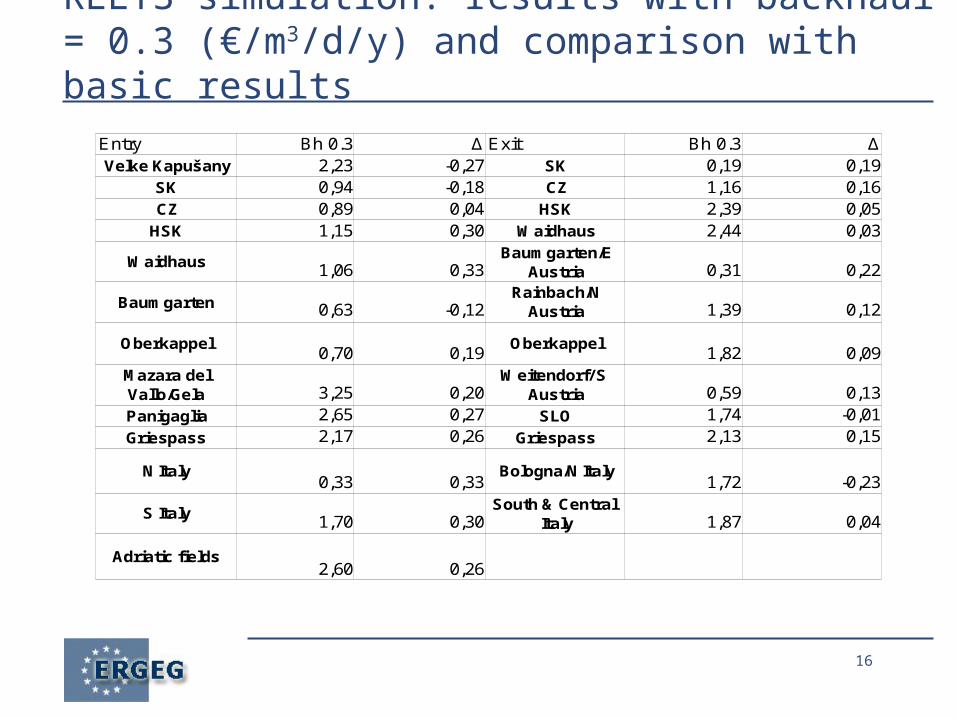
REETS simulation: results with backhaul = 0.3 (€/m3/d/y) and comparison with basic results
Entry Bh 0.3 Δ Exit Bh 0.3 Δ
2,23 -0,27 SK 0,19 0,19SK 0,94 -0,18 CZ 1,16 0,16CZ 0,89 0,04 HSK 2,39 0,05
HSK 1,15 0,30 Waidhaus 2,44 0,03
Waidhaus 1,06 0,33 0,31 0,22
Baumgarten 0,63 -0,12 1,39 0,12
Oberkappel0,70 0,19
Oberkappel1,82 0,09
3,25 0,20 0,59 0,13Panigaglia 2,65 0,27 SLO 1,74 -0,01Griespass 2,17 0,26 Griespass 2,13 0,15
N Italy0,33 0,33
Bologna/N Italy1,72 -0,23
S Italy 1,70 0,30 1,87 0,04
Adriatic fields2,60 0,26
Velke Kapušany
Baumgarten/E Austria
Rainbach/N Austria
Mazara del Vallo/Gela
Weitendorf/ S Austria
South & Central Italy

17
REETS simulation: impact of increased cost (investment allowance) in BOG or TAG
Entry Basic +20% in BOG +20% in TAG Exit Basic +20% in BOG +20% in TAG
Velke Kapušany2.49 -0.01 0.02
SK0.00 0.00 0.00
SK 1.11 0.00 0.04 CZ 0.99 0.00 -0.03CZ 0.85 0.00 0.05 HSK 2.34 -0.01 -0.06
HSK 0.85 0.00 0.05 Waidhaus 2.41 0.00 -0.05
Waidhaus0.74 -0.01 0.04
Baumgarten/E Austria 0.08 0.01 -0.01
Baumgarten0.76 0.00 0.04
Rainbach/N Austria 1.27 0.23 -0.03
Oberkappel 0.51 -0.02 0.05 Oberkappel 1.73 0.33 -0.04Mazara del Vallo/Gela 3.05 -0.02 -0.07
Weitendorf/ S Austria 0.46 0.00 0.05
Panigaglia 2.38 -0.01 -0.06 SLO 1.75 0.00 0.02Griespass 1.91 -0.01 -0.05 Griespass 1.98 0.00 0.09
N Italy0.00 0.00 0.00
Bologna/N Italy 1.94 0.00 0.09
S Italy1.40 -0.01 -0.05
South & Central Italy 1.83 0.00 0.10
Adriatic fields 2.34 -0.02 -0.07
18
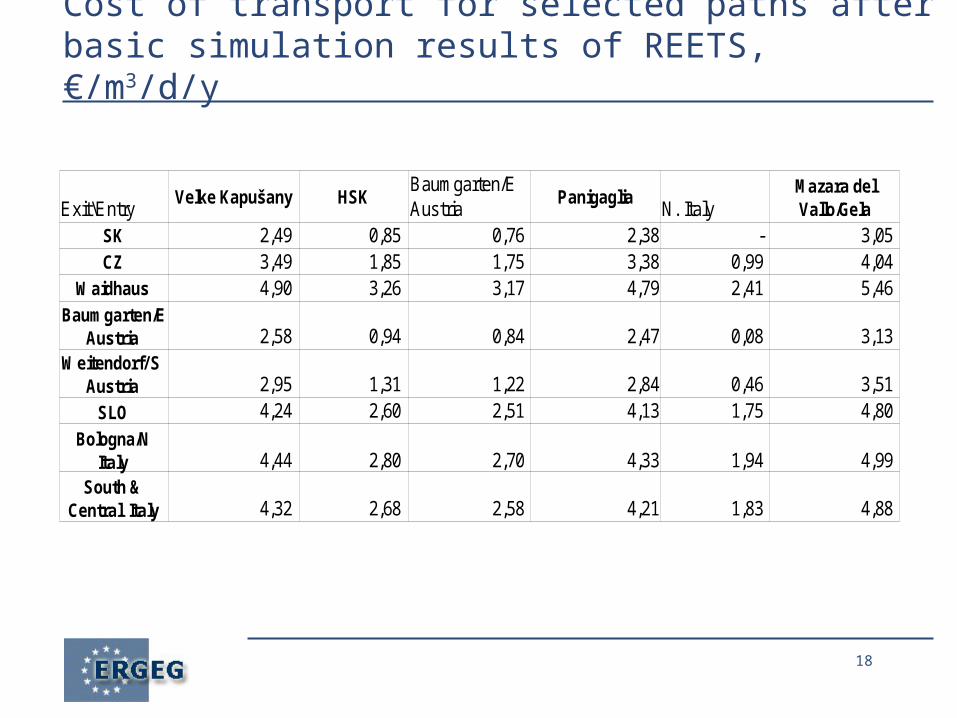
Cost of transport for selected paths after basic simulation results of REETS, €/m3/d/y
Exit\EntryHSK Panigaglia
N. ItalySK 2,49 0,85 0,76 2,38 - 3,05 CZ 3,49 1,85 1,75 3,38 0,99 4,04
Waidhaus 4,90 3,26 3,17 4,79 2,41 5,46
2,58 0,94 0,84 2,47 0,08 3,13
2,95 1,31 1,22 2,84 0,46 3,51 SLO 4,24 2,60 2,51 4,13 1,75 4,80
4,44 2,80 2,70 4,33 1,94 4,99
4,32 2,68 2,58 4,21 1,83 4,88
Velke KapušanyBaumgarten/E Austria
Mazara del Vallo/Gela
Baumgarten/E Austria
Weitendorf/ S Austria
Bologna/N Italy
South & Central Italy
19
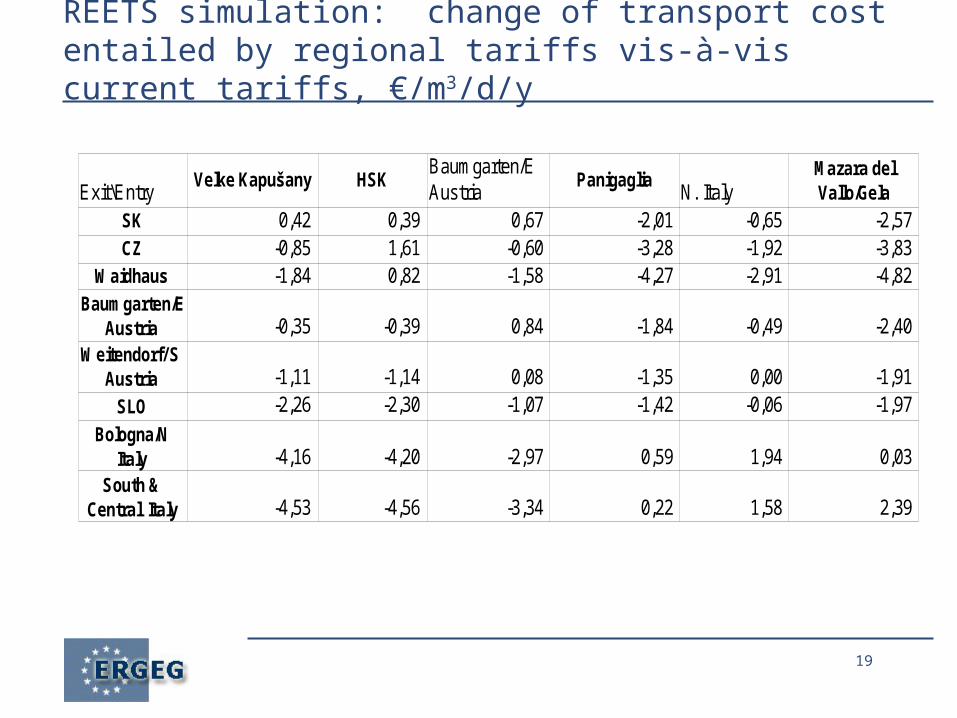
REETS simulation: change of transport cost entailed by regional tariffs vis-à-vis current tariffs, €/m3/d/y
Exit\EntryHSK Panigaglia
N. ItalySK 0,42 0,39 0,67 -2,01 -0,65 -2,57 CZ -0,85 1,61 -0,60 -3,28 -1,92 -3,83
Waidhaus -1,84 0,82 -1,58 -4,27 -2,91 -4,82
-0,35 -0,39 0,84 -1,84 -0,49 -2,40
-1,11 -1,14 0,08 -1,35 0,00 -1,91 SLO -2,26 -2,30 -1,07 -1,42 -0,06 -1,97
-4,16 -4,20 -2,97 0,59 1,94 0,03
-4,53 -4,56 -3,34 0,22 1,58 2,39
Velke KapušanyBaumgarten/E Austria
Mazara del Vallo/Gela
Baumgarten/E Austria
Weitendorf/ S Austria
Bologna/N Italy
South & Central Italy
20
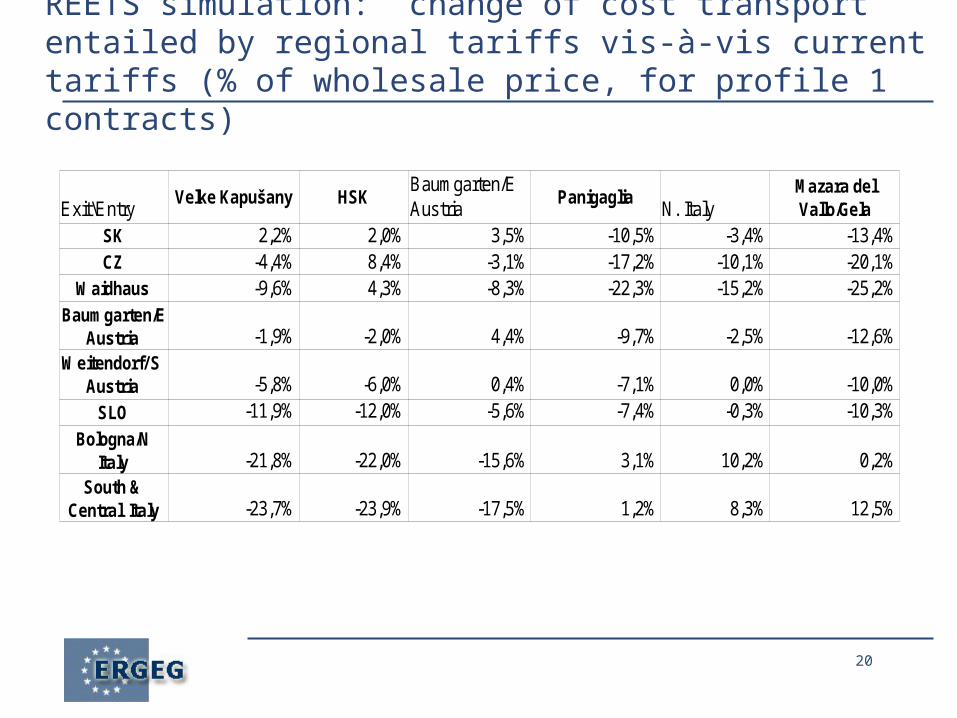
REETS simulation: change of cost transport entailed by regional tariffs vis-à-vis current tariffs (% of wholesale price, for profile 1 contracts)
Exit\EntryHSK Panigaglia
N. ItalySK 2,2% 2,0% 3,5% -10,5% -3,4% -13,4%CZ -4,4% 8,4% -3,1% -17,2% -10,1% -20,1%
Waidhaus -9,6% 4,3% -8,3% -22,3% -15,2% -25,2%
-1,9% -2,0% 4,4% -9,7% -2,5% -12,6%
-5,8% -6,0% 0,4% -7,1% 0,0% -10,0%SLO -11,9% -12,0% -5,6% -7,4% -0,3% -10,3%
-21,8% -22,0% -15,6% 3,1% 10,2% 0,2%
-23,7% -23,9% -17,5% 1,2% 8,3% 12,5%
Velke KapušanyBaumgarten/E Austria
Mazara del Vallo/Gela
Baumgarten/E Austria
Weitendorf/ S Austria
Bologna/N Italy
South & Central Italy

21
REETS simulation: comments
● Recall that total revenues – and hence weighted average transport cost in SSE-5 – does not change in this simulation
● With respect to current tariffs, REETS entail:
•- increase of transport costs for “close” sources
•- decrease of transport costs for “far” sources
● Cost increase due to investment is spread among all routes
● Weight used for sections used “backhaul” has limited impact

22
REETS simulation: ITC mechanism/1
● Unlike in electricity, physical flows triggered by scheduled transportation patterns are largely predictable
● No need to devise inter-TSO compensation mechanism based on ex-post flows
● Tariffs may be entirely capacity – based, required revenue is defined ex-ante
● If commodity-based component is agreed, related revenues are simply attributed to each TSO
23
REETS simulation: ITC mechanism/2
● Regulated allowed revenue (AR) determined and approved by NRAs for each TSO
● Tariffs may be collected by individual TSOs (e.g. according to exit area) and/or by a regional grid manager (RGM)
● Tariff revenue is then re-allocated to match individual AR
● Cost of tariffs and fuel gas to be separately provided by shippers at metered or regulated rates
24
REETS: preliminary conclusions/1
● Based on assumption of no TSO revenue change
● A regional tariff solution can be easily estimated for a stylised system and is stable
● Transport cost changes vis-à-vis current tariffs would be remarkable but usually between ± 10-15% of wholesale price, 4-8% of retail price
● Reduced transport cost from more remote sources likely to offset increases for close sources

25
REETS: preliminary conclusions/2● Risk of sharp changes adversely affecting wholesale prices in some countries suggests that REETS should be phased in gradually
● Hence transitional system consisting of smaller balancing areas with interlinks may be appropriate
● Since transport costs from “close” sources increase, from “far” sources fall, competition opportunities between suppliers and exporting sources increase
● ITC required but based on TSO's required revenues, implementation easier than for electricity