gas ten year statement 2017 - national grid | natural … asxmp. ecr ona f r pe - al cor enmge. x/ t...
TRANSCRIPT
NOVEMBER 2017
Gas Ten Year Statement 2017
UK gas transmission

Gas Ten Year Statement November 2017
HomeThis will take you to the contents page. You can click on the titles to navigate to a section.
ArrowsClick on the arrows to move backwards or forwards a page.
A to ZYou will find a link to the glossary on each page.
HyperlinksHyperlinks are underlined and highlighted in the chapter colour throughout the report. You can click on them to access further information.
How to use this interactive document To help you find the information you need quickly and easily we have published the GTYS as an interactive document.

Gas Ten Year Statement November 2017 01
We are in the midst of an energy revolution. The economic landscape, developments in technology and consumer behaviour are changing at a remarkable rate, creating more opportunities than ever before for our industry.
Our 2017 Gas Ten Year Statement, along with our other System Operator publications, aims to encourage and inform debate, leading to changes that ensure a secure, sustainable and affordable energy future.
GTYS 2017 continues to be an important part of how we engage with you to understand the drivers of change influencing your business. This allows us to continue to develop the National Transmission System and market framework in line with your needs.
Although the key themes have remained unchanged over the past 12 months, their importance remains crucial to us, in particular how we respond to the changing needs of our customers, the impact of EU legislation and the effect of Great Britain’s evolving and dynamic gas market on system operations and planning into the future.
Our latest Future Energy Scenarios (FES) further emphasises the importance of gas in GB’s energy mix. Gas continues to play a key role providing flexible generation to enable the growth of renewable sources of generation and providing top-up heating in the longer term. It is fundamentally important that we continue to enhance our approach to how we foresee the network evolving to ensure we have the tools and capability in place ahead of the need.
Complementing 2017’s GTYS and FES publications, National Grid is producing the Gas Future Operability Planning (GFOP) document. Looking ahead to 2050, the GFOP focuses on how the changing needs of our customers will affect the operability of the gas transmission system. Alongside GTYS we are keen to get your views on the GFOP publication and engagement activities are being arranged to facilitate this.
I hope you find both of these documents useful, along with our other System Operator publications. Further information about all our publications can be found in Section 1.2.
Please share your views with us. You can find details of how to contact us on our website http://www.nationalgrid.com/gtys
Andy MalinsHead of Network Capability and Operations, Gas

Gas Ten Year Statement November 2017 02
Contents
Executive summary ............................................03Key messages ........................................................04Future GTYS editions and feedback ......................05
Chapter four
Introduction .........................................................081.1 What do we do? ...........................................091.2 Future Energy Scenarios ............................... 101.3 Key themes ................................................... 121.4 Network Development Process .................... 131.5 GTYS chapter structure ................................ 141.6 Gas Future Operability Planning document ... 161.7 GTYS document suite ................................... 17
Network development inputs ...........................202.1 Introduction ................................................... 212.2 Customer requirements ................................222.3 Future Energy Scenarios ...............................402.4 Legislative change .........................................482.5 Asset health ...................................................54
System operation ...................................................904.1 Introduction .......................................................914.2 What are System Operator capabilities? .........924.3 Deciding between System Operator
capabilities and assets .....................................934.4 Investing in our System Operator capabilities .........................................954.5 Need Case review ...........................................104
Chapter five
Chapter six
Chapter seven
Asset development ...............................................1105.1 Introduction ..................................................... 1115.2 Industrial Emissions Directive ......................... 1125.3 Integrated Pollution Prevention and Control Directive ...................................... 1135.4 Large Combustion Plant Directive ................. 1165.5 Medium Combustion Plant Directive .............. 1175.6 Asset health review ......................................... 1175.7 Meeting future flow patterns ........................... 117
Way forward ...........................................................1206.1 Continuous development of GTYS ................120 6.2 2016/17 stakeholder feedback engagement ..121
Appendix .................................................................124Appendix 1 – National Transmission
System maps .....................................124Appendix 2 – Customer connections
and capacity information ....................136Appendix 3 – Meet the teams ...................................145Appendix 4 – Import and storage infrastructure ....... 147Appendix 5 – EU activity ........................................... 151Appendix 6 – Conversion matrix ...............................154Appendix 7 – Glossary ..............................................155
System capability ...............................................603.1 Introduction ................................................... 613.2 NDP – Defining the Need Case .....................623.3 Customer capacity – exit ..............................633.4 Customer capacity – entry ............................ 813.5 Impact of legislative change ..........................86
Chapter one
Chapter two
Chapter three

Gas Ten Year Statement November 2017 03
Executive summary
Overview
The 2017 Gas Ten Year Statement (GTYS) provides an update on the current and future challenges which impact the way we plan and operate the National Transmission System (NTS). In addition, the GTYS outlines what we are doing to address them as the System Operator (SO) and Transmission Owner (TO). Three themes continue to be a priority for us: customer requirements, legislative change and asset health. This year’s publication will again focus on these against the backdrop of the current Future Energy Scenarios.
Continuing with the format used for last year’s document, GTYS 2017 is presented across the following sections (see figure 0.1) with the aforementioned themes of customer requirements, Future Energy Scenarios, legislative change, and asset health bridging the central three chapters of System Capability, System Operation and Asset Development.
Figure 0.1 2017 GTYS structure
1. Introduction
6. Way Forward
Options to respond
2. NDP Triggers
3. System CapabilityDo nothing/impact on current network and SO capabilities
4. System OperationSO Tool/ Capability development
5. Asset DevelopmentNetwork/Asset option development
Connections (new
/existing)
Entry and E
xit Capacity
System
Flexibility
Historic E
volution of Supply &
Dem
and
Current S
upply & D
emand
Future Energy S
cenarios
IED
(IPP
C, LC
P, MC
P &
BR
EF)
Maintenance &
Replacm
ent
CustomerRequirements
Future Energy Scenarios
Legislative Change
Asset Health

Gas Ten Year Statement November 2017 04
Executive summary
Changing energy landscape – the pattern of gas supply in Great Britain has changed dramatically in the past 15 years. We have gone from being self-sufficient in 2000 to now being dependent on imported gas for around half our needs. We expect a similar change looking forward as UK Continental Shelf supplies continue to decline. Additionally, growing renewable generation will lead to gas- fired generation being increasingly called on to provide flexibility to support intermittent supply.
These changes in gas supply and demand will create new operability challenges. We discuss these further in the Gas Future Operability Planning document which is being published alongside this GTYS.
Impact of changing customer requirements – in February 2016 we initiated an innovation project (Project CLoCC: Customer Low Cost Connections), the objective being to reduce connection costs for typically smaller projects to the NTS to less than £1 million and the time it takes to connect to less than one year. We are creating an online gas customer connections portal, a suite of standardised connection designs and optimised commercial agreements to offer more flexibility to customers.
Harmonising the development process for incremental capacity – new rules for incremental capacity at Interconnection Points have been introduced consistent with the Network Code on Capacity Allocation Mechanism.
Asset operation on the NTS – during 2016/17 we developed a new methodology for Network Output Measures (NOMs) and submitted our proposal to Ofgem on 30 March 2017. Based around a monetised risk approach, this new methodology will significantly improve our ability to assess network risk and prioritise network investment. In January 2013 the Industrial Emissions Directive was introduced. This restricts the use of 16 of our 64 compressor units on the NTS. The Medium Combustion Plant Directive which will be effective from January 2018 is anticipated to affect the availability of a further 26 compressor units.
Key messages

Gas Ten Year Statement November 2017 05
We are always keen to hear your comments to help shape the structure and content of future Gas Ten Year Statements. We also seek your views on the following areas of our gas transmission business:• Asset Health• Gas Planning Standards• Industrial Emissions Directive• Network Development Policy.
If you have any feedback to help us shape GTYS 2018, please email us at [email protected].
Future GTYS editions and feedback

Gas Ten Year Statement November 2017 06

Chapter oneIntroduction 08
Gas Ten Year Statement November 2017 07

Gas Ten Year Statement November 2017 08
Cha
pter
one
Introduction
We update you on current and future challenges which impact the way we plan and operate the NTS. We also discuss what we’re doing to address these as System Operator (SO) and Transmission Owner (TO).GTYS is published at the end of the annual planning cycle. We use GTYS to provide information on an annual basis to help you
to identify connection and capacity opportunities on the NTS. We summarise key projects, changes to our internal processes that may impact you and other key publications which provide further information on our System Operator activities. We are keen to engage with you to get your feedback on what we’re doing and how we’re doing it.
Welcome to our 2017 Gas Ten Year Statement (GTYS). We write the GTYS to provide you with a better understanding of how we intend to plan and operate the National Transmission System (NTS) over the next ten years.

Gas Ten Year Statement November 2017 09
Chapter o
ne
Our roleWe are the System Operator and Transmission Owner of the gas NTS in Great Britain. As System Operator our primary responsibility is to transport gas from supply points to exit offtake points safely, efficiently and reliably. We manage the day-to-day operation of the network including balancing supply and demand, maintaining system pressures and ensuring gas quality standards are met. As Transmission Owner we must make sure all of our assets on the NTS are fit for purpose and safe to operate. We develop and implement effective maintenance plans and asset replacement schedules to keep the gas flowing.
Our networkThe NTS plays a vital part in the secure transportation of gas and facilitation of the competitive gas market. We have a network of 7,600km of pipelines, presently operated at pressures of up to 94 bar, which transport gas from coastal terminals and storage facilities to exit offtake points from the system (see Appendix 1). At the exit offtake points, gas is transferred to eight Distribution Networks (DNs) for onward transportation to domestic and industrial customers, or to directly connected customers including storage sites, power stations, large industrial consumers and interconnectors (pipelines to other countries).
Our regulatory frameworkThe RIIO (Revenue = Incentives + Innovation + Outputs) regulatory framework was implemented by Ofgem in 2013/14. RIIO uses incentives to drive innovation to develop and deliver more sustainable energy. We are currently within the RIIO-T1 period (2013–21); under this framework we have set outputs which have been agreed with our stakeholders. We deliver these outputs in return for an agreed revenue allowance from Ofgem. (For more information please see Our Performance1 publication.)
1.1 What do we do?
1 http://talkingnetworkstx.com/general-performance.aspx

Gas Ten Year Statement November 2017 10
Cha
pter
one
2 http://fes.nationalgrid.com/
We published our latest Future Energy Scenarios (FES) publication in July 20172. We have created a credible range of scenarios, developed following industry feedback, which focus on the energy trilemma (sustainability, affordability and security of supply). The figure below (Figure 1.1) summarises the four 2017 scenarios.
Our scenarios are used as a basis for a range of further National Grid activities. The FES is the starting point for our regulated long-term investment and operability planning as well as a reference point for other National Grid reports. You can see how these documents link together in Figure 1.2.
1.2 Future Energy Scenarios
IntroductionP
rosp
erit
yM
ore
mo
ney
avai
lab
leLe
ss m
one
y av
aila
ble
Green ambition More focusLess focus
Steady StateA world focused on security of supply and short-term thinking
Two DegreesA world where environmental sustainability is the top priority
Slow ProgressionA world focused on long-term environmental strategy
Consumer PowerA world which is relativelywealthy and market driven
Figure 1.1 The 2017 FES scenario matrix

Gas Ten Year Statement November 2017 11
Chapter o
ne
2015/16
Winter Consultation
Oct 2017Winter Outlook Report Our view of the gas and electricity systems for the winter ahead.
Apr 2018Summer Outlook Report Our view of the gas and electricity systems for the summer ahead.
May 2018Winter ReviewA comparison between the past winter’s actual energy demand and supply and our forecast.
Jun 2018Winter Consultation An opportunity to share your views on energy demand and supply for the winter ahead.
Future Energy ScenariosA range of plausible and credible pathways for the future of energy from today out to 2050.
Jul
2017
Gas Ten Year Statement How we will plan and operate the gas network, with a ten-year view.
Nov
2017
Electricity Capacity ReportContains recommendations for the capacity to secure for the Capacity Market T–1 and T–4 auctions.
Jul
2017
National Grid plcNational Grid House, Warwick Technology Park, Gallows Hill, Warwick. CV34 6DA United KingdomRegistered in England and Wales No. 4031152
www.nationalgrid.com
Future Operability Planning 2016
UK gas transmission
Future Op
erability P
lanning 2016
Gas Future Operability PlanningHow the changing energy landscape will impact the operability of the gas system.Q
uart
erly
Electricity Ten Year Statement The likely future transmission requirements on the electricity system.
Nov
2017
System Operability Framework How the changing energy landscape will impact the operability of the electricity system.R
egul
ar
System Needs and Product StrategyOur view of future electricity system needs and potential improvements to balancing services markets.Ja
n20
18
Network Options AssessmentThe options available to meet reinforcement requirements on the electricity system.
Figure 1.2 System Operator publications

Gas Ten Year Statement November 2017 12
Cha
pter
one
Introduction
Three key themes continue to be a priority for us over the next ten years:• Customer requirements• Legislative change• Asset health.
This year’s GTYS focuses on these key themes and outlines what impact they will have on how we operate and develop our network over the next ten years.
Customer requirementsCustomer behaviour is continually changing. The NTS has to be able to respond in a more dynamic way. Often it’s not a case of one customer but the combined impact of multiple changing customer behaviours, occurring at the same time. This makes it ever more challenging to plan and operate the system.
The importance of understanding our customers’ requirements of the NTS is discussed in more detail in Chapters 2, 3 and 4. In Chapter 4 we have outlined how we’re developing our internal systems to better manage within-day customer requirements.
Legislative changeLegislative change has a big impact on how we plan and operate our network.
In previous versions of GTYS we have outlined the key elements of the Industrial Emissions Directive (IED) and how our network could be affected.
We discuss the impact of legislative change in Chapters 2, 3, 4 and 5.
Asset healthThe NTS comprises 7,600 km of pipeline, 24 compressor sites with 75 compressor units, 20 control valves and 530 above-ground installations (AGIs).
It’s vital that we comply with all safety legislation that applies to operating the NTS while also maintaining the current level of network risk through maintenance and replacement. With so many assets on the system that are ageing, we have a growing asset health issue. An ageing network needs more maintenance but we have to balance this with the changing needs on our network.
The impact of asset health on our network is covered in Chapters 2 and 5.
1.3 Key themes

Gas Ten Year Statement November 2017 13
Chapter o
ne
The Network Development Process (NDP) defines the method for decision making, optioneering, development, sanction, delivery and closure for all our projects (Figure 1.3). The goal is to deliver projects that have the lowest whole-life cost, are fit for purpose and meet stakeholder and RIIO requirements.In GTYS we focus on the first three stages of the NDP (Trigger, Need Case and Establish
Portfolio) as these outline our internal decision-making process. The final three stages relate to physical asset build and non-physical solutions such as commercial options. These are briefly discussed in Chapter 5.
The impact of asset health on our network is covered in Chapters 2 and 5.
1.4 Network Development Process
Review and Close Project
Trigger
A change in the network, legislation, market or customer requirements.
Need Case
Required system capability over the short/medium/long term
Establish Portfolio
Risks of ‘Do Nothing’ option. Consider ‘rules’, ‘tools’ and ‘assets’.
Select Option
Invest in assets, develop commercial options or wider network options?
Develop and SanctionValue delivered for customers and end consumers under different options?
Execute Project
Least regrets option or options?
Stakeholder Engagement
Chapter 2 Chapter 3 Chapters 4 & 5 Chapter 5
Figure 1.3 The Network Development Process

Gas Ten Year Statement November 2017 14
Cha
pter
one
Introduction
The chapter structure provided in Figure 1.4 gives you a clearer overview of what happens at each stage of the NDP and how the stages link together to provide the most robust, cost-effective solution(s).
Along with our FES the impact of the three key themes are discussed throughout this year’s GTYS.
1.5 GTYS chapter structure
Figure 1.4 2017 GTYS structure
1. Introduction
6. Way Forward
Options to respond
2. NDP Triggers
3. System CapabilityDo nothing/impact on current network and SO capabilities
4. System OperationSO Tool/ Capability development
5. Asset DevelopmentNetwork/Asset option development
Connections (new
/existing)
Entry and E
xit Capacity
System
Flexibility
Historic E
volution of Supply &
Dem
and
Current S
upply & D
emand
Future Energy S
cenarios
IED
(IPP
C, LC
P, MC
P &
BR
EF)
Maintenance &
Replacm
ent
CustomerRequirements
Future Energy Scenarios
Legislative Change
Asset Health
Gas Ten Year Statement November 2017 15
Chapter o
ne
Chapter 2. Network development process triggers This chapter covers four key triggers: customer requirements, the FES, legislation and asset health. We discuss these triggers and how they impact the current and future use of the NTS.
There are many inputs that ‘trigger’ our NDP. For every trigger we assess the needs of our network to ensure it remains fit for purpose. We’re in a period of great change. This may result in significant modifications to the way we currently plan and operate the NTS. We anticipate that we will have a wider range of triggers in future.
Chapter 3. System capabilityThis chapter explores the Need Case stage of our NDP. This is where we assess our system capability requirements.
System capability defines the maximum and minimum ability of our current network infrastructure to transport gas safely and effectively. We provide information about entry and exit capacity, pressures, and the impact of the IED.
Chapter 4. System operationThis chapter explores part of the ‘Establish Portfolio’ stage of our NDP, specifically with our non-asset solutions.
We develop a portfolio of non-asset and asset solutions to meet the Need Case requirements. We detail the specific ongoing and planned developments to our System Operator capabilities (rules and tools). These developments make sure that we can keep planning to operate a fit-for-purpose network safely and efficiently, to deliver value for our customers and stakeholders.
Chapter 5. Asset developmentThis chapter explores the final part of the ‘Establish Portfolio’ stage of our NDP, specifically with our asset solutions.We set out our NTS reinforcement projects that have been sanctioned, projects under construction in 2017/18 and potential investment options for later years as a result of the IED. It also covers our asset health review.
Chapter 6. Way forwardWe’re committed to meeting your needs and want you to help shape our GTYS and NDP. This chapter discusses our plans over the coming year and tells you how you can get involved.
Gas Ten Year Statement November 2017 16
Cha
pter
one
Introduction
Last year we developed the Gas Future Operability Planning (GFOP) document3 to provide a clearer focus on how your changing needs may impact the future operability of the NTS out to 2050.
The GFOP acts as a clear vehicle in which all participants can assess future gas transmission network needs and operational challenges. It may trigger a change in the way we respond to you and other market signals, leading to modifications in our decision- making and operational processes to ensure we continue to maintain a resilient, safe and secure NTS now and into the future. We need to work with all interested parties to make sure that the right commercial options (rules), operational arrangements (tools) and physical investments (assets) are considered across the NTS. Any resulting impacts and changes will be documented in the GTYS.
GFOP 2017 will consist of four quarterly publications released over the course of 2017/18. Our November edition, GFOP 2017 – A changing energy landscape, introduces a number of operability challenges we currently face and may face in the future. Our forthcoming quarterly publications will provide a more detailed assessment of these challenges.
For more information and to view the GFOP visit: nationalgrid.com/gfop
1.6 Gas Future Operability Planning document
3 https://www.nationalgrid.com/uk/publications/gas-future-operability-planning-gfop

Gas Ten Year Statement November 2017 17
Chapter o
ne
As part of the GTYS publication we produce a huge amount of analysis and data. For ease of use we have not included all of this data in the main GTYS document.
Our Charts Workbook contains:• all graphs and charts contained in this
GTYS publication• actual demand for gas year (2016/17) • peak, maximum and minimum day physical
NTS entry flows (for gas year 2016/17)• peak, maximum and minimum day physical
NTS exit flows (for gas year 2016/17)• gas demand and supply volumes by
scenario (out to gas year 2040/41)• 1-in-20 peak day diversified demand
by scenario (out to gas year 2040/41)• 1-in-20 peak day undiversified demand
by scenario (out to 2040/41)• 1-in-50 load curves (for gas years 2017/18,
2026/27 and 2030/31)• annual and peak supply by terminal
(out to gas year 2039/40).
To view our workbook and for more information visit: nationalgrid.com/gtys
We’d love to hear your views on the content and structure of the 2017 GTYS. If you’d like to get in touch, please email us at [email protected].
1.7 GTYS document suite

Gas Ten Year Statement November 2017 18
Cha
pter
one

Gas Ten Year Statement November 2017 19
Chapter twoNetwork development inputs 20
Gas Ten Year Statement November 2017 19

Gas Ten Year Statement November 2017 20C
hapt
er t
wo
Network development inputs
Several inputs trigger our Network Development Process (NDP). In this year’s GTYS we focus on four triggers: customer requirements, Future Energy Scenarios (FES), legislative change and asset health. We respond to these particular triggers because they affect network requirements and future system operability.
Key insights
Customer requirements• We are reviewing our connections
processes to improve the customer experience and to help accommodate unconventional gas sources.
• In February 2016 we began Project CLoCC, using innovative solutions to reduce the time and cost of connecting to the NTS. We are working to create an online gas customer connections portal, a suite of standardised connection designs and optimise commercial agreements to offer more flexibility.
• The Planning and Advanced Reservation of Capacity Agreement (PARCA) arrangements are in place. Customers can use them to reserve capacity before making final investment decisions in their projects.
• New rules for incremental capacity at Interconnection Points have been introduced consistent with the Network Code on Capacity Allocation Mechanism (CAM NC).
Future Energy Scenarios• Gas import dependency has grown
considerably since the early 2000s and could reach 76% by 2035.
• Peak supply capacity is much higher than peak demand.
• Peak demand does not decline as sharply as annual demand. In scenarios with a lot of renewable generation, gas-fired power stations are used less but still provide back-up when wind generation is low.
Legislative change• The Industrial Emissions Directive (IED)
was introduced in January 2013 combining the Integrated Pollution Prevention and Control Directive (IPPC) and Large Combustions Plant Directive (LCP).
• IPPC applies to 23 of our 24 compressor sites.
• LCP affects 16 of our 64 gas turbine driven compressor units.
• The draft Medium Combustion Plant Directive (MCP) affects 41 compressor units in total.
• EU rules and regulations will continue to apply in the UK until such time as the UK is no longer a member of the EU, although it is likely that the EU (Withdrawal) Bill will translate them directly into UK legislation.
• National Grid is engaging with both the government and Ofgem to understand the impact of the UK exiting the EU.
Asset health• 70% of our pipelines and 77% of our
other assets will be over 35 years old at the end of RIIO-T1.
• Over RIIO-T1 we are planning to invest £660m of capital expenditure in maintaining the health of our network.
• During 2016/17 we have developed a new methodology for Network Output Measures (NOMs) and submitted our proposal to Ofgem on 30 March 2017. This new methodology is based around a monetised risk approach.
• We will consider the removal of assets within the NDP to avoid unnecessary maintenance and reduce costs.

Gas Ten Year Statement November 2017 21C
hapter two
As we outlined in Chapter 1, our NDP defines our decision-making, optioneering and project development processes for all projects. Certain triggers initiate the NDP. Three key triggers have emerged from our NDP work: • customer requirements• legislative change and • asset health.
The Future Energy Scenarios (FES) also influence the NDP.
These triggers are interlinked so a change in one trigger will affect another (see Figure 2.1). For example, changes to emissions legislation has resulted in generators closing or reducing their use of coal plants leading to increased combined cycle gas turbine (CCGT) plant usage. This has changed the supply and demand patterns on the network, which feeds into our FES.
This chapter describes how each of the above can trigger an NDP.
2.1 Introduction
Figure 2.1 Key NDP triggers
Legislative Change
NTS Asset Health
Evolving Supply and Demand è Future Energy Scenarios
Customer Requirements
Connections Capacity Flexible Operation

Gas Ten Year Statement November 2017 22C
hapt
er t
wo
Network development inputs
The connection and capacity processes initiated by our customers trigger our NDP. We need to assess what impact a connection (new or modified) or a capacity change (supply or demand increase/decrease) will have on our current network capability and our operational strategies.
Anyone wishing to connect to the NTS can arrange for a connection directly with us. In addition we can reserve capacity for you, however, you must be aware that a shipper must buy and hold your capacity.
We can only enter into transportation arrangements with shippers and Gas Distribution Network Operators (DNO). Our Gas Transporters Licence stipulates that capacity can only be made available to these parties.
We have produced a high-level overview of our connection and capacity application processes in Table 2.1. We have included chapter and section numbers to help you navigate to the relevant section of this year’s GTYS.
2.2 Customer requirements
2.2.1 Our connection and capacity application processes

Gas Ten Year Statement November 2017 23C
hapter twoTable 2.1
Our connection and capacity application process
Our connection and capacity processes
Our customers and their key service requirements
Find more informationin GTYS go to:
Gas Shipper(signatory to theUniform Network Code (UNC)) Capacity Rights to flow gas onto the system (short, medium long term)
Distribution Network (DN) (signatory to the UNC) B4:B9 Rights to offtake gas from the system
CustomersNew Site Developers (that are not signatory to the UNC) and or currently connected customers.Both new and currently connected customers have Capacity Rights to flow gas onto and offtake gas from the system
Connections Application to offer (A2O) includes physical pipeline connections to the NTS (if required) for new connections, modifications and diversions
Chapter 2 – Sections 2.2.2, Appendix 2
✖
Physical Disconnection/Decommissioning follow the application to offer (A2O) process. Disconnection from the NTS covers the creation of a physical air gap and the removal of all assets
Chapter 2 – Section 2.2
✖
Entry and Exit Capacity
Quarterly System Entry Capacity (QSEC – gas years y+2 to y+17) Auctions
Chapter 2 – Section 2.2.3
✖ ✖Exit Application Windows (unsold within baseline capacity – gas years y+1 to y+3)
Chapter 2 – Section 2.2.4, Appendix 2 ✖
Exit Application Window (Enduring Annual – gas years y+4 to y+6 – Evergreen Rights) & (Adhoc – m+6 – Evergreen Rights) Enduring annual NTS exit Capacity
Chapter 2 – Section 2.2.4, Appendix 2
✖
Flexible Capacity for flow changes
Chapter2 – Sections 2.2.3, 2.2.4, Appendix 2 ✖ ✖
Entry/Exit Planning and Advanced Reservation of Capacity Agreement (PARCA – reserve unsold/ additional capacity & allocation)
Chapter 2 – Section 2.2.5, Appendix 2
CAM Incremental
Incremental entry/exit capacity trigger process for Interconnection Points (IPs). This process follows the principles of PARCA.
Chapter 2- section 2.2.7

Gas Ten Year Statement November 2017 24C
hapt
er t
wo
If you need a new connection or a modification to an existing NTS connection, you will need to go through the application to offer (A2O) process (see Section 2.2.2). Our connection (A2O) and capacity processes (Planning and Advanced Reservation of Capacity Agreement – PARCA) are separate.
Our customers have the flexibility to initiate these two processes at their discretion. However, the two processes can become dependent on each other. The new PARCA process has been designed to run in parallel with the A2O process to prevent the possibility of stranded capacity. We will only allocate reserved capacity if a full connection offer (FCO) has been progressed and accepted. Typically, it can take up to 12 months to progress and sign an FCO. This means
that the A2O process (if required) needs to be initiated at least 12 months before the capacity allocation date defined in the PARCA contract (see Section 2.2.5 and Appendix 2 for more detail).
In some cases we may need to reinforce our system to ensure we can meet our customers’ connection or capacity requirements. This was one of the key drivers for implementing the new PARCA process as we can now align any works we need to complete with our customers’ projects.
If you have any queries about our connections or capacity processes please contact the gas customer team directly (see Appendix 3 for our contact details).
Network development inputs
We offer four types of connection to the NTS as well as modifications to existing NTS connections4.
To connect your facility to the NTS you will need to initiate the A2O process. You can either have other parties build the facility’s connection or have the connection adopted by the host gas transporter (depending upon their circumstances).
You can then pass the connecting assets on to a chosen System Operator/transporter, or retain ownership yourselves.
Table 2.2 summarises the four different NTS gas connections that are currently available and the process of disconnecting and decommissioning.
2.2.2 Connecting to our network
4 https://www.nationalgrid.com/uk/gas/connections/applying-connection

Gas Ten Year Statement November 2017 25C
hapter two
If you need to make a change to the connection arrangement (e.g. request an increase in gas supply) this request will be considered using the same approach as a new NTS connection.
Customer Connections – Application to Offer (A2O)The Uniform Network Code (UNC)5 provides a robust and transparent framework for new customer connections and modifications to an existing connection.
The UNC provides:• a formal connection application template
for customers to complete• definition of the content of an initial
connection offer• definition of the content of a full
connection offer• how to request a modification to a full
connection offer
• timescales for National Grid to produce a connection offer:
– Initial connection offer – up to two months – Full connection offer – up to six months
(simple) or nine months (medium/complex)• timescales for customers to accept initial/
full connection offer (up to three months)• application fees for an initial connection
offer (fixed) and full connection offer (variable and reconciled)
• A requirement for National Grid to review the application fees on an annual basis.
The NTS connection application form and more information on the A2O connections process can be found on our website6.
NTS Gas Connections Categories
Entry Connections Connections to delivery facilities processing gas from gas-producing fields or Liquefied NaturalGas (LNG) vapourisation (importer) facilities, for the purpose of delivering gas into the NTS.
Exit Connections These connections allow gas to be supplied from the NTS to the premises (a supply point), toa distribution network (DN) or to connected systems at connected system exit points (CSEPs). There are several types of connected system including:– A pipeline system operated by another gas transporter– A pipeline operated by a party that is not a gas transporter, for transporting gas to premises
consuming more than 2,196 MWh per annum.
Storage Connections Connections to storage facilities, for supplying gas from the NTS and delivering it back later.
International Interconnector Connections
These are connections to pipelines that connect Great Britain to other countries. They can be for supply of gas from and/or delivery of gas to the NTS.
Disconnection and decommissioning
Disconnection is the positive isolation from the NTS and the customers’ facilities through a physical air gap between the two assets.
Decommissioning is where the site is returned to its original state. All assets are disconnected and removed including the removal of pipeline.
Table 2.2 NTS gas connections
5 http://www.gasgovernance.co.uk/UNC6 https://www.nationalgrid.com/uk/gas/connections/applying-connection

Gas Ten Year Statement November 2017 26C
hapt
er t
wo
Network development inputs
Figure 2.2 summarises the A2O process and the timescales associated with each stage.
Figure 2.2 Application to Offer (A2O) Process
Medium ComplexSimple(Feasibility Study
Not Required)
Applicant Decision Period
Detailed Design, Construction and Commissioning
Feasibility Study
Full Connection Offer
Feasibility Study
Full Connection Offer
Full Connection Offer
Initial Connection Offer (Optional) 2 months
3 months
3 months
3 months
24 months
6 months
Applicant Decision Period

Gas Ten Year Statement November 2017 27C
hapter twoConnection application charges
Our charging policy for all customer connections is set out in The Statement and Methodology for Gas Transmission Connection Charging7, which complies with Licence Condition 4B8.
When you connect to the NTS, the connection costs are calculated based on the time and materials used to undertake the activity. For a Minimum Offtake Connection (MOC) at a greenfield site, the cost of the connection is generally around £2m and can take up to three years to deliver. The costs and timescales for more complex connections can be significantly higher than those for a MOC.
Connecting pipelinesIf you want to lay your own connecting pipeline from the NTS to your facility, ownership of the pipe will remain with you. This is our preferred approach for connecting pipelines.
The Statement and Methodology for Gas Transmission Connection Charging describes other options for the installation and ownership of connecting pipelines. For all options, the connecting party is responsible for the costs of the pipeline.
Connection pressuresThere are four primary types of defined pressure on the NTS:• Standard Offtake Pressures as defined
in the UNC – A minimum pressure of 25barg of gas will be made available at NTS supply meter point offtakes. For NTS/Local Distribution Zone (LDZ) offtakes see Assured Offtake Pressures.
• Assured Offtake Pressures (AOP) as defined in the UNC – These are minimum pressures required to maintain security of supply to our DN customers. A significant number of these assured pressures are set at 38barg, the anticipated minimum pressure in most sections of the NTS under normal operating conditions.
• Anticipated Normal Operating Pressures (ANOP) – These are advisory pressures and indicate to our directly connected customers the minimum pressure likely to be available on the NTS in their connection area under normal operation. If our capability analysis shows an increasing likelihood that these pressures will not be met under normal operation, the customer will be notified of revised ANOPs with at least 36 months’ notice.
• Maximum Operating Pressure (MOP) – This is the maximum pressure that each section of the NTS can operate at and is relevant to connected NTS Exit and NTS Entry Point/Terminals.
These pressures will be stated in the Network Entry Agreement (NEA) or Network Exit Agreements (NExA) depending on the connection you require. When agreeing or revising a NExA, we can provide information regarding historical pressures which should help you to understand how we assess pressures and indicate how AOPs and ANOPs relate to typical operating pressures.
Shippers may also request a ‘specified pressure’ for any supply meter point, connected to any pressure tier, in accordance with the Uniform Network Code Section J 2.2.
General connection pressure information NTS offtake pressures tend to be higher at entry points and outlets of operating compressors, and lower at the system extremities and inlets to operating compressors. Offtake pressure varies throughout the day, from day-to-day, season-to-season and year-to-year. We currently plan normal NTS operations with start-of-day pressures no lower than 33barg. Note that these pressures cannot be guaranteed as pressure management is a fundamental aspect of operating an economic and efficient system.
7 https://www.nationalgrid.com/uk/gas/connections/applying-connection8 https://epr.ofgem.gov.uk//Content/Documents/Gas_transporter_SLCs_consolidated%20-%20Current%20Version.pdf

Gas Ten Year Statement November 2017 28C
hapt
er t
wo
Ramp rates and notice periodsDirectly connected offtakes have restrictions in terms of ramp rates and notice periods written into NExAs. A ramp rate (the rate at which the offtake of gas can be increased at the offtake) of 50 MW/minute can be offered for a simple connection. Higher ramp rates can be agreed but may be subject to completion of a ramp rate study. Notice periods are typically defined as the number of hours’ notice for increases of up to 25%, up to 50% and greater than 50% of maximum offtake rate. These notice periods are required to ensure that pressures can be maintained at times of system stress including high demand. Notice periods will only be enforced in these circumstances when system flexibility is limited. More detail regarding access to system flexibility can be found on our website in the Short Term Access to System Flexibility Methodology Statement9.
Connections and capacityThe Gas Act 1986 (as amended 1995) states that we “must develop and maintain an efficient and economical pipeline system and comply with any reasonable request to connect premises, as long as it’s economic to do so”.
Connecting a new supply or demand may require system reinforcement to maintain system pressures and capability. Depending on the scale, reinforcement projects may require significant planning, resourcing and construction lead-times. Therefore we need as much notice as possible. Project developers should approach us as soon as they are in a position to discuss their projects so that we can assess the potential impact on the NTS and help inform their decision making.
The PARCA process (see section 2.2.5) was designed to encourage developers to approach us at the initial stages of their project. This new process allows alignment between both the developer’s project timeline and any reinforcement works required on the NTS to accept or deliver capacity.
Evolving our connections processAs a result of changes in the energy sector and an increase in unconventional gas development, we are seeing more connections to the NTS that were not viable or foreseen in the past. These new and unconventional gas suppliers see value in connecting to the NTS because of the system location and/or the benefits of a higher pressure network.
We have begun to see new types of connection request, for example shale and biomethane entry connections and natural gas-powered vehicle refuelling stations exit connections. The system requirements for these connections are fundamentally different to more traditional project connections.
Many of you have told us that the existing connection regime does not meet your project’s requirements. If our present NTS connection service continues as it is, the majority of new and unconventional gas projects could be forced to seek connections to distribution networks, or try to find other ways of using the gas they produce.
We want to make the NTS more accessible to these new gas sources, and are addressing this challenge through Project CLoCC.
Network development inputs
9 https://www.nationalgrid.com/uk/gas/capacity

Gas Ten Year Statement November 2017 29C
hapter two
Project CLoCC (Customer Low Cost Connections) is looking at simplifying the process of connecting to the NTS for a new generation of gas customers.
BackgroundThis £5.4m Network Innovation Competition (NIC) project was set up due to demand for connecting lower flow customers to the NTS. It will address the main hurdles our customers were facing by reducing costs to connect down to under £1million (currently an average of £2m) and the time to connect to under a year (currently up to three years).
The project challenges the current A2O connection process with both technical and commercial solutions that align to the needs of our non-traditional gas customers, such as biomethane, small gas generators and shale. In addition, CLoCC also supports the development of exit projects such as Compressed Natural Gas (CNG) for transport.
By facilitating these new connections to the NTS from emerging markets, we can help maximise the potential for newer forms of indigenous gas, thereby improving the nation’s energy security while reducing our carbon footprint in the process.
UpdateThe project is now in its final stage, and has had a productive 12 months. A Project CLoCC Stakeholder Conference was held in early 2017 to give interested parties the opportunity to voice their opinions and give their input to help shape the final outcomes of the project. From these discussions, we were able to gain invaluable feedback that influenced the direction of the project.
As a result of this stakeholder collaboration, the project will deliver in three main ways:
• By developing a new online gas customer connections portal which will give an indicative guide as to how much it will cost customers to connect new sites in a matter of minutes. The portal will also include information about the capacity process so both cost and capacity information can be explored from a single location. This will be available for all gas customers to use for connection applications, regardless of flow. This year we have already developed a portal prototype and are now refining it for launch in October 2018.
• By developing a suite of standardised, pre-approved and pre-appraised design connections which will be ready ‘off the shelf’ to order. This will reduce the time to connect. Options cover connection pipework sizes of 80mm, 200mm and 300mm. The suite of designs can therefore accommodate a broad range of customers with a wide range of gas flows.
• By optimising commercial arrangements to offer more flexibility for our customers. This will be done by ensuring adaptations to relevant gas regime governance are implemented. An example of this is the work the project has done around oxygen specifications and gas quality (see Appendix 2 for more information).
As we move through the final phase of our project, we will deliver detailed designs for each of our connection solutions. We will also build and test one of them. Alongside this, we will complete work on the online portal and ensure all commercial arrangements are in place so the wide-reaching benefits of the project will be accessible to a new generation of customers as soon as the project closes in October 2018.
You can find out more and keep up to date at www.ProjectCLoCC.com.
Spotlight: Facilitating flexible connections to gas customers

Gas Ten Year Statement November 2017 30C
hapt
er t
wo
Network development inputs
Entry capacity gives shippers the right to flow gas onto the NTS. Only licensed shippers can apply for and obtain entry capacity. A licensed shipper is considered a ‘User’ of the NTS under the terms of the UNC.
NTS entry capacity typesWe can make firm and interruptible NTS entry capacity available to the market at each Aggregated System Entry Point (ASEP)10. The volume of firm capacity made available at each ASEP consists of the following:• Baseline NTS Entry Capacity (obligated) –
as defined by our Gas Transporters Licence• Incremental NTS Entry Capacity (obligated)
– firm capacity made available over and above baseline, in response to market demand and backed by User commitment
• Incremental NTS Entry Capacity (non-obligated) – at our discretion, we can release additional firm NTS entry capacity at an ASEP, over and above obligated levels.
Interruptible NTS entry capacity can be made available to the market at ASEPs where it can be demonstrated that firm NTS entry capacity is not being used. The volume of Interruptible NTS entry capacity available at an ASEP consists of two parts:• Use it or Lose it (UIOLI) – any NTS entry
firm capacity that has been unused for a number of days can be resold to the market as interruptible NTS entry capacity
• Discretionary – we can make additional interruptible NTS entry capacity available to the market at our discretion.
If there is physical congestion on the network, then we may limit interruptible NTS entry capacity rights, without any compensation for the Users affected.
NTS entry capacity auctionsTo obtain entry capacity a shipper can bid for capacity on the Gemini system through a series of auctions11. For long-term capacity, shippers can bid in three auctions:• Quarterly System Entry Capacity (QSEC)• Annual Monthly System Entry Capacity
(AMSEC)• Rolling Monthly Trade & Transfer
(RMTnTSEC).
The QSEC auction is held every March and can be open for up to ten working days. NTS entry capacity is made available in quarterly strips from October Y+2 to September Y+16 (where Y is the current gas year).
The AMSEC auction is run every February and NTS Entry Capacity is sold in monthly strips from April Y+1 through to September Y+2. This auction is ‘pay as bid’ and subject to a minimum reserve price.
The RMTnTSEC is held on a monthly basis at the month ahead stage. Any unsold quantities from AMSEC are made available in the RMTnTSEC auction and sold in monthly bundles. The auction is ‘pay as bid’, and subject to the same reserve price as AMSEC.
2.2.3 NTS entry capacity
10 https://www.nationalgrid.com/uk/gas/capacity11 https://www.nationalgrid.com/uk/gas/market-and-operations/capacity/entry-capacity

Gas Ten Year Statement November 2017 31C
hapter two2017 incremental obligated capacity
In order for incremental obligated entry capacity to be released, and therefore the obligated entry capacity level to be increased, enough bids for entry capacity must be received during the QSEC auctions to pass an economic test. If this capacity can be made available via capacity substitution12 then it may be released. This involves moving unused capacity from one or more system points to a point where there is excess demand. If incremental capacity requires reinforcement works it can only be triggered when the customer enters into a PARCA (see Section 2.2.5).
If insufficient bids are received to pass the economic test, capacity in excess of the obligated level can be released on a non-obligated basis, which would mean that the obligated capacity level does not increase for future auctions.
The QSEC auctions opened on Monday 20 March and closed on Tuesday 21 March 2017. No bids were received for incremental entry capacity.
Bids received at all ASEPs were satisfied from current unsold obligated levels for future quarters and no incremental obligated entry capacity was released.
12 https://www.nationalgrid.com/uk/gas/charging-and-methodologies/methodologies

Gas Ten Year Statement November 2017 32C
hapt
er t
wo
Network development inputs
Exit capacity gives shippers and Distribution Network Operators (DNOs) the right to take gas off the NTS. Only licensed shippers and DNOs can apply for and obtain exit capacity. A licensed shipper or DNO is considered a ‘User’ of the NTS under the terms of the UNC.
NTS exit capacity typesWe make Firm and Off Peak capacity available to the market at each offtake point. The volume of Firm capacity made available at each offtake point consists of the following:• Baseline Capacity (obligated) – as defined
by our Gas Transporters Licence• Incremental Capacity (obligated) – Firm
capacity made available over and above baseline, in response to market demand and supported by User commitment. This increase in capacity is permanent
• Incremental Capacity (non-obligated) – at our discretion, we can release additional firm capacity at an offtake point over and above obligated levels.
Off Peak capacity is made available to the market at offtake points where it can be demonstrated that Firm capacity is not being used. The volume of Off Peak capacity available at an offtake consists of three parts:• Use it or Lose it (UIOLI) – any Firm
capacity that has been unused over recent days, can be resold to the market as Off Peak capacity
• Unused Maximum NTS Exit Point Offtake Rate (MNEPOR) – during D-1 at 13:30 the NTS Demand Forecast is published. Where this demand forecast is less than 80% of the annual peak 1-in-20 demand forecast, we are obligated to release any remaining capacity up to the MNEPOR level as Off Peak capacity
• Discretionary – we can make additional Off Peak capacity available to the market at our discretion.
If there are low pressures on the network, then we may curtail Off Peak capacity rights, without any compensation for the Users affected.
For our DNO Users we also make NTS exit (flexibility) capacity available. This allows the DNO to vary the offtake of a quantity of gas from the NTS away from a steady rate over the course of a gas day. This allows the DNO to meet their 1-in-20 NTS Security Standard as well as to meet their diurnal storage requirements.
2.2.4 NTS exit capacity

Gas Ten Year Statement November 2017 33C
hapter twoNTS exit capacity application windows
To obtain exit capacity a shipper can apply for capacity through four exit capacity application windows:Annual NTS (Flat) Exit Capacity (AFLEC) –This application window is for capacity covering the period Y+1 to Y+3. The capacity allocated in this application window is not enduring and therefore cannot be increased or decreased. The application period for this application window is 1 to 31 July.Enduring Annual Exit (Flat) Capacity Increase (EAFLEC) – This application window is for capacity covering the period Y+4 to Y+6 (where Y is the current gas year). The capacity bought in this application window is enduring and can be increased or decreased in a later application window (subject to User commitment). The application period for this auction is 1 to 31 July.Enduring Annual Exit (Flat) Capacity Decrease (EAFLEC) – This application window allows a User to decrease their enduring capacity holdings from Year Y+1 (October following the July window). Further decreases and increases can be requested in subsequent application windows. The application period for this auction is 1 to 15 July.
Ad-hoc Enduring Annual Exit (Flat) Capacity – This application window allows a User to apply between 1 October to 30 June for capacity from Year Y. The capacity release date must not be earlier than the 1st of the month M+7 (where M is the month in which the application is made) and no later than 1 October in Y+6. The User (or Users in aggregate) must hold equal to or more than 125% of the Baseline NTS exit (flat) capacity for the year in which the application is received or the application must exceed 1 GWh/day.
DNOs apply for NTS exit (flexibility) capacity during the 1 to 31 July enduring annual exit (flat) capacity application window.
All capacity requests are subject to network analysis to assess the impact on system capability. Where the capacity requested can be accommodated through substitution the capacity request may be accepted. Capacity substitution involves moving unused capacity from one or more offtakes to a point where there is excess demand. If incremental capacity cannot be met via substitution the customer will need to enter into a PARCA as reinforcement works may be required to meet the capacity request (see section 2.2.5).
Successful applications submitted in the AFLEC window will be allocated within ten business days of the application window closing. Successful applications submitted in the EAFLEC window (both increases and decreases) will be allocated on or before 30 September.

Gas Ten Year Statement November 2017 34C
hapt
er t
wo
Network development inputs
The Planning and Advanced Reservation of Capacity Agreement (PARCA) is a bilateral contract that allows long-term NTS entry and/or exit capacity to be reserved for a customer while they develop their own project. The customer can buy the reserved capacity at an agreed future date.
The PARCA framework was implemented on 2 February 2015. It replaces the Advanced Reservation of Capacity Agreement (ARCA) for NTS exit capacity and the Planning Consent Agreement (PCA) for both NTS entry and exit capacity.
The PARCA framework is based on a development of the long-term NTS entry and exit capacity release mechanisms and extends the UNC ad hoc application provisions that allow users to reserve enduring NTS exit (flat) capacity and NTS entry capacity.
Baseline capacity, non-obligated incremental capacity and incremental capacity that can be provided via substitution will be made available through the annual auctions for Quarterly System Entry Capacity (QSEC) and enduring annual NTS exit (flat) capacity processes, and can also be reserved through a PARCA by a developer or a User (both DNO and shipper).
Incremental capacity that cannot be provided via substitution is only guaranteed for release where a PARCA has been agreed by us and a developer or a User (both DNO and shipper).
The PARCA framework provides a number of benefits for PARCA customers, other NTS customers/Users and us.
2.2.5 PARCA framework
Benefits for PARCA Customers
It is designed to help customers to reserve NTS entry and/or exit capacity early on in their project development without full financial commitment to formally booking capacity.
Reserved NTS capacity will be exclusive to the PARCA applicant (or their nominated NTS user) and will not be available to other NTS users.
It provides the customer with greater certainty around when capacity can be made available should their project progress to completion.
It aligns the customers and our project timelines; this is particularly important where reinforcement is required, so the projects can progress together.
The customer can align the NTS capacity and connection processes for their project.
The process is flexible, with logical ‘drop-out points’ before capacity allocation. Capacity allocation would be closer to the customer’s first gas day than under previous arrangements. As a result, the customer would be able to take advantage of these ‘drop-out points’, should their project become uncertain.
They are available to both UNC parties and project developers and therefore available to a wider range of customers compared to the existing annual NTS capacity auction and application processes.

Gas Ten Year Statement November 2017 35C
hapter two
Benefits for other NTS Customers and Users
Throughout the lifecycle of a PARCA, we will publish more information externally (compared to the existing auction/application mechanisms), increasing transparency for other NTS users.
The PARCA entry capacity process includes an ad hoc QSEC auction mechanism to allow other NTS users to compete for unsold QSEC before it is reserved.
The PARCA process includes a PARCA application window during which other NTS users can approach us to sign a PARCA. This provides a prompt for those customers considering entering into a PARCA. It would allow multiple PARCAs to be considered together. This way, we will make best use of unsold levels of NTS capacity and existing system capability when determining how to meet our customers’ requirements. This will enable the most economic and efficient investment decisions to be made.
Throughout the lifecycle of a PARCA, each customer must provide us with regular project progress updates. If a customer fails to provide the required information in the appropriate timescales, their PARCA may be cancelled and any reserved NTS capacity would either be used for another live PARCA or returned to the market. This will ensure that NTS capacity is not unnecessarily withheld from other NTS users.
A PARCA customer will be required to provide financial security to reserve NTS capacity. If the customer cancels their PARCA, a termination amount will be taken from the security provided. This would be credited to other NTS users through the existing charging mechanisms.
The timescales for the release of incremental NTS capacity to the PARCA applicant will be aligned to our timescales for providing increased system capability. This will take into account the Planning Act requirements for a reinforcement project. As a result, the risk of constraint management actions taking place and any costs potentially being shared with end consumers will be reduced.
They are available to both UNC parties and project developers and therefore available to a wider range of customers compared to the existing annual NTS capacity auction and application processes.
Benefits for Us
Throughout the lifecycle of a PARCA, the customer will be required to provide regular project progress updates. We would not begin construction on any investment projects until the customer has received full planning permission for their project. This will allow our case for any required investment to be clearly linked to our customer requirements.

Gas Ten Year Statement November 2017 36C
hapt
er t
wo
Network development inputs
Initially, a customer will submit a PARCA application requesting the capacity they need. We will use the information provided in the PARCA application to determine how and when the capacity requested can be delivered.
A customer might be a gas shipper, DNO or any other third party such as a developer and may or may not be a party signed up to the Uniform Network Code (UNC). The PARCA arrangements apply to all NTS entry and exit points, NTS storage and NTS interconnectors.
A key aspect of the PARCA is that it helps the customer and us to progress our respective projects in parallel. It also assures the customer that capacity has been reserved with the option to buy it later. Financial commitment to the capacity (allocation of capacity) is only required once the customer is certain that their project will go ahead.
The PARCA framework is split into four logical phases: Phase 0 to Phase 3 (see Figure 2.3).
This phased structure gives the customer natural decision points where they can choose whether to proceed to the next phase of activities.
2.2.6 PARCA framework structure

Gas Ten Year Statement November 2017 37C
hapter two
More information on the PARCA process is provided in Appendix 2 and on our website13.
Figure 2.3 PARCA framework phases
13 https://www.nationalgrid.com/uk/gas/connections/reserving-capacity-parca-and-cam
Phase 0
Phase 1Up to 6 months
Phase 2Up to 60 months
Phase 3Up to 24 months
Customer approaches National Grid for initial project discussions
National Grid confirm receipt of the application within two business days
National Grid will reserve the capacity on behalf of the customer (Reservation Date)
We will conduct network reinforcement if this is required
Informal assessment completed
National Grid provides formal acceptance of a competent application to the customer within six business days
National Grid initiate the Phase 2 Works
Capacity is delivered (Registration Date)
Customer submits PARCA application and PARCA application fee
National Grid initiate Phase 1 Works
Customer provides demonstration information and annual financial security
Within ten business days National Grid may trigger a PARCA Window and an ad hoc QSEC capacity auction
Where customer is a non-code party, nominates a User(s) at least one month prior to capacity allocation date
National Grid will issue the customer with the Phase 1 Output Report and the PARCA contract
National Grid formally allocate the capacity to the customer (Allocation Date)

Gas Ten Year Statement November 2017 38C
hapt
er t
wo
Network development inputs
In order to harmonise the development process for incremental capacity at Interconnection Points (IPs), new rules for incremental capacity have been included in the network code on Capacity Allocation Mechanism (CAM NC). An amended version has been approved by the EU Member States in October 2016 and the entry into force date was 6 April 2017.
The newly introduced process provides for several phases, certain requirements that need to be fulfilled before an incremental project can be initiated based on market demand and new capacity requirements.
2.2.7 Incremental capacity at Interconnection Points
Figure 2.4 Phases of releasing incremental capacity
Market Demand
Assessment
Article 26
Design Phase (consultation)
Article 27
NRA Approval
Article 28
Ascending Clock
Auctions
Article 29
Alternative Allocation
Mechanism
Article 30
Eco
nom
ic T
est
Art
icle
22
– 25
NON CAM PlanningDetailed Design
Construction

Gas Ten Year Statement November 2017 39C
hapter two• The market demand assessment will be
conducted in accordance with Article 26 of the Official Regulation (EU) 2017/459 of the amended CAM code, hereafter referred to as the CAM Code, and covers how the market will signal to TSOs a potential need for capacity beyond the unsold technical capacity available.
• The project design covers technical studies and a TSO led public consultation on the proposed incremental project.
• National Regulatory Authority (NRA) approval covers the finalisation of the project proposal followed by a NRA decision on whether the project goes ahead.
• The allocation mechanism can be via the standard annual yearly auctions at interconnection points (IPs), or an alternative mechanism can be proposed under the project design.
• National Grid intends to make use of the alternative mechanism to follow the existing Planning and Advanced Reservation of Capacity Agreement (PARCA) process as much as possible.
• Any allocation or reservation of capacity will be subject to an economic test.
• The CAM process does not cover rules for gaining planning consent or for construction. However, these remain a necessary part of the process for creating incremental capacity and are considered as part of the process rules where appropriate.
For more information on CAM visit https://www.gasgovernance.co.uk/Tx/061016

Gas Ten Year Statement November 2017 40C
hapt
er t
wo
Network development inputs
This section describes our views of gas demand and supply. We show how customers’ requirements have changed over the years, and how they may develop in the future.
Our Future Energy Scenarios (FES)14 are published every year, drawing on our own analysis and input from stakeholders across the energy industry. The scenarios are based on the energy trilemma (security of supply, sustainability and affordability) and provide credible pathways for the future of energy for GB out to 2050. This year our scenarios are Two Degrees, Slow Progression, Steady State and Consumer Power. Since last year the scenario names Gone Green and No Progression have been retired. Gone Green has substantially changed since we first launched FES in 2011. It has been renamed Two Degrees to reflect its focus on all forms of low carbon energy, rather than solely renewables. Two Degrees is built to show a cost-optimal pathway to meet the UK’s
2050 carbon emissions reduction targets. The name reflects the ambition of restricting global temperature rise to below two degrees Celsius above pre-industrial levels, as set out in the Paris Agreement15. No Progression has been renamed Steady State as your comments suggested that No Progression implied no movement. Steady State represents a world where current levels of progress and innovation continue. The scenario matrix is shown in Chapter 1, Figure 1.1.
In this chapter we are not repeating the detailed description of gas demand and supply scenarios that is available in our FES publication. Instead we show the high and low cases for both demand and supply along with a brief commentary highlighting some of the implications. We also only show results as far as 2035 rather than 2050, as this period is of the greatest relevance to decisions that need to be taken on the gas network today. Our Charts Workbook gives full details of gas supply and demand for our scenarios.
2.3 Future Energy Scenarios
14 http://fes.nationalgrid.com/15 http://unfccc.int/paris_agreement/items/9485.php
Gas Ten Year Statement November 2017 41C
hapter two
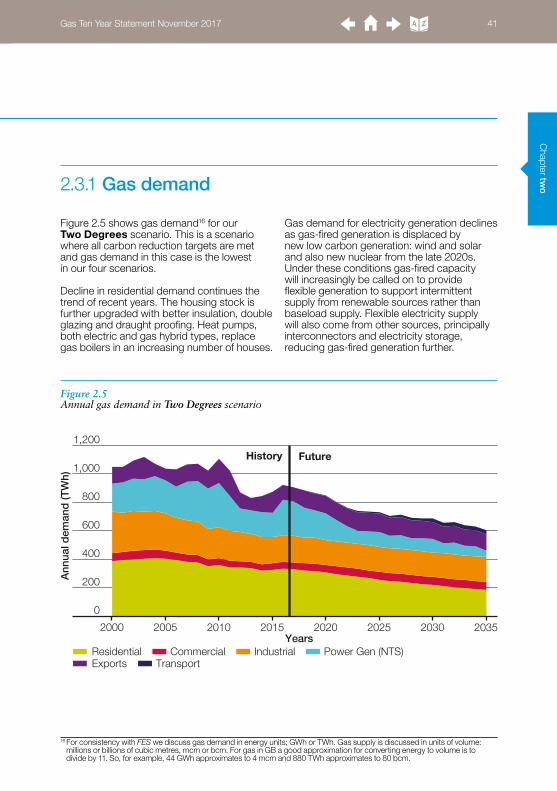
Figure 2.5 shows gas demand16 for our Two Degrees scenario. This is a scenario where all carbon reduction targets are met and gas demand in this case is the lowest in our four scenarios. Decline in residential demand continues the trend of recent years. The housing stock is further upgraded with better insulation, double glazing and draught proofing. Heat pumps, both electric and gas hybrid types, replace gas boilers in an increasing number of houses.
Gas demand for electricity generation declines as gas-fired generation is displaced by new low carbon generation: wind and solar and also new nuclear from the late 2020s. Under these conditions gas-fired capacity will increasingly be called on to provide flexible generation to support intermittent supply from renewable sources rather than baseload supply. Flexible electricity supply will also come from other sources, principally interconnectors and electricity storage, reducing gas-fired generation further.
2.3.1 Gas demand
16 For consistency with FES we discuss gas demand in energy units; GWh or TWh. Gas supply is discussed in units of volume: millions or billions of cubic metres, mcm or bcm. For gas in GB a good approximation for converting energy to volume is to divide by 11. So, for example, 44 GWh approximates to 4 mcm and 880 TWh approximates to 80 bcm.
Figure 2.5 Annual gas demand in Two Degrees scenario
Ann
ual d
eman
d (T
Wh)
Years
0
1,000
800
600
400
200
1,200
2000 2005 2010 2015 2020 2025 2030 2035
ResidentialExports Transport
Commercial Industrial Power Gen (NTS)
History Future

Gas Ten Year Statement November 2017 42C
hapt
er t
wo
Network development inputs
Figure 2.6 Annual gas demand in Steady State scenario
Our Steady State scenario has the highest gas demand, shown in Figure 2.6. In this scenario there is very little green ambition, and carbon reduction targets are not met. There is very little further roll-out of heat pumps in the residential market, and demand
in this sector shows little further decline. Development of new low carbon generation is less ambitious than in Two Degrees and an increase in gas-fired generation is needed in the late 2020s to cover delays in building new nuclear capacity.
Ann
ual d
eman
d (T
Wh)
0
1,000
800
600
400
200
1,200
2000 2005 2010 2015 2020 2025 2030 2035Years
ResidentialExports Transport
Commercial Industrial Power Gen (NTS)
History Future

Gas Ten Year Statement November 2017 43C
hapter two
Figure 2.7 Peak gas demand for all scenarios
Peak daily demandWe calculate peak day gas demand for Great Britain as a whole under 1-in-20 weather conditions; broadly speaking, the severity of weather that might be expected once every 20 years. Figure 2.7 shows the peak demand for all four scenarios. Peak demands follow the same pattern from year to year as the annual demands, but you can see that the peak
demand in Two Degrees does not decline by as much as the annual demand; peak falls by 27% while annual falls by 44%. The difference is largely due to the treatment of gas-fired generation; gas-fired stations have a low load factor in Two Degrees, meaning that their annual demand declines markedly over time, but all available stations will be generating at peak.
TW
h/ye
ar
0
5,000
6,000
3,000
4,000
2,000
1,000
7,000
2017 2019 2021 2023 2025 2027 2029 2031 2033 2035Years
Steady State Consumer PowerTwo Degrees Slow Progression

Gas Ten Year Statement November 2017 44C
hapt
er t
wo
Network development inputs
Figure 2.8 Annual supply pattern in Two Degrees scenario
The pattern of gas supply in GB has changed dramatically in the past 15 years. We have gone from being self-sufficient in gas in 2000 to being dependent on imported gas for around half of our needs in 2016. Production from the UK Continental Shelf (UKCS) declined from 95bcm in 2000 to 35bcm in 2016. This has been replaced with gas from Norway, continental Europe, and the world market (delivered as liquefied natural gas [LNG]). We can expect a similarly large change looking forward. Over the next 20 years, the UKCS will continue to decline. In some scenarios we consider the development of other indigenous sources: shale gas, biomethane and bio-substitute natural gas (bioSNG). Some of these may connect either to the NTS or to the distribution networks. In three out of four scenarios imported gas will become even more important. To demonstrate the high and low cases for gas supply we have chosen to show Two Degrees and Consumer Power.
Two Degrees, shown in Figure 2.8, has the lowest gas demand. In this world our green ambition drives investment in renewable and sustainable technologies. There is little incentive for maximising production from the UK Continental Shelf (UKCS) and no support for shale gas. On the other hand, biomethane and bioSNG, shown together on the chart as Green Gas, both feature in this scenario, though the total volume is still small, reaching about 4bcm in 2035.
The top of the supply stack in both Figure 2.8 and Figure 2.9 is labelled Generic Imports. This is gas which could be LNG or continental gas or a mixture. This approach effectively provides ranges for LNG and continental gas imports in each scenario.
2.3.2 Gas supply
Annu
al s
uppl
y (b
cm)
Year
0
100
80
60
40
20
120
Impo
rt de
pend
ency
(%)
0
90
80
70
60
40
30
50
20
10
100
2000 2005 2010 2015 2020 2025 2030 2035
UKCSGeneric Imports
Shale Green Gas Norway Continent LNGImport Dependency
History Future

Gas Ten Year Statement November 2017 45C
hapter two
Figure 2.9 Annual supply pattern in Consumer Power scenario
Consumer Power, shown in Figure 2.9, has high gas demand. Government policies are focused on indigenous energy supply, so both UKCS and shale development are at their highest. Due to limited green ambition, there
is little further development of biomethane over today’s level. With the highest indigenous supply, this is the scenario with the lowest import dependency.
Annu
al s
uppl
y (b
cm)
Year
0
100
80
60
40
20
120
Impo
rt de
pend
ency
(%)
0
90
80
70
60
40
30
50
20
10
100
2000 2005 2010 2015 2020 2025 2030 2035
UKCSGeneric Imports
Shale Green Gas Norway Continent LNGImport Dependency
History Future

Gas Ten Year Statement November 2017 46C
hapt
er t
wo
Network development inputs
Figure 2.10 Peak supply margin under N-1 conditions
Peak supplyWe assess peak gas demand against the supply capacity of the full range of supplies. For many years this analysis has shown that supply capacity is well in excess of peak demand. For a more stringent test we also assess whether peak demand could still be met if the single largest piece of supply infrastructure fails, known as the N-1 test. In all scenarios this represents losing supply from both LNG terminals at Milford Haven,
a loss of 86mcm/day. Figure 2.10 shows the margin of peak supply over peak demand under N-1 conditions. The closure of the Rough long-range storage facility, described in the next section, has meant that in Steady State, with its high gas demand and moderate supply, the N-1 margin comes close to zero in the late 2020s. If gas supply and demand develops in line with Steady State, suppliers may need to consider some new infrastructure. We discuss infrastructure in the next section.
Mar
gin
(mcm
/day
)
0
50
100
150
2015 2020 2025 2030 2035Years
Steady State Consumer PowerTwo Degrees Slow Progression

Gas Ten Year Statement November 2017 47C
hapter two
StorageSome medium-range storage has been developed in the last three years, but the economics, and particularly the winter to summer price spread, are very challenging for the development of new storage sites. Nevertheless, many new storage sites have been proposed over the last ten years and there are currently plans for nearly 9bcm of space, both for medium-range fast-cycle facilities and for long-range seasonal storage. Details of existing and proposed storage sites are provided in Appendix 4.
There was only one long-range storage site in GB: a depleted gas field, Rough, off the coast of Yorkshire. The capability of the site was reduced in 2015, while investigations were carried out into the condition of the wells used for injecting and withdrawing gas. In June 2017 after two years of testing and remediation the owners, Centrica Storage, announced the permanent closure of the site as a storage facility. For more details please see the Centrica Storage website17.
ImportsThe UK has a diverse set of import options with pipelines from Norway, the Netherlands, Belgium and from other international sources in the form of LNG. There are currently no plans for increased pipeline interconnection. Details of existing and proposed LNG sites and existing interconnectors are given in Appendix 4.
2.3.3 Supply infrastructure
17 http://www.centrica-sl.co.uk/news/permanent-cessation-storage-operations-1
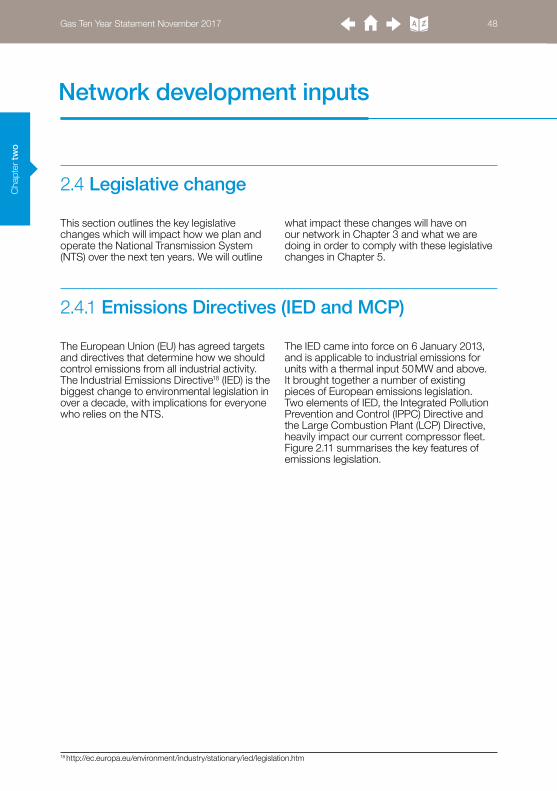
Gas Ten Year Statement November 2017 48C
hapt
er t
wo
Network development inputs
The European Union (EU) has agreed targets and directives that determine how we should control emissions from all industrial activity. The Industrial Emissions Directive18 (IED) is the biggest change to environmental legislation in over a decade, with implications for everyone who relies on the NTS.
The IED came into force on 6 January 2013, and is applicable to industrial emissions for units with a thermal input 50 MW and above. It brought together a number of existing pieces of European emissions legislation. Two elements of IED, the Integrated Pollution Prevention and Control (IPPC) Directive and the Large Combustion Plant (LCP) Directive, heavily impact our current compressor fleet. Figure 2.11 summarises the key features of emissions legislation.
This section outlines the key legislative changes which will impact how we plan and operate the National Transmission System (NTS) over the next ten years. We will outline
what impact these changes will have on our network in Chapter 3 and what we are doing in order to comply with these legislative changes in Chapter 5.
2.4.1 Emissions Directives (IED and MCP)
18 http://ec.europa.eu/environment/industry/stationary/ied/legislation.htm
2.4 Legislative change
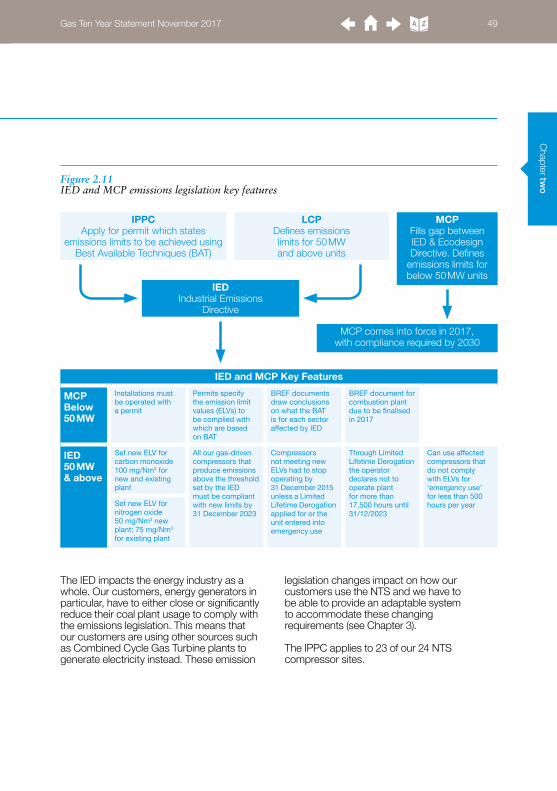
Gas Ten Year Statement November 2017 49C
hapter twoFigure 2.11
IED and MCP emissions legislation key features
The IED impacts the energy industry as a whole. Our customers, energy generators in particular, have to either close or significantly reduce their coal plant usage to comply with the emissions legislation. This means that our customers are using other sources such as Combined Cycle Gas Turbine plants to generate electricity instead. These emission
legislation changes impact on how our customers use the NTS and we have to be able to provide an adaptable system to accommodate these changing requirements (see Chapter 3).
The IPPC applies to 23 of our 24 NTS compressor sites.
IPPCApply for permit which states
emissions limits to be achieved using Best Available Techniques (BAT)
IEDIndustrial Emissions
Directive
MCPFills gap between IED & Ecodesign Directive. Defines
emissions limits for below 50 MW units
MCP comes into force in 2017, with compliance required by 2030
LCPDefines emissions limits for 50 MW and above units
IED and MCP Key Features
MCPBelow50 MW
Installations must be operated with a permit
Permits specify the emission limit values (ELVs) to be complied with which are based on BAT
BREF documents draw conclusions on what the BAT is for each sector affected by IED
BREF document for combustion plant due to be finalised in 2017
IED50 MW & above
Set new ELV for carbon monoxide 100 mg/Nm3 for new and existing plant
All our gas-driven compressors that produce emissions above the threshold set by the IED must be compliant with new limits by 31 December 2023
Compressorsnot meeting new ELVs had to stop operating by 31 December 2015 unless a Limited Lifetime Derogation applied for or the unit entered into emergency use
Through Limited Lifetime Derogation the operator declares not to operate plant for more than 17,500 hours until 31/12/2023
Can use affected compressors that do not comply with ELVs for ‘emergency use’ for less than 500 hours per yearSet new ELV for
nitrogen oxide 50 mg/Nm3 new plant; 75 mg/Nm3 for existing plant

Gas Ten Year Statement November 2017 50C
hapt
er t
wo
Network development inputs
The LCP Directive applies to 16 of our 64 gas turbine driven compressor units. Details of what we are doing to adapt our sites to comply with this legislation are outlined in Chapter 5.
The IED legislation forms the new mandatory minimum emission standards that all European countries must comply with by 2023.
For units with a thermal input from 1 MW to below 50 MW, the Medium Combustion Plant (MCP) Directive will apply. This is currently draft legislation, which needs to be ‘in force’ by 1 January 2018 and is expected to be transposed into UK legislation by 19 December 2017. Based on the current draft legislation we anticipate that 26 compressor units may be non-compliant and 41 units in total will be affected.
The following sections summarise the main elements of IED and MCP which impact upon our compressor fleet. More detail about what we are doing to comply with these legislative changes along with maps highlighting which compressor sites are affected are provided in Chapters 3 and 5.
Integrated Pollution Prevention and Control (IPPC) DirectiveThe IPPC19, implemented in 2008, states that any installation with a high pollution potential (e.g. oxides of nitrogen (NOx) and carbon monoxide (CO)) must have a permit to operate.
To obtain a permit we must demonstrate that Best Available Techniques (BAT, see below for more information) have been employed on the permitted installation to prevent/reduce emitting these pollutants by means of an assessment. These BAT assessments provide a balance between costs and the environmental benefits of the options considered.
We have to ensure that all of our compressor installations covered by the regime have a permit. These permits will specify the maximum Emission Limit Values (ELVs) for each unit,
along with other operating conditions.We are currently working on three compressor sites in order to ensure compliance with the IPPC Directive. Further information on these works can be found in Chapter 5.
The utilisation of National Grid’s compressor installations varies greatly across the fleet. Consequently environmental benefits can be maximised if a network-wide approach is employed, focusing on high utilisation installations (in order, for example, to maximise reduction of total mass emissions within the UK) with due consideration given to potential local environmental impacts.
This network-wide approach is described in the annual Network Review which is carried out by National Grid NTS to review all emissions from compressor sites. The findings are discussed and agreed with the Environmental Agency (EA), Natural Resources Wales (NRW) and the Scottish Environment Agency (SEPA). Further information and a copy of the Network Review may be obtained from the environment agencies.
BAT Reference documentsBAT Reference (BREF) documents20 have been adopted under both the IPPC Directive and IED. The BREF documents outline:• techniques and processes currently used
in each sector• current emission levels• techniques that should be implemented
by each sector as BAT• emerging techniques to comply with
the legislation.
The BAT conclusions drawn from the BREF documents will outline the permit conditions for each non-compliant unit.
The BREF document for large combustion plants was issued by the European Commission in August 2017. From this date of finalisation we will have four years to implement the conclusions.
19 http://eur-lex.europa.eu/legal-content/EN/TXT/?uri=URISERV:l2804520 http://eippcb.jrc.ec.europa.eu/reference

Gas Ten Year Statement November 2017 51C
hapter twoLarge Combustion Plant (LCP) Directive
The LCP Directive21, implemented in 2001, applies to all combustion plants with a thermal input of 50 MW or more. All of our compressor units that fall within the LCP Directive must meet the ELVs defined in the directive. The ELVs are legally enforceable limits of emissions to air for each LCP unit. ELVs set out in the directive can be met in one of two ways:1 Choose to opt in – must comply with the
ELV or plan to upgrade to comply by a pre-determined date.
2 Choose to opt out – must comply with restrictions defined in the derogation including Limited Lifetime Derogation or the Emergency Use Derogation.
Limited Lifetime DerogationIn the IED it states that from January 2016 to 31 December 2023 a combustion plant may be exempt from compliance with the ELVs for plants 50 MW and above provided certain conditions are fulfilled:• the operator makes a declaration before
1 January 2014 not to operate the plant for more than 17,500 hours starting from 1 January 2016 and ending no later than 31 December 2023
• the operator submits each year a record of the number of operating hours since 1 January 2016
• the ELVs set out in the permits as per the IPPC Directive are complied with.
We have already made the declaration above and have been allowed to use this derogation for our current affected units.
Emergency use provisionThe IED includes the possibility of using plant for emergency use:“ Gas turbines and gas engines that operate less than 500 operating hours per year are not covered by the emission limit values set out in this point. The operator of such plant shall record the used operating hours.”
This means that we may be able to use our non-compliant compressor units for 500 hours or less each calendar year.
Further information on our compliance with LCP can be found in Chapters 3 and 5.
Medium Combustion Plant (MCP) DirectiveThe Medium Combustion Plant Directive (MCP) will be transposed into UK legislation by 19 December 2017. During 2015 the MCP Directive was finalised at a European level. The derogation for gas-driven compressors was originally 2025. National Grid has secured a longer derogation for gas compressors that are required to ensure the safety and security of a national gas transmission system, which now have a further five years (to 2030) to comply with the requirements.
The MCP Directive applies to smaller gas compressors and will affect a further 41 of the NTS compressor units. Other combustion plants, such as pre-heat systems, are also captured as part of this directive. During 2016/17 we have undertaken an audit of this plant type to develop mitigation plans.
21 http://eur-lex.europa.eu/legal-content/EN/TXT/?URISERV:I28028

Gas Ten Year Statement November 2017 52C
hapt
er t
wo
Network development inputs
Figure 2.12 Legislation timelines
2013 2014 20152016 2018 20192013 2014 2016 2018 2019 2021 2022 2023 2024 2025 2026 2027 2028 2029 2030
6 January 2013IED came into force
Mid-2021Likely time by which the MCP will come
into force
2030MCP Derogation finishes for NTS
compressors
1 January 2014Make declaration to comply with requirements of Limited Lifetime
Derogation
2015Compressors not meeting new ELVs
must stop operating
2017BREF for combustion plants expected to be
implemented
2020Expected date by when
member states must comply with the provisions of BREF
for combustion plants
19 December 2017Time by which the
MCP to be transposed into UK legislation
6 January 2016Limited Lifetime
Derogation commences
31 December 2023Limited Lifetime
Derogation finishes
2017201720152015 20202020
Following the UK’s referendum result on EU membership in June 2016, National Grid notes that EU rules and regulations will continue to apply in the UK until such time as the UK’s membership of the EU is withdrawn. National Grid is engaging with both the Government and Ofgem to understand the impact of the UK exit from the EU on the implementation of future EU energy market requirements. National Grid will continue to take forward implementation of EU requirements while the terms of the future UK relationship with the EU, including the Internal Energy Market, are defined.
European Union Third PackageOne of the most important pieces of European gas and electricity markets legislation is referred to as the Third Package. This was transposed into law in Great Britain (GB) by regulations that came into force in 2011.
The Third Package creates a framework to promote cross-border trade and requires a number of legally binding Guidelines and Network Codes to be established and implemented with the aim of: promoting liquidity, improving integration between Member States’ gas markets and promoting the efficient use of interconnectors to ensure that gas flows according to price signals, i.e. to where it is valued most.
2.4.2 Other legislation

Gas Ten Year Statement November 2017 53C
hapter twoThese EU legislative requirements take
priority over GB domestic legislation and associated regulations and codes, including the Uniform Network Code (UNC). We, as the Transmission System Operator, have raised a series of EU related UNC Modifications to comply with the legislation.
The focus to date has been on:a Commission Decision on amending
Annex I to Regulation (EC) No 715/2009 on conditions for access to the natural gas transmission networks [2012/490/EU, 24/08/2012]; (Congestion Management Procedures (CMP)). This specifies rules to ensure booked capacity at Interconnection Points is used efficiently to address issues of contractual congestion in transmission pipelines.
b Commission Regulation (EU) No 984/2013 of 14 October 2013 establishing a Network Code on Capacity Allocation Mechanisms in Gas Transmission Systems and Supplementing Regulation (EC) No 715/2009; and CAM. This seeks to create more efficient allocation of capacity at the Interconnection Points between adjacent Transmission System Operators. CAM introduced the revised 05:00-05:00 Gas Day arrangements at Interconnection Points.
c Commission Regulation (EU) No 312/2014 of 26 March 2014 establishing a Network Code on Gas Balancing of Transmission Networks; (BAL). This includes network-related rules on nominations procedures at Interconnection Points, rules for imbalance charges and rules for operational balancing between Transmission System Operators. This also reflects the new Gas Day arrangements that are applicable across the GB balancing zone via this code. It applied in Great Britain from 1 October 2015.
d Commission Regulation (EU) No. 703/2015 of 30 April 2015 establishing a Network Code on Interoperability and Data Exchange Rules. This obliges Transmission System Operators to implement harmonised operational and technical arrangements in order to remove perceived barriers to cross-border gas flows and thus facilitate EU market integration. Implemented 1 May 2016.
e Commission Regulation (EU) 2017/240 of 16 March 2017 establishing a Network Code on Harmonised Transmission Tariff Structures for Gas (TAR). This introduces increased transparency of transmission tariff structures with a transparent reference price methodology that ensures a reasonable level of cost reflectivity and predictability but that also allows certain discounts to apply that facilitate security of supply and system flexibility.
f Amendment to CAM (Commission Regulation (EU) 2017/459). This introduces, for interconnection points only, a process for the release of incremental capacity, a process for capacity conversion, and amendments to the auction timetable. Further legislative elements of the EU third package concern energy market integrity and transparency. This was taken forward by Regulation (EU) 1227/2011 and Regulation (EU) 1348/2014 (commonly known as REMIT and the REMIT Implementing Regulation respectively).
For more information on our activity to date and our future activity to comply with third package EU legislation see Appendix 5.

Gas Ten Year Statement November 2017 54C
hapt
er t
wo
Network development inputs
Asset health is a becoming a more frequent trigger to our NDP. This section explores asset maintenance and our asset health programme, from identification of an issue, through to resolution. The NTS comprises 7,600 km of pipeline, 24 compressor sites with 75 compressor units, 20 control valves and 530 above-ground installations (AGIs). Of these assets approximately 70% of pipelines and 77% of our other assets will be over 35 years old at the end of RIIO-T1.
Over RIIO-T1 we are planning to invest £660m of capital expenditure in maintaining the health of our network to continue to deliver a safe and reliable network for our customers.
We have developed our asset maintenance and asset health programmes in order to maintain the health of the National Transmission System (NTS). Our asset maintenance programme focuses on delivering routine maintenance and monitoring the health of our assets versus our expected asset life cycles. The asset health programme addresses assets that are either end of life or have failed, typically through more invasive works such as replacement or refurbishment. These programmes ensure that we can consistently deliver a safe and reliable system to meet our customers’ and stakeholders’ needs.
Through our RIIO price control arrangements we report on the health of the NTS. Network Output Measures (NOMs) are used as a proxy for measuring the health and thus level of risk on the network. We must meet specific targets which are related to the condition of the NTS and this means that asset health is a key RIIO measure in terms of allowances and output. The targets we have been set cover an eight-year period (RIIO-T1) from 2013 to 2021.
Our asset health plans, in aggregate, meet the target set out in our RIIO price control. However, as we have ramped up asset investment in our ageing network, we have found the actual observed condition of our network is at a lower level than the modelled view of our assets used within the current NOMs methodology. As a result, we are planning a higher level of investment to manage network risk over the regulatory period than we had originally forecast.
Although we meet the NOMS target in aggregate, we are forecasting to fall short of target in some asset categories but to exceed target in other categories where we need to invest more to address network risk. We are confident that our asset health programme is appropriately addressing asset health issues on our network and that it is in the interests of consumers.
In order to ramp up replacement and refurbishment of our assets, we have implemented a programme of works to resolve current asset issues as efficiently as possible while minimising disruption to our customers. By bundling similar work together, either by site or asset type, we have been able to accelerate our work delivery to maintain the health of the network. Our asset health programme comprises a number of campaigns which are outlined in further detail later in this chapter.
2.5 Asset health

Gas Ten Year Statement November 2017 55C
hapter two
We manage the assets that make up the NTS against 47 asset categories. Our asset maintenance strategy takes into account the likely failure modes of the asset families and the consequences should we lose functionality. This consideration leads to decisions on the type of intervention and triggers for maintenance activity.
By forecasting the usage of our assets and the condition we expect them to be in throughout their lifecycle we can plan, monitor and react to their maintenance requirements.Examples of application of the strategy are: • Pipelines – Risk-based inspection driven
by considering pipeline condition, criticality, and performance of corrosion prevention.
• Instrumentation – Criticality-based, intelligent condition monitoring or performance testing.
• Electrical – Scheduled inspections and failure-finding functional checks.
• Compressors – Condition monitoring, functional checks, scheduled inspections and usage-based inspections.
• Valves – Criticality based interval inspection and performance testing.
• Above Ground Installations (AGIs) – Time-based visual inspection and functional checks.
We have processes in place to collate asset health issues whether identified through maintenance or identified through performance indicators or observations.
Some of the issues identified can be resolved by the maintenance teams while others are more complex to resolve and are handled through our NDP. We carefully consider what priority is given to the resolution of issues.
This prioritisation process is represented in our regulatory reporting using a risk matrix shown in figure 2.13. This uses the health of the asset to represent the likelihood of loss of function and criticality to represent the impact of that loss.
2.5.1 Asset maintenance
Figure 2.13 Asset replacement priority matrix
Asset Health Scores
Replacement Priority Matrix
AH1 New or as newAH2 Good or serviceable conditionAH3 Deterioration, requires assessment or monitoringAH4 Material deterioration, intervention requires considerationAH5 End of serviceable life, intervention required
AH1 AH2 AH3 AH4 AH5C1 RP4 RP3 RP2 RP1 RP1C2 RP4 RP3 RP2 RP1 RP1C3 RP4 RP3 RP2 RP2 RP1C4 RP4 RP3 RP2 RP2 RP1
C1 Very HighC2 HighC3 MediumC4 Low
Criticality
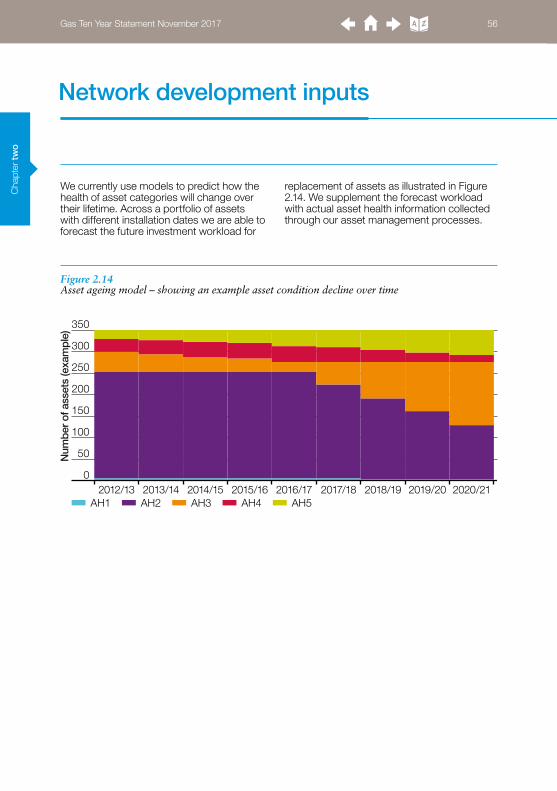
Gas Ten Year Statement November 2017 56C
hapt
er t
wo
Network development inputs
Figure 2.14 Asset ageing model – showing an example asset condition decline over time
We currently use models to predict how the health of asset categories will change over their lifetime. Across a portfolio of assets with different installation dates we are able to forecast the future investment workload for
replacement of assets as illustrated in Figure 2.14. We supplement the forecast workload with actual asset health information collected through our asset management processes.
0
Num
ber
of a
sset
s (e
xam
ple
)
50
100
200
150
300
250
350
2015/16 2016/17 2017/18 2018/19 2019/20 2020/212014/152012/13 2013/14AH1 AH2 AH3 AH4 AH5

Gas Ten Year Statement November 2017 57C
hapter two
During 2015/16 we built a catalogue of known asset condition issues which will be addressed by the asset health campaigns within the next five years. In 2016/17 we have increased the delivery of our asset health works in order to manage network risk. This increased delivery has been enabled by the surveying and planning work undertaken in the initial years of RIIO-T1 and the establishment of asset health campaigns to drive an increase in efficient project delivery and workload.
We continually review our asset health investment plans and will look to adjust our plans as we gain further understanding of the health of our assets and associated network risk to ensure that we deliver the network required by our customers.
During 2016/17 we have identified additional work at our Bacton and St Fergus terminal sites. These sites are key strategic sites on the NTS and require significant asset investment to ensure continued safe and reliable operation.
Figure 2.15 illustrates the increase in volume of open plant status issues (PSIs) that have been collected into our register through more rigorous application of our collation process.
Minor asset issues can be resolved outside of our NDP, however where multiple options are being considered to resolve the asset issue our NDP may be used to critically assess the options.
2.5.2 The asset health campaign
Figure 2.15 Cumulative volume of open PSIs and total PSIs raised
Cum
ulat
ive
volu
me
of o
pen
PSIs
Year
0
7,000
6,000
5,000
4,000
2,000
3,000
1,000
8,000
2004 2005 2006 2007 2008 2009 2010 2011 2012 2013 2014 2015 2016 2017
Cumulative Open PSIs Total PSIs raised

Gas Ten Year Statement November 2017 58C
hapt
er t
wo
Campaign deliveryWe have examined the most appropriate approach to complete all of the investments required to manage the asset health risk, taking into account efficient spend and minimising disruption to gas consumers.
Our revised campaign approach retains elements of geographic co-ordination but now bundles investment by work type to maximise the opportunity for cost saving.
Asset health and NDPBy using our NDP to resolve an asset health issue we are able to reach the most efficient and effective solution. We start with a stakeholder engagement workshop to establish a range of options which could address the asset need. We then explore the advantages and disadvantages of the options and align them to the Whole Life Prioritisation Matrix (WLP). This process narrows down the range of options for more detailed assessment.
The Establish Portfolio stage of the NDP, as described in Chapter 5, explores the asset investment options we consider to resolve asset health issues. When looking at asset investment options we not only look at the impact on NTS capability and operation, we also look at the impact on other projects and governance obligations such as to the Health and Safety Executive (HSE) and the Department for Business, Energy and Industrial Strategy (BEIS).
We expect each of the asset health deliveries throughout the campaign to follow our NDP. Depending on the asset type and location it may be assessed individually or collectively.
Asset health campaign challenges The network section approach to asset health works can result in system access challenges as some assets will need to be taken offline to complete the required work. In order to manage this temporary impact on our network the programme of works will be designed to minimise disruption and will not affect our ability to provide a safe and reliable network.
Measuring asset health and risk During 2016/17 we have developed a new methodology for measuring and reporting the health of our assets. This new NOMs methodology proposal is based around a monetised risk approach and was submitted to Ofgem on 30 March 2017. By improving our understanding of asset failure modes and the consequences of failure, we can create a more accurate model of network risk and how we can mitigate that network risk through our asset management interventions.
We still have a number of elements to develop but our initial work has given us confidence that this will be a significant improvement in achieving the methodology objectives (of assessing network risk and prioritising network investment). Our attention now focuses on plans to develop the analytics capability for the methodology and our intention is to use this capability to support the development of our long term Asset Investment Programme. This will form our regulatory submission for the next price control period (RIIO-T2).
Network development inputs

Gas Ten Year Statement November 2017 59
Chapter threeSystem capability 60
Gas Ten Year Statement November 2017 59
Gas Ten Year Statement November 2017 60C
hapt
er th
ree
System capability
GTYS is published at the end of the annual planning cycle. We use GTYS to provide information on an annual basis to help you to identify connection and capacity opportunities on the NTS. We summarise key projects,
changes to our internal processes that may impact you, and other key publications which provide further information on our System Operator activities.
This section outlines the current system capability of the National Transmission System (NTS). Information is provided for entry and exit capacity and the impact of the Industrial Emissions Directive (IED). This chapter explores the Need Case stage of the Network Development Process (NDP), which we use to establish NTS capability requirements.
Key insights
• We continue to provide information about lead times and capacity across different geographical areas and we aim to make our GTYS and our other publications more relevant to your needs.
• Overall Distribution Network (DN) flat capacity requests are falling. However, overall flex requests are increasing across the network.
• The impact of legislative change, particularly the IED, continues to challenge how we develop our network and improve our investment approach.
Gas Ten Year Statement November 2017 61C
hapter three
System capability and the development of the National Transmission System (NTS) is managed through the Network Development Process (NDP) which we introduced in Chapter 1. Following on, Chapter 2 explored some of the triggers for this process.
This chapter describes what happens once we receive a ‘trigger’ and we enter the Need Case stage of the NDP. This is where we analyse the NTS’s capability requirements.
Included within this chapter are:• customer entry and exit capacity processes.• capability requirements triggered by
the IED.
Understanding our system capability allows us to determine where rules, tools or asset solutions need to be found to meet our customer requirements.
3.1 Introduction
Gas Ten Year Statement November 2017 62C
hapt
er th
ree
Defining the ‘Need Case’ is the process through which we understand the implications of a change. We assess the level of risk to the NTS which allows us to determine the most credible method of addressing that risk. We articulate the cause of the problem or driver (the ‘trigger’) and consider any potential secondary drivers. This allows us to ensure we consider all opportunities and deliver the most efficient option.
An example of this could be a site with immediate asset health investment requirements. When assessing the health investment we would also consider rationalising the site to remove redundant equipment and incorporate the network future requirements. We ask ourselves the following questions: What do we repair? What do we replace? What do we enhance? This allows us to make the most efficient longer term investments and reduce the chance of stranded assets i.e. assets that are no longer required.
National Grid undertakes the role of System Operator (SO) for the NTS in Great Britain. Gas SO incentives are designed to deliver financial benefits to the industry and consumers by reducing the cost and minimising the risks of balancing the system.
Under RIIO, we are incentivised to think about Total Expenditure (TOTEX) as well as Capital Expenditure (CAPEX) and we need to demonstrate good value for money. We therefore focus on the need of the SO when considering asset and non-asset solutions. Our NDP allows us to articulate the change in risk of different options and present the SO need, both now and in the future.
We initially look at the ‘Counterfactual’ option. This is the minimum action we could take ensuring compliance with relevant legislation. This may mean no investment or the minimum investment on a like-for-like basis to ensure safety and licence requirements are met. The change in risk is calculated and used to support the optioneering phase; these could be rules, tools or assets. Each option would then be assessed and either discounted if not feasible or fed into the Cost Benefit Analysis.
3.2 NDP – Defining the Need Case
System capability

Gas Ten Year Statement November 2017 63C
hapter three
Understanding our customers’ gas demand (exit capacity) requirements across the NTS allows us to plan and operate our system efficiently and effectively. When we receive an exit capacity request we analyse our current system to assess what impact an increase in demand has on the current system capability. This allows us to identify and plan for any geographical constraints which may arise from increasing customer exit capacity demand in a particular area of the NTS. Where constraints to current system capability are encountered we use the NDP to identify options to meet our customers’ needs in the most cost effective and efficient way.
The following section provides Shippers, Distribution Network Operators (DNOs) and developers with information about the lead time for providing NTS entry and exit capacity. If unsold NTS exit (flat) capacity is available at an existing exit point then it can be accessed through the July application process for the following winter.
The obligated capacity level, less any already sold, is the amount of capacity that we make available through the application and auction processes. We can increase capacity above the obligated levels when system capability allows, through substitution and via funded reinforcement works.
If we identify reinforcement works or increased operational risk, we investigate substituting unsold capacity. Capacity substitution involves moving our obligation to make capacity available from one system point to another. This is intended to avoid the unnecessary construction of new assets (further information on substitution is available in the Transmission Planning Code (TPC)22 and via the methodology statements23).
If substitution is not possible, we will consider whether a Need Case has been triggered and hence reinforcement works and contractual solutions will be investigated. Works on our existing sites, such as modification of compressors and above-ground installations (AGIs) may not require planning permission. This may result in shorter lead times. Significant new pipelines require a Development Consent Order (DCO), as a consequence of The Planning Act (2008). This can result in capacity lead times of 72 to 96 months. Construction of new compressor stations may also require DCOs if a new high-voltage electricity connection is needed and, subject to local planning requirements, may require similar timescales to pipeline projects.
3.3 Customer capacity – exit
Figure 3.1 Capacity leadtimes
If capacity can be made available:
<36 months 36 months >36 months
without investment, for example by a contractual solution
with simple medium-term works or capacity substitution
with more significant reinforcement works, including new pipelines and compression
22 https://www.nationalgrid.com/uk/gas/charging-and-methodologies23 https://www.nationalgrid.com/uk/gas/charging-and-methodologies/methodologies

Gas Ten Year Statement November 2017 64C
hapt
er th
ree
System capability
The changing nature of gas demand in the UK over the last five to ten years, combined with our stakeholder engagement feedback, gives us an indication of how our customers may want to use the NTS in the future.
As levels of residential demand steadily decline, Distribution Network Operators (DNO) have reduced the level of embedded storage in their networks through their gas-holder closure programme. As a result,
they now increasingly rely on the use of NTS linepack to meet their required daily storage levels. DNOs signal their requirements for using NTS linepack by booking NTS exit (flexibility) capacity levels.
We have seen a steady increase in recent years in flex capacity being requested (see Figure 3.2). However due to the increase in risk to the operation of the NTS we cannot always accept the flex capacity requested.
Spotlight: Understanding flex capacity requests
Figure 3.2 NTS exit (flexibility) capacity bookings by DNOs
GW
h/d
ay
100
250
300
200
150
350
2010/11
2011/12
2012/13
2013/14
2014/15
2015/16
2016/17
2017/18
2018/19
2019/20
2021/22
2020/21
Years2011 Flex 2012 Flex 2013 Flex2009 Flex 2010 Flex2016 Flex2014 Flex 2015 Flex

Gas Ten Year Statement November 2017 65C
hapter three
The NTS exit capacity map (see Figure 3.3) divides the NTS into zones based on key compressor stations, and multi-junctions. Within these zones, any new connection and/ or capacity request is likely to either be met through substitution within the zone or by a similar reinforcement project. It is likely that substitution within a zone will be close to a 1 to 1 basis. These zones are purely for information and were created for the Gas Ten Year Statement (GTYS). All our substitution analysis is carried out to the substitution methodology statement rules and, while it is very likely that capacity will be substituted from within a zone, it is not guaranteed.
We have provided commentary explaining the potential capacity lead times and likelihood of substitution in each zone, including areas of sensitivity. This information is an indication and actual capacity lead times and availability will depend on the quantity of capacity requested from all customers within a zone and interacting zones. This information recognises the impact Electricity Market Reform (EMR) may have on interest in NTS connections and capacity.
3.3.1 NTS capacity map
Figure 3.3 NTS exit capacity map
!!
!
!
!
!
!
!
1
2
32.1
4 65 7
910 8
Leeds
London
Glasgow
Cardiff
Edinburgh
Newcastle
Manchester
Birmingham
Legend— Gas Pipeline— Gas Pipeline – Sensitive Area— Exit Capacity Area

Gas Ten Year Statement November 2017 66C
hapt
er th
ree
3.3.2 Available (unsold) NTS exit (flat) capacity region
System capability
Table 3.1 includes the quantities of unsold NTS exit (flat) capacity in each zone that could be used to make capacity available at other sites through exit capacity substitution. The table also shows how unsold capacity has changed since the publication of the 2016 Gas Ten Year Statement (GTYS).
Table 3.1 Quantities of unsold NTS exit (flat) capacity
Region Number
Region Obligated Unsold
(GWh/d) (GWh/d) % of unsold capacity % change from 2016 GTYS
1 Scotland & the North 718 140 19% 0%
2 North West & West Midlands (North)
1,110 403 36% +1%
2.1 North Wales & Cheshire 315 200 63% 0%
3 North East, Yorkshire & Lincolnshire
1,577 598 38% 0%
4 South Wales & West Midlands (South)
569 80 14% 6%
5 Central & East Midlands 281 134 48% 0%
6 Peterborough to Aylesbury 126 29 23% 0%
7 Norfolk 368 120 33% -1%
8 Southern 526 227 43% 0%
9 London, Suffolk & the South East
1,504 485 32% +1%
10 South West 461 85 18% +3%

Gas Ten Year Statement November 2017 67C
hapter three
Figure 3.4 Region 1 – Scotland and the North
Region 1 – Scotland and the North
NTS Location: North of Longtown and Bishop Auckland
NTS/DN exit zones: SC1, 2, 3, 4, NO1, 2
This region is sensitive to St Fergus flows.
High St Fergus flows mean exit capacity will be available. As St Fergus flows reduce, exit capacity will be constrained. There is only a small quantity of substitutable capacity in the area, but compressor flow modifications, including reverse flow capability, can be delivered to provide significant quantities of capacity without requiring Planning Act timescales. Capacity may be more limited in the sensitive area (feeder 10 Glenmavis to Saltwick) due to smaller diameter pipelines.
●
●
●
●
●
●
●
●
●
●
●
●
1
2 3
Longtown
BathgateGlenmavis
St Fergus
Kirriemuir
Bishop Auckland
Aberdeen
Inverness
Middlesbrough
GlasgowEdinburgh
Newcastle
Legend Key Sites
— Gas Pipeline— Gas Pipeline – Sensitive Area— Exit Capacity Area

Gas Ten Year Statement November 2017 68C
hapt
er th
ree
System capability
Figure 3.5 Region 2 – North West and West Midlands (North)
Region 2 – North West and West Midlands (North)
NTS Location: South of Longtown, north of Alrewas and east of Elworth
NTS/DN exit zones: NW1, WM1
The region is highly sensitive to national supply patterns and use of storage; this area was historically supplied with gas from the north but increasingly receives gas from the south and from the east across the Pennines.
The amount of unsold capacity in the region indicates that capacity could be made available by exit capacity substitution. A capacity request in zone 2 is likely to be met through substitution from zone 2, including zone 2.1, and then from the downstream zones, in this case zone 5. Capacity is likely to be available on the main feeder sections between Carnforth and Alrewas. Potential non-Planning Act reinforcements could release capacity, but then significant pipeline reinforcement would be required, particularly in the sensitive region around Samlesbury and Blackrod (North Lancashire and Greater Manchester).
●
●
●
●
●
●
●
●
●
●
●
●
●
●
●
2
2.1
4
5
3
Audley
Elworth
Alrewas
Blackrod
Longtown
Samlesbury
Wormington
Nether Kellet
Preston
Liverpool
Leeds
Newcastle
Manchester
Birmingham
Legend Key Sites
— Gas Pipeline— Gas Pipeline – Sensitive Area— Exit Capacity Area

Gas Ten Year Statement November 2017 69C
hapter three
Figure 3.6 Region 2.1 – North Wales and Cheshire
Region 2.1 – North Wales and Cheshire
NTS Location: West of Elworth and Audley (feeder 4)
NTS/DN exit zones: NW2, WA1
This is an extremity of the system with limited local supplies (Burton Point) but has a significant number of storage facilities.
The quantity of unsold capacity within the region indicates a good probability that capacity could be made available via exit capacity substitution, but this is from Direct Connect offtakes where the capacity could be booked. Potential non-Planning Act reinforcements could release small amounts of additional capacity, but significant pipeline reinforcement would be required, resulting in long (Planning Act) timescales.
●
●
●
●
●
●
●
●
●
●
●
●
●
●
●
2
2.1
4
5
3
Audley
Elworth
Alrewas
Blackrod
Longtown
Samlesbury
Wormington
Nether Kellet
Preston
Liverpool
Leeds
Newcastle
Manchester
Birmingham
Legend Key Sites
— Gas Pipeline— Gas Pipeline – Sensitive Area— Exit Capacity Area

Gas Ten Year Statement November 2017 70C
hapt
er th
ree
System capability
Figure 3.7 Region 3 – North East, Yorkshire and Lincolnshire
Region 3 – North East, Yorkshire and Lincolnshire
NTS Location: South of Bishop Auckland, north of Peterborough and Wisbech and east of Nether Kellet
NTS/DN exit zones: NE1, 2, EM1, 2
There are a number of power stations in this region and this may impact on future ramp rate agreements (the rate at which flows can increase at an offtake, as set out in the Network Exit Agreement – NExA).
The amount of unsold capacity in the region indicates that capacity could be made available through exit capacity substitution. Further capacity should be available without needing reinforcement, assuming stable north-east supplies; however, this may be limited on smaller diameter spurs, including Brigg.
Non-Planning Act reinforcements, including compressor modifications, could be carried out to make additional capacity available.
!
!
!
!
!
!
!
!
!
!
!
!
!(
!(
!(
!(
!(
!(
!(
!(
!(
!(
!(
3
4 6
5 7
Hatton
Audley
Elworth
Alrewas
Longtown
Easington
Huntington
Churchover
Wisbech E W
Nether Kellet
Bishop Auckland
Preston
Leicester
Cambridge
Sheffield
Nottingham
Northampton
Peterborough
Middlesbrough
Leeds
Newcastle
Manchester
Birmingham
Legend Key Sites
— Gas Pipeline— Gas Pipeline – Sensitive Area— Exit Capacity Area

Gas Ten Year Statement November 2017 71C
hapter three
Figure 3.8 Region 4 – South Wales and West Midlands South
Region 4 – South Wales and West Midlands South
NTS Location: West of Churchover
NTS/DN exit zones: WM3, SW1, WA2
Exit capacity availability is highly sensitive to Milford Haven flows. Low Milford Haven flows result in reduced South Wales pressures, which limit capacity. High Milford Haven flows result in reduced pressures in the West Midlands which may limit capacity.
The quantity of unsold capacity within the region indicates a limited quantity of capacity could be substituted. Potential non-Planning Act reinforcements could release small quantities of capacity, but significant pipeline reinforcement would be required, since the area south of Cilfrew is a sensitive area (shown in red) due to the different pressure ratings.
!
!
!
!
!
!
!
!
!
!
!
!
!
!
!
!
!
!(
!(
!(
!(
!(
!(
!(
!(
32.1
4
5
10
2
Audley
Elworth
Alrewas
Ilchester Lockerley
Wormington
Churchover
Herbrandston
Exeter
Oxford
SwindonSwansea
Bristol
Preston
Plymouth
Leicester
SheffieldLiverpool
Nottingham
Southampton
Bournemouth
Cardiff
Manchester
Birmingham
Legend Key Sites
— Gas Pipeline— Gas Pipeline – Sensitive Area— Exit Capacity Area

Gas Ten Year Statement November 2017 72C
hapt
er th
ree
System capability
Figure 3.9 Region 5 – Central and East Midlands
Region 5 – Central and East Midlands
NTS Location: South of Alrewas, north of Churchover, west of Wisbech
NTS/DN exit zones: EM3, 4, WM2
The unsold capacity here indicates a limited scope for substitution. Potential non-Planning Act reinforcements could be carried out to release a small amount of capacity, but significant pipeline reinforcement would be required, in particular for the sensitive area Austrey to Shustoke.
!
!
!
!
!
!
!
!
!
!
!
!
!
!
!
!
!
!
!
!(
!
!
!
!
!
!
!
!
3
4 6
5
7
108
Hatton
Audley
Elworth
Alrewas
Whitwell
Cambridge
Aylesbury
Easington
Wormington
Huntington
Churchover
Wisbech E W
Luton
Oxford
Reading
Bedford
Swindon
Leicester
Cambridge
Sheffield
Nottingham
Northampton
Peterborough
Milton Keynes
Leeds
London
Manchester
Birmingham
Legend Key Sites
— Gas Pipeline— Gas Pipeline – Sensitive Area— Exit Capacity Area

Gas Ten Year Statement November 2017 73C
hapter three
Figure 3.10 Region 6 – Peterborough to Aylesbury
Region 6 – Peterborough to Aylesbury
NTS Location: North of Aylesbury, south of Peterborough and Wisbech, west of Huntingdon
NTS/DN exit zones: EA6, 7
Capacity availability is sensitive to demand increases downstream in region 10, the South West. The quantity of unsold capacity indicates limited scope for exit capacity substitution from the single offtake in the region, but there may be scope for substitution from the southern region downstream of Aylesbury. Potential non-Planning Act reinforcements could be carried out to release capacity.
!
!
!
!
!
!
!
!
!
!
!
!
!
!
6
7
8
9
5
Whitwell
Cambridge
Aylesbury
Huntington
Churchover
Wisbech E W
Luton
Oxford
Bedford
Leicester
CambridgeNorthampton
Peterborough
Milton Keynes
Legend Key Sites
— Gas Pipeline— Gas Pipeline – Sensitive Area— Exit Capacity Area

Gas Ten Year Statement November 2017 74C
hapt
er th
ree
System capability
Figure 3.11 Region 7 – Norfolk
Region 7 – Norfolk
NTS Location: North of Diss and Cambridge, east of Wisbech
NTS/DN exit zones: EA1, 2, 3
The region is sensitive to South East demand; if demand increases in the South East, capacity may become more constrained.
Unsold capacity here indicates a good probability that capacity could be substituted. Additional capacity could be made available without reinforcement works, assuming stable Bacton supplies.
!
!
!
!
!
!
!(
!
!(
!(
!(
!(
!(
9
7Diss
Bacton
Hatton
Whitwell
Cambridge
Huntington
Wisbech E W
Luton
Ipswich
Norwich
Cambridge
Chelmsford
Peterborough
3
Legend Key Sites
— Gas Pipeline— Gas Pipeline – Sensitive Area— Exit Capacity Area

Gas Ten Year Statement November 2017 75C
hapter three
Figure 3.12 Region 8 – Southern
Region 8 – Southern
NTS Location: South of Aylesbury and north of Lockerley
NTS/DN exit zones: SO1, 2
The region is sensitive to demand in the South West; if demand increases, capacity may become more constrained. The amount of unsold capacity indicates a good chance that capacity could be made available via exit capacity substitution. Potential non-Planning Act reinforcements (compressor station modifications) could release a small amount of capacity.
!
!
!
!
!
!
!
!
!
!
!
!
!
!
!
!
!
6
8
10
9
Whitwell
Lockerley
Cambridge
Aylesbury
Wormington
Luton
Oxford
Reading
Bedford
Swindon
BrightonPortsmouth
Southampton
Bournemouth
Milton Keynes
London
Legend Key Sites
— Gas Pipeline— Gas Pipeline – Sensitive Area— Exit Capacity Area

Gas Ten Year Statement November 2017 76C
hapt
er th
ree
System capability
Figure 3.13 Region 9 – London, Suffolk and the South East
Region 9 – London, Suffolk and the South East
NTS Location: South Diss, Cambridge, east of Whitwell
NTS/DN exit zones: EA4, 5, NT1, 2, 3, SE1, 2
The region is sensitive to Isle of Grain flows, with low flows limiting capacity. Capacity may be more limited in the sensitive areas at the extremities of the system (Tatsfield, Peters Green). The significant number of power stations in the region may impact on future ramp rate agreements (the rate at which flows can increase at an offtake, as set out in the Network Exit Agreement – NExA).
Unsold capacity indicates a good chance that capacity could be made available via exit capacity substitution, however, exchange rates may vary between locations. Potential non-Planning Act reinforcements could be carried out to release small quantities of additional capacity but significant pipeline reinforcement would be needed.
!
!
!
!
!
!
!
!
!
!
!
!
!
!
!
!
!
!
!(
6
8
7
9
Diss
Whitwell
Cambridge
Huntington
Wisbech E W
Isle of Grain
Luton
BedfordIpswich
Norwich
Brighton
Cambridge
Chelmsford
Folkestone
Peterborough
Milton Keynes
London
Legend Key Sites
— Gas Pipeline— Gas Pipeline – Sensitive Area— Exit Capacity Area
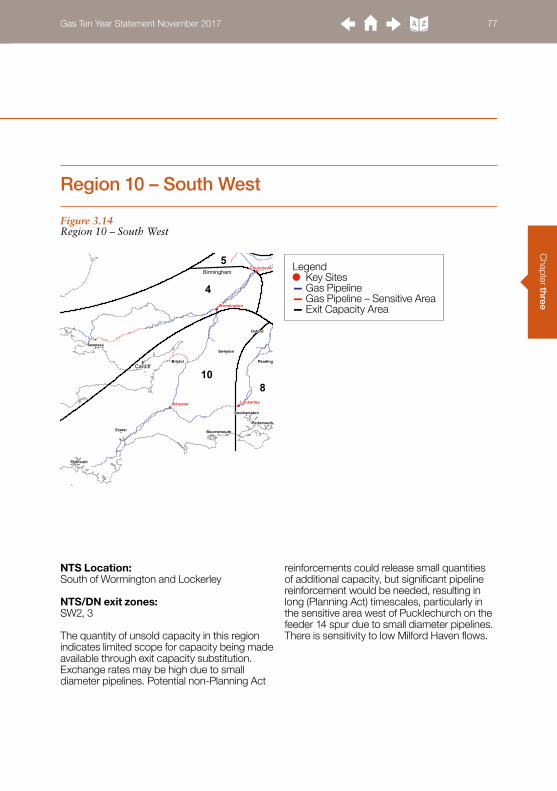
Gas Ten Year Statement November 2017 77C
hapter three
Figure 3.14 Region 10 – South West
Region 10 – South West
NTS Location: South of Wormington and Lockerley
NTS/DN exit zones: SW2, 3
The quantity of unsold capacity in this region indicates limited scope for capacity being made available through exit capacity substitution. Exchange rates may be high due to small diameter pipelines. Potential non-Planning Act
reinforcements could release small quantities of additional capacity, but significant pipeline reinforcement would be needed, resulting in long (Planning Act) timescales, particularly in the sensitive area west of Pucklechurch on the feeder 14 spur due to small diameter pipelines. There is sensitivity to low Milford Haven flows.
!
!
!
!
!
!
!
!
!
!
!
!
!
!
!
!
!
4
5
108
Ilchester Lockerley
Wormington
Churchover
Exeter
Oxford
Reading
SwindonSwansea
Bristol
Plymouth
Portsmouth
Southampton
Bournemouth
Cardiff
BirminghamLegend
Key Sites— Gas Pipeline— Gas Pipeline – Sensitive Area— Exit Capacity Area

Gas Ten Year Statement November 2017 78C
hapt
er th
ree
Table 3.2 Direct Connects offtakes by region
Table 3.2 shows which region the current Directly Connected (DC) offtakes fall within. There are no such offtakes in region 8.
3.3.3 Directly Connected exit points
Region Offtake Region Offtake Region Offtake
1
Blackness (BP Grangemouth)
3
Aldborough Storage
4
Abergelli Power StationFordoun Industrial Billingham ICI Abernedd Power StationGlenmavis (Storage) Blyborough (Brigg) Hirwaun Power StationGowkhall (Longannet) Blyborough (Cottam) Pembroke Power StationMoffat Irish Interconnector Caythorpe Storage Tonna (Baglan Bay)
St Fergus (Peterhead) Eastoft (Keadby Blackstart) Upper Neeston (Milford Haven) Refinery
St Fergus (Shell Blackstart) Eastoft (Keadby)5
Caldecott (Corby) Power Station
2
Barrow (Bains) Enron Billingham Drakelow Power StationBarrow (Blackstart) Goole (Guardian Glass) Peterborough Power StationBarrow (Gateway) Hatfield Moor Storage
6
Didcot Power StationCarrington (Partington) Power Station Hatfield Power Station Humbly Grove Storage
Ferny Knoll (AM Paper) Hatfield West Storage Marchwood Power StationFleetwood (Preesall) Storage Hornsea Storage
7
Bacton (Baird) StorageRoosecote Power Station Phillips Petroleum Teesside Bacton (Deborah) StorageSandy Lane (Blackburn) Power Station Rosehill (Saltend) Power Station Bacton (Esmond Forbes)
StorageSellafield Power Station Rough Storage Bacton Great YarmouthTrafford Power Station Saltend BPHP Bacton IUK Interconnector
Wyre Power Station Saltfleetby Storage Saddle Bow (Kings Lynn) Power Station
2.1
Burton Point (Connah’s Quay) Spalding 2 (South Holland) Power Station St Neots (Little Barford)
Deeside Power Station Stalingborough
9
Barking (Horndon)
Harwarden (Aka Shotton Paper) Staythorpe Coryton 2 (Thames Haven) Power Station
Hill Top Farm Storage Sutton Bridge Power Station Epping Green (Enfield Energy)Hole House Farm Storage Teesside (BASF) Grain Power Station
Holford Storage Teesside Hydrogen Medway (Isle of Grain) Power Station
Hollingsgreen (Hays Chemicals) Teesside (Seal Sands) Power Station
Middle Stoke (Damhead Creek) Power Station
ICIR(CastnerKelner_ICI_Runcorn)
Thornton Curtis (Humber Refinery) Ryehouse
King Street Storage Thornton Curtis (Killingholme) Stanford Le Hope (Coryton) Pickmere (Winnington Power Station) West Burton Power Station
10
Abson (Seabank) Power Station
Shellstar (Aka Kemira) Whitehill Storage Avonmouth StorageShotwick (BridgewaterPaper) Wragg Marsh (Spalding) Centrax IndustrialStublach Storage Zenica (ICI Avecia) ICI SevensideWeston Point (Rocksavage) Power Station Langage Power Station
Willington Power StationPortland StorageSeabank Power Station
System capability

Gas Ten Year Statement November 2017 79C
hapter three
Figure 3.15 NTS exit zones
3.3.4 NTS/DN exit zones
Figure 3.15 and Table 3.3 show which distribution network exit zones the current NTS/DN offtakes fall within.

Gas Ten Year Statement November 2017 80C
hapt
er th
ree
Table 3.3 NTS/DN exit zones
System capability
Exit Zone Offtake Exit
Zone Offtake Exit Zone Offtake
EA1
Eye
NO1
Guyzance
SC4
Nether HowleughWest Winch Cowpen Bewley LockerbieBrisley Coldstream PitcairngreenBacton Terminal Bishop Auckland Bathgate
EA2
Bacton Terminal Corbridge StranraerGreat Wilbraham Thrintoft Glenmavis
Roudham HeathSaltwick DrumHumbleton
SE1Tatsfield
EA3Bacton Terminal Little Burdon ShorneYelverton Elton Farningham
EA4
Matching Green
NO2
Wetheral SE2 Winkfield (SE)Royston Keld
SO1Ipsden
WhitwellMelkinthorpe Winkfield (SO)Tow Law
SO2Mappowder
EA6 Hardwick NT1 Winkfield (NT) Braishfield
EM1Thornton Curtis
NT2Horndon
SW1Fiddington
Walesby Luxborough Lane Evesham
EM2
Kirkstead NT3 Peters Green Ross (SW)Sutton Bridge
NW1Blackrod
SW2
Littleton DrewSilk Willoughby Salmesbury Easton GreyGosberton Lupton CirencesterBlyborough
NW2
Mickle Trafford Ilchester
EM3
Alrewas (EM) Malpas PucklechurchBlaby Warburton SeabankDrointon Weston Point
SW3
KennTur Langton Partington Aylesbeare
EM4Market Harborough Holmes Chapel Lyneham (Choakford)Caldecott Ecclestone Coffinswell
NE1
Towton Audley (NW) WA1 MaelorRawcliffe
SC1
CarestonWA2
Dyffryn ClydachBaldersby Balgray DowlaisPannal Kinknockie GilwernAsselby Aberdeen
WM1Aspley
Burley Bank St Fergus Audley (WM)
NE2Ganstead Mosside MilwichPickering
SC2Broxburn
WM2Shustoke
Paull Armadale Austrey
SC3Hulme Alrewas (WM)Soutra
WM3
Ross (WM)RugbyLeamington SpaLower QuintonStratford-Upon-Avon

Gas Ten Year Statement November 2017 81C
hapter three
3.4 Customer capacity – entry
3.4.1 Entry planning scenarios
As with exit capacity it is important for us to understand our customers’ gas supply (entry capacity) requirements to the NTS to again allow us to plan and operate our system efficiently and effectively. When we receive an entry capacity request we analyse our current system to assess what impact an increase in supply at a particular part of our system has on the current capability. This allows us to identify and plan for any geographical constraints which may arise from an increase in customer entry capacity in a particular area of the NTS. Where constraints to current system capability are encountered we use the NDP to identify options to meet our customers’ needs in the most cost effective and efficient way.
This section contains information about capacity availability and the lead time for providing NTS entry capacity as a guide for shippers and developers. Unsold NTS entry capacity available at an existing Aggregate System Entry Point (ASEP) can be accessed via the daily, monthly and annual entry capacity auction processes. If unsold capacity is not available, including at new entry points, the lead times may be longer.
We aim to help you understand the likely lead time associated with new entry points. New entry points can result in significant changes to network flow patterns and we encourage you to approach our customer service team to discuss specific requirements. This information is just an indication; actual capacity availability will depend on the amount of capacity requested from all customers at an ASEP and interacting ASEPs.
Chapter 2, Section 2.2 discussed the uncertainties in the future supply mix that arise from both existing supplies and potential new developments. The available supplies, in aggregate, are greater than peak demand. The supply uncertainty is further increased by the Gas Transporters Licence requirements for us to make obligated capacity available to shippers up to and including the gas flow day. This creates a situation where we are unable to take long-term auctions as the definitive signal from shippers about their intentions to flow gas. We are continuing to develop our processes to better manage the risks that arise from such uncertainties as part of our Gas Future Operability Planning (GFOP) work.
To help understanding of entry capability, we use the concept of entry zones which contain groups of ASEPs (Figure 3.16). These zones are discussed in further detail in Section 3.4.2. The entry points in each zone often make use of common sections of infrastructure to transport gas, and therefore have a high degree of interaction. There are also interactions between supplies in different zones which mean that interactions between supplies must also be determined when undertaking entry capability analysis. Examples are the interactions between Milford Haven and Bacton, or Easington and Bacton entry points where shared infrastructure assists capacity provision at both ASEPs by moving gas east–west or west–east across the country.

Gas Ten Year Statement November 2017 82C
hapt
er th
ree
Key scenarios we examine through the planning process include:• High west to east flows generated by
increased entry flows in the west travelling east across the country to support demands in the east and south east of the UK, including IUK export.
• High south to north flows created by reduced entry flows into St Fergus, with a corresponding increase in entry flows in the south, requiring gas to be moved from south to north.
In addition to the traditional geographical scenarios, we may also investigate several commercially driven sensitivities. For example, a sensitivity scenario with a reduction in imported gas balanced by high medium-range storage entry flows to meet winter demand.
Historically, we have considered these scenarios on an individual basis using ‘steady state’ gas flows consistent with an overall ‘end of day’ energy balance. As customer requirements from the network evolve, it is increasingly necessary for us to consider the ability of the system to switch between different flow scenarios, explicitly considering changing flows on the network.
If this technique indicates that future requirements from the network are outside of current capability, we would investigate a range of possible solutions (regulatory, commercial and physical). This ensures that a broad spectrum of solutions is identified. Where investment in assets is the optimum solution, we would carry out further optioneering through the planning process.
System capability
Figure 3.16 Zonal grouping of interacting supplies
!!
!
!
!!!
!
!
'
#
#
#
#
#
#
#
#
#
Bacton
Barrow
Teesside
Easington
St Fergus
Burton Point
Milford Haven
Isle of Grain
TheddlethorpeHolford
Hornsea
Caythorpe
Aldbrough
Humbly Grove
Hatfield Moor
Hole House Farm
Stublach
Fleetwood
Avonmouth
NORTHERN TRIANGLE
EASINGTON AREA
NORTH WEST
SOUTH EAST
SOUTH WEST
Legend Terminal Constrained LNG Storage Sites

Gas Ten Year Statement November 2017 83C
hapter three
3.4.2 Available (unsold) NTS entry capacity
Table 3.4 indicates the quantities of obligated and unsold NTS entry capacity at each ASEP within each entry zone. This unsold capacity (obligated less any previously sold or reserved) is available at each relevant ASEP
and could also be used to make capacity available at other ASEPs through entry capacity substitution. Substitution may also be possible across entry zones.
Table 3.4 Quantities of entry capacity by zone
Entry Zone ASEP Obligated Capacity Unsold Capacity
GWh/day 2017/2018GWh/day
2021/2022GWh/day
2024/2025 GWh/day
Northern Triangle
Barrow 340.01 191.7 49.75 338.53
Canonbie 0 0 0 0
Glenmavis 99 99 99 99
St Fergus 1,670.70 1,216.50 1,624.86 1,663.74
Teesside 445.09 293.94 402.95 444.06
North West
Burton Point 73.5 39.86 73.5 73.5
Cheshire 542.7 28.59 28.59 28.59
Fleetwood 650 650 650 650
Hole House Farm 296.6 13.16 13.16 13.16
Partington 215 215 215 215
Easington Area
Caythorpe 90 0 0 0
Easington (incl. Rough) 1,407.15 106.2 143.43 531.91
Garton 420 0 0 420
Hatfield Moor (onshore) 0.3 0.3 0.3 0.3
Hornsea 233.1 27.31 27.31 233.1
Hatfield Moor (storage) 25 3 3 3
Theddlethorpe 610.7 586.77 610.7 610.7
South West
Avonmouth 179.3 179.3 179.3 179.3
Barton Stacey 172.6 82.6 100.6 172.6
Dynevor Arms 49 49 49 49
Milford Haven 950 0 150 150
Wytch Farm 3.3 3.3 3.3 3.3
South East
Bacton IP 1,297.80 914.93 1,146.30 1,181.82
Bacton UKCS 485.6 0 0 0
Isle of Grain 699.68 35.38 35.38 177.08

Gas Ten Year Statement November 2017 84C
hapt
er th
ree
System capability
Table 3.4 contains the ASEP names as defined in the NTS Licence. For clarity, the Garton ASEP contains the Aldborough storage facility, the Barton Stacey ASEP contains the Humbly Grove storage facility and the Cheshire ASEP contains the Hill Top Farm, Holford and Stublach gas storage facilities. More information on storage facilities can be found in Appendix 4.
Our Charts Workbook provides further information about the level of booked and obligated entry capacity at each ASEP, excluding those that are purely storage.
The figures also provide data points representing historic maximum utilisation and the range of future peak flow scenarios for these ASEPs. While all un-booked capacity can be considered for entry capacity substitution, future bookings may change and the gap between the scenario peak flow data and the obligated capacity level may be a better indication of the capacity available for substitution. Using this indicator, significant capacity for substitution exists at St Fergus and Theddlethorpe.
ASEPs: Barrow, Canonbie, Glenmavis, St Fergus, Teesside (and Moffat).
These northern supplies need to be transported down either the east or west coast of England to reach major demand centres in the midlands and south of the country.
The amount of unsold capacity in this region, combined with the reduced St Fergus forecast flows, indicates a high likelihood that capacity could be made available through entry capacity substitution. Potential non-Planning Act reinforcements, including compressor reverse flow modifications, could release further quantities of additional capacity.
ASEPs: Burton Point, Cheshire, Fleetwood, Hole House Farm, Partington.
These five ASEPs use common infrastructure and the main west coast transportation route to move gas into the rest of the system.
The unsold capacity in this region indicates that some capacity could be made available via entry capacity substitution, however, entry
capability will not necessarily match entry capacity and exchange rates may be greater than one to one. Potential non-Planning Act reinforcements, including compressor reverse flow modifications, could release additional capacity but significant pipeline reinforcement would then be required, resulting in long (Planning Act) timescales.
Entry Zone – Northern triangle
Entry Zone – North West

Gas Ten Year Statement November 2017 85C
hapter three
ASEPs: Avonmouth, Barton Stacey, Dynevor Arms, Milford Haven, Wytch Farm.
This zone enables sensitivity analysis around potential LNG supplies from Milford Haven.
The quantity of unsold capacity in this zone is principally at the Avonmouth and Dynevor Arms ASEPs associated with the LNG
storage facilities. Due to the short duration of deliverability of these facilities, it is unlikely that the capacity could be made available for entry capacity substitution other than for equivalent facilities. Significant pipeline reinforcement and additional compression would be required to provide incremental capacity, resulting in long (Planning Act) timescales.
ASEPs: Bacton UKCS, Bacton IP, Isle of Grain.
The ASEPs use common infrastructure away from the Bacton area.
While there is a high degree of interaction between the Bacton (UKCS & IP) and Isle of Grain ASEPs, the quantity of unsold capacity in this zone cannot be interpreted as an
indication of suitability for entry capacity substitution. This is due to constraints on the network in terms of the ability to transport gas south to north. Potential non-Planning Act reinforcements, including compressor reverse flow modifications, could release some additional capacity, but significant pipeline reinforcement would then be required resulting in long (Planning Act) timescales.
Entry Zone – South West
Entry Zone – South East
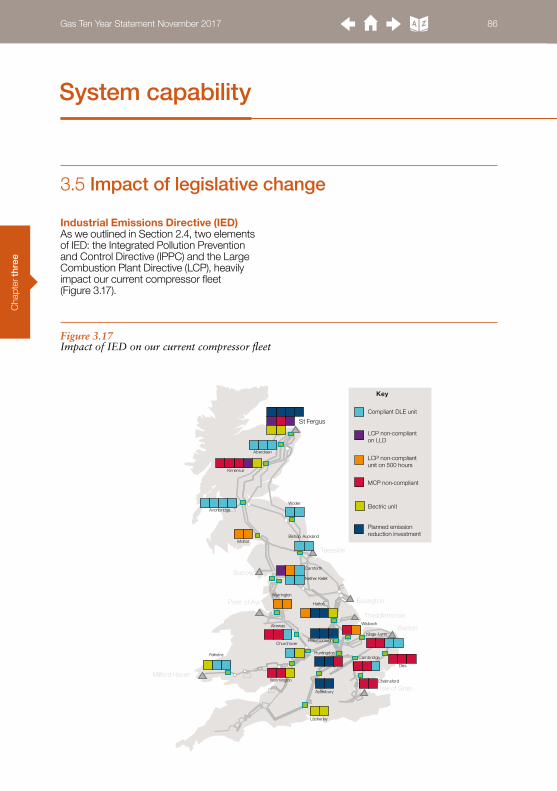
Gas Ten Year Statement November 2017 86C
hapt
er th
ree
System capability
3.5 Impact of legislative change
Industrial Emissions Directive (IED)As we outlined in Section 2.4, two elements of IED: the Integrated Pollution Prevention and Control Directive (IPPC) and the Large Combustion Plant Directive (LCP), heavily impact our current compressor fleet (Figure 3.17).
Figure 3.17 Impact of IED on our current compressor fleet
Bacton
Isle of Grain
Theddlethorpe
Easington
Milford Haven
Teesside
St Fergus
Barrow
Point of Ayr
Aberdeen
Kirriemuir
Wooler
Avonbridge
Moffat
Carnforth
Nether Kellet
Warrington
Hatton
Wisbech
Kings Lynn
Diss
Cambridge
Chelmsford
Bishop Auckland
Alrewas
Churchover
Wormington
Felindre
Lockerley
Aylesbury
Peterborough
Huntingdon
Compliant DLE unit
LCP non-compliant on LLD
LCP non-compliant unit on 500 hours
MCP non-compliant
Electric unit
Planned emission reduction investment
Key
Gas Ten Year Statement November 2017 87C
hapter three
IED stakeholder engagementDuring 2016/17 further discussions have taken place with Ofgem and the Environmental Regulators. The 2016 running hours for Compressor Installations and the commencement and continuation of emissions reduction projects were agreed during these discussions with the UK Environmental Regulators.
During 2016 we have further developed our compressor strategy. Details of this are given in Chapter 5.
Medium Combustion Plant Directive (MCP) As outlined in Section 2.4, the MCP Directive will affect 41 NTS compressor units. Other combustion plants, such as pre-heat systems, are also captured as part of this Directive. During 2017/18 we will undertake an audit of this plant type and develop mitigation plans.
Best Available Technique References (BREF) As defined in Section 2.4, BREF has been adopted under IPPC and IED. The BREF for large combustion plant was issued by the European Commission in August 2017. We will be taking BREF into account when determining the Best Available Technique (BAT) for all options considered on IED non-compliant units going forwards. We do not anticipate any significant changes to the BAT process we currently follow when assessing our compressor options.

Gas Ten Year Statement November 2017 88C
hapt
er th
ree

Gas Ten Year Statement November 2017 89
Chapter fourSystem operation 90
Gas Ten Year Statement November 2017 89

Gas Ten Year Statement November 2017 90C
hapt
er fo
ur
System operation
This chapter describes how we are investing in our capabilities as the System Operator to make the most of our network. These investments mean we can continue to plan to operate, and then operate, our network safely and efficiently.
The non-asset solutions, the ‘rules and tools’ we are developing, are triggered as part of the Establish Portfolio stage of our Network Development Process (NDP); we discuss this progression in more detail.
Key insights
• As the System Operator we must provide a safe and reliable network. We know you want to flow gas using within-day profiles that meet your operational, commercial and contractual needs, and you want minimum restrictions.
• Our challenge is to make the most efficient investment decisions to make the most of our existing network before we build new assets.
• We are enhancing our forecasting, analytical, decision support and reporting capabilities, by improving our processes and investing in our systems and tools.

Gas Ten Year Statement November 2017 91C
hapter four
As System Operator (SO), our responsibility is to transport gas from supply points to offtakes, providing a safe and reliable network. Where operational strategies cannot be used to maintain transportation of supply we need to make physical changes to our network. These physical changes are outlined in Chapter 5 (Asset development). In Chapter 4 we discuss how we operate our current network.
The way we operate the NTS is affected by a number of obligations, unchanged since the 2016 GTYS publication.
Safety and system resilience:• We must plan and develop the NTS to meet
Pipeline System Security Standards.• We must maintain NTS pressures within
safe limits.• We must maintain the quality of gas
transported through the NTS to meet the criteria defined within the Gas Safety (Management) Regulations (GS(M)R) to comply with UK gas appliances.
• We must maintain network capabilities to effectively manage or mitigate a gas supply emergency.
Environment:• We must minimise our environmental impact.
Facilitating efficient market operation:• We must meet the pressures contractually
agreed with our customers.• We must provide you with information and
data that you need to make effective and efficient decisions.
• We must make NTS entry and exit capacity available in line with our licence obligations and contractual rights.
• We must take commercial actions in the event that system capability is lower than contractual rights.
• We must manage gas quality (calorific value) at a zonal level to ensure consumers are fairly billed for the gas they use.
• We must optimise the use of NTS infrastructure.
You have told us that you value the ability to flow gas using within-day profiles to meet your operational, commercial and contractual needs, with minimal restrictions. You want us to maximise our performance in this area. To do this, we are focusing on:• operating the NTS effectively and efficiently
to maximise its capability while meeting our statutory and commercial obligations
• developing methods (including analytical capabilities) to quickly identify, manage and mitigate any network issues to minimise the impact on you
• optimising, scheduling and managing access to the NTS for maintenance and construction activities to minimise the impact on you
• providing you with flexibility to flow gas at the most efficient profile for you, even where this flexibility exceeds contractual rights. As you would expect, we must make sure that this operational flexibility does not create unacceptable system risks or have a detrimental impact on our other customers.
So our challenge is to maximise value from our existing network by investing in our capabilities as the SO.
In this chapter we describe current and planned developments to our SO capabilities and explain how we make decisions between investing in our capabilities and installing new assets.
4.1 Introduction

Gas Ten Year Statement November 2017 92C
hapt
er fo
ur
Our SO capabilities describe what we need to do to be able to produce outputs that, when combined, deliver the most value for you.
4.2 What are System Operator capabilities?
System operation
To make sure our outputs are fit for purpose, each SO capability requires a combination of efficient business processes, effective technology
(systems/tools), skilled and knowledgeable people (see Figure 4.2).
Figure 4.1 Examples of some of the inputs and outputs of our SO capability
Long-to-medium-term Supply and Demand
Forecasts
PublishedDemand Forecast
Inputs to Operational
Risk Assessments
Current Market
Conditions
Short-term Supply and Demand Forecasting
The capability to forecast daily volumes, and within-
day variations in supply and demand (across
appropriate time horizons)
Figure 4.2 Key inputs required for our SO capabilities
Knowledge/Skills
Systems/Tools
Process
Gas Ten Year Statement November 2017 93C
hapter four
We use our Network Development Process (NDP) to assess system capability requirements; this was introduced in Chapter 1. Here we discussed how we consider and improve the capability of the system and use the NDP to assess our capability as System Operator (SO). Chapter 2 explored some of the triggers for this process and Chapter 3 described the Need Case stage of the NDP where we calculate the NTS’s capability requirements.
Understanding our system capability and our capability as the SO allows us to determine where rules, tools or asset solutions need to be found to meet our customer requirements. This chapter will discuss where, as SO, we can better use rules and tools to make more efficient use of the system. Chapter 5 (Asset development) will follow on from this by discussing how the asset solutions are developed.
Under RIIO, we are incentivised to think about Total Expenditure (TOTEX) as well as Capital Expenditure (CAPEX). We need to demonstrate good value for money. We therefore focus on the need of the SO, both now and in the future, when considering the solutions to meeting our system capability requirements.
We do this through the use of our Whole Life Prioritisation scoring model. This uses a qualitative approach comparing a range of solutions against key criteria including: flexibility, customer charges, future proofing, current capability and obligations, resilience, and barriers to new investment. We use this scoring method to rank the available options for the next stages of our processes. These can be asset or non-asset solutions, or sometimes a combination of the two. At the Establish Portfolio stage no options are fully discounted nor final choices made. These are the least regrets options used to set the bounds for further investigation and options development. Should optioneering result in the breaking of these bounds, the projects will return to earlier stages of the process for reassessment.
An asset solution may not always be the most efficient way to meet a system capability requirement and deliver financial benefits to the industry and consumers by reducing costs and minimising the risks of balancing the system. We therefore, in our role as SO, consider our non-asset solutions.
A non-asset solution, in simple terms, is where we ‘sweat our assets’ by assessing what the maximum capability is of our existing network. We look at contractual solutions and we invest in our capabilities as the SO e.g. enhanced simulation and situational awareness tools. Also, we may be willing to accept commercial risk rather than invest in a more expensive asset solution.
4.3 Deciding between System Operator capabilities and assets
Gas Ten Year Statement November 2017 94C
hapt
er fo
ur
System operation
This approach has recently been undertaken to assess the Avonmouth gas pipeline, which was originally planned to replace capabilities lost with the anticipated closure of the Avonmouth LNG storage facility. Risk analysis alongside changing demands in the South West has now demonstrated that we do not need to build the pipeline at this time, with cost savings on the allowance made back to the regulator and community.
We actively work with our customers to ensure we understand their needs and that together we can make informed decisions that are right for end consumers. Later on in this chapter we will give some examples of work we are doing in this area.
We are constantly reviewing our current systems and processes in order to refine what we do and how we do it. This maximises the value we get from our existing network through improved forecasting, analysis, risk assessment and decision making (across all time horizons) before we invest in asset solutions.

Gas Ten Year Statement November 2017 95C
hapter four
Our SO capabilities can be grouped into categories which have been summarised in Figure 4.3 below. Figure 4.3 gives an
example of how information flows between our operational capabilities; it does not represent our organisational structure.
We use a combination of these capabilities to deliver our daily operational strategies and plans which make sure we provide a safe and reliable network for you.
We are committed to developing our people to make sure they have the right knowledge, skills and experience to drive efficiency and maximise our process and system performance to deliver a reliable network for our customers.
The following sections provide more detail on each of our key operational capabilities including how we are improving our processes and what investments we are making to develop our systems and tools.
4.4 Investing in our System Operator capabilities
Supply & Demand Forecasting
Planning
Operational Strategy
Review Situational Awareness
Operational Control
Long-to-medium-term supply & demand forecasting
Short-term supply & demand forecasting
Emergency Planning and Management
1 to 10 years ahead Risk Assessment
1 month to 1 week ahead Risk Assessment
Improve all areas
Prepare NTS Access Plan (Maintenance/Construction)
Define Operational Strategy
Review Operational Performance
Deliver NTS Access Plan
On-the-day Risk Assessment
Validate customer requirements against business rules
Real Time Data Provision and Monitoring (Telemetry)
Execute Operational Strategy
Take constraint management/residual balancing actions
Figure 4.3 Our SO operational processes
Gas Ten Year Statement November 2017 96C
hapt
er fo
ur
System operation
4.4.1 Supply and demand forecasting
What is it?
• Effective and accurate forecasting of gas supply and demand is critical to our SO decision-making processes, particularly with increasingly uncertain future supply and demand patterns.
• Our supply and demand forecasts are based on our Future Energy Scenarios (see Chapter 2) as well as the latest market information. Forecasts are produced annually, monthly, weekly and daily, depending on the activity being undertaken.
• The forecasts feed into Planning Network Access (one to ten years ahead), Planning and Procuring activities (one month to one week ahead), and real time Operational Control and Situational Awareness of the NTS (day ahead to within day).
• We share our forecasts with you through our information provision systems to facilitate an efficient market24, by helping you manage your supply/demand balance position.
How are we improving?Process
Long to medium term• We continuously improve our long-to-
medium term supply and demand forecasts by ensuring we have an effective feedback loop from the operational and short-term teams back in to the longer-term forecasting teams, to capture and resolve any data gaps or inconsistencies quickly.
Short term• We aim to maximise the efficiency of
our current processes using our existing tools and systems. As we develop new forecasting tools, we revise and optimise our existing processes to make the most of the new technology.
Drivers for change
• Diversity of supply imports. • Increased arbitrage through interconnectors. • Changes in UK installed gas generation
capacity and gas/coal forward spread.• Price sensitive operation of fast cycle storage.
24 https://www.nationalgrid.com/uk/gas/market-operations-and-data

Gas Ten Year Statement November 2017 97C
hapter four
Systems/Tools
Long to medium term• We have recently completed a project
working with experts from the University of Warwick to investigate the latest data-mining tools to help us better understand possible long-term future supply and demand patterns. We worked with the Statistics Department at the university to consider several new methods for analysis of the data sets we use in risk assessments. An approach called cluster analysis was identified as one of the suitable tools. This is a mathematical technique that allows for automatic classification of supply and demand patterns that could lead to similar risks within the network. Broadening our analysis in this way means we can build a better understanding of where constraints are on our network. This will help us to improve safety, risk management and investment planning – and reduce the probability of network constraints. This should impact positively on all our key stakeholders and customers. For more information on this project (National Transmission System (NTS) Constraint Modelling), please visit the Smarter Networks Portal via the link provided below. http://www.smarternetworks.org/project/nia_nggt0022
Short term• We continue to improve our short-term
forecasting tools and then integrate them into our Gas Control Suite (GCS) which was commissioned in July 2016.

Gas Ten Year Statement November 2017 98C
hapt
er fo
ur
System operation
4.4.2 Planning
What is it?
• Planning considers a time horizon of approximately one to ten years ahead. Analytical risk assessments (incorporating commercial and physical factors) are used to identify and quantify possible future system constraints, which may affect our system capability.
• We assess the capability of our system to operate safely while meeting our regulatory and contractual obligations, e.g. Assured Offtake Pressures (AOP), while continuing to deliver your anticipated flow profile requirements.
• If the network has insufficient capability we are able to use our SO constraint management tools, such as capacity substitution, bilateral contracts and on-the-day flow swaps as part of long-term commercial and operational strategies to deliver a reliable service for you.
• We consider whether variations to existing industry rules and our associated obligations would impact our network capability.
• Other outputs from this activity include our NTS Access Plan where we agree mutually acceptable timescales with the TO for maintenance and construction activities. This enables us to notify you when critical maintenance activities affecting your assets will be carried out.
• As described in Chapter 2, our focus on asset health means that we are likely to continue undertaking a large number of maintenance activities. Our aim is always to minimise the impact on you by effective works planning and clear communications.
• In Planning we also identify a Need Case for Operating Margins (OM) gas. We can use OM when there is an operational balancing requirement which cannot be satisfied by taking other system balancing actions or as a result of damage or failure on any part of the NTS.
Drivers for change
• Increased number of possible future supply and demand forecasts.
• Large day-to-day and within-day change in supply and demand.
• Our large programme of asset health works out to 2021.
How are we improving?Process
• We continue to develop improved relationships and ways of working with our TO colleagues in National Grid Gas Transmission, to ensure that construction and maintenance activities can be delivered without risking our ability to provide a safe and reliable network for you to supply or use gas.
• During 2017, we completed a project which proposed changes to our planning processes which will improve our ability to assess customer requirements, alongside others’ needs, and will ensure that our planning processes reflect the operational conditions experienced by our control room. The proposals will also allow us to draw a clearer line of sight between what we are planning for, and how we are accounting for it in our processes. To formally implement these proposals we updated our Transmission Planning Code document and consulted on these changes during July and August.
• These changes include how we deal with both foreseen and unforeseen events on the network. Foreseen events include supply and demand profiling, while unforeseen events include supply losses, sudden CCGT demand increase (due to generation requirements in the electricity market) and compressor trips. We also changed how we assess DN pressure requirements. We assess a level of pressure at DN offtakes, appropriate to the LDZ demand level, in addition to Assured Offtake Pressures. It is important to note

Gas Ten Year Statement November 2017 99C
hapter four
that these changes do not affect the existing commercial and regulatory arrangements concerning Assured Offtake Pressures. For more information on the updates made to our Transmission Planning Code please visit https://www.nationalgrid.com/uk/gas/charging-and-methodologies
Systems/Tools
• Given the increasingly uncertain environment and the range of time horizons, the number of possible supply and demand forecasts that we need to consider has increased in recent years. The ability to effectively analyse this wide range of scenarios in order to understand the impact on system operation and capability is becoming increasingly vital to our operational and planning activities.
• We are continuing to develop our ability to undertake multi-scenario network analysis over both planning and operational timescales. Compared to existing analysis techniques and activities, this capability will allow us to better understand the operational impact of a greater number of forecast scenarios than we have previously been capable of with our current tools and processes.
• We can use the new multi-scenario analysis approach to assess future Need Cases and evaluate network access requests. When combined with the improvements in our long-to-medium term supply and demand forecasting capabilities, this enables us to develop more comprehensive, robust and probabilistic long-term commercial, investment and operational strategies, thereby minimising costs for the community.
• This can also allow us to develop a more informed NTS Access Plan with reduced risk of maintenance activities on your assets being cancelled or deferred as a result of operational constraints.

Gas Ten Year Statement November 2017 100C
hapt
er fo
ur
System operation
4.4.3 Operational strategy
What is it?
• Within our operational strategy activities we develop short-term plans to ensure that we can configure our network and associated assets in an optimum configuration to meet your flow and pressure requirements each gas day.
• These short-term plans are developed from approximately one month ahead of the gas day, through to week-ahead and end with on-the-day control room support. Our plans are based on our long-term risk assessments and are continually refined and optimised using up-to-date market and customer intelligence plus the latest supply and demand forecasts.
• Our short-term plans identify and mitigate risks for the safe and reliable operation of the system. We provide our control room with the latest up-to-date commercial and physical information, so that they can facilitate NTS access while maximising the capability of the network for you to use.
• We identify opportunities to perform against our SO incentives, which have been structured and agreed with the regulator to deliver value for our customers and stakeholders.
Drivers for change
• Large day-to-day and within-day change in supply and demand.
• Greater price sensitive operation.• Shorter customer notice periods,
particularly in response to changes in the electricity market.
How are we improving?Process
• We regularly review and develop our short-term strategy processes to ensure efficiency and to confirm that we are continuing to deliver the needs of our control room, who, in turn, deliver for you.
Systems/Tools
• The multi-scenario network analysis enhancements described earlier in this chapter can also be used to realise benefits in our planning and procurement activities. These analysis enhancements allow us to target our efforts into more detailed, in-depth analysis for areas at higher risk of impacting our ability to meet customer requirements or where there are system improvement opportunities for the SO.
• When combined with the ongoing improvements in short-term supply and demand forecasting, and improved systematisation and visualisation of results from the analysis, it will allow us to provide more informed and optimised plans to the control room to mitigate the risk of your operation being affected.
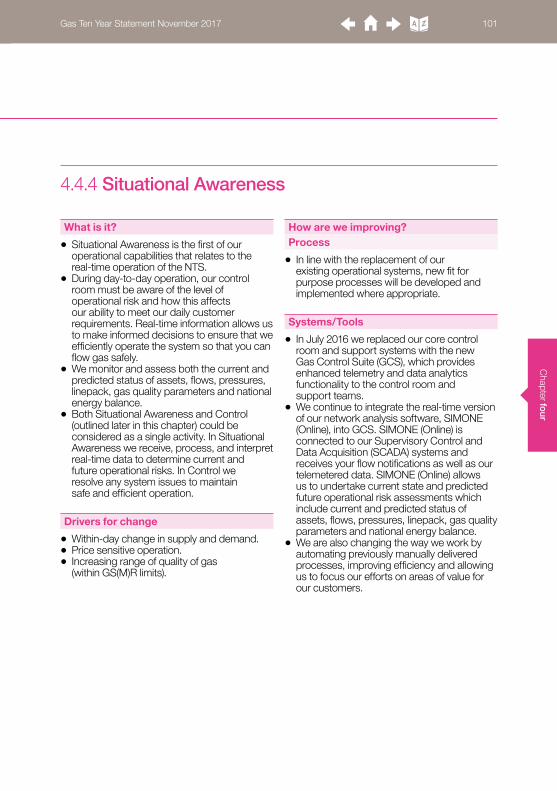
Gas Ten Year Statement November 2017 101C
hapter four
4.4.4 Situational Awareness
What is it?
• Situational Awareness is the first of our operational capabilities that relates to the real-time operation of the NTS.
• During day-to-day operation, our control room must be aware of the level of operational risk and how this affects our ability to meet our daily customer requirements. Real-time information allows us to make informed decisions to ensure that we efficiently operate the system so that you can flow gas safely.
• We monitor and assess both the current and predicted status of assets, flows, pressures, linepack, gas quality parameters and national energy balance.
• Both Situational Awareness and Control (outlined later in this chapter) could be considered as a single activity. In Situational Awareness we receive, process, and interpret real-time data to determine current and future operational risks. In Control we resolve any system issues to maintain safe and efficient operation.
Drivers for change
• Within-day change in supply and demand.• Price sensitive operation.• Increasing range of quality of gas
(within GS(M)R limits).
How are we improving?Process
• In line with the replacement of our existing operational systems, new fit for purpose processes will be developed and implemented where appropriate.
Systems/Tools
• In July 2016 we replaced our core control room and support systems with the new Gas Control Suite (GCS), which provides enhanced telemetry and data analytics functionality to the control room and support teams.
• We continue to integrate the real-time version of our network analysis software, SIMONE (Online), into GCS. SIMONE (Online) is connected to our Supervisory Control and Data Acquisition (SCADA) systems and receives your flow notifications as well as our telemetered data. SIMONE (Online) allows us to undertake current state and predicted future operational risk assessments which include current and predicted status of assets, flows, pressures, linepack, gas quality parameters and national energy balance.
• We are also changing the way we work by automating previously manually delivered processes, improving efficiency and allowing us to focus our efforts on areas of value for our customers.

Gas Ten Year Statement November 2017 102C
hapt
er fo
ur
System operation
4.4.5 Operational Control
What is it?
• Our activities within Control use inputs from all of our other operational capabilities, to ensure that our control room can make informed and efficient decisions when operating the network.
• The processes and systems that we use in this function enable us to operate NTS assets, react to unplanned events, validate customer flow notifications against commercial rules, take commercial actions such as energy balancing or constraint management and engage effectively with customers to initiate third-party actions.
• As gas flows and our customers’ behaviours continue to evolve, more control actions will be required to ensure:
– our system operates safely – we maintain a national energy balance and – we meet our customers’ daily needs.
The tools and communication methods we currently use are fit for purpose. However as the complexity of the actions required and the levels of risk being managed increase we may need to develop these tools and systems to ensure they continue to be fit for purpose in the future.
Drivers for change
• Within-day change in supply and demand.• Price sensitive operation.• Increasing range of quality of gas (within
GS(M)R limits).
How are we improving?Process
• In line with the replacement of our existing operational systems, including those mentioned in Section 4.4.4, new fit for purpose processes will be developed and implemented when appropriate.
Systems/Tools
• In GCS, we use data visualisation and analytics software to allow us to bring together relevant information from all other operational capabilities, and external data sources, to ensure that the control room makes operational decisions and takes control actions based upon the most up-to-date data and analysis. This will now enable us to mitigate issues to minimise the risk of your operation being affected.

Gas Ten Year Statement November 2017 103C
hapter four
4.4.6 Review
What is it?
• We are continuously improving how we operate our network to ensure we are providing the best service for you.
• As we take on a more active role in managing and balancing the network, the number of commercial and operational actions that we make will inevitably increase. The amount of review, validation and analysis will therefore also increase as we are required to take more actions.
• Given the changing, increasingly uncertain supply and demand environment, we will not be able to rely on our past experiences of operating our network. As a result, this places greater emphasis on the development of effective feedback loops from this area into both the Planning and Operational Control activities.
• We increasingly need to monitor our customers’ compliance with contractual obligations and technical standards. We provide feedback to those parties that may be operating outside their obligations, particularly if their operation has a knock-on effect on us being able to deliver a reliable service for you.
Drivers for change
• Evolving customer requirements and supply/demand environment.
• Anticipated increased number of control actions.
How are we improving?Process
• We want to continue to improve our relationships and ways of working with our customers and stakeholders. When customer compliance incidents occur, particularly those which affect your ability to operate, we always review and, where possible, share any lessons learnt to reduce the risk of repeat occurrences.
• We are increasingly sharing more information on our operational performance with you in the Operational and System Operator forums. We host the forum with shippers and Distribution Network Operators, and through documents that we publish, such as this.
Systems/Tools
• Our new systems, in particular the data visualisation and analytics software embedded within GCS, will help us to draw conclusions more quickly, ensuring that effective learning is developed and fed back into our other operational processes and systems so that we continuously improve our service to you.
Gas Ten Year Statement November 2017 104C
hapt
er fo
ur
System operation
4.5 Need Case review
4.5.1 Asset health
Here we review all previous decisions and summarise the Need Cases completed over the last 12 months.
A significant number of the Need Cases completed this year have been related to asset health projects. These Need Cases look at the impact of removing the assets/sites from the network and assessing the potential impact. Optioneering is then completed looking at the full range of rules, tools or assets. More detail on some of the bigger projects are detailed below.
BactonBacton is currently a key gas entry point to the UK and will continue to be into the future. It was built in 1969 and is in a coastal environment which accelerates degradation such as corrosion. The site is a critical component of the gas transmission network. It is a key dynamic swing node for a large subset of the customer base at an interdependent part of the network. It bridges Great Britain with mainland Europe and controls flows into the South East, ensuring security of supply for London and the important west–east transit route for LNG to Europe.
The site manages a large volume of the nation’s gas. In March 2013, a late cold snap when storage was low at the end of winter required record flows from Bacton. For the entire month of March 2013 Bacton supplied on average 33% of UK demand with a maximum flow of 139.1 mcm/d (40% of UK demand) on 21st March 2013.
Changing UK supplies and demand meant we should assess the future requirements of the site in order to efficiently invest in asset health. With clear requirements for the site, a more detailed assessment needs to be completed to determine what functionality needs to be retained as the site is rationalised. Work is on-going to develop the optimal solution for the site.

Gas Ten Year Statement November 2017 105C
hapter four
Feeder 9 Humber CrossingAs the sole transportation route across the River Humber, Feeder 9 is one of the most critical pipelines on the NTS. It regularly transports between 70 mcm/d and 100 mcm/d and plays a pivotal role in the provision of entry capacity in the Easington area and the UK gas market as a whole. There are continuing concerns over the integrity of the pipeline due to rapid and unpredictable estuary movements.
Analysis using our four Future Energy Scenarios demonstrates that there is a long-term requirement for Feeder 9. Through our strategic optioneering process we have determined that a replacement pipeline in a tunnel is the most credible long-term solution. We are therefore progressing with a replacement pipeline solution, as well as continuing to monitor the existing crossing on an increased frequency.
Summary of plant without a Need Case Other assessments have confirmed there is no Need Case for:• Wormington compressor aftercoolers• Huntingdon compressor aftercoolers• The Orenda compressor units at
Churchover compressor station.
The disconnection works will be combined with other project work on the three sites.

Gas Ten Year Statement November 2017 106C
hapt
er fo
ur
System operation
4.5.2 Deferred asset investment
Here we detail how improvements in our planning process have helped us optimise when we commit to our investment decisions.
AvonmouthAllowances to replace the operational service currently provided by the LNG storage facility at Avonmouth were agreed as part of RIIO-T1. Our analysis and work with stakeholders, most notably the Health and Safety Executive and Wales & West Utilities, determined that a physical build at this time is not in consumer interests.
We continue to monitor the capacity and forecast flow position in the South West Region. The booked capacity position has not notably changed since 2013. Although our risk of capacity buy back in this region still exists, the Need Case remains insufficient to initiate a physical solution. In addition the latest FES indicates a significant reduction in 1-in-20 demand in 2020, further supporting our no build position at this time.
The delivery of the Avonmouth output has been part of the Mid-Period Review process, as was agreed at the time of the Final Proposals in RIIO-T1. At the time of publication, Ofgem’s position was to reduce our load-related expenditure allowance by £168.8 million to reflect the amount allowed for the pipeline’s output.

Gas Ten Year Statement November 2017 107C
hapter four
Scotland 1-in-20To secure Scotland under our 1-in-20 obligation we have continued to assess the Need Case for the Scotland 1-in-20 suite of projects.
Our analysis has been updated based on the latest FES publication and it indicates that if agreement (from SGN) to reduce some of the higher Assured Offtake Pressures (AOPs) in Scotland can be obtained, it would be possible to meet the minimum St Fergus flow levels into early RIIO-T2.
With a partial reduction in AOP allowing us to maintain 1-in-20 capabilities beyond RIIO-T1, we have deferred the potential NTS investment while we continue discussions with SGN. Should the partial AOP reduction not be possible, based on the current FES we would need to start to progress our asset solution by 2018 due to a four-year build period.
We are continuing to assess the inherent NTS risk and the change in this profile at lower demand levels which is not addressed by the reduced AOP solution.
Over the last 12 months we have been in discussion with SGN on the impact to their network of reducing the AOPs. They have indicated the potential to accept a reduction
to their Southern Scotland offtake AOPs but would require investment to accept any reductions at their Northern Scotland offtake AOPs. The reduced Southern Scotland AOPs can be maintained under peak 1-in-20 conditions into early RIIO-T2. However, through the same period, reduced AOPs cannot be maintained at lower demand levels and will continue to be managed through current operational tools. Evidence suggests that UK Continental Shelf (UKCS) supplies will continue to reduce which means the reduced AOPs are not an enduring solution. Based on these results we are continuing to progress the below options with SGN:• The reduction of AOPs in Southern
Scotland.• An off-peak AOP reduction for Northern
Scotland.• Optimisation and cost implications of
investing in the Distribution Network vs investment in the NTS.
We have assessed the potential for a contractual solution to incentivise additional entry flows at St Fergus, such as a diversion of flows from Easington. Our current view is that this would have no benefits over the other options being considered, including asset reinforcement. It would be more expensive, complex to deliver and would provide less security.

Gas Ten Year Statement November 2017 108C
hapt
er fo
ur

Gas Ten Year Statement November 2017 109
Chapter fiveAsset development 110
Gas Ten Year Statement November 2017 109

Gas Ten Year Statement November 2017 110C
hapt
er five
Asset development
This chapter considers the most efficient way of delivering current and future network needs where asset investment has been identified as the preferred option. It sets out sanctioned National Transmission System (NTS) reinforcement projects, projects under construction in 2017/18 and potential future investment options as a result of the Industrial Emissions Directive (IED) and our asset health review. These are assessed against the scenarios and sensitivities in our Future Energy Scenarios (FES) publication. This chapter also explores the Establish Portfolio stage of our Network Development Process (NDP).
Key insights
• Increasing uncertainty around supply and demand scenarios makes planning future capability on the NTS more challenging.
• All of our gas-driven compressors that produce emissions above the IED threshold must comply with new requirements by 31 December 2023.
• The future uncertainty of flows from St Fergus means we must be able to move gas south-to-north. We currently have limited capability to do this, but we do have time to assess potential solutions against the network changes resulting from the IED. Flows are monitored and we expect to meet the necessary timescales to deliver any investments.
• Delivering asset health work is a key measure of RIIO in terms of allowances and output. Over the next three years we will continue to make effective asset management decisions so we can deliver the right levels of network performance for our customers and stakeholders.

Gas Ten Year Statement November 2017 111C
hapter five
Chapter 1 introduced our Network Development Process (NDP). In this penultimate chapter we expand on the asset solution element of the ‘Establish Portfolio’ stage (see Figure 5.1). This stage is only reached if a solution to a trigger cannot be found within the existing capabilities of the system.
The aim of this stage is to establish a portfolio of, in this case, physical investment options that address the Need Case. A range of options are investigated during the network analysis phase, including a ‘Do Nothing’ option.
This allows for the comparison of options both in terms of effectiveness at meeting the Need Case requirements and overall cost. The implications of each option we have considered are summarised and discussed at stakeholder engagement workshops. The options are then narrowed down to identify a preferred option which not only addresses the Need Case but delivers the most cost-effective, legally compliant solution.
5.1 Introduction
Figure 5.1 The Network Development Process
Review and Close Project
Trigger
A change in the network, legislation, market or customer requirements.
Need Case
Required system capability over the short/medium/long term.
Establish Portfolio
Risks of ‘Do Nothing’ option. Consider ‘rules’, ‘tools’ and ‘assets’.
Select Option
Invest in assets, develop commercial options or wider network options?
Develop and SanctionValue delivered for customers and end consumers under different options?
Execute Project
Least regrets option or options?
Stakeholder Engagement

Gas Ten Year Statement November 2017 112C
hapt
er five
Asset development
Further to the reopener submission as detailed in the 2016 GTYS, preparations are being made for the 2018 reopener to enable compliance with the IED requirements. As noted in Section 3.5, a number of our existing compressor units are captured under the LCP element of the IED and are required to comply with the legislation under Limited Life Derogation (LLD) or Emergency Use Derogation (EUD). Under LCP-LLD units above 50 MW thermal input will need to cease operation by 31 December 2023 or after 17,500 hours of operation beginning 1 January 2016, whichever is sooner. Under LCP-EUD, units above 50 MW thermal input are limited to 500 hours of operation annually, in perpetuity, starting 1 January 2016. Our updated plans to ensure compliance are as follows:
Kirriemuir CompressorAt Kirriemuir we originally proposed to enter Unit D (RB211) into the Limited Life Derogation (LLD). Unfortunately due to an operational failure this machine has now been disconnected from the network as it is uneconomical to repair.
Consideration is being given to future resilience on site.
St Fergus CompressorAt St Fergus, we are proposing to reduce our fleet emissions in accordance with IPPC and address the LCP requirements.
Units 2A and 2D have entered the LLD, in line with the Scottish Environmental Protection Agency (SEPA) guidelines.
Assessments are underway to understand the most efficient way to meet future legislative constraints and anticipated gas flow patterns, including various options for new build alongside the rehabilitation of existing units with the use of innovative abatement technology.
Hatton CompressorTwo of the existing units at the site have been entered into LLD and the remaining gas-fired unit has been entered into the 500 hours derogation. This decision is based on the positive progress of the electric VSD unit which was operationally accepted in early 2016.
Further assessments are underway regarding additional capability at Hatton following predicted supply changes.
Carnforth CompressorOne of the RB211 units, previously on LLD, has since been removed from operation and it has been deemed uneconomical to repair. The second RB211 unit is to remain on 500 hours use in line with the derogation obtained from the Environment Agency. Options for minor site reconfiguration works are being considered, which would provide additional resilience via Nether Kellet Compressor.
Moffat CompressorThe two units at this site are to remain on 500 hours use in line with derogations obtained from the Environment Agency. Associated asset health works are being planned.
Warrington CompressorThe two units at site are to remain on 500 hours use in line with derogations obtained from the Environment Agency. Associated asset health works are being planned.
Wisbech CompressorThe Maxi Avon unit has already been replaced with an IED-compliant Avon unit. The RB211 unit is to remain on 500 hours use in line with derogation obtained from the Environment Agency.
5.2 Industrial Emissions Directive

Gas Ten Year Statement November 2017 113C
hapter five
As previously reported, phases 1 and 2 of our IPPC Emissions Reduction Programme are now complete. Replacement compressor units have been operationally accepted and commissioned as follows:• Early 2015 St Fergus (two new electrically driven units)
Kirriemuir (one new electrically driven unit).• Early 2016 Hatton (one new electrically driven unit).
During 2016, these new machines operated for approximately 10,000 hours on the National Transmission System (NTS).
5.3 Integrated Pollution Prevention and Control (IPPC) Directive
5.3.1 IPPC phase 1 and 2

Gas Ten Year Statement November 2017 114C
hapt
er five
Asset development
Phase 3 of the Emissions Reduction Programme includes investment at the Huntingdon and Peterborough compressor stations, to comply with IPPC NOx and CO emissions limits by 2021.
Extensive network analysis completed in 2014 confirmed that both sites are critical to current and future network operation. The analysis assessed network flows across a range of supply and demand conditions using our data produced from FES. This showed that future capability requirements are very similar to current capability provided at these sites.
The operation of both sites is affected by the distribution of supplies and the level of demand in the south of the system. The sites are needed to manage network flows in the south and east of the system, particularly at the 1-in-20 peak day demand level described by our Design Standard25 as defined in our transportation licence.
Peterborough and Huntingdon compressor stations are critical to maintaining flows and pressures on the NTS. At high demand levels, for example during winter, they are required to operate together. At lower demands they can be used interchangeably depending on network flows. This can provide network resilience, for example by allowing maintenance to be undertaken on one of the sites or maintaining minimum system pressures during unplanned outages.
Peterborough is also a key site for the north–south, east–west and west–east transfer of gas to manage flows from the north, from Milford Haven LNG terminal and to or from Bacton terminal. For phase 3, we are building one new gas turbine compressor at Huntingdon and one at Peterborough.
In 2015/16 a review of the delivery programmes across both sites was undertaken. The project delivery strategy was revised to commence early works at Huntingdon in 2016/17, with Peterborough following in 2017/18. Due to the planning delays there was no early works phase at Peterborough. Following their success at the procurement event held in 2016, Costain Oil & Gas will carry out main works at Huntingdon and the entire work scope at Peterborough.
A significant quantity of essential asset health investment was identified at both Peterborough and Huntingdon. These asset health works are financially separate from IPPC 3 and 4 core and extraordinary works scopes. However, they will be delivered using the mechanism of the IPPC Early Works and Main Works Contracts (MWC) to take advantage of contractual and outage efficiencies.
Huntingdon Early Works has been successfully delivered; the works were executed safely, with zero injuries and the project consistently averaged positive scores from monthly Safety Leadership visits. The works were delivered below our forecasts and the site was declared operationally available for winter running ahead of the planned return to service date.
The Main Works Contractor has recently mobilised to site at Huntingdon, and will mobilise to Peterborough in Q4 2017. This is to prepare the sites ahead of taking delivery of the compressor machinery train packages from Solar Turbines at Huntingdon and in Q3 2018 at Peterborough.
Activities successfully completed across 2016/17 keep both projects on schedule, with operational acceptance of the new units scheduled for 2020 at Huntingdon and for 2021 at Peterborough.
5.3.2 IPPC phase 3
25 To plan to meet the 1-in-20 peak aggregate daily demand, including but not limited to, within-day gas flow variations.

Gas Ten Year Statement November 2017 115C
hapter five
For IPPC, as per the May 2015 re-opener, we identified Peterborough, Huntingdon and St Fergus as the next priority sites for emission reduction. The works at Peterborough and Huntingdon are progressing alongside the aforementioned IPPC phase 3 works. At St Fergus we are progressing the pre-work sanction stage
of development. We are currently reviewing the overall compression requirements at both Huntingdon and Peterborough and at present our investment plan includes in total, two new units at Peterborough and two new units at Huntingdon. Further detail of our updated plans will be provided in the May 2018 reopener.
5.3.3 IPPC phase 4

Gas Ten Year Statement November 2017 116C
hapt
er five
Asset development
Under RIIO-T1, initial funding was agreed to install two new units at Aylesbury under LCP phase 1. Although the existing gas compressor units at this site are required to comply with the LCP Directive, the only non-compliance was related to the carbon monoxide (CO) Emission Limit Values (ELV).
Aylesbury compressor is a key site in a series of stations between Hatton in Lincolnshire and Lockerley in the south-west. These sites move flows around the system and are critical to support 1-in-20 peak day demand levels in the south-west.
At lower demand levels than the 1-in-20 peak day demand, these compressors can also be operated to manage linepack within the system, maintaining system resilience to plant failure, plant unavailability and within-day flow variation to the levels experienced on the network today. Under lower demand conditions Aylesbury provides an important role as a gas-powered backup site to Lockerley compressor station (downstream of Aylesbury). Lockerley has only electrically driven compressor units installed as a consequence of strict local planning constraints.
Through innovation and collaboration with our suppliers our proposed solution to meet the legislative requirement for CO ELV was the addition of a CO oxidation catalyst in the exhaust stack. This negated the need to build new units at this site. We have been working with Siemens to develop this solution. A number of other asset-related works are being delivered at Aylesbury as part of an overall upgrade package. Unit B was successfully commissioned to Operational Acceptance stage in Q1 2017. The catalyst solution has been proven to be operating at circa 98% efficiency level during working conditions.
Unit A moved from its commissioning phase to operational acceptance in Q2 2017, following the conclusion of asset health works. Asset acceptance and project closure is expected to conclude by Q1 2018.
Aylesbury has now received full permit variation confirmation for the new facility and its operating conditions. We have worked constructively with the Environment Agency to achieve this outcome, including approval of a new Continuous Emissions Monitoring System which formed a key part of the project’s delivery requirements.
The LCP has been superseded by IED. In this respect, the IED mirrors the requirements set out in the LCP. Of our 64 gas-driven compressor units, 16 are affected by the LCP. To decide what we should do we have looked at each affected site on a unit-by-unit basis. Work to comply with the LCP is currently underway at Aylesbury compressor station. Options for the other sites which have non-compliant units are included in our IED Investment Ofgem Submission.
To comply with the LCP, all installations with a thermal input over 50 MW must have Emission Limit Values (ELVs) below the following:• carbon monoxide (CO) – 100 mg/Nm3
• nitrogen oxide (NOx) – 75 mg/Nm3 for existing installations
• nitrogen oxide (NOx) – 50 mg/Nm3 for new installations.
Within National Grid this relates to RB211 and Maxi Avon gas driven plant.
5.4.1 Aylesbury Compressor
5.4 Large Combustion Plant (LCP) Directive

Gas Ten Year Statement November 2017 117C
hapter five
As we indicated in Section 2.4, the MCP Directive is currently in draft. Based on the draft legislation we have anticipated the likely impact on our compressor fleet. However, further analysis will need to be undertaken
to assess what options are available to comply with this new legislation. Stakeholder engagement activities, as used with the IED programmes, will be undertaken to ensure the best possible solutions are found.
As indicated in Section 2.5, the NTS is ageing. This means that asset health is becoming a more prominent issue for us.
Previously, the strategy we adopted for asset health investment was to focus on maintaining the condition of our primary assets (entry points, pipelines, multi-junctions, compressor stations and exit points) to avoid costly asset replacement. This strategy reduces the risk of long outages and network disruption.
For every asset health issue we are now considering whether the asset is still required, or if there is a more suitable alternative option. We consider all options including whether to maintain, replace or remove the asset. Reviewing each case like this will drive the most cost-effective solutions at each site.
The way gas enters and exits the NTS is changing. Our FES scenarios offer insight into gas usage behaviour both for the consumer and the supplier.
Our scenarios suggest that we need to be prepared for a decline in St Fergus flows. Historically the NTS was designed and operated to move the majority of UK gas supply from St Fergus (north) to demand in England and Wales (south). Lower supplies from St Fergus could make it difficult to meet current obligations in Scotland in a 1-in-20 demand scenario and we have
been considering options to mitigate this risk. Commercial options are currently being progressed, as discussed in Chapter 4.
As part of our ongoing strategy, flows are monitored and the flow decline has not been as severe as was expected at the time of the RIIO price submission. As discussed in Chapter 4, we do need to determine whether an asset-based solution will need to be implemented, but this does allow time to assess potential solutions against the network changes which the IED will bring.
5.5 Medium Combustion Plant (MCP) Directive
5.6 Asset health review
5.7 Meeting future flow patterns
Gas Ten Year Statement November 2017 118C
hapt
er five

Gas Ten Year Statement November 2017 119
Chapter sixWay forward 120
Gas Ten Year Statement November 2017 119

Gas Ten Year Statement November 2017 120C
hapt
er s
ix
Way forward
GTYS is an opportunity for us to outline our current operational and asset-based plans for developing the NTS to ensure we continue to meet the needs of our customers and stakeholders. We use this document to highlight any challenges that we see facing our future operation and planning of the NTS. As part of our annual review of the GTYS we analyse all customer and stakeholder feedback to ensure the publication is valuable for you and is fit for purpose.
We want to continue to engage with you, by involving you in our decision-making process, providing transparency on our processes and keeping you informed of our plans.
We have adopted the following principles to ensure the GTYS continues to add value:• we seek to identify and understand the
views and opinions of all our customers and stakeholders
• we provide opportunities for engagement throughout the GTYS process, enabling constructive debate
• we create an open and two-way communication process around assumptions, drivers and outputs
• we respond to all customer and stakeholder feedback and demonstrate how this has been considered.
6.1 Continuous development of GTYS
This chapter outlines our plans to continue the development of the GTYS and how we propose to engage with you over the coming year.

Gas Ten Year Statement November 2017 121C
hapter six
From the feedback used to shape GTYS 2015 and 2016, we have continued to align this year’s publication around the initial stages of our NDP.
GTYS 2017 also continues to:• provide greater clarity on which Direct
Connect offtakes are located in each exit region (see Chapter 3)
• include information on storage injectability by site as this would be of interest to you (see Appendix 4).
2017 publication feedbackWe welcome your feedback and comments on this edition of GTYS as it helps us to tailor the document to areas you value. Over 2017/18, we are keen to hear your views on the following areas of our gas transmission business:• Asset Health.• Industrial Emissions Directive.• Network Development Policy.• System Flexibility.
We will be holding a consultation event in early 2018 where we will be seeking your views on the 2017 GTYS. We will be asking you:• Whether the GTYS: – Explains the process we follow in order
to develop the NTS? – Illustrates the future needs and
development of the NTS in a coordinated and efficient way?
– Provides information to assist you in identifying opportunities to connect to the NTS?
• Which areas of the GTYS are of most value to you?
• Which areas of the GTYS can we improve?• Is there any additional information you
would like to see included in the GTYS?
If you would like to get involved in our consultation event or want to provide feedback please contact us at: [email protected].
We look forward to hearing from you.
6.2 2016/17 stakeholder feedback engagement

Gas Ten Year Statement November 2017 122C
hapt
er s
ix

Gas Ten Year Statement November 2017 123
Chapter sevenAppendix 124
Gas Ten Year Statement November 2017 123

Gas Ten Year Statement November 2017 124
Cha
pter
sev
en
Appendix 1 National Transmission System (NTS) maps
Figure A1.1 Scotland (SC) – NTS
Glenmavis
Aberdeen
Careston
Balgray
Armadale
Broxburn
Soutra
Hume
St. Fergus1050(78)
900(62)
1200(70)
900(47)
1050(43)
900(66)
900(
73)
900(6
2)
1050
(32)
1050
(85)
900(78)
900(138)
900(
75)
900(132)
1050(53)
600(51)
600(18)
900(26)
900(
58)
900(44)
900(29)
North
900(
15)
900(14)
900(
17)
600(16)
600(6)
600(31)600(14)
900(11)
900(16)
900(1)
900(
62)
900(17)
a
c1
d
Drum
900(
40)
b
Elvanfoot
Moffat
Kinknockie
LochsideKirriemuir
Bathgate
To N. Ireland / Eire
Nether Howcleugh
Lockerbie
1200(50)
A
B
Denotes a crossingpoint between LDZs
New compressor orcompressor modifications
Approved emissionsprojects
Terminal
LDZ boundary
Existing pipeline(with distance marker)
Pipeline diameter (mm)
Length (km)
Proposed pipeline
Offtake
Storage facility
Existing compressor
Alternative route
Uprating of pipelines

Gas Ten Year Statement November 2017 125
Chapter seven
Figure A1.2 North (NO) – NTS
i
Humbleton
Saltwick
Wetheral
Tow Law
Keld Cowpen Bewley
EltonLittleBurdon
Thrintoft
1050(79)
600(56)
1050(64)900(77)
600(1
6)
750(33)
750(18) 1050(22)
750(14)
1050(40)
900(66)
900(22)
North West North East
Scotland
900(2)
1050(17)
600(1)600(11) 600(4)
900(29)
750(24)
900(
65)
900(19)
ab
d
c1
e
f
g
h
Teesside
900(
5)
1050(29)
Wooler
Longtown
600(6)
BishopAuckland
Coldstream
Denotes a crossingpoint between LDZs
New compressor orcompressor modifications
Approved emissionsprojects
Terminal
LDZ boundary
Existing pipeline(with distance marker)
Pipeline diameter (mm)
Length (km)
Proposed pipeline
Offtake
Storage facility
Existing compressor
Alternative route
Uprating of pipelines

Gas Ten Year Statement November 2017 126
Cha
pter
sev
en
Figure A1.3 North West (NW) – NTS
Partington
Barrow
BlackrodBurscough
Treales
Warrington
Samlesbury
Malpas
Shocklach
Eccleston
MickleTrafford
WestonPoint
1050(51)900(21)
1050(40)
900(3)
900(1)
1050(61)
900(22)
600(5)
Holmes Chapel
North
North East
East M
idlands
West MidlandsWales
900(16)
900(17)
900(
59)
450(14)
600(27)
900(50)
450(10)450(15)
Lupton
Carnforth
e
f
s
r1
r3
t
900(18)
1050
(44)
1050
(38)
1050
(15)
450(32)600 (23)
900(34)
Warburton
1050(6)
1050(6)
BurtonPoint
1050(31)
1200(93)
r2
Nether Kellet
Denotes a crossingpoint between LDZs
New compressor orcompressor modifications
Approved emissionsprojects
Terminal
LDZ boundary
Existing pipeline(with distance marker)
Pipeline diameter (mm)
Length (km)
Proposed pipeline
Offtake
Storage facility
Existing compressor
Alternative route
Uprating of pipelines
Appendix 1 National Transmission System (NTS) maps

Gas Ten Year Statement November 2017 127
Chapter seven
Figure A1.4 North East (NE) – NTS
i
Baldersby
Pickering
Pannal
Towton
Asselby
Rawcliffe
Ganstead
Beeford
Paull
750(30)750 (53)
900(17)
900(24)900(24)
900(23)
1050(1)
900(3)
900(33)
900(25)
750(6)
750(25)
1050(43)
750(14)
750(16)
j k
g
h
Easington
Burley Bank
North
East Midlands
North W
est
1200(53)
1200(93)
1200(32)
900(8)
1200(65)
Goxhill
Walesby
1200(26.2)
1050(1)
Denotes a crossingpoint between LDZs
New compressor orcompressor modifications
Approved emissionsprojects
Terminal
LDZ boundary
Existing pipeline(with distance marker)
Pipeline diameter (mm)
Length (km)
Proposed pipeline
Offtake
Storage facility
Existing compressor
Alternative route
Uprating of pipelines

Gas Ten Year Statement November 2017 128
Cha
pter
sev
en
Figure A1.5 East Midlands (EM) – NTS
TheddlethorpeBlyborough
SilkWilloughby
Kirkstead
Gosberton
Sutton Bridge
CaldecottMarketHarborough
900(16)
900(35)
900(17)900(34)
750(36)
1050
(55)
TurLangton
Eastern
North East
900(32)
Blaby
900(11) 900(5) 900(5)
1050
(38)
900(17)900(51)
900(24)
900(19)
900(29)900(25)
900(2)
900(14)
750(1)
jj
m1n
o
p
q1
q2
Alrewas
South
m2
NorthWest
WestMidlands
Hatton
1050
(10)
1050
(25)
1200
(45)
C
1050
(55)
kj
Denotes a crossingpoint between LDZs
New compressor orcompressor modifications
Approved emissionsprojects
Terminal
LDZ boundary
Existing pipeline(with distance marker)
Pipeline diameter (mm)
Length (km)
Proposed pipeline
Offtake
Storage facility
Existing compressor
Alternative route
Uprating of pipelines
Appendix 1 National Transmission System (NTS) maps
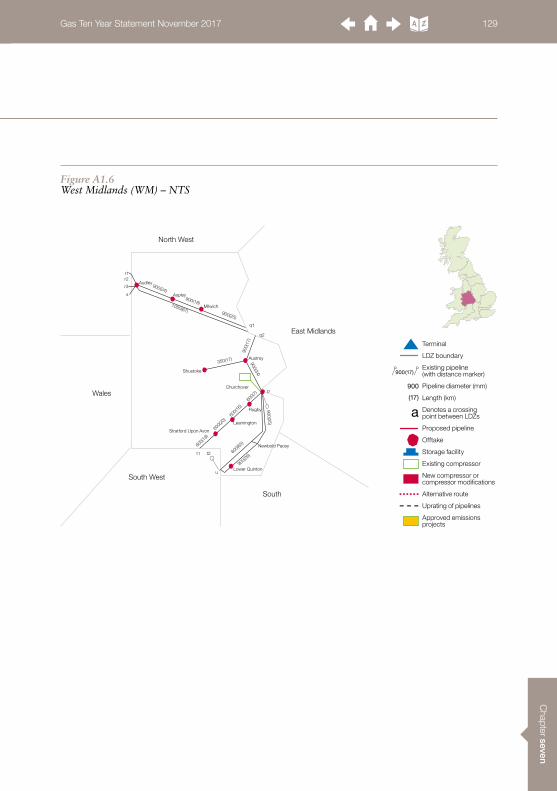
Gas Ten Year Statement November 2017 129
Chapter seven
Figure A1.6 West Midlands (WM) – NTS
Aspley
Leamington
Austrey
Shustoke
900(18)1050(67)
900(25)
350(17)
600(1
8)
600(6
5)
900(26)
900(34)
900(
17)
South
North West
South West
Stratford Upon Avon
Audley
Rugby
Milwich
900(24)
900(25)
600(2
0)60
0(16)
600(7
)
r2
s
q1
q2
pChurchover
t1
u
Wales
East Midlands
r1
Newbold Pacey
r3
t2
Lower Quinton
Denotes a crossingpoint between LDZs
New compressor orcompressor modifications
Approved emissionsprojects
Terminal
LDZ boundary
Existing pipeline(with distance marker)
Pipeline diameter (mm)
Length (km)
Proposed pipeline
Offtake
Storage facility
Existing compressor
Alternative route
Uprating of pipelines
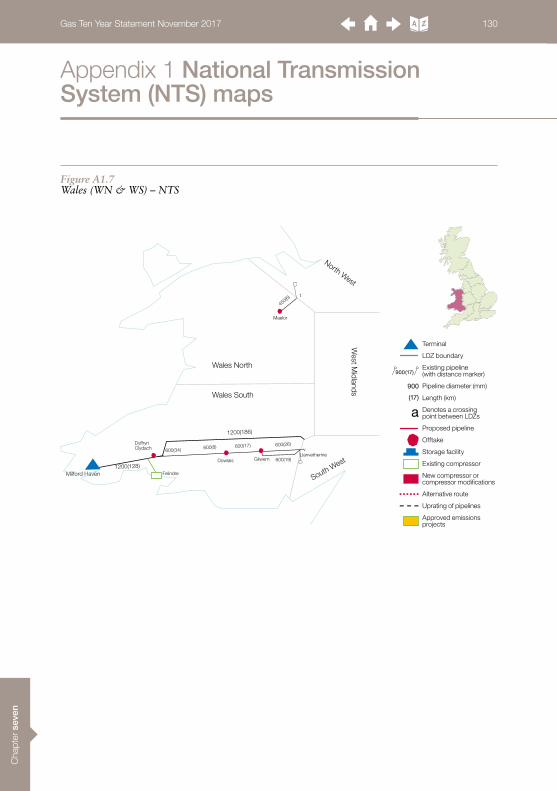
Gas Ten Year Statement November 2017 130
Cha
pter
sev
en
Figure A1.7 Wales (WN & WS) – NTS
t
Maelor
GilwernDowlais
DyffrynClydach
Milford Haven
600(26)
600(19)
600(17)600(8)600(34)
450(6)
West M
idlands
North West
South West
v
Wales North
Wales South
Llanvetherine
1200(186)
1200(128)Felindre
Denotes a crossingpoint between LDZs
New compressor orcompressor modifications
Approved emissionsprojects
Terminal
LDZ boundary
Existing pipeline(with distance marker)
Pipeline diameter (mm)
Length (km)
Proposed pipeline
Offtake
Storage facility
Existing compressor
Alternative route
Uprating of pipelines
Appendix 1 National Transmission System (NTS) maps

Gas Ten Year Statement November 2017 131
Chapter seven
Figure A1.8 Eastern (EA) – NTS
Bacton
West Winch
Brisley
Whitwell
Great Wilbraham
Chelmsford
Roudham Heath Yelverton
Stapleford
Diss
1050
(10)
900(4)
900(3
9)
900(26)1050(27)1050(19)
900(
64)
900(
41)
900(
43)
900(
24)
900(28)
900(10)
900(68)
900(41)
900(3)
900(5
4)
900(
90)
900(24) 900(2
8)
750(6
)
North Thames
South
East Midlands
900(16)
900(
16)
900(12)
900(11.5)
900(17)
900(24)
900(6
3)
900(
35)
Matching Green
900(1
4)
900(1
3)
Royston
900(9) 900(2)
900(23)
n
o
jj
900(15)
600(20)
600(
2)
900(
6)y
yy
x1
x2
m2m
900(
25)
zaa
Tydd St Giles
Kings Lynn
Wisbech
900(18)
900(38)
Cambridge
RoxwellSteppingley
Huntingdon
Lutton
Peterborough
Eye900(18)
900(
21)
900(21)
900(41)1200(46)
1200(65)D
E
Denotes a crossingpoint between LDZs
New compressor orcompressor modifications
Approved emissionsprojects
Terminal
LDZ boundary
Existing pipeline(with distance marker)
Pipeline diameter (mm)
Length (km)
Proposed pipeline
Offtake
Storage facility
Existing compressor
Alternative route
Uprating of pipelines

Gas Ten Year Statement November 2017 132
Cha
pter
sev
en
Figure A1.9 North Thames (NT) – NTS
Winkfield
Peters Green
Luxborough Lane
Horndon
750(15)
750(
9)
900(2
0)
600(8)
South East
Eastern
South
y
yy z
bb
dd
aa90
0(25
)
900(
9.5)
cc
Denotes a crossingpoint between LDZs
New compressor orcompressor modifications
Approved emissionsprojects
Terminal
LDZ boundary
Existing pipeline(with distance marker)
Pipeline diameter (mm)
Length (km)
Proposed pipeline
Offtake
Storage facility
Existing compressor
Alternative route
Uprating of pipelines
Appendix 1 National Transmission System (NTS) maps

Gas Ten Year Statement November 2017 133
Chapter seven
Figure A1.10 South East (SE) – NTS
Shorne
FarninghamTatsfield
750(
2)
Isle of Grain
600(20)
South
North Thames
750(25)
750(
14)
750(
16)
600(
1.5)
bb
600(
1.5)
cc
900(23.5)
Denotes a crossingpoint between LDZs
New compressor orcompressor modifications
Approved emissionsprojects
Terminal
LDZ boundary
Existing pipeline(with distance marker)
Pipeline diameter (mm)
Length (km)
Proposed pipeline
Offtake
Storage facility
Existing compressor
Alternative route
Uprating of pipelines

Gas Ten Year Statement November 2017 134
Cha
pter
sev
en
Figure A1.11 South (SO) – NTS
Braishfield
Mappowder600(21)
750(67)
600(2)
750(17)
900(
65)
900(
35)
900(
25)
900(
8)
900(
29)
South East
North Thames
Eastern
West Midlands
South West
900(
16)
750(
19)
750(
6)
w
dd
x1
x2
East Midlands
Nuffield
Lockerley
Aylesbury
Hardwick
900(
25)
900(3
1)
Ipsden
F
Denotes a crossingpoint between LDZs
New compressor orcompressor modifications
Approved emissionsprojects
Terminal
LDZ boundary
Existing pipeline(with distance marker)
Pipeline diameter (mm)
Length (km)
Proposed pipeline
Offtake
Storage facility
Existing compressor
Alternative route
Uprating of pipelines
Appendix 1 National Transmission System (NTS) maps

Gas Ten Year Statement November 2017 135
Chapter seven
Figure A1.12 South West (SW) – NTS
Evesham
FiddingtonRoss
Cirencester
Easton Grey
Pucklechurch
Seabank
Avonmouth
Ilchester
Aylesbeare
Kenn
600(
4)
600(
5)
600(44)900(30)600(4)
450(26)450(2)
450(
60)
600(9)600(15)
500(36)
600(36)
500(15)
Wales South
West Midlands
South
600(
38)
600(14)
600(8)
600(
17)
600(
24)
500(10)
150(9)
v
t
u
w
Wormington
900(26)
600(15)
600(16)
600(32)
600(33)
Choakford
900(
42)
1200(186)
600(10)
Littleton Drew
Barrington
Denotes a crossingpoint between LDZs
New compressor orcompressor modifications
Approved emissionsprojects
Terminal
LDZ boundary
Existing pipeline(with distance marker)
Pipeline diameter (mm)
Length (km)
Proposed pipeline
Offtake
Storage facility
Existing compressor
Alternative route
Uprating of pipelines

Gas Ten Year Statement November 2017 136
Cha
pter
sev
en
Appendix 2 Customer connections and capacity information
We are committed to environmental initiatives that combat climate change. During the last year, an increasing number of customers have asked about entry into our pipeline system for biomass-derived renewable gas. We have also received requests for gas entry from unconventional sources, such as coal bed methane.
We welcome these developments and would like to connect these supply sources to the NTS. To facilitate this, we have been reviewing the NTS oxygen specification which is far more stringent than the Gas Safety
Management Regulation (GS(M)R). As part of Project CLoCC we are continuing to review this limit and in the meantime will consider any request for increased oxygen content above the current NTS specification of 10ppm up to the GS(M)R specification of 2000ppm, on a case-by-case basis.
For further information on how we are reducing the time and cost of new connections to the NTS, please see Chapter 2, Section 2.2 regarding NIC-funded Project CLoCC.
We require a network entry agreement, storage connection agreement or interconnection agreement, as appropriate, with the respective operators of all delivery, storage and interconnector facilities. These
agreements establish, among other things, the gas quality specification, the physical location of the delivery point and the standards to be used for both gas quality and the measurement of flow.
2.1.1 Renewable gas connections
2.1 Additional information specific to system entry, storage and interconnector connections

Gas Ten Year Statement November 2017 137
Chapter seven
For any new entry connection to our system, the connecting party should tell us as soon as possible what the gas composition is likely to be. We will then determine whether gas of this composition would be compliant with our statutory obligations and our existing contractual obligations. From a gas quality perspective our ability to accept gas supplies into the NTS is affected by a range of factors, including the composition of the new gas, the location of the system entry point, volumes provided and the quality and volumes of gas already being transported within the system.
In assessing the acceptability of the gas quality of any proposed new gas supply, we will consider:• our ability to continue to meet statutory
obligations, including, but not limited to, the GS(M)R
• the implications of the proposed gas composition on system running costs
• the implications of the new gas supply on our ability to continue to meet our existing contractual obligations.
For indicative purposes, the specification in table A2.1 is usually acceptable for most locations. This specification encompasses, but is not limited to, the statutory requirements set out in the GS(M)R.
2.1.2 Network entry quality specification
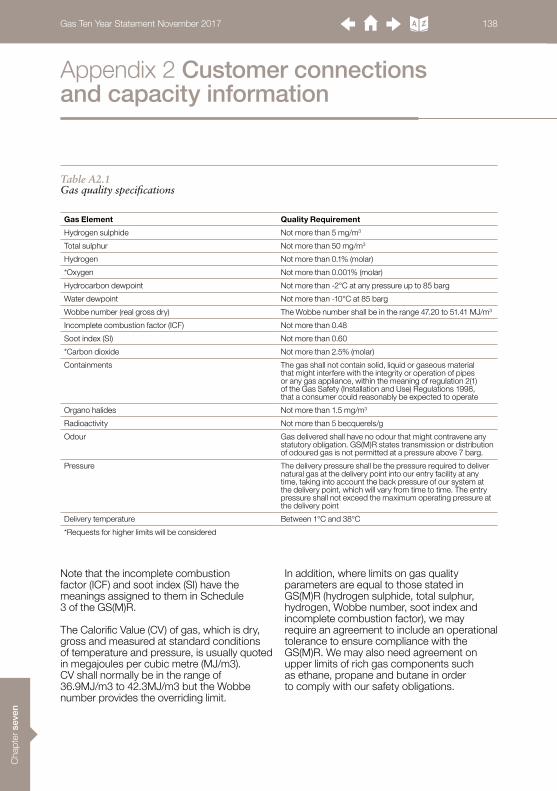
Gas Ten Year Statement November 2017 138
Cha
pter
sev
en
Appendix 2 Customer connections and capacity information
Note that the incomplete combustion factor (ICF) and soot index (SI) have the meanings assigned to them in Schedule 3 of the GS(M)R.
The Calorific Value (CV) of gas, which is dry, gross and measured at standard conditions of temperature and pressure, is usually quoted in megajoules per cubic metre (MJ/m3). CV shall normally be in the range of 36.9MJ/m3 to 42.3MJ/m3 but the Wobbe number provides the overriding limit.
In addition, where limits on gas quality parameters are equal to those stated in GS(M)R (hydrogen sulphide, total sulphur, hydrogen, Wobbe number, soot index and incomplete combustion factor), we may require an agreement to include an operational tolerance to ensure compliance with the GS(M)R. We may also need agreement on upper limits of rich gas components such as ethane, propane and butane in order to comply with our safety obligations.
Table A2.1 Gas quality specifications
Gas Element Quality Requirement
Hydrogen sulphide Not more than 5 mg/m3
Total sulphur Not more than 50 mg/m3
Hydrogen Not more than 0.1% (molar)
*Oxygen Not more than 0.001% (molar)
Hydrocarbon dewpoint Not more than -2°C at any pressure up to 85 barg
Water dewpoint Not more than -10°C at 85 barg
Wobbe number (real gross dry) The Wobbe number shall be in the range 47.20 to 51.41 MJ/m3
Incomplete combustion factor (ICF) Not more than 0.48
Soot index (SI) Not more than 0.60
*Carbon dioxide Not more than 2.5% (molar)
Containments The gas shall not contain solid, liquid or gaseous material that might interfere with the integrity or operation of pipes or any gas appliance, within the meaning of regulation 2(1) of the Gas Safety (Installation and Use) Regulations 1998, that a consumer could reasonably be expected to operate
Organo halides Not more than 1.5 mg/m3
Radioactivity Not more than 5 becquerels/g
Odour Gas delivered shall have no odour that might contravene anystatutory obligation. GS(M)R states transmission or distribution of odoured gas is not permitted at a pressure above 7 barg.
Pressure The delivery pressure shall be the pressure required to delivernatural gas at the delivery point into our entry facility at any time, taking into account the back pressure of our system at the delivery point, which will vary from time to time. The entry pressure shall not exceed the maximum operating pressure at the delivery point
Delivery temperature Between 1°C and 38°C
*Requests for higher limits will be considered

Gas Ten Year Statement November 2017 139
Chapter seven
EU gas quality harmonisationThe European Committee for standardisation (CEN) published its gas quality standard EN 16726 in December 2015. The standard covers a number of gas quality parameters but does not include the key safety parameter of Wobbe Index because EU level agreement could not be reached. While the application of the standard to member states is voluntary, the EC stated its intention to make it legally binding via an amendment to the EU Interoperability Network Code and in 2016 asked ENTSOG to lead an initiative with stakeholders to examine the impacts and issues associated with doing so. ENTSOG’s work concluded that the standard should not be made binding, which the EC agreed with at the Madrid Forum in October 2016. However, the EC also invited CEN to continue its work on a harmonised Wobbe Index for inclusion in the standard and stated that it would revisit harmonisation again upon the conclusion of this work, which is likely to be around 2020. The Sector Forum Gas committee within CEN established a number of taskforces to achieve this and while there is no direct GB representation, National Grid is currently able to monitor developments, contribute via ENTSOG and provide progress updates to the industry.
GB developmentsThe Institute of Gas Engineers and Managers (IGEM) has established an industry working group to explore changes to the GB gas specifications in the GS(M)R. This group is investigating whether the upper Wobbe Index limit can be increased; this has been recommended by SGN following the conclusion of Opening up the Gas Market (OGM). OGM involved a year-long field trial of wider Wobbe gas injected and utilised within Oban, one of the Scottish Independent Undertakings (SIUs). More information about OGM can be found on the SGN website https://www.sgn.co.uk/oban/. This working
group is also considering whether the gas quality specification contained in the GS(M)R can be transferred to an IGEM standard.
Within GB, carbon dioxide has again been the subject of industry debate. In December 2016, BP raised UNC Modification 0607S in order to facilitate an increase in the carbon dioxide limit at the North Sea Midstream Partners sub-terminal at St Fergus from 4.0mol% to 5.5mol%. BP are seeking this change in order to facilitate continued gas flows from the high CO2 Rhum gas field (and others that feed into the offshore pipeline that delivers gas into the NSMP terminal) in the event that lower CO2 gas is unavailable to blend offshore to meet the current specification. While our analysis indicates that such a limit would be acceptable for NSMP volumes at St Fergus, it is not a limit that we could currently accommodate more generally on the NTS. Therefore, at the time of writing, the modification had been amended to be time-limited and provide National Grid with a right to review the limit if such flexibility were requested by others that could not otherwise be accommodated. In October 2017, we issued a separate consultation to the industry about the likelihood of future requests to widen gas quality specifications, review the current change process and explore any demand for National Grid gas quality services in the longer term.
Project CLoCC aims to facilitate new sources of gas to connect to the NTS. In order to facilitate the connection of biomethane customers in particular, any requests for oxygen specification in excess of the NTS requirement and within the GS(M)R limit will be considered on a case-by-case basis.
The development of shale gas is still in its infancy in the UK and at present there is uncertainty over the quality of such gas until wells are drilled. We will continue to work with customers and monitor developments in this area.
2.1.3 Gas quality developments

Gas Ten Year Statement November 2017 140
Cha
pter
sev
en
Appendix 2 Customer connections and capacity information
The PARCA framework is split into four logical phases: Phase 0 to Phase 3. This phased structure gives the customer natural decision points where they can choose whether to proceed to the next phase of activities.
Regardless of these natural decision points the PARCA process is flexible enough to allow the customer to leave the process at any time before full financial commitment to the capacity through capacity allocation.
This phase is a bilateral discussion phase between the customer and National Grid with no defined timescales. It allows the customer and National Grid to understand each other’s processes and potential projects before the customer decides whether to formally enter the PARCA process. If the customer wants to
proceed into the PARCA process after these discussions, they must submit a valid PARCA application form and pay a PARCA application fee. Our PARCA application form can be found at: https://www.nationalgrid.com/uk/gas/connections/reserving-capacity-parca- and-cam
2.2 The PARCA Framework Process
2.2.1 Overview of the four phases
Phase 0 – Bilateral Discussions (no defined timescales)
Phase 0
Customer approaches National Grid for initial project discussions
Informal assessment completed
Customer submits PARCA application and PARCA application fee
Phase 1 – Works and PARCA contract (up to six months)
Phase 1Up to 6 months
National Grid confirm receipt of the application within 2 business days
National Grid provides formal acceptance of a competent application to the customer within 6 business days
National Grid initiate Phase 1 Works
Within 10 business days National Grid may trigger a PARCA Window and an adhoc QSEC capacity auction
National Grid will issue the customer with the Phase 1 Output Report & the PARCA contract

Gas Ten Year Statement November 2017 141
Chapter seven
When we receive a valid PARCA application form and payment of the application fee from the customer, we will tell them their PARCA application has been successful and Phase 1 of the PARCA process will begin. During Phase 1 we will publish relevant information to the industry and, through the opening of a PARCA window, invite PARCA applications from other customers.
We will then explore a number of ways of delivering the capacity. This may be wholly through (or a combination of) existing network capability, substitution of capacity, a contractual solution or physical investment in the NTS. We will complete these works within six months of the start of Phase 1.
We also release long-term NTS capacity through established UNC capacity auction and application processes, more specifically:• Long-term NTS entry capacity that is sold
in quarterly strips through the Quarterly System Entry Capacity auction (QSEC) held annually in March.
• Long-term NTS Exit Capacity that is sold as an enduring (evergreen) product through the Enduring Annual NTS Exit Application process held annually in July.
So it’s important to bear in mind that existing system capacity that could be used to fully or partly satisfy a PARCA request may also be requested by our customers through those processes detailed above. As such it may not be appropriate to initiate the Phase 1 works of a PARCA while the QSEC or enduring annual processes are running because it may not be clear how much existing capacity will be available to satisfy a PARCA request for the purposes of the Phase 1 studies.
The timetable below (Figure A2.1) shows the annual QSEC auction and enduring exit capacity application and potential periods where we decide not to start Phase 1 PARCA works.
Annual QSEC Auction
QSEC invitation
QSEC bid window
Allocaton of QSEC bids
Entry Capacity PARCA Annual
Phase 1 of an entry capacity PARCA may not be initiated if there is an interaction with the ongoing annual QSEC auction process
Enduring Exit Application
Exit invitation
Exit capacity window
Allocation of exit capacity
Exit Capacity PARCA
Phase 1 of an entry capacity PARCA may not be initiated if there is an interaction with the ongoing annual Exit capacity application window
Figure A2.1 Annual Entry and Exit capacity application windows

Gas Ten Year Statement November 2017 142
Cha
pter
sev
en
Appendix 2 Customer connections and capacity information
PARCA windowThe purpose of the PARCA window is to encourage those customers considering applying for a PARCA to submit their application at this time, so that we can assess how to meet their capacity need alongside other potential projects.
For any PARCA application deemed competent outside a relevant PARCA window, within 10 business days of the initiation of the Phase 1 works of that PARCA we will open (where a window is not already open) either a PARCA entry or exit window. A notice will be published on our PARCA webpages, which can be accessed at: https://www.nationalgrid.com/uk/gas/connections/reserving-capacity-parca-and-cam
We guarantee to consider together all PARCA applications submitted and deemed competent within this window. However, it is important to note that if you wish to be considered for capacity alongside other PARCA applications, in order to ensure we can conduct our competency check within the PARCA window timescales, please endeavour to submit your application as early as practically possible. Figure A.2.2 outlines the PARCA window timeline.
Figure A2.2 PARCA window timeline
PARCA entry window opens
Opened within 10 days Further applications received
PARCA entry window closes
Closes 40 business days after the window was opened
Closes 20 business days after the window was opened if no further entry applications received
PARCA exit window opens
Opened within 10 days Further applications received
PARCA exit window closes
Closes 40 business days after the window was opened
Closes 20 business days after the window was opened if no further exit applications received

Gas Ten Year Statement November 2017 143
Chapter seven
The PARCA window is open for a maximum of 40 consecutive business days but will close after 20 consecutive business days if no further PARCA applications have been received within that time. There are two types of PARCA window:• Entry window – triggered if a PARCA
requests NTS entry capacity.• Exit window – triggered if a PARCA
requests NTS exit capacity.
Only one entry and/or exit PARCA window can be open at any one time. So if a PARCA application requesting entry/exit capacity is deemed competent within an open entry/exit PARCA window, an additional PARCA window will not be triggered.
On completion of Phase 1 we will provide the customer with an output report, which will include a Need Case report (establishes and documents the potential Need Case for investment, a technical options report and a PARCA contract).
When the contract is counter-signed, we will reserve the capacity on the customer’s behalf, from the date provided in the Phase 1 output report.
If the output report shows that physical reinforcement of the NTS is needed to provide the customer with their capacity, we will start the statutory planning consent at this stage; either the Planning Act or Town & Country Planning. If no physical reinforcement
is needed we will continue to reserve the capacity in accordance with the timelines provided as part of the Phase 1 output report.Phase 2 ends when the reserved capacity is allocated to the customer or, where the customer is a non-code party, a nominated code party(s). Once allocated and the capacity is financially committed to, the PARCA contract ends and we begin the capacity delivery phase (Phase 3).
Phase 2 – (up to 60 months)
Phase 2Up to 60 months
National Grid will reserve the capacity on behalf of the customer (Reservation Date)
National Grid initiate the Phase 2 Works
Customer provides demonstration information and annual financial security
Where customer is a non-code party, nominates a User(s) at least one month prior to capacity allocation date
National Grid formally allocate the capacity to the customer (Allocation Date)

Gas Ten Year Statement November 2017 144
Cha
pter
sev
en
Appendix 2 Customer connections and capacity information
Once the capacity is formally allocated, the PARCA contract expires and the capacity delivery Phase 3 is initiated. This is where we carry out necessary activities, such as reinforcing the NTS to deliver the allocated capacity. Please note that on allocation of
any reserved NTS capacity, the Uniform Network Code (UNC) user commitment applies.
The PARCA allows you to reserve capacity but it does not provide you with an NTS connection.
Phase 3 – (up to 24 months)
Phase 3Up to 24 months
We will conduct network reinforcement if this is required
Capacity is delivered (Registration Date)

Gas Ten Year Statement November 2017 145
Chapter seven
Our role within the Gas Customer Account Management team is to effectively manage business relationships with all our gas industry customers and stakeholders through ownership of the overall customer experience.
We coordinate a consistent customer approach across all value streams and transportation operations.
We deliver customer intelligence and represent the voice of our customers within
our business to help shape and inform key business decisions through a deeper understanding of your business requirements.Our dedicated team will be your first point of contact:
The Gas Customer Account Management team – [email protected]
Tracy PhippsGas Customer Account Manager
Our role within the Gas Contract Management team is to manage and deliver all commercial aspects of your connection, diversion and/or PARCA processes by understanding and developing solutions that meet your needs.We deliver all commercial and contractual changes including modifications to your connection including distribution network offtake arrangements, associated operator agreement changes, framework changes and manage the UNC customer lifecycle processes and obligations.
Our dedicated team will manage your connection, diversions and all PARCA applications:
The Gas Contract Management team – [email protected]
Eddie Blackburn Gas Contract Portfolio Manager
Andrea Godden Gas Contracting Commercial Manager
Belinda Agnew Gas Connections Contract Manager
Claire Gumbley Gas Connections Contract Manager
Louise McGoldrick Gas Connections Contract Manager
Richard Hounslea Gas Connections Contract Manager
Steven Ruane Gas Connections Contract Manager
Jeremy Tennant Gas Connections Support Assistant
Mark Lyndon Gas Connections Contract Manager
Graham Standring Gas Connections Contract Manager
3.1 Our Gas Customer Account Management team
3.2 Our Gas Contract Management team
Appendix 3 Meet the teams
Gas Ten Year Statement November 2017 146
Cha
pter
sev
en
Our role within the Operational Liaison team is to manage and deliver a wide range of customer-facing meetings/forums, some of which include:• Gas Operational Forum – A forum to
discuss key operational topics to a wide variety of customers such as Shippers, Terminal Operators and Storage Operators. The forum is open to the whole energy industry. To find out more please click on the following link: https://www.nationalgrid.com/uk/gas/market-operations-and-data/transmission-operational-data.
• System Operator Forum – A quarterly forum that ensures we continue to work as a community of System Operators, coming together for the benefit of gas consumers.
• Annual liaison meetings – These help us sustain a positive relationship with our Terminal and Storage Operators by formally meeting face to face to discuss a wide range of operational topics such as gas quality and maintenance.
We are also the business custodian for query management of Market Information Provision Initiative Data and GB REMIT. Our dedicated team will be your first point of contact via the following contact details:
The Operational Liaison team – [email protected]
Karen Thompson Operational Liaison Manager
Anvinder Thiara Operational Liaison Lead
Hayley Johnson Operational Liaison Analyst
Claire O’Grady Operational Liaison Analyst
Chris Martin Liaison Support Assistant
Dally Powar Liaison Support Assistant
3.3 Our Operational Liaison team
Appendix 3 Meet the teams

Gas Ten Year Statement November 2017 147
Chapter seven
GB is served through a diverse set of import routes from Norway, the Netherlands, Belgium and from other international sources through the LNG import terminals. Total import capacity is currently around 149 bcm/year, split into three near equal parts: the continent (43 bcm/year), Norway (56 bcm/year)26 and LNG (49 bcm/year).
Table A4.1 shows existing import infrastructure and Table A4.2 shows proposals for further import projects.
4.1 Import infrastructure
Appendix 4 Import and storage infrastructure
Table A4.1 Existing import infrastructure
26 Norwegian import capacity through Tampen and Gjoa is limited by available capacity in the UK FLAGS pipeline
Facility Operator / Developer Type Location Capacity (bcm/year)
Interconnector IUK Pipeline Bacton 26.9
BBL Pipeline BBL Company Pipeline Bacton 16.4
Isle of Grain 1-3 National Grid LNG Kent 20.4
South Hook 1-2 Qatar Petroleum and ExxonMobil
LNG Milford Haven 21
Dragon 1 Shell / Petronas LNG Milford Haven 7.6
Langeled Gassco Pipeline Easington 26.3
Vesterled Gassco Pipeline St Fergus 14.2
Tampen Gassco Pipeline St Fergus 9.8
Gjoa Gassco Pipeline St Fergus 6.2
Total 148.8
Source: National Grid

Gas Ten Year Statement November 2017 148
Cha
pter
sev
en
Appendix 4 Import and storage infrastructure
27 This list is no way exhaustive; other import projects have at times been detailed in the press.
Table A4.2 Proposed import projects27
Project Operator / Developer
Type Location Start-up Capacity (bcm/year)
Status
Isle of Grain 4 National Grid LNG Kent ~ ~ Open Season
Norsea LNG ConocoPhillips LNG Teesside ~ ~ Planning Granted, no FID. Currently on Hold
Port Meridian Port Meridian Energy
LNG Barrow, Cumbria
~ 5 Open Season
Amlwch Halite Energy LNG Anglesey ~ ~30 Approved
Source: National Grid

Gas Ten Year Statement November 2017 149
Chapter seven
In the last 12 months no proposals have attained a Final Investment Decision (FID) for subsequent construction. The following
tables detail UK storage in terms of existing storage sites, those under construction and proposed sites.
Note, due to operational considerations, the space and deliverability will not be fully consistent with that used for operational planning as reported in our 2017/18 Winter Outlook Report.
In June 2017 Centrica Storage announced the closure of Rough as a storage facility. Some gas will be withdrawn in winter 2017/18 with deliverability starting at around 12 mcm/day at the end of September, and falling to around 6 mcm/day as gas is withdrawn and the pressure falls. This is principally a safety measure, designed to lower the pressure in the reservoir, rather than a commercial
supply of gas. There will still be gas left in Rough: the ‘cushion gas’, normally used to maintain operating pressure. Centrica Storage intend to apply for permission to produce all recoverable gas from the field, though this will then be classified as a producing field, not a storage site. For more information please see the Centrica Storage website28.
Over the last few years, a number of projects have been put on hold or cancelled. These include Aldborough 2, Baird, Caythorpe, Gateway and Portland. Table A4.4 shows other proposed storage sites.
4.2 Storage infrastructure
Table A4.3 Existing storage sites
28 http://www.centrica-sl.co.uk/home
Site Operator / Developer
Location Space (bcm) Approximate max delivery (mcm/d)
Rough Centrica Storage Southern North Sea - -
Aldborough SSE/Statoil East Yorkshire 0.3 40
Hatfield Moor Scottish Power South Yorkshire 0.07 1.8
Holehouse Farm EDF Trading Cheshire 0.022 5
Holford E.ON Cheshire 0.2 22
Hornsea SSE East Yorkshire 0.3 18
Humbly Grove Humbly Grove Energy
Hampshire 0.3 7
Hill Top Farm EDF Energy Cheshire 0.05 12
Stublach Storenergy Cheshire 0.2 15
Total 1.44 120.8
Source: National Grid

Gas Ten Year Statement November 2017 150
Cha
pter
sev
en
Please note Tables A4.1, A4.2, A4.3 and A4.4 represent the latest information available to National Grid at time of going to press. Developers are welcome to contact us to add or revise this data.
TableA4.4 Proposed storage projects29
29 This list is in no way exhaustive; other storage projects at times have been detailed in the press.
Appendix 4 Import and storage infrastructure
Project Operator/Developer
Location Space (bcm) Status
Gateway Stag Energy Offshore Morecambe Bay
1.5 Planning granted, no FID
Deborah Eni Offshore Bacton 4.6 Planning granted, no FID
Islandmagee InfrasStrata County Antrim, Northern Ireland
0.5 Planning granted, no FID
King Street King Street Energy Cheshire 0.3 Planning granted, no FID
Preesall Halite Energy Lancashire 0.6 Planning granted, no FID
Saltfleetby Wingaz Lincolnshire 0.8 Planning granted, no FID
Whitehill E.ON East Yorkshire 0.4 Planning granted, no FID
Total 8.7
Source: National Grid
Gas Ten Year Statement November 2017 151
Chapter seven
In Chapter 2, Section 2.4, we discussed the European Union (EU) Third Package of energy legislation which was introduced in 2009. Over the last six years, we have been working with the European Network of Transmission System Operators for Gas (ENTSOG), the European Commission, the Agency for the Cooperation of Energy Regulators (ACER), Ofgem, the UK Government, other Transmission System Operators (TSOs) and the industry to enable the development of several EU gas Network Codes (Capacity Allocation Mechanism (CAM), Balancing (BAL) Interoperability and Data Exchange (INT) and Tariffs (TAR)).
We have influenced the EU Code developments and supported the industry and our customers, through a process of extensive dialogue involving stakeholder working sessions, technical workshops and a number of consultations.
We have changed our contractual arrangements with other TSOs at Bacton (connecting to Belgium and the Netherlands) and at Moffat (connecting Northern Ireland and the Republic of Ireland to Great Britain) to ensure we comply with the new legislation.
Since 1 October 2015 the UK market aligned to the EU standard gas day of 5am to 5am. This facilitated the operation of the BAL and CAM codes from 1 October 2015 and 1 November 2015 respectively. Elements of the INT code were also implemented from 1 October 2015.
In accordance with article 6 of CAM, we continue to meet once a year with adjacent TSOs at Bacton and Moffat to discuss, analyse and agree the amount of available capacity at Interconnection Points (IP) that would be offered in the annual yearly capacity auction.
From 7 April 2016, National Grid began reporting information on nominations and primary capacity allocations for the GB system in accordance with the requirements of the Implementing Regulation for the Regulation on Wholesale Market Integrity and Transparency (REMIT).
During 2016, we also worked with the industry to provide input to ENTSOG’s process concerning whether the EU gas quality standard developed by CEN should be made legally binding. In October 2016, the EC announced that it was no longer pursuing this at this stage, although it may revisit the issue in the future if CEN incorporates a harmonised Wobbe Index into the standard.
To date, the UNC modifications to implement the EU Codes and Guidelines are:a 0449 (Introduction of Interconnection Points
and new processes and transparency requirements to facilitate compliance with the EU Congestion Management Procedures). Implemented with effect from 6:00am on 1 October 2013; it is superseded by text introduced under 0500.
b 0461 (Changing the UNC Gas Day to Align with Gas Day under EU Network Codes). Implemented with effect from 5:00am on 1 October 2015.
c 0485 (Introduction of long-term use-it-or-lose-it mechanism to facilitate compliance with EU Congestion Management Procedures). Implemented with effect from 6:00am on 30 September 2014; it is superseded by text introduced under 0500.
d 0489 (EU Gas Balancing Code – Information Provision changes required to align the UNC with the EU Code). Implemented with effect from 5:00am on 1 October 2015.
e 0493 (EU Gas Balancing Code Daily Nominations at Interconnection Points (IP)). Implemented with effect from 6:00am on 19 June 2015.
5.1 Our activity to date
Appendix 5 EU activity

Gas Ten Year Statement November 2017 152
Cha
pter
sev
en
f 0494 (Imbalance Charge amendments required to align the UNC with the Network Code on Gas Balancing of Transmission Networks). Implemented with effect from 5:00am on 1 October 2015.
g 0500 (EU Capacity Regulations Capacity Allocation Mechanisms with Congestion Management Procedures). Implemented with effect from 6:00am on 19 June 2015.
h 0501V (Treatment of Existing Entry Capacity Rights at the Bacton ASEP to comply with EU Capacity Regulations). Implemented with effect from 6:00am on 21 July 2015. The process established by this modification (for allocation of capacity held by shippers between the new ASEPs at Bacton) was completed on 28 August 2015.
i 0510V (Reform of Gas Allocation Regime at GB Interconnection Points). Implemented with effect from 5:00am on 1 October 2015.
j 0519 (Harmonisation of Reference Conditions at Interconnection Points). Implemented with effect from 5:00am on 1 October 2015.
k 0525 (Enabling EU-compliant Interconnection Agreements). Implemented with effect from 5:00am on 1 October 2015.
l 0546S (Reduction of the Minimum Eligible Quantity (100,000kWh) for European IP capacity).
m 0547S (Corrections to the EID arising from implementation of Modifications 0493/0500).
n 0562FT (Amendment to the Effective Date of Modification 0519 ‘Harmonisation of Reference Conditions at Interconnection Points). Implemented with effect from 5:00am on 6 November 2015.
o 0567S (Amendment to Reference Temperature Conditions within the National Grid – IUK Interconnection Agreement). Implemented with effect from 5:00am on 12 February 2016.
p 0597 (Rules for the Release of Incremental Capacity at Interconnection Points). Implemented with effect from 5:00am on 6 April 2017.
q 0598S (Amendments to Capacity Allocation Mechanisms to comply with EU Capacity Regulations). Implemented with effect from 5:00am on 6 April 2017.
r 0611S (Amendments to the Firm Capacity Payable Price at Interconnection Points). Implemented with effect from 5:00am on 11 August 2017.
Appendix 5 EU activity

Gas Ten Year Statement November 2017 153
Chapter seven
5.2 Our future activity
5.2.1 2017 onwards
The CAM and TAR codes have recently gone through the comitology30 process involving EU Member States and the Commission. The entry into force date for both was 6 April 2017. A number of changes to GB
arrangements will be required to deliver these codes/changes between 2017 and 2019. Modifications 597, 598s, 611s, 616s and 621 have been raised to this effect.
Some further details on the changes to be implemented for the next couple of years are as follows:• An EU-wide Network Code on Harmonised
Transmission Tariff Structures for Gas which needs to be implemented by end 2018/early 2019 for use in 2019. This code will include rules for the application of a reference price methodology for the calculation of reserve prices for standard capacity products, as well as the associated consultation and publication requirements.
• An amendment proposal to the existing Rolling Quarterly Auction, and the introduction of a Capacity Conversion mechanism from 1 January 2018 onwards.
• Transparency: additional transparency requirements need to be published throughout this period.
• Gas Security of Supply arrangements: Over the past year-and-a-half the revision of the EU Gas Security of Supply Regulation has been negotiated within Europe. It is a directly applicable EU regulation expected to have effect from the latter part of 2017. Within the regulation are several key milestones for implementation, particularly the introduction of the principle of solidarity required by December 2018. Currently National Grid is working with BEIS and Ofgem to assess the impact of the revised regulation and activities required for implementation.
30 Comitology refers to a set of procedures through which EU countries control how the European Commission implements EU law.

Gas Ten Year Statement November 2017 154
Cha
pter
sev
en
Appendix 6 Conversion matrix
To convert from the units on the left-hand side to the units across the top multiply by the values in the table.
GWh mcm Million therms
Thousand toe
GWh 1 0.091 0.034 0.086
mcm 11 1 0.375 0.946
Million therms 29.307 2.664 1 2.520
Thousand toe 11.630 1.057 0.397 1
Note: all volume to energy conversions assume a calorific value (CV) of 39.6 MJ/m3
GWh = Gigawatt hoursmcm = Million cubic metresThousand toe = Thousand tonne of oil equivalent MJ/m3 = One million joules per metre cubed

Gas Ten Year Statement November 2017 155
Chapter seven
Acronym Term Definition
Annual power demand The electrical power demand in any one fiscal year. Different definitions of annual demand are used for different purposes.
ACS Average cold spell Average cold spell: defined as a particular combination of weather elements which gives rise to a level of winter peak demand which has a 50% chance of being exceeded as a result of weather variation alone. There are different definitions of ACS peak demand for different purposes.
AGI Above-ground installation To support the safe and efficient operation of the pipeline, above-ground installations (AGIs) are needed at the start and end of the cross-country pipeline and at intervals along the route.
ANOP Anticipated Normal Operating Pressure
A pressure that we may make available at an offtake to a large consumer connected to the NTS under normal operating conditions. ANOPs are specified within the NExA agreement for the site.
AOP Assured Offtake Pressure A minimum pressure at an offtake from the NTS to a DN that is required to support the downstream network.
AQ Annual Quantity The AQ of a Supply Point is its annual consumption over a 365-day year.
ARCA Advanced Reservation of Capacity Agreement
This was an agreement between National Grid and a shipper relating to future NTS pipeline capacity for large sites in order that shippers can reserve NTS Exit Capacity in the long term. This has been replaced by the PARCA process. (See also PARCA)
ASEP Aggregate System Entry Point
A System Entry point where there is more than one, or adjacent Connected Delivery Facilities; the term is often used to refer to gas supply terminals.
Bar The unit of pressure that is approximately equal to atmospheric pressure (0.987 standard atmospheres). Where bar is suffixed with the letter g, such as in barg or mbarg, the pressure being referred to is gauge pressure, i.e. relative to atmospheric pressure. One millibar (mbarg) equals 0.001 bar.
BAT Best Available Technique A term used in relation to Industrial Emissions Directive (IED) 2010. In this context BAT is defined as Best Available Technique and means applying the most effective methods of operation for providing the basis for emission limit values and other permit conditions designed to prevent and, where that is not practicable, to reduce emissions and the impact on the environment as a whole.
BBL Balgzand–Bacton Line A gas pipeline between Balgzand in the Netherlands and Bacton in the UK. http://www.bblcompany.com. This pipeline is currently uni-directional and flows from the Netherlands to the UK only.
Baseload electricity price The costs of electricity purchased to meet minimum demand at a constant rate.
bcm Billion cubic metres Unit or measurement of volume, used in the gas industry. 1 bcm = 1,000,000,000 cubic metres.
Biomethane Biomethane is a naturally occurring gas that is produced from organic material and has similar characteristics to natural gas. http://www.biomethane.org.uk/
Boil-off A small amount of gas which continually boils off from LNG storage tanks. This helps to keep the tanks cold.
BEIS Department of Business, Energy & Industrial Strategy
A UK government department. The Department of Business, Energy & Industrial Strategy (BEIS) works to make sure the UK has secure, clean, affordable energy supplies and promote international action to mitigate climate change. These activities were formerly the responsibility of the Department of Energy and Climate Change (DECC), which closed in July 2016.
BREF BAT Reference Documents BAT Reference Documents draw conclusions on what the BAT is for each sector to comply with the requirements of IED. The BAT conclusions drawn as a result of the BREF documents will then form the reference for setting permit conditions.
Capacity Capacity holdings give NTS Users the right to bring gas onto or take gas off the NTS (up to levels of capacity held) on any day of the gas year. Capacity rights can be procured in the long term or through shorter-term processes, up to the gas day itself.
Appendix 7 Glossary

Gas Ten Year Statement November 2017 156
Cha
pter
sev
en
Appendix 7 Glossary
Acronym Term Definition
CCGT Combined Cycle Gas Turbine
Gas turbine that uses the combustion of natural gas or diesel to drive a gas turbine generator to generate electricity. The residual heat from this process is used to produce steam in a heat recovery boiler which in turn, drives a steam turbine generator to generate more electricity. (See also OCGT)
CCS Carbon capture and storage
Carbon (CO2) capture and storage (CCS) is a process by which the CO2 produced in the combustion of fossil fuels is captured, transported to a storage location and isolated from the atmosphere. Capture of CO2 can be applied to large emission sources like power plants used for electricity generation and industrial processes. The CO2 is then compressed and transported for long-term storage in geological formations or for use in industrial processes.
CEN Comité Europeén de Normalisation
European committee for standardisation concerned with the development, maintenance and distribution of standards and specifications.
CfD Contract for Difference Contract between the Low Carbon Contracts Company (LCCC) and a low carbon electricity generator designed to reduce its exposure to volatile wholesale prices.
CHP Combined heat and power A system whereby both heat and electricity are generated simultaneously as part of one process. Covers a range of technologies that achieve this.
CLNG Constrained LNG A service available at some LNG storage facilities whereby Shippers agree to hold a minimum inventory in the facility and flow under certain demand conditions at National Grid’s request. In exchange Shippers receive a transportation credit from National Grid.
CM Capacity Market The Capacity Market is designed to ensure security of electricity supply. This is achieved by providing a payment for reliable sources of capacity, alongside their electricity revenues, ensuring they deliver energy when needed.
CNG Compressed natural gas Compressed natural gas is made by compressing natural gas to less than 1 per cent of the volume it occupies at standard atmospheric pressure.
CO2 Carbon dioxide Carbon dioxide (CO2) is the main greenhouse gas and the vast majority of CO2 emissions come from the burning of fossil fuels (coal, natural gas and oil).
CO2e Carbon dioxide equivalent A term used relating to climate change that accounts for the ‘basket’ of greenhouse gases and their relative effect on climate change compared to carbon dioxide. For example UK emissions are roughly 600m tonnes CO2e. This constitutes roughly 450m tonnes CO2 and less than the 150m tonnes remaining of more potent greenhouse gases such as methane, which has 21 times more effect as a greenhouse gas, hence its contribution to CO2e will be 21 times its mass.
Compressor station An installation that uses gas turbine or electricity-driven compressors to boost pressures in the pipeline system. Used to increase transmission capacity and move gas through the network.
CSEP Connected System Exit Point
A point at which natural gas is supplied from the NTS to a connected system containing more than one supply point. For example a connection to a pipeline system operated by another Gas Transporter.
CV Calorific Value The ratio of energy to volume measured in megajoules per cubic metre (MJ/m3), which for a gas is measured and expressed under standard conditions of temperature and pressure.
CWV Composite Weather Variable
A measure of weather incorporating the effects of both temperature and wind speed. We have adopted the new industry-wide CWV equations that took effect on 1 October 2015.
DC Directly Connected (offtake) Direct connection to the NTS typically to power stations and large industrial users. I.e. the connection is not via supply provided from a Distribution Network.
DCO Development Consent Order
A statutory Order under The Planning Act (2008) which provides consent for a development project. Significant new pipelines require a DCO to be obtained, and the construction of new compressor stations may also require DCOs if a new HV electricity connection is required.
DFN Daily Flow Notification A communication between a Delivery Facility Operator (DFO) and National Grid, indicating hourly and end-of-day entry flows from that facility.

Gas Ten Year Statement November 2017 157
Chapter seven
Acronym Term Definition
DFO Delivery Facility Operator The operator of a reception terminal or storage facility, who processes and meters gas deliveries from offshore pipelines or storage facilities before transferring the gas to the NTS.
Distribution System A network of mains operating at three pressure tiers.
Diurnal Storage Gas stored for the purpose of meeting, among other things, within-day variations in demand. Gas can be stored in special installations, such as in the form of linepack within transmission, i.e. >7 barg, pipeline systems.
DM Daily Metered Supply Point A Supply Point fitted with equipment, for example a datalogger, which enables meter readings to be taken on a daily basis.
DN Distribution Network A gas transportation system that delivers gas to industrial, commercial and domestic consumers within a defined geographical boundary. There are currently eight DNs, each consisting of one or more Local Distribution Zones (LDZs). DNs typically operate at lower pressures than the NTS.
DNO Distribution Network Operator
Distribution Network Operators own and operate the Distribution Networks that are supplied by the NTS.
EIA Environmental Impact Assessment
Environmental study of proposed development works as required under EU regulation and the Town and Country Planning (Environmental Impact Assessment) Regulations 2011. These regulations apply the EU directive “on the assessment of the effects of certain public and private projects on the environment” (usually referred to as the Environmental Impact Assessment Directive) to the planning system in England.
ELV Emission Limit Value Pollution from larger industrial installations is regulated under the Pollution Prevention and Control regime. This implements the EU Directive on Integrated Pollution Prevention and Control (IPPC) (2008/1/EC). Each installation subject to IPPC is required to have a permit containing emission limit values and other conditions based on the application of Best Available Techniques (BAT) and set to minimise emissions of pollutants likely to be emitted in significant quantities to air, water or land. Permit conditions also have to address energy efficiency, waste minimisation, prevention of accidental emissions and site restoration.
EMR Electricity Market Reform A government policy to incentivise investment in secure, low-carbon electricity, improve the security of Great Britain’s electricity supply, and improve affordability for consumers. The Energy Act 2013 introduced a number of mechanisms. In particular:• A Capacity Market, which will help ensure security of electricity supply at the least
cost to the consumer.• Contracts for Difference, which will provide long-term revenue stabilisation for new
low carbon initiatives.Both will be administered by delivery partners of the Department of Business, Energy & Industrial Strategy (BEIS). This includes National Grid Electricity Transmission (NGET).
ENA Energy Networks Association
The Energy Networks Association is an industry association funded by gas or transmission and distribution licence holders.
ENTSOG European Network of Transmission System Operators for Gas
Organisation to facilitate cooperation between national gas transmission system operators (TSOs) across Europe to ensure the development of a pan-European transmission system in line with European Union energy goals.
ETYS Electricity Ten Year Statement
The ETYS illustrates the potential future development of the National Electricity Transmission System (NETS) over a ten-year (minimum) period and is published on an annual basis.
Exit Zone A geographical area (within an LDZ) that consists of a group of supply points that, on a peak day, receive gas from the same NTS offtake.
FEED Front End Engineering Design
The FEED is basic engineering which comes after the Conceptual design or Feasibility study. The FEED design focuses on the technical requirements as well as an approximate budget investment cost for the project.
FES Future Energy Scenarios The FES is a range of credible futures which has been developed in conjunction with the energy industry. They are a set of scenarios covering the period from now to 2050, and are used to frame discussions and perform stress tests. They form the starting point for all transmission network and investment planning, and are used to identify future operability challenges and potential solutions.
Gas Ten Year Statement November 2017 158
Cha
pter
sev
en
Appendix 7 Glossary
Acronym Term Definition
Gas Deficit Warning The purpose of a Gas Deficit Warning is to alert the industry to a requirement to provide a within-day market response to a physical supply/demand imbalance.
Gasholder A vessel used to store gas for the purposes of providing diurnal storage.
Gas Supply Year A twelve-month period commencing 1 October, also referred to as a Gas Year.
GB Great Britain A geographical, social and economic grouping of countries that contains England, Scotland and Wales.
GFOP Gas Future Operability Planning
This publication describes how changing requirements affect the future capability of the NTS out to 2050. It also considers how these requirements may affectNTS operation and our processes. The GFOP may highlight a need to change the way we respond to you or other market signals. This, in turn, may lead us to modifyour operational processes and decision making. This publication helps to make sure we continue to maintain a resilient, safe and secure NTS now and into the future.
GS(M)R Gas Safety (Management) Regulations 1996
Regulations which apply to the conveyance of natural gas (methane) through pipes to domestic and other consumers and cover four main areas:(a) the safe management of gas flow through a network, particularly those
parts supplying domestic consumers, and a duty to minimise the risk of a gas supply emergency
(b) arrangements for dealing with supply emergencies(c) arrangements for dealing with reported gas escapes and gas incidents(d) gas composition.Gas Transporters are required to submit a safety case to the HSE detailing the arrangements in place to ensure compliance with GS(M)R requirements.
Gas Transporter Formerly Public Gas Transporter (PGT), GTs, such as National Grid, are licensed by the Gas and Electricity Markets Authority (GEMA) to transport gas to consumers.
GTYS Gas Ten Year Statement The Gas Ten Year Statement is published annually in accordance with National Grid Gas plc’s obligations in Special Condition 7A of the Gas Transporter Licence relating to the National Transmission System and to comply with Uniform Network Code (UNC) requirements.
GW Gigawatt 1,000,000,000 watts, a measure of power.
GWh Gigawatt hour 1,000,000,000 watt hours, a unit of energy.
gCO2/kWh Gram of carbon dioxide per kilowatt hour
Measurement of CO2 equivalent emissions per kWh of energy used or produced.
HSE Health and Safety Executive
The HSE regulates the onshore pipeline operators to maintain and improve the health and safety performance within the industry.
IEA International Energy Agency
An intergovernmental organisation that acts as energy policy advisor to 28 member countries.
IED Industrial Emissions Directive
The Industrial Emissions Directive came into force on January 2013. The directive has recast seven existing Directives related to industrial emissions into a single clear, coherent legislative instrument, including the IPPC and Large Combustion Plant Directives.
IGMS Integrated Gas Management Control System
Used by National Grid System Operation to control and monitor the Gas Transmission system, and also to provide market information to interested stakeholders within the gas industry.
Interconnector A pipeline transporting gas to another country. The Irish Interconnector transports gas across the Irish Sea to both the Republic of Ireland and Northern Ireland. The Belgian Interconnector (IUK) transports gas between Bacton and Zeebrugge. The Belgian Interconnector is capable of flowing gas in either direction. The Dutch Interconnector (BBL) transports gas between Balgzand in the Netherlands and Bacton. It is currently capable of flowing only from the Netherlands to the UK.

Gas Ten Year Statement November 2017 159
Chapter seven
Acronym Term Definition
IPPC Integrated Pollution Prevention & Control Directive 1999
Emissions from our installations are subject to EU-wide legislation; the predominant legislation is the Integrated Pollution Prevention & Control (IPPC) Directive 1999, the Large Combustion Plant Directive (LCPD) 2001 and the Industrial Emissions Directive (IED) 2010. The requirements of these directives have now been incorporated into the Environmental Permitting (England and Wales) (Amendment) Regulations 2013 (with similar regulations applying in Scotland).IPPC aims to reduce emissions from industrial installations and contributes to meeting various environment policy targets and compliance with EU directives. Since 31 October 2000, new installations are required to apply for an IPPC permit. Existing installations were required to apply for an IPPC permit over a phased timetable until October 2007.
IUK Interconnector (UK) A bi-directional gas pipeline between Bacton in the UK and Zeebrugge Belgium. http://www.interconnector.com
KWh Kilowatt hour A unit of energy used by the gas industry. Approximately equal to 0.0341 therms. One Megawatt hour (MWh) equals 1000 kWh, one Gigawatt hour (GWh) equals 1000 MWh, and one Terawatt hour (TWh) equals 1000 GWh.
LCP Large Combustion Plant (Directive)
The Large Combustion Plant (LCP) directive is a European Union Directive which introduced measures to control the emissions of sulphur dioxide, oxides of nitrogen and dust from large combustion plant, including power stations.
LDZ Local Distribution Zone A gas distribution zone connecting end users to the (gas) National Transmission System.
Linepack The volume of gas within the National or Local Transmission System at any time.(See Also: PCLP)
LNG Liquefied natural gas LNG is formed by chilling gas to -161˚C so that it occupies 600 times less space than in its gaseous form.
Load Duration Curve (1-in-50 Severe)
The 1 in 50 severe load duration curve is that curve which, in a long series of years, with connected load held at the levels appropriate to the year in question, would be such that the volume of demand above any given demand threshold (represented by the area under the curve and above the threshold) would be exceeded in one out of fifty years.
Load Duration Curve (Average)
The average load duration curve is that curve which, in a long series of winters, with connected load held at the levels appropriate to the year in question, the average volume of demand above any given threshold, is represented by the area under the curve and above the threshold.
LTS Local Transmission System A pipeline system operating at >7 barg that transports gas from NTS/LDZ offtakes to distribution system low pressure pipelines. Some large users may take their gas direct from the LTS.
LTSEC Long-Term System Entry Capacity (LTSEC)
NTS Entry Capacity available on a long-term basis (up to 17 years into the future) via an auction process. This is also known as Quarterly System Entry Capacity (QSEC).
m3 Cubic metre The unit of volume, expressed under standard conditions of temperature and pressure, approximately equal to 35.37 cubic feet. One million cubic metres (mcm) are equal to 106 cubic metres, one billion cubic metres (bcm) equals 109 cubic metres.
mcm Million cubic metres Unit or measurement of volume, used in the gas industry. 1 mcm = 1,000,000 cubic metres
Margins Notice The purpose of the Margins Notice is to provide the industry with a day-ahead signal that there may be the need for a market response to a potential physical supply/demand imbalance.
MCP Medium Combustion Plant (Directive)
The Medium Combustion Plant (MCP) directive will apply limits on emissions to air from sites below 50 MW thermal input. MCP is likely to come into force by 2020.

Gas Ten Year Statement November 2017 160
Cha
pter
sev
en
Appendix 7 Glossary
Acronym Term Definition
MRS Medium-Range Storage Typically, these storage facilities have very fast injection and withdrawal rates that lend themselves to fast day-to-day turn rounds as market prices and demand dictate.
MWh Megawatt hour 1,000,000 watts, a measure of power usage or consumption in 1 hour.
NBP National balancing point The wholesale gas market in Britain has one price for gas irrespective of where the gas comes from. This is called the national balancing point (NBP) price of gas and is usually quoted in price per therm of gas.
NCS Norwegian Continental Shelf
The Norwegian Continental Shelf (NCS) comprises those areas of the sea bed and subsoil beyond the territorial sea over which Norway exercises rights of exploration and exploitation of natural resources. NCS gas comes into the UK via St Fergus and Easington terminals.
NDM Non-daily metered A meter that is read monthly or at longer intervals. For the purposes of daily balancing, the consumption is apportioned, using an agreed formula, and for supply points consuming more than 73.2 MWh pa, reconciled individually when the meter is read.
NDP Network Development Process
NDP defines the method for decision making, optioneering, development, sanction, delivery and closure for all National Grid gas projects. The aim of the NDP is to deliver projects that have the lowest whole-life cost, are fit for purpose and meet stakeholder and RIIO requirements.
NEA Network Entry Agreement A NEA is signed by the gas shipper prior to any gas flowing on to the system. Within the NEA the gas transporter sets out the technical and operational conditions of the connection such as the gas quality requirements, the maximum permitted flow rate and ongoing charges.
NExA Network Exit Agreement A NExA is signed by a gas shipper or Distribution Network Operator prior to any gas being taken off the system. Within the NExA the gas transporter sets out the technical and operational conditions of the offtake such as the maximum permitted flow rate, the assured offtake pressure and ongoing charges.
NGGT National Grid Gas Transmission
NGGT refers to teams within both the SO and TO areas of National Grid, involved in gas transmission activities.
NGSE Network Gas Supply Emergency
A NGSE occurs when National Grid is unable to maintain a supply–demand balance on the NTS using its normal system balancing tools. A NGSE could be caused by a major loss of supplies to the system as a result of the failure of a gas terminal or as the result of damage to a NTS pipeline affecting the ability of the system to transport gas to consumers. In such an event the Network Emergency Coordinator (NEC) would be requested to declare a NGSE. This would enable National Grid to use additional balancing tools to restore a supply–demand balance. Options include requesting additional gas supplies be delivered to the NTS or requiring gas consumers, starting with the largest industrial consumers, to stop using gas. These tools will be used, under the authorisation of the NEC, to try to maintain supplies as long as possible to domestic gas consumers.
NOM Network Output Measure RIIO has introduced Network Output Measures (NOMs) (previously Network Replacement Outputs) as a proxy for measuring the health and thus level of risk on the gas network. There are specific targets which are related to the condition of the NTS which must be met. Asset health is a key RIIO measure in terms of allowances and output. The targets cover an eight-year period from 2013 to 2021.
NOx Nitrous oxide A group of chemical compounds, some of which are contributors to pollution, acid rain or are classified as greenhouse gases.
NTS National Transmission System
A high-pressure gas transportation system consisting of compressor stations, pipelines, multijunction sites and offtakes. NTS pipelines transport gas from terminals to NTS offtakes and are designed to operate up to pressures of 94 bar(g).
National Transmission System Offtake
An installation defining the boundary between NTS and LTS or a very large consumer. The offtake installation includes equipment for metering, pressure regulation, odourisation equipment etc.
NWE North West European (Hub)
The wholesale gas market in North West Europe has one price for gas irrespective of where the gas comes from. This is called the North West European (NWE) hub price of gas and is usually quoted in price per therm of gas.

Gas Ten Year Statement November 2017 161
Chapter seven
Acronym Term Definition
Oil & Gas UK Oil & Gas UK is a representative body for the UK offshore oil and gas industry. It is a not-for-profit organisation, established in April 2007. http://www.oilandgasuk.co.uk
OCGT Open Cycle Gas Turbine Gas turbines in which air is first compressed in the compressor element before fuel is injected and burned in the combustor. (See also CCGT)
OCM On the Day Commodity Market
This market constitutes the balancing market for GB and enables anonymous financially cleared on the day trading between market participants.
Odourisation The process by which the distinctive odour is added to gas supplies to make it easier to detect leaks.
Ofgem Office of Gas and Electricity Markets
The UK's independent National Regulatory Authority, a non-ministerial government department. Its principal objective is to protect the interests of existing and future electricity and gas consumers.
OM Operating Margins Gas used by National Grid Transmission to maintain system pressures under certain circumstances, including periods immediately after a supply loss or demand forecast change, before other measures become effective and in the event of plant failure, such as pipe breaks and compressor trips.
OUG Own Use Gas Gas used by National Grid to operate the transportation system. Includes gas used for compressor fuel, heating and venting.
pa Per annum Per year
PARCA Planning and Advanced Reservation of Capacity Agreement
A solution developed in line with the enduring incremental capacity release solutions which have been developed following the implementation of the Planning Act (2008). PARCAs were implemented on 1 February 2015 and replace the functions of PCAs and ARCAs. (See also ARCA & PCA)
PCA Planning Consent Agreement
Planning Consent Agreements were made in relation to NTS Entry and Exit Capacity requests and comprised a bilateral agreement between National Grid and developers, DNOs or Shippers whereby National Grid assessed the Need Case for NTS reinforcement and would undertake any necessary planning activities ahead of a formal capacity signal from the customer. Where a Need Case was identified, the customer would underwrite National Grid NTS to undertake the required statutory Planning Act activities such as strategic optioneering, Environmental Impact Assessment, statutory and local community consultations, preparation of the Development Consent Order (DCO) and application. This has now been replaced by the PARCA process. (See PARCA)
PCLP Projected Closing Linepack Linepack is the volume of gas stored within the NTS. Throughout a gas day linepack levels fluctuate due to imbalances between supply and demand over the day. National Grid, as residual balancer of the UK gas market, need to ensure an end-of-day market balance where total supply equals, or is close to, total demand. The Projected Closing Linepack (PCLP) metric is used as an indicator of end-of-day market balance. (See also Linepack)
Peak Day Demand The 1-in-20 peak day demand is the level of demand that, in a long series of winters, with connected load held at levels appropriate to the winter in question, would be exceeded in one out of 20 winters, with each winter counted only once.
QSEC Quarterly System Entry Capacity
NTS entry capacity available on a long-term basis (up to 17 years into the future) via an auction process. Also known as Long-Term System Entry Capacity (LTSEC).
RIIO-T1 RIIO relates to the current Ofgem price control period which runs from 1 April 2013 to 31 March 2021. For National Grid Transmission this is referred to as RIIO-T1.

Gas Ten Year Statement November 2017 162
Cha
pter
sev
en
Appendix 7 Glossary
Acronym Term Definition
Safety Monitors Safety Monitors in terms of space and deliverability are minimum storage requirements determined to be necessary to protect loads that cannot be isolated from the network and also to support the process of isolating large loads from the network. The resultant storage stocks or monitors are designed to ensure that sufficient gas is held in storage to underpin the safe operation of the gas transportation system under severe conditions. There is now just a single safety monitor for space and one for deliverability. These are determined by National Grid to meet its Uniform Network Code requirements and the terms of its safety case. Total shipper gas stocks should not fall below the relevant monitor level (which declines as the winter progresses). National Grid is required to take action (which may include use of emergency procedures) in order to prevent storage stocks reducing below this level.
SEAL Shearwater Elgin Area Line The offshore pipeline from the Central North Sea (CNS) to Bacton.
SEPA Scottish Environment Protection Agency
The environmental regulator for Scotland.
Shale Gas Shale gas is natural gas that is found in shale rock. It is extracted by injecting water, sand and chemicals into the shale rock to create cracks or fractures so that the shale gas can be extracted. https://www.gov.uk/government/publications/about-shale-gas-and-hydraulic-fracturing-fracking
Shipper or Uniform Network Code (Shipper) User
A company with a Shipper Licence that is able to buy gas from a producer, sell it to a supplier and employ a GT to transport gas to consumers.
Shrinkage Gas that is input to the system but is not delivered to consumers or injected into storage. It is either Own Use Gas or Unaccounted for Gas.
SHQ Supply Hourly Quantity Supply Hourly Quantity
SNCWV Seasonal Normal Composite Weather Variable
The seasonal normal value of the CWV is the smoothed average of the values of the applicable CWV for that day in a significant number of previous years. (See also CWV)
System operability The ability to maintain system stability and all of the asset ratings and operational parameters within pre-defined limits safely, economically and sustainably.
SO System Operator An entity entrusted with transporting energy in the form of natural gas or power on a regional or national level, using fixed infrastructure. Unlike a TSO, the SO may not necessarily own the assets concerned. For example, National Grid operates the electricity transmission system in Scotland, which is owned by Scottish Hydro Electricity Transmission and Scottish Power.
SOQ Supply Offtake Quantity The maximum daily consumption at a Supply Point.
SOR Strategic Options Report Output of the PCA, ARCA and PARCA statutory Planning Act activities reporting to the customer on the findings of optioneering analysis by National Grid in relation to the customer request for NTS Entry or Exit Capacity.
SRS Short-Range Storage These are commercially operated sites that have shorter injection/withdrawal times so can react more quickly to demand, injecting when demand or prices are lower and withdrawing when higher.
Substitution Capacity substitution is the process of moving unsold capacity from one or more system points to another, where demand for that capacity exceeds the available capacity quantities for the relevant period. This avoids the construction of new assets or material increases in operational risk.
Supplier A company with a supplier’s licence contracts with a shipper to buy gas, which is then sold to consumers. A supplier may also be licensed as a shipper.
Supply Point A group of one or more meter points at a site.
Therm An imperial unit of energy. Largely replaced by the metric equivalent: the kilowatt hour (kWh). 1 therm equals 29.3071 kWh.

Gas Ten Year Statement November 2017 163
Chapter seven
Acronym Term Definition
TO Transmission Owner National Grid owns the gas National Transmission System (NTS) in Great Britain. As the TO National Grid must make sure all assets on the NTS are fit for purpose and safe to operate. Effective maintenance plans and asset replacement schedules are developed and implemented to keep the gas flowing.
TPC Transmission Planning Code
The Transmission Planning Code describes National Grid’s approach to planning and developing the NTS in accordance with its duties as a gas transporter and other statutory obligations relating to safety and environmental matters. The document is subject to approval by the Gas and Electricity Markets Authority (GEMA).
TSO Transmission System Operator
Operator of a Gas Transmission Network under licence issued by the Gas and Electricity Markets Authority (GEMA) and regulated by Ofgem.
TWh Terawatt hour 1,000,000,000,000 watt hours, a unit of energy.
UAG Unaccounted for Gas Gas ‘lost’ during transportation. Includes leakage, theft and losses due to the method of calculating the Calorific Value.
UK United Kingdom of Great Britain and Northern Ireland
A geographical, social and economic grouping of countries that contains England, Scotland, Wales and Northern Ireland.
UKCS United Kingdom Continental Shelf
The UK Continental Shelf (UKCS) comprises those areas of the sea bed and subsoil beyond the territorial sea over which the UK exercises sovereign rights of exploration and exploitation of natural resources.
UNC Uniform Network Code The Uniform Network Code is the legal and commercial framework that governs the arrangements between the Gas Transporters and Shippers operating in the UK gas market. The UNC comprises different documents including the Transportation Principal Document (TPD) and Offtake Arrangements Document (OAD).
VSD Variable Speed Drives Compressor technology where the drive speed can be varied with changes in capacity requirement. Variable speed drive compressors compared to constant speed compressors are more energy efficient and operate more quietly by varying speed to match the workload.
Weather corrected The actual demand figure that has been adjusted to take account of the difference between the actual weather and the seasonal normal weather.
WLP Whole Life Prioritisation The WLP provides the criteria used to prioritise all of the options considered as part of the Network Development Process (NDP). The scoring from the WLP Model aids the decision-making process by discounting unsuitable options at an early stage of the NDP.

Gas Ten Year Statement November 2017 164
Cha
pter
sev
en
Disclaimer
This statement is produced for the purpose of and in accordance with National Grid Gas plc’s obligations in Special Condition 7A31 of its Gas Transporter Licence relating to the National Transmission System and section O4.1 of the Transportation Principal Document of the Uniform Network Code in reliance on information supplied pursuant to section O of the Transportation Principal document of the Uniform Network Code. Section O1.3 of the Transportation Principal document of the Uniform Network Code applies to any estimate, forecast or other information contained in this statement.
For the purpose of the remainder of this statement, National Grid Gas plc will be referred to as National Grid.
National Grid would wish to emphasise that the information must be considered as illustrative only and no warranty can be or is made as to the accuracy and completeness of the information contained within the Document. Neither National Grid Electricity Transmission, National Grid Gas nor the other companies within the National Grid group, nor the directors, nor the employees of any such company shall be under any liability for any error or misstatement or opinion on which the recipient of this Document relies or seeks to rely other than fraudulent misstatement or fraudulent misrepresentation and does not accept any responsibility for any use which is made of the information or Document which or (to the extent permitted by law) for any damages or losses incurred. Copyright National Grid 2017, all rights reserved. No part of the Document or this site may be reproduced in any material form (including photocopying and restoring in any medium or electronic means and whether or not transiently or incidentally) without the written permission of National Grid except in accordance with the provisions of the Copyright, Designs and Patents Act 1988.
Copyright Any and all copyright and all other intellectual property rights contained in this outlook document belong to National Grid. To the extent that you re-use the outlook document, in its original form and without making any modifications or adaptations thereto, you must reproduce, clearly and prominently, the following copyright statement in your own documentation: © National Grid plc, all rights reserved.
31 Special Condition 7A requires the Ten Year Statement, published annually, shall provide a ten-year forecast of transportation system usage and likely system developments that can be used by companies, who are contemplating connecting to our system or entering into transport arrangements, to identify and evaluate opportunities.

Gas Ten Year Statement November 2017 165
Join our mailing list to receive emailupdates for GTYS or any of ourFuture of Energy documents.http://www.nationalgrid.com/updates
Email us with your viewson GTYS at: Box.SystemOperator. [email protected] we will get in touch.
Access our current and pastGTYS documents and data at:http://www.nationalgrid.com/gtys
Keep up to date on key issues relating to National Grid viaour Connecting website:www.nationalgridconnecting.com
You can write to us at:Gas Network DevelopmentNational Grid HouseWarwick Technology ParkGallows HillWarwickCV34 6DA
National Grid UK
@nationalgriduk
NationalGridUK
National Grid
Continuing the conversation
Gas Ten Year Statement November 2017 165

National Grid plcNational Grid House, Warwick Technology Park, Gallows Hill, Warwick. CV34 6DA United KingdomRegistered in England and Wales No. 4031152
www.nationalgrid.com