gastonia comprehensive pedestrian plan
TRANSCRIPT

Gastonia ComprehensivePEDESTRIAN PLAN
Final Report
Gastonia Comprehensive Pedestrian Plan
Final Report May 2014
prepared for
prepared by


Gastonia Comprehensive Pedestrian Plan Final Report
i
Gastonia Comprehensive Pedestrian Plan Final Report
Steering Committee Flip Bombardier, PE, Assistant City Manager – Public Infrastructure, City of Gastonia Rusty Bost, PE, City Engineer, City of Gastonia Miles Braswell, Director of Transportation, Gaston County Schools Mike Carpenter/Beth Heywood, Gaston Residential Services, Inc. Bob Cinq Mars, Planning Commission Member, City of Gastonia Pat Corinth, Assistant Director, City of Gastonia Parks & Recreation Danette Dye, Case Specialist – Housing & Community Development, City of Gastonia Randi Gates, Community Grants Coordinator, Carolina Thread Trail Hank Graham, AICP, Principal Transportation Planner, Gaston-Cleveland-Lincoln MPO Mike Holder, PE, Director, NCDOT Division 12 David Kielson, PE, Planning Engineer, NCDOT Division 12 Walter Kimble, Council Member, City of Gastonia Jack Kiser, AICP, Senior Executive – Special Projects, City of Gastonia Donna Lahser, Public Information Officer, Gastonia Police Department Donna Lockett, Executive Director, Gaston Together – Gaston 2020 Greenway Advocacy Taylor Marcantel, Transportation Planner I, Gaston-Cleveland-Lincoln MPO Sgt. Keith C. McCabe, Traffic Enforcement Bureau, City of Gastonia Police Department Ed Munn, City Manager, City of Gastonia Abigail Newton, Community Health Education Administrator, Gaston County Health Department Charlie Pearson, Treasurer, Connect Gaston – Bike/Ped Advocacy Group Heather Stroupe, President, Gateway Community Watch Jason Thompson, AICP, Planning Director, City of Gastonia John Vine-Hodge, Transportation Planner II, NCDOT Bicycle-Pedestrian Division Consultants Toole Design Group LandDesign

Gastonia Comprehensive Pedestrian Plan Final Report
ii
Table of Contents
Executive Summary
1 Introduction ....................................................................................................................................................... 1
1.1 Why a Plan?.............................................................................................................................................. 1
1.2 Plan Overview ......................................................................................................................................... 5
1.3 Public Participation ................................................................................................................................. 5
2 Existing Context and Pedestrian Issues .....................................................................................................15
2.1 Overview ................................................................................................................................................15
2.2 Existing Sidewalks .................................................................................................................................23
2.3 Existing and Proposed Greenways and Trails ................................................................................27
2.4 Access to Transit ..................................................................................................................................28
2.5 Potential Trip Generators ..................................................................................................................30
2.6 Pedestrian Crashes ...............................................................................................................................33
2.7 Planning Context ..................................................................................................................................37
2.8 Pedestrian Issues ...................................................................................................................................38
3 Programs, Policies, and Design Standards .................................................................................................39
3.1 Programs and Policies ..........................................................................................................................39
3.2 Design Standards ..................................................................................................................................43
4 Network Recommendations ........................................................................................................................45
4.1 Pedestrian Environment ......................................................................................................................45
4.2 Toolbox of Effective Treatments ......................................................................................................49
4.3 Pedestrian Demand ..............................................................................................................................53
4.4 Network Improvements .....................................................................................................................57
5 Implementation ...............................................................................................................................................75
5.1 Action Strategies ...................................................................................................................................75
5.2 Project Prioritization ...........................................................................................................................78
5.3 Project Tiers ..........................................................................................................................................81
5.4 NCDOT Complete Streets and Incidental Pedestrian Improvements ....................................89

Gastonia Comprehensive Pedestrian Plan Final Report
iii
List of Tables
Table Page
Table 1-1 Welcome Survey Responses – Primary Mode of Transportation ..................................... 8
Table 1-2 Welcome Survey Responses – Frequency of Walking......................................................... 8
Table 1-3 Welcome Survey Responses – Reasons for Walking ........................................................... 9
Table 1-4 Online Map Predominate Data Type Characteristics .......................................................... 9
Table 2-1 Socioeconomic Characteristics .............................................................................................. 20
Table 2-2 Means of Transportation to Work........................................................................................ 21
Table 2-3 Gaston County Public Health Indicators ............................................................................. 23
Table 2-4 Existing Sidewalks and Sidewalk Needs ................................................................................ 23
Table 2-5 Existing and Proposed Greenways and Trails ..................................................................... 27
Table 2-6 Transit Ridership and Pedestrian Access Ratio by Route ................................................ 30
Table 2-7 Pedestrian Crashes (2007-2011) ............................................................................................ 37
Table 3-1 Recommended Education, Encouragement, Enforcement Programs and Policies ...................................................................................... 41
Table 3-2 Recommended Maintenance and Improvements Programs ............................................ 42
Table 3-3 Preferred Design Standards and Policies ............................................................................. 44
Table 4-1 Toolbox of Effective Treatments ........................................................................................... 51
Table 4-2 Pedestrian Demand Variables ................................................................................................. 55
Table 4-3 Spot Improvements ................................................................................................................... 61
Table 4-4 Corridor Improvements .......................................................................................................... 63
Table 5-1 Action Strategies........................................................................................................................ 76
Table 5-2 NCDOT Bicycle and Pedestrian Scoring ............................................................................. 79
Table 5-3 Prioritization Methodology ..................................................................................................... 80
Table 5-4 Capital Cost by Tier and Project Type................................................................................. 82
Table 5-5 Spot Improvement Tiers .......................................................................................................... 83
Table 5-6 Corridor Improvement Tiers ................................................................................................. 84
Gastonia Comprehensive Pedestrian Plan Final Report
iv
List of Figures
Figure Page
Figure 1-1 Online Map Welcome Survey ................................................................................................... 7
Figure 1-2 Online Map Public Input ...........................................................................................................11
Figure 2-1 Gastonia Zoning Map ................................................................................................................17
Figure 2-2 2010 Population Pyramids for Gastonia and United States ..............................................20
Figure 2-3 National Pedestrian Trips by Trip Purpose ..........................................................................22
Figure 2-4 Sidewalk Inventory .....................................................................................................................25
Figure 2-5 Proposed System of Public Greenways and Trails ..............................................................29
Figure 2-6 Gastonia Transit System Map ..................................................................................................31
Figure 2-7 Potential Trip Generators ........................................................................................................35
Figure 2-8 Pedestrian Crashes (2007-2011) ............................................................................................36
Figure 4-1 Pedestrian Demand Heat Map ................................................................................................56
Figure 4-2 Rendering of Spot Improvement #52 ....................................................................................58
Figure 4-3 Rendering of Corridor Improvement #36 ...........................................................................59
Figure 4-4 Rendering of Corridor Improvement #70 ...........................................................................60
Figure 4-5 Pedestrian Improvements Maps ..............................................................................................66
Figure 5-1 Potential Opportunities for NCDOT Incidental Improvements to the Pedestrian Network .....................................91
Appendices • Appendix A Online Map Welcome Survey Responses
• Appendix B Previous Planning Documents
• Appendix C Recommended Modifications to Existing Design Standards
• Appendix D Design Guidelines
• Appendix E Corridor Improvements Detailed Notes
• Appendix F Project Scoring
• Appendix G Unit Costs
• Appendix H Potential Funding Sources

Gastonia Comprehensive Pedestrian Plan Executive Summary
ES-1
Executive Summary
The City of Gastonia desires to be a city where walking is safe, convenient, and a desirable mode of transportation for residents and visitors of all ages and abilities. Walking is an essential part of every trip; whether walking in your neighborhood, traveling between your car and the front door of a business establishment, or going to the corner convenience store, at some point we are all pedestrians.
ES.1 Why a Plan? The Gastonia Comprehensive Pedestrian Plan has been developed to realize the vision of improved health, safety, and quality of life in Gastonia. The City understands that walking is critical to having a diverse transportation network and making its streets more vibrant and attractive. For people to choose walking over other modes of transportation, sidewalks and other pedestrian spaces need to be safe, comfortable, and aesthetically pleasing, while also connecting logical desire lines between recognized origins and destinations. Pedestrian zones must be designed to accommodate all users, regardless of age or ability, allowing for person-to-person interaction, patronage of businesses, and the pursuit of active, healthy lifestyles.
The Gastonia Comprehensive Pedestrian Plan was a collaborative effort of the City of Gastonia, the Gaston-Cleveland-Lincoln Metropolitan Planning Organization (MPO), and the North Carolina Department of Transportation (NCDOT). The Plan identifies policies, programs, and physical infrastructure improvements to make Gastonia a safer and more comfortable place to walk.
The Vision of the Gastonia Comprehensive Pedestrian Plan is to improve the health, safety, and quality of life in Gastonia.
West Main Avenue near Marietta Street

Gastonia Comprehensive Pedestrian Plan Final Report
ES-2
ES.2 Public Participation The Gastonia Comprehensive Pedestrian Plan was formulated through a robust public participation plan. Specific methods and techniques included:
• Steering Committee composed of a range of City departments, Gaston-Cleveland-Lincoln MPO staff, NCDOT staff, Gaston County representatives, advocacy groups, and business and community leaders.
• Walking tour where Steering Committee members observed and discussed pedestrian-related issues and opportunities throughout the community.
• Van tour that allowed stakeholders to both verbally and visually communicate pedestrian issues to the project team from all areas of Gastonia.
• Interactive online map that offered the opportunity for the public to identify various relevant items, including: places they walk to and from often; difficult crossings; missing sidewalks; and other conditions that impact their experience walking in Gastonia.
• Public meetings to present existing conditions, receive input on pedestrian issues, and present the Draft Plan for review and feedback.
Goals of the Plan • Improve safety by reducing the
number and severity of crashes involving pedestrians
• Develop practical and implementable solutions
• Support local businesses and foster economic growth
• Support existing transit
• Enhance neighborhood connectivity and make linkages
• Promote social equity
• Improve enforcement
• Inform and educate the public
• Assess existing infrastructure while implementing retrofits and filling gaps
• Enhance coordination between Gastonia, the Gaston-Cleveland-Lincoln MPO, and NCDOT
• Enhance the character of downtown
• Ensure that new development contributes to pedestrian access and connectivity
• Address difficult intersections and other barriers
• Identify performance measures
• Improve pedestrian outcomes on all roadway improvement and reconstruction projects
• Improve health

Gastonia Comprehensive Pedestrian Plan Executive Summary
ES-3
ES.3 Existing Context and Pedestrian Issues
The existing pedestrian context was established through the documentation of existing infrastructure, land use, and safety conditions pertaining to pedestrian travel and comfort in the City of Gastonia. As a complement to this, the pedestrian planning context was also considered through the review of demographic information and relevant previous planning documents. Finally, pedestrian issues were identified.
Specific areas that were documented include:
• Geography and development history of the City of Gastonia and how these have both positively and negatively impacted the pedestrian planning and implementation processes.
• Overview of the City’s existing pedestrian environment, including barriers, constraints, and opportunities for pedestrian travel.
• Current socioeconomic characteristics of the City of Gastonia and associated implications for potential pedestrian conditions.
• Public health conditions within the City’s population, including a high prevalence of high risk health conditions that could be remedy with greater physical activity.
• Inventory of existing sidewalks and sidewalk needs.
• Account of existing and proposed greenways and trails.
Pedestrian Issues • Too many curb cuts and driveways
• Excess underutilized pavement
• Overbuilt roads
• High speed traffic
• Americans with Disabilities (ADA) issues
• Not enough time for pedestrians to cross large arterial roads
• Sidewalks in poor condition
• Lack of buffers between the sidewalk and the road
• Large arterial roads with a sidewalk on only one side
• Bridges with narrow or missing sidewalks
• Deteriorated crosswalks
• Pedestrian median islands that don’t provide a physical separation from traffic
• Intersections without four crosswalks
• Gaps in the pedestrian network that inhibit connectivity
• Of the existing and planned greenways, it’s unclear which ones serve (or could serve) a pedestrian transportation purpose
• Pedestrian access to transit is limited by a lack of surrounding sidewalks and amenities such as benches and shelters, as well as difficult crossing conditions
• Pedestrian safety in parking lots
• Poor lighting conditions
• Pedestrians jaywalking and/or crossing at unmarked mid-block locations
• Limited sight distance
• No sidewalks at all on some collector streets

Gastonia Comprehensive Pedestrian Plan Final Report
ES-4
• Availability of and access to public transportation by pedestrians in Gastonia.
• Potential destinations throughout Gastonia that should generate pedestrian trips, including civic buildings and services, commercial and retail establishments, schools, and parks and recreational amenities.
• Pedestrian crash locations and severity.
• Previous planning documents that have a direct influence on pedestrian transportation and recreation.
ES.4 Programs, Policies, and Design Guidelines
Existing Programs and Policies The City of Gastonia has several existing programs regarding pedestrians:
• The Engineering Department maintains a database of sidewalk requests from citizens along with sidewalks identified in previous planning efforts. These sidewalk projects are constantly evaluated as funding becomes available.
• The City also has a more formal Sidewalk Request Petition program whereby the City installs new concrete sidewalk by request, in the form of a petition, from the majority street’s property owners that own a majority of the street frontage. All property owners that are benefited by the project will be assessed an amount, based on street frontage, sufficient to cover 100 percent of the total cost of the project.
• The City also occasionally issues bonds for infrastructure, including pedestrian infrastructure like sidewalks. The most recent municipal bonds, approved in 2010, have resulted in the installation of sidewalks along many collector and arterial roads in the City.
• Gastonia Transit and the Department of Public Works and Utilities have less formal, annual programs that address deficiencies in the City’s pedestrian system.
Recommended Programs and Policies Members of the Steering Committee were active in determining the most appropriate programs and policies for the Plan. Potential education, encouragement, enforcement, and maintenance policies and programs were provided to the Steering Committee for review and comment. Steering Committee members provided feedback on the most appropriate programs and policies as well as direct comments on appropriate applications to the City of Gastonia. The final set of programs and policies is the result of an interactive process and is informed by best practices in other cities. Recommended programs and policies are presented in Table ES-1 and Table ES-2.
Policies and programs complement and support physical improvements and ongoing maintenance to the pedestrian network.

Gastonia Comprehensive Pedestrian Plan Executive Summary
ES-5
Table ES-1: Recommended Education, Encouragement, Enforcement Programs and Policies
PROGRAM/POLICY DESCRIPTION
Update/Maintain Existing GIS Sidewalk Inventory
• Maintaining the City’s GIS-based sidewalk inventory is an important tool for tracking the location of existing sidewalks.
• Updating the inventory to include curb ramps and condition information would make the dataset useful for asset management.
Web/Mobile Reporting App
• Provide a web/mobile app that allows citizens to report non-emergency physical and infrastructure issues.
• This would include any issues that impact pedestrian safety, access, and comfort.
• Interdepartmental communication would increase the effectiveness of such a system (e.g., police and engineering).
• Marketing would be needed to make the public aware of the reporting app.
“Near Miss” Reporting System
• A near miss reporting system would allow travelers to identify locations and operations that may create a safety risk before an incident occurs.
• This can be used as a complement to a web/mobile reporting app – evaluation of maintenance needs and involvement of police and engineering departments.
• Coupling and comparing actual crash data with near miss locations would assist in determining accident-prone areas.
• Marketing would be needed to make the public aware of the reporting system.
Pedestrian Counts
• Regular pedestrian counts are a means of measuring the effect of physical, operational, and programmatic changes on walking rates.
• Existing pedestrian counts demonstrate areas of demand and can be used to help support investment in pedestrian network improvements.
• Conducting pedestrian counts in the years following network investments can assist in demonstrating the impact improvements have on increasing pedestrian travel.
• The City should coordinate with NCDOT’s emerging pedestrian and bicycle count program.
Staff Training • Establish a program to train City staff whose jobs affect pedestrian safety (i.e., planning, engineering, parks and recreation,
police department, etc.). “Watch For Me NC” training materials could be utilized (http://www.watchformenc.org/).
• Such training will not only educate staff on pedestrian issues and concerns but will assist in implementation of the Plan.
Walking Encouragement
• Walking route maps are an encouragement strategy for getting more people walking while indicating the most comfortable and safe routes that link residents to key destinations and areas of interest.
• As part of walking route maps, including distance and terrain information will allow user to select the most appropriate routes for their skill level.
• Organized neighborhood and company walking and running groups can be a popular way for people to get exercise and build social networks.
Media Collaboration
• Work with local print and television media to develop a series of educational pieces that address both safe driving and walking behaviors; these pieces could also cover the rules applicable to all users of public roadways and should be in compliance with North Carolina law (http://www.ncdot.gov/bikeped/lawspolicies/).
• The Government Access Channel (cable channel 16) could be an excellent format for providing instruction on appropriate walking and driving behaviors. Utilizing “Watch For Me NC” materials could be an easy starting point for public service announcement content (http://www.watchformenc.org/).
• Evaluate media methods for reaching those without access to newspaper and cable television.
Child Pedestrian Safety Curriculum
• Collaborate with Gaston County Schools to implement the National Highway Traffic Safety Administration (NHTSA) Child Pedestrian Safety Curriculum, which teaches and encourages pedestrian safety for students grades Kindergarten through 5th Grade (http://www.nhtsa.gov/ChildPedestrianSafetyCurriculum).
• This NHTSA curriculum is organized into five lessons: walking near traffic, crossing streets, crossing intersections, parking lot safety, and school bus safety. Each lesson builds upon a previous set of skills learned.
• Another resource to consider is NCDOT’s “Let’s Go NC!, A Pedestrian and Bicycle Safety Skills Program for Healthy, Active Children” (https://connect.ncdot.gov/projects/BikePed/Pages/LetsGoNC.aspx).
Speed Limits • Consider lowering the standard speed limit (35 mph) and/or implementing targeted speed limit reductions in areas of high
pedestrian demand/potential.
• Regarding residential areas, the City already will grant a speed limit reduction if requested by residents.

Gastonia Comprehensive Pedestrian Plan Final Report
ES-6
Table ES-2: Recommended Maintenance and Improvement Programs1
PROGRAM/POLICY DESCRIPTION
Maintenance and Repair
• Fund the maintenance of sidewalks and other pedestrian infrastructure on an ongoing basis.
• Maintaining and repairing sidewalks is a way to protect the City’s investment in the pedestrian network and can help the City’s overall walkability.
ADA Curb Ramps
• Begin a program to install and retrofit curb ramps at all intersections within the City.
• Set a per year goal.
• Ensure that new curb ramps follow Americans with Disability Act (ADA) guidance.
Crosswalks
• Establish a citywide crosswalk improvement program.
• Implement it in pilot locations, then set a per year goal.
• As part of the program, establish as a baseline default that crosswalks will be marked on all four legs of an intersection.
Pedestrian Countdown Signals
• Create a proactive pedestrian countdown signal improvement program to install pedestrian countdown signals at new locations on an ongoing basis.
• Set a per year goal.
Pedestrian Refuge • Where existing painted center medians exist in proximity to intersections, seek opportunities to construct raised medians in their place to provide pedestrian refuge.
Transit Access
• Establish a program to provide better crossing opportunities at bus stops, especially at uncontrolled mid-block locations.
• If existing crossing locations can’t be improved, consider moving the bus stop to a location where better crossing conditions can be accommodated.
• Consider implications to transit operations prior to relocating bus stops.
Midblock Crossings • Consider midblock crossing improvement opportunities along corridors where signals are currently spaced far apart.
• Improvements may include advanced warning signage and pavement markings, Rectangular Rapid Flash Beacons, and/or HAWK signals.
Street “Right Sizing”
• Evaluate opportunities to implement lane diets, road diets, curb extensions, and other reallocations to “right size” existing roads so that they function better for all modes.
• Reclaimed pavement areas can be utilized for buffers/greenstrips, sidewalk widening, bike lanes, and/or curb extensions.
• In all cases, sufficient traffic analysis should be performed to ensure functionality and appropriateness of treatments.
1 Design guidelines specific to these areas of maintenance and improvement are included in Appendix D of the Plan.

Gastonia Comprehensive Pedestrian Plan Executive Summary
ES-7
ES.5 Design Standards
Existing Standards and Details A review of current standards and details that apply to pedestrian related facilities in the City of Gastonia was performed. A number of details were provided by the City of Gastonia and encompass standards and typical sections from the City of Gastonia, Gaston-Cleveland-Lincoln MPO, and NCDOT. A detailed documentation of this review is included in Appendix C of the Plan.
Preferred Design Standards and Policies As with policies and programs, members of the Steering Committee were active in determining preferred design standards and policies for the Plan. Potential design standards and policies were provided to the Steering Committee for review and comment. Comments were received during a Steering Committee meeting, including how such should be applied in Gastonia. Table ES-3 presents preferred design standards and policies for the City of Gastonia, which are the result of an interactive process and are informed by best practices in other cities.
ES.6 Network Recommendations Chapter 4 of the Plan presents recommendations for improving Gastonia’s pedestrian network. Best practices were incorporated into the recommendations and strategies are intended to assist in reducing barriers to pedestrian travel by improving safety, convenience, and comfort.
Pedestrian Environment The pedestrian environment can be defined by two primary areas of activity: 1) Along the Roadway; and 2) Across the Roadway. Consideration should be given to both of these areas of activity when implementing recommended improvements and determining new improvements moving forward.
• Along the Roadway – Providing a quality walking experience for pedestrians along the streets and roadways of Gastonia is influenced by a variety of factors, including: sidewalks, buffers, obstructions, access to transit, vehicular intrusions, bridges, and access to trails.
• Across the Roadway – In addition to providing continuous and safe facilities adjacent to roadways, safe street crossings are a critical component of an accessible and complete pedestrian network. Essential factors in determining the quality of a pedestrian’s experience crossing a roadway include: intersection geometry, crosswalks, pavement conditions, curb ramps, width and number of lanes, pedestrian crossing islands, curb extensions, traffic signals and stop signs, signal timing, lighting, and signing and striping.
Linwood Road near Gaston Avenue

Gastonia Comprehensive Pedestrian Plan Final Report
ES-8
Table ES-3: Preferred Design Standards and Policies
STANDARD/POLICY DESCRIPTION
Complete Streets Policy
• Develop and adopt a recommended complete streets policy in accordance with the National Complete Streets Coalition’s 10 ideal elements of a complete streets policy, including a vision, applicability to all users and all projects, specific exceptions, connectivity of the network for all modes, design criteria, context sensitivity, performance standards, and next steps.
Design Details The following modifications or additions to current design details are recommended:
• 5-foot minimum sidewalk width on collector streets and higher; 4-foot minimum sidewalk width on residential streets provided the entire sidewalk width is maintained “free and clear” of obstruction.
• Where feasible, 5- to 6-foot minimum buffer (greenstrip) widths between road and sidewalk on collector streets and higher.
• Allow 11-foot lane widths on all streets.
• Maintenance of sidewalk slope and grade across driveways.
• Two curb ramps per intersection corner; if constrained, utilize depressed corner (i.e., don’t point pedestrians into middle of intersection); ensure that new curb ramps follow Americans with Disability Act (ADA) guidance, specifically with regard to the width and depth of the landing area provided at the top of the curb ramp.
• In addition to signage for a shared street, shared lane pavement markings should be shown and denoted in plan view where feasible.
• Placement and marking of crosswalks.
• Typical signage for pedestrians at intersections and midblock crossings.
• Encourage pedestrian countdown signals as part of all new and existing signalized intersection improvement projects.
• Placement and access of bus stops.
• Traffic calming treatments that benefit pedestrians, including raised crosswalks, curb extensions, and pedestrian refuge islands.
Signal Timing Policy • Ensure that the City’s official policy is to time all signals using the guidance for pedestrian crossing time (i.e., walking rate of travel of 3.5 feet per second) included in the latest Manual on Uniform Traffic Control Devices (MUTCD).
Unified Development Ordinance
Evaluate Gastonia Unified Development Ordinance to determine:
• Potential to amend existing access management policy (Section 9.23). In addition to frequency and spacing of driveways, this policy should address driveway design, inter-parcel connectivity, access from side streets, and right-in/right-out access strategies.
• Potential inclusion of crosswalk requirements along public roads and within private developments.
• Potential inclusion of pedestrian signal requirements along public roads and within private developments.
NCDOT Resolution • The City should adopt a resolution requesting pedestrian accommodations (i.e., sidewalks, ADA curb ramps, crosswalks, pedestrian signals at signalized intersections, etc.) be funded on all non-interstate NCDOT road and bridge projects within the municipal boundaries.

Gastonia Comprehensive Pedestrian Plan Executive Summary
ES-9
Toolbox of Effective Treatments A toolbox of effective treatments is presented in Chapter 4 of the Plan to assist in planning and design of future improvements. Recommended treatments are categorized as follows:2
• Signalization treatments use traffic signals to increase the safety and comfort of pedestrians crossing the street. Example treatments include pedestrian signals, improving signal timing, and modifying signal phasing to provide a Leading Pedestrian Interval (LPI).
• Geometric treatments add or adjust existing physical features in the pedestrian network. Example treatments include installing pedestrian refuge and curb extensions.
• Signs/Markings/Operational treatments are those that do not fit within the other two categories. Example treatments include pavement markings, lighting, turn restrictions, and enforcement.
Recommended treatments in each of these categories address both “across the roadway” and “along the roadway” needs. Depending on the exact location and desired outcome, a single treatment or a combination of several may be appropriate. In all cases, careful consideration and review of travel patterns for all modes is recommended. This toolbox can be used by the City of Gastonia to program roadway improvement projects and standalone pedestrian projects, as well as influence the private development process.
Pedestrian Demand
While all parts of the City of Gastonia would benefit from improved pedestrian facilities, it is important to understand and recognize that some areas are more attractive to pedestrian travel and some citizens are more dependent on walking as a mode of transportation. To this end, a GIS-based demand analysis was developed that incorporates the City’s existing demographic data to prioritize areas where more people have limited mobility, in combination with the locations of pedestrian generators such as transit stops, parks, and schools. Locational data was assigned appropriate weights based on the amount of pedestrian activity that each location would likely generate. Variables included destinations, generators, bus stops, greenways, crash locations, demographics, and recommendations from previous plans. The variables utilized and their weighting factors are included in Chapter 4 of the Plan, along with a “heat map” that identifies pedestrian
2 http://safety.fhwa.dot.gov/ped_bike/tools_solve/ped_tctpepc/index.cfm
Pryor Street at West Davidson Avenue near Erwin

Gastonia Comprehensive Pedestrian Plan Final Report
ES-10
demand hotspots. While all areas of the City were considered in the final determination of recommendations, the identified hotspots became focus areas for detailed field analysis because it was understood that these areas have a higher need for pedestrian infrastructure.
ES.7 Network Improvements Improvement recommendations are presented in Chapter 4 and are primarily capital improvements to the physical pedestrian network. In some instances, further study is recommended to best define future improvements. All recommendations were compiled from a number of sources and vetted through the Steering Committee and the general public.
Project Lists Specific improvement projects were identified and are presented in both tabular and map format in Chapter 4 of the Plan. Improvement projects were categorized into two distinct groups:
• Spot Improvements, including intersection improvements, pedestrian bridges, and midblock crossings. A total of 62 spot improvements were identified.
• Corridor Improvements, including sidewalks, multiuse paths, and greenways. A total of 124 corridor improvements were identified.
ES.8 Implementation To ensure that recommendations made in the Plan move toward realization, a framework for implementation was established.
Action Strategies The Gastonia Comprehensive Pedestrian Plan recommends a variety of programs, policies, and design standard revisions. However, without action these recommendations will not be realized. Therefore, a number of action strategies were developed relevant to these recommendations. These strategies complement the recommendations made earlier in this document and are intended to act as the “spark” to move these recommendations forward. Specific action strategies are located in Chapter 5 of the Plan and include: global strategies; education, encouragement, and enforcement strategies; maintenance and improvement strategies; and design standards and policies strategies.
E. Long Avenue near Broad Street

Gastonia Comprehensive Pedestrian Plan Executive Summary
ES-11
Project Prioritization The Gastonia Comprehensive Pedestrian Plan is envisioned to have a 10-year horizon; however, with over 180 projects identified, it is clear that not all projects can be implemented within the 10-year period of the Plan. Additionally, it is important to gain some understanding of which projects will provide the most benefit. For these reasons, a prioritization methodology was devised to score projects comparatively. This methodology blended the NCDOT prioritization process and understanding of local needs.
A number of variables were used to “score” each recommended project, including access, constructability, safety, demand/density, and benefit/cost variables. The variables utilized are primarily quantitative in nature and do not account for qualitative input such as perceived connectivity, public preference, and observed need. The potential use of such qualitative variables was presented during the final public meeting and received positive feedback. Therefore, it is recommended that the City consider incorporating some level of qualitative criteria as the project prioritization process is refined in future years. The exact composition of the prioritization methodology is included in Chapter 5 of the Plan.
Project Tiers Included in Chapter 5 of the Plan are tables presenting all network improvement recommendations as detailed in Chapter 4 along with opinions of probable cost, prioritization scoring, and suggested tiers for implementation. To provide some level of qualitative consideration, tiers are not direct rankings based solely on score, but rather balance scores with public comments regarding connectivity, preference, and need. In constructing the tiers logical scoring breakpoints were considered to provide a manageable number and cost of projects in the two tiers that comprise the 10-year horizon of the Plan. As individual projects are evaluated in greater detail, it is highly recommended that additional public input be received to assist in determining comprehensive need and desire for the project.
Improvements were categorized by the following tiers:
• Tier I (0-5 years) – These are projects that scored well (i.e., 35 points or higher for Spot Improvements; 40 points or higher for Corridor Improvements) or received moderate scores (i.e., 30 points or higher) coupled with strong public support. They are critical to establishing early momentum, resolving key issues, and setting the foundation for the success of future improvements.
• Tier II (5-10 years) – These are projects that received moderate scores (i.e., 30-34.5 points for Spot Improvements; 35-39.5 points for Corridor Improvements) or were middling in scoring (20-29.5 points) coupled with strong public support. Planning, building of support, and
Steering Committee Meeting
Gastonia Comprehensive Pedestrian Plan Final Report
ES-12
identification of funding sources should begin now for these projects so they are on track for implementation within this period.
• Tier III (10+ years) – These are projects that received lower scores (less than 30 points for Spot Improvements; less than 35 points for Corridor Improvements) and did not receive significant public support. While identified as part of the planning process that has produced this document, these projects fall outside the 10-year horizon of the Plan. However, these projects do address pedestrian needs within the City of Gastonia and should be implemented in the long-term. Once earlier-tiered projects have been realized, further analysis and reevaluation should be conducted. Additionally, as these projects receive greater attention, public support may increase.
Although the above tiers have been established, these designations are for planning purposes only; improvements should be implemented as soon as opportunities arise. For example, if circumstances provide an opportunity to complete a Tier II project two years after the Plan is adopted, the improvement should be made, regardless of its designation as “Tier II.”
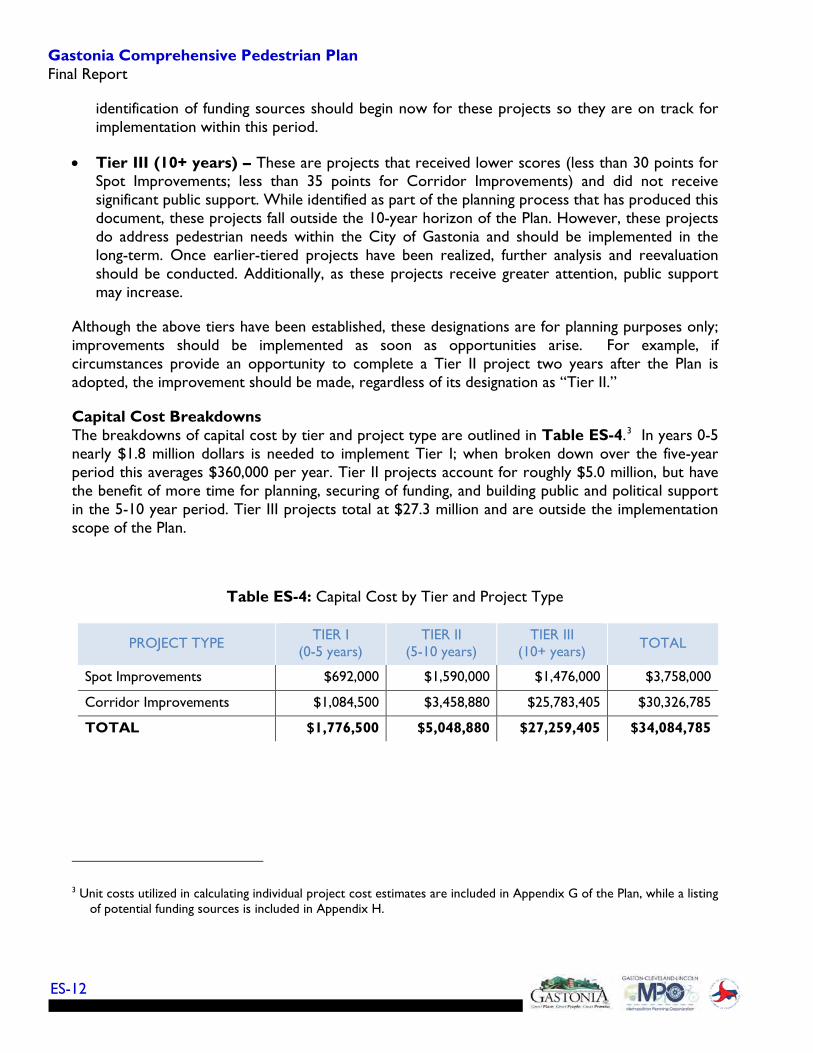
Capital Cost Breakdowns The breakdowns of capital cost by tier and project type are outlined in Table ES-4.3 In years 0-5 nearly $1.8 million dollars is needed to implement Tier I; when broken down over the five-year period this averages $360,000 per year. Tier II projects account for roughly $5.0 million, but have the benefit of more time for planning, securing of funding, and building public and political support in the 5-10 year period. Tier III projects total at $27.3 million and are outside the implementation scope of the Plan.
Table ES-4: Capital Cost by Tier and Project Type
PROJECT TYPE TIER I (0-5 years)
TIER II (5-10 years)
TIER III (10+ years) TOTAL
Spot Improvements $692,000 $1,590,000 $1,476,000 $3,758,000
Corridor Improvements $1,084,500 $3,458,880 $25,783,405 $30,326,785
TOTAL $1,776,500 $5,048,880 $27,259,405 $34,084,785
3 Unit costs utilized in calculating individual project cost estimates are included in Appendix G of the Plan, while a listing of potential funding sources is included in Appendix H.

Gastonia Comprehensive Pedestrian Plan Executive Summary
ES-13
NCDOT Complete Streets and Incidental Pedestrian Improvements The North Carolina Board of Transportation adopted a Complete Streets policy in July 2009. The policy directs the North Carolina Department of Transportation (NCDOT) to consider and incorporate all modes of transportation when building new projects or making improvements to existing transportation infrastructure. Under the new policy, NCDOT will collaborate with cities, towns, and communities during the planning and design phases of new streets or improvement projects. Together, they will decide how to provide the transportation options needed to serve the community and complement the context of the area.
Gastonia, like many municipalities in North Carolina, has aggressively annexed areas around its periphery as development has occurred in these places. As a result, approximately 80 percent of the area within the City Limits is now considered urbanized by the U.S. Census Bureau. The remaining rural area is primarily comprised of parkland, waste facilities, underdeveloped industrial parks, and satellite annexations for proposed mixed-use developments. As new residential and industrial development continues, the City will likely become more urbanized.
As an urbanized community, the City of Gastonia experiences high demand for pedestrian facilities. Since the intended scope of this plan is limited to ten years, not all facilities needed or desired by the community are included in this plan. However, as NCDOT constructs new transportation projects or improves existing transportation infrastructure in the City, there is great potential for the construction of incidental pedestrian facilities. The City will continue to advocate for NCDOT to include pedestrian facilities in the construction of new transportation projects or in improvements to existing transportation infrastructure. A map is included in Chapter 5 of the Plan that depicts these potential opportunities for NCDOT incidental improvements to the pedestrian network.

Gastonia Comprehensive Pedestrian Plan Final Report
ES-14
page intentionally left blank

Gastonia Comprehensive Pedestrian Plan 1 Introduction
1
1 Introduction
The City of Gastonia desires to be a city where walking is safe, convenient, and a desirable mode of transportation for residents and visitors of all ages and abilities. Walking is an essential part of every trip; whether walking in your neighborhood, traveling between your car and the front door of a business establishment, or going to the corner convenience store, at some point we are all pedestrians.
1.1 Why a Plan? The Gastonia Comprehensive Pedestrian Plan has been developed to realize the vision of improved health, safety, and quality of life in Gastonia. The City understands that walking is critical to having a diverse transportation network and making its streets more vibrant and attractive. For people to choose walking over other modes of transportation, sidewalks and other pedestrian spaces need to be safe, comfortable, and aesthetically pleasing, while also connecting logical desire lines between recognized origins and destinations. Pedestrian zones must be designed to accommodate all users, regardless of age or ability, allowing for person-to-person interaction, patronage of businesses, and the pursuit of active, healthy lifestyles.
The Gastonia Comprehensive Pedestrian Plan was a collaborative effort of the City of Gastonia, the Gaston-Cleveland-Lincoln Metropolitan Planning Organization (MPO), and the North Carolina Department of Transportation (NCDOT). The Plan identifies policies, programs, and physical infrastructure improvements to make Gastonia a safer and more comfortable place to walk.
The Vision of the Gastonia Comprehensive Pedestrian Plan is to improve the health, safety, and quality of life in Gastonia.
West Main Avenue near Marietta Street

Gastonia Comprehensive Pedestrian Plan Final Report
2
Benefits of Walking1 Improving a city’s walking environment can have significant positive impacts to a variety of important benefit categories, including health, safety, economics, and the general quality of life of a community. In recent years, much research and attention has been paid to the benefits of walking; the following sections showcase some of the more compelling arguments for increasing the attractiveness, convenience, and safety of walking.
Health Benefits Walking is the most basic form of physical activity and provides substantial health benefits. The American Medical Association (AMA) and Center for Disease Control (CDC) both recommend adults participate in at least 150 minutes of physical activity per week (i.e., about 20 minutes a day).2 Numerous health advocacy organizations recommend walking for physical activity, as it is easy, widely accessible, relatively low impact, and requires no specialized equipment. Walking also does not require a dedicated time and place for physical activity as do going to the gym, swimming, o r other methods of physical activity; it can also be easily incorporated into daily activities as a means of transportation or recreation.
Walking is the most commonly reported physical activity among U.S. adults over all and also the most frequently reported activity among adults who meet physical activity guidelines. However, as of 2012, less than half of adults living in the U.S. reported meeting the recommended physical activity and a third reported being physically inactive.3
Increased walking can help remedy a number of common health issues and concerns. The Mayo Clinic encourages regular walking as a healthy activity, stating that walking can help an individual:
• Maintain a healthy weight;
• Prevent or manage various conditions, including heart disease, high blood pressure, and type 2 diabetes;
• Strengthen bones;
• Lift mood; and
• Improve balance and coordination.
1 For additional information on the benefits of walking, please reference the North Carolina Statewide Pedestrian and Bicycle Plan: http://www.ncdot.gov/bikeped/download/WalkBikeNCPlanAppendixlowres.pdf
2 Centers for Disease Control and Prevention 3 Centers for Disease Control and Prevention
Linwood Road near Gaston Avenue

Gastonia Comprehensive Pedestrian Plan 1 Introduction
3
Walking also has particular benefits for senior citizens and children:
• Exercise on a regular basis has been shown to help prevent dementia.4
• Walking is an excellent way for seniors, especially those who don’t drive, to socialize with friends and access local services.
• In 2010, over one third of children and adolescents were considered overweight or obese. At the same time, there has been a significant decline in walking to school: Only 13% of children walk to school, down from 66% in 1970.5 While a decrease in walking to school is not the direct cause of childhood obesity, regular exercise in the form of walking to school could help reverse this trend.
Economic Benefits Improving a community’s walking environment can also have positive impacts on that community’s local economy. More people are expressing a preference to live in compact, walkable, mixed use neighborhoods. The National Realtors Accosition 2013 Community Preference Survey revealed that 60% of adults favor walkable, mixed use neighborhoods, and almost two thirds of adults between 18 and 35 report a desire to drive less if alternative transportation options were available. Additionally, property values have shown increases of $700 to $3,000 for each additional point on WalkScore, a widely used tool to measure a community’s walkability.6
When individuals and families can choose to walk instead of drive, it can make a significant impact to a household’s expenses and can increase job opportunities. Cost savings from driving less or not needing to own multiple or even a single vehicle provide additional income which can be used for other necessities and discretionary purchases. Also, through its ability to improve health, walking has been shown to reduce health care costs. In addition:
• Walkable communities that connect jobs to residential areas provide greater access to jobs for people without a vehicle and can improve upward economic mobility.7
• Providing transportation options for all people is important, especially as 13% of people over the age of 15 do not drive.8
• Costs associated with obese and overweight adults in the Unites States and Canada are estimated to be approximately $300 billion.9
• The nation could save $5.6 billion in health care costs related to obesity if one of every 10 adults started a regular walking program.10
4 Genetics and Aging Research Unit at Massachusetts General Hospital 5 Centers for Disease Control and Prevention 6 Cortright, Joe. “How Walkability Raises Home Values in U.S. Cities.” CEOs for Cities. 2009 7 Chetty, Raj, et al. “Where is the Land of Opportunity? The Geography of Intergenerational Mobility in the United
States.” Harvard University and the National Bureau of Economic Research. 2014. 8 National Household Travel Survey 9 Behan, D. and Cox, S. “Obesity and its Relation to Mortality and Morbidity Costs.” Society of Actuaries. 2010.

Gastonia Comprehensive Pedestrian Plan Final Report
4
Safety Benefits No matter who you are, everyone is a pedestrian at some point in their journey, and walking is an essential means of transportation for people who cannot drive or do not own a vehicle. Pedestrians are also the most vulnerable road user and at the highest risk for injury in the event of a crash. People may lack access to a vehicle due to age (i.e., children and seniors), disability, or financial limitation. Providing safe transportation options for everyone allows citizens to independently navigate between their homes and important destinations such as schools, shopping centers, grocery stores, and public services.
Safe walking environments result in safer overall transportation networks. Design changes that facilitate safe walking improve the safety of all road users, such as improved visibility and reductions in speeding. Traffic safety has positive financial impacts as well. The National Safety Council estimates an average cost of $57,400 (i.e., 2011 dollars) for a nonfatal injury resulting from a motor vehicle crash. In addition to improved traffic safety, a culture of walking increases “eyes on the street,” which can help reduce crime.
Quality of Life Benefits Walkable communities are more vibrant communities because their streets are active and dynamic with people engaging one another on a personal level. Focus on improving connectivity, accessibility, and safety of pedestrians results in environments that encourage strong economies and a healthy populace.
Nationally, almost half of trips made daily are three miles or less in length, not an unreasonable walking distance.11 When communities work to embrace walking as a means of transportation and recreation, they increase the choices their citizens have for these shorter trips. Whether out of necessity or choice, living in a community where walking to the store, work, or church is a viable option makes life easier and more enjoyable.
Communities who work to improve walkability also see an improved public realm and quality of development. Working with developers to facilitate a connected system of shared-use paths and sidewalks, walking becomes a way of life rather than a choice. Encouraging a mix of land uses to create nodes of neighborhood conveniences in relatively close proximity to residential areas provides local options for shopping, eating, and socialization. Development patterns that support a
10 National Governor’s Association Report on Healthy Living. 2011. 11 Federal Highway Administration. University Course on Bicycle and Pedestrian Transportation (FHWA-HRT-05-085).
http://www.tfhrc.gov/safety/pedbike/pubs/05085/index.htm
E. Long Avenue near Broad Street

Gastonia Comprehensive Pedestrian Plan 1 Introduction
5
variety of destinations within a compact area are not only positive for walking but will also reduce automobile dependency, alleviate roadway congestion, reduce parking demand, and improve the community’s overall quality of life.
1.2 Plan Overview The Plan is divided into five sections. This Introduction provides information regarding the purpose of the Plan and public participation process. Existing Context and Pedestrian Issues summarizes baseline conditions, previous planning efforts, and pedestrian issues. Next, Programs, Policies, and Design Standards reviews recommended education, encouragement, and enforcement policies and programs and design standard revisions. Network Recommendations describes the demand analysis, as well as listing and mapping recommended improvements. The final chapter, entitled Implementation, provides action strategies for moving recommendations forward, prioritization methodology, and project tiers and cost estimates.
1.3 Public Participation The Gastonia Comprehensive Pedestrian Plan was formulated through a robust public participation plan. Specific methods and techniques are outlined in the sections that follow.
The planning process was guided by a Steering Committee composed of a range of City departments, Gaston-Cleveland-Lincoln MPO staff, NCDOT staff, Gaston County representatives, advocacy groups, and business and community leaders. Members of the Steering Committee are listed on the title page of this report.
Steering Committee Meeting

Gastonia Comprehensive Pedestrian Plan Final Report
6
Walking Tour Members of the Steering Committee and other interested parties participated in a walking tour of Gastonia on June 24, 2013. During the walk, participants observed and discussed pedestrian-related issues and opportunities throughout the community. Information gathered during this tour is reflected in the list of existing issues included later in this report and were considered as recommendations were crafted later in the planning process.
Stakeholder Van Tour A van tour was conducted on June 25, 2013. The van tour allowed stakeholders to both verbally and visually communicate pedestrian issues to the project team from all areas of Gastonia. Similar to insight received during the walking tour described above, information gathered during the van tour is reflected in the list of existing issues included later in this report and were considered as recommendations were crafted later in the planning process.
Goals of the Plan • Improve safety by reducing the
number and severity of crashes involving pedestrians
• Develop practical and implementable solutions
• Support local businesses and foster economic growth
• Support existing transit
• Enhance neighborhood connectivity and make linkages
• Promote social equity
• Improve enforcement
• Inform and educate the public
• Assess existing infrastructure while implementing retrofits and filling gaps
• Enhance coordination between Gastonia, the Gaston-Cleveland-Lincoln MPO, and NCDOT
• Enhance the character of downtown
• Ensure that new development contributes to pedestrian access and connectivity
• Address difficult intersections and other barriers
• Identify performance measures
• Improve pedestrian outcomes on all roadway improvement and reconstruction projects
• Improve health
South New Hope Road south of Redbud Drive

Gastonia Comprehensive Pedestrian Plan 1 Introduction
7
Online Map An interactive online map was provided July to mid-September 2013 that offered the opportunity for the public to identify various relevant items, including: places they walk to and from often; difficult crossings; missing sidewalks; and other conditions that impact their experience walking in Gastonia. Members of the public could add new items to the map or comment on input others had already added to the map. Input received was incorporated into the planning process moving forward. The categories of information that were collected are highlighted below.
Route Comments
• Place I walk often
• Missing sidewalk
• Uncomfortable place to walk
• Off-street connection needed
• Existing worn path
Point Comments
• Place I walk to/from
• Bus stop I walk to/from
• Difficult crossing
• Sidewalk needs repair
• Barrier to walking
• Pedestrian crash near miss
In addition to collecting data on walking conditions, the online map’s “Welcome Survey” allowed for the collection of information pertaining to respondents’ residency, work location, transportation preferences, and walking habits. The Welcome Survey is shown in Figure 1-1.
Figure 1-1: Online Map Welcome Survey

Gastonia Comprehensive Pedestrian Plan Final Report
8
A total of 75 unique users visited the online map, with 72% living within the city limits of Gastonia and 83% working in Gastonia. Information specific to respondents walking habits is presented in Table 1-1, Table 1-2, and Table 1-3 (for additional detail regarding information collected in the Online Map Welcome Survey, please see Appendix A). While 93% indicated that driving is their primary mode of transportation, 72% said that they walk either every day or a few times each week. Top reasons for walking included exercise and shopping/errands.
Table 1-1: Welcome Survey Responses – Primary Mode of Transportation
ANSWER CATEGORY
NUMBER OF RESPONDENTS
PERCENTAGE OF RESPONDENTS
Driving 70 93%
Walking 4 5%
Biking 1 1%
TOTAL 75 99%* *Does not equal 100% due to rounding
Table 1-2: Welcome Survey Responses – Frequency of Walking
ANSWER CATEGORY
NUMBER OF RESPONDENTS
PERCENTAGE OF RESPONDENTS
Every day 24 32%
A few times a week 30 40%
A few times a month 8 11%
A few times a year 11 15%
Never 2 3%
TOTAL 75 101%* *Does not equal 100% due to rounding

Gastonia Comprehensive Pedestrian Plan 1 Introduction
9
Table 1-3: Welcome Survey Responses – Reasons for Walking
ANSWER CATEGORY
NUMBER OF RESPONSES*
PERCENTAGE OF RESPONDENTS
Exercise 63 84%
Shopping/errands 25 33%
To/from work 6 8%
To/from school 4 5%
Other 13 17% *Multiple responses per respondent were allowed
While 75 people logged into the online map and completed the welcome survey, only 26 of those respondents went on to actually add data to the map itself. Additionally, nearly 50% of the data was added by two respondents. Because of the lower rate of map usage, data collected through the online map was weighed against additional public input and institutional knowledge of other stakeholders to ensure that the most accurate picture of pedestrian needs was communicated in the Plan. Citizens from the Modena Street area also provided written comments regarding pedestrian needs in their community. In most instances, information included in the online map proved to be indicative of general public opinions about pedestrian needs in Gastonia.
Figure 1-2 shows the online map with all input received. The most predominate data types entered into the online map were missing sidewalks and difficult crossings. Table 1-4 relates specifics about these two data types. Streets with requests for sidewalks varied in character, but many were wider, higher volume arterials. Fewer comments were received regarding neighborhood streets, which could indicate that these streets are already considered walkable. Some comments were not from pedestrians themselves, but rather were from concerned drivers who see pedestrians walking on the side of the road or in the median.
Table 1-4: Online Map Predominate Data Type Characteristics
MISSING SIDEWALKS DIFFICULT CROSSINGS
Students walking to school No crosswalks
Accessing retail destinations Traffic too fast
Concerned drivers Too much traffic
Varied street types Road too wide

Gastonia Comprehensive Pedestrian Plan Final Report
10
Specific information collected from the online map included:
• Modena Street had the highest concentration of data, including being a difficult area to walk, numerous desire lines and destinations, missing sidewalks, difficult crossings, and presence of bus stops;
• Desire for sidewalks between all elementary and middle schools and their surrounding neighborhoods;
• Difficult crossings were clustered along Franklin Boulevard and then scattered throughout the City;
• Highest reported concentration of pedestrian near misses is along Franklin Boulevard between Highland and Firestone Streets;
• Areas that were specifically cited for being an uncomfortable place to walk included US 321 north of I-85, Modena Street, Cox Road, and Hoffman Road;
• Majority of requested off-street connections directly mirror the City’s greenway plan;
• Bus stop accessibility was only mentioned twice with both comments located along the Modena Street corridor; and
• Needed sidewalk repair was only cited in one location, Broad Street south of Davidson Avenue.

Gastonia Comprehensive Pedestrian Plan 1 Introduction
11
Figure 1-2: Online Map Public Input

Gastonia Comprehensive Pedestrian Plan Final Report
12
page intentionally left blank

Gastonia Comprehensive Pedestrian Plan 1 Introduction
13
Public Meetings Two public meetings were included as part of the planning process for the Gastonia Comprehensive Pedestrian Plan. The first public meeting was held on June 25, 2013 at the Gastonia Police Department on Long Avenue. Ample notification was provided to the public through the use of newspaper advertisements, email blasts to community organizations (i.e., churches, Rotary, neighborhood organizations, etc.), a newspaper article in the Gaston Gazette. The meeting afforded an opportunity for citizens to provide input on existing conditions, barriers and obstacles, and pedestrian needs. A series of existing conditions maps were displayed for review and an opportunity for participants to vote on the most important pedestrian issues in Gastonia was provided.
The second public meeting was held on December 16, 2013. Again, a variety of methods were utilized to inform the public of this meeting, including newspaper advertisements, email blasts to community organizations, distribution of flyers and posters throughout the city, and posting of the draft report to the MPO webpage for review. This meeting presented the Draft Plan. Feedback received was utilized to assist in refinement of priorities for recommended actions and confirming a roadmap for implementation.
Steering Committee Members Reviewing Draft Projects

Gastonia Comprehensive Pedestrian Plan Final Report
14
page intentionally left blank

Gastonia Comprehensive Pedestrian Plan 2 Existing Context and Pedestrian Issues
15
2 Existing Context and Pedestrian Issues
The existing pedestrian context was established through the documentation of existing infrastructure, land use, and safety conditions pertaining to pedestrian travel and comfort in the City of Gastonia. As a complement to this, the pedestrian planning context was also considered through the review of demographic information and relevant previous planning documents. Finally, pedestrian issues were identified.
2.1 Overview
Geography and Development History The City of Gastonia’s geographic and demographic characteristics have an overarching impact on the pedestrian planning process. They significantly affect transportation, the environment, local ordinances, and everyday decisions by motorists and pedestrians.
The City of Gastonia is the political, economic, and cultural center of Gaston County, North Carolina and is the third most populous city in the fast-growth Charlotte-Concord-Gastonia, NC-SC Metropolitan Statistical Area with 72,723 residents (U.S. Census Bureau, 2012 Population Estimates Program). The land area of the City is just over 50 square miles and consists of gently rolling hills and elevated ridges such as Crowders Mountain. There are many streams and floodplains which feed into the South Fork and Catawba rivers and several small ponds and lakes. The population density of the City is approximately 1,440 persons per square mile, similar to that of other satellite cities in the region, such as Concord, NC and Rock Hill, SC but nearly half as
Existing conditions provide a baseline for understanding pedestrian issues.
North Marietta Street south of East Long Avenue

Gastonia Comprehensive Pedestrian Plan Final Report
16
dense as the City of Charlotte. The City is also home to approximately 6,000 business firms that employ about 40,000 workers (U.S. Census Bureau, 2007 Economic Census and 2008-12 American Community Survey). The City is almost exclusively classified as “urban” by the United States Census Bureau, with the remaining rural area primarily consisting of parkland, developing industrial areas, and satellite annexations for future development.
The City’s early development is typical of older municipalities in the Piedmont region of the Carolinas in that its initial growth was fueled by proximity to the railroad and the manufacturing industry, especially of textiles. During this period, the City’s population and economy grew rapidly and over time, the City annexed several surrounding mill villages. The pedestrian-oriented development of these areas that occurred from the late 1800’s to early 1900’s is
in marked contrast to areas of the City that were developed after World War II and the proliferation of the automobile in American households. Many of these historic, pedestrian-oriented areas, such as Downtown and Loray Mill, are being revitalized as American housing preferences have begun to once again favor walkable, mixed-use communities with a sense of place.
Much of the post-war, suburban growth of the City was built on greenfield sites at the City’s periphery, in virtually every direction. These areas were attractive to the City’s middle and high income families seeking larger lots and modern housing. However, the gradual decline of the manufacturing industry and availability of desirable and developable greenfield sites has reoriented residential growth in Gastonia. In recent decades, higher-end residential growth has mostly occurred towards Charlotte as the City has become more dependent on Charlotte for white-collar jobs for new and existing residents. While undeveloped land at all edges of the City has continued to be developed and annexed by the City, the growth of the eastern part of the City has been much more rapid.
With the exception of industrial uses, the most intensive non-residential land uses are along Franklin Boulevard (US 29/US 74), which runs east-west and serves as the new “Main Street” for Gastonia. Other major thoroughfares are home to much of the remaining non-residential uses, such as York Highway (US 321), Garrison Boulevard, Union Road (NC 274), and New Hope Road (NC 279). Commercial growth has been more even in the City than residential growth, but most big-box retail stores and regional-scale commercial developments have been built east of downtown, forming a sort of secondary central business district that includes regional-scale commercial, hotels, and medical facilities and offices. The existing land use patterns are evident in the City’s zoning map, provided in Figure 2-1.
York-Chester Historic District

Gastonia Comprehensive Pedestrian Plan 2 Existing Context and Pedestrian Issues
17
Figure 2-1: Gastonia Zoning Map
Pedestrian Environment Gastonia’s geography and development history impact the City’s pedestrian environment in both positive and negative ways. These impacts, natural or man-made, translate into barriers and opportunities for pedestrian travel. Though the City of Gastonia does not conduct regular pedestrian counts at this time, anecdotal evidence and experience of City staff indicates that the highest pedestrian traffic is in areas with higher concentrations of low-income households and a more diverse mix of land uses. Downtown likely has the highest pedestrian traffic, but this is primarily limited to normal business hours, as downtown still lacks the residential density and mix of uses to sustain a full 24-hour/7-day a week pedestrian environment. In more suburban areas

Gastonia Comprehensive Pedestrian Plan Final Report
18
where the landscape is predominantly single-family residential, pedestrian traffic is almost exclusively recreational or social.
Barriers to pedestrian travel are both natural and man-made. In Gastonia, the rolling and occasionally rugged terrain and prevalence of streams and floodplains has caused some development to neglect street and sidewalk connectivity where it would be very expensive or even cost-prohibitive. Certain elements of the transportation system, such as at-grade railroads and I-85 pose similar problems for connectivity. Many man-made barriers to pedestrian travel are the collective result of typical post-WWII, automobile-oriented development patterns. These include overbuilt and automobile-oriented thoroughfares, a lack of adequate pedestrian infrastructure and accommodations, automobile-orientated site plans, excessive cul-de-sac development and poor connectivity between developments, and segregation of land uses.
Many thoroughfares in Gastonia are excessively wide and lack sidewalks, pedestrian refuges, and/or pedestrian signalization. Wider travel lanes encourage higher speeds which can discourage pedestrian travel, even when pedestrian infrastructure is present. This is especially true for many of the thoroughfares where sidewalk is directly adjacent to the roadway, lacking a planting strip or some type of buffer that would serve as a physical and/or psychological separation for pedestrians.
Another man-made barrier is the high number of gaps in the pedestrian network. While this may only be a minor inconvenience for some, it limits the mobility-impaired population and can be unattractive and dangerous to any pedestrian during wet weather. Worn paths made by frequent pedestrian traffic can be found along thoroughfares throughout the City. But sidewalks are only part of the pedestrian infrastructure. In some instances where sidewalk is present, ADA-compliant ramps have yet to be installed. And in many locations where pedestrians can and do cross major thoroughfares, at intersections or at mid-block, there is often inadequate accommodation for this crossing. While pedestrian signalization at major intersections is more common than the provision of mid-block crossings or pedestrian refuge islands, many areas still lack adequate pedestrian signalization.
Land use and subdivision regulations also have played a large role in the pedestrian environment. While these regulations have changed over time, the impact of previous regulations on residential development has been the development of single-family and multi-family developments that have poor connectivity to surrounding developments, either residential or non-residential. This style of residential development, characterized by cul-de-sacs and gated apartment complexes, can make the actual path to neighborhood commercial areas much longer than the distance “as the crow flies.” On the other hand, for non-residential development, land use regulations have
Historic land use regulations required large parking areas like this one at Dixie Village Shopping Center

Gastonia Comprehensive Pedestrian Plan 2 Existing Context and Pedestrian Issues
19
historically been detrimental to the pedestrian environment by promoting an excessive number of parking spaces and curb cuts and requiring little pedestrian accommodations.
Unfortunately, many of the man-made barriers are the result of pre-existing constraints. The topography and presence of at-grade railroads do limit the feasibility of providing adequate street and pedestrian connectivity in many areas. At the same time, availability of right-of-way is a major problem for sidewalk and multi-use path construction along thoroughfares and streams. In many cases, the right-of-way backs up to street curbs and/or slope issues require temporary easements to construct pedestrian facilities. In the case of greenways along streams and floodplains, right-of-way must often be acquired from adjacent landowners, which is sometimes met with resistance.
Aside from topographical and right-of-way constraints, existing land use patterns are another constraint in improving the pedestrian environment. Human-scale neighborhoods with a mix of land uses, either vertical or horizontal, encourage pedestrian travel. While many parts of the City already have this mix of uses, there are still areas where single-family residential developments dominate the landscape. Some commercial and office areas can be found at major intersections, but there are still many neighborhoods which lack neighborhood commercial areas within walking distance.
Still, there are some easy opportunities for the City of Gastonia to improve the pedestrian environment. While streams and floodplains have discouraged connectivity in some instances, they can also make for attractive greenway alternatives, depending on right-of-way situations and surrounding land uses. “Paper Streets,” or public rights-of-way that were planned for streets that were never built, are another opportunity for the City. Such are more common in older parts of the City and present opportunities for improved pedestrian connectivity. Another opportunity for Gastonia is its moderately high population and employment growth rate. This will allow for additional development, especially infill development and redevelopment, to improve the pedestrian environment as they are built.
Demographics The current socioeconomic characteristics of the City of Gastonia imply many things for existing and potential pedestrian conditions. These statistics, illustrated in Table 2-1 and Figure 2-2, indicate that the City of Gastonia:
• Has a high percentage of households with no regular access to a vehicle relative to the Charlotte Metropolitan Statistical Area (MSA) and North Carolina as whole;
• Has an aging population higher than the Charlotte MSA but similar to that of North Carolina and the United States;
• Has a high percentage of residents with a disability; and
• Has a high percentage of households living below the federal poverty line and earning less than 80% of the Area Median Income (AMI) for the Charlotte MSA.

Gastonia Comprehensive Pedestrian Plan Final Report
20
Table 2-1: Socioeconomic Characteristics
CATEGORY GASTONIA CHARLOTTE MSA
NORTH CAROLINA
UNITED STATES
Under 18 years 25.8% 26.2% 23.8% 23.9%
65 years and over 12.7% 10.2% 13.1% 13.2%
Zero Vehicle Households 8.6% 5.9% 6.5% 9.0%
Disabled Population 15.2% 9.8% 13.1% 12.0%
Population in Poverty 21.4% 13.9% 16.8% 14.9%
Households Earning Under 80% of AMI 54.2% 41.7% N/A N/A
Note: 80% of AMI is $43,322 (2012 dollars) but is rounded to $45,000 because of data limitations. Source: 2008-12 American Community Survey, Tables DP02, DP03, DP04, DP05, and B19001.
Figure 2-2: 2010 Population Pyramids for Gastonia and United States Source: 2010 U.S. Census, Table QT-P1
It should be noted that the distribution of low-income and carless households is not even throughout the City. The central and western parts of the City have the greatest concentrations of these populations, though there are pockets in other areas, typically in areas with affordable rental housing in close proximity to commercial areas and public transit service. Still, the socioeconomic

Gastonia Comprehensive Pedestrian Plan 2 Existing Context and Pedestrian Issues
21
trends above are to be expected for urban areas, where low-income, carless, and disabled persons are better accommodated by more public services, such as public transit, and a concentration of major destinations and employment opportunities.
These socioeconomic figures for Gastonia likely mean that there is a good amount of pedestrian travel occurring in the City by necessity versus by choice. Interestingly though, when looking at the means of transportation that Gastonia residents use to commute to work, a very small percentage actually commute to work by walking, biking, or riding public transportation. Instead, Gastonia has a very high percentage of commuters that travel to work by driving alone (see Table 2-2).
Table 2-2: Means of Transportation to Work
CATEGORY GASTONIA CHARLOTTE MSA
NORTH CAROLINA
UNITED STATES
Drove alone 83.3% 79.6% 80.9% 76.1%
Carpooled 11.8% 10.7% 10.7% 10.0%
Public transportation 1.0% 2.1% 1.1% 5.0%
Walked 0.7% 1.5% 1.8% 2.8%
Bicycle 0.1% 0.1% 0.2% 0.6%
Other 0.7% 0.8% 1.0% 1.2%
Worked at home 2.6% 5.2% 4.3% 4.3%
Note: Other includes taxicub, motorcycle, and other means. Source: 2008-12 American Community Survey, Table B08301.
It is important to note that while Gastonia has a low pedestrian mode share for work commutes, work commute trips are only estimated to account for approximately five percent of all pedestrian trips at the national level, as shown in Figure 2-3. Most pedestrian trips are social, recreational, or for personal errands. Unfortunately, existing federal, state, and regional surveys and other data collection efforts do not provide detailed information for non-work pedestrian trips at the local level. Because of this lack of information, many local governments have begun counting pedestrians at select locations to better understand their pedestrian travel patterns.

Gastonia Comprehensive Pedestrian Plan Final Report
22
Figure 2-3: National Pedestrian Trips by Trip Purpose
Source: 2009 National Household Travel Survey
Public Health Pedestrian activity is very important for the public health of a community. Walking, like most forms of regular physical activity, has been associated with many health-related benefits, including: lower low-density lipoprotein (LDL) cholesterol; higher high-density lipoprotein (HDL) cholesterol; lower blood pressure; reduced risk and management of type 2 diabetes; reduced risk of heart attack; improved mood; and feeling strong and fit. As indicated in Table 2-3, the prevalence of these types of health issues tends to be higher in Gaston County than North Carolina as a whole.
Social and Recreation,
46.0%
Family/ Personal
Errands, 37.0%
School or Church, 8.6%
To/ From Work, 4.5%
Work-Related Business, 1.7%
Other, 2.1%

Gastonia Comprehensive Pedestrian Plan 2 Existing Context and Pedestrian Issues
23
Table 2-3: Gaston County Public Health Indicators
CATEGORY GASTON COUNTY
NORTH CAROLINA
In excellent or very good health 44% 50%
Percent with high cholesterol 46% 39%
Diabetes 18% 11%
Overweight/obese 75% 65%
Achieving recommended amount of physical activity 45% 47%
Poor mental health 24% 25%
Source: 2011 Behavioral Risk Factor Surveillance System.
In the Gaston County 2012 Community Health Assessment Report, one of the top priorities for the County was to “reduce the incidence of obesity by increasing programming to promote physical activity and improved nutritional practices.” When survey respondents throughout the County were asked to rank perceived community health problems, the most popular response was obesity. And when asked about built environment issues, the most popular response was sidewalks, followed by parks and recreation, and walking and biking trails.
2.2 Existing Sidewalks The sidewalk inventory included in Figure 2-4 depicts existing sidewalks in Gastonia as well as locations where sidewalks are not present but are needed. The “sidewalk needed” category is compiled from a database maintained by the City’s Engineering Department that consolidates addressed sidewalk need from citizen requests and previous planning studies, such as Safe Routes to School efforts. The total linear miles of existing and needed sidewalks, according to the data provided, is summarized in Table 2-4.
Table 2-4: Existing Sidewalks and Sidewalk Needs
CATEGORY LINEAR MILES
Total Existing Sidewalks 174.2
Total Identified Sidewalk Needs 25.7
No analysis of the condition of existing sidewalks has been performed by the City of Gastonia. However, City staff has inventoried existing sidewalks in GIS, as illustrated in Figure 2-4. As this map indicates, sidewalk infrastructure is the densest around downtown Gastonia and in new subdivisions developed in the early 2000’s and later. Outside of these areas, sidewalk infrastructure

Gastonia Comprehensive Pedestrian Plan Final Report
24
is mostly limited to arterials and collectors, though there are still gaps in connectivity of sidewalks along such streets.
The presence and condition of sidewalks throughout Gastonia is closely linked with the time period in which any given area was developed. Because much of the area around downtown Gastonia and the surrounding mill villages were developed before the proliferation of the automobile in American society following World War II, these areas tend to have a highly connected street grid and better sidewalk network, with sidewalks often provided on both sides of the street. However, some areas, such as the Highland Community, were developed less comprehensively and lack this infrastructure. Furthermore, in some instances, sidewalks in older neighborhoods are much narrower than the preferred 5- to 6-foot width of today and were designed before the Americans with Disabilities (ADA) Act of 1990. Only through recent retrofitting has this existing
infrastructure been addressed and equipped with ADA-compliant curb ramps. Still, these sidewalks are often separated from the street by a narrow planting strip, providing a physical and psychological separation between pedestrians and automobiles. In some of the older areas of the City, sidewalk tiles can also be found from an era when pedestrian wayfinding superseded that of the automobile. This pedestrian-friendly design, when combined with an intact, small-block street grid and mix of nearby land uses, makes these areas arguably the most walkable neighborhoods in the City.
On the opposite end of the spectrum are the many subdivisions that were developed within the City from the 1980’s through the early 2000’s. While some of these subdivisions have sidewalk on one or both sides of the street, land use patterns and demographics translate into the use of these sidewalks as primarily for recreational uses and exercise.
In between the historic neighborhoods and new subdivisions are the mid-century subdivisions, such as Gardner Park. These are similar to their modern counterpart but differ in their higher street connectivity and extraordinarily wide streets, which are utilized by pedestrians because of the lack of sidewalks. Because these subdivisions were developed alongside schools, some of these areas have benefited from sidewalks and pedestrian signals that have been installed around elementary and middle schools.
The presence of sidewalk along non-residential corridors and nodes is inconsistent throughout the City. While some of the older areas have had sidewalks for decades, much of the sidewalk along arterials and collectors has been installed recently as roads have been widened, new development has occurred, and the City has issued bonds or used other revenue to construct sidewalks.
Historic Street Name Tiles

Gastonia Comprehensive Pedestrian Plan 2 Existing Context and Pedestrian Issues
25
Figure 2.4: Sidewalk Inventory

Gastonia Comprehensive Pedestrian Plan Final Report
26
page intentionally left blank

Gastonia Comprehensive Pedestrian Plan 2 Existing Context and Pedestrian Issues
27
2.3 Existing and Proposed Greenways and Trails A map of existing and proposed greenways and trails was developed and is presented in Figure 2-5. This map highlights existing multi-use trails such as the Highland Rail Trail, as well as trails that have been recommended as part of the City’s Vision for a Healthy Community planning process (see below for more information). Table 2-5 summarizes the number of miles of existing and proposed greenways and trails.
Table 2-5: Existing and Proposed Greenways and Trails
CATEGORY LINEAR MILES
Total Existing Greenways and Trails 8.3
Total Proposed Greenways and Trails 60.6
Through its Vision for a Healthy Community, A Plan for Parks, Recreation and Open Spaces, 2005-2020, the City has laid out a plan for developing greenways with the goals of ultimately interconnecting the entire City and making joining connections to County and regional trails. Specific priorities identified in the document include expanding the Avon/Catawba Creek Greenway system, interconnecting City parks, and connections to Daniel Stowe Botanical Garden, Crowders Mountain State Park, and Gaston College. As an initial step in achieving this vision, multiple opportunities and alternatives were identified in the Vision for a Healthy Community document, with the intent to move projects forward strategically, recognizing that not all alternatives will need to be implemented.
Currently, the Avon/Catawba Creek Greenway and Highland Rail Trail form the backbone of the multi-use path system in the City. Though there are several miles of multi-use paths within City and State parks in Gastonia, these park paths are primarily for recreation and are not as well connected to the City’s overall pedestrian network. Both the Avon/Catawba Creek Greenway and Highland Rail Trail, on the other hand, are more linear and have many existing and future connections to surrounding neighborhoods. These wide, asphalt paved paths are in good condition, having been constructed incrementally or in whole over the past fifteen years. These paths are closed to the public from dusk to dawn and as such, there is minimal lighting provided.
Both the Avon/Catawba Creek Greenway and Highland Rail Trail come short of reaching downtown, but through incremental improvements, the City is working to realize this important connection. The pedestrian retrofitting of the Marietta Street Bridge and widening of the sidewalk on Long Avenue, from Marietta Street to the terminus of the Highland Rail Trail, exemplifies these efforts. The City is also currently in the planning stages of bringing bicycle and pedestrian improvements to Second Avenue and Chestnut Street to connect the Avon/Catawba Creek Greenway with downtown. Barriers to expanding the existing multi-use path system are mostly related to cost and right-of-way constraints. Extending the Highland Rail Trail north to connect to Rankin Lake Park and eventually Gaston College is a major priority of the City and County and projects to achieve this expansion are in the planning stages. The City is also currently planning the

Gastonia Comprehensive Pedestrian Plan Final Report
28
extension of the Avon/Catawba Creek Greenway to Marietta Street to tie into the City’s sidewalk system. Westward expansion from Marietta Street is complicated because of topography and right-of-way but eastward expansion of the greenway, towards Daniel Stowe Botanical Gardens will likely happen as development occurs in the area.
Also of concern to the City of Gastonia and Gaston County is their role in the realization of the Carolina Thread Trail (also known as “The Thread”). As envisioned, the Carolina Thread Trail is a “green interstate system” of major trails and conservation lands connecting 15 counties and over 2.3 million people. Facilities in the City of Gastonia and Gaston County that are part of The Thread are the Catawba Creek Greenway, Highland Rail Trail, Riverside Greenway, and Spencer Mountain/McAden Blueway. Additionally, The Thread seeks to link attractions in the region, including Belmont Abbey College, Crowders Mountain State Park, and Daniel Stowe Botanical Garden.
2.4 Access to Transit Gastonia Transit, the City’s bus service, operates seven transit routes (see Figure 2-6) with six buses running on a “pulse” schedule in which all buses regularly converge at Bradley Station
simultaneously to facilitate easy transfers between routes. Transit service runs Monday through Saturday and coverage is provided to the majority of the transit-dependent population; however, there is little coverage in other areas, such as the southeastern part of the City. Bus stops are marked with unique Gastonia Transit signs and all buses are wheelchair accessible.
Pedestrian access to bus stops varies by route, and generally speaking is better on higher ridership routes. Typically, it is assumed that a quarter-mile is the distance pedestrians are willing to travel to reach a bus stop. Though not a perfect measure, the ratio of sidewalk length to roadway length within a quarter-mile of a transit route is helpful in understanding the current state of pedestrian access to transit. A ratio closer to 2.00 would indicate that sidewalk is almost always provided on both sides of the street within a quarter-mile of a route while anything significantly under 1.00 indicates that there are sidewalk gaps within a quarter-mile of a route.
Gastonia Transit Bus on Garrison Boulevard

Gastonia Comprehensive Pedestrian Plan 2 Existing Context and Pedestrian Issues
29
Figu
re 2
-5: P
ropo
sed
Syst
em o
f Pub
lic G
reen
way
s an
d T
rails

Gastonia Comprehensive Pedestrian Plan Final Report
30
Table 2-6 shows these “pedestrian access” ratios and the average weekday ridership figures in 2013 for the different Gastonia Transit routes. The #2 South New Hope and #3 South Marietta routes are combined because these routes are served by one bus and the ridership data cannot be disaggregated. As can be seen, all routes have a ratio under 1.00, indicating that sidewalk gaps do exist throughout the network. The City of Gastonia does not currently inventory its bus shelters, but most of the high volume bus stops have covered bus shelters with seating.
Table 2-6: Transit Ridership and Pedestrian Access Ratio by Route
ROUTE
AVG. 2013 WEEKDAY RIDERSHIP
SIDEWALK TO ROADWAY
LENGTH RATIO*
#1 Franklin Boulevard 216 0.74
#5 Edgewood 175 0.67
#4 South York 166 0.58
#2 South New Hope & 177 0.47
#3 South Marietta
#8 Hospital 159 0.43
*Excludes limited-access freeways
2.5 Potential Trip Generators Potential pedestrian generators were identified and incorporated into a land-use based map as presented in Figure 2-7. This information was incorporated into the prioritization methodology that is presented in Chapter 4 of the Plan.
As the political center and largest city of Gaston County, Gastonia is home to many social and cultural services which are pedestrian generators. However, unlike some small cities, these services are dispersed throughout the City. While political and administrative facilities, such as City Hall and the County Courthouse, are still located downtown, other facilities, such as the Gaston County Health Department, the Main Branch of the Gaston County Library, the Schiele Museum, and the CaroMont Regional Medical Center are located in other parts of the City. At the same time, regional-scale commercial developments have increasingly located east of downtown along Franklin Boulevard. Today, the area between Eastridge Mall and Franklin Square serves as a secondary central business district, including regional-scale shopping, hotels, and medical facilities.
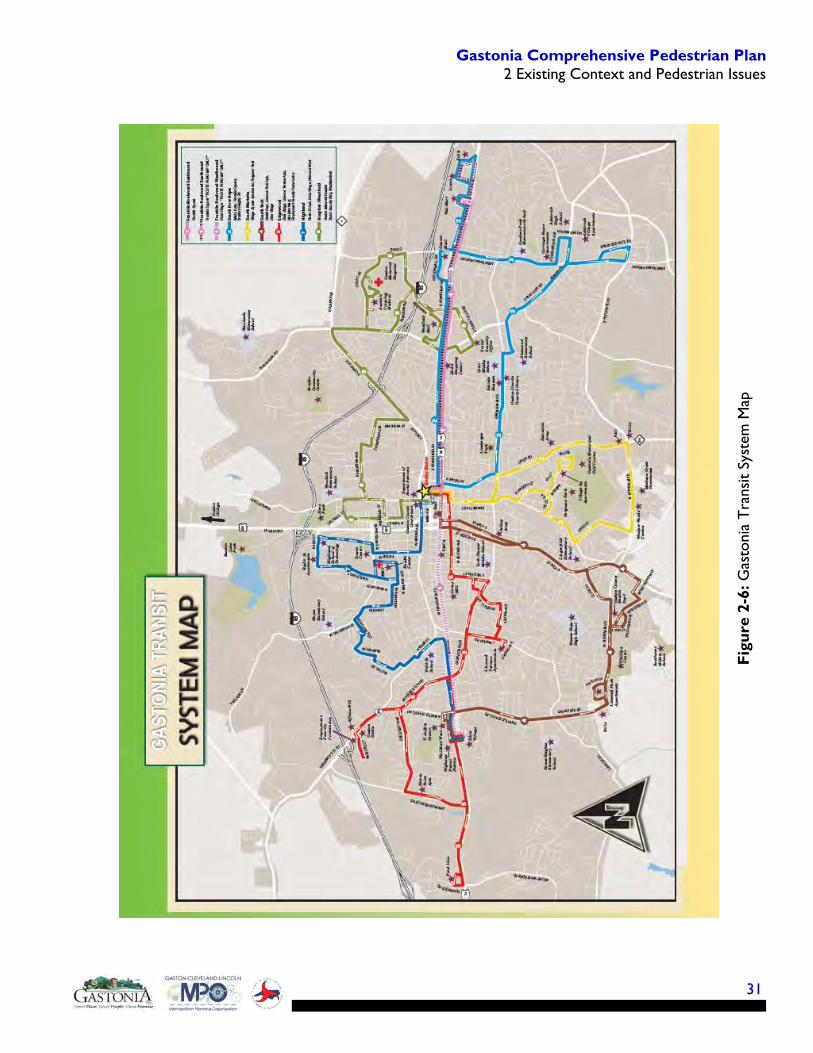
Gastonia Comprehensive Pedestrian Plan 2 Existing Context and Pedestrian Issues
31
Figu
re 2
-6: G
asto
nia
Tran
sit S
yste
m M
ap

Gastonia Comprehensive Pedestrian Plan Final Report
32
Downtown is home to many pedestrian generators and has a good network of sidewalks and pedestrian signals at intersections. In addition to City Hall and the Gaston County Administrative building, there is also the Bradley Station terminal for Gastonia Transit buses. The Salvation Army and other social services are also located downtown and attract many pedestrians. Just north of the Downtown Historic District are the Gaston County Courthouse and Gaston County Human Services Center. While below-grade railroad tracks separate these two major pedestrian generators from the rest of downtown, these facilities are well connected by wide sidewalks and pedestrian signals. The Marietta Street Bridge, the main bridge between these facilities and downtown, was recently redesigned to be more pedestrian friendly.
The Gaston County Health Department is another generator, especially when its surrounding uses, including public housing, two schools, a park, and a grocery-anchored strip mall, are considered. This cluster of pedestrian activity is located in the southwestern part of the City on Hudson Boulevard. Many residents arrive here by public transit, and while there are sidewalks on the main streets, sidewalk is still missing in some areas. Pedestrian signals are present at the intersection of Hudson Boulevard and Lynhaven Drive/Lyon Street, where most pedestrians cross the 4-lane divided Hudson Boulevard.
The Schiele Museum and Main Branch of the Gaston County Library are located across the street from each other on Garrison Boulevard southeast of Downtown. Also nearby are Grier Middle School and a mix of offices and retail. The internal sidewalk networks for these pedestrian generators are good and there is sidewalk along Garrison Boulevard for most of the immediate area. There is also pedestrian signalization at the intersection of Garrison Boulevard and Churchill Drive; however, there is currently no sidewalk down Churchill Drive or other streets that lead into the relatively dense residential areas behind these pedestrian generators.
Some recreation facilities, such as Erwin Center, Bradley Center, Lineberger Park, Martha Rivers Park, and the City’s greenway system are also major pedestrian generators in the warmer months. These facilities are scattered throughout the City and most have been integrated into the surrounding sidewalk network. In many cases, recreational facilities at schools are also open to the public after school hours.
Schools themselves are another type of pedestrian generator, especially those located in the more urbanized areas. The City has historically made many efforts to better connect schools to their surrounding neighborhoods, often through the Safe Routes to School program. While this has resulted in many improvements, including sidewalks, trails, and pedestrian signals, there are still some elementary and middle schools that lack adequate sidewalk facilities, particularly in areas more recently annexed by the City.
Sherwood Elementary School Students

Gastonia Comprehensive Pedestrian Plan 2 Existing Context and Pedestrian Issues
33
Commercial areas in general were recognized as high pedestrian generators, as illustrated in Figure 2-6. These ranged from large shopping centers, such as the Walmart and Dixie Village on West Franklin Boulevard, to convenience stores that attract many pedestrians from surrounding neighborhoods. Most shopping centers have adequate internal sidewalk systems but lack sidewalk on the frontage street, thus missing a critical connection to surrounding neighborhoods and bus stops. Convenience stores are often well integrated into the sidewalk network but have a considerable amount of curb cuts and high-traffic roadways along their frontage, which can be intimidating and unsafe for pedestrians.
As with commercial areas, high-density residential areas were also recognized as major pedestrian generators. In addition to a higher concentration of residents, those living in high density residential areas tend to have lower rates of vehicle ownership and are more likely to walk places. As with shopping centers, many apartment complexes have good internal sidewalk connectivity but lack adequate connectivity to surrounding properties. In fact, many newer apartment complexes are gated and restrict pedestrian access to one or two locations.
2.6 Pedestrian Crashes A pedestrian crash map was also developed (see Figure 2-8), which captures all police reported crashes involving pedestrians in Gastonia for the years 2007 to 2011. The map also highlights the severity of injury to the pedestrians. At the first public meeting, participants were asked to review the map and assist in the process of identifying locations where pedestrian crash clusters appeared to exist.
From the map, the following can be understood:
• Three of the five fatal injuries from 2007-2011 occurred along Franklin Boulevard and the other two were in residential areas.
• Crashes appear more prevalent along commercial corridors where wider roads and higher traffic speeds are common, such as Franklin Boulevard, Cox Road, and New Hope Road.
• The majority of neighborhood crashes resulted in “possible injury,” indicating slower speeds and less severe crashes.
• Most crashes are within close proximity to intersecting streets where greater potential for vehicular and pedestrian conflicts exist.
Gastonia Comprehensive Pedestrian Plan Final Report
34
page intentionally left blank

Gastonia Comprehensive Pedestrian Plan 2 Existing Context and Pedestrian Issues
35
Figure 2-7: Potential Trip Generators

Gastonia Comprehensive Pedestrian Plan Final Report
36
Figure 2-8: Pedestrian Crashes (2007-2011)

Gastonia Comprehensive Pedestrian Plan 2 Existing Context and Pedestrian Issues
37
Table 2-7 presents types of crashes and associated numeric data. This data was obtained using the online North Carolina Pedestrian and Bicycle Crash Data Tool provided by NCDOT’s Division of Bicycle and Pedestrian Transportation. This tool allows the user to access an online database of police reported bicycle and pedestrian crashes.12
Table 2-7: Pedestrian Crashes (2007-2011)
CRASH SEVERITY
YEAR
TOTAL 2007 2008 2009 2010 2011
Fatal Injury 2 0 1 0 2 5
Disabling Injury 5 4 2 0 1 12
Evident Injury 19 12 9 11 13 65
Possible Injury 24 21 21 24 22 110
Unknown Injury 5 1 2 1 5 4
No Injury 1 0 3 3 1 19
Total 56 38 38 39 44 215
Source: North Carolina Pedestrian and Bicycle Crash Data Tool (http://www.pedbikeinfo.org/pbcat_nc/index.cfm)
2.7 Planning Context A number of planning documents have been developed at the local, regional, and state levels in recent years that have applicability to or influence on the Gastonia Comprehensive Pedestrian Plan. Content was reviewed to gain understanding of previous recommendations and determine methods for building on previous efforts. Documents that were reviewed are listed below and portions of each document that have bearing on pedestrian travel in Gastonia are summarized in Appendix B.
• Keep It Movin’ Gaston: Gaston-Cleveland-Lincoln MPO 2035 Long Range Transportation Plan
• Downtown Streetscape & Public Realm Plan
• Franklin Boulevard Corridor Master Plan
12 http://www.pedbikeinfo.org/pbcat_nc/index.cfm

Gastonia Comprehensive Pedestrian Plan Final Report
38
• Gastonia 2025 Comprehensive Plan
• Vision for a Healthy Community: Parks and Recreation Long Range Plan
• Franklin/Myrtle School Small Area Plan
• Highland Master Plan
• Downtown to Lineberger Pedestrian and Bicycle Connection
• Creating Opportunities for Active Living, North Carolina Department of Health and Human Services (NC DHHS) Grant-Supported Effort
• NCDOT Complete Streets Planning and Design Guidelines
• WalkBike NC
2.8 Pedestrian Issues Steering Committee engagement, walking and van tours, public input, review of the existing context, and field analysis revealed a number of concerns regarding pedestrian conditions in Gastonia. These issues are listed at right. Recommendations presented in Chapter 4 of the Plan seek to alleviate or completely remedy these issues.
Pedestrian Issues • Too many curb cuts and driveways
• Excess underutilized pavement
• Overbuilt roads
• High speed traffic
• Americans with Disabilities (ADA) issues
• Not enough time for pedestrians to cross large arterial roads
• Sidewalks in poor condition
• Lack of buffers between the sidewalk and the road
• Large arterial roads with a sidewalk on only one side
• Bridges with narrow or missing sidewalks
• Deteriorated crosswalks
• Pedestrian median islands that don’t provide a physical separation from traffic
• Intersections without four crosswalks
• Gaps in the pedestrian network that inhibit connectivity
• Of the existing and planned greenways, it’s unclear which ones serve (or could serve) a pedestrian transportation purpose
• Pedestrian access to transit is limited by a lack of surrounding sidewalks and amenities such as benches and shelters, as well as difficult crossing conditions
• Pedestrian safety in parking lots
• Poor lighting conditions
• Pedestrians jaywalking and/or crossing at unmarked mid-block locations
• Limited sight distance
• No sidewalks at all on some collector streets West Franklin Boulevard
near Myrtle School Road

Gastonia Comprehensive Pedestrian Plan 3 Programs, Policies, and Design Standards
39
3 Programs, Policies, and Design Standards
Programs, policies, and design standards affecting pedestrian travel in the City of Gastonia were reviewed. Recommendations for revisions and additions have been made and are presented in this chapter of the Plan.
3.1 Programs and Policies
Existing Programs and Policies The City of Gastonia has several existing programs regarding pedestrians. As previously mentioned, the Engineering Department maintains a database of sidewalk requests from citizens along with sidewalks identified in previous planning efforts. Cost estimates are developed for these sidewalk projects and other attributes are noted, such as the presence of a worn path or proximity to schools and parks. These sidewalk projects are constantly evaluated as funding becomes available. The City also has a more formal Sidewalk Request Petition program whereby the City installs new concrete sidewalk by request, in the form of a petition, from the majority street’s property owners that own a majority of the street frontage. City Engineering staff will assist in determining the most feasible limits of the project, design the project, and bid and administer the construction of the curb and gutter or sidewalk. All property owners that are benefited by the project will be assessed an amount, based on street frontage, sufficient to cover 100 percent of the total cost of the project.
The City also occasionally issues bonds for infrastructure, including pedestrian infrastructure like sidewalks. The most recent municipal bonds, approved in 2010, have resulted in the installation of sidewalks along many collector and arterial roads in the City.
Policies and programs complement and support physical improvements and ongoing maintenance to the pedestrian network.
Franklin Boulevard at Linwood Road

Gastonia Comprehensive Pedestrian Plan Final Report
40
Gastonia Transit and the Department of Public Works and Utilities have less formal, annual programs that address deficiencies in the City’s pedestrian system. Each year, Gastonia Transit addresses the lack of bus shelters by installing, on average, two shelters a year at high volume bus stops. Similarly, each year, the Department of Public Works and Utilities dedicates a certain amount of funding to installing, repairing, and replacing ADA-compliant sidewalk ramps.
A number of state and federal policies also exist that directly pertain to pedestrian safety and accommodations:
• North Carolina Complete Streets Policy http://www.completestreetsnc.org/
• NCDOT Pedestrian Policy Guidelines http://www.ncdot.gov/bikeped/download/bikeped_Ped_Policy.pdf
• NCDOT Greenway Policy http://www.ncdot.gov/_templates/download/external.html?pdf=http%3A//www.ncdot.gov/bikeped/download/bikeped_laws_Greenway_Admin_Action.pdf
• NCDOT Board of Transportation Resolution for Bicycling and Walking http://www.ncdot.gov/bikeped/download/bikeped_laws_BOT_Mainstreaming_Resolution.pdf
• NCDOT Bridge Policy https://connect.ncdot.gov/projects/Roadway/RoadwayDesignAdministrativeDocuments/Bridge%20Policy.pdf
• United States Department of Transportation Policy Statement on Bicycle and Pedestrian Accommodation Regulations and Recommendations (March 2010) http://www.fhwa.dot.gov/environment/bikeped/policy_accom.htm
Recommended Programs and Policies Members of the Steering Committee were active in determining the most appropriate programs and policies for the Plan. Potential education, encouragement, enforcement, and maintenance policies and programs were provided to the Steering Committee for review and comment. Steering Committee members provided feedback on the most appropriate programs and policies as well as direct comments on appropriate applications to the City of Gastonia. The final set of programs and policies is the result of an interactive process and is informed by best practices in other cities.
Recommended programs and policies are presented in Table 3-1 and Table 3-2. In addition to these, the North Carolina Statewide Pedestrian and Bicycle Plan identifies a number of programs the City of Gastonia may want to consider.13
13 http://www.ncdot.gov/bikeped/download/WalkBikeNCPlanChapterslowres.pdf

Gastonia Comprehensive Pedestrian Plan 3 Programs, Policies, and Design Standards
41
Table 3-1: Recommended Education, Encouragement, Enforcement Programs and Policies
PROGRAM/POLICY DESCRIPTION
Update/Maintain Existing GIS Sidewalk Inventory
• Maintaining the City’s GIS-based sidewalk inventory is an important tool for tracking the location of existing sidewalks.
• Updating the inventory to include curb ramps and condition information would make the dataset useful for asset management.
Web/Mobile Reporting App
• Provide a web/mobile app that allows citizens to report non-emergency physical and infrastructure issues.
• This would include any issues that impact pedestrian safety, access, and comfort.
• Interdepartmental communication would increase the effectiveness of such a system (e.g., police and engineering).
• Marketing would be needed to make the public aware of the reporting app.
“Near Miss” Reporting System
• A near miss reporting system would allow travelers to identify locations and operations that may create a safety risk before an incident occurs.
• This can be used as a complement to a web/mobile reporting app – evaluation of maintenance needs and involvement of police and engineering departments.
• Coupling and comparing actual crash data with near miss locations would assist in determining accident-prone areas.
• Marketing would be needed to make the public aware of the reporting system.
Pedestrian Counts
• Regular pedestrian counts are a means of measuring the effect of physical, operational, and programmatic changes on walking rates.
• Existing pedestrian counts demonstrate areas of demand and can be used to help support investment in pedestrian network improvements.
• Conducting pedestrian counts in the years following network investments can assist in demonstrating the impact improvements have on increasing pedestrian travel.
• The City should coordinate with NCDOT’s emerging pedestrian and bicycle count program.
Staff Training • Establish a program to train City staff whose jobs affect pedestrian safety (i.e., planning, engineering, parks and recreation,
police department, etc.). “Watch For Me NC” training materials could be utilized (http://www.watchformenc.org/).
• Such training will not only educate staff on pedestrian issues and concerns but will assist in implementation of the Plan.
Walking Encouragement
• Walking route maps are an encouragement strategy for getting more people walking while indicating the most comfortable and safe routes that link residents to key destinations and areas of interest.
• As part of walking route maps, including distance and terrain information will allow user to select the most appropriate routes for their skill level.
• Organized neighborhood and company walking and running groups can be a popular way for people to get exercise and build social networks.
Media Collaboration
• Work with local print and television media to develop a series of educational pieces that address both safe driving and walking behaviors; these pieces could also cover the rules applicable to all users of public roadways and should be in compliance with North Carolina law (http://www.ncdot.gov/bikeped/lawspolicies/).
• The Government Access Channel (cable channel 16) could be an excellent format for providing instruction on appropriate walking and driving behaviors. Utilizing “Watch For Me NC” materials could be an easy starting point for public service announcement content (http://www.watchformenc.org/).
• Evaluate media methods for reaching those without access to newspaper and cable television.
Child Pedestrian Safety Curriculum
• Collaborate with Gaston County Schools to implement the National Highway Traffic Safety Administration (NHTSA) Child Pedestrian Safety Curriculum, which teaches and encourages pedestrian safety for students grades Kindergarten through 5th Grade (http://www.nhtsa.gov/ChildPedestrianSafetyCurriculum).
• This NHTSA curriculum is organized into five lessons: walking near traffic, crossing streets, crossing intersections, parking lot safety, and school bus safety. Each lesson builds upon a previous set of skills learned.
• Another resource to consider is NCDOT’s “Let’s Go NC!, A Pedestrian and Bicycle Safety Skills Program for Healthy, Active Children” (https://connect.ncdot.gov/projects/BikePed/Pages/LetsGoNC.aspx).
Speed Limits • Consider lowering the standard speed limit (35 mph) and/or implementing targeted speed limit reductions in areas of high
pedestrian demand/potential.
• Regarding residential areas, the City already will grant a speed limit reduction if requested by residents.

Gastonia Comprehensive Pedestrian Plan Final Report
42
Table 3-2: Recommended Maintenance and Improvement Programs14
PROGRAM/POLICY DESCRIPTION
Maintenance and Repair
• Fund the maintenance of sidewalks and other pedestrian infrastructure on an ongoing basis.
• Maintaining and repairing sidewalks is a way to protect the City’s investment in the pedestrian network and can help the City’s overall walkability.
ADA Curb Ramps
• Begin a program to install and retrofit curb ramps at all intersections within the City.
• Set a per year goal.
• Ensure that new curb ramps follow Americans with Disability Act (ADA) guidance.
Crosswalks
• Establish a citywide crosswalk improvement program.
• Implement it in pilot locations, then set a per year goal.
• As part of the program, establish as a baseline default that crosswalks will be marked on all four legs of an intersection.
Pedestrian Countdown Signals
• Create a proactive pedestrian countdown signal improvement program to install pedestrian countdown signals at new locations on an ongoing basis.
• Set a per year goal.
Pedestrian Refuge • Where existing painted center medians exist in proximity to intersections, seek opportunities to construct raised medians in their place to provide pedestrian refuge.
Transit Access
• Establish a program to provide better crossing opportunities at bus stops, especially at uncontrolled mid-block locations.
• If existing crossing locations can’t be improved, consider moving the bus stop to a location where better crossing conditions can be accommodated.
• Consider implications to transit operations prior to relocating bus stops.
Midblock Crossings • Consider midblock crossing improvement opportunities along corridors where signals are currently spaced far apart.
• Improvements may include advanced warning signage and pavement markings, Rectangular Rapid Flash Beacons, and/or HAWK signals.
Street “Right Sizing”
• Evaluate opportunities to implement lane diets, road diets, curb extensions, and other reallocations to “right size” existing roads so that they function better for all modes.
• Reclaimed pavement areas can be utilized for buffers/greenstrips, sidewalk widening, bike lanes, and/or curb extensions.
• In all cases, sufficient traffic analysis should be performed to ensure functionality and appropriateness of treatments.
14 Design guidelines specific to these areas of maintenance and improvement are included in Appendix D.

Gastonia Comprehensive Pedestrian Plan 3 Programs, Policies, and Design Standards
43
3.2 Design Standards
Existing Standards and Details A review of current standards and details that apply to pedestrian related facilities in the City of Gastonia was performed. A number of details were provided by the City of Gastonia and encompass standards and typical sections from the City of Gastonia, Gaston-Cleveland-Lincoln MPO, and NCDOT. A detailed documentation of this review is included in Appendix C.
In general, existing details did not include the following best practices:
Crosswalks
o Placement and markings
Typical signage for pedestrians at intersections and midblock crossings
Bus Stops
o Placement and access
Traffic Calming
o Raised Crosswalks
o Curb Extensions
Preferred Design Standards and Policies As with policies and programs, members of the Steering Committee were active in determining preferred design standards and policies for the Plan. Potential design standards and policies were provided to the Steering Committee for review and comment. Comments were received during a Steering Committee meeting, including how such should be applied in Gastonia. Table 3-3 presents preferred design standards and policies for the City of Gastonia, which are the result of an interactive process and are informed by best practices in other cities. A library of pedestrian facility design guidelines is included in Appendix D. NCDOT specifically adheres to the American Association of State Highway and Transportation Officials (AASHTO) design guidelines and the Manual on Uniform Traffic Control Devices (MUTCD), as well their own NCDOT Complete Streets Planning and Design Guidelines, when considering pedestrian facility design.

Gastonia Comprehensive Pedestrian Plan Final Report
44
Table 3-3: Preferred Design Standards and Policies
STANDARD/POLICY DESCRIPTION
Complete Streets Policy
• Develop and adopt a recommended complete streets policy in accordance with the National Complete Streets Coalition’s 10 ideal elements of a complete streets policy, including a vision, applicability to all users and all projects, specific exceptions, connectivity of the network for all modes, design criteria, context sensitivity, performance standards, and next steps.
Design Details The following modifications or additions to current design details are recommended:
• 5-foot minimum sidewalk width on collector streets and higher; 4-foot minimum sidewalk width on residential streets provided the entire sidewalk width is maintained “free and clear” of obstruction.
• Where feasible, 5- to 6-foot minimum buffer (greenstrip) widths between road and sidewalk on collector streets and higher.
• Allow 11-foot lane widths on all streets.
• Maintenance of sidewalk slope and grade across driveways.
• Two curb ramps per intersection corner; if constrained, utilize depressed corner (i.e., don’t point pedestrians into middle of intersection); ensure that new curb ramps follow Americans with Disability Act (ADA) guidance, specifically with regard to the width and depth of the landing area provided at the top of the curb ramp.
• In addition to signage for a shared street, shared lane pavement markings should be shown and denoted in plan view where feasible.
• Placement and marking of crosswalks.
• Typical signage for pedestrians at intersections and midblock crossings.
• Encourage pedestrian countdown signals as part of all new and existing signalized intersection improvement projects.
• Placement and access of bus stops.
• Traffic calming treatments that benefit pedestrians, including raised crosswalks, curb extensions, and pedestrian refuge islands.
Signal Timing Policy • Ensure that the City’s official policy is to time all signals using the guidance for pedestrian crossing time (i.e., walking rate of travel of 3.5 feet per second) included in the latest Manual on Uniform Traffic Control Devices (MUTCD).
Unified Development Ordinance
Evaluate Gastonia Unified Development Ordinance to determine:
• Potential to amend existing access management policy (Section 9.23). In addition to frequency and spacing of driveways, this policy should address driveway design, inter-parcel connectivity, access from side streets, and right-in/right-out access strategies.
• Potential inclusion of crosswalk requirements along public roads and within private developments.
• Potential inclusion of pedestrian signal requirements along public roads and within private developments.
NCDOT Resolution • The City should adopt a resolution requesting pedestrian accommodations (i.e., sidewalks, ADA curb ramps, crosswalks, pedestrian signals at signalized intersections, etc.) be funded on all non-interstate NCDOT road and bridge projects within the municipal boundaries.

Gastonia Comprehensive Pedestrian Plan 4 Network Recommendations
45
4 Network Recommendations
This chapter presents recommendations for improving Gastonia’s pedestrian network. Best practices have been incorporated into the recommendations and strategies are intended to assist in reducing barriers to pedestrian travel by improving safety, convenience, and comfort.
4.1 Pedestrian Environment The pedestrian environment can be defined by two primary areas of activity: 1) Along the Roadway; and 2) Across the Roadway. Consideration should be given to both of these areas of activity when implementing recommended improvements and determining new improvements moving forward.
Along the Roadway Providing a quality walking experience for pedestrians along the streets and roadways in Gastonia is influenced by a variety of factors, including:
Recommendations have been formulated to reduce barriers while improving safety, convenience, and comfort.
Avon/Catawba Creeks Greenway near Fern Forest Drive at Holly Drive
South New Hope Road at Redbud Drive

Gastonia Comprehensive Pedestrian Plan Final Report
46
• Sidewalks: Sidewalks are the central component of the pedestrian network. Sidewalks and walkways should provide a continuous system of accessible paths for pedestrians.
• Buffers: A pedestrian’s safety and comfort in the roadway environment is significantly affected by the width and quality of the buffer between the sidewalk and the roadway on streets with heavy traffic volumes. Buffers such as on-street parking, street trees, bike racks, and landscaping (or greenstrips) can enhance the pedestrian experience by separating the vehicular traffic lanes from the pedestrian space on the sidewalk.
• Obstructions: Items reducing the clear width for pedestrian travel along sidewalks affect sidewalk functionality. While necessary, utility poles, signs, mailboxes, and fire hydrants should be placed outside a minimum 48-inch clear width zone on the sidewalk. Additionally, street trees, planters, café tables and retailers’ merchandise can contribute to a lively and attractive pedestrian environment, but appropriate space for these items is needed.
• Access to Transit: Sidewalk connectivity in the proximity of bus stops provides access to these stops for all riders, especially important to older residents and those with disabilities. Further, the provision of benches, shelters, and other amenities improve pedestrian comfort and safety while also increasing transit ridership.
• Vehicular intrusions: Sidewalks are often interrupted by driveways, introducing conflict zones into the sidewalk. Illegal sidewalk parking can force walkers into the street.
• Bridges: Bridges can serve as either connections or barriers in the pedestrian network.
• Access to Trails: There are currently over 8 miles of multi-use trails in Gastonia, with another 60 miles planned. Pedestrian access to trails is predominantly provided via street crossings and at trailhead locations.
Lowell Bethesda Road south of Gaston Road

Gastonia Comprehensive Pedestrian Plan 4 Network Recommendations
47
Across the Roadway In addition to providing continuous and safe facilities adjacent to roadways, safe street crossings are a critical component of an accessible and complete pedestrian network. Essential factors in determining the quality of a pedestrian’s experience crossing a roadway include intersection geometry and the character of the road. The following is an overview of intersection considerations that affect pedestrians.
• Intersection Geometry: Intersection geometry is a critical element affecting accessibility and pedestrian comfort crossing streets. Skewed intersections that result in obtuse angles (larger than 90 degrees) allow motorists to make right turns across the pedestrian travel way at higher speeds, while often interfering with pedestrians’ ability to see turning traffic.
• Crosswalks: Crosswalk markings are used to alert motorists to locations where they should expect pedestrians and to identify a designated crossing location for pedestrians. While it is preferred that crosswalks be marked, a crosswalk may be marked or unmarked since, legally, crosswalks exist at all intersections, unless specifically prohibited.
• Pavement Condition: The pavement condition of crosswalks, curb ramps, and corners also affect pedestrian safety and comfort. All pavement areas should be ADA-compliant, using PROWAG recommended standards.
• Curb Ramps: ADA-compliant curb ramps ensure the pedestrian network is accessible for all users and creates a more useful network for pedestrians traveling with strollers or carts.
West Franklin Boulevard near Dixie Village Shopping Center
Hudson Boulevard at Lynhaven Drive

Gastonia Comprehensive Pedestrian Plan Final Report
48
• Width and Number of Lanes: The wider the road that must be crossed, the longer the pedestrian is exposed to the possibility of being hit while crossing. Multiple travel lanes create the possibility of “multiple threat” crashes, where one vehicle yields but blocks the view of another vehicle that then hits the pedestrian.
• Pedestrian Crossing Islands: In locations with longer crossing distances (i.e., more than two lanes) and/or higher vehicle speeds, pedestrian crossing islands benefit pedestrians by providing a refuge. In particular, pedestrian crossing islands have been shown to increase safety for pedestrians crossing multi-lane roadways at un-signalized crossings.
• Curb Extensions: Curb extensions (or curb bumpouts) shorten the distance pedestrians must cross, while at the same time increasing their visibility to motorists. By narrowing the curb-to-curb width of a roadway, curb extensions help reduce motor vehicle speeds and improve pedestrian safety.
• Traffic Signals and Stop Signs: Traffic controls have a significant impact on a pedestrian’s experience crossing the roadway. Particularly important is the distance between controlled intersections, since few pedestrians will walk very far to reach an official crosswalk.
• Signal Timing: It is essential to provide signals that are phased and timed to allow pedestrians of all abilities to cross the roadway, including those who are typically slower (children, senior citizens, people with limited mobility). At the same time, signal delay must be minimized in order to reduce the amount of illegal and unsafe crossing that occurs when pedestrians get impatient waiting for the signal to change.
• Lighting: Pedestrians can be adversely affected by low-light conditions. In fact, two-thirds of pedestrian fatalities occur between dusk and dawn. Lighting is important at intersections and mid-block crossings, particularly in locations near transit stops.
• Signage and Striping: Signage and striping support other infrastructure and signal elements of the pedestrian’s travel across the roadway. They inform pedestrians of the
West Franklin Boulevard west of Chester Street

Gastonia Comprehensive Pedestrian Plan 4 Network Recommendations
49
crossing location and alert motorists of the presence of pedestrians. Stop bar placement is intended to create appropriate space between motor vehicles stopped at a controlled intersection and pedestrians walking in the crosswalk. Overall, signage and striping should be well-placed and conform to current MUTCD standards.
4.2 Toolbox of Effective Treatments A toolbox of effective treatments is presented in Table 4-1 to assist in planning and design of future improvements. Recommended treatments are categorized as follows:15
• Signalization treatments use traffic signals to increase the safety and comfort of pedestrians crossing the street. Example treatments include pedestrian signals, improving signal timing, and modifying signal phasing to provide a Leading Pedestrian Interval (LPI).
• Geometric treatments add or adjust existing physical features in the pedestrian network. Example treatments include installing pedestrian refuge and curb extensions.
• Signs/Markings/Operational treatments are those that do not fit within the other two categories. Example treatments include pavement markings, lighting, turn restrictions, and enforcement.
Recommended treatments in each of these categories address both “across the roadway” and “along the roadway” needs. Depending on the exact location and desired outcome, a single treatment or a combination of several may be appropriate. In all cases, careful consideration and review of travel patterns for all modes is recommended. This toolbox can be used by the City of Gastonia to program roadway improvement projects and standalone pedestrian projects, as well as influence the private development process.
15 http://safety.fhwa.dot.gov/ped_bike/tools_solve/ped_tctpepc/index.cfm

Gastonia Comprehensive Pedestrian Plan Final Report
50
page intentionally left blank

Gastonia Comprehensive Pedestrian Plan 4 Network Recommendations
51
Table 4-1: Toolbox of Effective Treatments
ISSUE DESCRIPTION INFRASTRUCTURE ELEMENTS TYPES OF RECOMMENDATIONS A
CR
OSS
TH
E R
OA
DW
AY
Inadequate or missing crossing facilities
Pedestrians are encouraged to cross the street at intersections, especially where some type of traffic control is present (i.e., stop signs or signals). Where traffic control and crosswalks are missing or in disrepair, the effectiveness of the pedestrian network is diminished. Signals and geometric treatments work in concert with signage and pavement markings at intersections to improve pedestrian safety and comfort. Mid-block crossings also require adequate crossing facilities.
Signalization • Traffic signals • Pedestrian signals • Signal timing and sequencing
Geometric • Pedestrian refuge islands • Curb extensions
Signs/Markings/Operational • Crosswalks • Lighting • Signage
Signalization • Add pedestrian signals where missing • Signalize currently uncontrolled
intersections as warranted • Install second pedestrian signal in
medians at wide crossings
Geometric • Install pedestrian refuge islands • Install curb extensions to decrease
crossing distance and slow turning vehicles
Signs/Markings/Operational • Add crosswalks or upgrade to high
visibility crosswalks to increase motorists’ awareness of crossing pedestrians and highlight desired crossing locations
• Add stop signs as warranted • Install Rapid Flash Beacon at select
locations
Insufficient time to cross intersection
Pedestrians may feel that they do not have enough time to cross at signalized intersections. The 2009 Manual on Uniform Traffic Control Devices calls for signal timing to be based on a walking rate of travel of 3.5 feet per second.
Signalization • Signal timing • Pedestrian signals
Geometric • Curb to curb distance, based on
intersection geometry • Curb extensions • Pedestrian refuge islands
Signalization • Increase the length of time a walk
signal is provided • Program a leading pedestrian interval
into the signal cycle
Geometrics • Reduce the crossing distance with curb extensions and pedestrian refuge islands • Reduce turning radii at intersections to accommodate curb extensions and
pedestrian refuge islands where possible
Wide or diagonal intersections
Regardless of the intersection size or shape, the shortest pedestrian crossing distance typically offers the safest crossing for pedestrians (i.e., reducing the likelihood of a crash with a motor vehicle).
Streets that intersect at angles other than 90° create either wide or narrow corners. Wide corners allow motorists to turn without slowing down. When making a right-hand turn, motorists must look back and over the left shoulder – a maneuver that is difficult to execute and diverts a motorist’s attention from potential pedestrians in the crossing just ahead. When making left-hand turns, motorist may also fail to observe pedestrians as they move easily through a wide turn.
Signalization • Pedestrian signals • Signal timing and sequencing Geometric • Intersection geometry • Pedestrian refuge islands
Signs/Markings/Operational • Crosswalks • Signage
Signalization • Program a leading pedestrian interval
into the signal cycle
Geometric • Create intersections with 90° angles • Install pedestrian refuge islands • Consider feasibility of a modern
roundabout
Signs/Markings/Operational • Stripe high visibility crosswalks • Narrow travel lanes to calm traffic
Complex intersections
Intersections where three or more streets come together create challenges for all modes. Many of the challenges of wide or diagonal intersections may also be present at complex intersections. Another type of complex intersection is an offset intersection.
Pedestrians may find it difficult to travel through complex intersections comfortably and safely. Pedestrians may need to cross more streets and be aware of more motor vehicles approaching from a number of different directions, especially at crossings without traffic controls that are synchronized with the whole intersection.
Signalization • Signal timing and sequencing Geometric • Intersection geometry • Number of streets to cross • Pedestrian refuge islands
Signs/Markings/Operational • Crosswalks • Turning restrictions • Signage
Signalization • If more than two phase signal, allow
pedestrians to cross on all phases where crossing is safe
• Consider separate pedestrian phase for offset intersections
Geometric • Evaluate closing approaches • Install medians to channelize traffic and
provide pedestrian refuges
Signs/Markings/Operational • Stripe high visibility crosswalks with
signage alerting motorists to the presence of pedestrians
• Change two-way streets to one-way streets to reduce confusion at intersections
• Prohibit right turn on red
Excessive auto-orientation
Excessively auto-oriented streets are any streets where the speed or volume of traffic is inappropriate for the adjacent land use(s). These streets often have 4 or more travel lanes, traffic volumes over 10,000 per day, and posted speeds of 35 mph or more. Motorists may travel at speeds greater than the posted speed limit.
In general, pedestrians crossing streets with excessive auto-orientation do not feel comfortable or safe because of the width of the crossings and the speed and volume of traffic. Motorists often fail to yield to pedestrians in crosswalks, especially when turning. Signalized intersections providing traffic control for pedestrian crossings often are too far apart, forcing pedestrians to walk excessively long distances to a protected crossing.
Signalization • Traffic signals • Pedestrian signals
Geometric • Pedestrian refuge islands • Curb extensions
Signs/Markings/Operational • Crosswalks • Turn restrictions • Cameras
Signalization • Create midblock crossings with
appropriate warnings for motorists and protections for pedestrians – may require pedestrian-activated signal
Geometric • Reduce turning radii where possible • Install pedestrian refuge islands
Signs/Markings/Operational • Stripe high visibility crosswalks with
signage alerting motorists to the presence of pedestrians
• Install enforcement cameras calibrated for pedestrian safety needs
• Prohibit right turn on red
ALO
NG
TH
E R
OA
DW
AY
Excessive auto-orientation
Streets with heavy traffic volumes, high speeds, or excessive widths are uncomfortable for pedestrians to walk along, particularly if the sidewalks are directly adjacent to the roadway instead of buffered by a planting strip, parking lane, bike lane, etc. The intrusion of frequent driveways is another problem typical of such streets, forcing pedestrians to be alert for vehicles turning across their path. Where speeds are high and driveways are wide, turning motorists are unlikely to yield to pedestrians.
Geometric • Sidewalks • Buffers • Access management
Signs/Markings/Operational • Signage • Cameras
Geometric • Widen sidewalks • Install buffers between sidewalk and travel lanes • Use traffic calming treatments • Identify appropriate opportunities for access management (i.e., reducing the number,
width, and placement of driveways)
Signs/Markings/Operational • Re-strip curb lane to allow parking, if
demand exists • Install speed cameras and/or
permanent speed feedback signs
Insufficient sidewalk capacity
Missing, undersized, or blocked sidewalks may force pedestrians to walk in the roadway, at great risk to themselves, and disrupting traffic flow.
Geometric • Sidewalk presence and
width • Transit stops
Signs/Markings/Operational • Minimum clear width walking
zone (i.e., control of encroachments)
Geometric • Resolve sidewalk gaps, especially near schools, transit stops, and park entrances • Extend the sidewalk at transit stops to provide additional space for transit rider
alighting and boarding
Signs/Markings/Operational • Maintain minimum clear width
standards through encroachment enforcement program
• Require sufficient capacity through redevelopment process

Gastonia Comprehensive Pedestrian Plan Final Report
52
page intentionally left blank

Gastonia Comprehensive Pedestrian Plan 4 Network Recommendations
53
4.3 Pedestrian Demand While all parts of the City of Gastonia would benefit from improved pedestrian facilities, it is important to understand and recognize that some areas are more attractive to pedestrian travel and some citizens are more dependent on walking as a mode of transportation. To this end, an approach for quantifying potential pedestrian demand was developed in consultation with City staff and the Steering Committee.
A GIS-based demand analysis was developed that incorporates the City’s existing demographic data to prioritize areas where more people have limited mobility, in combination with the locations of pedestrian generators such as transit stops, parks, and schools. Locational data was assigned appropriate weights based on the amount of pedestrian activity that each location would likely generate. Variables included destinations, generators, bus stops, greenways, crash locations, demographics, and recommendations from previous plans. Table 4-2 presents the variables utilized and their weighting factors.
Figure 4-1 provides a “heat map” that blends the variables presented in Table 4-2 to demonstrate potential geographic demand for pedestrian facilities. Areas that appear “hotter” (signified by orange to red colors on the map) tend to have a higher concentration of the various variables utilized, while areas appearing “cooler” (signified by green to yellow colors on the map) have lower concentrations of the same variables. While all areas of the City were considered in the final determination of recommendations, the identified hotspots became focus areas for detailed field analysis because it was understood that these areas have a higher need for pedestrian infrastructure.
Detailed analysis of hotspots was conducted by a team of planning and design professionals. In-field data collection surrounding hotspot locations was performed, including photography, observation of pedestrian behaviors, and documentation of challenges to pedestrian improvement. Additionally, recommendations were formulated in the field and have been included in the network recommendations presented in Section 4.4 of the Plan. A sampling of hotspot characteristics are provided below.
• Franklin Boulevard/Cox Road Hotspot – This area is characterized by automobile oriented suburban style shopping centers that are set back from the road with large parking lots along their frontages. A level of pedestrian infrastructure does exist within individual shopping centers, but connectivity between centers and along roadways is lacking. Roads and driveways are wide and do not have proper crosswalks, curb ramps, or pedestrian signalization, making crossing difficult. Topography, open drainage ditches, and a crossing of Duharts Creek make improvements challenging.
• Downtown Hotspot – This area is defined by traditional downtown, mixed use development; buildings are built to the lot line and create a street wall in many areas. Street cross sections range from very wide along Franklin Boulevard to quite intimate along Second Avenue. Some streets have been enhanced for pedestrian travel including Main Avenue and Marietta Street. Most intersections are not complete in their accommodating of pedestrians, missing crosswalks, curb ramps, and/or pedestrian signals. Sidewalk gaps exist throughout this area and the speed of vehicular travel is a concern.
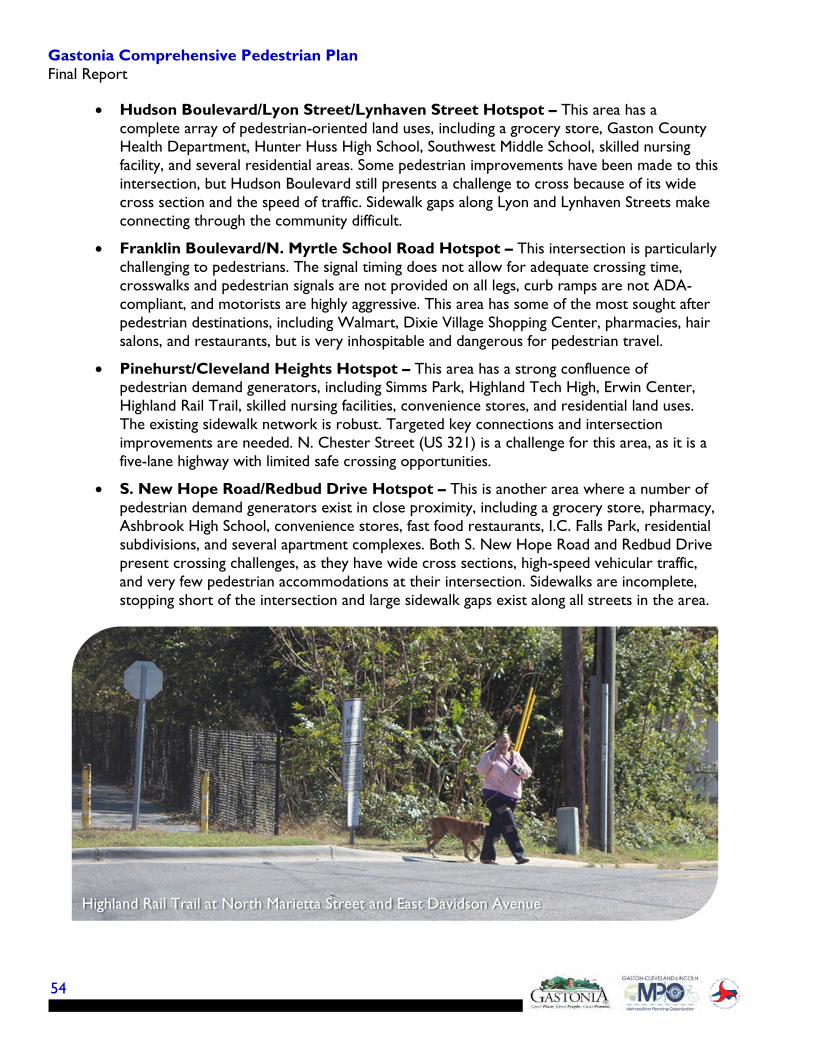
Gastonia Comprehensive Pedestrian Plan Final Report
54
• Hudson Boulevard/Lyon Street/Lynhaven Street Hotspot – This area has a complete array of pedestrian-oriented land uses, including a grocery store, Gaston County Health Department, Hunter Huss High School, Southwest Middle School, skilled nursing facility, and several residential areas. Some pedestrian improvements have been made to this intersection, but Hudson Boulevard still presents a challenge to cross because of its wide cross section and the speed of traffic. Sidewalk gaps along Lyon and Lynhaven Streets make connecting through the community difficult.
• Franklin Boulevard/N. Myrtle School Road Hotspot – This intersection is particularly challenging to pedestrians. The signal timing does not allow for adequate crossing time, crosswalks and pedestrian signals are not provided on all legs, curb ramps are not ADA-compliant, and motorists are highly aggressive. This area has some of the most sought after pedestrian destinations, including Walmart, Dixie Village Shopping Center, pharmacies, hair salons, and restaurants, but is very inhospitable and dangerous for pedestrian travel.
• Pinehurst/Cleveland Heights Hotspot – This area has a strong confluence of pedestrian demand generators, including Simms Park, Highland Tech High, Erwin Center, Highland Rail Trail, skilled nursing facilities, convenience stores, and residential land uses. The existing sidewalk network is robust. Targeted key connections and intersection improvements are needed. N. Chester Street (US 321) is a challenge for this area, as it is a five-lane highway with limited safe crossing opportunities.
• S. New Hope Road/Redbud Drive Hotspot – This is another area where a number of pedestrian demand generators exist in close proximity, including a grocery store, pharmacy, Ashbrook High School, convenience stores, fast food restaurants, I.C. Falls Park, residential subdivisions, and several apartment complexes. Both S. New Hope Road and Redbud Drive present crossing challenges, as they have wide cross sections, high-speed vehicular traffic, and very few pedestrian accommodations at their intersection. Sidewalks are incomplete, stopping short of the intersection and large sidewalk gaps exist along all streets in the area.
Highland Rail Trail at North Marietta Street and East Davidson Avenue

Gastonia Comprehensive Pedestrian Plan 4 Network Recommendations
55
Table 4-2: Pedestrian Demand Variables
FACTOR MEASURE MEASURE NOTES BUFFER/ GEOGRAPHY WEIGHT WEIGHTING
NOTES
Pedestrian Demand
Existing Land Use
High density residential, mixed use commercial, etc.
All properties within specified categories, no buffer
6.67%
-
Major Destination
Parks, social services, medical facilities, government buildings, etc.
¼ mile 6.67% -
Schools and Recreation Centers
All schools (K-12) ¼ mile 13.33% x2
Multimodal Accommodations
Bus Stops and Greenways
All bus stops and trails/greenways (existing and proposed)
¼ mile 13.33% High volume bus stops and existing greenways x2
Safety Pedestrian Crashes (2007-2011)
Crash severity incorporated into weighting
¼ mile 13.33% Fatal injury, disabling injury, and evident injury x2
Equity Limited Mobility Population
Density of households with no access to a motor vehicle
Census block group
33.33%
- Per capita income
Density of residents under 15
Density of residents over 65
Previous Plans and Studies
Franklin Boulevard Corridor Study
- Include entire corridor
13.33% Only give credit for being in one plan; Franklin Blvd. Corridor nodes x2
Loray Small Area Plan - Include entire
study area
Public Realm Design Plan - Include primary
grid downtown

Gastonia Comprehensive Pedestrian Plan Final Report
56
Figu
re 4
-1: P
edes
tria
n D
eman
d H
eat
Map

Gastonia Comprehensive Pedestrian Plan 4 Network Recommendations
57
4.4 Network Improvements Recommendations presented in this section are primarily capital improvements to the physical pedestrian network. In some instances, further study is recommended to best define future improvements. The presented recommendations were compiled from a number of sources and vetted through the Steering Committee and the general public.
Project Lists Specific improvement projects have been identified and categorized into two distinct groups:
• Spot Improvements, including intersection improvements, pedestrian bridges, and midblock crossings. Spot Improvements are presented in Table 4-3 in alphabetical order. Project location and a brief description are included for each project.
• Corridor Improvements, including sidewalks, multiuse paths, and greenways. Corridor Improvements are presented in Table 4-4 in alphabetical order. Project limits and project type are included for each project (see Appendix D for additional information).
Map IDs are included for each Spot and Corridor Improvement, corresponding to the maps that are included at the end of this chapter.
To provide a better understanding of the characteristics of the listed improvement projects several representative renderings have been prepared and are presented in Figure 4-2, Figure 4-3, and Figure 4-4 on the following pages.
Pryor Street at West Davidson Avenue near Erwin Center

Gastonia Comprehensive Pedestrian Plan Final Report
58
Figure 4-2: Rendering of Spot Improvement #52
S. New Hope Road at Redbud Drive – Existing
S. New Hope Road at Redbud Drive – Rendered improvement

Gastonia Comprehensive Pedestrian Plan 4 Network Recommendations
59
Figure 4-3: Rendering of Corridor Improvement #36
Franklin Boulevard East of Cox Road – Existing
Franklin Boulevard East of Cox Road – Rendered improvement

Gastonia Comprehensive Pedestrian Plan Final Report
60
Figure 4-4: Rendering of Corridor Improvement #70
Modena Street South of Spring Street – Existing
Modena Street South of Spring Street – Rendered improvement

Gastonia Comprehensive Pedestrian Plan 4 Network Recommendations
61
Table 4-3: Spot Improvements
MAP ID
PRIMARY LOCATION CROSSING TYPE NOTES
1 Armstrong Park Rd New Hope Rd Intersection add crosswalks, pedestrian signals, pedestrian refuge
2 Broad St Main Ave Intersection improve crossing conditions, potentially by adding a pedestrian refuge island or pedestrian signal
3 Broad St Franklin Blvd Intersection add pedestrian signals, ADA ramps, repair sidewalks, pedestrian refuge median on franklin needed, implement access management plan
4 Broad St Long Ave Intersection add pedestrian signals, ADA ramps, improve sidewalk/path interface, improve crosswalks
5 Chester St New Way Dr Intersection existing crosswalks at unsignalized intersection; add advanced warning devices (eg. rapid flash beacon)
6 Chester St/ York St Tenth Ave Intersection
pedestrian improvements with stormwater management, improve sidewalks, fill sidewalk gaps, add crosswalk with advance warning signage and pavement markings, install raise medians for refuge
7 Cox Rd Court Dr Intersection add pedestrian signals and ADA ramps
8 Cox Rd I-85 Ramps Intersection sidewalk, crosswalks, ADA ramps, pedestrian refuge, pedestrian signals
9 Davidson Ave Pryor St Intersection add crosswalks, ADA ramps, and advanced warning pavement markings
10 Franklin Blvd Myrtle School Rd Intersection add crosswalks, improve pedestrian signals, address ADA issues
11 Franklin Blvd Chestnut St Intersection add pedestrian signals, ADA ramps, high visibility crosswalks, increase signal timing for pedestrians
12 Franklin Blvd Church St Intersection add pedestrian signals, ADA ramps, high visibility crosswalks
13 Franklin Blvd Linwood Rd Intersection add pedestrian signals, add ADA ramps
14 Franklin Blvd Trenton St Study study realignment of intersection to make 4-point intersection with full complement of pedestrian facilities
15 Franklin Blvd Oakland St Intersection crosswalks, ADA ramps, pedestrian signals
16 Franklin Blvd Marietta St Intersection crosswalks, ADA ramps, pedestrian signals
17 Franklin Blvd South St Intersection intersection improvements to enhance pedestrian connectivity, including crosswalks, ADA ramps, pedestrian signals
18 Franklin Blvd York St Intersection crosswalks, ADA ramps, pedestrian signals
19 Franklin Blvd Church St Intersection crosswalks, sidewalks, ADA ramps, pedestrian signals
20 Franklin Blvd Avon St Intersection install ADA ramps, pedestrian signals, crosswalks, replace damaged sidewalks, fill gaps in sidewalk network
21 Franklin Blvd Chester St Intersection add pedestrian signals, replace sidewalks, consider raised pedestrian refuge in median, relocate signage away from sidewalk
22 Franklin Blvd Cox Rd Intersection ADA ramps, crosswalks, sidewalks, curb, gutter, pedestrian refuge, pedestrian signals
23 Franklin Blvd Second Ave Intersection
add pedestrian signals, multimodal access management plan, raise painted curb extension, improve bus stop amenities, connect to Walmart sidewalk behind guardrail
24 Franklin Blvd Firestone St Intersection consider unique crosswalk pattern or texture, perhaps throughout Franklin Blvd
25 Franklin Blvd Lineberger Rd Intersection crosswalks, sidewalks, pedestrian refuge, ADA ramps, pedestrian signals
26 Franklin Blvd Franklin Commons Intersection crosswalks, sidewalks, pedestrian refuge, ADA ramps, pedestrian signals
27 Franklin Blvd Edgewood Rd Intersection crosswalk, center median refuge, and pedestrian signals crossing east side of intersection
28 Franklin Blvd Vance St Intersection crosswalks, ADA ramps, pedestrian signals
29 Franklin Blvd New Hope Rd Intersection crosswalks, pedestrian refuge, ADA ramps, pedestrian signals
30 Franklin Blvd Durharts Creek Bridge pedestrian bridge over Durhart Creek on north side of road
31 Franklin Blvd
between Belvedere Ave and Beverly Dr Crossing
explore midblock crossing and other pedestrian improvements, including crosswalk, pedestrian refuge, ADA ramps, RRFB

Gastonia Comprehensive Pedestrian Plan Final Report
62
MAP ID
PRIMARY LOCATION CROSSING TYPE NOTES
32 Garrison Blvd Churchill Dr Study study retiming signals to provide more pedestrian crossing time
33 Garrison Blvd Chestnut St Intersection crosswalks, ADA ramps, pedestrian signals
34 Garrison Blvd Chester St Intersection improve pedestrian signals, consider pedestrian refuge in median
35 Garrison Blvd Trenton St Intersection crosswalks, sidewalks, pedestrian refuge, ADA ramps, pedestrian signals
36 Garrison Blvd Vance St Intersection improvements at non-signalized intersection, including crosswalks, sidewalks, ADA ramps, RRFB
37 Gaston Day School Rd
Bradford Heights Rd Crossing explore midblock crossing, including crosswalk, ADA ramps, RRFB
38 Hudson Blvd Robinwood Rd Intersection realign/remark crosswalks, add pedestrian signals
39 Hudson Blvd Lyon St / Lynhaven Dr Intersection
fill sidewalk gaps, complete ADA improvements, add to existing crosswalks, add to existing pedestrian signals
40 Hudson Blvd Davis Park Rd Intersection add pedestrian signals, add crosswalks, add ADA ramps, provide refuge in raised median
41 Hudson Blvd Fuller Dr Intersection crosswalks, ADA ramps, RRFB
42 Hudson Blvd York St Intersection add sidewalks, add pedestrian signals, address ADA issues, consider pedestrian refuge islands to shorten crossing distance
43 Hudson Blvd Union Rd Intersection evaluate feasibility to right-size intersection, provide refuge, add high visibility crosswalks on all sides, add pedestrian signals
44 Hudson Blvd Hoffman Rd Intersection crosswalks, pedestrian refuge, ADA ramps, pedestrian signal
45 Hudson Blvd/Titman Rd New Hope Rd Intersection crosswalks, ADA ramps, pedestrian signals, pedestrian refuge
46 Lineberger Park Highland Rail Trail Study feasibility study to connect Lineberger Park to Highland Rail Trail
47 Long Ave/Ozark Ave Modena St Intersection
add pedestrian signals, ADA ramps to existing island, advance warning in slip lane to calm traffic, consider separate pedestrian signal phase
48 Marietta St Gaston County Courthouse Crossing
additional midblock crossing near E Page Ave, implement full advanced warning package at all existing midblock crossings
49 Modena St Rhyne St Intersection reconfigure intersection and remove excess pavement to calm traffic
50 Modena St Modena St Ext Intersection reconfigure intersection and remove excess pavement to calm traffic
51 New Hope Modena/Montrose Intersection complete crosswalks, add pedestrian signal
52 New Hope Rd Redbud Dr Intersection add crosswalks, pedestrian signals, connect sidewalks to intersection, add ADA ramps
53 New Hope Rd I-85 Ramps Intersection crosswalks, sidewalks, ADA ramps, pedestrian refuge, pedestrian signals
54 Radio St Barkley St Intersection crosswalks, ADA ramps
55 Remount Rd Aberdeen BLvd Intesection crosswalks, pedestrian refuge, ADA ramps, pedestrian signals
56 Second Ave Marietta St Intersection add pedestrian signals, add ADA ramps
57 Second Ave Avon St Intersection add sidewalks, repair damaged sidewalks, install ADA ramps, consider crosswalks
58 Second Ave South St Study study feasibility of full reconstruction of intersection and approaches with complete package of pedestrian improvements
59 Second Ave York St Intersection add pedestrian signals
60 Second Ave Chester St Intersection add pedestrian signals, ADA ramps, curb extensions
61 Union Rd Robinwood Rd Intersection add crosswalks, add pedestrian signals, fill sidewalk gaps, consider pedestrian refuge islands, address ADA issues
62 US 321 Jackson Rd/Dale Ave Intersection crosswalks, ADA ramps, pedestrian signals

Gastonia Comprehensive Pedestrian Plan 4 Network Recommendations
63
Table 4-4: Corridor Improvements
MAP ID LOCATION FROM TO LENGTH
IN FEET TYPE
1 Aberdeen Blvd New Hope Rd I-85 3,698 Greenway
2 Aberdeen Blvd I-85 Remount Rd 876 Sidewalk Construction
3 Aberdeen Blvd Remount Rd Cox Rd 2,169 Sidewalk Construction
4 Adams Dr Spencer Ave Miller St 948 Sidewalk Construction
5 Archie Whiteside Dr Food Lion Grocery Store Selwyn Cir 1,503 Sidewalk Construction
6 Armstrong Park Rd Franklin Blvd Hudson Blvd 10,003 Study
7 Athenian Dr Hillcrest Ave W Garrison Blvd 2,249 Sidewalk Construction
8 Bradley Ave York St Cemetery 1,299 Sidewalk Construction
9 Bradley Center Driveway Modena St; Farewell Dr Bradley Center Parking Lot 1,136 Sidewalk Construction
10 Broad St Franklin Blvd 4th Ave 1,710 Bike and Pedestrian Improvements
11 Broad St Woodhill Dr Boxwood Ln 1,118 Sidewalk Construction
12 Catawba Creek Greenway Extension Ferguson Park Marietta Street 2,717 Greenway
13
Catawba Creek Greenway Southeast Extension (Phase I) Southeast Armory Robinwood Rd 8,532 Greenway
14
Catawba Creek Greenway Southeast Extension (Phase II) Gaston Day School Rd Timberwood Dr 7,620 Greenway
15 Chestnut St 4th Ave Garrison Blvd 966 Sidewalk Construction
16 Churchill Dr Garrison Blvd Buckingham Ave 4,668 Sidewalk Construction
17 Connection to Bradley Center N. New Hope Rd Bradley Center 4,836 Greenway
18 Clay St Second Ave Franklin Blvd 720 Sidewalk Construction
19 Cox Rd I-85 Court Dr 2,609 Sidewalk Construction
20 Cox Rd I-85 Franklin Blvd 1,707 Sidewalk Construction
21 Craig Ave Poston Cir Thomas St 1,513 Sidewalk Construction
22 Davidson Ave Chester St Falls St 1,151 Sidewalk Construction
23 Davidson Ave Marietta St Hanover St 837 Sidewalk Construction
24 Davidson Ave Broad St Avon St 2,059 Sidewalk Construction
25 Davis Park Rd Hudson Blvd Richland Ave 1,137 Sidewalk Construction
26 E Hudson Blvd York Rd Union Rd 7,370 Sidewalk Construction
27 E Second Ave S Chestnut St S Marietta St 3,503 Bike and Pedestrian Improvements
28 Eddie St Dixon Rd Dead End 866 Sidewalk Construction
29 Edgewood Rd Food Lion Grocery Store Oates Rd 2,988 Sidewalk Construction
30 Elm St Tenth Ave Adams Dr 251 Sidewalk Construction
31 Ferguson Park Greenway Connector Existing Greenway Ruby Ave 823
Greenway and Sidewalk Construction
32 Fern Forest Drive Garrison Blvd Hudson Blvd 723 Greenway Connection

Gastonia Comprehensive Pedestrian Plan Final Report
64
MAP ID LOCATION FROM TO LENGTH
IN FEET TYPE
33 Fourth Ave Vance St Fifth Ave 177 Sidewalk Construction
34 Franklin Blvd Broad St Avon St 1,475 General Pedestrian Improvements
35 Franklin Blvd Cox Rd East Club Rd 2,015 Sidewalk Construction
36 Franklin Blvd Cox Rd City Limits 5,461 Sidewalk Construction
37 Gardner Park Dr; Pamela St
Downey Pl; Gardner Park Dr Pamela St; Redbud Dr 6,520 Sidewalk Construction
38 Garrison Blvd Marietta St Chestnut St 3,526 Sidewalk Construction
39 Garrison Blvd New Hope Rd Burtonwood Dr 1,687 Sidewalk Construction
40 Gaston Day School Rd Kendrick Rd Hoffman Rd 3,745 Sidewalk Construction
41 Gaston Day School Rd Lincoln Lane Kendrick Rd 6,287 Sidewalk Construction
42 Green Dr Franklin Blvd East Club Circle 809 Sidewalk Construction
43 Greenway Connector Highland Rail Trail US 321 117 Greenway
44 Greenway Connector Highland Rail Trail Cemetery 69 Greenway
45 Henderson St Lyon St Southside Ave 1,042 Sidewalk Construction
46 Henderson St McArver St Gail Ave 186 Sidewalk Construction
47 Highland Branch Greenway Rankin Lake Park Bulb Ave 5,631 Greenway
48 Highland St Davidson Ave Church Property 1,042 Sidewalk Construction
49 Hillcrest Ave Miller St Athenian Dr 1,187 Sidewalk Construction
50 Hillwood Dr Hargrove Ave Dead End 1,699 Sidewalk Construction
51 Holly Dr Timberlane St Greenway Access 1,052 Sidewalk Construction
52 Home Trail Weldon St Hillcrest Ave 562 Sidewalk Construction
53 Hudson Blvd Robinwood Rd Churchill Dr 2,180 Sidewalk Construction
54 Hudson Blvd Armstrong Park Rd Redbud Dr 2,567 Sidewalk Construction
55 Hudson Blvd Windsor Woods Dr Existing sidewalk at 951 E Hudson Blvd 2,692 Sidewalk Construction
56 Hudson Blvd E Davis Park Dr York Rd 8,052 Sidewalk Construction
57 Independence Way Redbud Dr Londonderry Dr 257 Sidewalk Construction
58 Jackson Rd York Rd Nineteenth Ave 3,546 Sidewalk Construction
59 Jackson St W Eighth Ave W Tenth Ave 682 Sidewalk Construction
60 Kendrick Rd Robinwood Rd East City Limits 13,519 Sidewalk Construction
61 Laurel Ln Castlegate St Robinwood Rd 1,550 Sidewalk Construction
62 Laurel Ln Churchill Dr Timberlane St 1,498 Sidewalk Construction
63 Linwood Rd Garrison Blvd Spencer Ave 1,657 Multiuse Path
64 Linwood Rd East Dr Cloninger Ave 357 Sidewalk Construction
65 Londonderry Dr Jefferson Ave Independence Way 1,377 Sidewalk Construction
66 Loray Greenway Connector Linwood US 321 7,910
Greenway and Sidewalk Construction
67 Lyon St Hudson Blvd 2065 Lyon St Frontage 559 Sidewalk Construction
68 May Ave Webb St Scruggs St 1,930 Sidewalk Construction
69 McArver St Mountainview St Henderson St 537 Sidewalk Construction
70 Modena St Park Ave Spring St 2,912 Sidewalk Construction

Gastonia Comprehensive Pedestrian Plan 4 Network Recommendations
65
MAP ID LOCATION FROM TO LENGTH
IN FEET TYPE
71 Modena St Rhyne St Bradley Center Driveway 1,634 Sidewalk Construction
72 Modena St New Hope Rd Modena St Ext 2,102 Sidewalk Construction
73 Modena St Modena Ext Rhyne St 1,511 Sidewalk Construction
74 Montrose Dr N New Hope Rd Rhyne Carter Rd 1,611 Sidewalk Construction
75 Morris St Doffin Ln Radio St 723 Sidewalk Construction
76 Mountain View St McArver St S York St 1,495 Sidewalk Construction
77 N Oakwood St Hillwood Dr Davidson Ave 1,744 Sidewalk Construction
78 New Greenway Linwood Rd Sherman St 2,297 Greenway
79 New Hope Rd Franklin Blvd Ozark Ave 6,756 Sidewalk Construction
80 New Hope Rd Burtonwood Dr Franklin Blvd 688 Sidewalk Construction
81 New Hope Rd Redbud Dr Hudson Blvd/Titman Rd 2,412 Sidewalk Construction
82 New Hope Rd Armstrong Park Rd Redbud Dr 3,508 Sidewalk Construction
83 New Hope Rd Lee St Armstrong Park Rd 1,993 Sidewalk Construction
84 New Way Dr Morris St US 321 543 Sidewalk Construction
85 Norment Ave Pryor St Morris St 532 Sidewalk Construction
86 Old Redbud Dr Redbud Dr Franklin Blvd 1,527 Sidewalk Construction
87 Osceola St Eight Ave Existing Sidewalk North of Oxford Ave 627 Sidewalk Construction
88 Osceola St Marietta St Oxford Ave 3,276 Sidewalk Construction
89 Park Ln Edgefield Ave Nineteenth Ave 1,728 Sidewalk Construction
90 Pryor St Davidson Ave Norment Ave 551 Sidewalk Construction
91 Pryor St Pryor St Sycamore Ave 1,339 Greenway
92
Ramblewood Ln; Sherwood Cir; Pineridge Ln
Pineridge Ln; Forestbrook Dr; Ramblewood Ln
North Dead End; Ramblewood Ln; Union Rd 3,110 Sidewalk Construction
93 Rankin Ave Boyce St Chester St 289 Sidewalk Construction
94 Rankin Ave Pryor St Highland St 626 Sidewalk Construction
95 Ransom St Greenway Connector Ransom St Hillwood Dr 1,335 Greenway
96 Redbud Dr Hudson Blvd New Hope Rd 2,632 Sidewalk Construction
97 Remount Rd New Hope Rd Aberdeen Rd 2,943 Sidewalk Construction
98 Robinwood Rd Hudson Blvd Catawba Creek Greenway 1,013 Sidewalk Construction
99 Ruby Ave Johnston St York St 2,665 Sidewalk Construction
100 S Chestnut St Lineberger Park E Second Ave 1,722 Bike and Pedestrian Improvements
101 S Marietta St / E Hilltop Dr Clyde St E Hudson Blvd 2,534 Sidewalk Construction
102 S. New Hope Rd Hudson Blvd Beaty Rd 7,872 Sidewalk Construction
103 Second Ave Marietta St Linwood Rd 7,594 Bike and Pedestrian Improvements
104 Second Ave Chestnut St S Belvedere Ave 1,419 Bike and Pedestrian Improvements
105 Seigle Ave Efird St Davenport St 522 Sidewalk Construction
106 Shannon Greenway Connector Donegal Ct Existing greenway 314 Greenway
107 Sherwood Cir Forestbrook Dr Kendrick Rd 4,587 Sidewalk Construction

Gastonia Comprehensive Pedestrian Plan Final Report
66
MAP ID LOCATION FROM TO LENGTH
IN FEET TYPE
108 Southwest Middle School Phillips Center Southwest Middle School 2,133 Greenway
109 Southwood Dr S. New Hope Rd Bellevue Ter 2,277 Sidewalk Construction
110 T Jeffers Greenway N Myrtle School Rd Crescent Ln 4,521 Greenway and Sidewalk Construction
111 T Jeffers Greenway Connector T Jeffers Greenway
Walmart Parcel on W Franklin Blvd 2,865
Greenway and Sidewalk Construction
112 Third Ave York St Marietta St 1,140 Sidewalk Construction
113 Timberlane St Laurel Ln Holly Dr 861 Sidewalk Construction
114 Union Rd Fourth Ave Sixth Ave 1,304 Sidewalk Construction
115 Union Rd Robinson Elementary School
Frontage of 3611 Union Rd 3,435 Sidewalk Construction
116 Union Rd Hudson Blvd Frontage of 2900 Union Rd (ARP Church) 4,563 Sidewalk Construction
117 Union Road Robinson Elementary School Drive
Frontage of 2956 Union Rd 1,317 Sidewalk Construction
118 US 321 New Way Dr Caldwell St 1,371 Sidewalk Construction
119 W Fourth Ave Trenton St Clay St 473 Sidewalk Construction
120 W Nineteenth Ave Carolina Ave Winget St 1,223 Sidewalk Construction
121 Walnut Ave Airline Ave Firestone St 2,458 Sidewalk Construction
122 York Rd Hudson Blvd Nassau Pl 4,096 Sidewalk Construction
123 York Rd Hudson Blvd Ruby Ave 5,157 Sidewalk Construction
124 York St End of Existing Sidewalk Frontage of 927 S. York St 166 Sidewalk Construction
Figure 4-5: Pedestrian Improvement Maps

Gastonia Comprehensive Pedestrian Plan 4 Network Recommendations
67
1

Gastonia Comprehensive Pedestrian Plan Final Report
68
2

Gastonia Comprehensive Pedestrian Plan 4 Network Recommendations
69
3

Gastonia Comprehensive Pedestrian Plan Final Report
70
4

Gastonia Comprehensive Pedestrian Plan 4 Network Recommendations
71
5

Gastonia Comprehensive Pedestrian Plan Final Report
72
6

Gastonia Comprehensive Pedestrian Plan 4 Network Recommendations
73
Inset

Gastonia Comprehensive Pedestrian Plan Final Report
74
page intentionally left blank

Gastonia Comprehensive Pedestrian Plan 5 Implementation
75
5 Implementation
To ensure that recommendations made in this document move toward realization, a framework for implementation has been established. This chapter provides:
• Action strategies to move program, policy, and design revision recommendations forward;
• Overview of the project prioritization methodology and how it relates to NCDOT’s prioritization process; and
• Defining of project tiers to establish implementation periods.
5.1 Action Strategies The Gastonia Comprehensive Pedestrian Plan recommends a variety of programs, policies, and design standard revisions. However, without action these recommendations will not be realized. Therefore, a number of action strategies have been developed relevant to these recommendations. These strategies complement the recommendations made earlier in this document and are intended to act as the “spark” to move these recommendations forward. Action strategies are presented in Table 5-1.
Steering Committee Meeting

Gastonia Comprehensive Pedestrian Plan Final Report
76
Table 5-1: Action Strategies
RECOMMENDATION ACTION STRATEGIES INVOLVED PARTIES
Global Strategies
Pedestrian Coordinator or Committee
• To move recommendations forward, it is essential to have a single staff person or limited committee of staff who are dedicated to the advancement of walkability in Gastonia. Such a position or committee does not have to be fulltime but those involved should set aside formal time to concentrate on pedestrian issues within the City.
At a minimum: • Administration
• Planning
• Engineering
Establish Local Funding • Identify annual funding for pedestrian facilities. This funding would be available and
appropriated to a number of areas, including pedestrian counters, speed limit reductions, sidewalk maintenance and repair, retrofits, and new construction.
• City Council
• Administration
Education, Encouragement, Enforcement Strategies
Update/Maintain Existing GIS Sidewalk Inventory
• Develop an internal tracking system that alerts GIS personnel to the construction of new sidewalks.
• Loop GIS personnel into the development process so they are aware when new sidewalks are constructed as part of private development.
• Coordinate between GIS, planning, and engineering to document sidewalk maintenance requests of citizens.
• Set goals for conducting a minimum amount of fieldwork annually to capture curb ramps and sidewalk conditions.
• Planning
• GIS
• Engineering
Web/Mobile Reporting App
• Coordinate between planning, engineering, GIS, and IT staff to determine the feasibility of developing a web/mobile app for reporting infrastructure issues.
• Consider beginning with a simple web-based form for reporting and later develop a more complex system incorporating mapping and mobile applications.
• Once active, work with marketing staff to develop a publicity campaign to encourage use by citizens.
• Ask police department personnel to report pedestrian infrastructure issues they see while policing the City.
• Planning
• Engineering
• IT
• GIS
• Marketing
• Police
“Near Miss” Reporting System
• Coordinate between planning, engineering, GIS, and IT staff to determine the feasibility of developing a near miss reporting system and if it should be integrated with the infrastructure reporting web/mobile app.
• Consider beginning with a simple web-based form for reporting and later develop a more complex system incorporating mapping and comparison of actual crash data to determine accident-prone areas.
• Once active, work with marketing staff to develop a publicity campaign to encourage use by citizens.
• Ask police department personnel to report near misses they see while policing the City.
• Planning
• Engineering
• IT
• GIS
• Marketing
• Police
Pedestrian Counts
• Create an implementation plan for the strategic deployment of pedestrian counters as funding is available for purchase and installation.
• To supplement electronic counts, consider partnering with high schools and colleges to perform limited manual counts at key intersections.
• Coordinate with NCDOT’s emerging pedestrian and bicycle count program.
• Planning
• Engineering
• NCDOT
Staff Training
• Establish a schedule for periodic (i.e., every 6-12 months) training of City staff whose jobs affect pedestrian safety (i.e., planning, engineering, parks and recreation, police department, etc.).
• Training can initially be led by staff that are more knowledgeable of pedestrian issues; as training progresses, consider engaging outside resources, including “Watch For Me NC” training materials (http://www.watchformenc.org/)
• Planning
• Engineering
• Parks and Recreation
• Police
Walking Encouragement
• Establish a walkability advisory committee composed of local walking/running groups and advocates to collaborate with City staff to identify walking routes and develop a draft walking route map (or series of maps).
• Encourage walking advisory committee to organize community walking and running groups.
• Local walking/running groups and advocates
• Planning
• GIS

Gastonia Comprehensive Pedestrian Plan 5 Implementation
77
RECOMMENDATION ACTION STRATEGIES INVOLVED PARTIES
Media Collaboration
• Establish a City media action team composed of representatives from marketing, planning, engineering, parks and recreation, and police to work with local media outlets to get the “good word” out about walking in Gastonia.
• Create a strategic plan for the development of educational pieces for print, television, web, and Government Access Channel distribution.
• Administration
• Marketing
• Planning
• Engineering
• Parks and Recreation
• Police
• Local Media
Child Pedestrian Safety Curriculum
• Work with City Administration to begin a dialogue with Gaston County Schools to discuss the possible implementation of the National Highway Traffic Safety Administration Child Pedestrian Safety Curriculum (http://www.nhtsa.gov/ChildPedestrianSafetyCurriculum) or the “Let’s Go NC!” Program (https://connect.ncdot.gov/projects/BikePed/Pages/LetsGoNC.aspx)
• Administration
• Gaston County Schools
Speed Limit Reductions
• Perform an initial review of streets to determine those that are obvious candidates for speed limit reduction (e.g., neighborhood streets).
• Set a goal for annual replacement of speed limit signs commiserate with available funding.
• Engineering
• Streets and Traffic
Maintenance and Improvement Strategies
Maintenance and Repair Program
• Establish an annual goal of linear feet of sidewalk to be repaired that is tied directly to the identified funding level.
• Use information gathered through web/mobile reporting app to determine areas of need.
• Engineering
• Streets and Traffic
ADA Curb Ramp Program
• Establish an annual goal of number of curb ramps or intersections to be improved that is tied directly to the identified funding level.
• Use recommended network improvements/prioritization included in this document and information gathered through web/mobile reporting app to determine areas of need.
• Engineering
• Streets and Traffic
• NCDOT (as needed)
Crosswalk Program
• Establish an annual goal of number of crosswalks or intersections to be improved that is tied directly to the identified funding level.
• Use recommended network improvements/prioritization included in this document and information gathered through web/mobile reporting app to determine areas of need.
• Engineering
• Streets and Traffic
• NCDOT (as needed)
Pedestrian Countdown Signal Program
• Establish an annual goal of number of signals to be installed that is tied directly to the identified funding level.
• Use recommended network improvements/prioritization included in this document to determine areas of need.
• Engineering
• Streets and Traffic
• NCDOT (as needed)
Pedestrian Refuge Program
• Use recommended network improvements/prioritization included in this document to determine areas of need.
• If needed, study traffic implications of pedestrian refuge.
• Seek opportunities for implementation either through resurfacing projects or other planned roadway improvements.
• Engineering
• Streets and Traffic
• NCDOT (as needed)
Midblock Crossings and Street “Right Sizing”
• Use recommended network improvements/prioritization included in this document to determine areas of need.
• If needed, study traffic implications of midblock crossings and right sizing.
• Coordinate and implement through crosswalk program, resurfacing projects, and/or other planned roadway improvements.
• Engineering
• Streets and Traffic
• NCDOT (as needed)
Transit Access Program
• Work with Gastonia Transit to determine areas of need and craft a strategic transit access plan for the improvement of pedestrian facilities that directly access transit.
• Program identified improvements into the maintenance/repair, curb ramp, crosswalk, pedestrian signal, and pedestrian refuge programs listed above.
• Transit
• Planning
• Engineering
• Streets and Traffic
• NCDOT (as needed)

Gastonia Comprehensive Pedestrian Plan Final Report
78
RECOMMENDATION ACTION STRATEGIES INVOLVED PARTIES
Design Standards and Policies Strategies
Complete Streets Policy
• Research complete streets policies to determine desired elements.
• Coordinate across City departments to ensure policy is appropriate and enforceable.
• Present draft complete streets policy to Planning Commission and City Council for consideration and adoption.
• Planning
• Engineering
• Streets and Traffic
• Administration
• Planning Commission
• City Council
Design Details • Modify design details as recommended in Appendix C.
• Present to Planning Commission and City Council for adoption.
• Engineering
• Administration
• Planning Commission
• City Council
Unified Development Ordinance
• Determine appropriate amendments to the Unified Development Ordinance in accordance with recommendations made in Table 3.3 regarding access management, crosswalk requirements, and pedestrian signals.
• Present to Planning Commission and City Council for consideration and adoption.
• Planning
• Engineering
• Administration
• Planning Commission
• City Council
NCDOT Resolution
• Research similar resolutions adopted by other jurisdictions that request pedestrian accommodations be funded on all non-interstate NCDOT road and bridge projects to determine desired elements for Gastonia resolution.
• Present draft NCDOT resolution to City Council for consideration and adoption.
• Planning
• Engineering
• Streets and Traffic
• Administration
• City Council
5.2 Project Prioritization The Gastonia Comprehensive Pedestrian Plan is envisioned to have a 10-year horizon; however, with over 180 projects identified, it is clear that not all projects can be implemented within the 10-year period of the Plan. Additionally, it is important to gain some understanding of which projects will provide the most benefit. For these reasons, a prioritization methodology was devised to score projects comparatively. This methodology blended the NCDOT prioritization process and understanding of local needs.
NCDOT Prioritization Process To direct the expenditure of available transportation construction dollars, the North Carolina General Assembly created the Strategic Transportation Investment Act (STI) which was signed into law on June 26, 2013. STI required NCDOT to develop a prioritization process to rank highway and non-highway projects.
Through an iterative and inclusive process, NCDOT develop what is now known as Prioritization 3.0 (P3.0). P3.0 provides unique scoring criteria for each type of transportation project, including highway, aviation, bicycle and pedestrian, ferry, public transit, and rail. The scoring criteria specific to bicycle and pedestrian projects is presented in Table 5-2.

Gastonia Comprehensive Pedestrian Plan 5 Implementation
79
Table 5-2: NCDOT Bicycle and Pedestrian Scoring
FUNDING CATEGORY
QUANTITATIVE DATA LOCAL INPUT
Division Rank MPO/RPO Rank
Division Needs
Access = 10%
25% 25%
Constructability = 5%
Safety = 15%
Demand Density = 10%
Benefit/Cost = 10%
TOTAL (Quantitative Data + Local Input) = 100%
Available funding is distributed to three categories, in order of significance: 1) Statewide Mobility (40%); 2) Regional Impact (30%); and 3) Division Need (30%). Bicycle and pedestrian projects, unless incidental to a larger roadway project, are eligible for funding through the Division Need category. NCDOT is geographically broken into 14 divisions and all bicycle and pedestrian projects must compete for funding within their own geographic division. Gastonia is part of Division 12, which includes Gaston, Cleveland, Lincoln, Catawba, Alexander, and Iredell Counties. All projects in Division 12 compete for the same funds and are scored on the 0-100 point scale shown in Table 5-2. Each MPO and Rural Planning Organization (RPO) may submit 20 bicycle/pedestrian projects per funding cycle to compete within their respective district. Eligibility requirements include that projects must be identified in a local bicycle and/or pedestrian plan, have a minimum $100,000 cost, and a local funding match of 20% of the project cost.
Gastonia Comprehensive Pedestrian Plan Prioritization Methodology Because the City of Gastonia anticipates working with the Gaston-Cleveland-Lincoln MPO to seek NCDOT funding for some of the projects recommended in the Plan, it is important that the prioritization methodology developed have some relationship to the NCDOT prioritization process. For this reason, the methodology reflects the NCDOT P3.0 but also considers local factors through the use of unique components with each variable.
A number of variables were used to “score” each recommended project (i.e., raw scores by variable are included in Appendix E). The variables utilized are primarily quantitative in nature and do not account for qualitative input such as perceived connectivity, public preference, and observed need. The potential use of such qualitative variables was presented during the final public meeting and received positive feedback. Therefore, it is recommended that the City consider incorporating some level of qualitative criteria as the project prioritization process is refined in future years.
The prioritization methodology is presented in Table 5-3.

Gastonia Comprehensive Pedestrian Plan Final Report
80
Table 5-3: Prioritization Methodology
VARIABLES SCORING NOTES
Access (miles to destination) Max Score 10
0.0 to 0.25 mile 10
0.26 to 0.5 mile 7.5
0.51 to 1.0 mile 5
1.01 miles or more 2.5 Constructability Max Score 5
No Construction Constraints 5
Environmental or Right-of-Way Constraint 3
Environmental and Right-of-Way Constraint 1 Safety Max Score 15
Crashes 5 Project with a serious crash within 0.25 mile
Speed Limit 5 Project with an adjacent road which has a posted speed limit over 30 mph
Separated Facility 5 Project that is separated from the road (e.g., greenway, side path, etc.)
Encourages Speed Reduction 5 Project with traffic calming measures Demand/Density Max Score 10
Persons per square mile – 2,251 or more 10 Using Census Block Groups
Persons per square mile – 1,501 to 2,250 7.5 2008 population per square mile
Persons per square mile – 751 to 1,500 5
Persons per square mile – 0 to 750 2.5 Benefit/Cost Max Score 10
Spot Project Breakdown
93.750001 – 454.454545 10 Cost of projects were Normalized = Cost of Project/Highest Project Cost
62.500001 – 93.750000 7.5 Benefit score = (Demand/Density + Access)/Normalized Project Cost
30.487806 – 62.500000 5
12.500000 – 30.487805 2.5
Corridor Project Breakdown
588.50001 – 5885.000000 10 Cost of projects were Normalized = Cost of Project/Highest Project Cost
272.927537 – 588.500000 7.5 Benefit score = (Demand/Density + Access)/Normalized Project Cost
87.509295 – 272.927536 5
0.000000 – 87.509294 2.5

Gastonia Comprehensive Pedestrian Plan 5 Implementation
81
5.3 Project Tiers Table 5-5 and Table 5-6 located at the end of this section present all network improvement recommendations as detailed in Chapter 4 along with opinions of probable cost, prioritization scoring, and suggested tiers for implementation. To provide some level of qualitative consideration, tiers are not direct rankings based solely on score, but rather balance scores with public comments regarding connectivity, preference, and need. In constructing the tiers logical scoring breakpoints were considered to provide a manageable number and cost of projects in the two tiers that comprise the 10-year horizon of the Plan. As individual projects are evaluated in greater detail, it is highly recommended that additional public input be received to assist in determining comprehensive need and desire for the project.
Improvements have been categorized by the following tiers:
• Tier I (0-5 years) – These are projects that scored well (i.e., 35 points or higher for Spot Improvements; 40 points or higher for Corridor Improvements) or received moderate scores (i.e., 30 points or higher) coupled with strong public support. They are critical to establishing early momentum, resolving key issues, and setting the foundation for the success of future improvements.
• Tier II (5-10 years) – These are projects that received moderate scores (i.e., 30-34.5 points for Spot Improvements; 35-39.5 points for Corridor Improvements) or were middling in scoring (20-29.5 points) coupled with strong public support. Planning, building of support, and identification of funding sources should begin now for these projects so they are on track for implementation within this period.
• Tier III (10+ years) – These are projects that received lower scores (less than 30 points for Spot Improvements; less than 35 points for Corridor Improvements) and did not receive significant public support. While identified as part of the planning process that has produced this document, these projects fall outside the 10-year horizon of the Plan. However, these projects do address pedestrian needs within the City of Gastonia and should be implemented in the long-term. Once earlier-tiered projects have been realized, further analysis and reevaluation should be conducted. Additionally, as these projects receive greater attention, public support may increase.
Although the above tiers have been established, these designations are for planning purposes only; improvements should be implemented as soon as opportunities arise. For example, if circumstances provide an opportunity to complete a Tier II project two years after the Plan is adopted, the improvement should be made, regardless of its designation as “Tier II.”

Gastonia Comprehensive Pedestrian Plan Final Report
82
Capital Cost Breakdowns The breakdowns of capital cost by tier and project type are outlined in Table 5-4.16 In years 0-5 nearly $1.8 million dollars is needed to implement Tier I; when broken down over the five-year period this averages $360,000 per year. Tier II projects account for roughly $5.0 million, but have the benefit of more time for planning, securing of funding, and building public and political support in the 5-10 year period. Tier III projects total at $27.3 million and are outside the implementation scope of the Plan.
Table 5-4: Capital Cost by Tier and Project Type
PROJECT TYPE TIER I (0-5 years)
TIER II (5-10 years)
TIER III (10+ years) TOTAL
Spot Improvements $692,000 $1,590,000 $1,476,000 $3,758,000
Corridor Improvements $1,084,500 $3,458,880 $25,783,405 $30,326,785
TOTAL $1,776,500 $5,048,880 $27,259,405 $34,084,785
16 Unit costs utilized in calculating individual project cost estimates are included in Appendix G, while a listing of potential funding sources is included in Appendix H.

Gastonia Comprehensive Pedestrian Plan 5 Implementation
83
Table 5-5: Spot Improvement Tiers
MAP ID TIER SCORE
(max 50) PRIMARY LOCATION CROSSING TYPE COST ESTIMATE
1 III 27.5 Armstrong Park Rd New Hope Rd Intersection $82,000
2 I 32.5 Broad St Main Ave Intersection $57,000
3 I 32.5 Broad St Franklin Blvd Intersection $93,000
4 II 30 Broad St Long Ave Intersection $71,000
5 I 35 Chester St New Way Dr Intersection $61,000
6 II 30 Chester St/ York St Tenth Ave Intersection $76,000
7 II 30 Cox Rd Court Dr Intersection $25,000
8 III 20 Cox Rd I-85 Ramps Intersection $80,000
9 I 42.5 Davidson Ave Pryor St Intersection $15,000
10 I 37.5 Franklin Blvd Myrtle School Rd Intersection $40,000
11 I 37.5 Franklin Blvd Chestnut St Intersection $40,000
12 I 37.5 Franklin Blvd Church St Intersection $40,000
13 I 35 Franklin Blvd Linwood Rd Intersection $25,000
14 II 32.5 Franklin Blvd Trenton St Study $15,000
15 II 32.5 Franklin Blvd Oakland St Intersection $40,000
16 II 32.5 Franklin Blvd Marietta St Intersection $40,000
17 II 32.5 Franklin Blvd South St Intersection $40,000
18 II 32.5 Franklin Blvd York St Intersection $40,000
19 II 30 Franklin Blvd Church St Intersection $47,000
20 II 30 Franklin Blvd Avon St Intersection $70,000
21 II 30 Franklin Blvd Chester St Intersection $106,000
22 II 30 Franklin Blvd Cox Rd Intersection $130,000
23 II 30 Franklin Blvd Second Ave Intersection $140,000
24 III 27.5 Franklin Blvd Firestone St Intersection $28,000
25 III 27.5 Franklin Blvd Lineberger Rd Intersection $55,000
26 III 27.5 Franklin Blvd Franklin Commons Intersection $55,000
27 III 25 Franklin Blvd Edgewood Rd Intersection $25,000
28 III 25 Franklin Blvd Vance St Intersection $40,000
29 III 25 Franklin Blvd New Hope Rd Intersection $49,000
30 III 23 Franklin Blvd Durharts Creek Bridge $250,000
31 III 20 Franklin Blvd between Belvedere Ave and Beverly Dr Crossing $77,000
32 I 37.5 Garrison Blvd Churchill Dr Study $10,000
33 I 35 Garrison Blvd Chestnut St Intersection $38,000
34 II 32.5 Garrison Blvd Chester St Intersection $27,000
35* I 32.5 Garrison Blvd Trenton St Intersection $56,000
36 III 27.5 Garrison Blvd Vance St Intersection $94,000
37 III 25 Gaston Day School Rd Bradford Heights Rd Crossing $68,000

Gastonia Comprehensive Pedestrian Plan Final Report
84
MAP ID TIER SCORE
(max 50) PRIMARY LOCATION CROSSING TYPE COST ESTIMATE
38 I 35 Hudson Blvd Robinwood Rd Intersection $31,000
39 I 35 Hudson Blvd Lyon St / Lynhaven Dr Intersection $39,000
40 II 30 Hudson Blvd Davis Park Rd Intersection $40,000
41 II 30 Hudson Blvd Fuller Dr Intersection $94,000
42* II 25 Hudson Blvd York St Intersection $66,000
43* II 22.5 Hudson Blvd Union Rd Intersection $105,000
44* II 20 Hudson Blvd Hoffman Rd Intersection $84,000
45 III 22.5 Hudson Blvd/Titman Rd New Hope Rd Intersection $121,000
46 I 40 Lineberger Park Highland Rail Trail Study $20,000
47* II 25 Long Ave/Ozark Ave Modena St Intersection $65,000
48 II 30 Marietta St Gaston County Courthouse Crossing $158,000
49 III 17.5 Modena St Rhyne St Intersection $41,000
50 III 17.5 Modena St Modena St Ext Intersection $48,000
51 III 27.5 New Hope Modena/Montrose Intersection $31,000
52 II 30 New Hope Rd Redbud Dr Intersection $70,000
53 III 25 New Hope Rd I-85 Ramps Intersection $76,000
54 I 40 Radio St Barkley St Intersection $11,000
55 III 17.5 Remount Rd Aberdeen BLvd Intesection $87,000
56 I 40 Second Ave Marietta St Intersection $25,000
57 I 40 Second Ave Avon St Intersection $59,000
58 I 35 Second Ave South St Study $15,000
59 I 35 Second Ave York St Intersection $17,000
60 III 27.5 Second Ave Chester St Intersection $73,000
61 III 20 Union Rd Robinwood Rd Intersection $96,000
62 II 30 US 321 Jackson Rd/Dale Ave Intersection $41,000
*Strong public support expressed by public meeting participants
Table 5-6: Corridor Improvement Tiers
MAP ID TIER SCORE
(max 50) LOCATION FROM TO TYPE COST ESTIMATE
1 III 30 Aberdeen Blvd New Hope Rd I-85 Greenway $1,010,000
2 III 25 Aberdeen Blvd I-85 Remount Rd Sidewalk Construction $61,000
3 III 20.5 Aberdeen Blvd Remount Rd Cox Rd Sidewalk Construction $167,000
4 III 30 Adams Dr Spencer Ave Miller St Sidewalk Construction $140,740
5 III 22.5 Archie Whiteside Dr Food Lion Grocery Store Selwyn Cir
Sidewalk Construction $115,000
6 II 35.5 Armstrong Park Rd Franklin Blvd Hudson Blvd Study $15,000
7 III 25.5 Athenian Dr Hillcrest Ave W Garrison Blvd Sidewalk Construction $293,845

Gastonia Comprehensive Pedestrian Plan 5 Implementation
85
MAP ID TIER SCORE
(max 50) LOCATION FROM TO TYPE COST ESTIMATE
8 II 35.5 Bradley Ave York St Cemetery Sidewalk Construction $103,000
9 III 20.5 Bradley Center Driveway
Modena St; Bridgewood Ln
Bradley Center Parking Lot
Sidewalk Construction $91,000
10 I 50 Broad St Franklin Blvd 4th Ave Bike and Pedestrian Improvements $17,000
11 III 30 Broad St Woodhill Dr Boxwood Ln Sidewalk Construction $52,000
12 III 27.5 Catawba Creek Greenway Extension Ferguson Park Marietta Street Greenway $410,000
13 III 26
Catawba Creek Greenway Southeast Extension (Phase I) Southeast Armory Robinwood Rd Greenway $2,354,000
14 III 26
Catawba Creek Greenway Southeast Extension (Phase II) Gaston Day School Rd Timberwood Dr Greenway $2,106,000
15 I 40 Chestnut St 4th Ave Garrison Blvd Sidewalk Construction $148,000
16 III 30.5 Churchill Dr Garrison Blvd Buckingham Ave Sidewalk Construction $266,000
17 III 25 Connection to Bradley Center N. New Hope Rd Bradley Center Greenway $1,111,000
18 III 32.5 Clay St Second Ave Franklin Blvd Sidewalk Construction $30,000
19 III 27.5 Cox Rd I-85 Court Dr Sidewalk Construction $80,000
20 III 25.5 Cox Rd I-85 Franklin Blvd Sidewalk Construction $87,000
21 II 35 Craig Ave Poston Cir Thomas St Sidewalk Construction $115,000
22 II 37.5 Davidson Ave Chester St Falls St Sidewalk Construction $75,000
23* II 27.5 Davidson Ave Marietta St Hanover St Sidewalk Construction $124,000
24 III 23 Davidson Ave Broad St Avon St Sidewalk Construction $151,000
25 III 27.5 Davis Park Rd Hudson Blvd Richland Ave Sidewalk Construction $78,000
26 III 25.5 E Hudson Blvd York Rd Union Rd Sidewalk Construction $296,000
27 I 40 E Second Ave S Chestnut Stq S Marietta St Bike and Pedestrian Improvements $172,500
28 III 27.5 Eddie St Dixon Rd Dead End Sidewalk Construction $48,000
29 III 20 Edgewood Rd Food Lion Grocery Store Oates Rd
Sidewalk Construction $252,000
30 II 35 Elm St Tenth Ave Adams Dr Sidewalk Construction $37,820
31 III 26 Ferguson Park Greenway Connector Existing Greenway Ruby Ave
Greenway and Sidewalk Construction $232,000
32 II 38 Fern Forest Drive Garrison Blvd Hudson Blvd Greenway Connection $178,000
33 III 32.5 Fourth Ave Vance St Fifth Ave Sidewalk Construction $6,000
34 III 32.5 Franklin Blvd Broad St Avon St General Pedestrian Improvements $449,000
35 III 30.5 Franklin Blvd Cox Rd East Club Rd Sidewalk Construction $117,000
36 III 25.5 Franklin Blvd Cox Rd City Limits Sidewalk Construction $329,000

Gastonia Comprehensive Pedestrian Plan Final Report
86
MAP ID TIER SCORE
(max 50) LOCATION FROM TO TYPE COST ESTIMATE
37* II 28 Gardner Park Dr; Pamela St
Downey Pl; Gardner Park Dr Pamela St; Redbud Dr
Sidewalk Construction $105,300
38 III 33 Garrison Blvd Marietta St Chestnut St Sidewalk Construction $203,000
39 III 27.5 Garrison Blvd New Hope Rd Burtonwood Dr Sidewalk Construction $120,000
40 III 20.5 Gaston Day School Rd Kendrick Rd Hoffman Rd Sidewalk Construction $269,000
41 III 18 Gaston Day School Rd Lincoln Lane Kendrick Rd Sidewalk Construction $315,000
42 III 32.5 Green Dr Franklin Blvd East Club Circle Sidewalk Construction $40,000
43 I 43 Greenway Connector Highland Rail Trail US 321 Greenway $34,000
44 III 32.5 Greenway Connector Highland Rail Trail Cemetery Greenway $28,000
45 II 35.5 Henderson St Lyon St Southside Ave Sidewalk Construction $63,000
46 II 35 Henderson St McArver St Gail Ave Sidewalk Construction $17,000
47 III 18.5 Highland Branch Greenway Rankin Lake Park Bulb Ave Greenway $400,000
48 II 37.5 Highland St Davidson Ave Church Property Sidewalk Construction $60,000
49 III 30 Hillcrest Ave Miller St Athenian Dr Sidewalk Construction $67,440
50 III 17.5 Hillwood Dr Hargrove Ave Dead End Sidewalk Construction $195,000
51 II 35 Holly Dr Timberlane St Greenway Access Sidewalk Construction $57,000
52 III 32.5 Home Trail Weldon St Hillcrest Ave Sidewalk Construction $36,000
53 III 28 Hudson Blvd Robinwood Rd Churchill Dr Sidewalk Construction $139,000
54 III 28 Hudson Blvd Armstrong Park Rd Redbud Dr Sidewalk Construction $198,000
55 III 23 Hudson Blvd Windsor Woods Dr Existing sidewalk at 951 E Hudson Blvd
Sidewalk Construction $203,000
56 III 30.5 Hudson Blvd E Davis Park Dr York Rd Sidewalk Construction $538,000
57 III 32.5 Independence Way Redbud Dr Londonderry Dr Sidewalk Construction $10,000
58 III 27.5 Jackson Rd York Rd Nineteenth Ave Sidewalk Construction $273,000
59 III 30 Jackson St W Eighth Ave W Tenth Ave Sidewalk Construction $52,000
60 III 18 Kendrick Rd Robinwood Rd East City Limits Sidewalk Construction $1,008,000
61* I 33 Laurel Ln Castlegate St Robinwood Rd Sidewalk Construction $48,000
62 III 28 Laurel Ln Churchill Dr Timberlane St Sidewalk Construction $84,000
63 I 40 Linwood Rd Garrison Blvd Spencer Ave Multiuse Path $125,000
64 III 27.5 Linwood Rd East Dr Cloninger Ave Sidewalk Construction $48,980
65 III 25.5 Londonderry Dr Jefferson Ave Independence Way Sidewalk Construction $58,000
66 III 25.5 Loray Greenway Connector Linwood US 321
Greenway and Sidewalk Construction $2,189,000
67 II 37.5 Lyon St Hudson Blvd 2065 Lyon St Frontage Sidewalk Construction $52,000

Gastonia Comprehensive Pedestrian Plan 5 Implementation
87
MAP ID TIER SCORE
(max 50) LOCATION FROM TO TYPE COST ESTIMATE
68 II 37.5 May Ave Webb St Scruggs St Sidewalk Construction $153,000
69 II 35 McArver St Mountainview St Henderson St Sidewalk Construction $41,000
70* II 25 Modena St Park Ave Spring St Sidewalk Construction $450,000
71* II 20 Modena St Rhyne St Bradley Center Driveway
Sidewalk Construction $116,000
72 III 18 Modena St New Hope Rd Modena St Ext Sidewalk Construction $450,000
73 III 17.5 Modena St Modena Ext Rhyne St Sidewalk Construction $377,000
74 III 25 Montrose Dr N New Hope Rd Rhyne Carter Rd Sidewalk Construction $86,400
75 I 40 Morris St Doffin Ln Radio St Sidewalk Construction $52,000
76 III 30 Mountain View St McArver St S York St Sidewalk Construction $381,000
77 III 30 N Oakwood St Hillwood Dr Davidson Ave Sidewalk Construction $77,000
78 III 21 New Greenway Linwood Rd Sherman St Greenway $638,000
79 II 35 New Hope Rd Franklin Blvd Ozark Ave Sidewalk Construction $272,000
80 III 32.5 New Hope Rd Burtonwood Dr Franklin Blvd Sidewalk Construction $28,000
81 III 32.5 New Hope Rd Redbud Dr Hudson Blvd/Titman Rd
Sidewalk Construction $80,000
82 III 32.5 New Hope Rd Armstrong Park Rd Redbud Dr Sidewalk Construction $234,000
83 III 30 New Hope Rd Lee St Armstrong Park Rd Sidewalk Construction $78,000
84 I 40 New Way Dr Morris St US 321 Sidewalk Construction $44,000
85 I 42.5 Norment Ave Pryor St Morris St Sidewalk Construction $42,000
86 III 25 Old Redbud Dr Redbud Dr Franklin Blvd Sidewalk Construction $87,000
87 II 37.5 Osceola St Eight Ave Existing Sidewalk North of Oxford Ave
Sidewalk Construction $49,000
88 III 30.5 Osceola St Marietta St Oxford Ave Sidewalk Construction $247,000
89 III 30 Park Ln Edgefield Ave Nineteenth Ave Sidewalk Construction $325,000
90 I 42.5 Pryor St Davidson Ave Norment Ave Sidewalk Construction $38,000
91 I 40.5 Pryor St Pryor St Sycamore Ave Greenway $281,000
92 III 28
Ramblewood Ln; Sherwood Cir; Pineridge Ln
Pineridge Ln; Forestbrook Dr; Ramblewood Ln
North Dead End; Ramblewood Ln; Union Rd
Sidewalk Construction $30,000
93 I 40 Rankin Ave Boyce St Chester St Sidewalk Construction $15,000
94 II 35 Rankin Ave Pryor St Highland St Sidewalk Construction $24,000
95 III 28.5 Ransom St Greenway Connector Ransom St Hillwood Dr Greenway $77,000
96 II 37.5 Redbud Dr Hudson Blvd New Hope Rd Sidewalk Construction $234,000
97 III 25 Remount Rd New Hope Rd Aberdeen Rd Sidewalk Construction $225,000

Gastonia Comprehensive Pedestrian Plan Final Report
88
MAP ID TIER SCORE
(max 50) LOCATION FROM TO TYPE COST ESTIMATE
98 II 35 Robinwood Rd Hudson Blvd Catawba Creek Greenway
Sidewalk Construction $78,000
99 III 25.5 Ruby Ave Johnston St York St Sidewalk Construction $652,000
100 II 38 S Chestnut St Lineberger Park E Second Ave Bike and Pedestrian Improvements $172,500
101 III 30 S Marietta St / E Hilltop Dr Clyde St E Hudson Blvd
Sidewalk Construction $420,000
102* II 25 S. New Hope Rd Hudson Blvd Beaty Rd Sidewalk Construction $469,000
103 I 43 Second Ave Marietta St Linwood Rd Bike and Pedestrian Improvements $68,000
104 III 33 Second Ave Chestnut St S Belvedere Ave Bike and Pedestrian Improvements $246,000
105 II 37.5 Seigle Ave Efird St Davenport St Sidewalk Construction $30,000
106 III 32.5 Shannon Greenway Connector Donegal Ct Existing greenway Greenway $84,000
107 III 18 Sherwood Cir Forestbrook Dr Kendrick Rd Sidewalk Construction $336,000
108 III 33.5 Southwest Middle School Phillips Center
Southwest Middle School Greenway $420,000
109 III 22.5 Southwood Dr S. New Hope Rd Bellevue Ter Sidewalk Construction $163,000
110 III 33.5 T Jeffers Greenway N Myrtle School Rd Crescent Ln
Greenway and Sidewalk Construction $760,000
111 III 31 T Jeffers Greenway Connector T Jeffers Greenway
Walmart Parcel on W Franklin Blvd
Greenway and Sidewalk Construction $803,000
112 II 38 Third Ave York St Marietta St Sidewalk Construction $43,260
113 III 30 Timberlane St Laurel Ln Holly Dr Sidewalk Construction $50,000
114 III 32.5 Union Rd Fourth Ave Sixth Ave Sidewalk Construction $72,000
115 III 22.5 Union Rd Robinson Elementary School
Frontage of 3611 Union Rd
Sidewalk Construction $269,000
116 III 22.5 Union Rd Hudson Blvd
Frontage of 2900 Union Rd (ARP Church)
Sidewalk Construction $344,000
117 III 27.5 Union Road Robinson Elementary School Drive
Frontage of 2956 Union Rd
Sidewalk Construction $50,000
118 II 38 US 321 New Way Dr Caldwell St Sidewalk Construction $117,000
119 III 33 W Fourth Ave Trenton St Clay St Sidewalk Construction $30,000
120 III 32.5 W Nineteenth Ave Carolina Ave Winget St Sidewalk Construction $72,000
121 II 35 Walnut Ave Airline Ave Firestone St Sidewalk Construction $198,000
122 III 32.5 York Rd Hudson Blvd Nassau Pl Sidewalk Construction $308,000
123 III 32.5 York Rd Hudson Blvd Ruby Ave Sidewalk Construction $477,000
124 II 35 York St End of Existing Sidewalk
Frontage of 927 S. York St
Sidewalk Construction $10,000
*Strong public support expressed by public meeting participants

Gastonia Comprehensive Pedestrian Plan 5 Implementation
89
5.4 NCDOT Complete Streets and Incidental Pedestrian Improvements The North Carolina Board of Transportation adopted a Complete Streets policy in July 2009. The policy directs the North Carolina Department of Transportation (NCDOT) to consider and incorporate all modes of transportation when building new projects or making improvements to existing transportation infrastructure. Under the new policy, NCDOT will collaborate with cities, towns, and communities during the planning and design phases of new streets or improvement projects. Together, they will decide how to provide the transportation options needed to serve the community and complement the context of the area.
Gastonia, like many municipalities in North Carolina, has aggressively annexed areas around its periphery as development has occurred in these places. As a result, approximately 80 percent of the area within the City Limits is now considered urbanized by the U.S. Census Bureau. The remaining rural area is primarily comprised of parkland, waste facilities, underdeveloped industrial parks, and satellite annexations for proposed mixed-use developments. As new residential and industrial development continues, the City will likely become more urbanized.
As an urbanized community, the City of Gastonia experiences high demand for pedestrian facilities. Since the intended scope of this plan is limited to ten years, not all facilities needed or desired by the community are included in this plan. However, as NCDOT constructs new transportation projects or improves existing transportation infrastructure in the City, there is great potential for the construction of incidental pedestrian facilities. The City will continue to advocate for NCDOT to include pedestrian facilities in the construction of new transportation projects or in improvements to existing transportation infrastructure.
Figure 5-1 shows potential roadway improvement projects that impact the City of Gastonia that may be funded by the State and designed and constructed beyond 2015, excluding expressway/interstate projects. These projects are identified in the Gaston-Cleveland-Lincoln MPO’s 2040 Metropolitan Transportation Plan (MTP), but it is important to note that not all projects are funded and that the MTP is updated every four years. Still, these highlighted projects illustrate areas where incidental improvements to the pedestrian network in Gastonia are expected to eventually occur, given effective communication with NCDOT.
Figure 5-1 also shows all state-maintained roadways and bridges to illustrate other areas where incidental pedestrian improvements could occur as NCDOT improves existing transportation infrastructure.

Gastonia Comprehensive Pedestrian Plan Final Report
90
page intentionally left blank

Gastonia Comprehensive Pedestrian Plan 5 Implementation
91
Figure 5-1: Potential Opportunities for NCDOT Incidental Improvements to the Pedestrian Network

Gastonia Comprehensive Pedestrian Plan Final Report
92
page intentionally left blank