gateshead local strategic partnership shifting resources upstream
TRANSCRIPT

Gateshead Local Strategic
Partnership
Shifting ResourcesUpstream
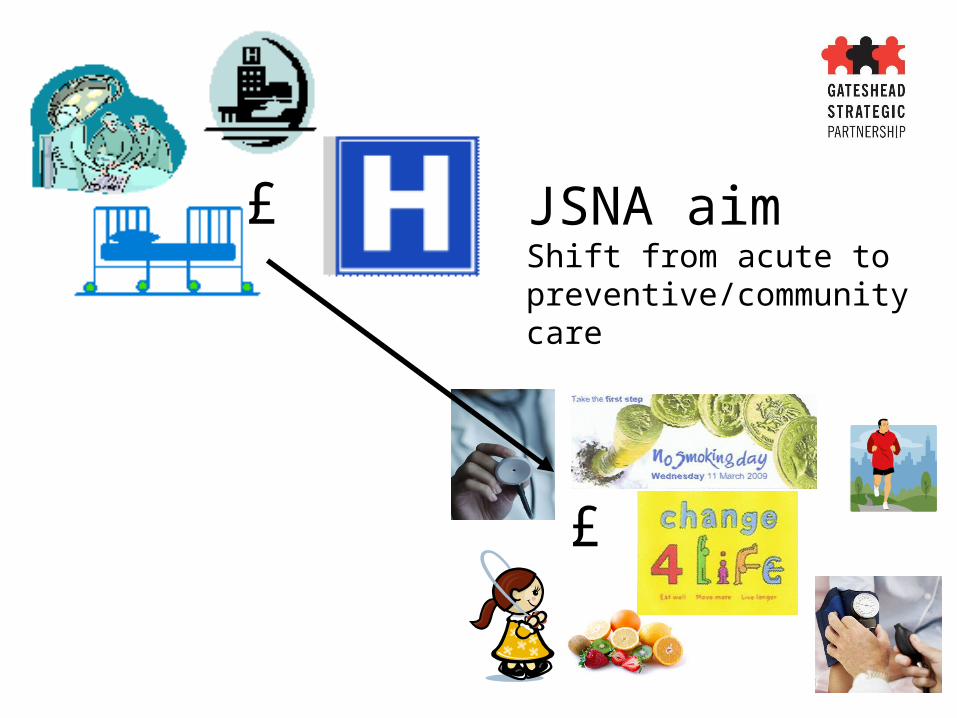
JSNA aimShift from acute to preventive/community care
£
£
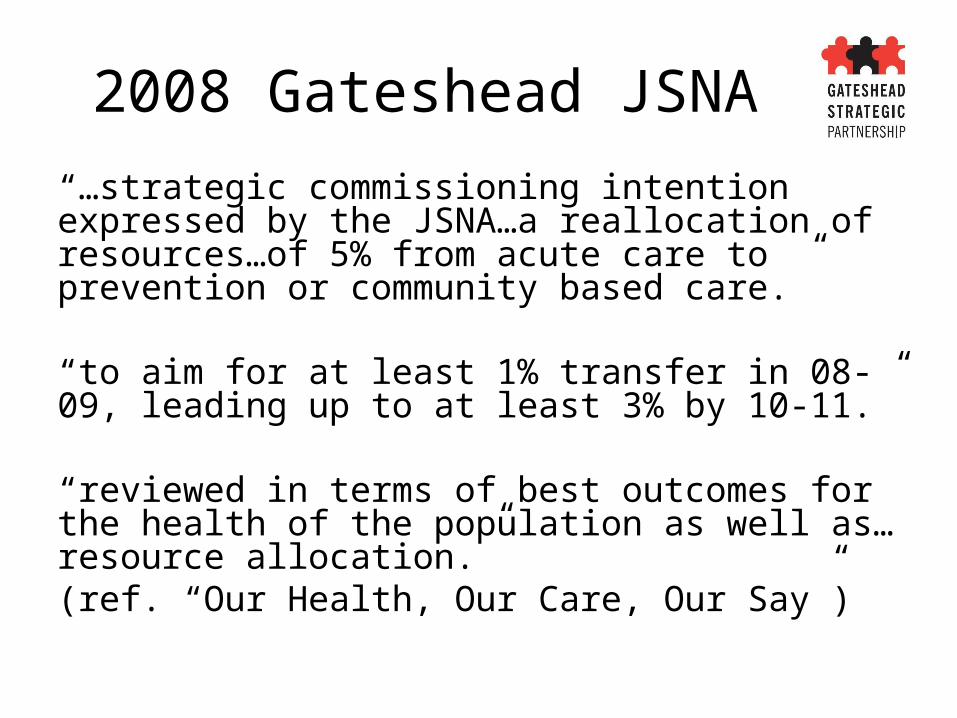
2008 Gateshead JSNA
“…strategic commissioning intention expressed by the JSNA…a reallocation of resources…of 5% from acute care to prevention or community based care.”
“to aim for at least 1% transfer in 08-09, leading up to at least 3% by 10-11.”
“reviewed in terms of best outcomes for the health of the population as well as…resource allocation.”(ref. “Our Health, Our Care, Our Say”)
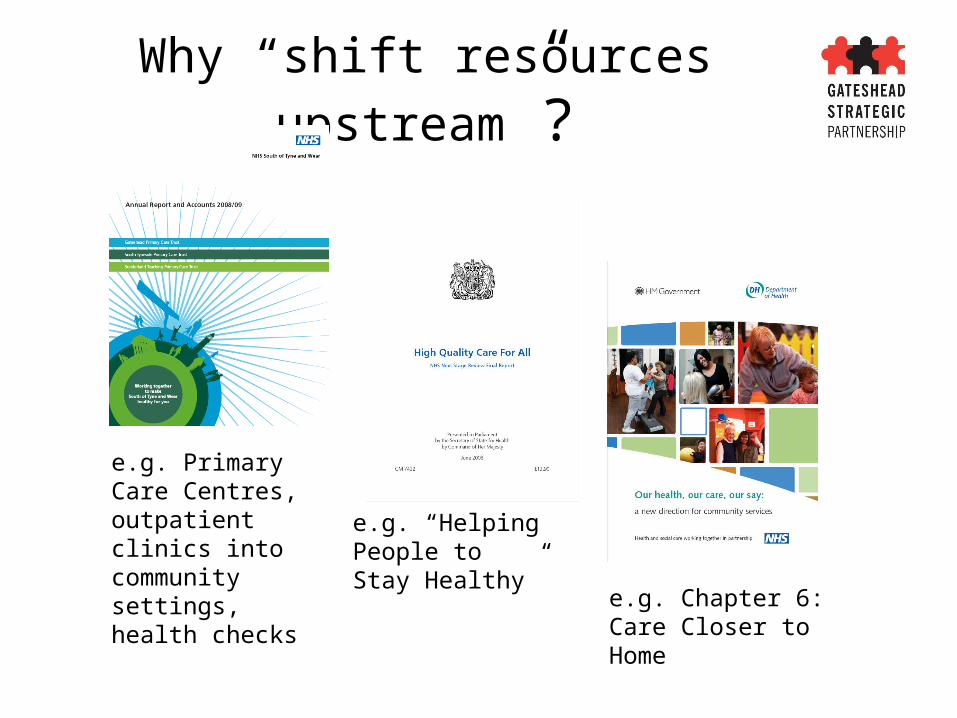
Why “shift resources upstream”?
e.g. Chapter 6: Care Closer to Home
e.g. Primary Care Centres, outpatient clinics into community settings, health checks
e.g. “Helping People to Stay Healthy”
Focus of project
• Tracking expenditure from acute to preventive or community care
• Data identification, access and presentation
• Circulatory disease(similar work also on mental health and musculo-skeletal conditions)
Why track expenditure?
• Lack of evidence showing how JSNA is influencing commissioning
• How do we know JSNA is making a difference?
• To demonstrate that JSNA is a cost-effective exercise
Challenges (1)
• Identifying appropriate data– Definitions of ‘acute’
• Secondary care – hospital-employed nurses in the community
– Acute to preventive/community care is a continuum
• E.g. care in outpatients is more ‘community-based’ than care as an inpatient
– Cross-over effects• Preventive measures affect several conditions e.g.
weight management – heart disease, diabetes etc.
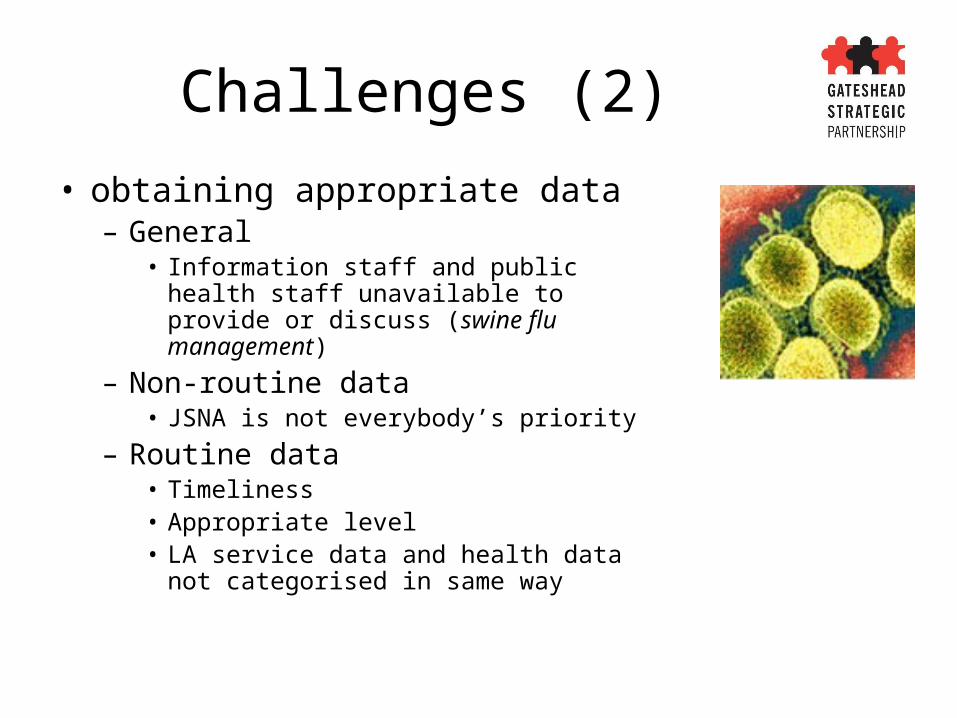
Challenges (2)
• obtaining appropriate data– General
• Information staff and public health staff unavailable to provide or discuss (swine flu management)
– Non-routine data• JSNA is not everybody’s priority
– Routine data• Timeliness• Appropriate level• LA service data and health data not
categorised in same way
Challenges (3)
Programme budgeting• PCT not LSP• Levels of standard breakdown
inappropriate– (lowest level = circulatory disease
subcategories)
• Not even split into secondary/primary care• Standard format is spend per 100,000
weighted head of population – less impact than actual £total
Challenges (4)
• Actual spend or percentage of total?• How to account for injections of funding, as opposed to
transferred money
• Displaying dataQuestions include– where do prescribing data go?– Is outpatients ‘more community-based’ than LA day
care?
• What do data NOT show?– Was expenditure actually transferred?– Were the relative changes coincidental?
Addressing challenges (1)
• Aim to use routinely available data– LA – Personal Social Services Expenditure
(PSSEX) but hope for more on specific long-term conditions (e.g. stroke expenditure)
– Drugs expenditure – prescription costs AND number of items
– Secondary care• Cardiology
– attendances and costs– Elective, non-elective– Inpatient, outpatient

Addressing challenges (2)
Primary care - Programme budgeting– Continue work with finance colleagues
• Identify useful drilling down approachesOngoing (local) work to show – by setting and – by sector
– Use and disseminate use of approach– Obtain £actual not £ per 100k population– Press for national drilling-down requirements
Addressing challenges (3)
• Make assumptions – even if we get it ‘wrong’ but use the same next time, we can still draw year-on-year comparisons
E.g. retain standard classification of hospital heart nurses as secondary care (far from ideal)
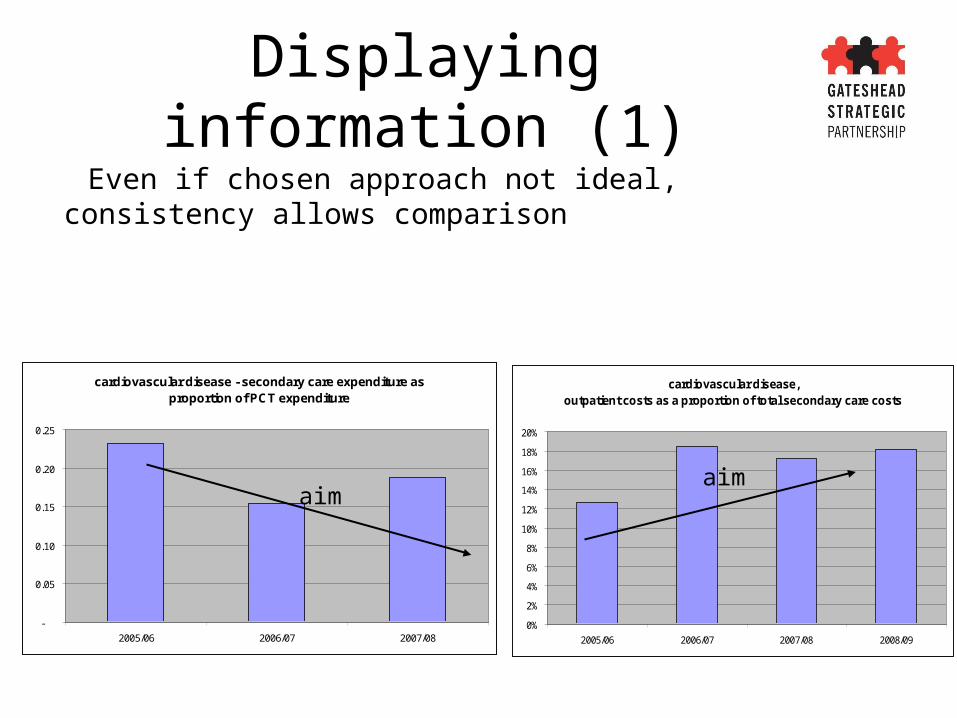
Displaying information (1)
Even if chosen approach not ideal, consistency allows comparison
cardiovascular disease, outpatient costs as a proportion of total secondary care costs
0%
2%
4%
6%
8%
10%
12%
14%
16%
18%
20%
2005/06 2006/07 2007/08 2008/09
cardiovascular disease - secondary care expenditure as proportion of PCT expenditure
-
0.05
0.10
0.15
0.20
0.25
2005/06 2006/07 2007/08
aimaim
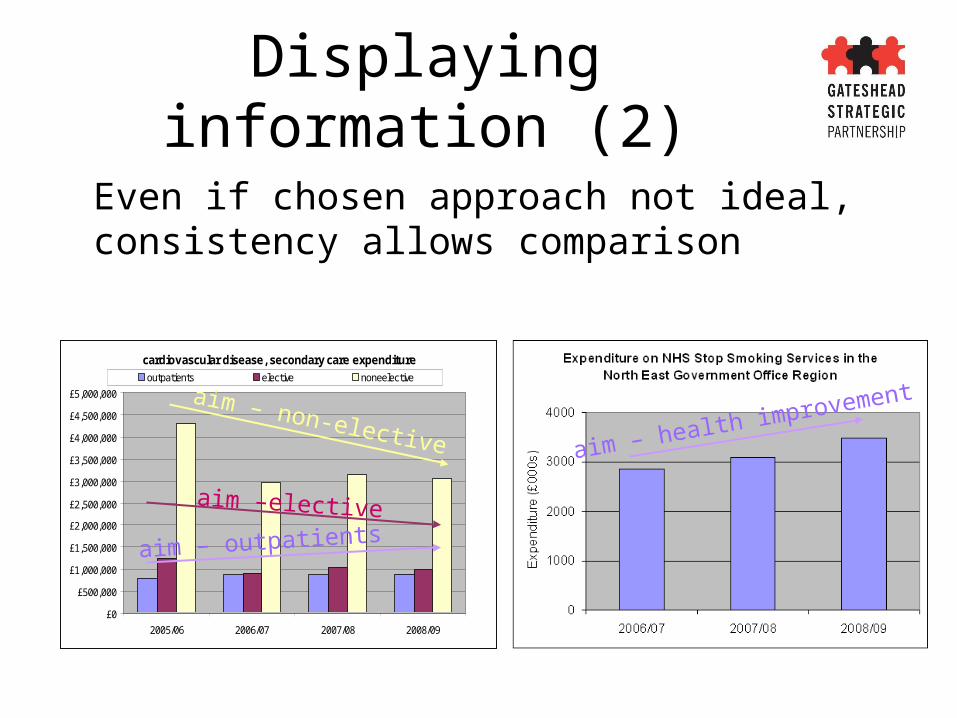
Displaying information (2)
Even if chosen approach not ideal, consistency allows comparison
cardiovascular disease, secondary care expenditure
£0
£500,000
£1,000,000
£1,500,000
£2,000,000
£2,500,000
£3,000,000
£3,500,000
£4,000,000
£4,500,000
£5,000,000
2005/06 2006/07 2007/08 2008/09
outpatients elective noneelective
aim – non-elective
aim – outpatients
aim –elective
aim – health improvement
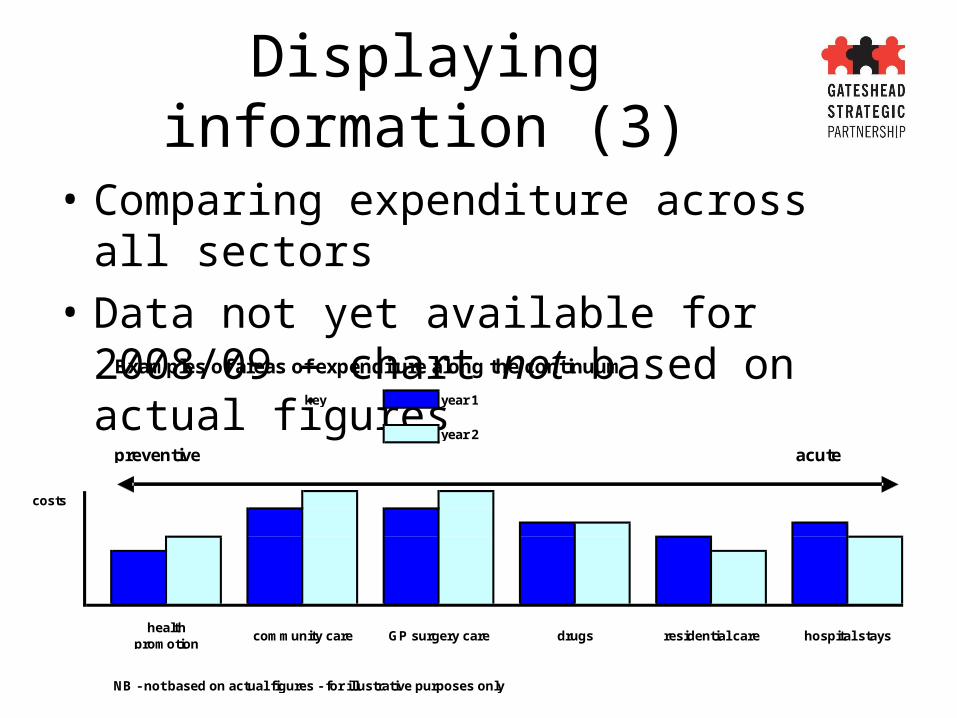
• Comparing expenditure across all sectors
• Data not yet available for 2008/09 – chart not based on actual figures
Displaying information (3)
Examples of areas of expenditure along the continuum
key year 1
year 2
preventive acute
costs
NB - not based on actual figures - for illustrative purposes only
residential care hospital stayshealth
promotioncommunity care GP surgery care drugs
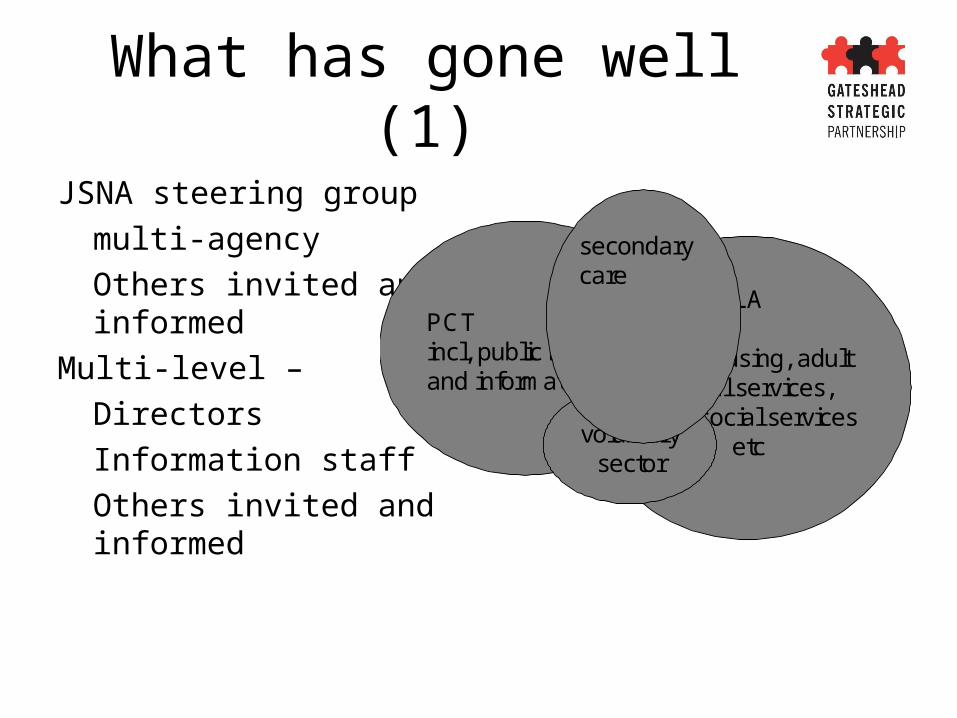
What has gone well (1)
JSNA steering group
multi-agency
Others invited and informed
Multi-level –
Directors
Information staff
Others invited and informed
PCTincl, public health and information
LA
incl. housing, adult social services,
child social services etcvoluntary
sector
secondary care
What has gone well (2)
• Programme budgeting– Finance colleagues very helpful– Pilot site for local implementation of
“Programme Budgeting” approach– Additional work ongoing
• Other information supply– Colleagues willing to discuss requirements
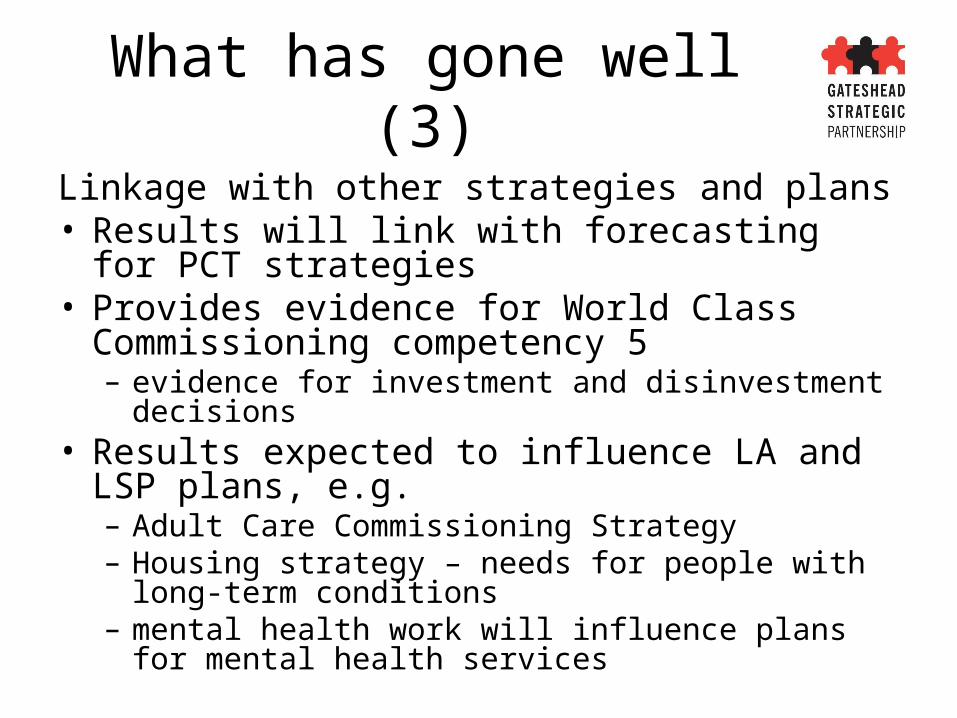
What has gone well (3)
Linkage with other strategies and plans• Results will link with forecasting for PCT
strategies• Provides evidence for World Class
Commissioning competency 5– evidence for investment and disinvestment decisions
• Results expected to influence LA and LSP plans, e.g.– Adult Care Commissioning Strategy– Housing strategy – needs for people with long-term
conditions– mental health work will influence plans for mental
health services
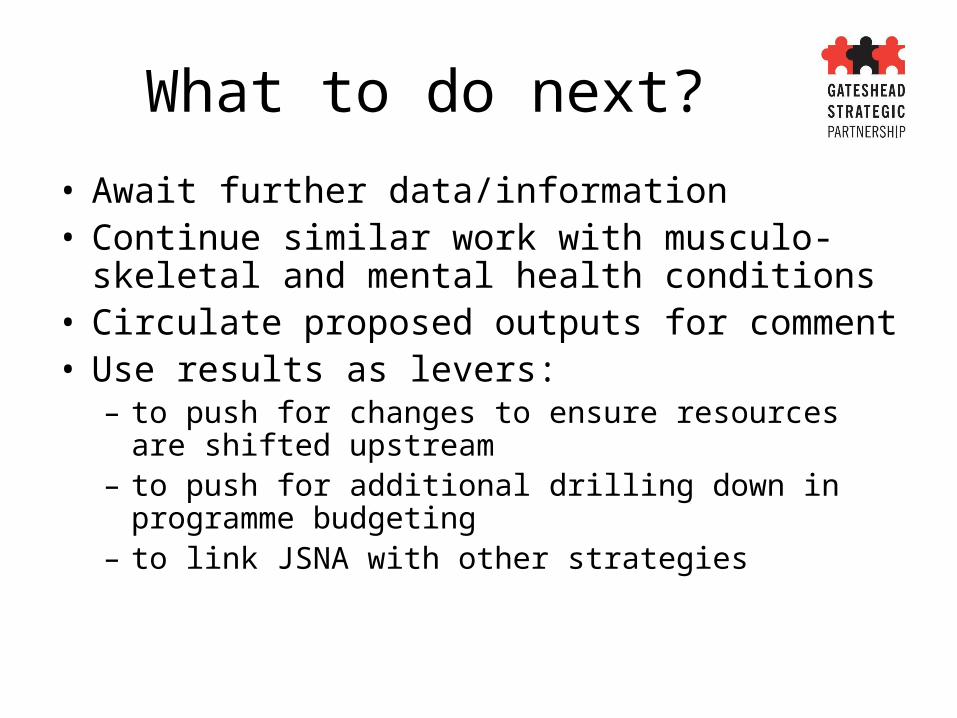
What to do next?
• Await further data/information• Continue similar work with musculo-skeletal and
mental health conditions• Circulate proposed outputs for comment• Use results as levers:
– to push for changes to ensure resources are shifted upstream
– to push for additional drilling down in programme budgeting
– to link JSNA with other strategies