gateway national recreation area— floyd bennett field...
TRANSCRIPT
Social Science ProgramNational Park ServiceU.S. Department of the Interior
Visitor Services Project
Gateway National Recreation Area—Floyd Bennett Field
Visitor Study
Spring 2003
Report 141
Park Studies Unit

Social Science ProgramNational Park ServiceU.S. Department of the Interior
Visitor Services Project
Gateway National RecreationArea—Floyd Bennett Field
Visitor StudySpring 2003
Wendy L. Shields
Margaret A. Littlejohn
Steven J. Hollenhorst
Visitor Services ProjectReport 141
April 2004
Wendy Shields is assistant project coordinator for the VSP, Margaret Littlejohn is the NationalPark Service VSP Coordinator, and Dr. Steve Hollenhorst is Director of the Park Studies Unit,Department of Resource Recreation and Tourism, University of Idaho. We thank the staff ofGateway National Recreation Area, especially John Lancos and Liam Strain, for their assistancewith this study. The VSP acknowledges the Public Opinion Lab of the Social and EconomicSciences Research Center, Washington State University, for its technical assistance. This visitorstudy is partially funded by Fee Demonstration Funding.

Visitor Services ProjectGateway National Recreation Area—Floyd Bennett Field
Report Summary
• This report describes the results of a visitor study at Gateway National Recreation Area — FloydBennett Field from May 24 - June 1, 2003. A total of 857 questionnaires were distributed tovisitors. Visitors returned 492 questionnaires for a 57.4% response rate.
• This report profiles Floyd Bennett Field visitors. A separate appendix contains visitors'comments about their visit. This report and the appendix include summaries of thosecomments.
• Twenty-seven percent of visitors were traveling alone; twenty-nine percent of visitors were withfriends. Thirty-one percent of visitor groups were groups of two. Twenty-four percent of thevisitor groups were family groups. Forty-one percent of visitors were aged 41-65 years and 10%were aged 15 or younger.
• United States visitors were from New York (96%), New Jersey (1%), and Puerto Rico (1%), withsmaller percentages from four other states. There were not enough international visitors toprovide reliable data.
• Nine percent of the visitors were of Spanish/Hispanic/Latino ethnicity. Of these, 55% werePuerto Rican, 5% Cuban. Forty-one percent identified themselves as of "other" Hispanicethnicity. Most visitors were of White racial background (82%), followed by Black/AfricanAmerican (15%) and Asian (5%).
• Forty-seven percent of visitors reported visiting Floyd Bennett Field 21 or more times during theprior twelve months. Another 45% visited two to twenty times in the prior twelve months. Whenasked how often they visit, 53% of visitors said they visit at least once a week. Another 21%visit daily and 16% visit at least once a month. Most (76%) visit on both weekdays andweekends. Fifty percent of visitors spent four or more hours on this visit.
• Prior to this visit, visitors most often obtained information about Floyd Bennett Field through wordof mouth (67%), previous visits (51%), and park program guide (18%). Twelve percent of thevisitors received no information before their visit. Most visitors (76%) were aware that GatewayNational Recreation Area—Floyd Bennett Field is a unit of the National Park Service.
• On this visit, the most common activities were fishing (30%), jogging/walking/hiking (27%),gardening (24%) and model airplanes (23%). The most common activities on past visitsincluded seeing historical aircraft or buildings (40%), jogging/walking/hiking (38%), and fishing(37%).
• The qualities/characteristics that visitors most often came to Floyd Bennett Field for includedopen space (75%), quiet (70%), natural views (65%), safe environment (64%), and a place torelax (62%). Other qualities characteristics received smaller proportions of responses. Whenasked how well their expectations about these qualities/characteristics had been met, thehighest ratings were for open space (77%), pursuing hobbies (72%) and a place to relax (70%).
• The factors most detracting to the visitors at Floyd Bennett Field were speeding cars andmotorcycles (23%), and trash (17%). Factors most adding to visits were model cars andairplanes (31%), and patrols by park rangers/park police (21%).
• Sixty-three percent of visitors rated the overall quality of visitor services at Floyd Bennett Field as"very good" or “good.” Eleven percent of groups rated the overall quality of visitor services as“poor” or "very poor."
For more information about the Visitor Services Project, please contact the University of Idaho ParkStudies Unit; phone (208) 885-7863 or visit the following website: http://www.psu.uidaho.edu

Gateway NRA—Floyd Bennett Field VSP Visitor Study May 24 – June 1, 2003
2
TABLE OF CONTENTS
Page
INTRODUCTION 1
METHODS 2
RESULTS 5
Visitors contacted 5
Demographics 5
Length of visit 14
Sources of information 16
Awareness of site management by National Park Service 19
Visits to other National Park Service units 20
Visit characteristics 22
Activities 25
Form of transportation and sites visited 29
Selected factors' effect on park visitors 32
Importance of visitor services and facilities 35
Visitor expectations 47
Preferred future programs and activities 56
Most important information learned 58
Overall quality of visitor services 60
What visitors liked most 61
What visitors liked least 63
Planning for the future 64
Comment summary 66
ADDITIONAL ANALYSIS 69
QUESTIONNAIRE 71
VISITOR SERVICES PROJECT PUBLICATIONS 73

Gateway NRA—Floyd Bennett Field VSP Visitor Study May 24 – June 1, 2003
3
Gateway NRA—Floyd Bennett Field VSP Visitor Study May 24 – June 1, 2003
1
INTRODUCTION
This report describes the results of a study of visitors at Gateway
National Recreation Area (NRA)—Floyd Bennett Field, also referred to as "Floyd
Bennett Field." This visitor study was conducted May 24 - June 1, 2003 by the
National Park Service (NPS) Visitor Services Project (VSP), part of the Park
Studies Unit at the University of Idaho.
The report is organized into four sections. The Methods section
discusses the procedures and limitations of the study. The Results section
provides summary information for each question in the questionnaire and includes
a summary of visitor comments. An Additional Analysis section is included to
help managers request additional analyses. The final section includes a copy of
the Questionnaire. The separate appendix includes comment summaries and
visitors' unedited comments.
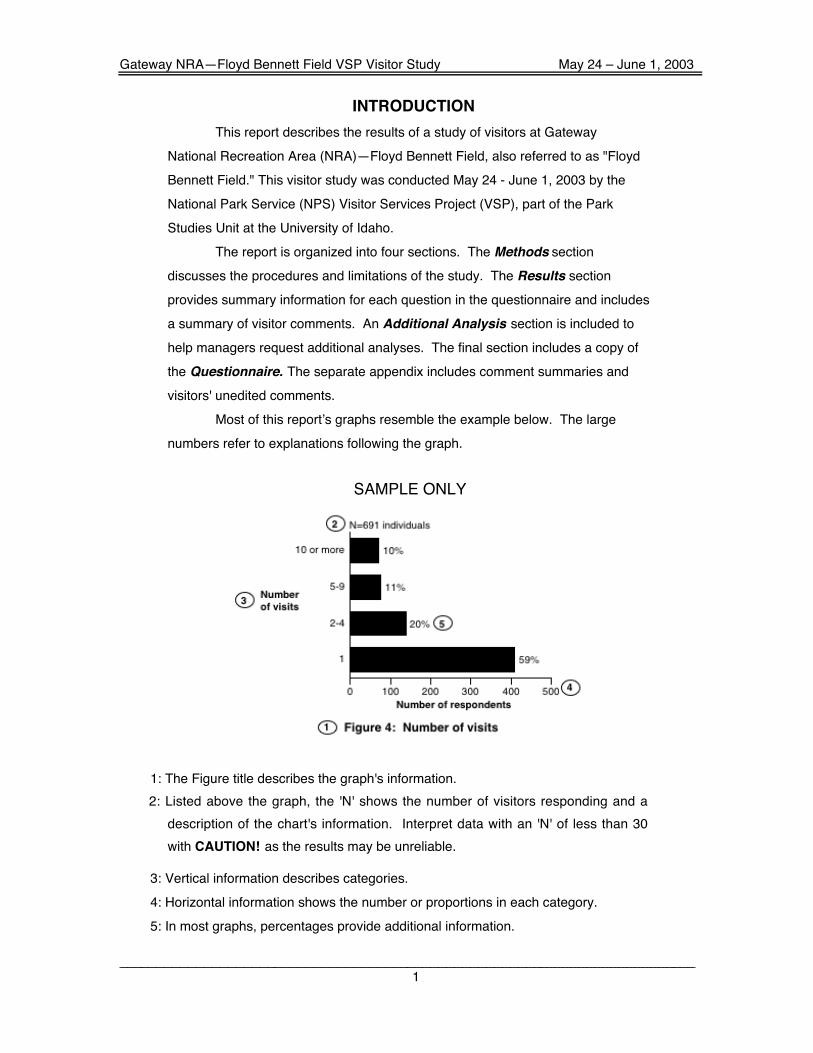
Most of this report!s graphs resemble the example below. The large
numbers refer to explanations following the graph.
SAMPLE ONLY
1: The Figure title describes the graph's information.
2: Listed above the graph, the 'N' shows the number of visitors responding and a
description of the chart's information. Interpret data with an 'N' of less than 30
with CAUTION! as the results may be unreliable.
3: Vertical information describes categories.
4: Horizontal information shows the number or proportions in each category.
5: In most graphs, percentages provide additional information.

Gateway NRA—Floyd Bennett Field VSP Visitor Study May 24 – June 1, 2003
2
METHODS
Questionnaire design and administration
The questionnaire for this visitor study was designed using a standard
format that has been developed in previous Visitor Services Project studies.
Some of the questions were comparable with VSP studies conducted at other
parks. Other questions were customized for Floyd Bennett Field. Interviews were
conducted with, and 857 questionnaires were distributed to a sample of visitors
who arrived at Floyd Bennett Field during the period from May 24 - June 1, 2003.
Visitors were sampled on the main road to Floyd Bennett Field, and along the
Rockaway Gateway Trail/greenway.
Visitor groups were greeted, briefly introduced to the purpose of the study,
and asked to participate. If visitors agreed, an interview, lasting approximately two
minutes was used to determine group size, group type, and the age of the adult
who would complete the questionnaire. These individuals were then given a
questionnaire and asked for their names, addresses and telephone numbers in
order to mail them a reminder-thank you postcard. Visitor groups were asked to
complete the questionnaire during or after their visit and then return it by mail.
Two weeks following the survey, a reminder-thank you postcard was
mailed to all participants. Replacement questionnaires were mailed to participants
who had not returned their questionnaires four weeks after the survey. Seven
weeks after the survey, second replacement questionnaires were mailed to
visitors who still had not returned their questionnaires. A phone follow-up call was
made to a random sample of non-respondents to ascertain why they had not
responded.
Data Analysis
Returned questionnaires were coded and the information was entered into
a computer using a standard statistical software package—Statistical Analysis
System (SAS). Frequency Distribution and cross-tabulations were calculated for
the coded data, and responses to open-ended questions were categorized and
summarized.
Gateway NRA—Floyd Bennett Field VSP Visitor Study May 24 – June 1, 2003
3
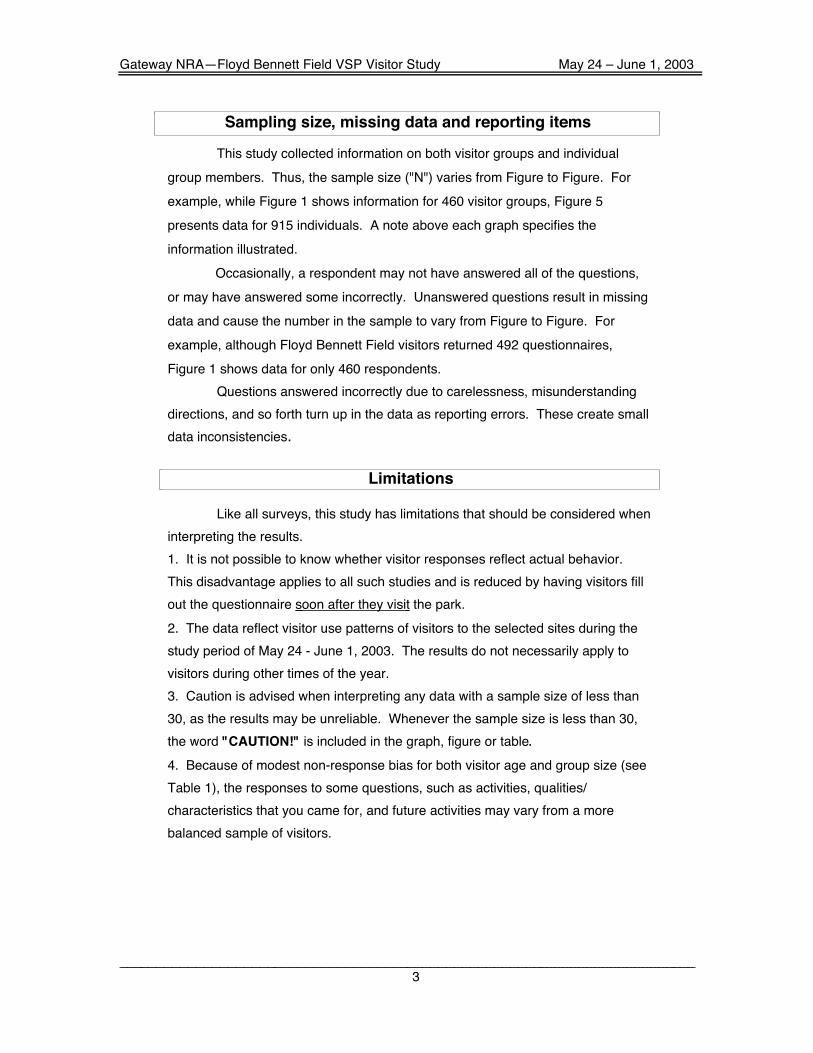
Sampling size, missing data and reporting items
This study collected information on both visitor groups and individual
group members. Thus, the sample size ("N") varies from Figure to Figure. For
example, while Figure 1 shows information for 460 visitor groups, Figure 5
presents data for 915 individuals. A note above each graph specifies the
information illustrated.
Occasionally, a respondent may not have answered all of the questions,
or may have answered some incorrectly. Unanswered questions result in missing
data and cause the number in the sample to vary from Figure to Figure. For
example, although Floyd Bennett Field visitors returned 492 questionnaires,
Figure 1 shows data for only 460 respondents.
Questions answered incorrectly due to carelessness, misunderstanding
directions, and so forth turn up in the data as reporting errors. These create small
data inconsistencies.
Limitations
Like all surveys, this study has limitations that should be considered when
interpreting the results.
1. It is not possible to know whether visitor responses reflect actual behavior.
This disadvantage applies to all such studies and is reduced by having visitors fill
out the questionnaire soon after they visit the park.
2. The data reflect visitor use patterns of visitors to the selected sites during the
study period of May 24 - June 1, 2003. The results do not necessarily apply to
visitors during other times of the year.
3. Caution is advised when interpreting any data with a sample size of less than
30, as the results may be unreliable. Whenever the sample size is less than 30,
the word "CAUTION!" is included in the graph, figure or table.
4. Because of modest non-response bias for both visitor age and group size (see
Table 1), the responses to some questions, such as activities, qualities/
characteristics that you came for, and future activities may vary from a more
balanced sample of visitors.

Gateway NRA—Floyd Bennett Field VSP Visitor Study May 24 – June 1, 2003
4
Special conditions
Weather conditions during the visitor study ranged from cloudy, rainy and
cold—temperatures of 50 degrees or below—(May 24-26 and June 1) to occasional
sunny and warmer days at Floyd Bennett Field (May 27-31). Occasional
thunderstorms passed through the area. The region was unseasonably rainy and
cool during the spring and early summer. The last U.S. departures of the Concorde
jet from JFK Airport took place during the study period.

Gateway NRA—Floyd Bennett Field VSP Visitor Study May 24 – June 1, 2003
5
RESULTS
Visitors contacted
At Floyd Bennett Field, 963 visitor groups were contacted; 857 of these
groups (89%) accepted questionnaires. Questionnaires were completed and
returned by 492 visitor groups, resulting in a 57.4% response rate for this study.
Table 1 compares age and group size information collected from the total
sample of visitors who participated, with age and group size of visitors who
actually returned questionnaires. Based on the variable of visitor group size, non-
response bias was judged to be insignificant. The average age of respondents
was somewhat older than the visitors who received questionnaires, so non-
response bias is judged to be somewhat significant. Older visitors returned their
questionnaires more frequently than younger visitors. Visitors who returned their
questionnaires also had slightly larger group sizes.
Table 1: Comparison of total sample andactual respondents
Variable Total sample Actualrespondents
N Avg. N Avg.
Age of respondents 834 48.2 460 51.6
Group size 843 1.8 460 3.1
Demographics
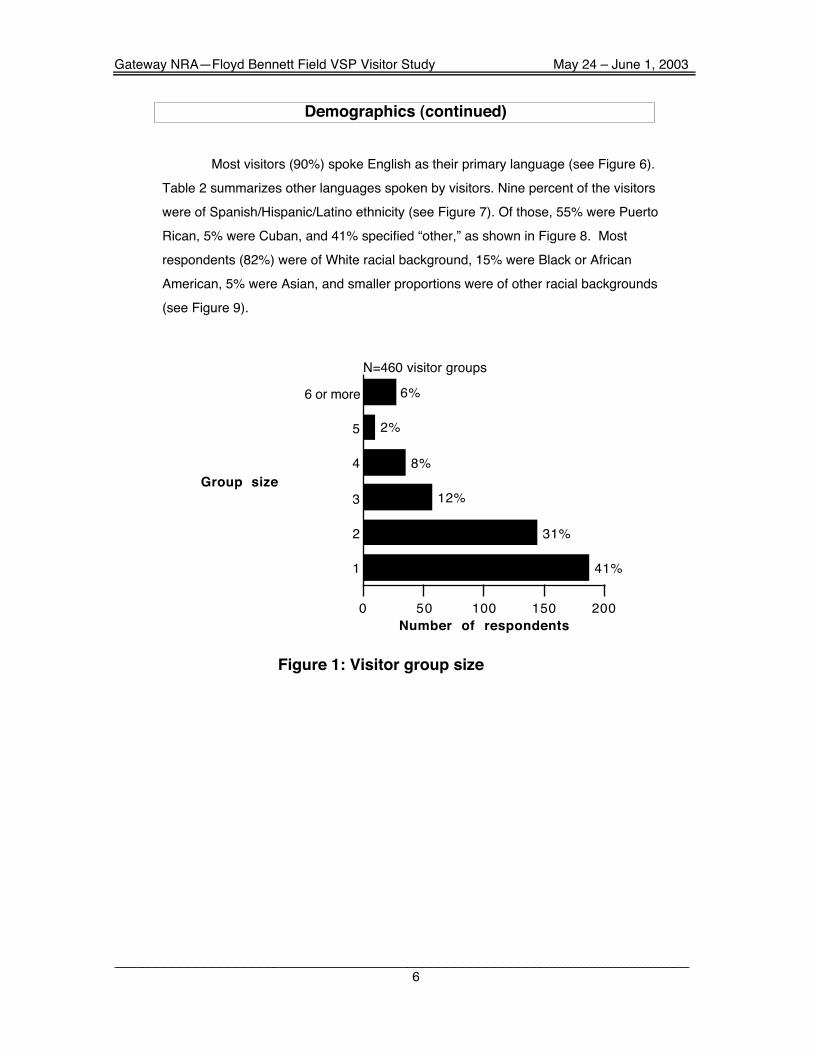
Figure 1 shows visitor group sizes, which ranged from one person to 200
people. Forty-one percent of visitors were traveling alone; thirty-one percent of
visitor groups consisted of two people, while another 20% consisted of three or four
people.
Twenty-four percent of visitor groups were made up of family members, 27%
were traveling alone, and 29% were with friends (see Figure 2). “Other” group types
included those traveling with model airplane club, fellow cyclists, wife, and gardening
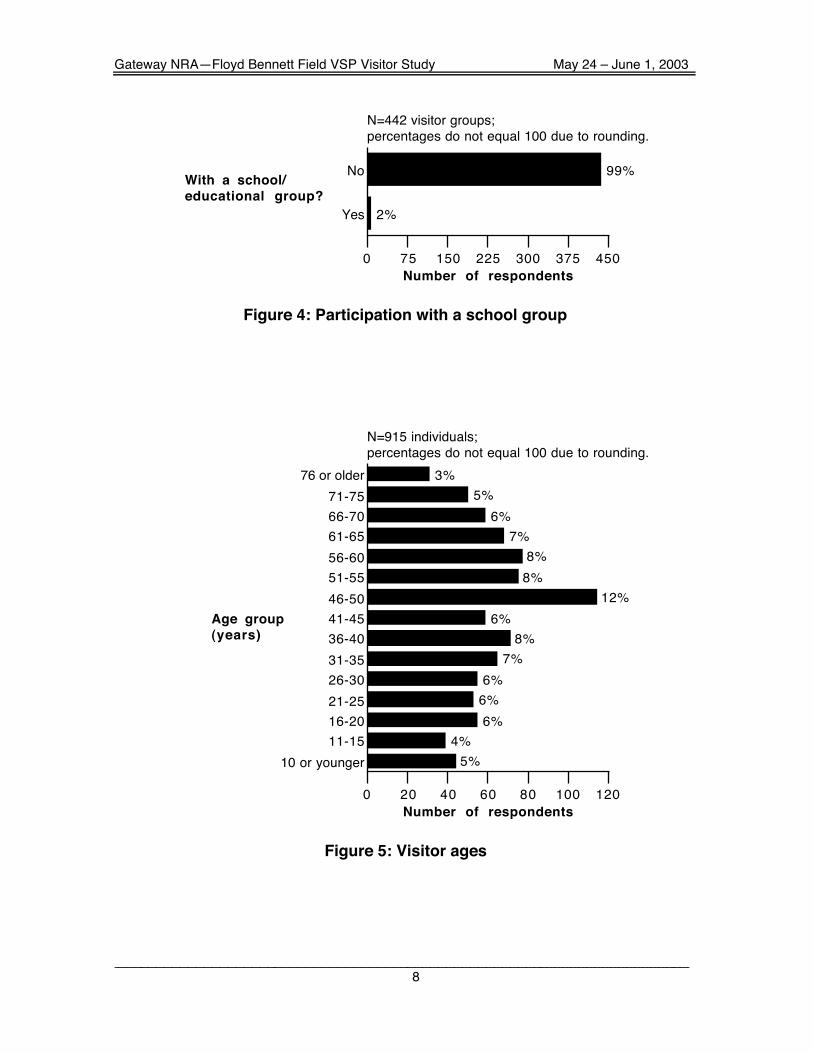
friends. Most respondents (99%) said they were not traveling with a school or
education group (see Figure 4). Thirty-five percent of the visitors were age group
46-65 years, and 11% were in the 66-75 year age group (see Figure 5). Children
who were 15 years and younger made up 10% of Floyd Bennett Field visitors.
Gateway NRA—Floyd Bennett Field VSP Visitor Study May 24 – June 1, 2003
6
Demographics (continued)
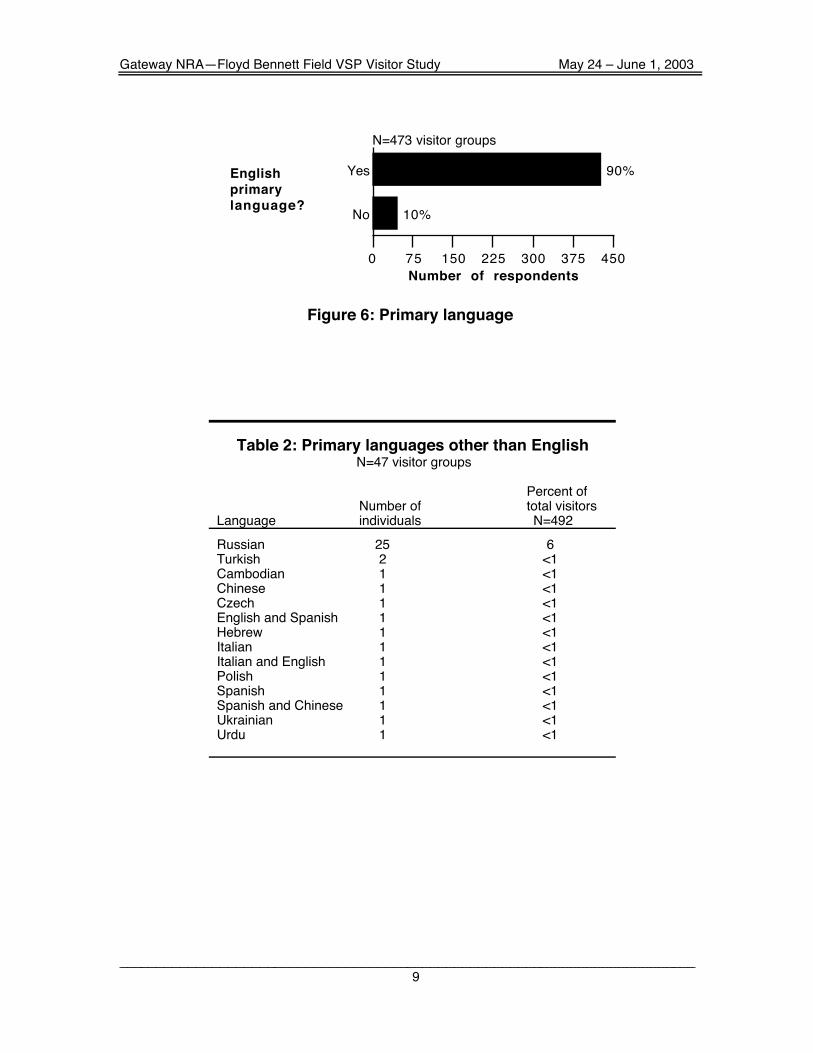
Most visitors (90%) spoke English as their primary language (see Figure 6).
Table 2 summarizes other languages spoken by visitors. Nine percent of the visitors
were of Spanish/Hispanic/Latino ethnicity (see Figure 7). Of those, 55% were Puerto
Rican, 5% were Cuban, and 41% specified “other,” as shown in Figure 8. Most
respondents (82%) were of White racial background, 15% were Black or African
American, 5% were Asian, and smaller proportions were of other racial backgrounds
(see Figure 9).
1
2
3
4
5
6 or more
41%
31%
12%
8%
2%
6%
0 50 100 150 200
Number of respondents
N=460 visitor groups
Group size
Figure 1: Visitor group size

Gateway NRA—Floyd Bennett Field VSP Visitor Study May 24 – June 1, 2003
7
Other
Family and friends
Family
Alone
Friends
5%
15%
24%
27%
29%
0 20 40 60 80 100 120 140
Number of respondents
N=464 visitor groups
Group type
Figure 2: Visitor group type
Yes
No
2%
98%
0 75 150 225 300 375 450
Number of respondents
N=443 visitor groups
With a guided
tour group?
Figure 3: Participation with a guided tour
Gateway NRA—Floyd Bennett Field VSP Visitor Study May 24 – June 1, 2003
8
Yes
No
2%
99%
0 75 150 225 300 375 450
Number of respondents
N=442 visitor groups;
percentages do not equal 100 due to rounding.
With a school/
educational group?
Figure 4: Participation with a school group
10 or younger
11-15
16-20
21-25
26-30
31-35
36-40
41-45
46-50
51-55
56-60
61-65
66-70
71-75
76 or older
5%
4%
6%
6%
6%
7%
8%
6%
12%
8%
8%
7%
6%
5%
3%
0 20 40 60 80 100 120
Number of respondents
N=915 individuals;
percentages do not equal 100 due to rounding.
Age group
(years)
Figure 5: Visitor ages
Gateway NRA—Floyd Bennett Field VSP Visitor Study May 24 – June 1, 2003
9
No
Yes
10%
90%
0 75 150 225 300 375 450
Number of respondents
N=473 visitor groups
English
primary
language?
Figure 6: Primary language
Table 2: Primary languages other than EnglishN=47 visitor groups
Percent ofNumber of total visitors
Language individuals N=492
Russian 25 6Turkish 2 <1Cambodian 1 <1Chinese 1 <1Czech 1 <1English and Spanish 1 <1Hebrew 1 <1Italian 1 <1Italian and English 1 <1Polish 1 <1Spanish 1 <1Spanish and Chinese 1 <1Ukrainian 1 <1Urdu 1 <1

Gateway NRA—Floyd Bennett Field VSP Visitor Study May 24 – June 1, 2003
10
Yes
No
9%
91%
0 75 150 225 300 375 450
Number of respondents
N=460 individuals
Spanish/Hispanic/
Latino?
Figure 7: Visitors of Spanish, Hispanic or Latino ethnicity
Other
Mexican
Cuban
Puerto Rican
41%
2%
5%
55%
0 5 10 15 20 25 30
Number of respondents
N=44 individuals;
percentages do not equal 100 because visitors
could be of more than one background.
Spanish/Hispanic/
Latino?
Figure 8: Spanish/Hispanic/Latino ethnicities

Gateway NRA—Floyd Bennett Field VSP Visitor Study May 24 – June 1, 2003
11
American Indian/Alaska Native
Native Hawaiian/other Pacific Islander
Asian
Black/African American
White
1%
1%
5%
15%
82%
0 100 200 300 400
Number of respondents
N=434 individuals;
percentages do not equal 100 because
visitors could be of more than one race.
Race
Figure 9: Visitor race
Demographics (continued)
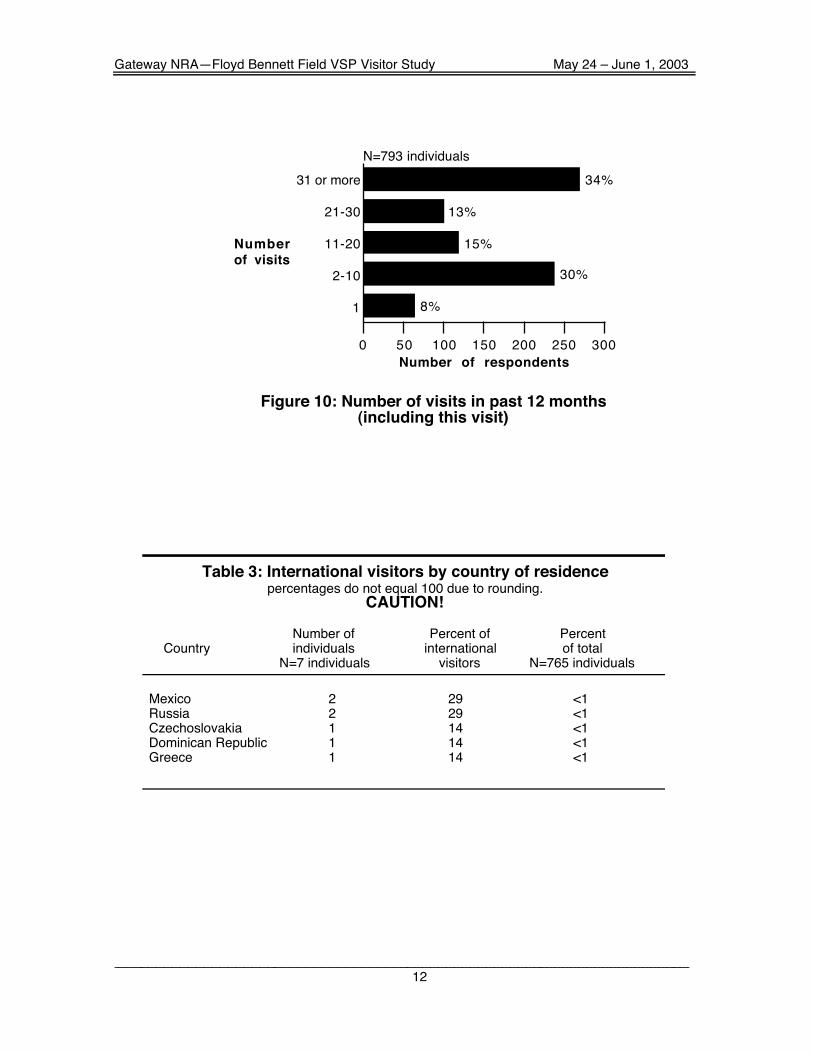
Visitors reported on the number of times each group member had visited
Floyd Bennett Field in the past 12 months. Thirty-four percent of visitors had
visited 31 times or more (see Figure 10). Thirty percent had visited two to ten
times: 8% of visitors reported that this was their first visit to Floyd Bennett Field in
the past 12 months.
Because international visitors represented only one percent of visitation to
Floyd Bennett Field (see Table 3 with caution). The largest proportions of United
States visitors were from New York (96%), Puerto Rico (1%), and New Jersey
(1%). Smaller proportions of U.S. visitors came from another 4 states (see Map 1
and Table 4).
Gateway NRA—Floyd Bennett Field VSP Visitor Study May 24 – June 1, 2003
12
1
2-10
11-20
21-30
31 or more
8%
30%
15%
13%
34%
0 50 100 150 200 250 300
Number of respondents
N=793 individuals
Number
of visits
Figure 10: Number of visits in past 12 months(including this visit)
Table 3: International visitors by country of residencepercentages do not equal 100 due to rounding.
CAUTION!
Number of Percent of PercentCountry individuals international of total
N=7 individuals visitors N=765 individuals
Mexico 2 29 <1Russia 2 29 <1Czechoslovakia 1 14 <1Dominican Republic 1 14 <1Greece 1 14 <1

Gateway NRA—Floyd Bennett Field VSP Visitor Study May 24 – June 1, 2003
13
Map 1: Proportion of United States visitors by state of residence
Table 4: United States visitors by state of residence
Number of Percent of Percent ofindividuals U.S. visitors total visitors
State N= 758 individuals N=765 individuals
New York 731 96 96New Jersey 10 1 <1Puerto Rico 8 1 <1Pennsylvania 3 <1 <1Florida 2 <1 <1California 1 <1 <1Connecticut 1 <1 <1

Gateway NRA—Floyd Bennett Field VSP Visitor Study May 24 – June 1, 2003
14
Length of visit
Thirty-five percent of visitor groups spent 5 or more hours at Floyd
Bennett Field on the visit when they received the questionnaire. Another 16%
responded that they spent three hours (see Figure 11), and 23% spent 2 hours.
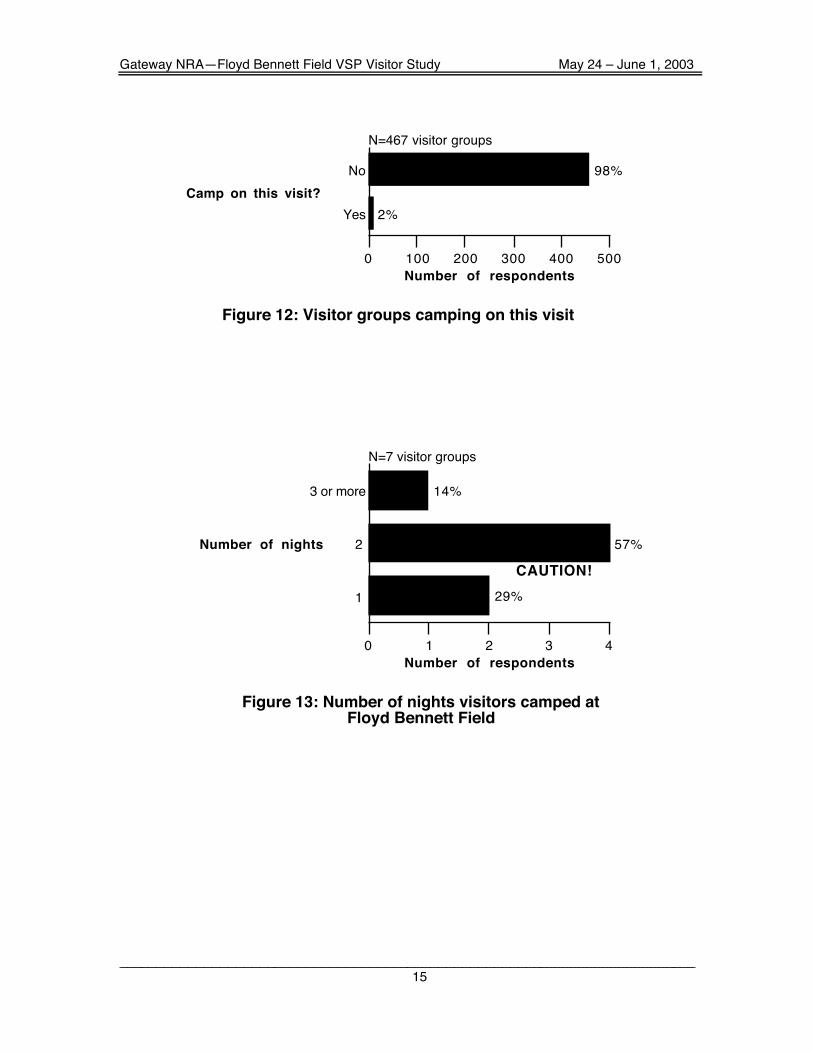
Visitors were asked if they were camping at Floyd Bennett Field on this
visit. Two percent were camping and 98% were not (see Figure 12). Of those
camping, 29% camped for one day, 57% camped for 2 days, and 14% reported
camping three nights or more (see Figure 13).
<1
1
2
3
4
5 or more
1%
11%
23%
16%
15%
35%
0 20 40 60 80 100 120
Number of respondents
N=324 visitor groups;
percentages do not equal 100 because visitor
groups could plan to use more than one source.
Hours spent
Figure 11: Hours spent at Floyd Bennett Field on this visit
Gateway NRA—Floyd Bennett Field VSP Visitor Study May 24 – June 1, 2003
15
Yes
No
2%
98%
0 100 200 300 400 500
Number of respondents
N=467 visitor groups
Camp on this visit?
Figure 12: Visitor groups camping on this visit
1
2
3 or more
29%
57%
14%
0 1 2 3 4
Number of respondents
N=7 visitor groups
Number of nights
CAUTION!
Figure 13: Number of nights visitors camped atFloyd Bennett Field
Gateway NRA—Floyd Bennett Field VSP Visitor Study May 24 – June 1, 2003
16
Sources of information
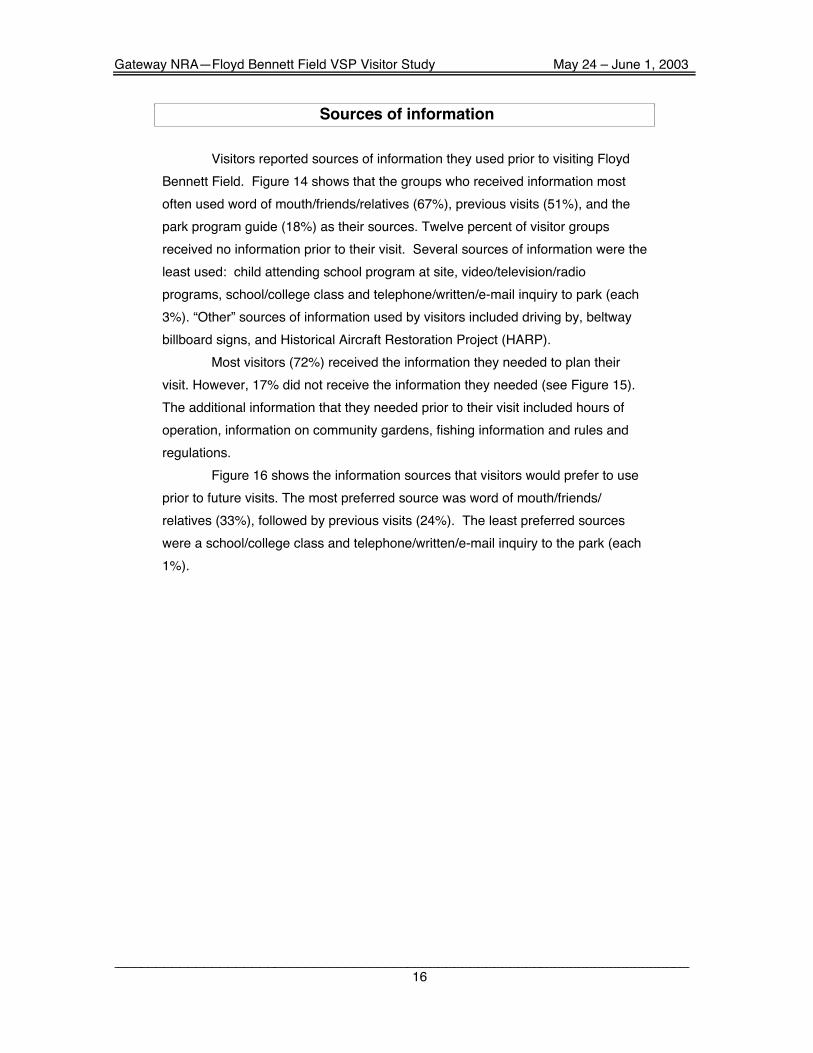
Visitors reported sources of information they used prior to visiting Floyd
Bennett Field. Figure 14 shows that the groups who received information most
often used word of mouth/friends/relatives (67%), previous visits (51%), and the
park program guide (18%) as their sources. Twelve percent of visitor groups
received no information prior to their visit. Several sources of information were the
least used: child attending school program at site, video/television/radio
programs, school/college class and telephone/written/e-mail inquiry to park (each
3%). “Other” sources of information used by visitors included driving by, beltway
billboard signs, and Historical Aircraft Restoration Project (HARP).
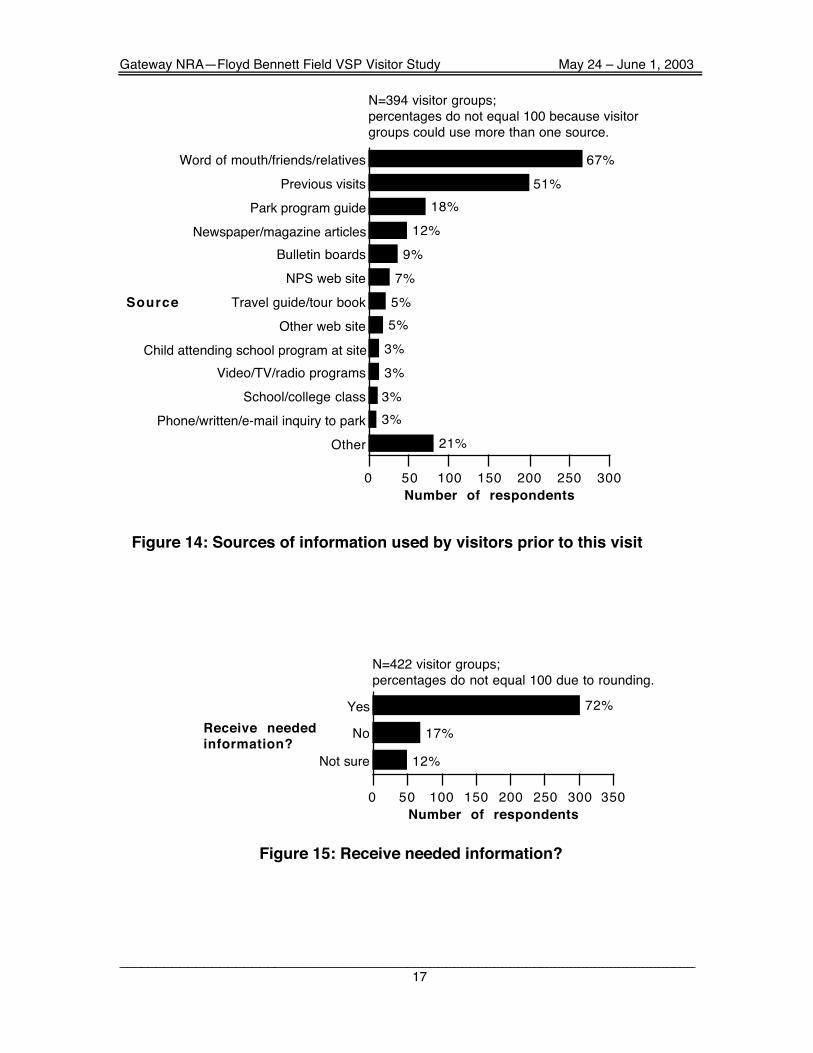
Most visitors (72%) received the information they needed to plan their
visit. However, 17% did not receive the information they needed (see Figure 15).
The additional information that they needed prior to their visit included hours of
operation, information on community gardens, fishing information and rules and
regulations.
Figure 16 shows the information sources that visitors would prefer to use
prior to future visits. The most preferred source was word of mouth/friends/
relatives (33%), followed by previous visits (24%). The least preferred sources
were a school/college class and telephone/written/e-mail inquiry to the park (each
1%).
Gateway NRA—Floyd Bennett Field VSP Visitor Study May 24 – June 1, 2003
17
Other
Phone/written/e-mail inquiry to park
School/college class
Video/TV/radio programs
Child attending school program at site
Other web site
Travel guide/tour book
NPS web site
Bulletin boards
Newspaper/magazine articles
Park program guide
Previous visits
Word of mouth/friends/relatives
21%
3%
3%
3%
3%
5%
5%
7%
9%
12%
18%
51%
67%
0 50 100 150 200 250 300
Number of respondents
N=394 visitor groups;
percentages do not equal 100 because visitor
groups could use more than one source.
Source
Figure 14: Sources of information used by visitors prior to this visit
Not sure
No
Yes
12%
17%
72%
0 50 100 150 200 250 300 350
Number of respondents
N=422 visitor groups;
percentages do not equal 100 due to rounding.
Receive needed
information?
Figure 15: Receive needed information?

Gateway NRA—Floyd Bennett Field VSP Visitor Study May 24 – June 1, 2003
18
Other
Phone/written/e-mail inquiry to park
School/college class
Video/TV/radio program
Child attending school program at site
Other web site
Travelguides/tour books
NPS web site
Bulletin boards
Newspaper/magazine articles
Park program guide
Previous visits
Word of mouth/friends/relatives
10%
1%
1%
2%
2%
2%
3%
3%
5%
6%
9%
24%
33%
0 50 100 150 200 250 300
Number of respondents
N=813 visitor groups;
percentages do not equal 100 due to rounding.
Source
Figure 16: Sources of information prior to future visits
Gateway NRA—Floyd Bennett Field VSP Visitor Study May 24 – June 1, 2003
19
Awareness of site management by National Park Service
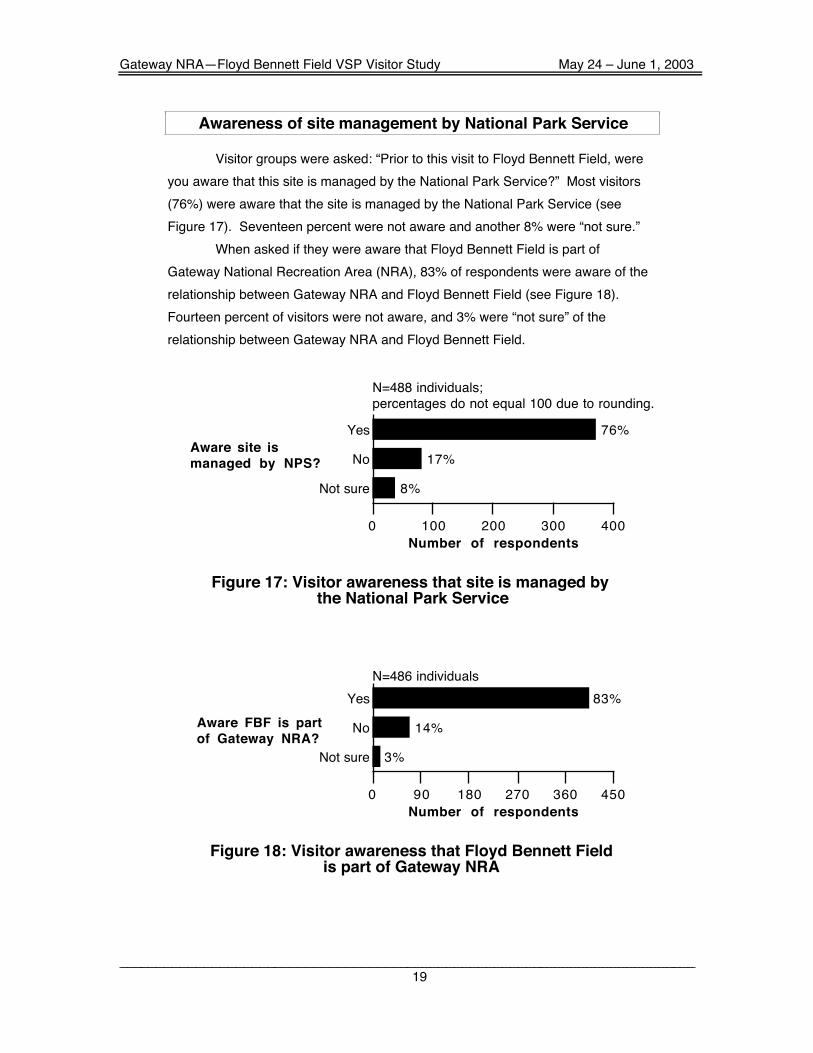
Visitor groups were asked: “Prior to this visit to Floyd Bennett Field, were
you aware that this site is managed by the National Park Service?” Most visitors
(76%) were aware that the site is managed by the National Park Service (see
Figure 17). Seventeen percent were not aware and another 8% were “not sure.”
When asked if they were aware that Floyd Bennett Field is part of
Gateway National Recreation Area (NRA), 83% of respondents were aware of the
relationship between Gateway NRA and Floyd Bennett Field (see Figure 18).
Fourteen percent of visitors were not aware, and 3% were “not sure” of the
relationship between Gateway NRA and Floyd Bennett Field.
Not sure
No
Yes
8%
17%
76%
0 100 200 300 400
Number of respondents
N=488 individuals;
percentages do not equal 100 due to rounding.
Aware site is
managed by NPS?
Figure 17: Visitor awareness that site is managed by the National Park Service
Not sure
No
Yes
3%
14%
83%
0 90 180 270 360 450
Number of respondents
N=486 individuals
Aware FBF is part
of Gateway NRA?
Figure 18: Visitor awareness that Floyd Bennett Fieldis part of Gateway NRA
Gateway NRA—Floyd Bennett Field VSP Visitor Study May 24 – June 1, 2003
20
Visits to other National Park Service units
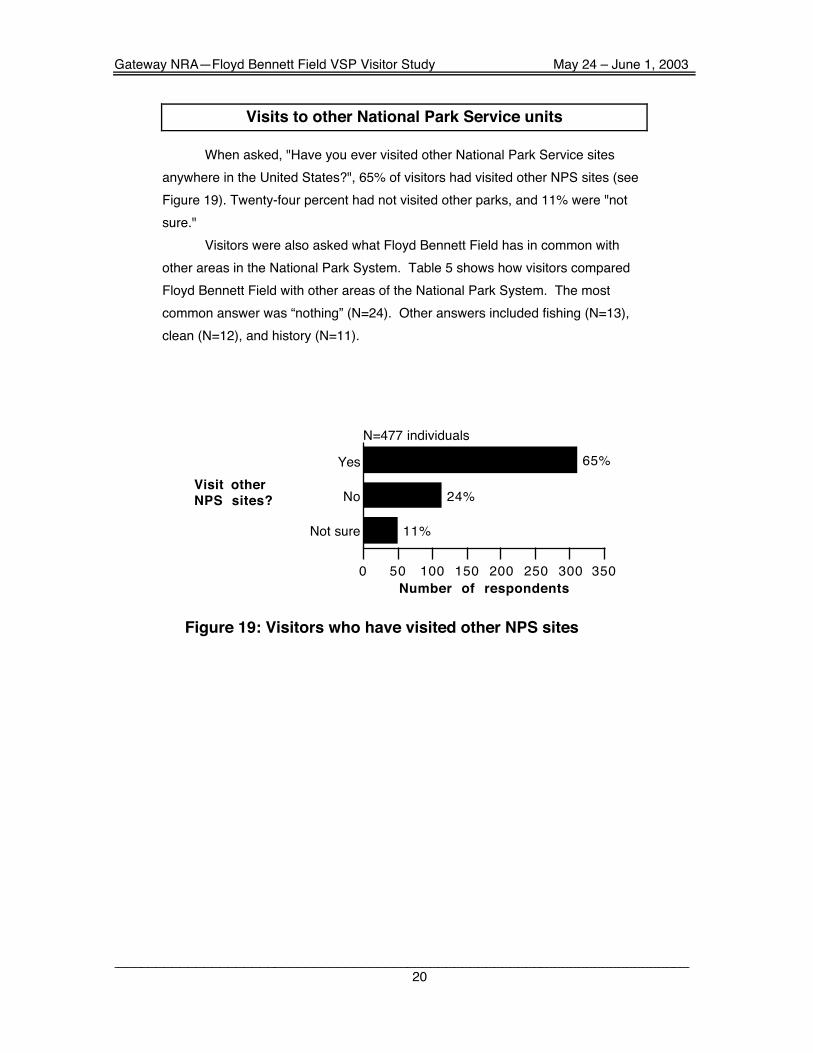
When asked, "Have you ever visited other National Park Service sites
anywhere in the United States?", 65% of visitors had visited other NPS sites (see
Figure 19). Twenty-four percent had not visited other parks, and 11% were "not
sure."
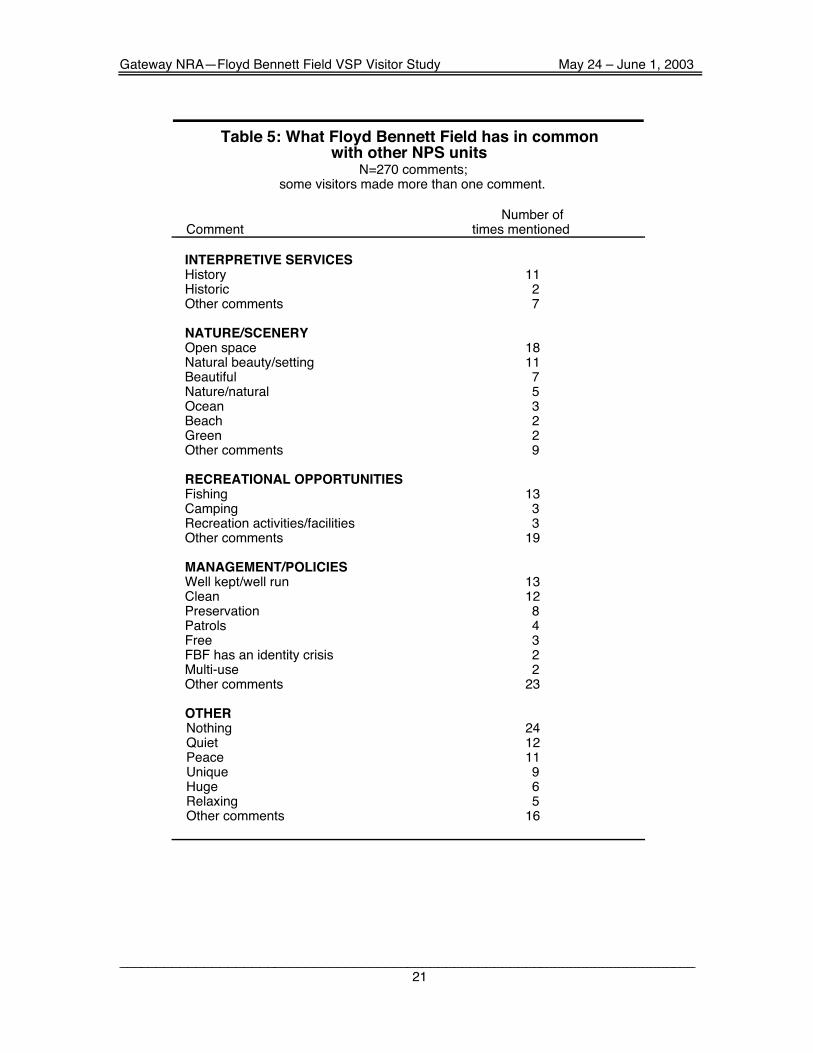
Visitors were also asked what Floyd Bennett Field has in common with
other areas in the National Park System. Table 5 shows how visitors compared
Floyd Bennett Field with other areas of the National Park System. The most
common answer was “nothing” (N=24). Other answers included fishing (N=13),
clean (N=12), and history (N=11).
Not sure
No
Yes
11%
24%
65%
0 50 100 150 200 250 300 350
Number of respondents
N=477 individuals
Visit other
NPS sites?
Figure 19: Visitors who have visited other NPS sites
Gateway NRA—Floyd Bennett Field VSP Visitor Study May 24 – June 1, 2003
21
Table 5: What Floyd Bennett Field has in commonwith other NPS units
N=270 comments;some visitors made more than one comment.
Number ofComment times mentioned
INTERPRETIVE SERVICESHistory 11Historic 2Other comments 7
NATURE/SCENERYOpen space 18Natural beauty/setting 11Beautiful 7Nature/natural 5Ocean 3Beach 2Green 2Other comments 9
RECREATIONAL OPPORTUNITIESFishing 13Camping 3Recreation activities/facilities 3Other comments 19
MANAGEMENT/POLICIESWell kept/well run 13Clean 12Preservation 8Patrols 4Free 3FBF has an identity crisis 2Multi-use 2Other comments 23
OTHERNothing 24Quiet 12Peace 11Unique 9Huge 6Relaxing 5Other comments 16

Gateway NRA—Floyd Bennett Field VSP Visitor Study May 24 – June 1, 2003
22
Visit characteristics
Responding to the question, “How often do you visit Floyd Bennett Field,”
53% of visitors said "at least once a week" (see Figure 20). Another 21% reported
daily visits, and 16% reported "at least once a month." Most visitors (76%) visit
the area on both weekends and weekdays, while 13% usually visit on weekends
(see Figure 21).
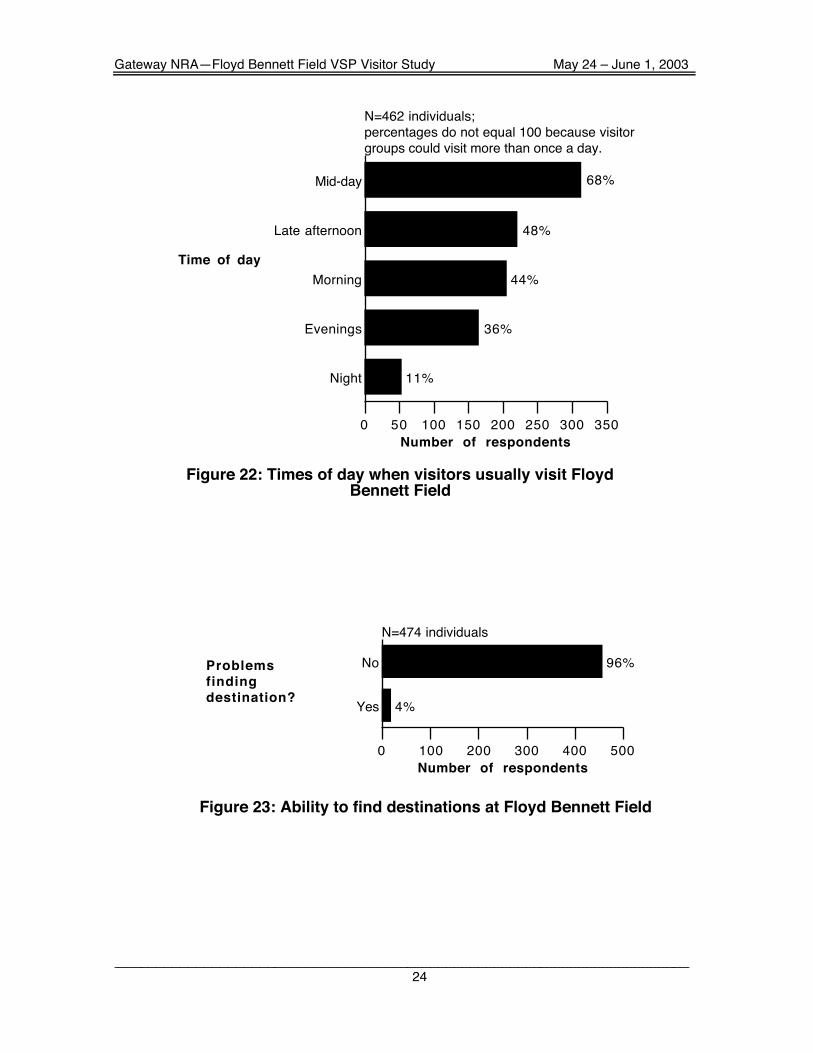
Visitors were also asked to list the time of day they usually visit Floyd
Bennett Field, using the following time periods.
Mornings (sunrise to 10 a.m.)Mid-day (10 a.m. to 2 p.m.)Late afternoon (2 p.m. to 6 p.m.)Evenings (6 p.m. to sunset)Night (sunset to sunrise)
Sixty-eight percent said they usually visit during mid-day (10 a.m. to 2 p.m.), as
shown in Figure 22. Almost one-half of visitors usually visit in late afternoon (2
p.m. to 6 p.m.) and 36% usually visit during the evening between 6 p.m. and
sunset.
Most visitors (96%) did not have problems in finding their destinations
while visiting Floyd Bennett Field (see Figure 23). However, 4% of those who
responded did have difficulty locating their destination at the Floyd Bennett Field.
The areas most difficult to find included: Hanger B, fishing areas, and model
airplane field.

Gateway NRA—Floyd Bennett Field VSP Visitor Study May 24 – June 1, 2003
23
First visit
At least once a year
At least once a month
Daily
At least once a week
4%
5%
16%
21%
53%
0 50 100 150 200 250
Number of respondents
N=460 individuals;
percentages do not equal 100 due to rounding.
Frequency
of visits
Figure 20: Frequency of visits by Floyd Bennett Field visitors
Weekdays
Weekends
Both weekdays & weekends
12%
13%
76%
0 50 100 150 200 250 300 350
Number of respondents
N=442 individuals;
percentages do not equal 100 due to rounding.
Days
of visit
Figure 21: Usual days of visits to Floyd Bennett Field
Gateway NRA—Floyd Bennett Field VSP Visitor Study May 24 – June 1, 2003
24
0 50 100 150 200 250 300 350
Number of respondents
Night
Evenings
Morning
Late afternoon
Mid-day
11%
36%
44%
48%
68%
N=462 individuals;
percentages do not equal 100 because visitor
groups could visit more than once a day.
Time of day
Figure 22: Times of day when visitors usually visit FloydBennett Field
Yes
No
4%
96%
0 100 200 300 400 500
Number of respondents
N=474 individuals
Problems
finding
destination?
Figure 23: Ability to find destinations at Floyd Bennett Field
Gateway NRA—Floyd Bennett Field VSP Visitor Study May 24 – June 1, 2003
25
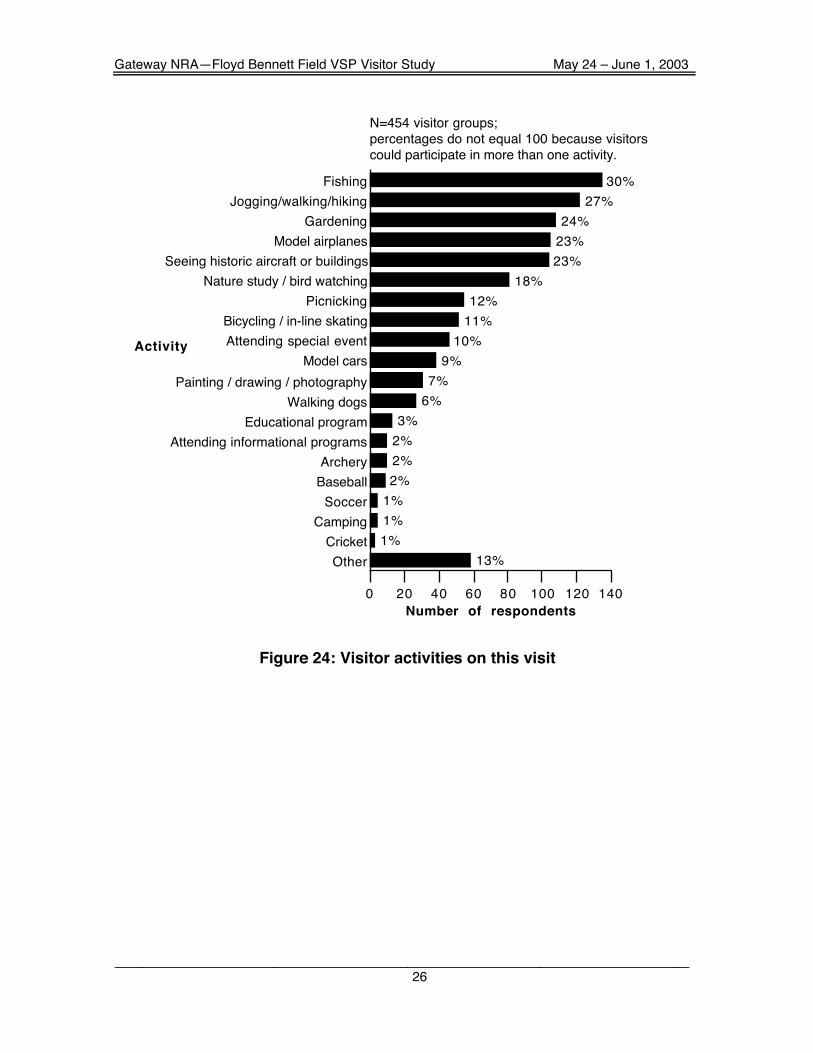
Activities
Figure 24 shows common activities that groups reported participating in
during this visit to Floyd Bennett Field. The most common activities reported
included fishing (30%), jogging/walking/hiking (27%) and model airplanes (23%).
"Other" activities included training student driver, bicycle racing, serving as HARP
volunteer, meditating, and observing activities.
Visitors were asked to choose the activity that was the main reason for this
visit from a list of activities. Twenty-three percent of visitors reported gardening,
22% percent said fishing, and 17% responded model airplanes (see Figure 25).
The most common activities on past visits included seeing historical
aircraft or buildings (40%), jogging/walking/hiking (38%), fishing (37%), and nature
study/bird watching (27%), as shown in Figure 26.
Visitors were asked, “Prior to this visit to Floyd Bennett Field, were you
aware of the availability of information about which fish are safe to eat (official
health warnings about safe/unsafe quantities of local fish to eat)?” Fifty-one
percent were not aware of the safety information regarding eating local fish (see
Figure 27). Thirty-seven percent were aware of the information and 12% were
"not sure."
Gateway NRA—Floyd Bennett Field VSP Visitor Study May 24 – June 1, 2003
26
Other
Cricket
Camping
Soccer
Baseball
Archery
Attending informational programs
Educational program
Walking dogs
Painting / drawing / photography
Model cars
Attending special event
Bicycling / in-line skating
Picnicking
Nature study / bird watching
Seeing historic aircraft or buildings
Model airplanes
Gardening
Jogging/walking/hiking
Fishing
13%
1%
1%
1%
2%
2%
2%
3%
6%
7%
9%
10%
11%
12%
18%
23%
23%
24%
27%
30%
0 20 40 60 80 100 120 140
Number of respondents
N=454 visitor groups;
percentages do not equal 100 because visitors
could participate in more than one activity.
Activity
Figure 24: Visitor activities on this visit

Gateway NRA—Floyd Bennett Field VSP Visitor Study May 24 – June 1, 2003
27
Other
Camping
Archery
Painting
Attending special event
Model cars
Picknicking
Walking dogs
Bicycling
Nature study
Learning history
Jogging
Model airplanes
Fishing
Gardening
9%
<1%
<1%
<1%
<1%
2%
2%
2%
3%
5%
6%
6%
17%
22%
23%
0 10 20 30 40 50 60
Number of respondents
N=260 visitor groups;
percentages do not equal 100 due to rounding.
Activity
Figure 25: Activity that was the main reason for this visit toFloyd Bennett Field

Gateway NRA—Floyd Bennett Field VSP Visitor Study May 24 – June 1, 2003
28
Other
Cricket
Soccer
Baseball
Archery
Camping
Educational program
Walking dogs
Attending informational programs
Painting/drawing/photography
Model cars
Bicycling/in-line skating
Gardening
Picnicking
Model airplanes
Attending special event
Nature study/bird watching
Fishing
Jogging/walking/hiking
Seeing historic aircraft or buildings
12%
1%
2%
2%
3%
4%
7%
7%
9%
10%
11%
17%
18%
20%
24%
26%
27%
37%
38%
40%
0 20 40 60 80 100 120 140
Number of respondents
N=328 visitor groups;
percentages do not equal 100 because visitor
groups could participate in more than one activity.
Activity
Figure 26: Visitor activities on past visits
Not sure
Yes
No
12%
37%
51%
0 50 100 150 200 250
Number of respondents
N=459 visitor groups
Aware of availability of
fish safety information?
Figure 27: Visitor awareness of availability of fishsafety information

Gateway NRA—Floyd Bennett Field VSP Visitor Study May 24 – June 1, 2003
29
Form of transportation and sites visited
Most visitors (95%) used a private vehicle as the form of transportation
used to travel to Floyd Bennett Field (see Figure 28). Other forms of
transportation used by visitors included bicycle (4%), and motorcycle (4%). No
visitors used a taxi service to travel to the Floyd Bennett Field. "Other" forms of
transportation included a car and hobby car.
Other
Taxi
Bus/subway
Foot
Motorcycle
Bicycle
Private vehicle
<1%
0%
1%
1%
4%
4%
95%
0 100 200 300 400 500
Number of respondents
N=484 individuals;
percentages do not equal 100 because visitors
could use more than one form of transport.
Transportation
Figure 28: Forms of transportation visitors used to get toFloyd Bennett Field

Gateway NRA—Floyd Bennett Field VSP Visitor Study May 24 – June 1, 2003
30
Visitors were asked what sites they visited while at Floyd Bennett Field
during this visit (see map on following page). Figure 29 shows that the most
commonly visited sites were the model airplane field (43%), community garden
(36%), and seaplane ramp fishing (29%). The least visited area was the Gateway
Environmental Study Center (2%).
Other
Gateway Environmental Study Center
Public campgrounds
Ecology Village campground
Sports fields
Permit bldg at entrance to field
Archery range
North 40 trails
Dead Horse Bay
Model car field
Ryan Visitor Center
Hangar B aviation exhibit
Raptor Point
Aviation road fishing
Seaplane ramp fishing
Community garden
Model airplane field
8%
2%
3%
3%
4%
7%
8%
8%
13%
20%
20%
20%
24%
25%
29%
36%
43%
0 50 100 150 200 250
Number of respondents
N=480 individuals;
percentages do not equal 100 because visitor
groups could visit more than one place.
Si te
Figure 29: Sites visited while at Floyd Bennett Field

Gateway NRA—Floyd Bennett Field VSP Visitor Study May 24 – June 1, 2003
31

Gateway NRA—Floyd Bennett Field VSP Visitor Study May 24 – June 1, 2003
32
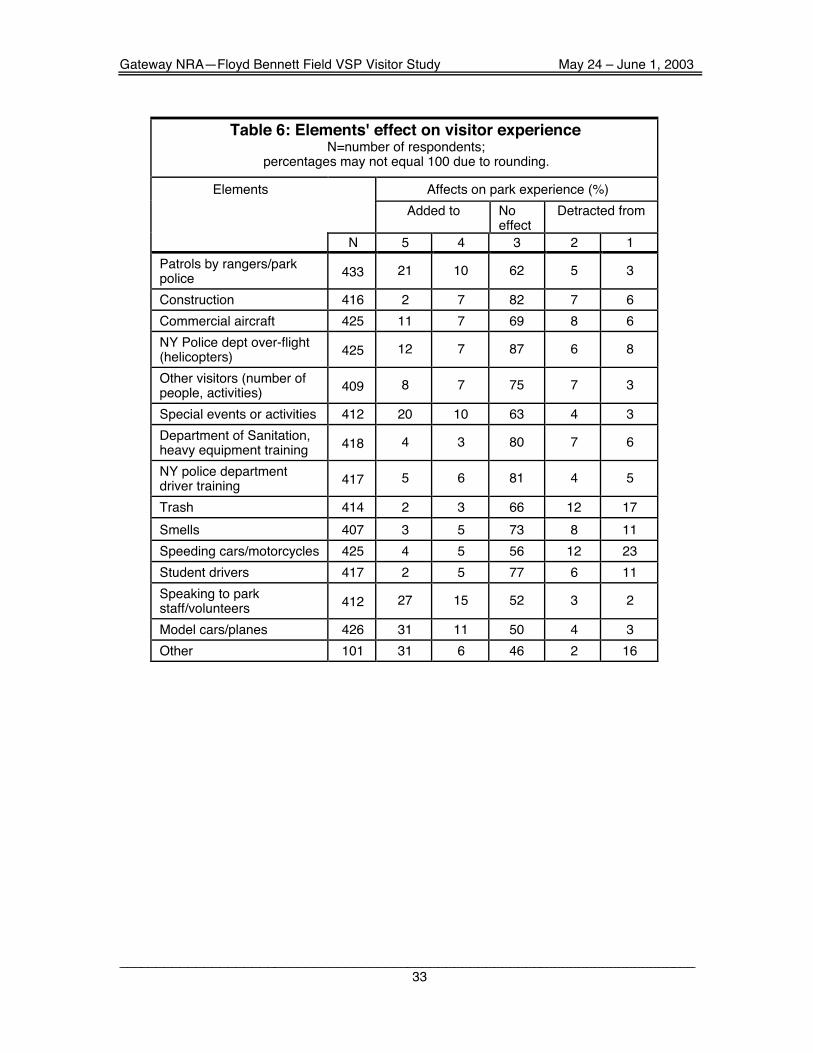
Selected factors' effect on park visitors
Visitors were asked to rate how selected factors may have affected their
visit to Floyd Bennett Field using a scale of 1 to 5, (1 or 2=detracted from, 3=no
effect, and 4 or 5=added to), The factors that most often had “no effect” on visitor
experience were New York police department helicopter overflight (87%),
construction (82%), and New York Department of sanitation heavy equipment
training (80%), as shown in Table 6. The factors receiving the highest proportion
of “added to” ratings included model airplanes and cars (42%), speaking to park
staff/volunteers (42%), “other” (37%), and patrols by park rangers/park police
(31%). The factors that received the highest proportion of “detracted from” ratings
were speeding cars/motorcycles (35%), trash (29%), and smells (19%). “Other”
factors that visitors listed included: fishing, gardens and HARP.
Visitors who rated factors effecting their park experience as “1” or “2”
(detracted from) were asked to explain how that element detracted from their
experience. The comments from 198 visitor groups are summarized in Table 7.
Gateway NRA—Floyd Bennett Field VSP Visitor Study May 24 – June 1, 2003
33
Table 6: Elements' effect on visitor experienceN=number of respondents;
percentages may not equal 100 due to rounding.
Affects on park experience (%)
Added to Noeffect
Detracted from
Elements
N 5 4 3 2 1
Patrols by rangers/parkpolice
433 21 10 62 5 3
Construction 416 2 7 82 7 6
Commercial aircraft 425 11 7 69 8 6
NY Police dept over-flight(helicopters)
425 12 7 87 6 8
Other visitors (number ofpeople, activities)
409 8 7 75 7 3
Special events or activities 412 20 10 63 4 3
Department of Sanitation,heavy equipment training
418 4 3 80 7 6
NY police departmentdriver training
417 5 6 81 4 5
Trash 414 2 3 66 12 17
Smells 407 3 5 73 8 11
Speeding cars/motorcycles 425 4 5 56 12 23
Student drivers 417 2 5 77 6 11
Speaking to parkstaff/volunteers
412 27 15 52 3 2
Model cars/planes 426 31 11 50 4 3
Other 101 31 6 46 2 16

Gateway NRA—Floyd Bennett Field VSP Visitor Study May 24 – June 1, 2003
34
Table 7: How elements detracted from park visitN=210 comments;
some visitors made more than one comment.Number of
Comment times mentioned
PERSONNELNeed more rangers 5Other comment 1
MAINTENANCE & FACILITIESToo much trash 36Smells 12Dirty 6Need trash cans 3Dirty restrooms 2Odors from compost 2Not enough restrooms 2Other comments 6
MANAGEMENT/POLICIESNo enforcement of regulations 7NYC police taking too much space 4Special events block access 3Department of sanitation training takes space 3Other comments 4
GENERALSpeeding 50Noise 25Motorcycles 10Helicopter noise 9Dangerous (cars/motorcycles) 4Model airplane noise 4Helicopters interfering with RC field 3Traffic 3Ranger road closed 2Crowded 2Other comments 2

Gateway NRA—Floyd Bennett Field VSP Visitor Study May 24 – June 1, 2003
35
Importance of visitor services and facilities
The National Park Service would like to improve or expand visitor services
and facilities at Floyd Bennett Field. Visitors were asked to rate how important
twenty specific visitor services and facilities were to them. The following scale
was used in the questionnaire:
IMPORTANCE5=extremely important
4=very important3=moderately important2=somewhat important
1=not importantDK= don!t know
Figures 30-49 show how visitors rated specific services and facilities in
terms of possible future improvements or expansion at Floyd Bennett Field. The
highest ratings of “very important” and “extremely important” were for restrooms
(83%), trash cans (82%) and ranger/park police presence (64%).
Figure 50 shows the combined "extremely important" and "very important"
ratings for all of the services/facilities.
Don't know
Not important
Somewhat important
Moderately important
Very important
Extremely important
1%
5%
9%
21%
31%
33%
0 32 64 96 128 160
Number of respondents
N=462 individuals
Rating
Figure 30: Importance of availablity of drinking water

Gateway NRA—Floyd Bennett Field VSP Visitor Study May 24 – June 1, 2003
36
Don't know
Not important
Somewhat important
Moderately important
Very important
Extrememly important
<1%
24%
19%
30%
15%
11%
0 20 40 60 80 100 120 140
Number of respondents
N=445 individuals;
percentages do not equal 100 due to rounding.
Rating
Figure 31: Importance of availability of food
Don't know
Not important
Somewhat important
Moderately important
Very important
Extremely important
1%
13%
13%
28%
25%
21%
0 20 40 60 80 100 120
Number of respondents
N=432 individuals;
percentages do not equal 100 due to rounding.
Rating
Figure 32: Importance of benches/seating areas
Gateway NRA—Floyd Bennett Field VSP Visitor Study May 24 – June 1, 2003
37
Don't know
Not important
Somewhat important
Moderately important
Very important
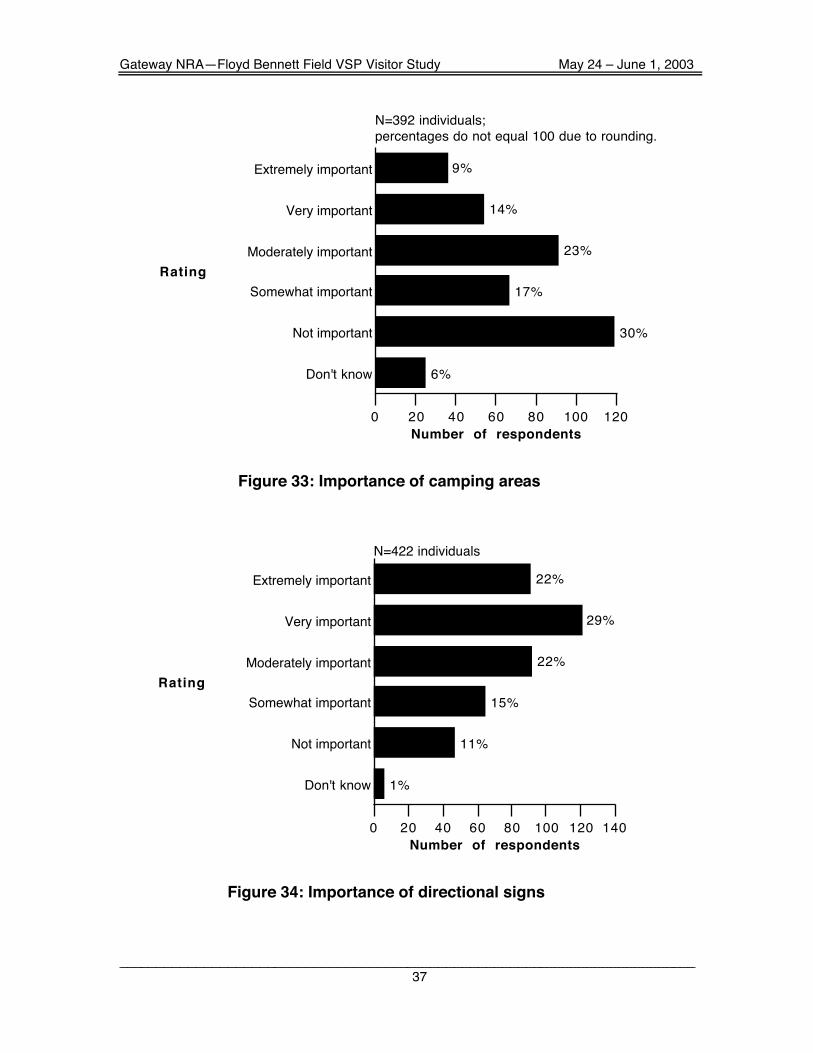
Extremely important
6%
30%
17%
23%
14%
9%
0 20 40 60 80 100 120
Number of respondents
N=392 individuals;
percentages do not equal 100 due to rounding.
Rating
Figure 33: Importance of camping areas
Don't know
Not important
Somewhat important
Moderately important
Very important
Extremely important
1%
11%
15%
22%
29%
22%
0 20 40 60 80 100 120 140
Number of respondents
N=422 individuals
Rating
Figure 34: Importance of directional signs

Gateway NRA—Floyd Bennett Field VSP Visitor Study May 24 – June 1, 2003
38
Don't know
Not important
Somewhat important
Moderately important
Very important
Extremely important
2%
14%
14%
34%
23%
13%
0 25 50 75 100 125 150
Number of respondents
N=407 individuals
Rating
Figure 35: Importance of exhibits
Don't know
Not important
Somewhat important
Moderately important
Very important
Extremely important
6%
18%
8%
19%
19%
31%
0 20 40 60 80 100 120 140
Number of respondents
N=425 individuals;
percentages do not equal 100 due to rounding.
Rating
Figure 36: Importance of fishing access

Gateway NRA—Floyd Bennett Field VSP Visitor Study May 24 – June 1, 2003
39
Don't know
Not important
Somewhat important
Moderately important
Very important
Extremely important
6%
18%
10%
24%
28%
14%
0 20 40 60 80 100 120
Number of respondents
N=405 individuals
Rating
Figure 37: Importance of hiking trails
Don't know
Not important
Somewhat important
Moderatly important
Very important
Extremly important
6%
27%
19%
24%
16%
9%
0 20 40 60 80 100 120
Number of respondents
N=405 individuals;
percentages do not equal 100 due to rounding.
Rating
Figure 38: Importance of meeting rooms

Gateway NRA—Floyd Bennett Field VSP Visitor Study May 24 – June 1, 2003
40
Don't know
Not important
Somewhat important
Moderately important
Very important
Extremely important
5%
19%
16%
26%
22%
12%
0 20 40 60 80 100 120
Number of respondents
N=402 individuals
Rating
Figure 39: Importance of multi-use trails
Don't know
Not important
Somewhat important
Moderately important
Very important
Extremely important
2%
9%
13%
24%
30%
21%
0 20 40 60 80 100 120 140
Number of respondents
N=411 individuals;
percentages do not equal 100 due to rounding.
Rating
Figure 40: Importance of park brochure/map

Gateway NRA—Floyd Bennett Field VSP Visitor Study May 24 – June 1, 2003
41
Don't know
Not important
Somewhat important
Moderately important
Very important
Extremely important
3%
10%
15%
25%
28%
19%
0 20 40 60 80 100 120
Number of respondents
N=425 individuals
Rating
Figure 41: Importance of picnic tables
Don't know
Not important
Somewhat important
Moderately important
Very important
Extremely important
1%
17%
16%
21%
23%
22%
0 20 40 60 80 100 120
Number of respondents
N=430 individuals
Rating
Figure 42: Importance of public telephones
Gateway NRA—Floyd Bennett Field VSP Visitor Study May 24 – June 1, 2003
42
Don't know
Not important
Somewhat important
Moderately important
Very important
Extremely important
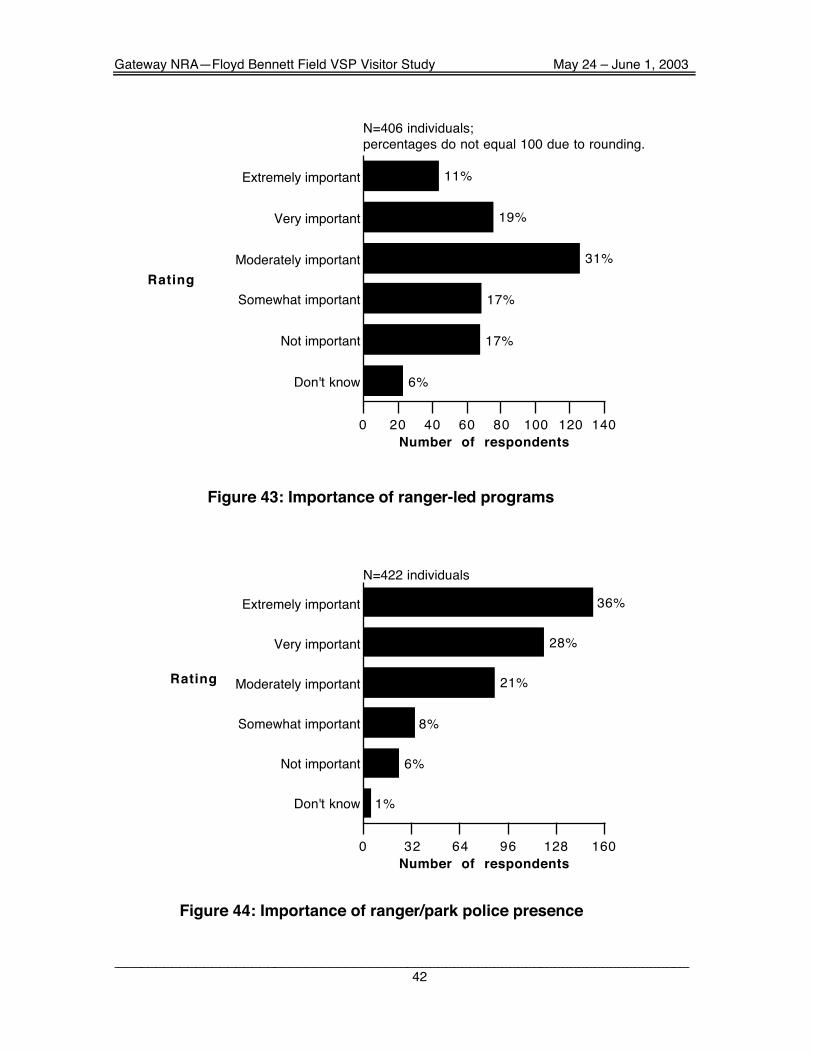
6%
17%
17%
31%
19%
11%
0 20 40 60 80 100 120 140
Number of respondents
N=406 individuals;
percentages do not equal 100 due to rounding.
Rating
Figure 43: Importance of ranger-led programs
Don't know
Not important
Somewhat important
Moderately important
Very important
Extremely important
1%
6%
8%
21%
28%
36%
0 32 64 96 128 160
Number of respondents
N=422 individuals
Rating
Figure 44: Importance of ranger/park police presence
Gateway NRA—Floyd Bennett Field VSP Visitor Study May 24 – June 1, 2003
43
Don't know
Not important
Somewhat important
Moderately important
Very important
Extremely important
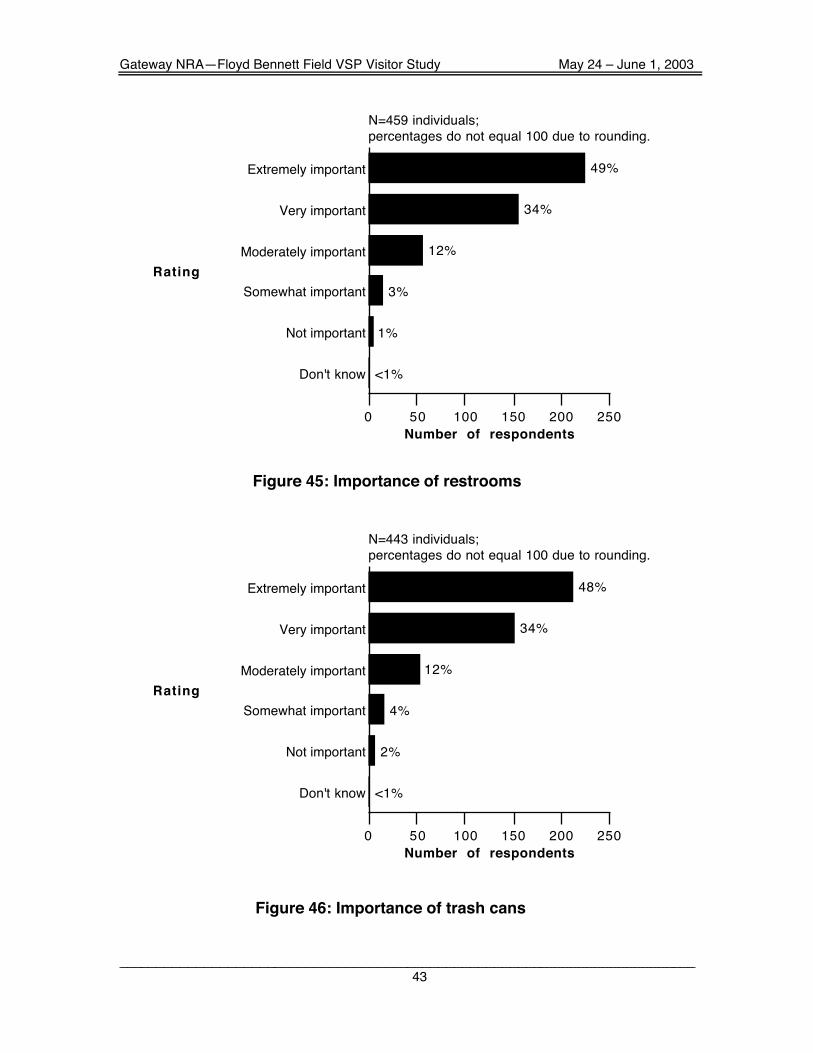
<1%
1%
3%
12%
34%
49%
0 50 100 150 200 250
Number of respondents
N=459 individuals;
percentages do not equal 100 due to rounding.
Rating
Figure 45: Importance of restrooms
Don't know
Not important
Somewhat important
Moderately important
Very important
Extremely important
<1%
2%
4%
12%
34%
48%
0 50 100 150 200 250
Number of respondents
N=443 individuals;
percentages do not equal 100 due to rounding.
Rating
Figure 46: Importance of trash cans

Gateway NRA—Floyd Bennett Field VSP Visitor Study May 24 – June 1, 2003
44
Don't know
Not important
Somewhat important
Moderately important
Very important
Extremely important
2%
10%
10%
26%
26%
26%
0 20 40 60 80 100 120
Number of respondents
N=423 individuals
Rating
Figure 47: Importance of shade structures
Don't know
Not important
Somewhat important
Moderately important
Very important
Extremely important
4%
21%
16%
28%
19%
13%
0 20 40 60 80 100 120
Number of respondents
N=404 individuals;
percentages do not equal 100 due to rounding.
Rating
Figure 48: Importance of sports fields

Gateway NRA—Floyd Bennett Field VSP Visitor Study May 24 – June 1, 2003
45
Don't know
Not important
Somewhat important
Moderately important
Very important
Extremely important
1%
6%
12%
24%
29%
28%
0 20 40 60 80 100 120 140
Number of respondents
N=427 individuals
Rating
Figure 49: Importance of visitor information office

Gateway NRA—Floyd Bennett Field VSP Visitor Study May 24 – June 1, 2003
46
Figure 50: Combined "extremely important" and "very important"ratings for visitor services/facilities
Gateway NRA—Floyd Bennett Field VSP Visitor Study May 24 – June 1, 2003
47
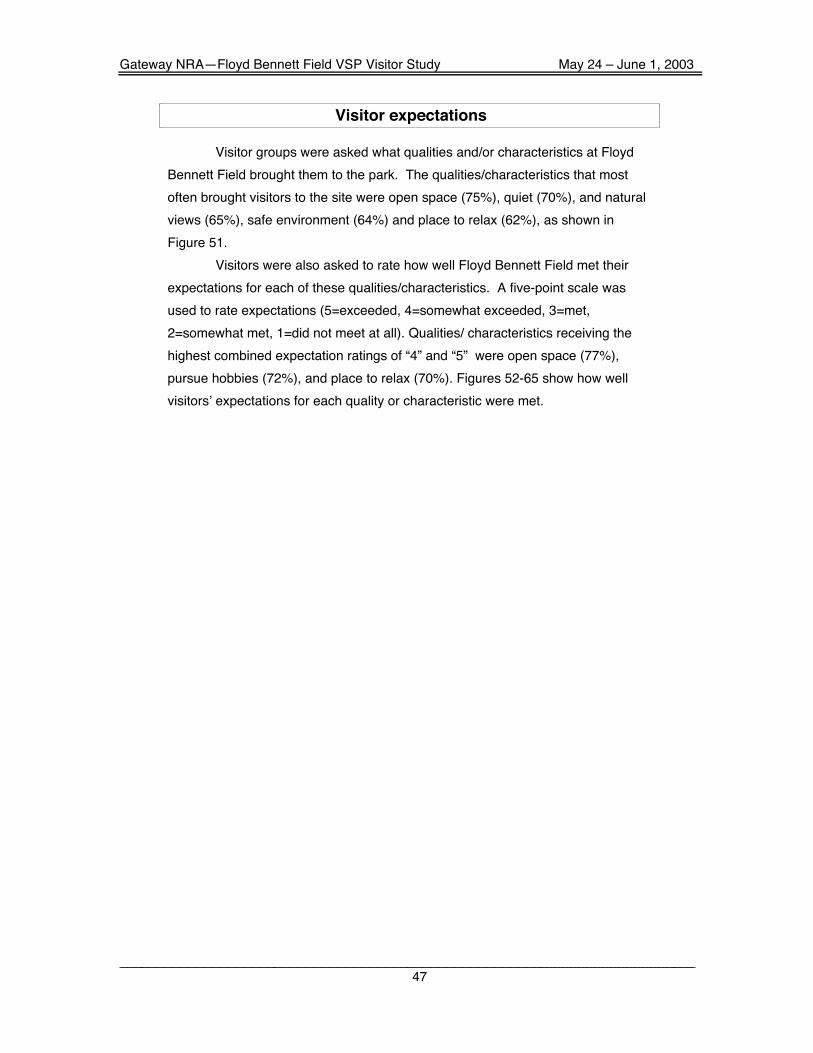
Visitor expectations
Visitor groups were asked what qualities and/or characteristics at Floyd
Bennett Field brought them to the park. The qualities/characteristics that most
often brought visitors to the site were open space (75%), quiet (70%), and natural
views (65%), safe environment (64%) and place to relax (62%), as shown in
Figure 51.
Visitors were also asked to rate how well Floyd Bennett Field met their
expectations for each of these qualities/characteristics. A five-point scale was
used to rate expectations (5=exceeded, 4=somewhat exceeded, 3=met,
2=somewhat met, 1=did not meet at all). Qualities/ characteristics receiving the
highest combined expectation ratings of “4” and “5” were open space (77%),
pursue hobbies (72%), and place to relax (70%). Figures 52-65 show how well
visitors! expectations for each quality or characteristic were met.

Gateway NRA—Floyd Bennett Field VSP Visitor Study May 24 – June 1, 2003
48
Other
Education
Volunteer
Night sky
Opportunities to learn history
Preserve history
Pursue hobbies
Recreation
Interact with others with similar interests
Place to relax
Safe environment
Natural views
Quiet
Open space
6%
17%
23%
23%
25%
25%
52%
53%
55%
62%
64%
65%
70%
75%
0 50 100 150 200 250 300 350
Number of respondents
N=420 individuals;
percentages do not equal 100 because visitors
could rate more than one quality/characteristic.
Quality/
characteristic
Figure 51: Qualities/characteristics that brought visitors toFloyd Bennett Field

Gateway NRA—Floyd Bennett Field VSP Visitor Study May 24 – June 1, 2003
49
Did not meet at all
Somewhat met
Met
Somewhat exceeded
Exceeded
3%
9%
31%
27%
30%
0 20 40 60 80 100
Number of respondents
N=307 individuals
Rating
Figure 52: Visitor expectations about quiet
Did not meet at all
Somewhat met
Met
Somewhat exceeded
Exceeded
0%
6%
17%
30%
47%
0 40 80 120 160
Number of respondents
N=325 individuals
Rating
Figure 53: Visitor expectations about open space
Gateway NRA—Floyd Bennett Field VSP Visitor Study May 24 – June 1, 2003
50
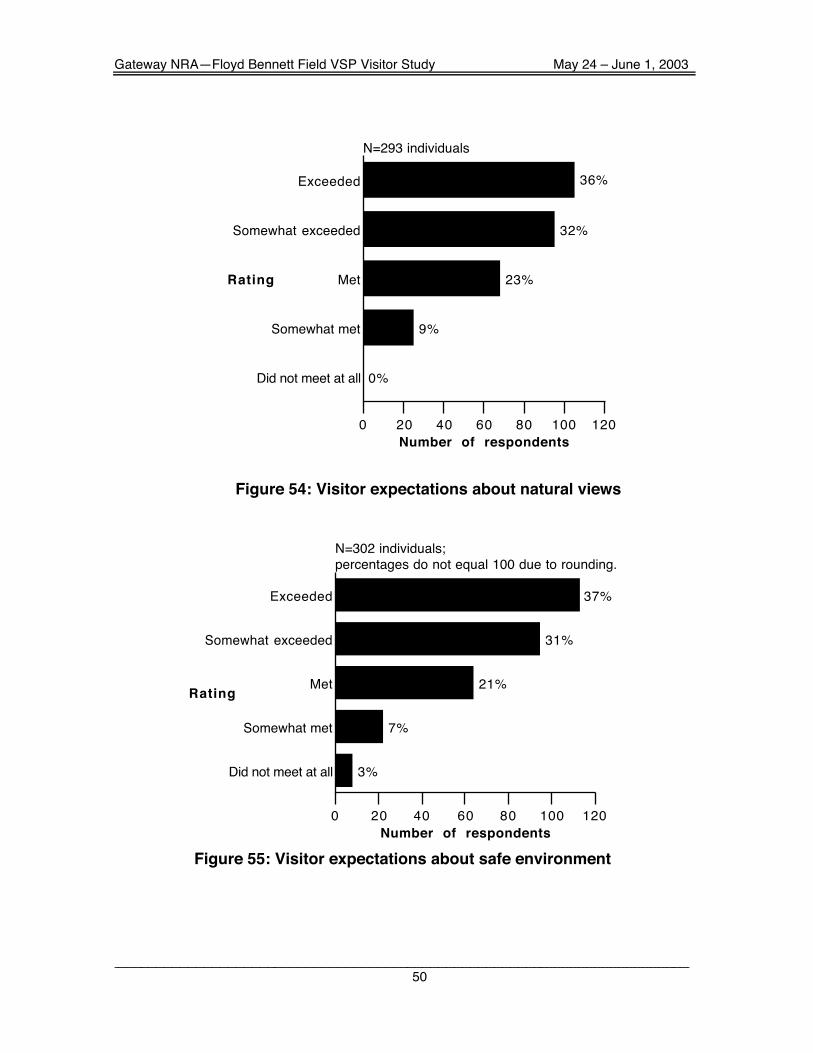
Did not meet at all
Somewhat met
Met
Somewhat exceeded
Exceeded
0%
9%
23%
32%
36%
0 20 40 60 80 100 120
Number of respondents
N=293 individuals
Rating
Figure 54: Visitor expectations about natural views
0 20 40 60 80 100 120
Number of respondents
Did not meet at all
Somewhat met
Met
Somewhat exceeded
Exceeded
3%
7%
21%
31%
37%
N=302 individuals;
percentages do not equal 100 due to rounding.
Rating
Figure 55: Visitor expectations about safe environment

Gateway NRA—Floyd Bennett Field VSP Visitor Study May 24 – June 1, 2003
51
Did not meet at all
Somewhat met
Met
Somewhat exceeded
Exceeded
2%
7%
22%
28%
42%
0 20 40 60 80 100 120
Number of respondents
N=287 individuals;
percentages do not equal 100 due to rounding.
Rating
Figure 56: Visitor expectations about place to relax withfamily
Did not meet at all
Somewhat met
Met
Somewhat exceeded
Exceeded
2%
8%
25%
26%
40%
0 20 40 60 80 100 120
Number of respondents
N=265 individuals;
percentages do not equal 100 due to rounding.
Rating
Figure 57: Visitor expectations about interaction withother people who have similar interests
Gateway NRA—Floyd Bennett Field VSP Visitor Study May 24 – June 1, 2003
52
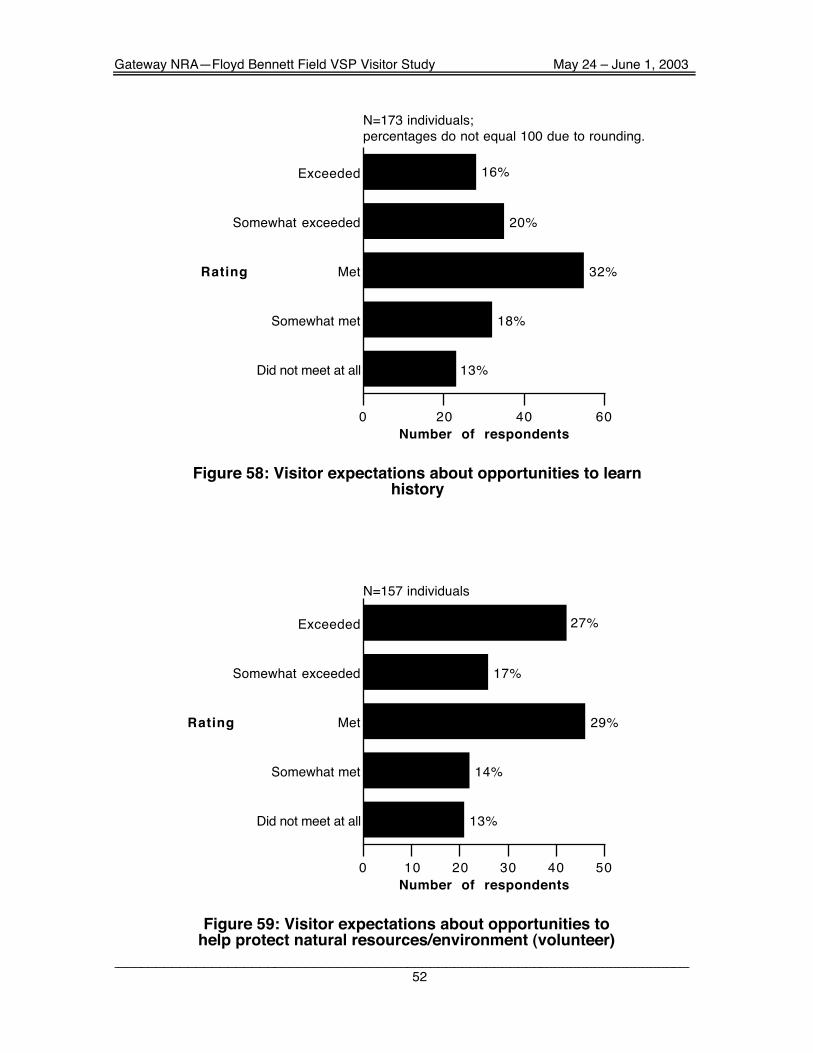
Did not meet at all
Somewhat met
Met
Somewhat exceeded
Exceeded
13%
18%
32%
20%
16%
0 20 40 60
Number of respondents
N=173 individuals;
percentages do not equal 100 due to rounding.
Rating
Figure 58: Visitor expectations about opportunities to learnhistory
Did not meet at all
Somewhat met
Met
Somewhat exceeded
Exceeded
13%
14%
29%
17%
27%
0 10 20 30 40 50
Number of respondents
N=157 individuals
Rating
Figure 59: Visitor expectations about opportunities tohelp protect natural resources/environment (volunteer)

Gateway NRA—Floyd Bennett Field VSP Visitor Study May 24 – June 1, 2003
53
Did not meet at all
Somewhat met
Met
Somewhat exceeded
Exceeded
11%
19%
34%
20%
16%
0 20 40 60
Number of respondents
N=148 Individuals
Rating
Figure 60: Visitor expectations about educationalopportunities
Did not meet at all
Somewhat met
Met
Somewhat exceeded
Exceeded
2%
11%
25%
26%
36%
0 20 40 60 80 100
Number of respondents
N=259 individuals
Rating
Figure 61: Visitor expectations about recreationalopportunities (jogging, hiking, fishing, camping, etc.)
Gateway NRA—Floyd Bennett Field VSP Visitor Study May 24 – June 1, 2003
54
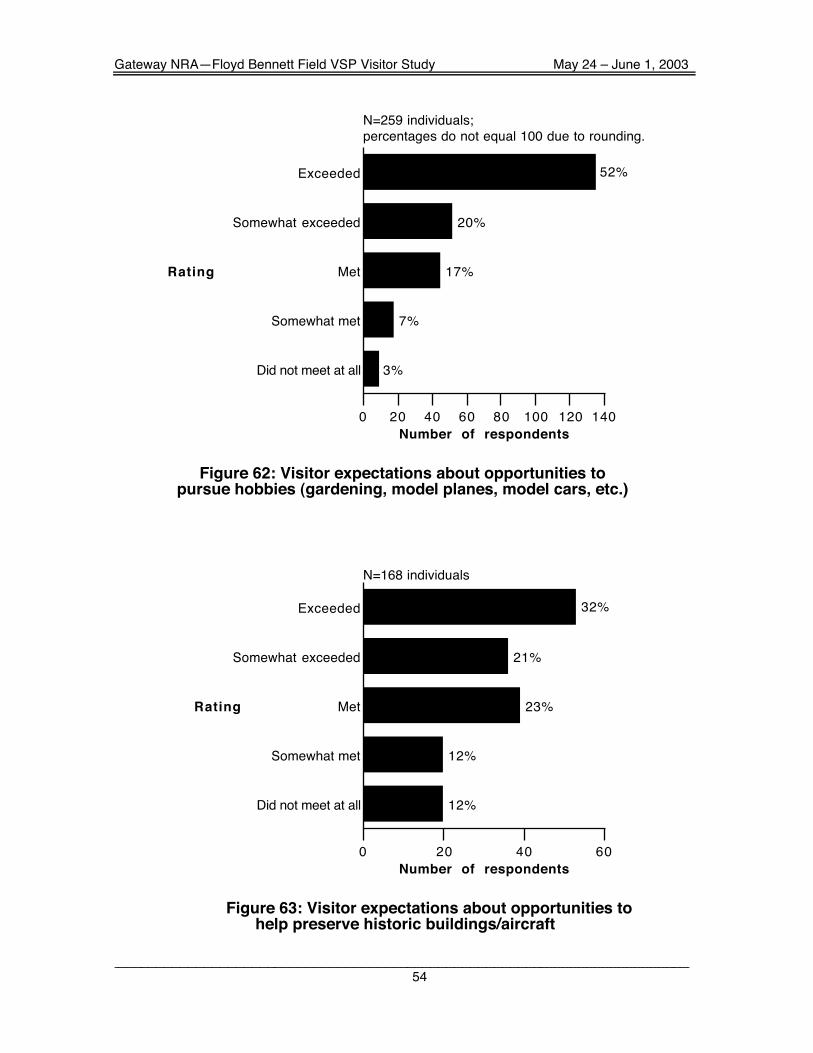
Did not meet at all
Somewhat met
Met
Somewhat exceeded
Exceeded
3%
7%
17%
20%
52%
0 20 40 60 80 100 120 140
Number of respondents
N=259 individuals;
percentages do not equal 100 due to rounding.
Rating
Figure 62: Visitor expectations about opportunities topursue hobbies (gardening, model planes, model cars, etc.)
Did not meet at all
Somewhat met
Met
Somewhat exceeded
Exceeded
12%
12%
23%
21%
32%
0 20 40 60
Number of respondents
N=168 individuals
Rating
Figure 63: Visitor expectations about opportunities tohelp preserve historic buildings/aircraft

Gateway NRA—Floyd Bennett Field VSP Visitor Study May 24 – June 1, 2003
55
Did not meet at all
Somewhat met
Met
Somewhat exceeded
Exceeded
10%
11%
17%
16%
45%
0 10 20 30 40 50 60 70
Number of respondents
N=154 individuals;
percentages do not equal 100 due to rounding.
Rating
Figure 64: Visitor expectations about views of night sky
Did not meet at all
Somewhat met
Met
Somewhat exceeded
Exceeded
14%
40%
9%
20%
17%
0 5 10 15
Number of respondents
N=35 individuals
Rating
Figure 65: Visitor expectations about “other”qualities/characteristics
Gateway NRA—Floyd Bennett Field VSP Visitor Study May 24 – June 1, 2003
56
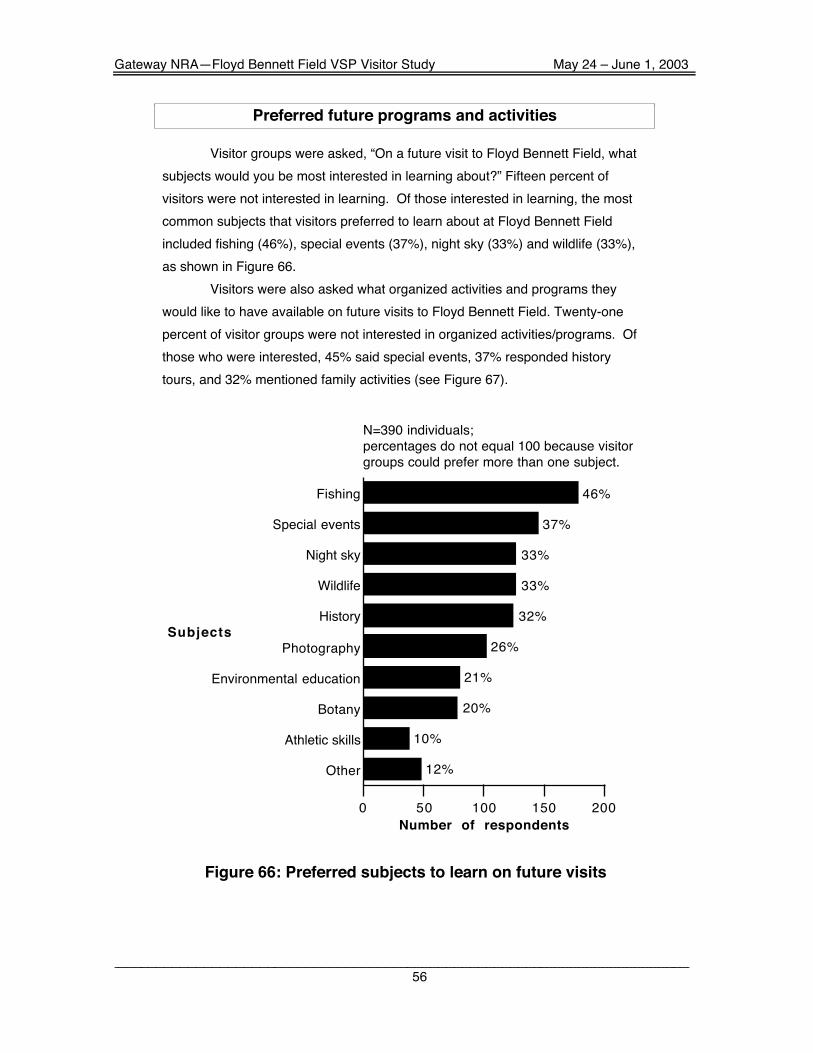
Preferred future programs and activities
Visitor groups were asked, “On a future visit to Floyd Bennett Field, what
subjects would you be most interested in learning about?” Fifteen percent of
visitors were not interested in learning. Of those interested in learning, the most
common subjects that visitors preferred to learn about at Floyd Bennett Field
included fishing (46%), special events (37%), night sky (33%) and wildlife (33%),
as shown in Figure 66.
Visitors were also asked what organized activities and programs they
would like to have available on future visits to Floyd Bennett Field. Twenty-one
percent of visitor groups were not interested in organized activities/programs. Of
those who were interested, 45% said special events, 37% responded history
tours, and 32% mentioned family activities (see Figure 67).
Other
Athletic skills
Botany
Environmental education
Photography
History
Wildlife
Night sky
Special events
Fishing
12%
10%
20%
21%
26%
32%
33%
33%
37%
46%
0 50 100 150 200
Number of respondents
N=390 individuals;
percentages do not equal 100 because visitor
groups could prefer more than one subject.
Subjects
Figure 66: Preferred subjects to learn on future visits

Gateway NRA—Floyd Bennett Field VSP Visitor Study May 24 – June 1, 2003
57
Other
Educational camping
Artist studios
Sport clinics
Volunteering
Camping
Children's programs
Bird walks
Canoeing / kayaking
Night walks
Family activities
History tours
Special events
11%
11%
15%
17%
22%
22%
24%
26%
29%
29%
32%
37%
45%
0 40 80 120 160
Number of respondents
N=352 individuals;
percentages do not equal 100 because visitor
groups could prefer more than one activity.
Activity
Figure 67: Preferred activities and programs visitors wouldlike available on future visits
Gateway NRA—Floyd Bennett Field VSP Visitor Study May 24 – June 1, 2003
58
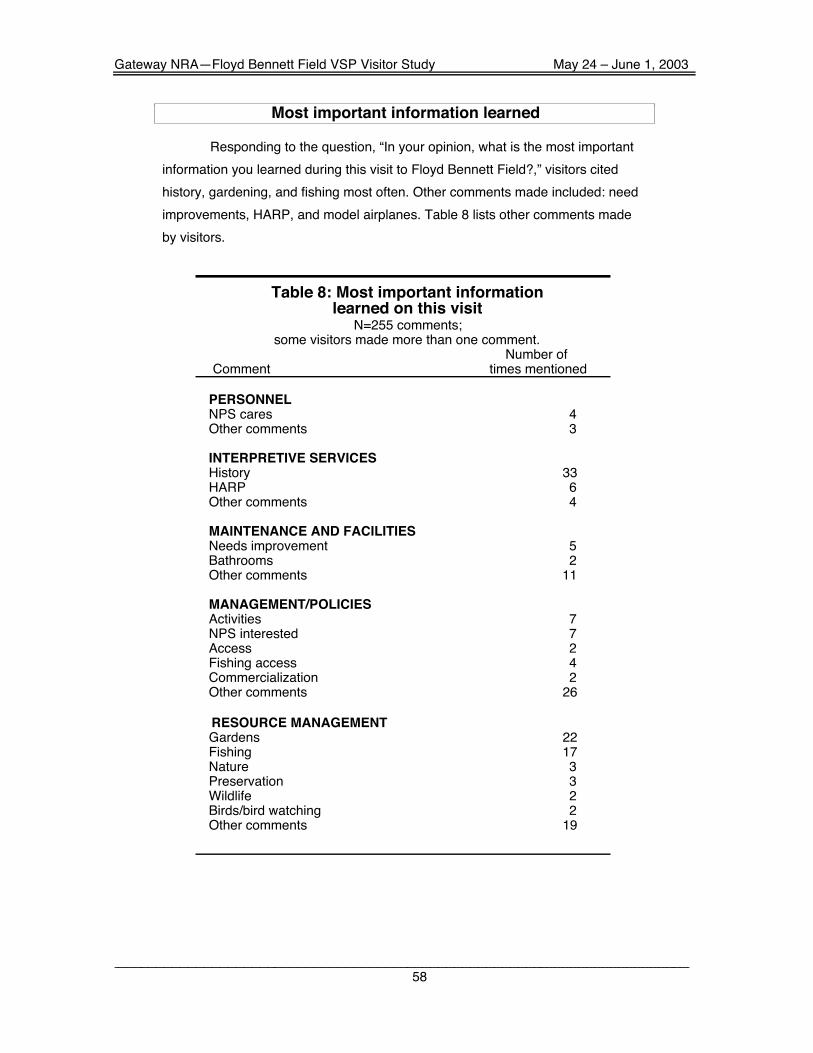
Most important information learned
Responding to the question, “In your opinion, what is the most important
information you learned during this visit to Floyd Bennett Field?,” visitors cited
history, gardening, and fishing most often. Other comments made included: need
improvements, HARP, and model airplanes. Table 8 lists other comments made
by visitors.
Table 8: Most important informationlearned on this visit
N=255 comments;some visitors made more than one comment.
Number ofComment times mentioned
PERSONNELNPS cares 4Other comments 3
INTERPRETIVE SERVICESHistory 33HARP 6Other comments 4
MAINTENANCE AND FACILITIESNeeds improvement 5Bathrooms 2Other comments 11
MANAGEMENT/POLICIESActivities 7NPS interested 7Access 2Fishing access 4Commercialization 2Other comments 26
RESOURCE MANAGEMENTGardens 22Fishing 17Nature 3Preservation 3Wildlife 2Birds/bird watching 2Other comments 19

Gateway NRA—Floyd Bennett Field VSP Visitor Study May 24 – June 1, 2003
59
Table 8: Most important informationlearned on this visit (continued)
Number ofComment times mentioned
GENERALCamping 6Recreation 5Fish consumption 4Hobbies 4Great to visit 2Location 2Great resource 2Other comments 46

Gateway NRA—Floyd Bennett Field VSP Visitor Study May 24 – June 1, 2003
60
Overall quality of visitor services
Visitor groups were asked to rate the overall quality of the visitor services
provided at Gateway National Recreation Area--Floyd Bennett Field during this
visit. Sixty-three percent rated the overall quality as “good” or “very good” (see
Figure 68). Eleven percent rated the overall quality as “poor” or “very poor.”
Very poor
Poor
Average
Good
Very good
2%
9%
26%
47%
16%
0 50 100 150 200 250
Number of respondents
N=453 visitor groups
Rating
Figure 68: Overall quality of visitor services

Gateway NRA—Floyd Bennett Field VSP Visitor Study May 24 – June 1, 2003
61
What visitors liked most
Visitors were asked, “What did you enjoy most about your visit to Floyd
Bennett Field?” Seventy-five percent of visitor groups (368 groups) responded to
this question; these comments are included in a separate appendix of this report.
Visitor comments about Floyd Bennett Field are summarized below (see Table 9).
Table 9: What visitors liked mostN=410 comments;
some visitors made more than one comment.Number of
Comment times mentioned
PERSONNELStaff 2Friendly staff 2Other comments 2
INTERPRETIVE SERVICESHanger B/HARP 6Historic Aircraft 6History 3Aviation exhibits 2Other comments 2
MAINTENANCE & FACILITIESGardens 32Remote control area 17Clean 7Beach 3Bike route 2Other comments 2
MANAGEMENT/POLICIESSafe/safety/security 10Blimp 6Enjoyed 5Other comments 2
RESOURCE MANAGEMENTOpen space 50Birds/birdwatching 9Natural 6Ocean/sea 5Serenity 5Fresh air 2Other comments 19

Gateway NRA—Floyd Bennett Field VSP Visitor Study May 24 – June 1, 2003
62
Table 9: What visitors liked most (continued)
Number ofComment times mentioned
RecreationFishing 42Model aircraft 24Hobbies 4Biking 6Other comments 10
GENERALQuiet 54Peace/peaceful 22Relax/relaxing 14Natural 8Access 6All 5Away from city 5Not crowded 3

Gateway NRA—Floyd Bennett Field VSP Visitor Study May 24 – June 1, 2003
63
What visitors liked least
Fifty-seven percent of visitor groups (N=280) responded to the question,
“What did you enjoy least about your visit to Floyd Bennett Field?” Table 10
includes a summary of those responses: a comprehensive list of comments can
be found in a separate appendix to this report.
Table 10: What visitors liked leastN=228 comments;
some visitors made more than one comment.Number of
Comment times mentioned
PERSONNELComments 2
INTERPRETIVE SERVICESNo information available 4Other comment 1
MAINTENANCE & FACILITIESTrash/litter 27Not enough restrooms 19No food available 11No drinking water 8Dirty restrooms 8Disrepair 7Dirty 6Potholes 6No shade/shelter 5No benches 3Smells 3Weeds 2Other comments 5
Gateway NRA—Floyd Bennett Field VSP Visitor Study May 24 – June 1, 2003
64
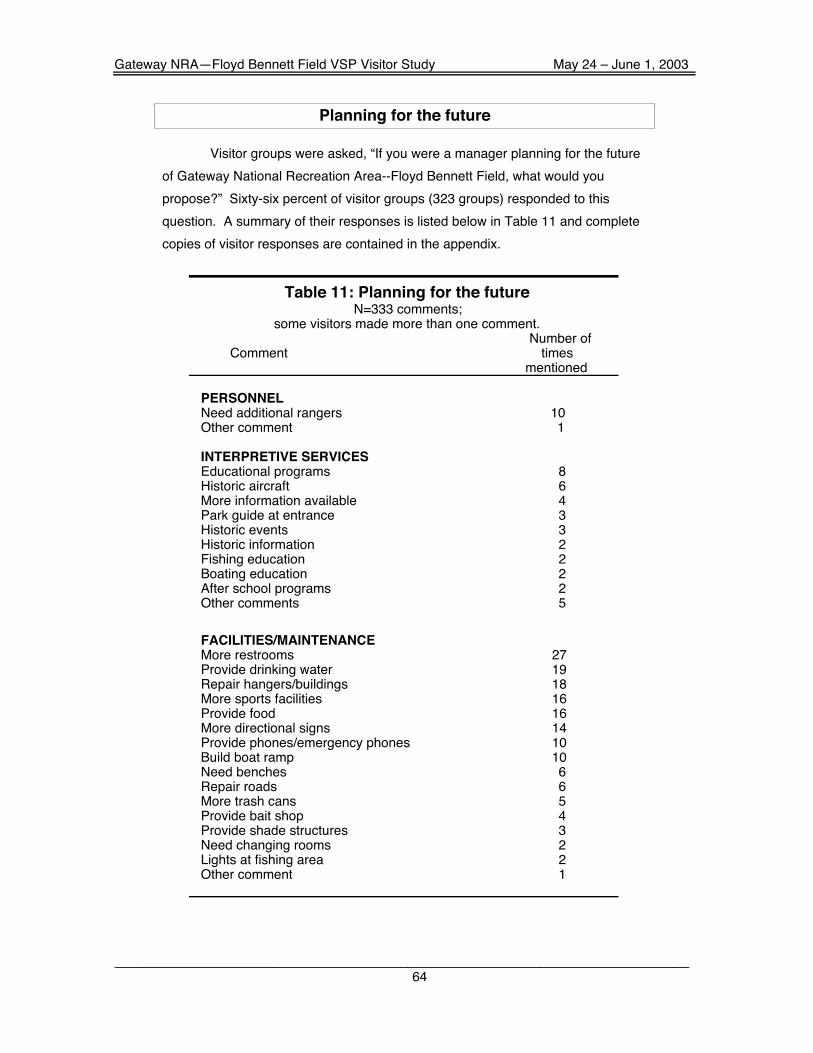
Planning for the future
Visitor groups were asked, “If you were a manager planning for the future
of Gateway National Recreation Area--Floyd Bennett Field, what would you
propose?” Sixty-six percent of visitor groups (323 groups) responded to this
question. A summary of their responses is listed below in Table 11 and complete
copies of visitor responses are contained in the appendix.
Table 11: Planning for the futureN=333 comments;
some visitors made more than one comment.Number of
Comment times mentioned
PERSONNELNeed additional rangers 10Other comment 1
INTERPRETIVE SERVICESEducational programs 8Historic aircraft 6More information available 4Park guide at entrance 3Historic events 3Historic information 2Fishing education 2Boating education 2After school programs 2Other comments 5
FACILITIES/MAINTENANCEMore restrooms 27Provide drinking water 19Repair hangers/buildings 18More sports facilities 16Provide food 16More directional signs 14Provide phones/emergency phones 10Build boat ramp 10Need benches 6Repair roads 6More trash cans 5Provide bait shop 4Provide shade structures 3Need changing rooms 2Lights at fishing area 2Other comment 1

Gateway NRA—Floyd Bennett Field VSP Visitor Study May 24 – June 1, 2003
65
Table 11: Planning for the future (continued)Number of
Comment times mentioned
MANAGEMENT/POLICIESNeed to Advertise/publicity 20Enforce rules/regulations 8Need sports complex 4No sports complex 3No NYPD/sanitation dept 3Other comments 3
RECREATIONProvide picnic areas/BBQ area 11Have air shows 10More fishing sites 10Have major/special events 10Bigger bike path 7Have family activities 4Stop poaching 2Build shooting range 2Other comment 1
RESOURCE MANAGEMENTKeep natural environment 14Build hiking trails 5Bigger garden area 5Remove poison ivy 2Other comment 1
GENERALComments 2
Gateway NRA—Floyd Bennett Field VSP Visitor Study May 24 – June 1, 2003
66
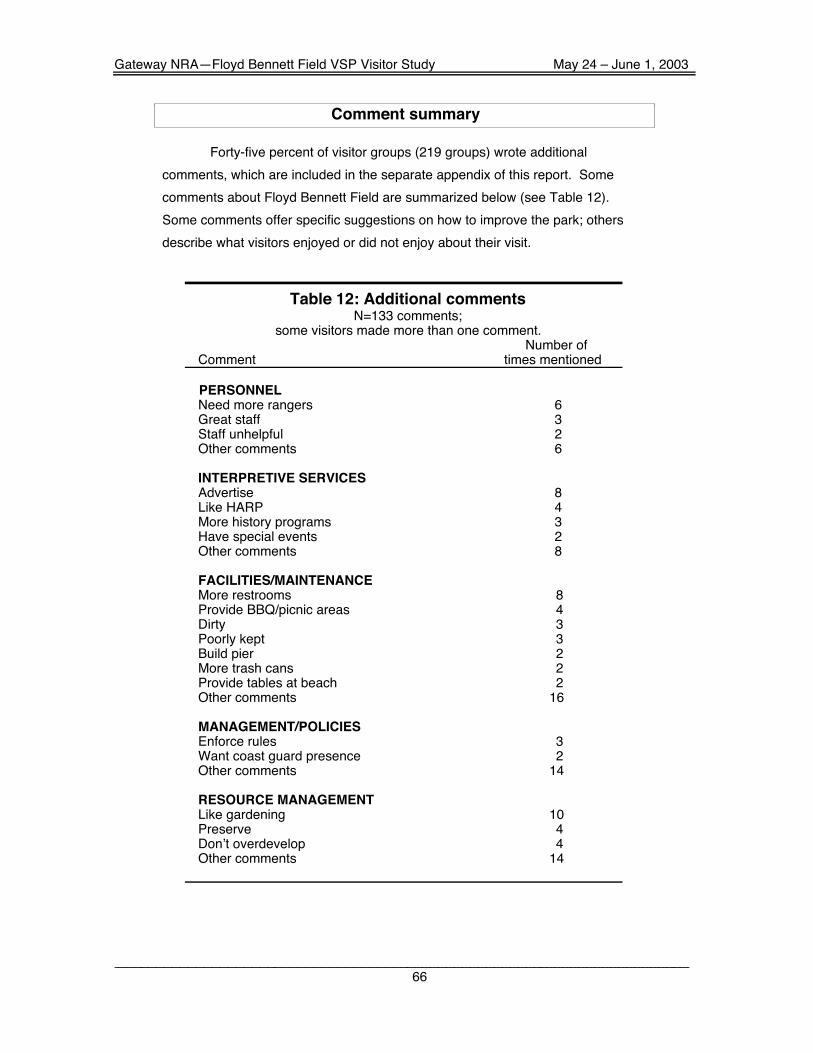
Comment summary
Forty-five percent of visitor groups (219 groups) wrote additional
comments, which are included in the separate appendix of this report. Some
comments about Floyd Bennett Field are summarized below (see Table 12).
Some comments offer specific suggestions on how to improve the park; others
describe what visitors enjoyed or did not enjoy about their visit.
Table 12: Additional commentsN=133 comments;
some visitors made more than one comment.Number of
Comment times mentioned
PERSONNELNeed more rangers 6Great staff 3Staff unhelpful 2Other comments 6
INTERPRETIVE SERVICESAdvertise 8Like HARP 4More history programs 3Have special events 2Other comments 8
FACILITIES/MAINTENANCEMore restrooms 8Provide BBQ/picnic areas 4Dirty 3Poorly kept 3Build pier 2More trash cans 2Provide tables at beach 2Other comments 16
MANAGEMENT/POLICIESEnforce rules 3Want coast guard presence 2Other comments 14
RESOURCE MANAGEMENTLike gardening 10Preserve 4Don!t overdevelop 4Other comments 14

Gateway NRA—Floyd Bennett Field VSP Visitor Study May 24 – June 1, 2003
67
Table 12: Additional comments (continued)
Number ofComment times mentioned
MANAGEMENT/POLICIESSpeeding 15Noise 9No enforcement 3Ranger road closed 3Police training 2Traffic 2HARP closed 2Other comments 18
RESOURCE MANAGEMENTFishing access 4Other comments 7
GENERALWeather 16Nothing 10Motorcycles 7Bugs 5Other comments 8

Gateway NRA—Floyd Bennett Field VSP Visitor Study May 24 – June 1, 2003
68

Gateway NRA—Floyd Bennett Field VSP Visitor Study May 24 – June 1, 2003
69
Gateway National Recreation Area--Floyd Bennett Field Visitor StudyAdditional Analysis
VSP Report 141
The Visitor Services Project (VSP) offers the opportunity to learn more from VSP visitor study data.Additional analysis can be done using the park's VSP visitor study data that was collected andentered into the computer. Two-way and three-way cross tabulations can be made of any of thecharacteristics listed below. Be as specific as possible-you may select a singleprogram/service/facility instead of all that were listed in the questionnaire. Include your name,address and phone number in the request.
• Awareness that GatewayNRA is managed by NPS
• Activities participated induring this visit
• Zip code or country
• Awareness that FBF is part ofGateway NRA
• Activities participated in onpast visits
• Number of visits in past 12months
• Sources of information priorto visit
• Activity that was the mainreason for visiting
• Spanish/Hispanic/Latino
• Sources of information priorto future visits
• Form of transportation usedto get to FBF
• Ethnicity?
• Receive needed information? • Places visited at FBF • Race
• Camp at FBF on this visit? • Importance of services/facilities at FBF
• Qualities/characteristics of FBFthat brought you to park
• Number of days camping • Visits to other NPS sites? • Ratings of how well qualities/characteristics met expectations
• Number of hours at FBF • Group size • Awareness of safety informationregarding fish consumption
• Frequency of visits to FBF • Group type • Subjects of interest on a futurevisit
• Days usually visit FBF • With guided tour group? • Organized activities on a futurevisit
• Time of day of visits to FBF • With school/educationalgroup?
• Overall quality of services
• Problems finding destinationat FBF
• Is English primary language?
• Factors' effect on visitorexperience
• Current age
Phone/send requests to:Visitor Services Project, PSU Phone: 208-885-7863College of Natural Resources FAX: 208-885-4261P.O. Box 441139 Email: [email protected] of IdahoMoscow, Idaho 83844-1139

Gateway NRA—Floyd Bennett Field VSP Visitor Study May 24 – June 1, 2003
70

Gateway NRA—Floyd Bennett Field VSP Visitor Study May 24 – June 1, 2003
71
QUESTIONNAIRE

Gateway NRA—Floyd Bennett Field VSP Visitor Study May 24 – June 1, 2003
72

Gateway NRA—Floyd Bennett Field VSP Visitor Study May 24 – June 1, 2003
73
Visitor Services Project Publications
Reports 1-6 (pilot studies) are available from the University of Idaho Park Studies Unit (UI PSU).All other VSP reports are available on the UI PSU web site: <http://www.psu.uidaho.edu>. Allstudies were conducted in summer unless otherwise noted.
19821. Mapping interpretive services: A pilot study
at Grand Teton National Park.
19832. Mapping interpretive services: Identifying
barriers to adoption and diffusion of themethod.
3. Mapping interpretive services: A follow-upstudy at Yellowstone National Park andMt Rushmore National Memorial.
4. Mapping visitor populations: A pilot study atYellowstone National Park.
19855. North Cascades National Park Service
Complex6. Crater Lake National Park
19867. Gettysburg National Military Park8. Independence National Historical Park9. Valley Forge National Historical Park
198710. Colonial National Historical Park (summer
& fall)11. Grand Teton National Park12. Harpers Ferry National Historical Park13. Mesa Verde National Park14. Shenandoah National Park (summer & fall)15. Yellowstone National Park16. Independence National Historical Park:
Four Seasons Study
198817. Glen Canyon National Recreational Area18. Denali National Park and Preserve19. Bryce Canyon National Park20. Craters of the Moon National Monument
198921. Everglades National Park (winter)22. Statue of Liberty National Monument23. The White House Tours, President's Park
(summer)24. Lincoln Home National Historical Site25. Yellowstone National Park26. Delaware Water Gap National Recreation
Area27. Muir Woods National Monument
199028. Canyonlands National Park (spring)29. White Sands National Monument30. National Monuments, Washington, D.C.31. Kenai Fjords National Park32. Gateway National Recreation Area33. Petersburg National Monument34. Death Valley National Monument35. Glacier National Park36. Scott's Bluff National Monument37. John Day Fossil Beds National Monument
199138. Jean Lafitte National Historical Park (spring)39. Joshua Tree National Monument (spring)40. The White House Tours, President's Park
(spring)41. Natchez Trace Parkway (spring)42. Stehekin-North Cascades NP/Lake Chelan
National Recreation Area43. City of Rocks National Reserve44. The White House Tours, President's Park (fall)
199245. Big Bend National Park (spring)46. Frederick Douglass National Historic Site
(spring)47. Glen Echo Park (spring)48. Bent's Old Fort National Historic Site49. Jefferson National Expansion Memorial50. Zion National Park51. New River Gorge National River52. Klondike Gold Rush National Historical Park
(AK)53. Arlington House-The Robert E. Lee Memorial
199354. Belle Haven Park/Dyke Marsh Wildlife
Preserve (spring)55. Santa Monica Mountains National Recreation
Area (spring)56. Whitman Mission National Historic Site57. Sitka National Historical Park58. Indiana Dunes National Lakeshore (summer)59. Redwood National Park60. Channel Islands National Park61. Pecos National Historical Park62. Canyon de Chelly National Monument63. Bryce Canyon National Park (fall)

Gateway NRA—Floyd Bennett Field VSP Visitor Study May 24 – June 1, 2003
74
Visitor Services Project Publications (continued)
199464. Death Valley National Monument
Backcountry (winter)65. San Antonio Missions National Historical
Park (spring)66. Anchorage Alaska Public Lands Information
Center67. Wolf Trap Farm Park for the Performing Arts68. Nez Perce National Historical Park69. Edison National Historic Site70. San Juan Island National Historical Park71. Canaveral National Seashore72. Indiana Dunes National Lakeshore (fall)73. Gettysburg National Military Park (fall)
199574. Grand Teton National Park (winter)75. Yellowstone National Park (winter)76. Bandelier National Monument77. Wrangell-St. Elias National Park & Preserve78. Adams National Historic Site79. Devils Tower National Monument80. Manassas National Monument Park81. Booker T. Washington National Monument82. San Francisco Maritime National Historical
Park83. Dry Tortugas National Park
199684. Everglades National Park (spring)85. Chiricahua National Monument (spring)86. Fort Bowie National Historic Site (spring)87. Great Falls Park, Virginia (spring)88. Great Smoky Mountains National Park
(summer)89. Chamizal National Memorial90. Death Valley National Park (fall)91. Prince William Forest Park (fall)92. Great Smoky Mountains National Park
(summer & fall combined)
199793. Virgin Islands National Park (winter)94. Mojave National Preserve (spring)95. Martin Luther King, Jr., National Historic Site
(spring)96. Lincoln Boyhood Home National Memorial97. Grand Teton National Park98. Bryce Canyon National Park99. Voyageurs National Park100. Lowell National Historical Park
1998101. Jean Lafitte National Historical Park &
Preserve (spring)
1998 (continued)102. Chattahoochee River National
Recreation Area (spring)103. Cumberland Island National Seashore
(spring)104. Iwo Jima/Netherlands Carillon Memorials105. National Monuments & Memorials,
Washington, D.C.106. Klondike Gold Rush National Historical
Park, AK107. Whiskeytown National Recreation Area108. Acadia National Park
1999109. Big Cypress National Preserve (winter)110. San Juan National Historic Site, P.R. (winter)111. Saint Croix National Scenic Riverway112. Rock Creek Park113. New Bedford Whaling National Historical Park114. Glacier Bay National Park & Preserve115. Kenai Fjords National Park & Preserve116. Lassen Volcanic National Park117. Cumberland Gap National Historic Park (fall)
2000118. Haleakala National Park (spring)119. White House Tour & White House Visitor
Center (spring)120. USS Arizona Memorial121. Olympic National Park122. Eisenhower National Historic Site123. Badlands National Park124. Mount Rainier National Park
2001125. Biscayne National Park (spring)126. Colonial National Historical Park (Jamestown)127. Shenandoah National Park128. Pictured Rocks National Lakeshore129. Crater Lake National Park130. Valley Forge National Historical Park
2002131. Everglades National Park (spring)132. Dry Tortugas National Park (spring)133. Pinnacles National Monument (spring)134. Great Sand Dunes National Monument and
Preserve135. Pipestone National Monument136. Outer Banks Group (Cape Hatteras National
Seashore, Wright Brothers National Monument)137. Sequoia & Kings Canyon National Park138. Catoctin Mountain Park139. Hopewell Furnace National Historic Site140. Stones River National Monument (fall)

Gateway NRA—Floyd Bennett Field VSP Visitor Study May 24 – June 1, 2003
75
Visitor Services Project Publications (continued)
2003141. Gateway National Recreation Area - Floyd
Bennett Field (spring)
For more information about the Visitor Services Project, please contact the University of Idaho ParkStudies Unit; phone (208) 885-7863 or go to web site: <http://www.psu.uidaho.edu>


Gateway NRA—Floyd Bennett Field VSP Visitor Study May 24 – June 1, 2003
NPS D-360 April 2004
Printed on recycled paper