gateway south and transwest express … · gateway south and transwest express conceptual technical...
TRANSCRIPT

GATEWAY SOUTH AND TRANSWEST EXPRESS
CONCEPTUAL TECHNICAL REPORT
Prepared for:
National Grid
Arizona Public Service Company PacifiCorp
Wyoming Infrastructure Authority
Prepared by:
Black & Veatch
February 29, 2008

Black & Veatch Table of Contents
February 29, 2008 i
GATEWAY SOUTH AND TRANSWEST EXPRESS CONCEPTUAL TECHNICAL REPORT
TABLE OF CONTENTS
1 EXECUTIVE SUMMARY ................................................................................................. 1-1
1.1 Introduction .............................................................................................................. 1-1 1.2 Approach .................................................................................................................. 1-2 1.3 Evaluation Points...................................................................................................... 1-2 1.4 Conclusions .............................................................................................................. 1-2 1.5 Recommendations .................................................................................................... 1-4
2 INTRODUCTION ............................................................................................................... 2-1 2.1 Background .............................................................................................................. 2-1 2.2 Purpose and Need..................................................................................................... 2-2 2.3 General Approach..................................................................................................... 2-5
3 PROJECT ALTERNATIVES.............................................................................................. 3-1 3.1 Overview .................................................................................................................. 3-1 3.2 Technical Considerations ......................................................................................... 3-3 3.3 Economic Considerations......................................................................................... 3-4 3.4 Studied Alternatives ................................................................................................. 3-5
4 PROJECT COMPONENTS AND UNIT COSTS............................................................... 4-1 4.1 Transmission Line Components and Unit Costs ...................................................... 4-1 4.2 Substation Configurations and Costs ....................................................................... 4-3 4.3 Converter Station Capacities and Costs ................................................................... 4-3 4.4 Capital Cost Development........................................................................................ 4-6 4.5 Economies of Scale .................................................................................................. 4-6
5 ALTERNATIVES ASSESSMENT..................................................................................... 5-1 5.1 Capital Costs............................................................................................................. 5-1 5.2 Relative Costs........................................................................................................... 5-2 5.3 Ability to Meet Needs .............................................................................................. 5-4 5.4 Construction Impacts................................................................................................ 5-4 5.5 Power Flow Considerations...................................................................................... 5-5 5.6 Dynamic Stability Considerations............................................................................ 5-6

Black & Veatch Table of Contents
February 29, 2008 ii
6 ASSESSMENT OF INDEPENDENT PROJECTS............................................................. 6-1 6.1 General ..................................................................................................................... 6-1 6.2 Development of One Project Only ........................................................................... 6-2 6.3 Independent Development of Two Projects ............................................................. 6-2
7 ASSESSMENT OF COLLABORATIVE DEVELOPMENT............................................. 7-1 7.1 General ..................................................................................................................... 7-1 7.2 Key Opportunities .................................................................................................... 7-1 7.3 Key Challenges......................................................................................................... 7-4 7.4 Project Timing Considerations................................................................................. 7-4 7.5 Analysis of Combined Solutions.............................................................................. 7-7
8 CONCLUSIONS AND RECOMMENDATIONS .............................................................. 8-1 8.1 Conclusions .............................................................................................................. 8-1 8.2 Recommendations .................................................................................................... 8-2
APPENDIX - Maps of Studies Alternatives

Black & Veatch Executive Summary
February 29, 2008 1-1
GATEWAY SOUTH AND TRANSWEST EXPRESS CONCEPTUAL TECHNICAL REPORT
1 EXECUTIVE SUMMARY 1.1 Introduction
National Grid, together with Arizona Public Service (APS), PacifiCorp and the Wyoming Infrastructure Authority (the Partners) are pursuing collaborative development of the TransWest Express and Gateway South Projects. The Partners engaged Black & Veatch to consider and update prior work performed on the projects, to study and evaluate the opportunities, and to perform the following general tasks:
• Develop overall cost estimates (capital and $/MW) of various project configurations and routes.
• Identify potential savings with joint project development. • Provide a qualitative assessment of system performance impact associated with various
AC, DC, and hybrid solutions. • Recommend which solutions should be carried forward into the WECC rating process. • Develop a report to document the findings.
The TransWest Express (TWE) Project was initially announced by APS in 2005 with the intent to provide Arizona and other southwestern states access to wind, coal, and other resources in Wyoming. Following a period of feasibility studies and stakeholder involvement, APS decided to continue with further analysis of their preferred alternative, which is a bipole ±500 kV HVDC (high voltage direct current) transmission line, with a delivery capacity of 3000 MW, a length of 900 to 1300 miles, and an in-service date of 2015. The Gateway South (GS) Project was announced by PacifiCorp in 2007 to provide transmission service between Wyoming, Utah and southern Nevada. The GS Project was proposed to consist of two distinct AC transmission line segments. The northern segment was proposed as a double circuit 500 kV line from eastern Wyoming to central Utah, with a delivery capacity of 3000 megawatts, a length of about 400 miles, and an in-service date of 2013. The southern segment was proposed as a single circuit 345 kV line from central Utah to southern Nevada, with a delivery capacity of 800 MW, a length of about 250 miles, and an in-service date of 2012. A companion and complementary project, the Gateway West Project, is being pursed

Black & Veatch Executive Summary
February 29, 2008 1-2
independently in a joint effort by PacifiCorp and Idaho Power. PacifiCorp has been holding stakeholder meetings and participating in regional planning reviews for these projects.
1.2 Approach The Partners approached the studies underlying this report by examining their prior work and then augmenting the information to better define the characteristics of each project. The update included a general confirmation of the points of interconnection, line lengths, expected resources and loads, estimates of load factors, and similar features. Augmentation consisted of an analysis to select a conductor size and configuration for each project and the development of twelve scenarios utilizing alternative AC/DC project configurations, HVDC terminal locations and power transfer levels. Power transfer levels ranged from 3000 MW to 7500 MW, with a reference case of 6000 MW.
1.3 Evaluation Points The twelve scenarios, which include three GS-only scenarios, three TWE-only scenarios, and six GS/TWE combined scenarios, were evaluated on a series of qualitative and quantitative metrics. These metrics included such items as length of common alignment, capacity costs per MW of transfer capacity, and similar items that could be quantified. Qualitative metrics included discussions of comparative environmental impacts, collaborative construction approaches and times, and interoperability considerations. Conceptually, this report discusses the expected integration of these projects, and they are discussed from both power flow and dynamic perspectives.
1.4 Conclusions Although many of the metrics are based on professional judgment and experience, it is clear that most of the scenarios can be clearly separated and distinguished on an evaluated basis. The evaluation indicates the following conclusions:
1. The preferred solution is Case 5, which combines a GS Project alternative (Case 2) with a TWE Project alternative (Case 4). These cases are described as follows:
• Case 2 consists of a double circuit 500 kV line between eastern Wyoming (Aeolus) and central Utah (Mona) and a single circuit 500 kV line between Mona and southern Nevada (Crystal). The anticipated path ratings for GS are 3000 MW for the northern segment and 1500 MW for the southern segment. The total anticipated corridor length is approximately 725 miles.

Black & Veatch Executive Summary
February 29, 2008 1-3
• Case 4 consists of a bipole 500 kV HVDC line between eastern Wyoming and southern Nevada (Marketplace). The anticipated path rating for TWE is 3000 MW and the anticipated corridor length is approximately 885 miles. It is assumed that over 1000 MW of power flowing from Phoenix to Las Vegas could be counter scheduled, but this would need to be confirmed by studies.
• Case 5 is a combination of Case 2 and Case 4 with an anticipated path rating of 6000 MW.
2. Equivalent scenarios of the projects tend to indicate a generally flat cost per MW of capacity when considering the accuracy of the conceptual cost estimates. However, the HVDC system does indicate a lower cost per MW for longer distance point-to-point delivery (i.e., Wyoming to Nevada).
3. In addition to the resource needs of APS and PacifiCorp customers, there are significant resource needs in Las Vegas and Southern California which can be partially met by most of the alternatives to varying degrees. There is existing transmission capacity leading into Las Vegas and Southern California, especially from the vicinity of Marketplace Substation.
4. The GS 4500 MW (vs. 3000 MW) export sensitivity cases increase the cost on a $/MW basis for capacity between Wyoming and Mona, Utah by about 8%.
5. Upgrading the GS link from Mona south from 345 kV to 500 kV results in a lower cost per MW of capacity, though the extra capacity may exceed that needed to serve the native load. This upgrade does make sense from a regional perspective by increasing the efficiency of the proposed right-of-way corridor, thereby delaying the need for future transmission.
6. Adding a third terminal to the TWE system increases the overall capital costs and does not appear to be as cost effective on a $/MW basis as either delivering all of the capacity to the Phoenix area or terminating the HVDC in the Las Vegas area and counter scheduling some of the power to Phoenix utilizing the existing Arizona network, including the East of the River (EOR) transmission (Path 49).
7. It is anticipated that improvements in dynamic and contingency outage performance with the presence of both the HVDC and AC elements of the project can be achieved. Larger improvements are expected with the TWE termination in southern Nevada than with the termination in the Phoenix area.
8. In all scenarios, development of both the GS and TWE Projects in a collaborative manner indicated one or more improvements over development of the projects separately.
9. Estimated shared cost savings associated with joint project development through conceptual planning and permitting may be in the $10 million to $30 million range.

Black & Veatch Executive Summary
February 29, 2008 1-4
10. The estimated capital cost savings from collaborative development is 5% or more depending on scenario, when compared to simply adding together the costs if the projects were built independently.
11. Utilization of shared right-of-way will need to be fully analyzed from a reliability standpoint to reduce the risk of potential line rating reductions due to outages of all lines in a common corridor.
1.5 Recommendations
Based on the work herein and the findings of this report, the following recommendations are provided:
1. Continue efforts toward collaborative development of the projects. 2. Take forward three alternatives for subsequent system studies and business case
evaluation. Based on the findings, this reduced set should include one case for the GS Project (Case 2), one alternative for the TWE Project (Case 4), and one integrated reference case (Case 5) which combines Case 2 and Case 4.
3. Stop further development of the other alternatives. The findings indicate these alternatives are either not required and/or are not cost effective given the needs itemized within this report. Be willing to resurrect any of these alternatives if the studies show the needs have changed or if the predicted performance or cost estimates are unable to be confirmed.
4. Continue system studies to confirm the statements made in the report regarding project performance and ratings and proceed with the WECC Phase 1 rating process.
5. Ensure that N-2 and common corridor impact and outage cases are fully vetted in the WECC process to reduce the risk of potential deratings due to impacts to the Western Interconnection performance.
6. Confirm the estimated costs of the alternatives described in this report with additional input from equipment and material suppliers and construction companies.
7. Confirm the predicted overall schedule of the alternatives described in this report with additional input from equipment and material suppliers and construction companies.

Black & Veatch Introduction
February 29, 2008 2-1
2 INTRODUCTION 2.1 Background
Arizona Public Service (APS), PacifiCorp, National Grid, and the Wyoming Infrastructure Authority (WIA) are proposing to jointly develop transmission lines between Wyoming and the Desert Southwest. APS and PacifiCorp both have a need to serve their growing customer demand within their respective service territories. Both are exploring the potential development of wind, coal, natural gas, and other resources, which are plentiful in Wyoming, to meet their future needs. Wyoming resource developers require additional transmission capacity to deliver energy to APS, PacifiCorp, and other potential customers. In 2005, APS announced plans for their proposed TransWest Express (TWE) Project between eastern Wyoming and Phoenix. APS performed a Feasibility Study (TransWest Express Project, Phase One - Feasibility Study, Final Study Report, November 2006) on a variety of line configurations and routes and determined that the best technology for the project is a bipole 500 kV HVDC transmission line. APS has since held several stakeholder meetings and continues to provide periodic updates to area planning groups. APS considers Wyoming resources delivered via the TransWest Express line as a viable option within their future resource plans. Several other Desert Southwest utilities have expressed interest in participating in the TransWest Express Project. National Grid, as lead developer, and the WIA joined this team of TWE partners in 2006. The project was envisioned as having a nominal delivery capacity into Arizona of 3000 MW, with a 2015 in-service date. The Gateway South (GS) Project is one project proposed by PacifiCorp in its Energy Gateway Expansion Plan announced in June 2007. This Expansion Plan was developed with a long range view towards providing service to growing loads in PacifiCorp’s service areas and to interconnect resources proposed in the region. It is based on a hub and spoke approach. The proposed Gateway South (GS) Project would run between eastern Wyoming and the Desert Southwest. In addition to Gateway South, additional lines in the Expansion Plan include the Gateway West Project between Wyoming and Idaho and other lines serving critical load areas of Salt Lake City and western Oregon. Gateway South is envisioned as a double circuit 500 kV AC transmission line having a nominal Wyoming export capacity of 3000 MW to Mona, Utah and a single circuit 345 kV line from Sigurd, Utah to Crystal, Nevada. The target in-service date is 2012 for the southern segment and 2013 for the Wyoming to Mona segment. APS, PacifiCorp, National Grid, and the WIA formed a partnership to identify and explore in greater detail potential opportunities and to develop solutions that would meet the needs of the

Black & Veatch Introduction
February 29, 2008 2-2
Partners. The Partners have recognized potential benefits to each project through the co-development of the projects including improved reliability of the WECC system, reducing current congestion, increasing the efficiency of development, and potential operational benefits. In addition, the Partners believe co-development could help reduce the environmental impact of the lines and provide greater service potential to all transmission customers. An Engineering Work Group (EWG), consisting of the Partners’ representatives, engaged Black & Veatch (B&V) to further develop the technical aspects of the projects. This report provides the analysis, findings, and recommendations resulting from this engagement.
2.2 Purpose and Need The primary purposes of both projects are as follows:
• To provide alternatives to cost-effectively meet increasing demand and energy needs of native load customers.
• To provide significant alternatives and options for meeting future resource integration needs, including renewables (e.g., wind, thermal).
• To improve resource diversity and reliability. • To provide increased access for third party transmission users. • To improve overall electric reliability in the Western Interconnection (WI).
PacifiCorp is projecting the annual peak load along the Wasatch Front will increase by more than 2500 MW by 2027. PacifiCorp is also projecting the annual peak load in southern Utah (including transmission network service customers) will increase by at least 500 MW by 2027. APS is projecting the annual peak load in its service territory to increase by 5000 MW by 2025. Annual energy sales for both utilities are projected to increase 40% to 50% in this timeframe. Other area utilities that could benefit from capacity provided by the projects (Tucson Electric Power, Salt River Project, Nevada Power Company, Southern California Edison, and Los Angeles Department of Water and Power) are also projecting high growth rates. Wyoming wind resources could provide the means to make significant strides towards meeting the renewable targets of each company. Wyoming coal resources could provide fuel diversity to counteract a reliance on natural gas, whose pricing is much more volatile. Black & Veatch identified a potential resource plan for TransWest Express for use in the transmission studies as well as a targeted area for the location of the northern terminus of the HVDC TWE line.

Black & Veatch Introduction
February 29, 2008 2-3
Black & Veatch examined several aspects associated with the feasibility of coal and wind energy generation in Wyoming.
Specific to coal, the major findings were: • Of the ten coal basins in Wyoming, the Powder River Basin (PRB), Greater Green River
Basin, Carbon Basin and Hanna Basin are currently actively mined. • The PRB has high coal resources at 550,000 millions of short tons (mst) and exceptional
coal quality with high Btu, low sulfur, and ash content which is compliant with the 1990 Clean Air Act emission standards.
• With the exception of two price hikes over 30 years, primarily due to imposed market discipline on fob mine prices by cutting back production, PRB coal prices have been fairly stable.
• The PRB region has access to several sources of ground and surface water. This water, however, is reserved for more valuable uses. The most viable option for generation sites in this area would be to use dry or hybrid cooling instead of conventional water cooling. This option would, however, increase capital costs and the efficiency of the power plant.
• Airshed constraints are perhaps the biggest challenge to developing coal plants in the state of Wyoming. Potential generation projects are subject to several permitting processes, including the New Source Review (NSR), and Prevention of Significant Deterioration (PSD) process, with the purpose of determining if the proposed generators will unduly damage the surrounding environment. Wyoming has (or is surrounded by) many specially protected Class I areas, making it complicated, if not difficult, to site a coal-fueled plant in most of the state. However, the area we recommend for generation development appears to be least affected by Class I and PSD constraints. In addition, the area also includes over half of the currently operating mines and coal deposits of the Powder River Basin. Finally, the commercial emergence of Integrated Gasification Combined Cycle (IGCC) technology may significantly reduce the constraints on coal generation associated with airshed concerns.
Wind resources were assessed along with appropriate terrain, transportation access, and permitting requirements to gain insight into factors that govern the siting of new wind generating facilities. Nine areas of high development potential were identified, based on wind resource assessments, in the eastern part of the state. Key wind-related findings are as follows:
• Wyoming has exceptional wind resources, ranking seventh among all states in the country for wind energy potential.
• Of the 250,000 MW of potential wind generation in Wyoming (National Renewable Energy Laboratory’s estimate), B&V estimates the most economical wind development potential for the nine site areas on the eastern side of the state is approximately 14,300

Black & Veatch Introduction
February 29, 2008 2-4
MW, with most of the potential development coming from areas with a Class 4 wind resource rating.
• Only six of the nine evaluated areas have some type of existing road access and some areas would be difficult or more costly to develop.
Currently, the transmission capacity available to export Wyoming energy resources is inadequate. This conclusion is consistent with the recommendations for transmission expansion emanating from the Western Governors Association (WGA), the Rocky Mountain Area Transmission Study (RMATS), and the Clean and Diversified Energy Advisory Committee (CDEAC). Further evidence of the scarcity of transmission capacity came following PacifiCorp’s announcement of their Energy Gateway Project, which spawned over 5000 MW in point-to-point transmission service requests that could not be accommodated with the existing transmission system. The 500 kV transmission network in the Western Interconnection is shown in Figure 2-1. Electric reliability is primarily a function of providing redundant paths via a network so that power can flow to populated areas when there is an outage on the primary electrical path. Electric reliability can be impacted on both the local and the regional level. As illustrated in Figure 2-1, the 500 kV transmission network is concentrated along three sides of the Western Interconnection. Adding 500 kV elements in the eastern portion of the loop (between the Montana/Wyoming area and the Desert Southwest) would provide regional benefits in the event of a catastrophic failure elsewhere on the loop.

Black & Veatch Introduction
February 29, 2008 2-5
Figure 2-1 Extra High Voltage Transmission Network
2.3 General Approach The Partners proposed preliminary project definitions for TransWest Express and Gateway South based on previous analysis. The co-development of the projects provides an opportunity to consider other configurations with the potential of a better combined solution. To study and evaluate the opportunities and to consider and update the prior work, the EWG engaged Black & Veatch to perform three general tasks and to report on the findings as follows:
• Develop overall cost estimates (capital and $/MW) of various project configurations and routes.
• Identify potential savings with joint project development.

Black & Veatch Introduction
February 29, 2008 2-6
• Provide a qualitative assessment of system performance impact associated with various AC, DC, and hybrid solutions.
The overall selection process for the configurations of the projects is made up of several consecutive screening processes. These screenings could be viewed as a series of funnels with the wide array of conceptual options considered in the first screening, a more detailed yet still conceptual review of comparative project configurations in the second screening, and finally a progressively more detailed system analysis as the Partners seek Accepted Ratings for the projects within the Western Electricity Coordinating Council (WECC) rating process. Figure 2-5 is a depiction of these study funnels.
Figure 2-5
The first funnel consisted of the following steps:
• Define objectives and constraints. • Review previous studies. • Identify a wide range of potential solutions. • Perform a high level cost analysis.
Needs
Cost
Environment
• Define objectives and constraints • Consider previous studies • Identify range of solutions to take forth in
comparative evaluation • Determine technical/financial parameters to be
used in evaluation ~ 5 – 10 Solutions
STUDY FUNNELS
• Develop base model and study parameters • Perform high level cost analysis • Input from WECC Regional Planning Project
Review performed by Partners • Identify TWE and GS cases to be carried
forward into WECC rating process
• Perform power flow analysis & stability studies
• WECC Phase I non-simultaneous detailed studies
• WECC Phase II simultaneous studies
Power Flow
Studies
All Options
~2 Solutions
2 Final Solutions
Previous Work
Criteria
Technologies

Black & Veatch Introduction
February 29, 2008 2-7
• Identify the most attractive solutions to take forth into the second funnel. Section 3.2 contains an overview of the results from this first screening process. The second funnel (this report) consisted of the following steps:
• Develop a base model and study parameters for the power flow studies. • Perform a refined cost analysis. • Identify which TWE solution and which GS solution shall to be carried forward into the
WECC rating process. This report documents the process and findings from this secondary screening process. The third funnel consists of the following steps:
• Perform power flow and stability studies. • WECC Phase 1 detailed power flow and stability studies to establish a “planned” (non-
simultaneous) rating for each project. • WECC Phase 2 detailed power flow and stability studies to establish an “accepted”
(simultaneous) rating for each project.

Black & Veatch Project Alternatives
February 29, 2008 3-1
3 PROJECT ALTERNATIVES 3.1 Overview
The EWG identified the following variables that are combined to define a potential solution: • Combined transfer capacity from Wyoming into various locations in the Desert
Southwest: 4500, 6000, or 7500 MW. • Line voltage: 345 kV, 500 kV AC, 765 kV AC, and 500 kV HVDC (including
combinations of these). The EWG developed initial reference configurations for each project based on earlier studies conducted by each respective Partner. The initial reference configuration for TWE consists of a 500 kV bipole HVDC line from Wyoming to Phoenix. The initial reference configuration for GS consists of a double circuit 500 kV AC line from Wyoming to Mona, Utah and a 345 kV line from Sigurd, Utah to southern Nevada. Each of these initial project configurations nominally provide for 3000 MW of transmission capacity to increase Wyoming’s export potential. To initiate the analysis, the EWG assigned nominal capacities of 1500 MW for a 500 kV AC circuit, and 3000 MW for a 500 kV HVDC bipole line. Using 6000 MW as the transfer capacity for the initial reference case and a 1500 MW “building block” approach, the EWG elected to include a 4500 MW lower case and a 7500 MW upper case as a sensitivity analysis. The EWG identified the following variables that are combined to define a potential solution:
• Combined export transfer capacity: 4500, 6000, or 7500 MW. • Line voltage: 500 kV AC, 765 kV AC, and 500 kV HVDC (including combinations of
the three, and convertible options). • Tower configuration: Single circuit, double circuit. • Right-of-way usage: Independent rights-of-way, common corridors. • Generation location: NE Wyoming, SE Wyoming, SW Wyoming. • Transmission interconnection/end points: Mona, Red Butte, southern Nevada (e.g.
Crystal or Marketplace), Phoenix (Pinnacle Peak). • Load sink or generation re-dispatch values at each interconnection point.
Line routes were based upon the preliminary right-of-way applications submitted to the Bureau of Land Management in November 2007. Figure 3-1 shows the map included within the right-of-way applications that depicts the preliminary proposed and alternative corridors. A corridor is generally defined as a broad geographical band with no predefined size or scale that follows a general directional space between major waypoints or terminal areas. Each corridor may contain multiple right-of-way paths or strips of land that can be secured for a transmission line.

Black & Veatch Project Alternatives
February 29, 2008 3-2
Figure 3-1

Black & Veatch Project Alternatives
February 29, 2008 3-3
3.2 Technical Considerations In addition to economics, there are a number of issues that need to be considered in choosing the technology and line voltage, including overall performance criteria, system impacts, ease of interconnections, and potential for future interconnections. APS demonstrated in their 2006 studies that HVDC is the best technical and economic choice for long point-to-point transmission lines. HVDC allows the utility to dictate exactly how much energy will flow on the line and will minimize the effect on the existing grid. The primary drawback of HVDC is the difficulty in placing intermittent terminals between end points. In addition to usually being cost-prohibitive, mid-terminals present technical challenges. The EWG considered a 3-terminal option feasible based on operational experience and included a Las Vegas third terminal within the evaluated configurations. PacifiCorp has proposed 500 kV AC technology as the nominal design for Gateway South (and Gateway West). The EWG reviewed this nominal design and confirmed that HVDC technology would not be appropriate for the GS segments. The distance between Wyoming and central Utah, approximately 400 miles, is just within the lower range of economic feasibility for HVDC technology. Given the potential need for future intermediate terminals, HVDC was not considered due to marginal economics on the initial configuration and the high cost of future interconnection points. The use of 765 kV AC was considered but ultimately was not pursued as a potential solution for the projects. The EWG and B&V analysis determined that a 765 kV AC circuit would need to be derated below optimal capacity due to the system characteristics in the Western Interconnection. To satisfy the WECC Performance Criteria, a 765 kV AC circuit that is nominally rated at 3900-5400 MW within the Eastern Interconnect would need to be derated to slightly above 3000 MW to match the largest single transmission contingency in the WI. A 3000 MW rating for 765 kV AC may still be an economic solution for 3000 MW capacity needs, however, there are other important factors that the EWG considered in its initial review of the viability of potential 765 kV solutions. From an environmental and cost perspective, it is desirable to concentrate circuits onto common structures or onto parallel lines within narrow rights-of-way. However, from a system reliability perspective, it is desirable to have parallel circuits separated to minimize the possibility of a single event (airplane crash, tornado, etc.) affecting multiple circuits. The EWG decided to limit the design transfer capacity to 3000 MW per structure, based on an analysis performed

Black & Veatch Project Alternatives
February 29, 2008 3-4
previously. Further analysis informed the basis for determining right-of-way widths being proposed for the projects. The analysis concluded that multiple 1500 MW circuits, each mounted on double circuit structures, could be co-located within 300-foot rights-of-way separated by a distance equal to or greater than the distance between towers along the length of the line. The use of 1500 MW building blocks, as opposed to 3000 MW (765 kV) blocks, also better aligns with the business needs of the Partners. Transmission expansion on the order considered by TWE and GS is quite complex and takes a number of years to materialize. Given these characteristics, the Partners need to maintain a degree of scalability within their plans to react to potentially changing needs for these projects, while still optimizing the use of corridors and minimizing environmental impacts. Utilizing a mix of 1500 MW (500kV AC) and 3000 MW (500kV DC) provides the partners with more flexibility in developing these projects over time. PacifiCorp has proposed the northern terminus for Gateway South be their proposed Aeolus substation, with a connection to the Wyoming grid southwest of Dave Johnston. They have proposed the southern terminus be at Nevada Power’s Crystal switching station. APS has proposed the northern terminal for TransWest Express be north of Dave Johnston, with a tie to the Wyoming transmission system. They have proposed the southern terminal be located near either Las Vegas or Phoenix. If terminated in Las Vegas, the plan would be to either counter-schedule power back to Phoenix or build an additional 500 kV AC single circuit line between Las Vegas and Phoenix, if necessary.
3.3 Economic Considerations The economic considerations being used in the evaluation of alternatives include the following:
• Capital costs (Details in Sections 4.1, 4.2, 4.3, 4.4, and 5.1). • Cost of electric losses. • Capital costs per MW of capacity per delivery point.
These costs were used to make comparisons between the various alternatives analyzed. In addition, the following economic considerations were incorporated into a qualitative analysis of benefits afforded through co-development:
• Timing impacts. • Shared development and permitting costs. • Shared right-of-way costs.

Black & Veatch Project Alternatives
February 29, 2008 3-5
• Shared procurement costs. • Shared construction management and environmental monitoring costs. • Shared maintenance costs.
Note that the economic benefits derived through co-development were not factored into the economic results used within the initial comparison of configurations.
3.4 Studied Alternatives After performing high level screening studies, the EWG identified 12 of the most attractive options to study further. For study purposes, it was assumed that all parts of the projects were placed in service simultaneously for an estimate of rating improvements. It is recognized that these projects consist of multiple line segments which will actually be placed into service over a period of years and that intermediate costs and ratings will occur. These cases are shown in the figures in the Appendix and are characterized below:
Case No.
Case Description
Combined Cases
1 GS - 345 kV 2 GS - 500 kV 3 TWE – HVDC to PHX 4 TWE – HVDC to LV 5 Reference Case: GS 500 + HVDC to LV 2 + 4 6 GS – 4500 MW 7 GS 4500 MW + HVDC to PHX (total 7500 MW) 6 + 3 8 TWE – HVDC to LV + LV-PHX AC 9 GS 500 kV + HVDC to PHX 2 + 3 10 GS 500 kV + HVDC to LV + LV-PHX AC 2 + 8 11 GS 500 kV + HVDC to LV + 3rd Terminal at LV 12 GS 4500 MW + HVDC to LV + LV-PHX AC (total 7500 MW) 6 + 8
Cases 1, 2, and 6 represent the Gateway South (GS) stand-alone cases:
• Case 1 represents Gateway South as currently proposed by PacifiCorp. It consists of a double circuit 500 kV line between Aeolus and Mona (~3000 MW) and a single circuit 345 kV line between Sigurd and Crystal (~800 MW).
• Case 2 represents Case 1 with the Mona-Crystal segment upgraded to 500 kV. It has a capacity of ~3000 MW between Aeolus and Mona and ~1500 MW between Mona and

Black & Veatch Project Alternatives
February 29, 2008 3-6
Crystal once series capacitors are added to the Red Butte to Harry Allen line and the transformers are upgraded at Harry Allen.
• Case 6 represents Case 2 with an additional single circuit 500 kV line (~1500 MW) between Dave Johnston and Mona, and with a double circuit 500 kV between Mona and Crystal. The total Wyoming export capacity of this case is 4500 MW.
Cases 3, 4, and 8 represent the TransWest Express (TWE) stand-alone cases:
• Case 3 represents TransWest Express as currently proposed by APS. It consists of a 500 kV HVDC transmission line between Wyoming and Phoenix.
• Case 4 is identical to Case 3 except with the southern HVDC terminal near Las Vegas. • Case 8 is identical to Case 4 except with an additional single circuit 500 kV line between
Las Vegas and Phoenix. Cases 5, 9, 10, and 11 represent combined GS and TWE cases with a nominal capacity of 6000 MW:
• Case 5 represents the Reference Case. It consists of the GS 3000 MW case (Case 2) plus the TWE Wyoming-Las Vegas HVDC case (Case 4).
• Case 9 is identical to Case 5 except with the southern HVDC terminal near Phoenix. • Case 10 is identical to Case 5 except with an additional single circuit 500 kV line
between Las Vegas and Phoenix. • Case 11 is identical to Case 9 except that it includes a third terminal in the Las Vegas
area. Cases 7 and 12 represent combined GS and TWE cases with a nominal capacity of 7500 MW:
• Case 7 represents a combination of the GS 4500 MW case (Case 6) plus the TWE Wyoming-Phoenix HVDC case (Case 3).
• Case 12 is identical to Case 7 except with the southern HVDC terminal near Las Vegas and a single circuit 500 kV line between Las Vegas and Phoenix.

Black & Veatch Project Components and Unit Costs
February 29, 2008 4-1
4 PROJECT COMPONENTS AND UNIT COSTS 4.1 Transmission Line Components and Unit Costs
All structures were assumed to be self-supporting lattice steel towers. Tower weights and foundation sizes were estimated based upon the following:
• Conductor sizes selected. • 1300’ ruling span and 1500’ maximum span. • NESC Medium and 90 mph high wind load cases.
A conductor analysis was performed to determine conductor sizes for the 500 kV AC and 500 kV HVDC transmission lines. A likely range of conductor bundle configurations was first evaluated on the basis of economics. In each analysis, the three most economical conductors were then evaluated on the basis of construction, operations, and maintenance issues. The methodology developed allowed a comparison of up to ten different conductor alternatives (number in bundle and size of conductors) under four different sets of technical/economic criteria. General technical inputs included project load, line voltage, line length, power factor, load factor, system loss factor, and generation reserve factor. The methodology also contained a number of inputs used to calculate structure costs such as sag/tension data for the anticipated spans, loading criteria, mix of structure types, and component unit costs. Economic inputs included cost of energy, cost of demand, escalation cost factor, discount rate, financing interest rate, period of financing, generation fixed charge rate, line fixed charge rate, and fixed annual cost, and number of years to be considered for the present worth analysis. The methodology calculated estimated tower heights (maximum constrained to 199’ to avoid the need for aircraft lighting), point loads, leg loads, tower weights, foundation sizes, and per mile capital costs. It also calculated the cost to generate losses in terms of energy costs and demand costs by year. The methodology was then used to perform a present worth analysis combining capital costs, energy resistive loss costs, and demand resistive loss costs. The following economic parameters were provided by PacifiCorp for use in the conductor sizing analysis for both GS and TWE:
Cost of losses (includes capacity charge component): $55/MWH Capital carrying charge: 12.55 %/yr Discount rate used in present worth calculations: 7.30 % Escalation cost factor used in present worth calculations: 2.08 %
Other parameters used in the analysis included the following:

Black & Veatch Project Components and Unit Costs
February 29, 2008 4-2
Percent of capital costs financed: 100 % Period of financing: 50 years Generation reserve margin: 15 % Years of analysis for present worth calculations: 40 years
For purposes of this report, a 75% load factor was assumed for both GS and TWE. The analysis included a range of load factors to test the sensitivity of this assumption to the results. The effect of taxes was not taken into account for this analysis. Prior to making a recommendation on conductor sizes, the three most economical conductors were also evaluated on a qualitative basis for the following:
• Corona/noise performance. • EMF performance. • Ice loading and galloping conductor performance. • Spacer/vibration damper or spacer-damper requirements. • Anticipated reel sizes and quantities of splices. • Construction equipment requirements (e.g., pullers, reel trailers, presses). • Site work impacts due to larger equipment (e.g., road widths, size of pulling sites). • Existing utility standards. • Emergency stock.
Based upon a combination of economics and an evaluation of the above factors, the following conductor sizes were chosen for the project:
• 500 kV AC Conductor: 3 Lapwing – ACSR/TWD (1943 kcmil) per phase. • 500 kV HVDC Conductor: 4 Lapwing – ACSR/TWD (1943 kcmil) per phase for the
Wyoming-Las Vegas options and 4 Bluebird – ACSR/TWD (2647 kcmil) per phase for the Wyoming-Phoenix options.
The final per mile costs used to evaluate the alternatives are tabulated below:
345 kV Single Circuit
500 kV Single Circuit
500 kV Double Circuit
500 kV HVDC Bipole*
Construction Cost $0.96 M $1.45 M $2.60 M $1.24 M Construction Cost + Right-of-Way $1.27 M $1.89 M $3.00 M $1.65 M Const. Cost + ROW + Development + Taxes
$1.40 M $2.03 M $3.18 M $1.79 M
Const. Cost + ROW + Development + Taxes + 10% Contingency**
$1.53 M $2.22 M $3.48 M $1.96 M
* Assumes (4) 1943 Lapwing ACSR/TWD per pole on HVDC ** 10% Contingency applied to Construction Cost + ROW only

Black & Veatch Project Components and Unit Costs
February 29, 2008 4-3
4.2 Substation Configurations and Costs All substations are assumed to be breaker-and-one-half bus configurations. Substation equipment is assumed to be rated for 3000 amps. It is anticipated that the existing 500 kV substations at Crystal and Marketplace have room for expansion. It is assumed that all other 500 kV substations will be constructed on new sites and that Aeolus will be jointly developed with the Gateway West participants. A typical 345/500 kV substation with 1500 MVA of transformation was assumed to cost $46 million. The cost of series capacitors/series compensation was assumed to be $5 million per 345 kV installation and $10 million per 500 kV installation. The cost of phase shifting transformers was assumed to be $15 million per 345 kV installation and $25 million per 500 kV installation. The following table illustrates major substation equipment anticipated to be required for the Reference Case, Case 5. Final requirements will be determined by future studies. This list does not include generation step-up transformers or other equipment associated with the Wyoming generation facilities. Gateway South Equipment Rating Quantity 500 kV Phase-Shifting Transformer 750 MVA (indicative) 2 500/345 kV Transformer @ Mona and Red Butte 1500 MVA (indicative) 2 345/230 kV Transformer @ Harry Allen 1500 MVA (indicative) 2 500 kV Circuit Breaker 3000 amp, 40-63 kA 21 345 kV Circuit Breaker @ Mona and Red Butte 3000 amp, 40-63 kA 7 500 kV Shunt Reactor w/circuit breaker 150 MVAR 11 500 kV Series Capacitor Bank 60% - 80% Compensation 6 345 kV Series Capacitor Bank 60% - 80% Compensation 1
TransWest Express Equipment Rating Quantity 500/230 kV Transformer at North 1500 MVA (indicative) 1 500 kV Circuit Breaker at North 3000 amp, 40-63 kA 14 500 kV Circuit Breaker at South 3000 amp, 40-63 kA 9 500 kV Circuit Breaker at southern interconnection 3000 amp, 40-63 kA 8 230 kV Circuit Breaker at North 3000 amp, 40-63 kA 12 Static VAR Compensator (SVC) -100 to -300 MVAR
(indicative) 1
HVDC converters, converter transformers, filters, and shunt capacitors
Ratings applicable to 3300 MW DC power
2
4.3 Converter Station Capacities and Costs A ±500 kV, 3300 MW nominal, HVDC converter station was assumed to cost $375 million, not including the cost of the adjacent AC substation and either a static var compensator (SVC) or a

Black & Veatch Project Components and Unit Costs
February 29, 2008 4-4
static synchronous compensator (STATCOM), which were added to the TWE project cost estimate separately. It is anticipated that there is adequate space for a converter station and attendant facilities near the Marketplace Substation south of Las Vegas. The area around Pinnacle Peak Substation north of Phoenix is constrained, so it is anticipated that a converter station could be located at least 10 miles to the north. The TWE Project will use a conventional bipole HVDC system. The system will be designed for normal balanced operation without metallic return. The converter stations at each end of the project will include a DC switchyard, valve hall, converter transformers, 500 kV AC switchyard with filters, and a 500 kV AC substation for connection to the local grid system. The HVDC converter will be capable of continuously delivering 3000 MW at either end of the system with both poles in service. Based on approximately 10% overall losses, the HVDC converter systems will be rated 3300 MW. The initial work by APS indicated the use of a ±500 kV HVDC system and that assumption has been used in this report and continues to appear as the appropriate choice. However, as part of further studies, consideration of the next voltage class (±600 kV) should be examined to possibly reduce system losses, improve voltage regulation, or to reduce conductor size. These changes will need to be closely compared to the increased equipment costs and capability of suppliers in this voltage range. Each converter will also be equipped with converter bypass switches to allow for operation during contingencies in monopole configuration with metallic return using the non-functioning pole. In monopole configuration, each pole will have a short-term ability to support at least a 10% overload with a ramp down back to the nominal rating over a 30 minute period. Further studies will be necessary to determine the power flow and duration that will be permissible during monopole operation. The TWE converter station costs are based on a 3300 MW nominal facility with the short-term overload capability described above. Additional studies may indicate a cost beneficial upgrade to the converter station that would allow for a monopole operation above the 10% overload levels at higher capacities and/or for longer periods. For example, the Intermountain Power Project includes an HVDC system that was initially rated 1600 MW with each pole rated 1200 MW continuous and 1600 MW short term. Each pole of the bipole was therefore designed for a temporary 100% overload, which decreases at a rate of 60 MW/min to a continuous overload of 50%. Further studies may indicate the need for an SVC or STATCOM at one or both of the HVDC converter stations. The strength of the AC network at the HVDC terminals is an important factor in determining the performance of the HVDC system. An initial assessment of the adequacy or strength of the system is commonly performed using a short circuit ratio (SCR) approach.

Black & Veatch Project Components and Unit Costs
February 29, 2008 4-5
When an HVDC converter is connected to a weak AC system, i.e., with low SCR, the following issues need to be addressed at the rectifier and inverter ends: Rectifier
• High temporary over voltages. • Low frequency resonances. • Long restart times.
Inverter
• High temporary over voltages. • Low frequency resonances. • Risk for voltage and power instability. • Long restart times. • High risk for commutation failures.
If that ratio is less than desired (typically an SCR of 2.5) based on the anticipated power flow, then it is necessary to supplement the terminal with an SVC or STATCOM. In the case of TWE, the southern terminal (either Phoenix or southern Nevada) is located in well-interconnected, strong networks with an abundance of existing generation. However, the northern terminal in Wyoming is located in a much weaker network and generation system that will ultimately evolve as part of this and other projects. Since the plan for this evolution to a stronger system cannot be predicted with a high degree of certainty, it is appropriate to plan and budget for an SVC at the northern terminal in order to mitigate temporary overvoltages. Subsequent studies and sensitivity assessments of different generation types, sizes, and location build-out scenarios will be necessary for sizing of the SVC and final determination of the initial need for this device. For estimating the TWE Project costs, it was assumed that an SVC would be required at the northern terminal in Wyoming and that one would not be needed at the southern terminal in Nevada. To integrate the HVDC converters into the local grid, it was assumed that at least two interconnections are required. For modeling and study purposes, it was assumed that the northern terminal would be interconnected with transmission lines to the Wyodak and Dave Johnston generation facilities either directly or via intermediate 500 kV or 230 kV networks. Similarly, it was assumed that the southern terminal would be interconnected with the Marketplace, El dorado, and/or McCullough 500 kV substations. For estimating purposes, an amount equal to 100 miles of single circuit 500 kV AC transmission was added to the TWE Project costs to represent the sum total of the interconnections at both terminals.

Black & Veatch Project Components and Unit Costs
February 29, 2008 4-6
For modeling and study purposes, it was assumed that new generation would be developed in the vicinity of the northern terminal and that this new generation would be interconnected with the 500 kV AC substation adjacent to the terminal. The costs of new generation and the associated transmission facilities to interconnect with the HVDC terminal were assumed to be the responsibility of the generation developer and have not been included in the TWE Project cost estimate. A contingency allowance of 10% is included in the TWE Project cost estimate.
4.4 Capital Cost Development Transmission line costs for four different tower configurations were developed on a unit basis related to conductor type and size, type of structures/tower, number of structures, related hardware, and estimated ROW acquisition costs. The typical transmission line design assumptions and costs were reviewed by the EWG for general consistency with historical practices and/or accepted industry practices. The resulting cost was converted to a cost/mile basis for use in comparing the alternatives. The costs related to general project development, environmental, engineering, surveying, geotechnical work, substations, and converter stations were included in the appropriate unit costs. The quantity of components (e.g., line lengths, number of substations, etc.) included in each alternative was used with the unit costs to develop total costs.
4.5 Economies of Scale Gateway South and TransWest Express are each large projects on their own and can expect to see significant volume discounts from material suppliers. Few material suppliers have the capacity to handle even one of these projects in a timely manner, so the level of volume discounts for two large projects constructed at the same time would be minimal. Though there will likely be overlap in their construction schedules, the two projects are on different time schedules. A materials contract that assures a continuous level of manufacturing over a 2-3 year period would be especially attractive to any material supplier. Therefore, with the proper timing, combined material contracts for Gateway South and TransWest Express have the potential for additional quantity discounts. Transmission line material costs for the combined projects are estimated at $1.0 billion to $1.5 billion depending on the alternative. A 1% discount equates to $10 million to $15 million in savings, while a 5% discount equates to $50 million to $75 million in savings.

Black & Veatch Project Components and Unit Costs
February 29, 2008 4-7
Similarly, a combined construction contract that stabilizes the labor requirements over a 3-5 year period would be very attractive to any construction contractor. Transmission line construction costs for the combined projects are estimated at $1.3 billion to $2.0 billion depending on the alternative. A 1% discount equates to $13 million to $20 million in savings, while a 5% discount equates to $65 million to $100 million in savings.

Black & Veatch Alternatives Assessment
February 29, 2008 5-1
5 ALTERNATIVES ASSESSMENT 5.1 Capital Costs
The cost estimates provided in the tables were performed at a high level using industry pricing and validation from the Partners. The estimates are based on general pricing data from vendors and cost breakdowns of recent projects that have occurred in the US. Note that B&V did not request cost proposals from construction contractors or manufacturers as the estimate is intended for conceptual purposes of projected costs of the two transmission projects. For study purposes, it was assumed that all parts of the projects were built overnight and that all facilities were in place for an estimate of cost/capacity ratios. It is fully recognized that these projects will actually be placed into service over a period of years and that intermediate costs and ratings will occur. A cost summary is exhibited in Table 5-1 for each of the cases studied. The estimated project cost for Gateway South and TransWest Express range from $2.5 billion to $8.8 billion. The price differential is dependent upon a single project versus the two projects, along with the options of voltage level, double or single circuit transmission lines, and the mileage distance.
Table 5-1 Cost Summary
Case No.
Case Description
Wyoming Export
Project Cost ($M)
1 GS - 345 kV 3000 MW $2,510 2 GS - 500 kV 3000 MW $2,890 3 TWE – HVDC to PHX 3000 MW $4,160 4 TWE – HVDC to LV 3000 MW $3,080 5 Reference Case: GS 500kV + HVDC to LV 6000 MW $5,970 6 GS – 4500 MW 4500 MW $4,670 7 GS 4500 MW + HVDC to PHX 7500 MW $8,820 8 TWE – HVDC to LV + LV-PHX AC 3000 MW $4,040 9 GS 500 kV + HVDC to PHX 6000 MW $7,050 10 GS 500 kV + HVDC to LV + LV-PHX AC 6000 MW $6,930 11 GS 500 kV + HVDC to LV + 3rd Terminal at LV 6000 MW $7,470 12 GS 4500 MW + HVDC to LV + LV-PHX AC 7500 MW $8,710

Black & Veatch Alternatives Assessment
February 29, 2008 5-2
5.2 Relative Costs The nominal capacity of each transmission segment is tabulated by case in Table 5-2. The actual capacity of each path will need to be confirmed by studies, but the nominal capacities were estimated based upon the following assumptions:
• The existing path rating south of Red Butte is 300 MW. • With any one element taken out of service (N-1), the path rating is equal to the sum of the
emergency ratings of the remaining elements, not to exceed the sum of the emergency ratings of all new facilities.
One measure of economic efficiency, for the purpose of comparing the twelve alternatives in this report, is by evaluation on a capital cost per megawatt of capacity basis as tabulated in Table 5-3. This table shows how that cost goes up with increasing distance. A comparison of the GS cost to Crystal vs. the TWE cost to Marketplace illustrates how HVDC is more cost effective than AC over long distances. Table 5-4 translates the $M/MW costs from Table 5-3 into $/MWH delivery charges assuming a 12.55% capital carrying charge, a 75% load factor on all lines, and line losses.
Table 5-2 Total Capacity (MW)
Case Wyoming – Mona
Mona/Sigurd – Red Butte
Red Butte – Crystal
Wyoming – Marketplace
Wyoming – Pinnacle Peak
1 3000 800 800 2 3000 1500 1500 3 3000 4 3000 5 3000 1500 1500 3000 6 4500 3000 3000 7 4500 3000 3000 3000 8 3000 1500 9 3000 1500 1500 3000 10 3000 1500 1500 3000 1500 11 3000 1500 1500 3000 3000 12 4500 3000 3000 3000 1500

Black & Veatch Alternatives Assessment
February 29, 2008 5-3
Table 5-3 Total Capacity Cost ($M/MW)
Case Wyoming to Mona
(North Utah)
Wyoming to Red Butte
(South Utah)
Wyoming to Crystal
(North LV)
Wyoming to Marketplace (South LV)
Wyoming to Pinnacle Peak
(Phoenix) 1 $0.63 $1.04 $1.41 2 $0.59 $1.06 $1.34 3 $1.38 4 $1.03 5 $0.59 $1.06 $1.34 $1.03 6 $0.63 $0.98 $1.24 7 $0.63 $0.98 $1.24 $1.38 8 $0.99 $1.70 9 $0.59 $1.06 $1.34 $1.38 10 $0.59 $1.06 $1.34 $0.99 $1.70 11 $0.59 $1.06 $1.34 $0.99 $1.53 12 $0.63 $0.98 $1.24 $0.99 $1.70
Table 5-4 Delivery Charge* ($/MWH)
Case Wyoming to Mona
(North Utah)
Wyoming to Red Butte
(South Utah)
Wyoming to Crystal
(North LV)
Wyoming to Marketplace (South LV)
Wyoming to Pinnacle Peak
(Phoenix) 1 $12.30 $20.86 $28.28 2 $11.58 $21.27 $26.84 3 $29.86 4 $20.70 5 $11.58 $21.27 $26.84 $20.70 6 $12.45 $19.61 $24.86 7 $12.45 $19.61 $24.86 $29.86 8 $20.03 $34.77 9 $11.58 $21.27 $26.84 $29.86 10 $11.58 $21.27 $26.84 $20.03 $34.77 11 $11.58 $21.27 $26.84 $19.94 $32.93 12 $12.45 $19.61 $24.86 $20.03 $34.77
*Assumes 12.55% Capital Carrying Charge, 75% Load Factor, and line losses.

Black & Veatch Alternatives Assessment
February 29, 2008 5-4
5.3 Ability to Meet Needs Of the twelve alternatives studied, five (1, 2, 3, 4, and 8) provide 3000 MW of transfer capacity, one (6) provides 4500 MW of transfer capacity, four (5, 9, 10, and 11) provide 6000 MW of transfer capacity, and two (7 and 12) provide 7500 MW of transfer capacity. The projects have been proposed primarily to meet the following needs:
• Mona Substation – 1500 MW. • Red Butte/Crystal Substation – 600 MW. • Pinnacle Peak/Marketplace Substation – 3000 MW.
All the alternatives except 3, 4, and 8 could provide the desired amount of capacity at Mona and Red Butte. There are also significant needs in Las Vegas and Southern California which can be partially met by most of the alternatives to varying degrees. It is believed that there is an abundance of existing transmission capacity leading into Las Vegas and Southern California, especially from the vicinity of Marketplace Substation. Cases 3, 7, 9, and 11 are the only alternatives able to serve the loads at Pinnacle Peak with a direct HVDC connection. However, since the power between Phoenix and Las Vegas is normally flowing east to west, there exists a strong possibility that power could be counter-scheduled to Phoenix if sufficient additional capacity is brought into Las Vegas. Cases 4 and 5 show the southern HVDC terminal in Las Vegas, with no new transmission between Las Vegas and Phoenix. It is anticipated that this should allow at least 1000 MW to be counter-scheduled into the Phoenix area, though the power flow studies will determine what is technically practical. If it is not practical to counter- schedule enough power, then a single circuit 500 kV transmission line between Las Vegas and Phoenix would need to be added as shown in Cases 8, 10, and 12.
5.4 Construction Impacts The maximum amount of construction impacts occur when both projects are constructed independently. For joint projects, it is assumed that the use of common access roads, surveying crews, geotechnical investigation crews, material laydown sites, batch plant sites, etc., will result in a reduced level of environmental disturbance. Good coordination practices will also reduce the impact on the public.

Black & Veatch Alternatives Assessment
February 29, 2008 5-5
5.5 Power Flow Considerations Steady state power transfer limits of a long AC line depend on the transmission angle, i.e., the angle difference between the sending and receiving ends. However, increasing the transmission angle will potentially reduce the transient stability margin in a pure AC system. A parallel HVDC transmission line with appropriate power controllers can be used to provide additional damping power (torque). This essentially means that the parallel DC line can be used to increase the stability margin of the AC line, or for the same stability margin, addition of a parallel HVDC line can allow the parallel AC line to operate at a higher transmission angle and thereby at higher power transfer. For example, if the allowable transmission angle is increased from 37° to 40°, the AC line rating can be increased by about 4%. Implementation of such controls requires observability of a reliable AC system signal to initiate the control action. Application of the control requires detailed analysis during system studies and simulator testing of the HVDC control system. A number of factors influence the amount of increase in the AC transmission line rating. These factors include the relative capacity of the HVDC line to the parallel AC system, strength of the terminal AC systems feeding the HVDC line, short term overload capabilities of the HVDC equipment, and the specific control actions of the HVDC controllers. The expected steady state performance of each case is briefly discussed below. Case 1: It is expected that the double circuit 500 kV line between Aeolus and Mona will require one intermediate switching station that may also be used for intermediate series capacitors. Loop flows will be one of the major issues associated with this alternative and will have to be kept as low as possible with suitable series compensation. Phase shifters may also need to be considered. Case 2: In this alternative, loop flows will be expected in Utah and Nevada, and they will have to be kept as low as possible with series compensation and possible phase shifters. Cases 3, 4, and 8: The point-to-point HVDC line from the northern terminal will deliver the entire 3000 MW to either Pinnacle Peak or the Las Vegas area without introducing any loop flows either within Wyoming or Utah. The power transfer through the DC line can also be scheduled to track the power generated by wind resources to minimize the loop flows on the parallel AC connection. A large amount of reactive power sources such as shunt capacitors and harmonic filters will be required to support the converter operation.

Black & Veatch Alternatives Assessment
February 29, 2008 5-6
Case 5: This is a true parallel AC-DC transmission alternative. The Aeolus-Mona-Crystal line can pick up some of the loads during the outage of a DC monopole. The rating of the Aeolus-Mona-Crystal line can potentially be higher than in Case 2 due to the presence of the DC line. Case 6: This alternative will have the largest impact on the regional transmission systems in Wyoming, Utah, Nevada, and Arizona compared to all other alternatives. The advantage of this alternative will be the ability to pick up the loads by other circuits when one of the 500 kV circuits is lost. Case 7: This alternative will also have a very significant impact on the regional systems. Loop flows will have to be kept as low as possible with series capacitors and possibly phase shifters. Case 9: This is a somewhat parallel AC-DC transmission alternative. Due to the presence of the Aeolus-Mona-Crystal 500 kV double circuit line, the reactive power requirement for the HVDC converters will be slightly reduced. In addition, the Aeolus-Mona-Crystal line can pick up some of the loads during the outage of a DC monopole. The rating of the Aeolus-Mona-Crystal line can potentially be higher than in Case 2 due to the presence of the DC line. Also, during the immediate first stability swing, the AC system may improve stability for the duration necessary to trip generation connected to the DC line, thus potentially improving the DC line performance and potentially allowing for a DC line rating improvement of 1-2%. The estimated improvements in the AC and DC line ratings will be more dependent on the underlying network performance from Crystal to Phoenix than was noted in Case 2, thus the expected lesser potential rating improvement in the DC line. Cases 10 and 12: Similar to Case 5, these are true parallel AC-DC transmission alternatives and will have the advantage of load pick up by the AC lines due to the loss of a DC monopole. The AC lines will also get the benefit of slightly higher rating due to the presence of the DC line. Case 11: This alternative will have the most advantages compared to all other alternatives. This will have less loop flows and better ability to pick up the loads during the loss of an AC line or a DC monopole.
5.6 Dynamic Stability Considerations Power system stability is defined as that condition in which the difference of the angular positions of synchronous machine rotors becomes constant following an aperiodic system disturbance.

Black & Veatch Alternatives Assessment
February 29, 2008 5-7
In the case of a pure AC system, the dynamic stability performance is solely dependent on the spinning reserve and the kinetic energy stored in the turbine generator units. On the other hand, the dynamic stability of an AC-DC system can potentially be improved through the use of DC power controllers provided on the DC lines. For example, if a pole is lost in a bipole DC system, the power through the healthy pole can be increased to the short time rating of the converters and ramped down to the long term emergency rating as illustrated in the diagram below. With this type of control, the system is provided with the needed synchronizing power to keep the system stable. Similarly, the DC controllers can be used to provide the synchronizing power for the loss of a parallel AC line, thereby increasing the overall stability performance of an AC-DC system. Utilization of such controls is dependent on the ability to identify reliable signals to initiate the
control action and matching the control performance to the capability of the parallel AC system. Application of such controls requires detailed analysis during system studies and simulator testing of the HVDC control system. The expected dynamic stability performance of the different alternatives is briefly discussed below. Cases 1, 2 and 6: These alternatives will have AC lines only and hence the stability of the system will be mainly influenced by the existing generators, the new generators, and dynamic voltage control devices that may be installed.

Black & Veatch Alternatives Assessment
February 29, 2008 5-8
Cases 3, 4, 5, 7, 8, 9, 10, 11 and 12: Each of these alternatives will either have one or two HVDC lines. The power flow through a HVDC line is controllable and hence this feature may potentially be used to improve the stability of an AC system. The dynamic stability performance of these alternatives may be better than the other alternatives.

Black & Veatch Assessment of Independent Projects
February 29, 2008 6-1
6 ASSESSMENT OF INDEPENDENT PROJECTS 6.1 General
Six stand-alone cases were considered in this report, three for Gateway South and three for TransWest Express. This section summarizes the opinions of Black & Veatch and the Engineering Work Group with respect to the stand-alone projects. Case 1 is the GS 3000 MW option with 500 kV north of Mona, and 345 kV south of Sigurd. Its primary strength is that it is the lowest cost option. However, by design this alternative provides limited capacity for southern Utah and the Las Vegas area. It does not provide capacity to Phoenix. From a technical perspective, power flow studies will be required to confirm how much power can be transferred in the existing infrastructure between Mona and Sigurd and from Sigurd south. The concern is that some of the 3000 MW capacity between Aeolus and Mona could be stranded in Mona. It is assumed that this option can meet the current needs of PacifiCorp. Case 2 is the GS 3000 MW option with 500 kV between Aeolus and Crystal. Its primary strength over Case 1 is that it provides a significant amount of additional capacity south of Mona at a low incremental price. However, by design this alternative provides no capacity to Phoenix. Case 6 is the GS option with 4500 MW of capacity between Wyoming and Mona, and 3000 MW of capacity between Mona and Crystal. Its primary strength is that it adds the most capacity for southern Utah and the Las Vegas area. Its primary weakness is that it is the highest cost option for GS. From a technical perspective, adding another 500 kV circuit between Wyoming and Crystal (as compared to Case 2) improves reliability, but the additional cost may be prohibitive. It is assumed that some of the capacity delivered to Crystal could allow for reverse-scheduling of approximately 1000 MW flowing from Phoenix to Las Vegas (thereby helping Phoenix), but this would need to be confirmed by studies and contract agreements. Case 3 is the TWE option with 500 kV HVDC between Wyoming and Phoenix (Pinnacle Peak). Its primary strength is that it provides 3000 MW of firm capacity to Phoenix. Its primary weakness is that it provides no capacity to Utah or Nevada, though its transmission lines pass through both states. Case 4 is the TWE option with 500 kV HVDC between Wyoming and southern Las Vegas (Marketplace). Its primary strength over Case 3 is its reduced cost and its ability to serve southern Nevada and southern Utah. Its primary weakness is that it provides no firm capacity

Black & Veatch Assessment of Independent Projects
February 29, 2008 6-2
directly to Phoenix. It is assumed that approximately 1000 MW of power flowing from Phoenix to Las Vegas could be reverse-scheduled (thereby helping Phoenix), but this would need to be confirmed by studies. It is anticipated that reverse scheduling from Marketplace will be more easily accomplished than from Crystal (as discussed for Case 6). Case 8 is the TWE option with 500 kV HVDC between Wyoming and Marketplace and a 500 kV AC circuit between Marketplace and Pinnacle Peak. Its primary strength is its ability to serve southern Nevada, southern Utah, and Phoenix. Its primary weakness is the high incremental cost to provide 1500 MW of firm capacity between Las Vegas and Phoenix.
6.2 Development of One Project Only Each of the independent projects can meet the need of one utility to varying degrees, though none of the independent projects would be able to meet the needs of both APS and PacifiCorp. As discussed further in Section 7.1, there are a number of collaborative development opportunities and cost savings that would be forfeited without a partnering arrangement. Furthermore, it is anticipated that the power flow studies will show that path ratings and dynamic stability of each will be less without the companion project in place.
6.3 Independent Development of Two Projects The Western Interconnection will benefit from each project whether or not they are developed together. However, independent development would not yield the synergistic opportunities discussed in Section 7.2 relative to development, licensing/permitting, and engineering/procurement/construction. Independent development would alleviate some of the challenges discussed in Sections 7.3 and 7.4.

Black & Veatch Assessment of Collaborative Development
February 29, 2008 7-1
7 ASSESSMENT OF COLLABORATIVE DEVELOPMENT The preceding sections of this report have dealt with the more independent or stand-alone characteristics of the GS and TWE Projects. This section will address the potential benefits and some possible risks of staging the projects in a collaborative manner. In this sense the term collaborative has a very broad definition and generally includes development from concept to completion and perhaps beyond into operations and maintenance.
7.1 General It has been recognized throughout the electric transmission industry that the development of two transmission system projects, in generally the same location, in the same timeframe and with a certain degree of interdependence, would inherently produce substantial benefits to the project Partners, although it is difficult to be specific as to what these benefits are and just how substantial they may be. To develop opinions on the benefits, a list of metrics was developed to gauge the benefits of a collaborative effort. This list includes a vision from several perspectives including technical, environmental, costs, and other similar items. The next step was to look at the six composite project cases and compare them. This step is more about relative performance or cost and less about the question of whether collaborative development is a good approach to achieving the projects.
7.2 Key Opportunities The key opportunities for collaborative development occur at all phases along the timeline from conceptual development, to licensing and permitting, to detail design and construction, and finally into operation and maintenance. In each phase opportunities exist and likewise, decisions will be made that will either reduce or improve the potential benefits from the succeeding phase. The following table provides a list of key opportunities and some discussion about the potential benefits.
Key Opportunities Discussion Conceptual Development Phase System Planning Understanding and coordinating the terminal points, line capacities,
and resources can provide for better integration of the systems. In some instances the projects can depend upon each other during contingencies to allow for a brief duration of overloads to provide sufficient time for system adjustments to avoid triggering more severe performance criteria. Using common models and analysis

Black & Veatch Assessment of Collaborative Development
February 29, 2008 7-2
Key Opportunities Discussion approaches, such as adjusting generation or adjusting loads, can illustrate better the expected performance. The cost of performing studies will be reduced through the use of a common model and common study teams.
WECC Process The WECC Process is focused on Regional Planning and System Reliability. To the extent the projects are presented and analyzed on an integrated regional basis, the better the performance benefits can be presented.
Stakeholder Involvement Stakeholders prefer to see the more holistic picture rather than see grid improvements in a piecemeal fashion. Demonstrating the cooperation and planning that would occur on these major projects will build Stakeholder confidence and provide an excellent forum to discuss issues rather than pitting the projects against one another.
Approved Line Ratings Ultimately the WECC Process results in a set of approved line or element ratings. See Section 2.3. Subject to studies, it is anticipated the alternatives that have the TWE HVDC system well integrated with the GS network may achieve an increase in the path rating.
Development Flexibility Selecting a configuration that has better flexibility to scale capacity and segments and to adapt to changing load patterns, network changes, and to changing resources is preferred.
Scheduling/Staging Collaboration on both projects would allow sequencing of segments to provide for optimal short term transactions while the full network is being constructed.
Right-of-Way (ROW) Planning
Collaborative pursuit of rights-of-way for the projects will allow the Partners to develop criteria for the specific relative routing of the circuits.
Activity Cost Sharing Nearly all of the efforts in the project development phase can be cost shared by the Partners in some generally equal manner given the substantial amount of overlaps in background data, reporting, team meetings, administration, and similar areas.
Design, Procurement and Construction Design Engineering Benefits include using the same base data for material and
equipment specifications such as wind loads, ground resistivity, geotechnical tests, project administration, etc.
Surveying Surveying will be necessary for proper structure location and height determinations. It is quite practical to survey the full width of a single corridor in a single pass. Multiple corridors would require additional effort.
Geotechnical Geotechnical data will need to be collected for proper foundation design, which will include taking soil borings at various intervals. If both projects are in close proximity, the number of boring locations can approach half the number that would be required if built separately.

Black & Veatch Assessment of Collaborative Development
February 29, 2008 7-3
Key Opportunities Discussion Access Roads Developing the projects together will allow the use of common
access points, a single maintenance road path, and generally single work pads for stringing, marshalling, and other activities.
Environmental Surveys Part of the permitting process is the need to perform a variety of data searches and ground walk surveys for biological, cultural, botanical, etc. information. Doing those activities once in an area is much better than doing the same in two completely separate corridors.
Land Use In some instances linear facilities have been shown to have adverse effect on current and future land use. To the extent that these facilities are co-located the effects are reduced.
Public Disturbance Facility construction of most any size and duration causes some public disturbance, but this effect can be perceived to be less if the activity is completed in a timely manner and normalcy is restored once rather than twice.
Visual Effects Co-locating visible linear facilities gives the perception that while transmission lines can be seen and may interfere with certain views, that it is better to have them adjacent rather than in far-separated corridors.
Procurement - Materials/Equip.
While selection of materials and equipment would seemingly be very different for the projects, a fair amount will be similar. Items such as grounding material, optical shield wire, microwave communications networks, foundation rebar, etc., may be common to both projects and thus further economies of scale can be achieved. In the substation area, it may be practical to use similar components for all of the AC facilities, including those located near the HVDC terminals. The savings from handling procurement together is estimated to be 2%-5%. For comparison purposes, a conservative value of about 3% is suggested and used in this report.
Construction - Line Construction of the transmission lines to the extent they are co-located in space and time can produce significant savings in mobilization, productivity, setup times, etc. Judgment indicates that this savings can be 3%-10% for that part of the cost. This is a broad band based on different perspectives and methods, from stick-built efforts to helicopter construction. For comparison purposes, a conservative value of about 5% is suggested and used in this report. This cost savings is estimated to apply to about 75% of the transmission line costs where the potential for shared ROW exists.
Construction - Subs/Terminals
Some savings may be achieved at locations where both an HVDC terminal and an AC substation are to be co-llocated, but these are expected to be relatively small, perhaps less than 1% of the cost. For comparison purposes and a more conservative approach, this saving is ignored in this report.
Field Management All projects will have construction inspections and to the extent that

Black & Veatch Assessment of Collaborative Development
February 29, 2008 7-4
Key Opportunities Discussion more activities are happening in the same locations at the same time, costs will decrease.
Environmental Monitoring
All projects will have environmental monitors and to the extent that more activities are happening in the same locations at the same time, costs will decrease.
Activity Cost Sharing Some of the efforts in the design, procurement and construction phase can be cost shared by the Partners in some generally equal manner given the substantial amount of overlaps in background data, reporting, team meetings, administration, and similar areas.
Operation & Maintenance Outage Scheduling Based on a full implementation of the projects that were planned to
be interoperable, it will be more convenient to schedule outages needed for inspections, maintenance, or replacement of components than if little or no coordination at the beginning occurred.
Resource Buildout While beyond the scope of this report, it is understood that the generation resources will be developed over a period of time and will have different operating and availability characteristics. Viewing these projects as a somewhat common delivery path allows for each resource to also share use to a degree, thus allowing for improved utilization and coordinated build-out, rather than a situation where each project has unplanned and/or discrete and dedicated resources.
Market Accessibility/Rating
Based on a coordinated development approach, the projects will be viewed as a larger and more robust and reliable path with a better or more solid rating for resources to use than if developed in an uncoordinated manner.
Stores and Inventory To the extent that the projects are planned together and executed together, they can use some common components and even share regional stores and inventory for spare towers and other materials.
7.3 Key Challenges Developing the projects in concert can also introduce some challenges as briefly implied in the Key Opportunities table. Those challenges are present in each part of the timeline of the projects, but in general can be mitigated so as to not be considered a significant risk. In most all cases, any risk that would emerge from developing the projects together is the same as if they were developed individually.
7.4 Project Timing Considerations At the present time, the projects have stated completion schedules that are not fully synchronized. This timing issue can be mitigated by either slowing the GS Project or advancing

Black & Veatch Assessment of Collaborative Development
February 29, 2008 7-5
the TWE Project. Since all indications are that the GS Project is facing a more near term need, it appears that consideration of advancing the TWE Project is the more appropriate shift. However, advancing the TWE Project requires earlier commitments by APS both in approvals and in cash flow. It is expected that the TWE Project will require longer to construct than the GS Project, in part due to the greater line mileage and in part to develop the HVDC terminals. To capture the transmission line construction benefits, we have developed a schedule that shows the TWE Project starting at the same time as GS but finishing about one year later to account for these issues. A summary schedule is shown in Figure 7-1.
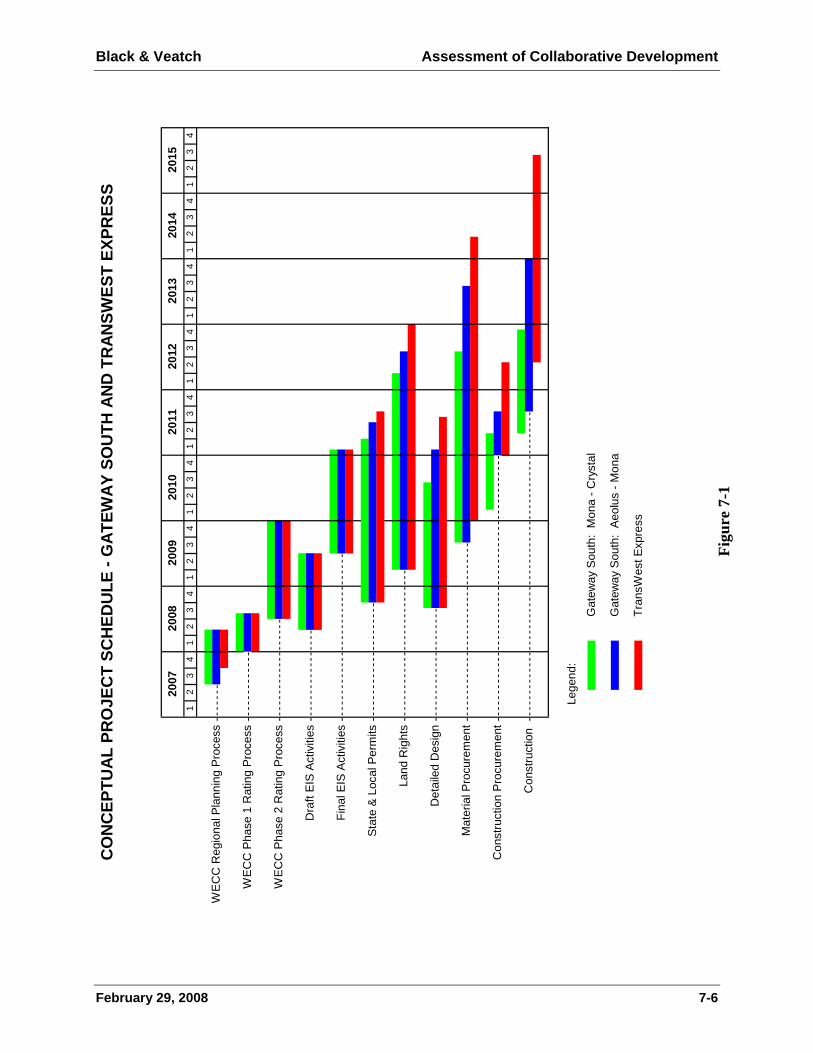
Black & Veatch Assessment of Collaborative Development
February 29, 2008 7-6
Figu
re 7
-1
----
---
----
----
----
-
----
----
----
----
---
----
----
----
----
-
----
----
----
----
----
----
----
---
----
----
----
----
----
--
----
----
----
----
----
----
----
----
----
----
----
----
-
----
----
----
----
----
----
----
----
-
----
----
----
----
----
----
----
----
----
----
----
----
-
----
----
----
----
----
----
----
----
----
----
----
----
----
----
-
Sta
te &
Loc
al P
erm
its
Land
Rig
hts
Det
aile
d D
esig
n
Mat
eria
l Pro
cure
men
t
WE
CC
Reg
iona
l Pla
nnin
g P
roce
ss
WEC
C P
hase
1 R
atin
g P
roce
ss
WEC
C P
hase
2 R
atin
g P
roce
ss
Dra
ft EI
S A
ctiv
ities
2007
12
34
2009
12
34
23
4
2011
12
34
2015
12
34
Con
stru
ctio
n P
rocu
rem
ent
Con
stru
ctio
n
Gat
eway
Sou
th:
Mon
a - C
ryst
al
2008
12
34
Fina
l EIS
Act
iviti
es
Lege
nd:
23
4
2013
12
34
2012
1
Tran
sWes
t Exp
ress
Gat
eway
Sou
th:
Aeol
us -
Mon
a
CO
NC
EPTU
AL
PRO
JEC
T SC
HED
ULE
- G
ATE
WA
Y SO
UTH
AN
D T
RA
NSW
EST
EXPR
ESS
2014
12
34
2010
1

Black & Veatch Assessment of Collaborative Development
February 29, 2008 7-7
7.5 Analysis of Combined Solutions Six GS/TWE combined solutions were considered in this report. This section summarizes the opinions of Black & Veatch and the Engineering Work Group with respect to the combined projects. The opinions build upon the assessment of independent projects discussed in Section 6.1. Case 5 is a 6000 MW case and is a combination of Case 2 (500 kV between Aeolus and Crystal) and Case 4 (HVDC between Wyoming and Marketplace). It provides a defined level of capacity to northern Utah, southern Utah, and southern Nevada. It is assumed that approximately 1000 MW of power flowing from Phoenix to Las Vegas could be reverse-scheduled to provide Phoenix with extra capacity, though this needs to be confirmed by studies. Case 7 is a 7500 MW case and is a combination of Case 6 (4500 MW GS case) and Case 3 (HVDC between Wyoming and Pinnacle Peak). Compared to Case 5, this case provides an increased level of capacity to northern Utah, southern Utah, and Phoenix, a reduced level of capacity to Las Vegas and has a cost that is about 44% higher. Case 9 is a 6000 MW case and is a combination of Case 2 (500 kV between Aeolus and Crystal) and Case 3 (HVDC between Wyoming and Pinnacle Peak). It provides an acceptable level of capacity to northern Utah, southern Utah, southern Nevada, and Phoenix. Compared to Case 5, this case provides an increased level of capacity to Phoenix, a reduced level of capacity to Las Vegas, and has a cost about 15% higher. Case 10 is a 6000 MW case and is a combination of Case 2 (500 kV between Aeolus and Crystal) and Case 8 (HVDC between Wyoming and Marketplace plus a 500 kV AC circuit between Marketplace and Pinnacle Peak). It provides a reasonable level of capacity to northern Utah, southern Utah, southern Nevada, and to Phoenix. Compared to Case 5, this case provides more capacity to Phoenix and has a cost that is about 16% higher. Case 11 is a 6000 MW case and is a combination of Case 2 (500 kV between Aeolus and Crystal) and Case 3 (HVDC between Wyoming and Pinnacle Peak), but also includes a third terminal at Marketplace. It provides a reasonable level of capacity to northern Utah, southern Utah, southern Nevada, and Phoenix. It affords the opportunity for selling all of the TWE capacity to either Las Vegas or Phoenix, with any combination in between. Compared to Case 5, this case provides more capacity to Phoenix and has a cost that is about 22% higher.

Black & Veatch Assessment of Collaborative Development
February 29, 2008 7-8
Case 12 is a 7500 MW case and is a combination of Case 6 (4500 MW GS case) and Case 8 (HVDC between Wyoming and Marketplace plus a 500 kV AC circuit between Marketplace and Pinnacle Peak). Compared to Case 5, this case provides an increased level of capacity to northern Utah, southern Utah, southern Nevada, and to Phoenix, but has a cost that is about 45% higher.

Black & Veatch Conclusions
February 29, 2008 8-1
8 CONCLUSIONS AND RECOMMENDATIONS 8.1 Conclusions
Although many of the metrics are based on professional judgment and experience, it is clear that most of the scenarios can be clearly separated and distinguished on an evaluated basis. The evaluation indicates the following conclusions:
1. The preferred solution is Case 5, which combines a GS Project alternative (Case 2) with a TWE Project alternative (Case 4). These cases are described as follows:
• Case 2 consists of a double circuit 500 kV line between eastern Wyoming (Aeolus) and central Utah (Mona) and a single circuit 500 kV line between Mona and southern Nevada (Crystal). The anticipated path ratings for GS are 3000 MW for the northern segment and 1500 MW for the southern segment. The total anticipated corridor length is approximately 725 miles.
• Case 4 consists of a bipole 500 kV HVDC line between eastern Wyoming and southern Nevada (Marketplace). The anticipated path rating for TWE is 3000 MW and the anticipated corridor length is approximately 885 miles. It is assumed that approximately 1000 MW of power flowing from Phoenix to Las Vegas could be counter-scheduled (thereby helping Phoenix), but this would need to be confirmed by studies.
• Case 5 is a combination of Case 2 and Case 4 with an anticipated path rating of 6000 MW.
2. Equivalent scenarios of the projects tend to indicate a generally flat cost per MW of capacity when considering the accuracy of the conceptual cost estimates. However, the HVDC system does indicate a lower cost per MW for longer distance point-to-point delivery (i.e., Wyoming to Nevada).
3. In addition to the resource needs ofAPS and PacifiCorp customers, there are significant resource needs in Las Vegas and Southern California which can be partially met by most of the alternatives to varying degrees. It is believed that there is an abundance of existing transmission capacity leading into Las Vegas and Southern California, especially from the vicinity of Marketplace Substation.
4. The GS 4500 MW (vs. 3000 MW) export sensitivity cases increase the cost on a $/MW basis for capacity between Wyoming and Mona, Utah by about 8%.
5. Upgrading the GS link from Mona south from 345 kV to 500 kV results in a lower cost per MW of capacity, though the extra capacity may exceed that needed to serve the native load. This upgrade does make sense from a regional perspective by increasing the

Black & Veatch Conclusions
February 29, 2008 8-2
efficiency of the proposed right-of-way corridor, thereby delaying the need for future transmission.
6. Adding a third terminal to the TWE system increases the overall capital costs and does not appear to be as cost effective on a $/MW basis as either delivering all of the capacity to the Phoenix area or terminating the HVDC in the Las Vegas area and counter scheduling some of the power to Phoenix utilizing the existing Arizona network, including the East of the River (EOR) transmission (Path 49).
7. It is anticipated that improvements in dynamic and contingency outage performance can be achieved with the presence of both the HVDC and AC elements of the project. Larger improvements are expected with the TWE termination in Southern Nevada than with the termination in the Phoenix Area.
8. In all scenarios, development of both the GS and TWE Projects in a collaborative manner indicated one or more improvements over development of the projects separately.
9. Estimated shared cost savings associated with joint project development through conceptual planning and permitting may be in the $10 million to $30 million range.
10. The estimated capital cost savings from collaborative development is 5% or more depending on scenario, when compared to simply adding together the costs if the projects were built independently.
11. Utilization of shared rights-of-way will need to be fully analyzed from a reliability standpoint to reduce the risk of potential line rating reductions due to outages of all lines in a common corridor.
8.2 Recommendations
Based on the work herein and the findings of this report, the following recommendations on next steps are provided:
1. Continue efforts toward collaborative development of the projects. 2. Take forward three alternatives for subsequent system studies and business case
evaluation. Based on the findings, this reduced set should include one case for the GS Project (Case 2), one alternative for the TWE Project (Case 4), and one integrated reference case (Case 5), which combines Case 2 and Case 4.
3. Stop further development of the other alternatives. The findings indicate that these alternatives are either not required and/or are not cost effective given the needs itemized within this report. Be willing to resurrect any of these alternatives if the studies show the needs have changed or if the predicted performance or cost estimates are unable to be confirmed.

Black & Veatch Conclusions
February 29, 2008 8-3
4. Continue system studies to confirm the statements made in the report regarding project performance and ratings and proceed with the WECC Phase 1 rating process.
5. Ensure that N-2 and common corridor impact and outage cases are fully vetted in the WECC process to reduce the risk of potential deratings due to impacts to Western Interconnection performance.
6. Confirm the estimated costs of the alternatives described in this report with additional input from equipment and material suppliers and construction companies.
7. Confirm the predicted overall schedule of the alternatives described in this report with additional input from equipment and material suppliers and construction companies.