gauge-adjusted rainfall estimates from commercial
TRANSCRIPT

Hydrol. Earth Syst. Sci., 21, 617–634, 2017www.hydrol-earth-syst-sci.net/21/617/2017/doi:10.5194/hess-21-617-2017© Author(s) 2017. CC Attribution 3.0 License.
Gauge-adjusted rainfall estimates from commercial microwave linksMartin Fencl1, Michal Dohnal1, Jörg Rieckermann2, and Vojtech Bareš1
1Department of Hydraulics and Hydrology, Czech Technical University in Prague, 166 29 Prague 6, Czech Republic2Eawag: Swiss Federal Institute of Aquatic Science and Technology, 8600 Dübendorf, Switzerland
Correspondence to: Martin Fencl ([email protected])
Received: 3 August 2016 – Published in Hydrol. Earth Syst. Sci. Discuss.: 5 August 2016Revised: 30 November 2016 – Accepted: 4 January 2017 – Published: 31 January 2017
Abstract. Increasing urbanization makes it more and moreimportant to have accurate stormwater runoff predictions, es-pecially with potentially severe weather and climatic changeson the horizon. Such stormwater predictions in turn requirereliable rainfall information. Especially for urban centres, theproblem is that the spatial and temporal resolution of rainfallobservations should be substantially higher than commonlyprovided by weather services with their standard rainfallmonitoring networks. Commercial microwave links (CMLs)are non-traditional sensors, which have been proposed abouta decade ago as a promising solution. CMLs are line-of-sight radio connections widely used by operators of mobiletelecommunication networks. They are typically very densein urban areas and can provide path-integrated rainfall obser-vations at sub-minute resolution. Unfortunately, quantitativeprecipitation estimates (QPEs) from CMLs are often highlybiased due to several epistemic uncertainties, which signif-icantly limit their usability. In this manuscript we thereforesuggest a novel method to reduce this bias by adjusting QPEsto existing rain gauges. The method has been specifically de-signed to produce reliable results even with comparably dis-tant rain gauges or cumulative observations. This eliminatesthe need to install reference gauges and makes it possible towork with existing information. First, the method is testedon data from a dedicated experiment, where a CML has beenspecifically set up for rainfall monitoring experiments, aswell as operational CMLs from an existing cellular network.Second, we assess the performance for several experimentallayouts of “ground truth” from rain gauges (RGs) with differ-ent spatial and temporal resolutions. The results suggest thatCMLs adjusted by RGs with a temporal aggregation of upto 1 h (i) provide precise high-resolution QPEs (relative er-ror < 7 %, Nash–Sutcliffe efficiency coefficient > 0.75) and(ii) that the combination of both sensor types clearly outper-
forms each individual monitoring system. Unfortunately, ad-justing CML observations to RGs with longer aggregation in-tervals of up to 24 h has drawbacks. Although it substantiallyreduces bias, it unfavourably smoothes out rainfall peaks ofhigh intensities, which is undesirable for stormwater man-agement. A similar, but less severe, effect occurs due to spa-tial averaging when CMLs are adjusted to remote RGs. Nev-ertheless, even here, adjusted CMLs perform better than RGsalone. Furthermore, we provide first evidence that the jointuse of multiple CMLs together with RGs also reduces biasin their QPEs. In summary, we believe that our adjustmentmethod has great potential to improve the space–time resolu-tion of current urban rainfall monitoring networks. Neverthe-less, future work should aim to better understand the reasonfor the observed systematic error in QPEs from CMLs.
1 Introduction
Water-related issues are one of the major challenges of mod-ern cities. Recently, more than 54 % of the world’s pop-ulation lives in urban areas and the number is continu-ously growing (United Nations, 2014). Increasing urbaniza-tion, together with undergoing weather and climatic changes,stresses the importance of efficient urban water managementfor preventing flooding and at the same time controlling pol-lution and ensuring sanitation. Rainfall is the main driverfor many urban hydrological processes. Hence, reliable rain-fall observations are crucial to informed decision making.Unfortunately, rainfall is very variable in both time andspace, which makes it challenging to observe reliably. Thisis especially true for rainfall monitoring for urban stormwa-ter management. Urban catchments usually consist of manysmall subcatchments with diverse land use characteristics.
Published by Copernicus Publications on behalf of the European Geosciences Union.

618 M. Fencl et al.: Gauge-adjusted rainfall estimates from commercial microwave links
In cities, large fractions of impervious surfaces reduce thetimes of concentration and conduits, such as gutters, streets,etc., drain stormwater runoff very efficiently. Thus, runoff re-sponses of urban catchments are usually very fast and greatlyinfluenced by the spatial distribution and temporal dynamicsof rainfall. Accurate predictions of rainfall–runoff, therefore,need rainfall information of high spatial and temporal reso-lution, which is difficult to get from point rain gauges (RGs)(Ochoa-Rodriguez et al., 2015).
The spatial representativeness of point rainfall observa-tions from RGs is, however, often limited, especially forthose heavy storm events, which determine the design of ur-ban stormwater systems. At many places around the world,S-band and C-band weather radars have therefore becomean integral part of operational networks of weather and hy-drological services. They can capture rainfall structure atthe mesoscale; however, typical spatial and temporal resolu-tion of radar’s gridded precipitation product (usually 5 minand 1 km2) is too low for urban hydrological applications(Ochoa-Rodriguez et al., 2015). In addition, radars measurerainfall hundreds of metres above ground (1 or 2 km of alti-tude at 100 km), due to the elevation of the radar beam andEarth’s curvature (Berne and Krajewski, 2013). Finally, lo-cal weather radars, which are capable of providing rainfallobservations at sub-kilometre/minute resolution, are rarelyavailable. In addition, the data quality of quantitative precip-itation estimates from radar in the heterogeneous urban en-vironment can be compromised by many influences from theurban topology and morphology (Tilford et al., 2002). Theextensive growth of GSM and other wireless networks in therecent decade around the globe opens new perspectives toimprove urban rainfall monitoring with non-traditional sen-sors. These are either cheap, simple sensors specifically de-signed for rainfall sensing (e.g. Stewart et al., 2012), or otherdevices, which are disturbed by or detect rain and hence pro-vide indirect rainfall observations, such as commercial mi-crowave links (CMLs).
A CML is a point-to-point radio system, which connectstwo remote locations. A CML features a radio unit and a di-rectional antenna transmitting a radio signal from one site(near end) to another (far end), where the signal is receivedby yet another unit. CMLs are commonly used by mobilenetwork operators as a wireless connection in their backhaulnetwork, but also by internet providers, military, and others.CMLs transmit electromagnetic waves, and therefore rainfallintensities can be retrieved in a similar fashion as for weatherradars. One important difference is, however, that a radarmeasures power of echoes reflected by raindrops, whereasquantitative precipitation estimates (QPEs) from a CML arebased on the rain-induced attenuation along its path (Atlasand Ulbrich, 1977).
Originally, the use of CMLs as rainfall sensors was sug-gested in the last century by Atlas and Ulbrich (1977). Inter-estingly, it has experienced a renaissance in the last decadewith an extensive growth of the GSM network (Leijnse
et al., 2007; Messer et al., 2006), and modern IT infrastruc-ture, which makes it possible to actually collect data fromhundreds or thousands of CMLs. First studies concentratedon algorithms for spatial–temporal interpolation (Goldshteinet al., 2009; Overeem et al., 2013; Zinevich et al., 2008) fromthe joint analysis of multiple CMLs. Bianchi et al. (2013a, b)reported detection of malfunctioning RGs and improvementof radar observations by CMLs. The great potential of CMLsfor ungauged regions was demonstrated by Doumounia et al.(2014). Interestingly, even though CML networks are mostdense in urban areas, and thus are ideally suited for urban hy-drological applications, there have been only very few inves-tigations reported, which focus specifically on CML rainfallat the scale and resolution required for urban rainfall–runoffmodelling (Fencl et al., 2013).
A CML network in urban areas is usually very densewith many short hops (< 1 km), which have the potentialto capture rainfall with a high spatial resolution. On theother hand, network management systems are typically con-figured to monitor CML power levels once in 15 min, oreven less often, which is insufficient for urban hydrologi-cal applications. Wang et al. (2012), however, showed thatit is technically possible to poll CMLs with the sub-minutesampling frequency. Fencl et al. (2015) and Chwala et al.(2016) demonstrated the feasibility of this approach on a realnetwork maintained by mobile operators. Unfortunately, theshort CMLs are very sensitive to antenna wetting (Kharadlyand Ross, 2001; Leijnse et al., 2008; Schleiss et al., 2013),which leads to substantial bias in their QPEs. Correcting thisbias is, therefore, crucial for exploiting the potential of CMLsfor urban hydrology.
1.1 Biased rainfall estimates from commercialmicrowave links
Rainfall sensing with CMLs is based on relating the levelof rain-induced attenuation to the rainfall intensity integratedalong the CML path. As both rainfall intensity and attenua-tion are moments of the drop size distribution (DSD), the re-lation between attenuation and rainfall can be approximatedby a power law:
R = αkβ , (1)
where R [mm h−1] is the rainfall intensity, k [dB km−1]is the specific path attenuation caused by raindrops, and α
[mm h−1 kmβ dB−β ] and β [–] are empirical parameters de-pending on frequency, polarization of CML, and DSD (Olsenet al., 1978). For the frequency range of CMLs commonlyused in cellular networks, the power-law approximation leadsto relatively low uncertainties in QPEs (Berne and Uijlen-hoet, 2007), compared to the other uncertainties contributingto the specific path attenuation k (Eq. 1), which are associ-ated with microwave propagation and CML hardware (Lei-jnse et al., 2008; Zinevich et al., 2010). Unfortunately, themicrowave path propagation is not only influenced by rain-
Hydrol. Earth Syst. Sci., 21, 617–634, 2017 www.hydrol-earth-syst-sci.net/21/617/2017/

M. Fencl et al.: Gauge-adjusted rainfall estimates from commercial microwave links 619
drop scattering and adsorption but also by a variety of otherphenomena such as the refractivity of air, gaseous attenua-tion, etc., which are often not measured directly. In addition,the additional signal power loss caused by the wetting of theantenna surfaces, so called wet antenna attenuation (WAA),is causing a systematic overestimation of rainfall. SeveralWAA models have been suggested to correct CML readingsfor this effect: from a simple empirically estimated offset(Overeem et al., 2011) to more complex semi-empirical mod-els (Kharadly and Ross, 2001; Leijnse et al., 2008; Schleisset al., 2013). Nevertheless, working with data from manyhundreds of antennas, we experienced that the wetting anddrying dynamics are complex processes, which not only aredependent on the individual antenna material and character-istics (type and material of radome, surface coating, orien-tation, exposure to the wind, height over ground, etc.), butalso are influenced by micro-weather and climate, such aslocal rainfall intensity, air humidity, wind speed, and air tem-perature, to just name a few. Thus, it is generally difficult tocorrectly predict WAA for a specific CML because (i) ourmechanistic understanding is limited and (ii) important inputdata are not available. Last, but not least, the reliability ofrainfall-induced path attenuation is also compromised by to-day’s inaccurate radio unit hardware, which measures trans-mitted (Tx) and received (Rx) signal levels of radio waveswith a quantization of up to 1 dB.
Such hardware-related influence factors are especially im-portant for short CMLs. In general, CMLs shorter than 1 kmcould be potentially most informative for urban rainfall mon-itoring, because (i) they could capture rainfall variability atthe microscale and (ii) their length corresponds with the di-mensions of urban sub-catchments. Unfortunately, they arealso less sensitive to rainfall, because they are comparablyless attenuated by rainfall than long CMLs, simply becauseless scattering occurs along the short path. Consequently,they are more sensitive to hardware-related errors (WAA andradio unit accuracy), which are path-length independent andthus contribute relatively more to the specific attenuation k inEq. (1) than the errors associated with microwave propaga-tion. In the future, we might have detailed models to predicthardware-related errors for each of the thousand CMLs of acommercial operator’s network. Up until now, the most fea-sible approach in our view is to compare, and possibly adjustCML estimated rainfall with ground rainfall observations toidentify and eliminate systematic errors in QPEs. However,to date, there is no established method how to best achievethis goal.
1.2 Adjusting rainfall estimates from commercialmicrowave links
As a first step, we reviewed the most relevant literature onadjusting rainfall radars. We found that (i) most common ad-justment methods are correcting the mean field bias of radarestimates to reference areal rainfall. The latter is usually cal-
culated from point RG observations using a variety of inter-polation methods (Smith and Krajewski, 1991), (ii) the criti-cal issue is the discrepancy between point RG observations,with a catch area of few dm2, and areal rainfall estimatedfrom radar measurements with pixel sizes in the order of1 km2, and (iii) this discrepancy is typically reduced by us-ing multiple RGs and also by rainfall aggregation over longerintervals, typically 1 h (Wilson and Brandes, 1979).
In this paper, we employ these findings to suggest amethod for continuous adjusting of commercial CMLs to cu-mulative rainfall from RGs. It is intended especially for urbancatchments where, according to our experience, RGs are of-ten available, but do not provide QPEs of sufficient resolutionneeded, e.g., for reliable rainfall–runoff modelling. The mainnovelty is that it is specifically tailored to the path-averagedattenuation of CMLs. Unlike radar reflectivity, this attenua-tion can be modelled by simplifying the power law of Eq. (1),as the β parameter of Eq. (1) is relatively close to unity. Ourresults demonstrate that we can substantially reduce system-atic errors from 50 % to about 7 %, which is very promisingfor the short CMLs in urban areas. In a fashion, our methodcan be viewed as a spatio-temporal disaggregation methodfor cumulative rain gauges based on the path-integrated high-frequent observations from CMLs. In our view, the combineduse of CMLs and RGs has, therefore, a very good potentialto improve the space–time resolution of current local rainfallmonitoring, which is of great importance for various applica-tions in urban hydrology. Moreover, it can contribute to ourdeeper understanding of rainfall behaviour at the microscaleand its implications for urban stormwater runoff.
The remainder of the paper is structured as follows: Sect. 2first describes the two experimental sites, second, presentsour suggestions to simplify the power-law model and, third,how it can be conditioned to local RGs. We also discuss suit-able statistics for performance assessment. Then, we presentthe results from two experimental sites, where in total fiveCMLs were adjusted by cumulative rainfall during differenttime intervals and from several different RG layouts. Finally,we discuss our approximation of the k–R relation togetherwith issues of model calibration and overall limitations ofthe adjustment approach and draw our conclusions.
2 Material and methods
This section first describes the experimental sites, their in-strumentation, and the experimental period in terms of rain-fall events. Second, a simplified attenuation-rainfall model isproposed together with a procedure on how to continuouslyadjust its parameters. Finally, we suggest suitable modelevaluation procedure and statistics for performance evalua-tion.
www.hydrol-earth-syst-sci.net/21/617/2017/ Hydrol. Earth Syst. Sci., 21, 617–634, 2017

620 M. Fencl et al.: Gauge-adjusted rainfall estimates from commercial microwave links
Figure 1. Experimental sites Prague-Letnany, CZ (left and middle panels), and Dübendorf, CH (right panel). Left panel: overview CZ, RGlayouts used for CML adjusting. Middle panel: detailed view on CZ, CMLs, and reference RGs. Right panel: detailed view on CH, CML,and the layout of reference disdrometers and RGs.
2.1 Experimental sites
We analyse datasets from two different experimental sites,Dübendorf (CH) and Prague-Letnany (CZ). The dataset fromDübendorf contains detailed reference rainfall measurementsalong a CML path, which provide an excellent basis for in-vestigating a rainfall from a single CML. In contrast, theareal rainfall observations from Prague-Letnany are more ap-propriate to analyse rainfall retrieval from multiple CMLsand thus more relevant to evaluate the proposed adjustingmethod for common urban hydrological applications.
2.1.1 Dübendorf
The Dübendorf (CH) site represents an experiment whereboth CML and rainfall measurements were controlled to ahigh degree (Wang et al., 2012). The field campaign started inMarch 2011 and was maintained for more than 1 year. In thepresent study, we use experimental period from June 2012 toSeptember 2012. The experimental set-up consisted of a sin-gle commercial CML (MINI-LINK Ericsson) and an arrayof five laser precipitation disdrometers (Parsivel, OTT Hy-dromet, Germany) placed along the CML path (Fig. 1, rightpanel). In addition, three tipping bucket RGs measure rainfallintensities, which make it possible to validate the disdrome-ter data. The CML is a 38 GHz simple duplex dual polarizedlink; i.e. the CML transmits and receives both vertically andhorizontally polarized radio waves in both directions (fromnear end to far end and vice versa). It is 1850 m long orig-inating at Dübendorf’s military airport and ending at mili-tary radar site at Wangen. The CML path is located mainlyover green surfaces of the airport and agricultural land. Here,we used data from a period where the automatic transmitpower control, which maintains a constant received signallevel (Rx) by adjusting the transmitted signal level (Tx) tominimize energy consumption and environmental radiation,was switched off. For details on data retrieval via SNMP and
pre-processing, see Wang et al. (2012) and Schleiss et al.(2013).
2.1.2 Prague-Letnany
In the Prague-Letnany (CZ) site, CMLs are an integral partof the existing cellular network and their operation is fullysubordinated to its primary telecommunication function. Theexperimental catchment Prague-Letnany is a small urbancatchment. The catchment area is 2.3 km2, being approxi-mately 2.5 km long in south–north direction and 1 km widein west–east direction (Fig. 1, middle panel). T-Mobile CZ,the mobile network operator, which has kindly been sup-plying us with CML data, operates approx. 20 CMLs inthe catchment (detailed view on CML network is providedin the supplementary material). The CMLs are located ap-prox. 40 m a.g.l. (above ground level) and their networkmostly follows a star-shaped design. Current Rx and Tx lev-els are polled from each CML via the SNMP protocol usingserver-sided java script and stored in a SQL database (Fenclet al., 2015). CMLs are polled in serial sequence, each ap-proximately 5 times per minute.
For the purposes of this study, we have selected four CMLsoperating at frequencies 25, 32, and 38 GHz (Fig. 1, mid-dle panel), which were not affected by communication out-ages and whose lengths correspond to the length scales of thecatchment and can, therefore, capture rainfall spatial variabil-ity at sub-kilometre scale. The selected CMLs are standardduplex links operated on MINI-LINK Ericsson platform withautomatic transmit power control configuration switched onduring the whole experimental period. The experimental pe-riod for the Prague-Letnany site was from June 2014 to Oc-tober 2014.
Reference rainfall observations are collected at four loca-tions by six tipping bucket RGs (MR3, Meteoservis v.o.s.,Czech Republic), two of them are collocated (Fig. 1, middlepanel). Each RG is dynamically calibrated (once a year), andchecked and maintained at least once a month. In addition,
Hydrol. Earth Syst. Sci., 21, 617–634, 2017 www.hydrol-earth-syst-sci.net/21/617/2017/

M. Fencl et al.: Gauge-adjusted rainfall estimates from commercial microwave links 621
five RGs from the operational rainfall monitoring network ofthe municipality are used (Fig. 1, left panel) to test the ef-fect of RG spatial layout on CML adjusting efficiency. TheseRGs are also dynamically calibrated (Stransky et al., 2007).All RGs are the same type with a catch area of 500 cm2 anda quantization of 0.1 mm.
2.2 Rainfall data
To validate the QPEs from CMLs, we use different referencerainfall information. For Dübendorf we take the mean of fivedisdrometers along the CML path (Fig. 1, right panel) andfor Prague-Letnany the mean of the six RGs (Fig. 1, mid-dle panel). The start of a rainfall event is set to the first ob-servation and the end to the last observation of all sensorsfor a corresponding event. The minimum dry interval be-tween events is taken to 30 min. In the case of Dübendorf,the events are defined based on disdrometer classification. Asin Prague-Letnany we use tipping bucket RGs, the beginningof an event is estimated to 15 min before the first tip and theend to 15 min after the last tip. Furthermore, the beginningand end of each event in the Prague-Letnany case study arerounded down to full hours for the start (and up for the end)to ease the analysis with aggregated rainfall intensities.
For the Prague-Letnany case study, we also investigatedin how far the limited spatial representativeness of RGs andthe spatio-temporal smoothing of peak rainfalls by the CMLaffect the performance. To this aim, we estimate three dif-ferent areal rainfalls (to which CMLs are adjusted) observedwith three different rainfall monitoring layouts A, B1 and B2(Fig. 1, left panel). The layout A is a single RG located insidethe catchment. This is a typical configuration used by en-gineering companies when calibrating rainfall–runoff mod-els of small urban catchments. Layouts B1 and B2 consistof three RGs located outside the catchment. In B1, RGs arerelatively close to the catchment. They form a triangle withedge lengths of 7.0, 5.4 and 2.8 km with the catchment areaapproximately in its centre. In B2, the RGs are more distantand form a triangle with edges 11.5, 9.6 and 8.2 km with thecatchment closer to the NE vertices (Fig. 1, left panel).
2.3 Simplified attenuation-rainfall model
For frequencies between 20 and 40 GHz, i.e. frequencies of-ten used by mobile network operators for shorter hops in ur-ban areas, β parameter of Eq. (1) is relatively close to unity;according to ITU (2005) this is 0.95 (20 GHz, vertical polar-ization) and 1.19 (40 GHz, horizontal polarization). To adjustCML continuously, we propose a simplified two-parameterattenuation-rainfall model, which combines linear approxi-mations of rainfall retrieval model (1) and models for wetantenna attenuation corrections (see Sect. 4.1):
R =
{γ (k − 1) if k > 1
0 if k ≤ 1(2)
where γ [mm h−1 km dB−1] is an empirical parameter re-lated to raindrop attenuation and other rainfall correlated sig-nal losses, k [dB km−1] is a specific attenuation after baselineseparation and 1 [dB km−1] is an offset parameter, whichcorrects for wet antenna attenuation and possible bias intro-duced by inaccurate baseline identification. The parameter 1
is constrained, to avoid model to produce negative rainfall in-tensity. The piecewise linearity of the relation makes it pos-sible to condition the model to rainfall and attenuation data,which were aggregated over relatively long intervals (e.g.hours) and at the same time predict rainfall for attenuationdata sampled at high frequencies.
The baseline for specific attenuation k is assumed to beconstant during each wet period. First, we classify the datainto dry and wet periods. Classification is performed accord-ing to Schleiss and Berne (2010) using a moving window ofthe length of 15 min. Second, we take the 10 % quantile ofthe total path loss values in the preceding dry weather periodas the best estimate.
2.4 Conditioning the simplified attenuation-rainfallmodel
First, RG rainfall intensities and CML attenuations are aver-aged to the same time resolution and appropriate aggregationintervals. The rainfall-attenuation model (2) is then contin-uously fitted on aggregated data using moving window ofN consecutive data points; i.e. for each time step i one set ofmodel parameters (γ , 1) is identified. Only data points withnon-zero rainfall are included into the calibration window asthe model is designed for wet weather periods. We tested dif-ferent window lengths (N = 3, 5, 10 points) and found thatthe optimal N in our case is 5 points (see Sect. 4.1. for moredetails). In general, a longer window (larger N ) reduces sen-sitivity to the random noise but requires stronger stationarityof error models.
The model (2) is fitted by minimizing cost function L us-ing a gradient method based on a quasi-Newton optimizationalgorithm L-BFGS-B implemented in the R language func-tion optim() (Byrd et al., 1995):
L =
i∑i−N+1
(Ri − Ri
)2, (3)
where R is observed aggregated RG rainfall and R is rainfallproduced by model (2). In this study, we carried out two con-secutive optimization runs for each attenuation-rainfall timeseries. First, an optimization run (a) is implemented withwide parameter ranges and the second run (b) is performedwith parameters constrained based on previous model real-izations. For the first optimization run (a), lower limits of
www.hydrol-earth-syst-sci.net/21/617/2017/ Hydrol. Earth Syst. Sci., 21, 617–634, 2017

622 M. Fencl et al.: Gauge-adjusted rainfall estimates from commercial microwave links
Table 1. Rainfall events selected for the evaluation at Prague-Letnany site, CZ, in 2014 and Dübendorf site, CH, in 2011. The maximalintensity Rmax and the total rainfall amount H are provided for each event. Short convective rainfalls with peak intensities up 90 mm h−1
and long low-intense stratiform rainfalls are included in the datasets.
Prague-Letnany, CZ Dübendorf, CH
Beginning Duration Rmax H Beginning Duration Rmax H
(2014) [min] [mm h−1] [mm] (2011) [min] [mm h−1
] [mm]
21 Jul 15:01 600 19.1 13.7 13 Jul 13:55:00 330 7.7 14.011 Aug 01:01 780 5.6 7.7 17 Jul 06:30:00 620 5.5 9.214 Aug 14:01 180 38.7 5.0 19 Jul 13:55:00 430 5.5 10.516 Aug 13:01 180 24.5 5.3 23 Jul 23:30:00 225 11.2 8.226 Aug 21:01 720 5.2 8.7 27 Jul 13:30:00 90 24.0 5.21 Sep 13:01 1200 2.7 12.9 27 Jul 17:20:00 125 22.7 5.911 Sep 13:01 1560 59.7 40.5 5 Aug 18:00:00 150 76.5 18.714 Sep 16:01 240 13.5 7.3 7 Aug 05:40:00 165 14.4 5.721 Sep 19:01 420 8.6 7.3 14 Aug 23:25:00 290 19.0 9.213 Oct 22:01 600 18.2 18.1 15 Aug 11:00:00 140 92.4 20.616 Oct 03:01 420 22.7 6.6 24 Aug 16:50:00 280 9.9 10.921 Oct 21:01 300 11.4 6.3 26 Aug 23:40:00 305 8.9 12.722 Oct 10:01 420 4.8 6.5 1 Sep 03:10:00 110 54.0 5.9
3 Sep 19:00:00 220 75.4 9.84 Sep 14:40:00 360 18.2 16.34 Sep 22:15:00 245 17.7 5.814 Sep 02:25:00 275 13.8 8.5
both parameters are set to zero. This avoids negative parame-ter values, which do not have a physical meaning. The upperlimit of the parameter γ is set to the value recommended byInternational Telecommunication Union (ITU) for parame-ter α in Eq. (1) (ITU, 2005) increased by 50 % to compensatefor the effect of exponent β in Eq. (1) during heavy rainfalls.The upper limit of the parameter 1 is set proportionally tothe inverse of CML length (5 dB km−1), which correspondsapproximately to wet antenna attenuation offsets reported byLeijnse et al. (2008).
New parameter ranges for optimization run (b) are esti-mated from parameter distribution of run (a): (i) parametervalues settled at upper limit are removed, as these are likelyto be associated with outliers, (ii) only parameters associ-ated with a specific attenuation k > 1 dB km−1 are consid-ered, and (iii) new parameter ranges are set from the remain-ing values as 5 and 95 % quantiles.
2.5 Performance assessment
We evaluate the adjusting method by directly comparingQPEs to reference rainfalls (Fig. 1, middle and right panels),both with a temporal resolution of 1 min. QPEs are adjustedover the whole experimental periods but evaluated only forrainfall events, which exceeded 5 mm in total, i.e. they arerelevant for stormwater management (Table 1). The adjust-ment is performed in the setting for historical rainfalls. Inaddition, results are compared with unadjusted CMLs pro-cessed by standard models with fixed parameters. The per-
formance of the algorithms is evaluated for each event andeach single CML. In the case of Prague-Letnany, also themean rainfall from all four CMLs is evaluated.
2.5.1 Rainfall estimation settings
First, we explore whether the proposed adjusting methodcan be used to disaggregate cumulative rainfall data, suchas hourly or daily values, to 1 min data. We adjust the CMLto cumulative rainfall during 5, 15, 30, 60 min, 3, 6, 12 h,and 1 day and evaluate the performance of retrieving 1 minrainfall data. We use the same RGs for adjustment and per-formance evaluation (Fig. 1, middle panel).
Second, we investigate the influence of the spatial layoutof RGs on CML adjusting on the Prague-Letnany case study(Fig. 1, left panel). We test several aggregation intervals (5,15, 30 min, or 1 h) for each RG layout (A, B1, and B2)to identify the optimal interval, which improve, on the onehand, the spatial representativeness of RG observations but,on the other hand, does not substantially smooth out rainfallpeaks.
Third, the QPEs from unadjusted CMLs are calculated us-ing a standard power-law model (1) and wet antenna cor-rections with fixed parameters. The Prague-Letnany CMLsare corrected for wet antenna attenuation using the con-stant correction as suggested by Overeem et al. (2011). TheDübendorf CML is corrected for wet antenna attenuation bya specific model suggested by Schleiss et al. (2013). Bothpower-law and wet antenna attenuation models are applied
Hydrol. Earth Syst. Sci., 21, 617–634, 2017 www.hydrol-earth-syst-sci.net/21/617/2017/

M. Fencl et al.: Gauge-adjusted rainfall estimates from commercial microwave links 623
under two scenarios: (S1) with parameters from literature(ITU, 2005; Overeem et al., 2011; Schleiss et al., 2013) and(S2) with local parameters inferred from the available refer-ence data (Fig. 1, middle panel).
2.5.2 Performance statistics
The Nash–Sutcliffe efficiency coefficient (NSE) is used toevaluate the ability of CMLs to capture rainfall temporal dy-namics. NSE is a relative measure, which gives compara-ble results of CML performance even for events of differentcharacteristics. Second, the systematic deviations of CMLsare assessed by plotting their QPEs against reference RGsand evaluated quantitatively by the slope of a linear regres-sion model without intercept. In addition, the relative error incumulative rainfall is calculated for each single event as therelative difference between the QPEs and reference rainfallamounts.
3 Results
First, the performance of CMLs when adjusted with rain-fall of different time resolution is presented. Both resultsfrom Dübendorf (CH) and Prague-Letnany (CZ) are shown(Figs. 2 and 3). Second, the influence of different RG lay-outs on CML adjusting is demonstrated on Prague’s dataset(Figs. 4 and 5). Finally, QPEs from adjusted CMLs are com-pared with the application of standard attenuation-rainfallmodels (Fig. 6). The CML performance is in all three casesevaluated on data with 1 min temporal resolution.
3.1 Influence of different aggregation intervals
The performance of CMLs adjusted by rainfalls aggregatedto 5, 15, 30, 60 min, 3, 6, 12 h, and 1 day intervals is pre-sented below. Relative error in cumulative rainfalls and NSEis shown for each link and aggregation (Fig. 2). In addition,for Prague-Letnany, the mean QPEs from all CMLs are eval-uated. It can be seen that the continuous adjustment performswell for aggregation intervals up to 1 h (relative error < 7 %,NSE > 75 %). CML QPEs adjusted to (sub)hourly data areassociated with low systematic errors and reliable rainfall in-tensities over the whole range from light to heavy rainfall(Fig. 2). We only find a slight underestimation of high in-tense peaks (Fig. 3), which might be due to mismatch be-tween point and path-averaged observations. The best per-formance is achieved when the QPEs from all CMLs areaveraged. This is probably due to the reduction of randomerrors when nearly unbiased rainfall information from multi-ple sensors is merged. In addition, multiple CMLs cover thecatchment area better than a single CML.
The performance of the adjustment algorithm substantiallydecreases when aggregation interval is increased from 1 to3 h and then further to 6 and 12 h (Fig. 2, NSE). This is prob-ably associated with the extent to which rainfall autocorre-
lation characteristics are preserved when aggregating rainfalldata to coarser time resolution (Appendix A). Hourly aggre-gations still seem to correspond relatively well to the tem-poral scale of rainfall peaks, whereas 3 h sums already of-ten smooth out peak intensities by averaging them over peri-ods of low-intensity or zero rainfall (Fig. A1). This averagingprobably impacts the identifiability of the parameters of thesimplified model (2).
When evaluating systematic errors for each event sepa-rately its variability is increasing with increasing aggrega-tion interval up to 12 h. Surprisingly, adjusting CMLs to dailyrainfall volumes leads to less variable results, although morebiased on average (Figs. 2 and 3). This might be caused bythe correlation structure of rainfall, where the correlation be-tween peak intensities is better preserved by daily rather than12 h aggregations (Appendix A, Fig. A1).
For the Dübendorf data, the method also does not per-form well for long aggregation intervals > 1 h (Figs. 2 and 3).However, here the mismatch most probably stems from thedifferent effect; antenna wetting attenuates the transmittedsignal for up to 6 h after rainfall has stopped (Fig. 2 inSchleiss et al., 2013). Aggregating these dry weather peri-ods with increased attenuation over longer time intervals thencauses substantial error in adjusted QPEs, because this pro-cess is not considered in the simplified model. Interestingly,we find that the drying times of CMLs from Prague-Letnanyare considerably shorter, mostly within few minutes. The rea-sons for this effect are not known.
3.2 Influence of different rain gauge layouts
The performance of the algorithm for different RG layoutsis evaluated on the Prague-Letnany dataset. For each layout,the rainfall was aggregated to 5, 15, 30 min, and 1 h time res-olution. We found that the best performance was achievedby averaging all four short CMLs located in the catchment– for all RG layouts. The performance of single CMLs isslightly worse. The relative differences between QPEs fromsingle CMLs and from their averages are in very similar pro-portions by all CMLs as when adjusting to reference rainfall(see the previous section). Therefore, only the performanceof averaged QPEs from all four CMLs is presented.
Layout A: CMLs adjusted by the single RG located in thecatchment measure very well both light and heavy rainfalls –with the exception of slight underestimation of high-intensepeaks over 30 mm h−1 (Fig. 4). The median systematic er-ror of CML QPEs corresponds to the bias of the single RG(Fig. 5). Nevertheless, adjusted CMLs clearly outperform asingle RG in terms of capturing rainfall temporal dynam-ics. The median NSE of CMLs is between 0.85 and 0.87,where the highest NSE (0.77–0.94) is obtained for an aggre-gation interval of 15 min. The inter-event variability of NSEslightly increases for longer aggregation intervals reachingvalues 0.70–0.90 for 1 h. These are much higher values of
www.hydrol-earth-syst-sci.net/21/617/2017/ Hydrol. Earth Syst. Sci., 21, 617–634, 2017

624 M. Fencl et al.: Gauge-adjusted rainfall estimates from commercial microwave links
Figure 2. Relative error (top panels) and Nash–Sutcliffe efficiency coefficient (NSE) (bottom panels) in QPEs of CMLs adjusted by rainfalldata of different time resolution. Each CML layout is represented by eight box plots corresponding to QPEs adjusted by rainfall aggregatedto time intervals from 5 min to 1 day. Each box plot depicts a range of the statistics during all evaluated events. Five groups of blue box plots(left panel) evaluate QPEs from single CMLs and from their average at Prague-Letnany. One group of orange box plots (right panel) depictsQPEs from a single CML at Dübendorf.
Figure 3. Comparison of CML QPEs adjusted by rainfall data of different time resolution to reference rainfall, from four averaged CMLsin Prague-Letnany (top panels) and one CML in Dübendorf (bottom panels). Scatter plots are shown only for selected aggregation intervals.Linear trend-line intersects are set to zero. Slopes of trend lines for all aggregation intervals are depicted in the right panels, showing alsoslopes of trend lines calculated for light rainfalls (R < 4 mm h−1).
NSE than those reached by the RG layout A alone, 0.52–0.78 with median 0.68 (Fig. 5).
Layout B1: CMLs adjusted to three rain gauges close tothe catchment perform slightly worse than CMLs adjustedby the layout A. In Fig. 4, a systematic underestimation ofintense rainfalls is visible. It is most pronounced for inten-
sities exceeding 30 mm h−1 and, in contrast, light rainfallsare overestimated by the CMLs. The bias in RG areal rain-fall used for adjusting (evaluated for each event separately)varies substantially more than the one from the layout A.This also leads to a higher variability in the systematic errorof QPEs. Interestingly, NSE for the CMLs (Fig. 5) is only
Hydrol. Earth Syst. Sci., 21, 617–634, 2017 www.hydrol-earth-syst-sci.net/21/617/2017/
M. Fencl et al.: Gauge-adjusted rainfall estimates from commercial microwave links 625
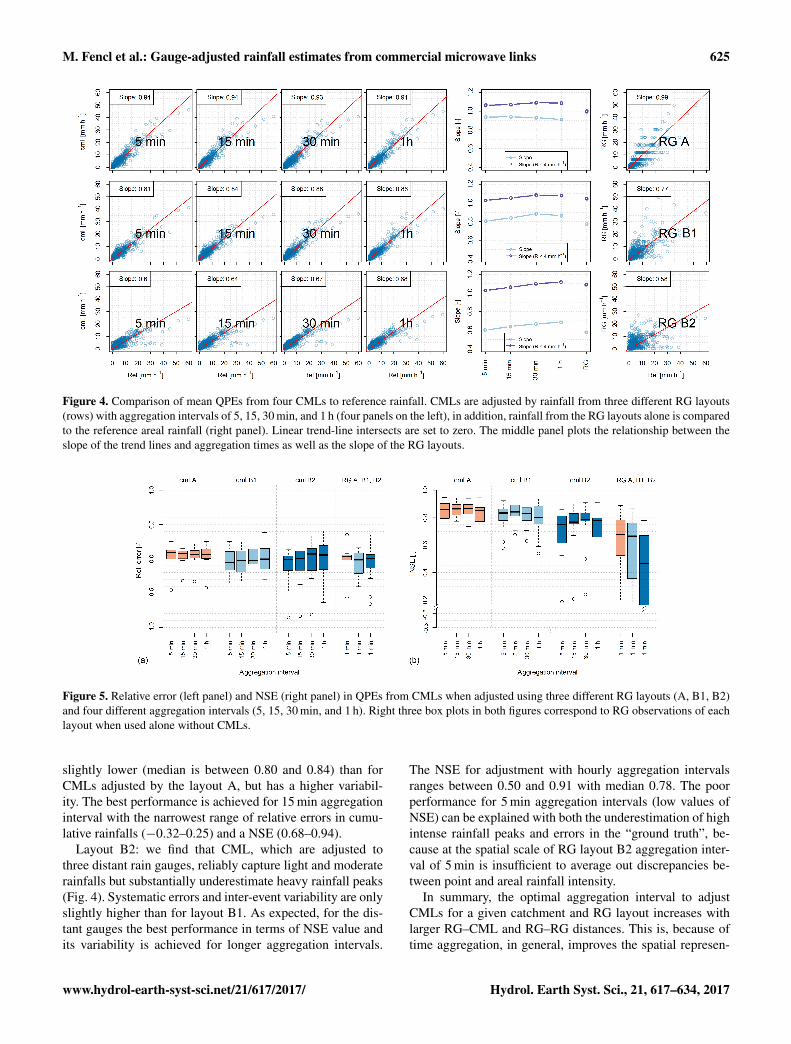
Figure 4. Comparison of mean QPEs from four CMLs to reference rainfall. CMLs are adjusted by rainfall from three different RG layouts(rows) with aggregation intervals of 5, 15, 30 min, and 1 h (four panels on the left), in addition, rainfall from the RG layouts alone is comparedto the reference areal rainfall (right panel). Linear trend-line intersects are set to zero. The middle panel plots the relationship between theslope of the trend lines and aggregation times as well as the slope of the RG layouts.
Figure 5. Relative error (left panel) and NSE (right panel) in QPEs from CMLs when adjusted using three different RG layouts (A, B1, B2)and four different aggregation intervals (5, 15, 30 min, and 1 h). Right three box plots in both figures correspond to RG observations of eachlayout when used alone without CMLs.
slightly lower (median is between 0.80 and 0.84) than forCMLs adjusted by the layout A, but has a higher variabil-ity. The best performance is achieved for 15 min aggregationinterval with the narrowest range of relative errors in cumu-lative rainfalls (−0.32–0.25) and a NSE (0.68–0.94).
Layout B2: we find that CML, which are adjusted tothree distant rain gauges, reliably capture light and moderaterainfalls but substantially underestimate heavy rainfall peaks(Fig. 4). Systematic errors and inter-event variability are onlyslightly higher than for layout B1. As expected, for the dis-tant gauges the best performance in terms of NSE value andits variability is achieved for longer aggregation intervals.
The NSE for adjustment with hourly aggregation intervalsranges between 0.50 and 0.91 with median 0.78. The poorperformance for 5 min aggregation intervals (low values ofNSE) can be explained with both the underestimation of highintense rainfall peaks and errors in the “ground truth”, be-cause at the spatial scale of RG layout B2 aggregation inter-val of 5 min is insufficient to average out discrepancies be-tween point and areal rainfall intensity.
In summary, the optimal aggregation interval to adjustCMLs for a given catchment and RG layout increases withlarger RG–CML and RG–RG distances. This is, because oftime aggregation, in general, improves the spatial represen-
www.hydrol-earth-syst-sci.net/21/617/2017/ Hydrol. Earth Syst. Sci., 21, 617–634, 2017
626 M. Fencl et al.: Gauge-adjusted rainfall estimates from commercial microwave links
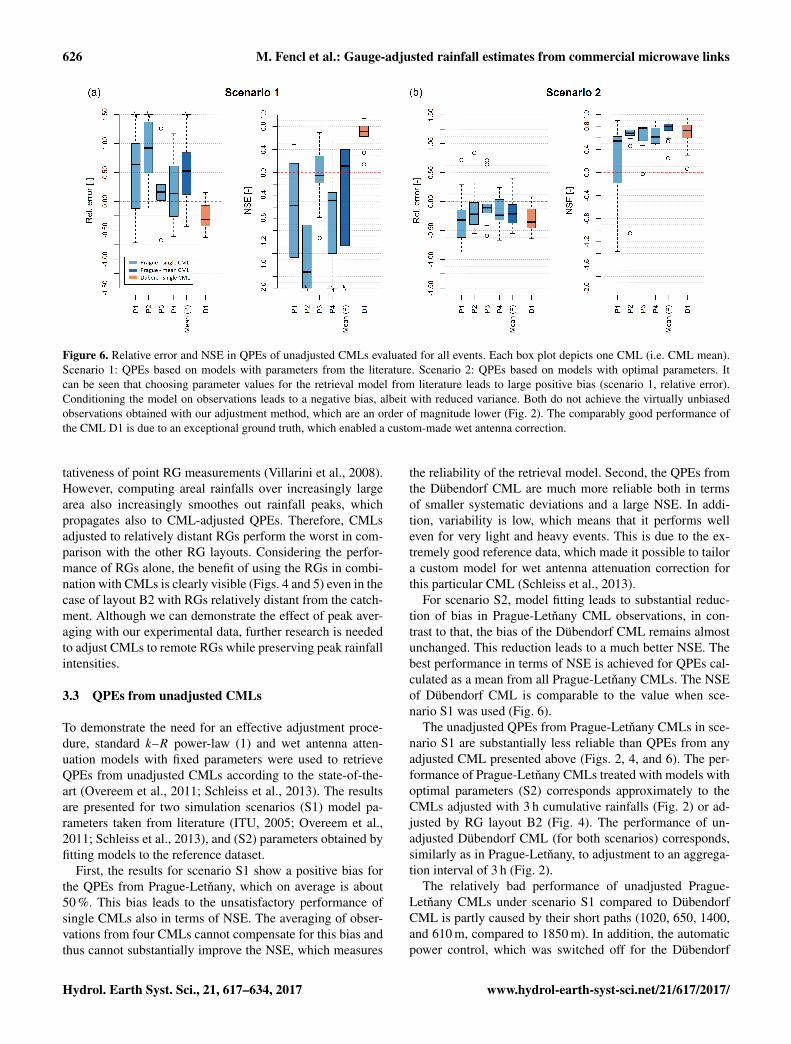
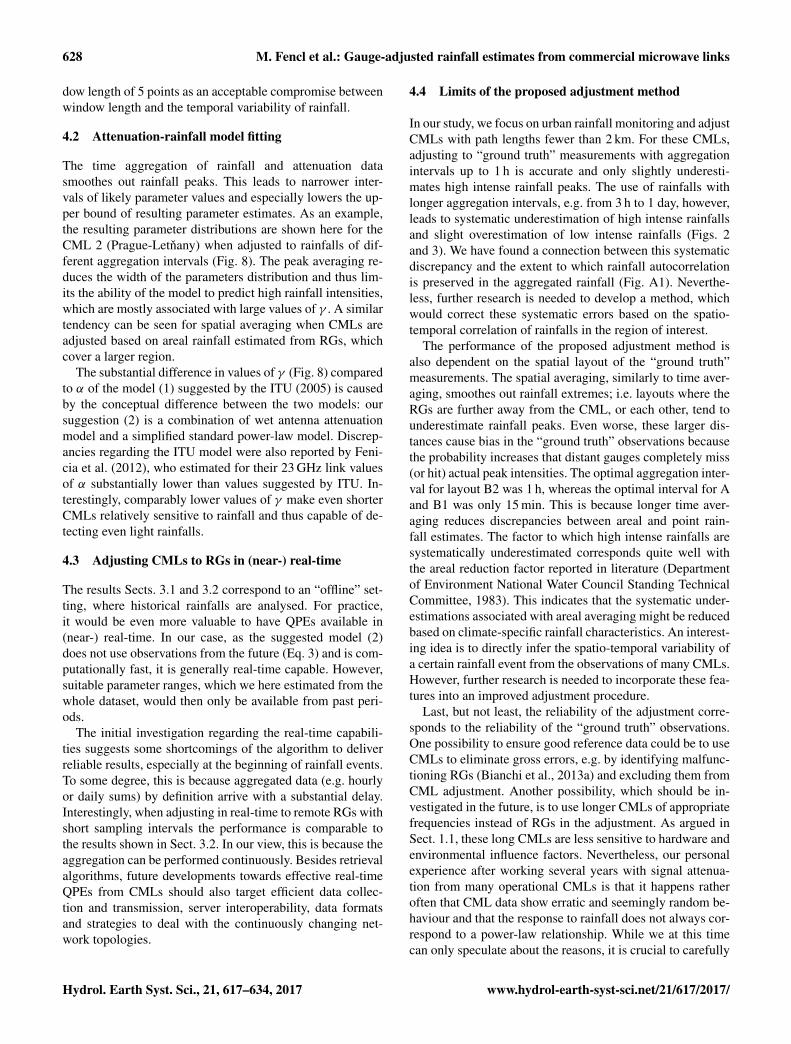
Figure 6. Relative error and NSE in QPEs of unadjusted CMLs evaluated for all events. Each box plot depicts one CML (i.e. CML mean).Scenario 1: QPEs based on models with parameters from the literature. Scenario 2: QPEs based on models with optimal parameters. Itcan be seen that choosing parameter values for the retrieval model from literature leads to large positive bias (scenario 1, relative error).Conditioning the model on observations leads to a negative bias, albeit with reduced variance. Both do not achieve the virtually unbiasedobservations obtained with our adjustment method, which are an order of magnitude lower (Fig. 2). The comparably good performance ofthe CML D1 is due to an exceptional ground truth, which enabled a custom-made wet antenna correction.
tativeness of point RG measurements (Villarini et al., 2008).However, computing areal rainfalls over increasingly largearea also increasingly smoothes out rainfall peaks, whichpropagates also to CML-adjusted QPEs. Therefore, CMLsadjusted to relatively distant RGs perform the worst in com-parison with the other RG layouts. Considering the perfor-mance of RGs alone, the benefit of using the RGs in combi-nation with CMLs is clearly visible (Figs. 4 and 5) even in thecase of layout B2 with RGs relatively distant from the catch-ment. Although we can demonstrate the effect of peak aver-aging with our experimental data, further research is neededto adjust CMLs to remote RGs while preserving peak rainfallintensities.
3.3 QPEs from unadjusted CMLs
To demonstrate the need for an effective adjustment proce-dure, standard k–R power-law (1) and wet antenna atten-uation models with fixed parameters were used to retrieveQPEs from unadjusted CMLs according to the state-of-the-art (Overeem et al., 2011; Schleiss et al., 2013). The resultsare presented for two simulation scenarios (S1) model pa-rameters taken from literature (ITU, 2005; Overeem et al.,2011; Schleiss et al., 2013), and (S2) parameters obtained byfitting models to the reference dataset.
First, the results for scenario S1 show a positive bias forthe QPEs from Prague-Letnany, which on average is about50 %. This bias leads to the unsatisfactory performance ofsingle CMLs also in terms of NSE. The averaging of obser-vations from four CMLs cannot compensate for this bias andthus cannot substantially improve the NSE, which measures
the reliability of the retrieval model. Second, the QPEs fromthe Dübendorf CML are much more reliable both in termsof smaller systematic deviations and a large NSE. In addi-tion, variability is low, which means that it performs welleven for very light and heavy events. This is due to the ex-tremely good reference data, which made it possible to tailora custom model for wet antenna attenuation correction forthis particular CML (Schleiss et al., 2013).
For scenario S2, model fitting leads to substantial reduc-tion of bias in Prague-Letnany CML observations, in con-trast to that, the bias of the Dübendorf CML remains almostunchanged. This reduction leads to a much better NSE. Thebest performance in terms of NSE is achieved for QPEs cal-culated as a mean from all Prague-Letnany CMLs. The NSEof Dübendorf CML is comparable to the value when sce-nario S1 was used (Fig. 6).
The unadjusted QPEs from Prague-Letnany CMLs in sce-nario S1 are substantially less reliable than QPEs from anyadjusted CML presented above (Figs. 2, 4, and 6). The per-formance of Prague-Letnany CMLs treated with models withoptimal parameters (S2) corresponds approximately to theCMLs adjusted with 3 h cumulative rainfalls (Fig. 2) or ad-justed by RG layout B2 (Fig. 4). The performance of un-adjusted Dübendorf CML (for both scenarios) corresponds,similarly as in Prague-Letnany, to adjustment to an aggrega-tion interval of 3 h (Fig. 2).
The relatively bad performance of unadjusted Prague-Letnany CMLs under scenario S1 compared to DübendorfCML is partly caused by their short paths (1020, 650, 1400,and 610 m, compared to 1850 m). In addition, the automaticpower control, which was switched off for the Dübendorf
Hydrol. Earth Syst. Sci., 21, 617–634, 2017 www.hydrol-earth-syst-sci.net/21/617/2017/

M. Fencl et al.: Gauge-adjusted rainfall estimates from commercial microwave links 627
Figure 7. Performance of linear approximation of k–R models for vertically polarized 38 GHz CML in terms of rainfall intensity. Left panel:linear approximation (red) of the power-law model (black). The blue dashed line shows the resulting model structure errors. Middle panel:linear approximation of power-law model coupled with Kharadly’s wet antenna attenuation model. Right panel: power-law model combinedwith Kharadly’s wet antenna attenuation model approximated by two linear models fitted separately for light (R ≤ 12 mm h−1) and heavyrainfall events (R > 12 mm h−1).
CML, also reduced the performance. We found that auto-matic power control worsens the quantization of CMLs (asTx has about three times lower quantization than Rx), andthus one can learn less from observations about the param-eters of the retrieval models, especially from short CMLs.An automatic power control as a standard feature of today’sCMLs needs to be considered when modern CML networksare used for rainfall monitoring. The results, however, indi-cate, that combining rainfall observations from multiple un-biased (or slightly biased) CMLs reduces such random errorsby averaging and thus improves QPEs for areal rainfall.
4 Discussion
The goal of this study was to suggest a procedure to adjustQPEs from CMLs to local rain gauges and to demonstratethe benefits over current retrieval methods. We obtained verypromising results, with relative errors of a few percent. Al-though this is truly encouraging, we would like to discuss,first, errors associated with the piecewise linear approxima-tion of attenuation-rainfall model Eq. (2) and WAA models,second, how to condition the model (2) to local RG obser-vations and, third, the application of adjusting algorithm in(near-) real-time setting. Finally, we would like to discusslimits of the proposed adjusting algorithm, e.g. regarding thepreservation of peak rainfalls.
4.1 Linear approximation of the power-law retrievalmodel
The model (2) can be interpreted as a combination of linearforms of an attenuation-rainfall model (1) and a WAA model.The uncertainty due to the simpler model structure of Eq. (2)is similar especially for shorter links to quantization of CMLreadings. To illustrate this effect, we compare the results forEqs. (1) and (2) by predicting specific attenuations for rain-fall intensities from 0 to 60 mm h−1. The power-law model
uses the ITU parameters (ITU, 2005), the simplified modelis fitted to the results of the power-law model by minimiz-ing the maximal absolute deviation. In Fig. 7, the results for38 GHz CML are shown, because the deviations for 38 GHzare larger than for 25 and 32 GHz due to the relatively highvalue of exponent β (1.13) for vertically polarized 38 GHzCML. The deviation between the power-law model and sim-plified model are between ±1.5 mm h−1, which correspondsto a specific attenuation of approx. 0.5 dB km−1. The devi-ation between WAA models and appropriate linear approx-imations depends on their character; e.g. the WAA modelof Overeem et al. (2011) is only based on a single additiveparameter and is thus fully included in our model throughthe parameter 1. Interestingly, a linear approximation of thecoupled attenuation-rainfall model (1) and Kharadly’s WAAmodel (Kharadly and Ross, 2001), which describes WAAas an exponential function of rainfall intensity, leads to aconsiderably higher deviation (Fig. 7, middle panel). Thedeviation can be, however, substantially reduced by fittingthe simplified model over a narrow range of attenuations,i.e. rainfall intensities. For example, the right panel of theFig. 7 shows two linear models fitted separately for lighter(R ≤ 12 mm h−1) and heavier rainfalls (R > 12 mm h−1).The absolute deviation between the linear approximationsand the original model is less than one-third compared to thelinear fit over a whole range of rainfall intensities (Fig. 7,middle panel).
When fitting the simplified model Eq. (2) continuouslyover relatively short periods, it is likely that the rainfall inten-sities covered by the calibration window will vary in narrowranges resulting in relatively small errors introduced by thelinear approximation. However, although the length of thecalibration window reduces the effect of random errors, itsoptimal length also depends on the stationarity of CML er-rors. This stationarity depends on characteristics of the rain-fall event, the CML hardware, and the local environment (seeSect. 1). For both experimental sites, we identified the win-
www.hydrol-earth-syst-sci.net/21/617/2017/ Hydrol. Earth Syst. Sci., 21, 617–634, 2017
628 M. Fencl et al.: Gauge-adjusted rainfall estimates from commercial microwave links
dow length of 5 points as an acceptable compromise betweenwindow length and the temporal variability of rainfall.
4.2 Attenuation-rainfall model fitting
The time aggregation of rainfall and attenuation datasmoothes out rainfall peaks. This leads to narrower inter-vals of likely parameter values and especially lowers the up-per bound of resulting parameter estimates. As an example,the resulting parameter distributions are shown here for theCML 2 (Prague-Letnany) when adjusted to rainfalls of dif-ferent aggregation intervals (Fig. 8). The peak averaging re-duces the width of the parameters distribution and thus lim-its the ability of the model to predict high rainfall intensities,which are mostly associated with large values of γ . A similartendency can be seen for spatial averaging when CMLs areadjusted based on areal rainfall estimated from RGs, whichcover a larger region.
The substantial difference in values of γ (Fig. 8) comparedto α of the model (1) suggested by the ITU (2005) is causedby the conceptual difference between the two models: oursuggestion (2) is a combination of wet antenna attenuationmodel and a simplified standard power-law model. Discrep-ancies regarding the ITU model were also reported by Feni-cia et al. (2012), who estimated for their 23 GHz link valuesof α substantially lower than values suggested by ITU. In-terestingly, comparably lower values of γ make even shorterCMLs relatively sensitive to rainfall and thus capable of de-tecting even light rainfalls.
4.3 Adjusting CMLs to RGs in (near-) real-time
The results Sects. 3.1 and 3.2 correspond to an “offline” set-ting, where historical rainfalls are analysed. For practice,it would be even more valuable to have QPEs available in(near-) real-time. In our case, as the suggested model (2)does not use observations from the future (Eq. 3) and is com-putationally fast, it is generally real-time capable. However,suitable parameter ranges, which we here estimated from thewhole dataset, would then only be available from past peri-ods.
The initial investigation regarding the real-time capabili-ties suggests some shortcomings of the algorithm to deliverreliable results, especially at the beginning of rainfall events.To some degree, this is because aggregated data (e.g. hourlyor daily sums) by definition arrive with a substantial delay.Interestingly, when adjusting in real-time to remote RGs withshort sampling intervals the performance is comparable tothe results shown in Sect. 3.2. In our view, this is because theaggregation can be performed continuously. Besides retrievalalgorithms, future developments towards effective real-timeQPEs from CMLs should also target efficient data collec-tion and transmission, server interoperability, data formatsand strategies to deal with the continuously changing net-work topologies.
4.4 Limits of the proposed adjustment method
In our study, we focus on urban rainfall monitoring and adjustCMLs with path lengths fewer than 2 km. For these CMLs,adjusting to “ground truth” measurements with aggregationintervals up to 1 h is accurate and only slightly underesti-mates high intense rainfall peaks. The use of rainfalls withlonger aggregation intervals, e.g. from 3 h to 1 day, however,leads to systematic underestimation of high intense rainfallsand slight overestimation of low intense rainfalls (Figs. 2and 3). We have found a connection between this systematicdiscrepancy and the extent to which rainfall autocorrelationis preserved in the aggregated rainfall (Fig. A1). Neverthe-less, further research is needed to develop a method, whichwould correct these systematic errors based on the spatio-temporal correlation of rainfalls in the region of interest.
The performance of the proposed adjustment method isalso dependent on the spatial layout of the “ground truth”measurements. The spatial averaging, similarly to time aver-aging, smoothes out rainfall extremes; i.e. layouts where theRGs are further away from the CML, or each other, tend tounderestimate rainfall peaks. Even worse, these larger dis-tances cause bias in the “ground truth” observations becausethe probability increases that distant gauges completely miss(or hit) actual peak intensities. The optimal aggregation inter-val for layout B2 was 1 h, whereas the optimal interval for Aand B1 was only 15 min. This is because longer time aver-aging reduces discrepancies between areal and point rain-fall estimates. The factor to which high intense rainfalls aresystematically underestimated corresponds quite well withthe areal reduction factor reported in literature (Departmentof Environment National Water Council Standing TechnicalCommittee, 1983). This indicates that the systematic under-estimations associated with areal averaging might be reducedbased on climate-specific rainfall characteristics. An interest-ing idea is to directly infer the spatio-temporal variability ofa certain rainfall event from the observations of many CMLs.However, further research is needed to incorporate these fea-tures into an improved adjustment procedure.
Last, but not least, the reliability of the adjustment corre-sponds to the reliability of the “ground truth” observations.One possibility to ensure good reference data could be to useCMLs to eliminate gross errors, e.g. by identifying malfunc-tioning RGs (Bianchi et al., 2013a) and excluding them fromCML adjustment. Another possibility, which should be in-vestigated in the future, is to use longer CMLs of appropriatefrequencies instead of RGs in the adjustment. As argued inSect. 1.1, these long CMLs are less sensitive to hardware andenvironmental influence factors. Nevertheless, our personalexperience after working several years with signal attenua-tion from many operational CMLs is that it happens ratheroften that CML data show erratic and seemingly random be-haviour and that the response to rainfall does not always cor-respond to a power-law relationship. While we at this timecan only speculate about the reasons, it is crucial to carefully
Hydrol. Earth Syst. Sci., 21, 617–634, 2017 www.hydrol-earth-syst-sci.net/21/617/2017/

M. Fencl et al.: Gauge-adjusted rainfall estimates from commercial microwave links 629
Figure 8. Parameters γ and 1 of the model (2) fitted for the CML 2 (32 GHz, horizontally polarized) using rainfall data of differentaggregation intervals. Each histogram corresponds to the distribution of one parameter optimized on data of a given aggregation interval.Only parameters associated with model realizations with a specific attenuation larger than 1 dB km−1 are depicted by the histograms.
select and test those long CMLs which should serve as a ref-erence.
5 Conclusions
Commercial microwave links (CMLs) can improve the reso-lution of existing rain gauge and radar networks, especiallyin populated areas where they are often very dense. Quan-titative precipitation estimates (QPEs) from CMLs as rain-fall sensors are, however, affected by various uncertainties,which are still too poorly understood to build effective signal-processing algorithms based on CML observations alone. Inthis paper, we, therefore, suggest a generic method to adjustCML QPEs to aggregated observations from existing RGssuch as 15 min or hourly averages:
– Our results demonstrate that standard commercialCMLs operated by mobile network operators can beused as powerful sensors for capturing rainfall variabil-ity at (sub)minute scale. Combining the high-resolutionobservations from CMLs with the reliable cumulativeobservations from RGs enables us to derive reliable
QPEs of high temporal resolution and very good spatialrepresentativeness. Thus, our method can also be seenas a method for spatio-temporal disaggregation of cu-mulative RG measurements based on CML attenuation.
– We propose a simplified semi-empirical model for CMLrainfall estimation, which combines microwave attenu-ation from rain and antenna wetting into one piecewiselinear relation. The model can be easily continuouslyadjusted to rainfall from existing RG networks in oper-ational conditions, even though RGs may have a lowspatial coverage and temporal resolution. The modelis intended for short CMLs (path length ≈ 1–2 km orless) operating at frequencies approx. between 20 and40 GHz, where the model structure errors from the lin-earization are much smaller than other influence factors,such as, for example, the quantization of CML atten-uation. These CMLs are crucial for capturing rainfallspace–time structure at the fine scale required for urbanhydrological applications.
– Our simple and robust approach performs very well forCMLs adjusted by rainfall with aggregation intervals up
www.hydrol-earth-syst-sci.net/21/617/2017/ Hydrol. Earth Syst. Sci., 21, 617–634, 2017

630 M. Fencl et al.: Gauge-adjusted rainfall estimates from commercial microwave links
to 1 h. Adjusting CMLs with longer aggregation inter-vals, however, leads to systematic underestimation ofhigh intense rainfalls and slight overestimation of lowintense rainfalls. We have found a connection betweenthis systematic discrepancy and a degree to which auto-correlation structure is preserved in aggregated rainfalldata.
– We have demonstrated on three different RG layoutsthat the CMLs adjusted by the RGs provide substan-tially better areal QPEs than the RGs alone. How-ever, RG layouts, which cover larger areas, e.g. ap-prox. 10–100 km2, tend to underestimate rainfall peaksand slightly overestimate light rainfalls, which is sim-ilar to the effect observed by temporal averaging. Wehave found that the underestimation is proportional tothe areal reduction factor reported in the literature.
– Further research towards an improved adjustmentmethod, which reduces systematic discrepancies in ad-justed CML QPEs by explicitly considering space–timecharacteristics of rainfalls, seems very promising. Therainfall space–time structure might be incorporated inthe model by correction factors based on either localclimatology or by directly estimating it from the re-sponse of the CML network itself. The latter seems es-pecially interesting for ungauged regions, where longerCMLs might provide reliable reference rainfall to cor-rect shorter CMLs.
The proposed approach overcomes one of the biggestshortcomings of commercial CMLs as rainfall sensors forpractical use in the urban hydrological application: the cal-ibration of CML rainfall estimation models to site-specificconditions.
The adjustment of CMLs to cumulative rainfall from pointground measurements has a huge potential especially for ur-ban catchments, where the CML network is commonly verydense. The combined use of RGs and CMLs can thus greatlyimprove the spatial and temporal resolution of existing rain-fall products and contribute to better understanding urbanrainfall–runoff processes, which are often hampered by poorrainfall data. Moreover, the insight into rainfall space–timestructures at (sub)minute and (sub)kilometre resolution cancontribute to deeper understanding of rainfall behaviour atthe microscale.
6 Data availability
Model, input data and optionally modeling results are avail-able from the corresponding author upon request.
Hydrol. Earth Syst. Sci., 21, 617–634, 2017 www.hydrol-earth-syst-sci.net/21/617/2017/

M. Fencl et al.: Gauge-adjusted rainfall estimates from commercial microwave links 631
Appendix A: Temporal rainfall aggregation
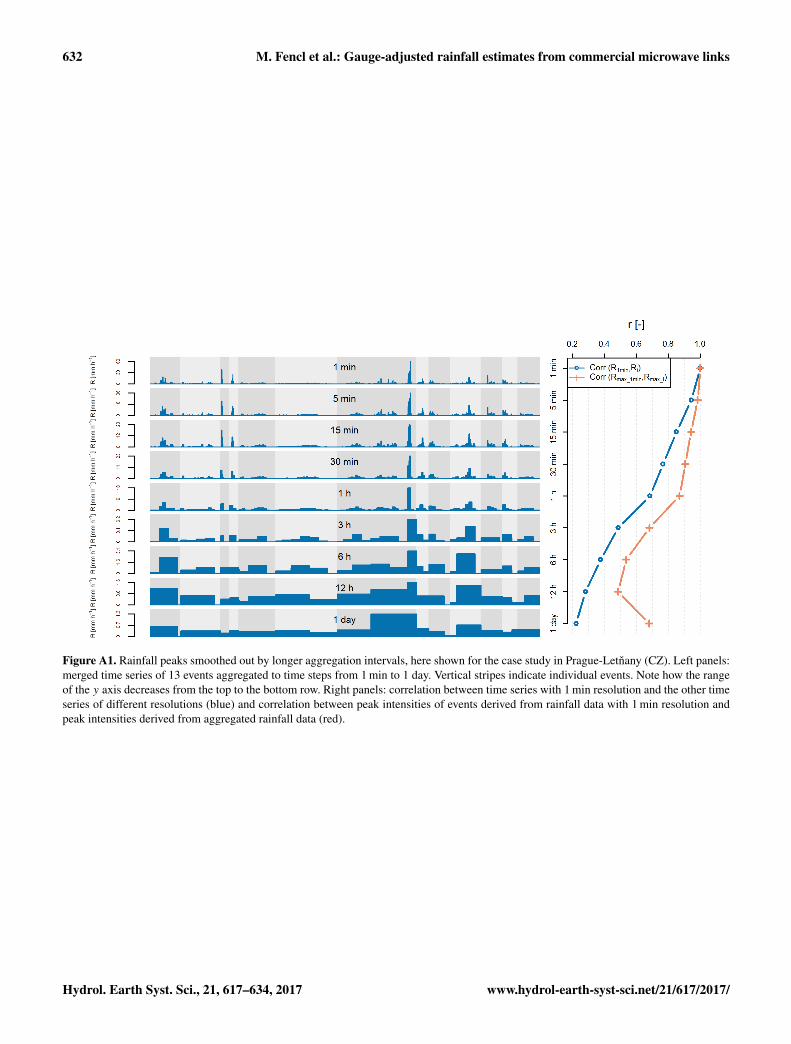
Aggregating rainfall over time reduces the discrepanciesbetween point, path-averaged, and areal rainfall, but alsosmoothes out rainfall dynamics (Villarini et al., 2008), whichwould make it possible to better identify attenuation-rainfallmodel parameters. The effect of rainfall intensity averagingwhen increasing the aggregation interval is demonstrated onthe rainfall data from our reference RGs in Prague-Letnany(CZ). The original rainfall time series with 1 min resolution(Fig. A1, top row panels) is aggregated over eight differentintegration times from 5 min (second row) to 1 day (bottomrow panels). The resulting time series are compared with theoriginal one. Only periods belonging to events listed in Ta-ble 1 are selected, which restricts the analysis only to rainyperiods with significant intensities. The right panel of Fig. A1shows the correlation between entire time series (blue) andthe correlation between rainfall intensity maxima of eachevent (red). It can be seen that the temporal aggregation upto 1 h preserves the main characteristics of rainfall events inPrague very well, e.g. high-intensity convective rainfalls canbe recognized from low-intensity frontal rainfalls.
www.hydrol-earth-syst-sci.net/21/617/2017/ Hydrol. Earth Syst. Sci., 21, 617–634, 2017
632 M. Fencl et al.: Gauge-adjusted rainfall estimates from commercial microwave links
Figure A1. Rainfall peaks smoothed out by longer aggregation intervals, here shown for the case study in Prague-Letnany (CZ). Left panels:merged time series of 13 events aggregated to time steps from 1 min to 1 day. Vertical stripes indicate individual events. Note how the rangeof the y axis decreases from the top to the bottom row. Right panels: correlation between time series with 1 min resolution and the other timeseries of different resolutions (blue) and correlation between peak intensities of events derived from rainfall data with 1 min resolution andpeak intensities derived from aggregated rainfall data (red).
Hydrol. Earth Syst. Sci., 21, 617–634, 2017 www.hydrol-earth-syst-sci.net/21/617/2017/
M. Fencl et al.: Gauge-adjusted rainfall estimates from commercial microwave links 633
The Supplement related to this article is available onlineat doi:10.5194/hess-21-617-2017-supplement.
Competing interests. The authors declare that they have no conflictof interest.
Acknowledgements. This work was supported by the projectof Czech Science Foundation (GACR) no. 14-22978S, theproject of the Czech Technical University in Prague projectno. SGS16/057/OHK1/1T/11, and the Swiss National Sci-ence Foundation in the scope of the COMCORDE projectno. CR2212_135551. We would like to thank T-Mobile CzechRepublic a.s. for kindly providing us CML data and specifically toPavel Kubík, for being helpful with our numerous requests. Specialthanks belong to Prazske vodovody a kanalizace, a.s. who providedand carefully maintained the rain gauges. Last but not least wewould like to thank Eawag for supporting COMMON projectand to Prazska vodohospodarska spolecnost a.s. for providing usadditional rainfall information from their RG network.
Edited by: C. OnofReviewed by: S. Thorndahl and H. Leijnse
References
Atlas, D. and Ulbrich, C. W.: Path- and Area-Integrated Rain-fall Measurement by Microwave Attenuation in the 1–3 cmBand, J. Appl. Meteorol., 16, 1322–1331, doi:10.1175/1520-0450(1977)016<1322:PAAIRM>2.0.CO;2, 1977.
Berne, A. and Krajewski, W.: Radar for hydrology: Unfulfilledpromise or unrecognized potential?, Adv. Water Resour., 51,357–366, doi:10.1016/j.advwatres.2012.05.005, 2013.
Berne, A. and Uijlenhoet, R.: Path-averaged rainfall esti-mation using microwave links: Uncertainty due to spa-tial rainfall variability, Geophys. Res. Lett., 34, L07403,doi:10.1029/2007GL029409, 2007.
Bianchi, B., Rieckermann, J., and Berne, A.: Quality control ofrain gauge measurements using telecommunication microwavelinks, J. Hydrol., 492, 15–23, doi:10.1016/j.jhydrol.2013.03.042,2013a.
Bianchi, B., Van, L., Hogan, R., and Berne, A.: A variational ap-proach to retrieve rain rate by combining information from raingauges, radars, and microwave links, J. Hydrometeorol., 14,1897–1909, doi:10.1175/JHM-D-12-094.1, 2013b.
Byrd, R., Lu, P., Nocedal, J., and Zhu, C.: A Limited Memory Al-gorithm for Bound Constrained Optimization, SIAM J. Scient.Comput., 16, 1190–1208, doi:10.1137/0916069, 1995.
Chwala, C., Keis, F., and Kunstmann, H.: Real-time data acqui-sition of commercial microwave link networks for hydrom-eteorological applications, Atmos. Meas. Tech., 9, 991–999,doi:10.5194/amt-9-991-2016, 2016.
Department of Environment National Water Council Standing Tech-nical Committee: Design and analysis of urban storm drainage,The Wallingford Procedure, in: Vol. 1 principles, methods andpractice, Hydraulics Research Ltd., Wallingford, Oxon, UK,1983.
Doumounia, A., Gosset, M., Cazenave, F., Kacou, M., andZougmore, F.: Rainfall monitoring based on microwave linksfrom cellular telecommunication networks: First results froma West African test bed, Geophys. Res. Lett., 41, 6015–6021,doi:10.1002/2014GL060724, 2014.
Fencl, M., Rieckermann, J., Schleiss, M., Stránský, D., and Bareš,V.: Assessing the potential of using telecommunication mi-crowave links in urban drainage modelling, Water Sci. Technol.,68, 1810–1818, doi:10.2166/wst.2014.429, 2013.
Fencl, M., Rieckermann, J., Sýkora, P., Stránský, D., andBareš, V.: Commercial microwave links instead of raingauges: fiction or reality?, Water Sci. Technol., 71, 31–37,doi:10.2166/wst.2014.466, 2015.
Fenicia, F., Pfister, L., Kavetski, D., Matgen, P., Iffly, J.-F., Hoff-mann, L., and Uijlenhoet, R.: Microwave links for rainfall es-timation in an urban environment: Insights from an experi-mental setup in Luxembourg-City, J. Hydrol., 464–465, 69–78,doi:10.1016/j.jhydrol.2012.06.047, 2012.
Goldshtein, O., Messer, H., and Zinevich, A.: Rain Rate Es-timation Using Measurements From Commercial Telecom-munications Links, IEEE T. Signal Proc., 57, 1616–1625,doi:10.1109/TSP.2009.2012554, 2009.
ITU: ITU-R P.838-3, http://www.itu.int/dms_pubrec/itu-r/rec/p/R-REC-P.838-3-200503-I!!PDF-E.pdf (last access:20 June 2016), 2005.
Kharadly, M. M. Z. and Ross, R.: Effect of wet antenna attenuationon propagation data statistics, IEEE T. Anten. Propag., 49, 1183–1191, doi:10.1109/8.943313, 2001.
Leijnse, H., Uijlenhoet, R., and Stricker, J. N. M.: Rainfall measure-ment using radio links from cellular communication networks,Water Resour. Res., 43, W03201, doi:10.1029/2006WR005631,2007.
Leijnse, H., Uijlenhoet, R., and Stricker, J. N. M.: Mi-crowave link rainfall estimation: Effects of link length andfrequency, temporal sampling, power resolution, and wetantenna attenuation, Adv. Water Resour., 31, 1481–1493,doi:10.1016/j.advwatres.2008.03.004, 2008.
Messer, H., Zinevich, A., and Alpert, P.: Environmental Monitoringby Wireless Communication Networks, Science, 312, 713–713,doi:10.1126/science.1120034, 2006.
Ochoa-Rodriguez, S., Wang, L.-P., Gires, A., Pina, R. D.,Reinoso-Rondinel, R., Bruni, G., Ichiba, A., Gaitan, S., Cris-tiano, E., Assel, J., Kroll, S., Murlà Tuyls, D., Tisserand,B., Schertzer, D., Tchiguirinskaia, I., Onof, C., Willems, P.,and Veldhuis, M.-C.: Impact of spatial and temporal resolu-tion of rainfall inputs on urban hydrodynamic modelling out-puts: A multi-catchment investigation, J. Hydrol., 531, 389–407,doi:10.1016/j.jhydrol.2015.05.035, 2015.
Olsen, R., Rogers, D., and Hodge, D.: The aRbrelation in the calcu-lation of rain attenuation, IEEE T. Anten. Propag., 26, 318–329,doi:10.1109/TAP.1978.1141845, 1978.
Overeem, A., Leijnse, H., and Uijlenhoet, R.: Measuring ur-ban rainfall using microwave links from commercial cellularcommunication networks, Water Resour. Res., 47, W12505,doi:10.1029/2010WR010350, 2011.
Overeem, A., Leijnse, H., and Uijlenhoet, R.: Country-wide rainfallmaps from cellular communication networks, P. Natl. Acad. Sci.USA, 110, 2741–2745, doi:10.1073/pnas.1217961110, 2013.
www.hydrol-earth-syst-sci.net/21/617/2017/ Hydrol. Earth Syst. Sci., 21, 617–634, 2017
634 M. Fencl et al.: Gauge-adjusted rainfall estimates from commercial microwave links
Schleiss, M. and Berne, A.: Identification of Dry and Rainy PeriodsUsing Telecommunication Microwave Links, IEEE Geosci. Re-mote Sens. Lett., 7, 611–615, doi:10.1109/LGRS.2010.2043052,2010.
Schleiss, M., Rieckermann, J., and Berne, A.: Quantification andModeling of Wet-Antenna Attenuation for Commercial Mi-crowave Links, IEEE Geosci. Remote Sens. Lett., 10, 1195–1199, doi:10.1109/LGRS.2012.2236074, 2013.
Smith, J. A. and Krajewski, W. F.: Estimation of theMean Field Bias of Radar Rainfall Estimates, J.Appl. Meteorol., 30, 397–412, doi:10.1175/1520-0450(1991)030<0397:EOTMFB>2.0.CO;2, 1991.
Stewart, R., Hut, R., Rupp, D., Gupta, H., and Selker, J.: A res-onating rainfall and evaporation recorder, Water Resour. Res., 48,W08601, doi:10.1029/2011WR011529, 2012.
Stransky, D., Bares, V., and Fatka, P.: The effect of rainfall measure-ment uncertainties on rainfall–runoff processes modelling, WaterSci. Technol., 55, 103–111, doi:10.2166/wst.2007.100, 2007.
Tilford, K. A., Fox, N. I., and Collier, C. G.: Application of weatherradar data for urban hydrology, Meteorol. Appl., 9, 95–104,doi:10.1017/S135048270200110X, 2002.
United Nations: World Urbanization Prospects: The 2014 Revision,Highlights (ST/ESA/SER.A/352), United Nations, Departmentof Economic and Social Affairs, Population Division, http://esa.un.org/unpd/wup/Publications/Files/WUP2014-Highlights.pdf(last access: 20 June 2016), 2014.
Villarini, G., Mandapaka, P. V., Krajewski, W. F., and Moore,R. J.: Rainfall and sampling uncertainties: A rain gaugeperspective, J. Geophys. Res.-Atmos., 113, D11102,doi:10.1029/2007JD009214, 2008.
Wang, Z., Schleiss, M., Jaffrain, J., Berne, A., and Rieckermann, J.:Using Markov switching models to infer dry and rainy periodsfrom telecommunication microwave link signals, Atmos. Meas.Tech., 5, 1847–1859, doi:10.5194/amt-5-1847-2012, 2012.
Wilson, J. W. and Brandes, E. A.: Radar Measurement of Rain-fall – A Summary, B. Am. Meteorol. Soc., 60, 1048–1058,doi:10.1175/1520-0477(1979)060<1048:RMORS>2.0.CO;2,1979.
Zinevich, A., Alpert, P., and Messer, H.: Estimation of rain-fall fields using commercial microwave communication net-works of variable density, Adv. Water Resour., 31, 1470–1480,doi:10.1016/j.advwatres.2008.03.003, 2008.
Zinevich, A., Messer, H., and Alpert, P.: Prediction of rain-fall intensity measurement errors using commercial microwavecommunication links, Atmos. Meas. Tech., 3, 1385–1402,doi:10.5194/amt-3-1385-2010, 2010.
Hydrol. Earth Syst. Sci., 21, 617–634, 2017 www.hydrol-earth-syst-sci.net/21/617/2017/