gauteng province · in other words, once the gic is in operation, investors will knock on only one...
TRANSCRIPT
ECONOMIC DEVELOPMENT REPUBLIC OF SOUTH AFRICA
GAUTENG PrOVINCE


Gauteng Department of Economic DevelopmentVote 3
In terms of the Public Finance Management Act, Rule 9.4 (1) of the Gauteng Legislature Standing Rules
PR171/2013 ISBN: 978-0-621-41953-5
AFCON – African Cup of NationsAIDC – Automotive Industry Development CentreAIS – Automotive Investment SchemesALLS – Automated Liquor Licensing SystemAPDP – Automotive Production Development ProgrammesASP – Automotive Supplier ParkAWESOME – Alternative Waste to EnergyBBBEE – Broad-Based Black Economic EmpowermentBBC – Buy Back CentreCAP – Co-operative Assistance ProgrammeCoJ – City of JoburgCONHILL – Constitution HillCSIR – Council for Scientific and Industrial ResearchDDI – Domestic Direct InvestmentDOC – Department of Communicationsdti – Department of Trade and IndustryECO – Environmental Control OfficerEEIA – Existing Environmental Impact AssessmentEIAs – Environmental Impact AssessmentsEMDP – Emerging Management Development ProgrammeEOI – Expression of Interest FAB LAB – Fabrication LaboratoryFDI – Foreign Direct InvestmentGAP – Gauteng Accelerator ProgrammeGCR – Global City RegionGDARD – Gauteng Department of Agriculture and Rural DevelopmentGDED – Gauteng Department of Economic DevelopmentGDF – Gauteng Department of FinanceGDID – Gauteng Department of Infrastructure DevelopmentGDRT – Gauteng Department of Roads and TransportGEDA – Gauteng Economic Development Agency GEGDS – Gauteng Employment, Growth and Development StrategyGEP – Gauteng Enterprise PropellerGFA – Gauteng Funding Agency GGB – Gauteng Gambling BoardGGDA – Gauteng Growth and Development AgencyGIC – Gauteng Investment CentreGIPF – Gauteng Industrial Policy FrameworkGPG – Gauteng Provincial Government
HET – Heritage, Education and TourismIBC – Integrated Business ServicesICT – Information and Communications TechnologyIDZ – IDZ Development CompanyIDZ DEVCO– Industrial Development ZoneIEDS – Integrated Economic Development ServicesILO – International Labour OrganisationIMF – International Monetary FundIPAP – Industrial Policy Action PlansITES – Institute of Technical Education ServicesIWEX – Industrial Waste Exchange ProgrammeJCSA – Jewellery Council of South AfricaLPG – Liquid Petroleum GasMBPDP – Master Blue Print Development PlanMFMA – Municipal Finance Management ActMoU – Memorandum of UnderstandingMTEF – Medium Term Expenditure FrameworkNGOs – Non Governmental OrganisationNGP – New Growth PathNPW – National Department of Public WorksNSA – Nissan South Africa (PTY) LtdPAIA – Promotion of Access to Information ActPAJA – Promotion of Administrative Justice ActPFMA – Public Finance Management ActPPP – Private Public Partnership PPPFA – Preferential Procurement Policy Financial ActRFP – Request for ProposalRFQ – Request for QuotationSAPS – South African Police ServiceSCD – Supply Chain DevelopmentSCM – Supply Chain ManagementSIPF – Shared Industrial Production FacilitySMMEs – Small Medium and Micro EnterprisesSMS – Senior Management ServicesSPDC – Supplier Park Development CompanyTIH – The Innovation HubTIHMC – The Innovation Hub Management CompanyVIC – Visitor Information CentreVUT – Vaal University of Technology
LIST OF ABBREVIATIONS
2 GAUTENG DEPARTMENT OF ECONOMIC DEVELOPMENT | ANNUAL REPORT 2012/13
SECTION 1: EXECUTIVE SUMMARY
1.1 Foreword
1.2 Overview of department’s performance by the HOD
SECTION 2: DEPARTMENTAL OVERVIEW
2.1 Mandate of the department
2.2 Public entities for which the MEC is responsible:
2.3 Constitutional, national and provincial legislative mandates
2.4 Good governance and legislative responsibilities national, provincial and
local government
SECTION 3: ORGANISATIONAL SYSTEMS AND RESOURCES AGAINST THE DELIVERY OF SERVICES3.1 Voted funds
3.2 Aim of the vote
3.3 Vision, mission and strategic goals
3.4 Core functions of the department
3.5 Organisation of the department
SECTION 4: REPORT ON THE PERFORMANCE OF PROGRAMMES AGAINST THE APPROVED PLANS4.1 Programme 1: Administration
4.2 Programme 2: Integrated economic development services
4.3 Programme 3: Trade and sector development
4.4 Programme 4: Business regulations and governance
4.5 Programme 5: Economic planning
SECTION 5: DED FINANCIAL REPORTING
SECTION 6: LIQUOR BOARD FINANCIAL REPORTING
SECTION 7: HUMAN RESOURCE OVERSIGHT REPORT
SECTION 8: OUTLOOK FOR THE COMING YEAR
SECTION 9: OTHER INFORMATION
9.1 Legislation produced and administered by the department
9.2 References/sources used accounting for the success rates/failures of the department
9.3 Access to information
TABLE OF CONTENTS4
6
9
12
14
14
14
16
18
20
20
20
21
21
22
24
28
34
50
61
66
130
158
198
204
206
206
206
3GAUTENG DEPARTMENT OF ECONOMIC DEVELOPMENT | ANNUAL REPORT 2012/13

4 GAUTENG DEPARTMENT OF ECONOMIC DEVELOPMENT | ANNUAL REPORT 2012/13
SECT
ION 01
GAUTENG DEPARTMENT OF ECONOMIC DEVELOPMENT | EXECUTIVE SUMMARY
5GAUTENG DEPARTMENT OF ECONOMIC DEVELOPMENT | ANNUAL REPORT 2012/13

1.1 FOrEWOrD
According to the 2013 Mid-year estimates, Gauteng remains the most populous province in South Africa. The estimates indicate that our population has increased from 23,7% of the national proportion as stipulated in Census 2011 to 24% in 2013.
This increase in our population places a heavy burden on our shoulders as government. The late Gauteng MEC for Economic Development, Nkosiphendule Kolisile, was fully cognizant of the pressures that this reality presented. Sensible of these challenges, the Gauteng Department of Economic Development, under the leadership of the late MEC Kolisile set out to achieve the following broad objectives:
Promoting trade and investment; Developing strategic economic infrastructure; Driving the re-industrialisation of the economy to support the
growth of labour intensive industries; Building an innovative and knowledge-based economy; and Strengthening green economy interventions to support
sustainable economic growth and development.
These priorities are indicative of the Gauteng Provincial Government’s commitment to overcoming the triple challenges of poverty, unemployment and inequality through the large-scale creation of decent work opportunities, enhancing the inclusivity of the Gauteng economy and propelling the province into a globally competitive CityRegion.
Although these are testing times for the global economy, Gauteng’s position as a leader of growth, employment and development in South Africa remains unparalleled.
With the exception of agriculture, Gauteng contributes the highest percentage share in almost all sectors of the South African economy including manufacturing, construction, trade, finance and mining.
Over and above this, Gauteng’s 34.5% contribution to South Africa’s GDP is second to none in the country. Gauteng also ranks high as an economic force in the African continent.
The size and performance of Gauteng’s economy is also linked to the province’s good record of service delivery and its ability to attract investment and create jobs on a massive scale.
Gauteng’s ability to cater for the biggest concentration of people in the entire country gives full expression to our belief that “dynamite comes in small packages”.
Nonetheless, we are fully cognizant of the fact that Gauteng’s status as South Africa’s biggest economy is not preordained. As a province, we should work tirelessly to maintain this position.
The Gauteng Investment Centre (GIC) is a cardinal element of our strategy to lure investors to the province. The GIC will have the following responsibilities:
Reduce the cost and time associated with doing business in Gauteng; Produce an electronic opportunity atlas for investors who wish
to plough their resources in various regions of the province; Be an information portal for investors who wish to take
advantage of some of the incentives that are on offer; and Harness the export readiness of Gauteng based businesses.
In other words, once the GIC is in operation, investors will knock on only one door to address all their needs instead of being sent from pillar to post, costing them valuable time and resources.
In the same vein, the key to maintaining Gauteng’s position as a preferred destination for investment lies in the generation of increased inward investment and the simultaneous promotion of export opportunities for Gauteng based businesses.
The Gauteng Growth and Development Agency (GGDA) is an important lever to our job creation machinery.
We have the task to ensure that efforts aimed at facilitating investment, especially in labour intensive sectors, are accelerated.
In view of this, the GGDA facilitated several foreign and direct investments in various sectors including steel beneficiation, auto components manufacturing, and food processing and pulp and paper manufacturing.
Small businesses are a critical element of our job creation, wealth sharing and poverty alleviation strategies. The support provided by the Gauteng Enterprise Propeller (GEP) to assist small businesses and cooperatives is important for creating new jobs in our economy and protecting existing ones.
GAUTENG DEPARTMENT OF ECONOMIC DEVELOPMENT EXECUTIVE SUMMARY
SECT
ION 01
6 GAUTENG DEPARTMENT OF ECONOMIC DEVELOPMENT | ANNUAL REPORT 2012/13
Attention for the 2013/14 financial year will also be firmly on intensifying GEP’s efforts towards creating market linkages for small businesses and cooperatives through partnerships as well as exhibitions and expos. Work on non-financial interventions such as business development support, mentorship, training and incubation must also continue.
By the same token our economic interventions must also cast the net wider to cater for the informal sector. Our definition of an inclusive economy is one that seeks to address informal traders, who are among the most marginalised workers in the province.
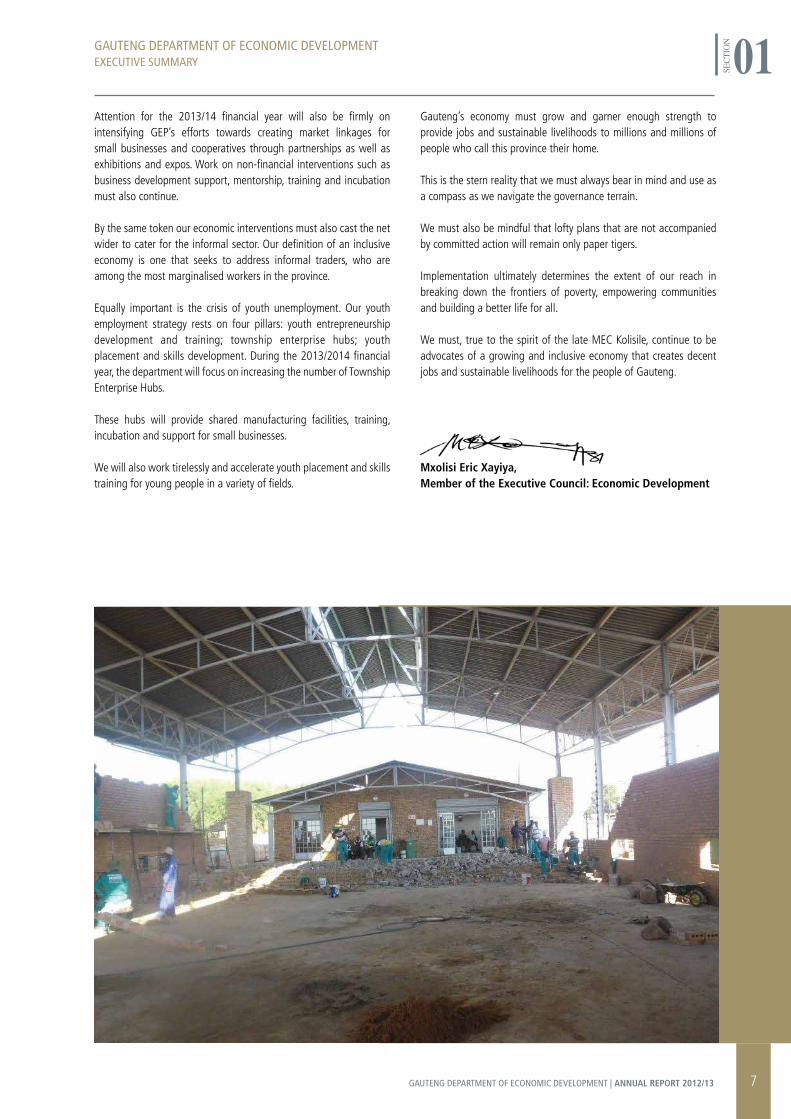
Equally important is the crisis of youth unemployment. Our youth employment strategy rests on four pillars: youth entrepreneurship development and training; township enterprise hubs; youth placement and skills development. During the 2013/2014 financial year, the department will focus on increasing the number of Township Enterprise Hubs.
These hubs will provide shared manufacturing facilities, training, incubation and support for small businesses.
We will also work tirelessly and accelerate youth placement and skills training for young people in a variety of fields.
Gauteng’s economy must grow and garner enough strength to provide jobs and sustainable livelihoods to millions and millions of people who call this province their home.
This is the stern reality that we must always bear in mind and use as a compass as we navigate the governance terrain.
We must also be mindful that lofty plans that are not accompanied by committed action will remain only paper tigers.
Implementation ultimately determines the extent of our reach in breaking down the frontiers of poverty, empowering communities and building a better life for all.
We must, true to the spirit of the late MEC Kolisile, continue to be advocates of a growing and inclusive economy that creates decent jobs and sustainable livelihoods for the people of Gauteng.
Mxolisi Eric Xayiya,Member of the Executive Council: Economic Development
GAUTENG DEPARTMENT OF ECONOMIC DEVELOPMENT EXECUTIVE SUMMARY
SECT
ION 01
7GAUTENG DEPARTMENT OF ECONOMIC DEVELOPMENT | ANNUAL REPORT 2012/13
GAUTENG DEPARTMENT OF ECONOMIC DEVELOPMENT EXECUTIVE SUMMARY
SECT
ION 01
8 GAUTENG DEPARTMENT OF ECONOMIC DEVELOPMENT | ANNUAL REPORT 2012/13
GAUTENG DEPARTMENT OF ECONOMIC DEVELOPMENT EXECUTIVE SUMMARY
SECT
ION 01
1.2 OVErVIEW OF DEPArTMENT’S PErFOrMANCE BY THE ACTING HOD
It is my pleasure to present the 2012/13 Annual Report of the activities of the Gauteng Department of Economic Development.
The Department’s mandate and goal remains constant, to cultivate and foster a favourable economic environment that creates sustainable jobs and promote rapid economic growth to address the triple challenge of poverty, joblessness and inequality. In the year under review the Department did not deviate from its core business, albeit, not without challenges.
Budget
The Department capitalised on the financial controls foundation firmly put in place in spending 99.9% of its allocated budget, of the R874.4m allocated, R873.4m was spent. Proper and supervised spending in line with the Public Finance Management Act, 1999 was towards planned priorities and prescribed needs.
Mergers
In the course of this financial year the Department concluded the merger of Blue IQ Investment Holdings and the Gauteng Economic Development Agency into the Gauteng Growth and Development Agency. This is a significant milestone to advance and enable focused economic development. The merger of the Cradle of Humankind and Dinokeng was also realised presenting the Department the opportunity to strengthen tourism development in the province. Furthermore and in line with the Provincial Executive Committee’s commendation, the Gauteng Film Commission was migrated to the Department of Sports, Recreation, Arts and Culture.
Sustainable Job Creation
In the domain of job creation, the Department directly and indirectly generated a substantial number of jobs in various industries including the motor industry and funding of Small Medium and Micro Enterprises (SMMEs) and Co-operatives through its Agencies. The unyielding commitment from business, to a great extent, amplified the Department’s efforts to respond to sustainable job creation in the province. The Department continues to device and implement ground breaking programmes to transform the economic landscape in the province.
Skills Development
The last few years were punctuated by the global economic recession and uncertainty that saw a major shift in desirable skills. In response to these challenges and while mindful of the long term impact in terms of sustainable job creation, the Department facilitated various scarce and critical skills development programmes to equip aspirant entrepreneurs and job seekers.
In the year under review, the Department oversaw a number of tailored training programmes including financial and non-financial interventions, mentoring and business development support benefiting the youth, women and people living with disabilities.
Moreover, these programmes enabled the Department to facilitate the placement of young people who received work readiness training into permanent and temporary jobs.
In spite of the resurgence of economic instability in European financial markets, the Department is confident and optimistic that the acquisition of scarce and critical skills will foster long-term growth for the province.
Township Enterprise Hubs
The Automotive Industry Development Agency (AIDC) is overseeing the development of the Winterveldt Enterprise Hub, which commenced in the last quarter of the year under review. The Department planned to establish at least six enterprise hubs, regrettably due to funding constraints the additional five will be built in the new Medium Term Expenditure Framework.
The hubs will be the central point for communities to access training, business support and mentoring, a direct response to the call to resuscitate township-based businesses. Despite financial constrains that punctuated some of the Department’s activities, the Department is making strides towards attaining the objectives duly assigned to it.
Intergovernmental Structures and Relations
Collaborating and joint planning cannot be overemphasised particularly in calamitous economic times, in this regard, the Department held bilateral meetings with the City of Johannesburg, Tshwane, Ekurhuleni Metro and the West Rand District, to advance and strengthen the desired Smart City model. The Department has since signed a Memorandum of Understanding (MoU) with Ekurhuleni Metro, and will finalise the rest in the new financial year.
9GAUTENG DEPARTMENT OF ECONOMIC DEVELOPMENT | ANNUAL REPORT 2012/13
The MoUs serve as a guiding framework for identified joint projects to be undertaken to ensure an integrated and inclusive plan of action.
This model will be extended to State-Owned Entities in the new financial year to maximise government’s efforts in addressing the triple challenges of poverty, unemployment and inequality.
Business Partnerships
The Department, in an endeavour to advocate for sustainable economic growth, engaged and worked with a number of business organisations through mutually beneficial partnerships towards implementing some of its projects and programmes. In conclusion, I would like to extend my sincere appreciation to the senior management team for their dedication and leading their respective teams in delivering the phenomenal work of the Department. The CEOs of Agencies worked tirelessly and brought considerable insight to propel the ideals of an equitable economy for the people of the province. I am grateful to MEC Nkosiphendule Kolisile whose boundless energy and optimism; constant and unrelenting guidance is highly valued.
Finally, I would like to extend my sincere appreciation to all our stakeholders for their support in enabling the Department to change the lives of ordinary citizens of Gauteng.
Albert Chanee, Acting Head of Department: Economic Development
GAUTENG DEPARTMENT OF ECONOMIC DEVELOPMENT EXECUTIVE SUMMARY
SECT
ION 01
10 GAUTENG DEPARTMENT OF ECONOMIC DEVELOPMENT | ANNUAL REPORT 2012/13
GAUTENG DEPARTMENT OF ECONOMIC DEVELOPMENT EXECUTIVE SUMMARY
SECT
ION 01
11GAUTENG DEPARTMENT OF ECONOMIC DEVELOPMENT | ANNUAL REPORT 2012/13

12 GAUTENG DEPARTMENT OF ECONOMIC DEVELOPMENT | ANNUAL REPORT 2012/13
SECT
ION 02
GAUTENG DEPARTMENT OF ECONOMIC DEVELOPMENT | DEPARTMENTAL OVERVIEW
13GAUTENG DEPARTMENT OF ECONOMIC DEVELOPMENT | ANNUAL REPORT 2012/13
2.1 MANDATE OF THE DEPArTMENT
The mandate of the Gauteng Department of Economic Development is to facilitate, promote economic growth and development in the province, with a targeted commitment to focus on enhancing inclusivity of the economy, while not neglecting to improve its competitiveness.
2.2 PUBLIC ENTITIES FOr WHICH THE MEC IS rESPONSIBLE:
Gauteng Enterprise Propeller Gauteng Gambling Board Gauteng Growth and Development Agency Gauteng Tourism Authority, Cradle of Humankind and Dinokeng
Merger of Entities
In the financial year under review the Blue IQ Investment Holdings and Gauteng Economic Development Agency (GEDA) were merged to establish the Gauteng Growth and Development Agency (GGDA). The merger followed the approval of the amendment of Blue IQ Investment Holdings (Proprietary) Limited Amendment Act, 2012 by the Gauteng Provincial Legislature. The mandate of GGDA is to:
Enable economic development that is focussed on creating sustainable jobs; To drive provincial growth and domestic products, employment
rates and also to Support development of key sectors of the economy in line with
established economic and industrial policies of the province.
The Department initiated a process to merge the Dinokeng and Cradle of Humankind into the Gauteng Tourism Authority. The merger was motivated by firstly the realisation that the two trading entities; namely. Dinokeng and Cradle of Humankind have reached concluding phase since they were established. The Dinokeng has been launched while the Cradle of Humankind has been operating for sometime. Secondly, the merger will afford the Department an opportunity to promote tourism development through the consolidation of tourism offerings in the province.
In the financial year under review the Gauteng Film Commission was migrated from the Department of Economic Development to the Department of Sports, Recreation, Arts and Culture following the Provincial Executive Committee decision to align the development and growth of the Creative Industries in the province.
Trading Entity
The Gauteng Liquor Board
2.3 CONSTITUTIONAL, NATIONAL AND PrOVINCIAL LEGISLATIVE MANDATES
In terms of Schedule 4 (Part A) of the Constitution of the Republic of South Africa, 1996 (Act No. 108 of 1996), provinces have concurrent legislative competence with the National Government in respect of, inter alia, urban and rural development. Schedule 4 (Part B) provides for provincial and national legislatures to have concurrent legislative competence in respect of local government matters such as municipal planning. In terms of Schedule 5 (Part A), provinces have exclusive legislative competence over provincial planning. Section 154 provides that the national and the provincial governments, by legislative and other measures, must support and strengthen the capacity of municipalities to manage their own affairs, to exercise their powers and to perform their functions.
The South African Constitution requires that all spheres of the government work together to address poverty, underdevelopment, marginalisation of individuals and communities and other legacies of apartheid and discrimination.
There are certain related and relevant acts and policies in addition to the Constitution that provide the provincial government with its mandate and specifically guide the Gauteng Department of Economic Development as it executes its mandate.
These selected Acts and Policies are listed below and are in the sections on national and provincial legislations: Public Finance Management Act (PFMA), 1999 Promotion of Access to Information Act, (PAIA) 2000 Employment Equity Act, 1998 National Records and Service Act, 1996 Promotion of Administrative Justice Act (PAJA) (No 3),
2000 Batho Pele Principles
National Legislative Mandate
Credit Agreements Act, 1980 Business Act, 1991 Public Service Act, 1994 Public Service Regulation, 2001 Sale and Service Matters Amendment Act, 1995 Skills Development Act, 1998 World Heritage Convention Act, 1999 Administration of Justice Act, 2000 Preferential Procurement Policy Framework Act, 2000 Municipal Finance Management Act (MFMA), 2004 Convention Concerning the Protection of the World Cultural and
Natural Heritage (adopted by the General Conference UNESCO on 16 November 1972 and by the RSA on 10 July 1997) National Environmental Management:
Protected Areas Act, 2003 Local Government: Municipal Systems Act, 2000
(Act No. 32 of 2000)
GAUTENG DEPARTMENT OF ECONOMIC DEVELOPMENTDEPARTMENTAL OVERVIEW
SECT
ION 02
14 GAUTENG DEPARTMENT OF ECONOMIC DEVELOPMENT | ANNUAL REPORT 2012/13
Less Formal Township Establishment Act, 1991 (Act No. 113 of 1991) Development Facilitation Act, 1995 (Act No. 67 of 1995)
Provincial Legislative Mandate
Gauteng Gambling Act, 1995, 1996, 2001 Gauteng Unfair Business Practices Act, 1996 Gauteng Tourism Act, 2001 Gauteng Liquor Act, 2003 Intergovernmental Fiscal Relations Act, 1997 Town Planning and Townships Ordinance, 1986
(Ordinance 15 of 1986) Gauteng Removal of Restrictions Act, 1996
(Act No. 3 of 1996) Sales and Service Matters Amendment Act, 1995 Municipal Systems Act, 2000 Broad Based Black Economic Empowerment Act, 2003 Companies Act, 1973, as amended 2009 Building Regulations Act, 1995 Intergovernmental Relations Framework Act, 2005
(Act No. 13 of 2005)
Provincial Policy Imperatives and Priorities
2009-2014 Election Manifesto Medium Term Strategic Framework (MTSF) Global City Region (GCR) Perspective:
The GCR aims at building Gauteng’s future as that of an integrated and globally competitive region where the economic activities of different parts of the province complement each other in consolidating it as an economic hub of Africa and an internationally recognised global city region. Gauteng Employment, Growth and Development
Strategy (GEGDS): The strategy is a comprehensive document that incorporates the election manifesto, policies and strategies. It identifies areas and sectors that should be prioritised to propel socio-economic growth and development in the province. It outlines specific provincial commitments to attain National government’s goal of halving unemployment by 2014.
Key Policy Developments
In the financial year under review, the Department continued to align with national government policies and strategies outlined hereunder with the aim to develop the new industrial path trajectory:
The New Growth Path (NGP), which is meant to redirect the country towards high growth trajectory underpinned by job creation. The NGP has identified key job drivers that must be stimulated in order to move the country towards the stated objective.
The Special Economic Zone Policy and Bill, which is a departure from the current Industrial Development Zone Framework, which had a narrow focus on export oriented production. The Policy is meant to be the vehicle for industrial interventions in the regions by providing an environment that will reduce the cost of doing business thereby enhancing the competitive advantage of regions. The National Procurement Regulations, which came into effect
on the 7th December 2011, seeks to foster change in procurement practices within South Africa. The change in procurement behaviour would ensure that Small, Medium and Micro Enterprise’s (SMME’s), especially those from the historically disadvantaged, and the manufacturing sector at large would receive favourable consideration when producing certain types of products, which have been designated.
The Gauteng Provincial Government developed and approved the Gauteng Employment Growth and Development Strategy (GEGDS) 2009-2014 in 2010. The strategy identified employment as the key focus area of the GEGDS with the aim to alleviate poverty and ensure equitable economic growth. The provincial departments aligned all their policies and strategies with an element of creating jobs in response to this strategy and where necessary, redesigned to directly target employment creation. To expedite the implementation of programmes and projects, it was necessary to align all the three spheres of government and work in collaboration with their implementing agencies.
In the period under review, a number of supporting strategies aligned to the NGP, the Industrial Policy Action Plans (IPAP2) and Gauteng Industrial Policy Framework (GIPF) were reviewed and developed, this include among other existing policy frameworks:
The Gauteng Trade and Investment Gateway Strategy: The strategy is meant to enhance Gauteng as the factory for exported goods and services for Southern Africa and the rest of the African continent. It means that Gauteng becomes a platform for investors who want to produce for the bigger African markets, given its advantage in productive infrastructure, financial hub, centre for Research and Development.
This strategy is a guide to Gauteng Growth and Development Agency on its trade and investment promotional activities in the African continent.
The National Electric Vehicle Strategy 2011: The Department reviewed for the Department of Trade and Industry on the critical success factors that must be in place for this sub-sector to take off. The Cooperative Strategy of 2009: The Department has also reviewed the strategy to measure the impact of interventions by government in the cooperatives sector with the view to shape the plans as per the needs of the sector. The review makes recommendations that if adhered to, can improve the performance of the cooperatives and increase the impact of the interventions by government institutions.
GAUTENG DEPARTMENT OF ECONOMIC DEVELOPMENTDEPARTMENTAL OVERVIEW
SECT
ION 02
15GAUTENG DEPARTMENT OF ECONOMIC DEVELOPMENT | ANNUAL REPORT 2012/13
Key actors Function
Branch /Chief Directorate /Directorate
Monitored by Mechanism
Member of Executive Council
Executive authority of the Department
Political accountability to the Legislature and public
Policy direction and provide strategic leadership
Appeals authority
Inter-governmental collaboration
Premier/ Executive Council/ Legislature
Strategic and budget prioritiesAnnual reportsBudget speech
2.4 GOOD GOVErNANCE AND LEGISLATIVE rESPONSIBILITIES
2.4.1 Intergovernmental Structures and Relations
During the 2012/13 financial year, the Department held both Technical and Political IGR Committee meetings in each quarter of the financial year. Over and above the Technical and the Political Committee meetings, bilateral meetings were held with the following municipalities:
City of Johannesburg; City of Tshwane Metropolitan Municipalities; West Rand District (including its Local Municipalities); and Ekurhuleni Metropolitan Municipalities.
The outcome of these bilateral engagements was to identify areas of collaboration that would culminate to a Memorandum of Understanding (MoU) with each municipality. A MoU with Ekurhuleni Metropolitan has been finalised and signed. All other outstanding MoU with other municipalities still have to be finalised. The MoU’s will serve as a guiding framework within which the implementation of the projects or programmes that would have been identified will be undertaken.
The Department will continue with both the technical and political engagements to forge partnerships with all metropolitan and two district municipalities in Gauteng. The primary objective would be to ensure that an integrated and inclusive joint programme of action will be drawn from all the cooperative agreements and agreed upon with a view of developing a number of implementing protocols.
2.4.2 Stakeholders
The following are spheres of government, parastatals and organisations that the Department work with:
National, Provincial and Local Government; Organised Labour; Big Businesses; State Owned Enterprises; Small, Medium and Micro Enterprises, and Cooperatives; Non Government Organisations; and Local Communities.
2.4.3 Monitoring Mechanisms and Implementation of the Mandate
GAUTENG DEPARTMENT OF ECONOMIC DEVELOPMENTDEPARTMENTAL OVERVIEW
SECT
ION 02
16 GAUTENG DEPARTMENT OF ECONOMIC DEVELOPMENT | ANNUAL REPORT 2012/13
Key actors Function
Branch /Chief Directorate /Directorate
Monitored by Mechanism
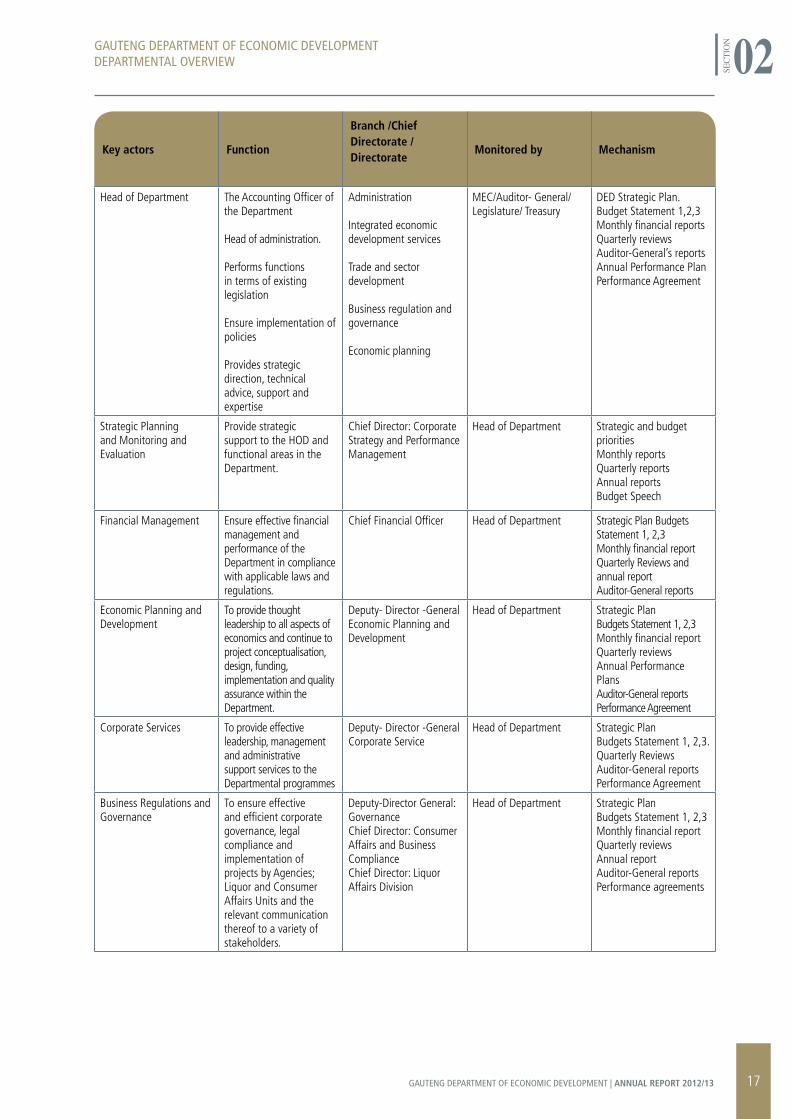
Head of Department The Accounting Officer of the Department
Head of administration.
Performs functions in terms of existing legislation
Ensure implementation of policies
Provides strategic direction, technical advice, support and expertise
Administration
Integrated economic development services
Trade and sector development
Business regulation and governance
Economic planning
MEC/Auditor- General/ Legislature/ Treasury
DED Strategic Plan. Budget Statement 1,2,3 Monthly financial reportsQuarterly reviewsAuditor-General’s reportsAnnual Performance PlanPerformance Agreement
Strategic Planning and Monitoring and Evaluation
Provide strategic support to the HOD and functional areas in the Department.
Chief Director: Corporate Strategy and Performance Management
Head of Department Strategic and budget prioritiesMonthly reportsQuarterly reportsAnnual reportsBudget Speech
Financial Management Ensure effective financial management and performance of the Department in compliance with applicable laws and regulations.
Chief Financial Officer Head of Department Strategic Plan Budgets Statement 1, 2,3Monthly financial reportQuarterly Reviews and annual reportAuditor-General reports
Economic Planning and Development
To provide thought leadership to all aspects of economics and continue to project conceptualisation, design, funding, implementation and quality assurance within the Department.
Deputy- Director -General Economic Planning and Development
Head of Department Strategic PlanBudgets Statement 1, 2,3Monthly financial reportQuarterly reviewsAnnual Performance PlansAuditor-General reportsPerformance Agreement
Corporate Services To provide effective leadership, management and administrative support services to the Departmental programmes
Deputy- Director -General Corporate Service
Head of Department Strategic PlanBudgets Statement 1, 2,3.Quarterly ReviewsAuditor-General reports Performance Agreement
Business Regulations and Governance
To ensure effective and efficient corporate governance, legal compliance and implementation of projects by Agencies; Liquor and Consumer Affairs Units and the relevant communication thereof to a variety of stakeholders.
Deputy-Director General: GovernanceChief Director: Consumer Affairs and Business ComplianceChief Director: Liquor Affairs Division
Head of Department Strategic PlanBudgets Statement 1, 2,3Monthly financial reportQuarterly reviewsAnnual reportAuditor-General reportsPerformance agreements
GAUTENG DEPARTMENT OF ECONOMIC DEVELOPMENTDEPARTMENTAL OVERVIEW
SECT
ION 02
17GAUTENG DEPARTMENT OF ECONOMIC DEVELOPMENT | ANNUAL REPORT 2012/13

18 GAUTENG DEPARTMENT OF ECONOMIC DEVELOPMENT | ANNUAL REPORT 2012/13
SECT
ION 03
GAUTENG DEPARTMENT OF ECONOMIC DEVELOPMENT | ORGANISATIONAL
SYSTEMS AND RESOURCES AGAINST THE DELIVERY OF SERVICES
19GAUTENG DEPARTMENT OF ECONOMIC DEVELOPMENT | ANNUAL REPORT 2012/13
3.1 VOTED FUNDS
3.2 AIM OF THE VOTE
In delivering on its mandate and responding to the outcomes-based approach, the aim of the Gauteng Department of Economic Development (DED) is to lead, facilitate and manage sustainable job creation and inclusive economic growth and development in the Gauteng City Region.
3.3 VISION, MISSION AND STrATEGIC GOALS
Vision
In delivering on its statement of purpose reflected above, the Department set for itself the following vision: Sustainable job creation and inclusive economic development in an integrated and globally competitive City Region.
Mission
The Department will be an activist, interventionist and developmentally focused Department contributing to an inclusive and growing economy in Gauteng by:
Providing thought leadership to inform the economic development agenda; Mobilising stakeholders to partner with for economic growth
and development;
Creating an enabling regulatory environment and stimulating business practices that promote inclusive economic growth; Enhancing the competitive advantage of key sectors of the
economy; Promoting and attracting trade and investment to the economy; Directing investment into strategic economic infrastructure; and Proactively linking communities to economic opportunities.
Strategic Goals
The Department’s response to the provincial outcomes-based approach and consideration of the environment, informs the Department’s Strategic Goals which are revised as follows:
Provide integrated economic and development planning which informs spatially referenced regional and local economic development; and contributes to the development of Gauteng into a globally competitive city region; Facilitate the implementation of strategic programmes that will
stimulate the brand, competitiveness and social transformation of Gauteng, enhance trade and export promotion and the attraction of investment; and result in the creation of decent jobs, increased tourism, and a greener economy; Promote an efficient, equitable and socially responsible business
environment; Act as an economic intelligence nerve-centre to inform strategic
decision making and targeted sector development strategies; and Promote public accountability and achieve high standards of
corporate governance and efficient resource utilisation.
GAUTENG DEPARTMENT OF ECONOMIC DEVELOPMENTORGANISATIONAL SYSTEMS AND RESOURCES AGAINST THE DELIVERY OF SERVICES
SECT
ION 03
AppropriationMain Appropriation
Adjusted Appropriation
Actual Amount Spent
Over/Under Expenditure
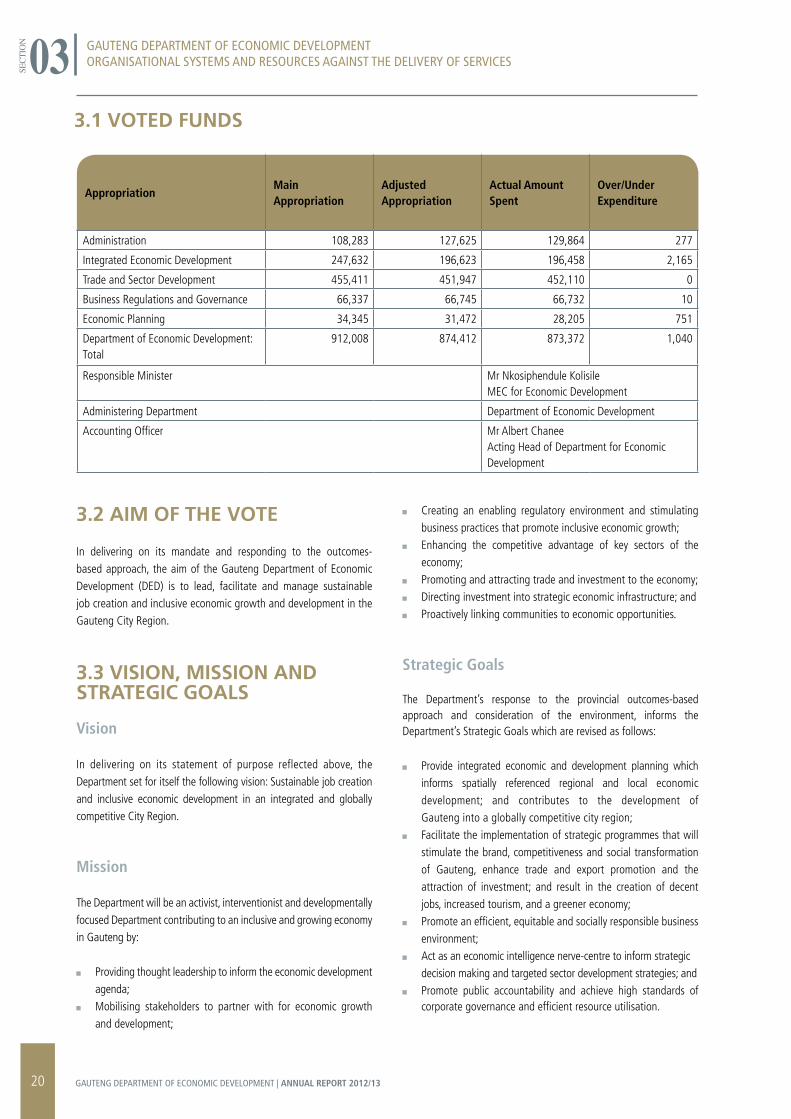
Administration 108,283 127,625 129,864 277
Integrated Economic Development 247,632 196,623 196,458 2,165
Trade and Sector Development 455,411 451,947 452,110 0
Business Regulations and Governance 66,337 66,745 66,732 10
Economic Planning 34,345 31,472 28,205 751
Department of Economic Development: Total
912,008 874,412 873,372 1,040
Responsible Minister Mr Nkosiphendule KolisileMEC for Economic Development
Administering Department Department of Economic Development
Accounting Officer Mr Albert ChaneeActing Head of Department for Economic Development
20 GAUTENG DEPARTMENT OF ECONOMIC DEVELOPMENT | ANNUAL REPORT 2012/13
GAUTENG DEPARTMENT OF ECONOMIC DEVELOPMENTORGANISATIONAL SYSTEMS AND RESOURCES AGAINST THE DELIVERY OF SERVICES
SECT
ION 03
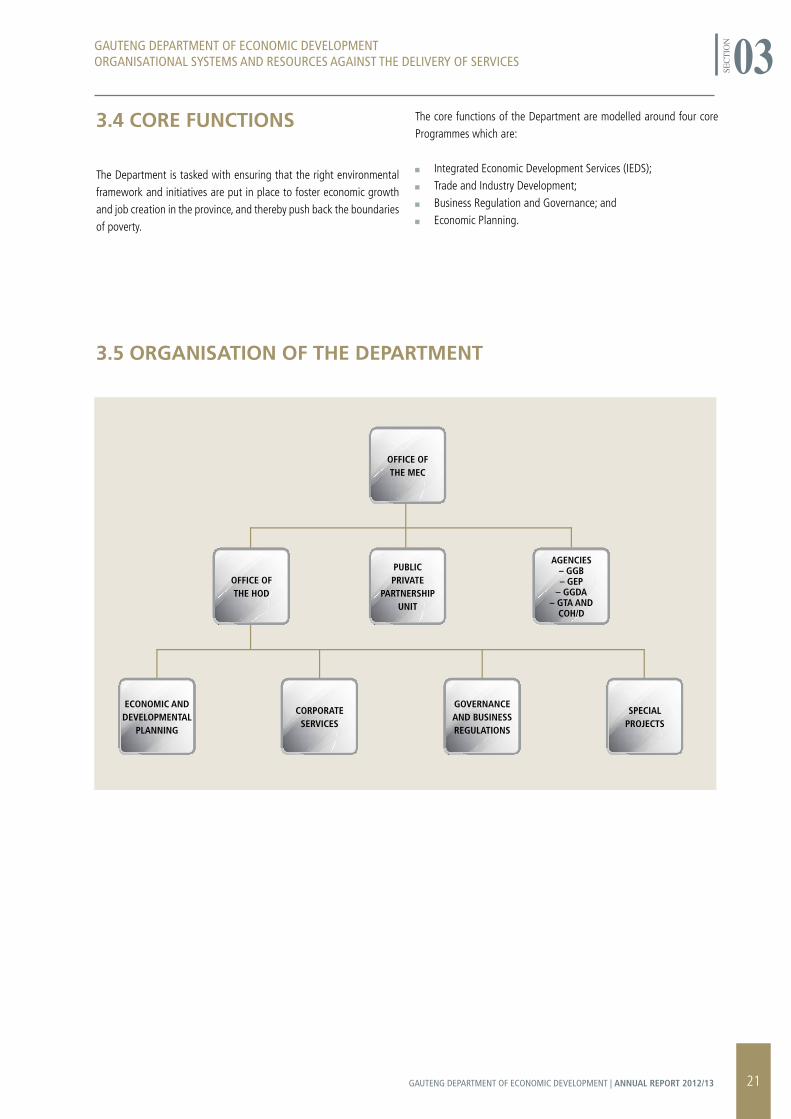
3.4 COrE FUNCTIONS
The Department is tasked with ensuring that the right environmental framework and initiatives are put in place to foster economic growth and job creation in the province, and thereby push back the boundaries of poverty.
The core functions of the Department are modelled around four core Programmes which are:
Integrated Economic Development Services (IEDS); Trade and Industry Development; Business Regulation and Governance; and Economic Planning.
3.5 OrGANISATION OF THE DEPArTMENT
AGENCIES– GGB– GEP
– GGDA– GTA AND
COH/D
ECONOMIC AND DEVELOPMENTAL
PLANNING
CORPORATE SERVICES
GOVERNANCEAND BUSINESSREGULATIONS
OFFICE OF THE MEC
PUBLIC PRIVATE
PARTNERSHIP UNIT
OFFICE OF THE HOD
SPECIAL PROJECTS
21GAUTENG DEPARTMENT OF ECONOMIC DEVELOPMENT | ANNUAL REPORT 2012/13

22 GAUTENG DEPARTMENT OF ECONOMIC DEVELOPMENT | ANNUAL REPORT 2012/13
SECT
ION 04
GAUTENG DEPARTMENT OF ECONOMIC DEVELOPMENT | PERFORMANCE OF PROGRAMMES AGAINST THE APPROVED PLANS
23GAUTENG DEPARTMENT OF ECONOMIC DEVELOPMENT | ANNUAL REPORT 2012/13
4.1 PrOGrAMME 1: ADMINISTrATION
The purpose of this programme is to provide effective leadership and strategic management and support in accordance with legislation, regulations, and policies; and ensure appropriate support services to all other programmes.
In this regard, the programme should effectively and efficiently manage and direct the activities of the MEC, manage and direct the Departmental transversal administrative programmes that give leadership to the Department, provide an effective financial management function, ensure the implementation of risk management and provide a strategic support function.
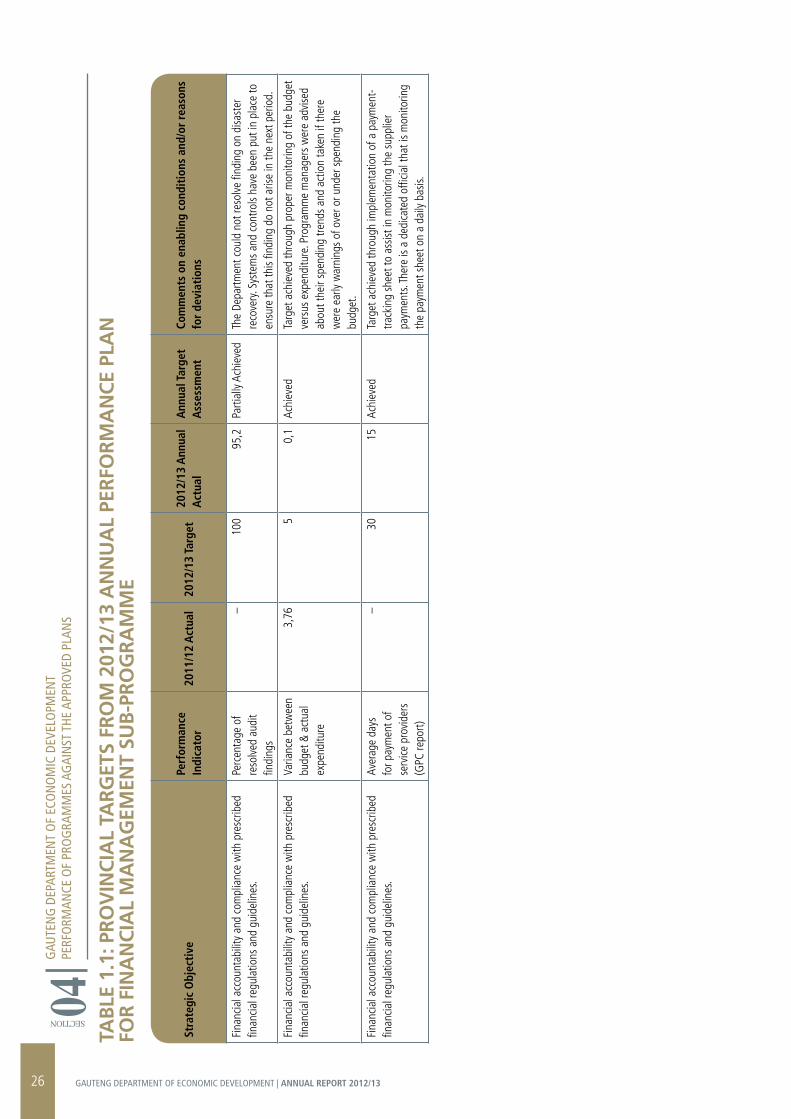
4.1.1 Financial Management
In the financial year under review, the Department spent 99.9% of the appropriated R874.4m budget.
The year to-date achievement was realised due to proper spending in accordance with planned priorities and prescribed needs, monthly spending analysis drawn-up; and continuous interaction with programmes and sub-programmes on their spending trends and how to address identified discrepancies which results in over and under spending of the allocated budget.
On average, the Department reduced 30 days payment of suppliers to 14,5 days. The internal daily payment monitoring tracking system and centralisation of invoice submission enabled the Department to achieve this target. The Provincial Treasury was constantly engaged to ensure that there were sufficient funds to enable payment of suppliers within the prescribed period.
The Department resolved 95,2% of Auditor-General findings, the outstanding finding is the Disaster Recovery Plan.
The Department was unable to implement Disaster Recovery Plan by 31 March 2013 due to budgetary constraints. However, the Chief Information Officer was granted approval to implement a fail-over site no later than June 2013.
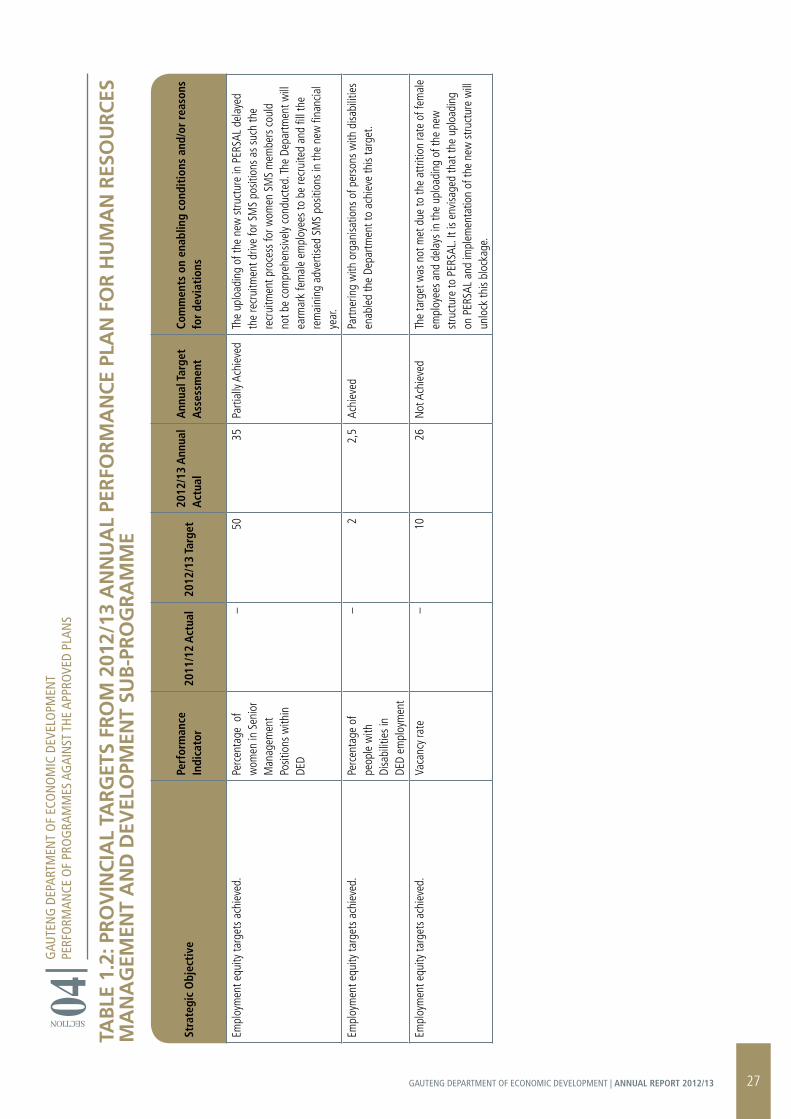
4.1.1.2 Human Resource Management and Development
By end of the financial year, the Department reduced the vacancy rate to 26%; this equates to 33 employees that were appointed. These appointments were in addition to the existing staff establishment whilst the Department transit from the old to the new organisational structure.
A total of 17 out of 19 advertised SMS positions had been filled. By the end of the financial year, women in Senior Management Services (SMS) employment positions were at 35% against planned target of 50%. The target was not met due to the attrition rate of female employees and delays in the uploading of the new structure to PERSAL. The Department will earmark female employees to be recruited and fill the remaining advertised SMS positions in the 2013/14 financial year.
The Department’s collaborative efforts with organisations for People with Disabilities contributed to the attainment of cumulative 2.5% employment of People with Disabilities against the set target of 2%. As part of the skills development initiative to capacitate employees with disabilities at elementary level, the Department has through Emerging Management Development Programme (EMDP) trained 4 employees with disabilities and were appointed as administration clerks for a period of 12 months. This process will enable employees to gather and develop the necessary skills in ensuring growth and succession.
In providing continued support to this targeted group, the Department has put measures in place to ensure their retention and development within the staff establishment.
GAUTENG DEPARTMENT OF ECONOMIC DEVELOPMENTPERFORMANCE OF PROGRAMMES AGAINST THE APPROVED PLANS
SECT
ION 04
24 GAUTENG DEPARTMENT OF ECONOMIC DEVELOPMENT | ANNUAL REPORT 2012/13
GAUTENG DEPARTMENT OF ECONOMIC DEVELOPMENTPERFORMANCE OF PROGRAMMES AGAINST THE APPROVED PLANS
SECT
ION 04
25GAUTENG DEPARTMENT OF ECONOMIC DEVELOPMENT | ANNUAL REPORT 2012/13
TAB
LE 1
.1: P
rO
VIN
CIA
L TA
rG
ETS
FrO
M 2
012/
13 A
NN
UA
L PE
rFO
rM
AN
CE
PLA
N
FOr
FIN
AN
CIA
L M
AN
AG
EMEN
T SU
B-P
rO
Gr
AM
ME
GAU
TEN
G D
EPAR
TMEN
T O
F EC
ON
OM
IC D
EVEL
OPM
ENT
PERF
ORM
ANCE
OF
PRO
GRA
MM
ES A
GAI
NST
THE
APP
ROVE
D PL
ANS
SECTION 04
Stra
tegi
c O
bjec
tive
Perf
orm
ance
In
dica
tor
2011
/12
Act
ual
2012
/13
Targ
et20
12/1
3 A
nnua
l A
ctua
lA
nnua
l Tar
get
Ass
essm
ent
Com
men
ts o
n en
ablin
g co
ndit
ions
and
/or
reas
ons
for
devi
atio
ns
Fina
ncia
l acc
ount
abili
ty a
nd c
ompl
ianc
e w
ith p
resc
ribed
fin
ancia
l reg
ulat
ions
and
gui
delin
es.
Perc
enta
ge o
f re
solv
ed a
udit
findi
ngs
–10
095
,2Pa
rtial
ly Ac
hiev
edTh
e De
partm
ent c
ould
not
reso
lve
findi
ng o
n di
sast
er
reco
very
. Sys
tem
s an
d co
ntro
ls ha
ve b
een
put i
n pl
ace
to
ensu
re th
at th
is fin
ding
do
not a
rise
in th
e ne
xt p
erio
d.
Fina
ncia
l acc
ount
abili
ty a
nd c
ompl
ianc
e w
ith p
resc
ribed
fin
ancia
l reg
ulat
ions
and
gui
delin
es.
Varia
nce
betw
een
budg
et &
act
ual
expe
nditu
re
3,76
50,
1Ac
hiev
edTa
rget
ach
ieve
d th
roug
h pr
oper
mon
itorin
g of
the
budg
et
vers
us e
xpen
ditu
re. P
rogr
amm
e m
anag
ers
wer
e ad
vise
d ab
out t
heir
spen
ding
tren
ds a
nd a
ctio
n ta
ken
if th
ere
wer
e ea
rly w
arni
ngs
of o
ver o
r und
er s
pend
ing
the
budg
et.
Fina
ncia
l acc
ount
abili
ty a
nd c
ompl
ianc
e w
ith p
resc
ribed
fin
ancia
l reg
ulat
ions
and
gui
delin
es.
Aver
age
days
fo
r pay
men
t of
serv
ice p
rovi
ders
(G
PC re
port)
–30
15Ac
hiev
edTa
rget
ach
ieve
d th
roug
h im
plem
enta
tion
of a
pay
men
t-tra
ckin
g sh
eet t
o as
sist i
n m
onito
ring
the
supp
lier
paym
ents
. The
re is
a d
edica
ted
offic
ial t
hat i
s m
onito
ring
the
paym
ent s
heet
on
a da
ily b
asis.
26 GAUTENG DEPARTMENT OF ECONOMIC DEVELOPMENT | ANNUAL REPORT 2012/13
TAB
LE 1
.2: P
rO
VIN
CIA
L TA
rG
ETS
FrO
M 2
012/
13 A
NN
UA
L PE
rFO
rM
AN
CE
PLA
N F
Or
HU
MA
N r
ESO
Ur
CES
M
AN
AG
EMEN
T A
ND
DEV
ELO
PMEN
T SU
B-P
rO
Gr
AM
ME
GAU
TEN
G D
EPAR
TMEN
T O
F EC
ON
OM
IC D
EVEL
OPM
ENT
PERF
ORM
ANCE
OF
PRO
GRA
MM
ES A
GAI
NST
THE
APP
ROVE
D PL
ANS
SECTION 04
Stra
tegi
c O
bjec
tive
Perf
orm
ance
In
dica
tor
2011
/12
Act
ual
2012
/13
Targ
et20
12/1
3 A
nnua
l A
ctua
lA
nnua
l Tar
get
Ass
essm
ent
Com
men
ts o
n en
ablin
g co
ndit
ions
and
/or
reas
ons
for
devi
atio
ns
Empl
oym
ent e
quity
targ
ets
achi
eved
.Pe
rcen
tage
of
wom
en in
Sen
ior
Man
agem
ent
Posit
ions
with
in
DED
–50
35Pa
rtial
ly Ac
hiev
edTh
e up
load
ing
of th
e ne
w s
truct
ure
in P
ERSA
L de
laye
d th
e re
crui
tmen
t driv
e fo
r SM
S po
sitio
ns a
s su
ch th
e re
crui
tmen
t pro
cess
for w
omen
SM
S m
embe
rs c
ould
no
t be
com
preh
ensiv
ely
cond
ucte
d. Th
e De
partm
ent w
ill
earm
ark
fem
ale
empl
oyee
s to
be
recr
uite
d an
d fil
l the
re
mai
ning
adv
ertis
ed S
MS
posit
ions
in th
e ne
w fi
nanc
ial
year
.
Empl
oym
ent e
quity
targ
ets
achi
eved
.Pe
rcen
tage
of
peop
le w
ith
Disa
bilit
ies
in
DED
empl
oym
ent
–2
2,5
Achi
eved
Partn
erin
g w
ith o
rgan
isatio
ns o
f per
sons
with
disa
bilit
ies
enab
led
the
Depa
rtmen
t to
achi
eve
this
targ
et.
Empl
oym
ent e
quity
targ
ets
achi
eved
.Va
canc
y ra
te–
1026
Not
Ach
ieve
dTh
e ta
rget
was
not
met
due
to th
e at
tritio
n ra
te o
f fem
ale
empl
oyee
s an
d de
lays
in th
e up
load
ing
of th
e ne
w
stru
ctur
e to
PER
SAL.
It is
env
isage
d th
at th
e up
load
ing
on P
ERSA
L an
d im
plem
enta
tion
of th
e ne
w s
truct
ure
will
un
lock
this
bloc
kage
.
27GAUTENG DEPARTMENT OF ECONOMIC DEVELOPMENT | ANNUAL REPORT 2012/13
4.2 PrOGrAMME 2: INTEGrATED ECONOMIC DEVELOPMENT SErVICES
The purpose of this programme is to ensure thought leadership and facilitation as well as the development of the province into a competitive global city with a distinctive African identity. The programme’s objective is to interpret the Gauteng space; provide development direction and create a system that delivers streamlined professional development planning services for all development investment in Gauteng; thereby ensuring that the development objectives of the Gauteng Global City Region are achieved. In this regard, the programme provides leadership in integrated development and spatial planning, the implementation of a uniform land use management system, fast tracked land development, the provision of development planning information, and support to municipalities to ensure credible and integrated development planning policies.
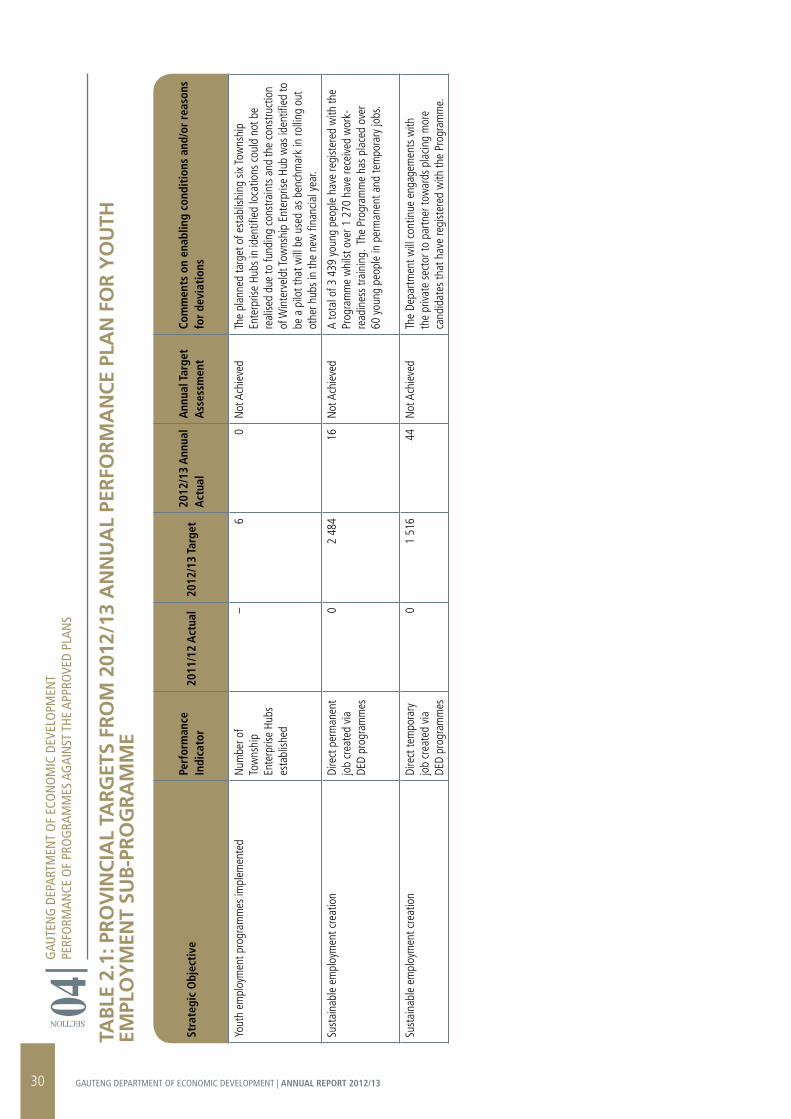
4.2.1 Youth Employment Programme
Township Enterprise Hubs
The planned annual target of establishing six Township Enterprise Hubs in identified locations was not realised due to funding constraints. However, the construction of one of the hubs, Winterveldt Township Enterprise Hub, has commenced and is to serve as a pilot that will be used as benchmark in rolling out other hubs in the new MTEF.
The Winterveldt Township Enterprise Hub project was awarded to the Automotive Industry Development Centre (AIDC) towards the end of January 2013 for implementation. AIDC completed the design and conceptual development of an automotive enterprise development hub, as well as an arts and culture enterprise model, and secured approval from City of Tshwane by end of the financial year.
AIDC secured agreements with the specific industry partners to provide support for the supply of paints and abrasives parts together with a take-away facility. Drafted building plans, commenced the actual refurbishment construction as per the designed specifications, and completed the open tender process for the variety of technical training equipment required for the Hub.
Youth Placement (Matriculates and Graduates NCV Level 4)
The Gauteng Youth Programme Management Office has established a walk-in centre whereby unemployed youth between the ages of 18-24 years cohort are recruited to register as participants in the placement programme. An on-going outreach programme that has been set-up at Community level supports this placement programme. Mobilisation is done through Economic Development Facilitators in liaison with Municipal officials throughout all 5 Regions.
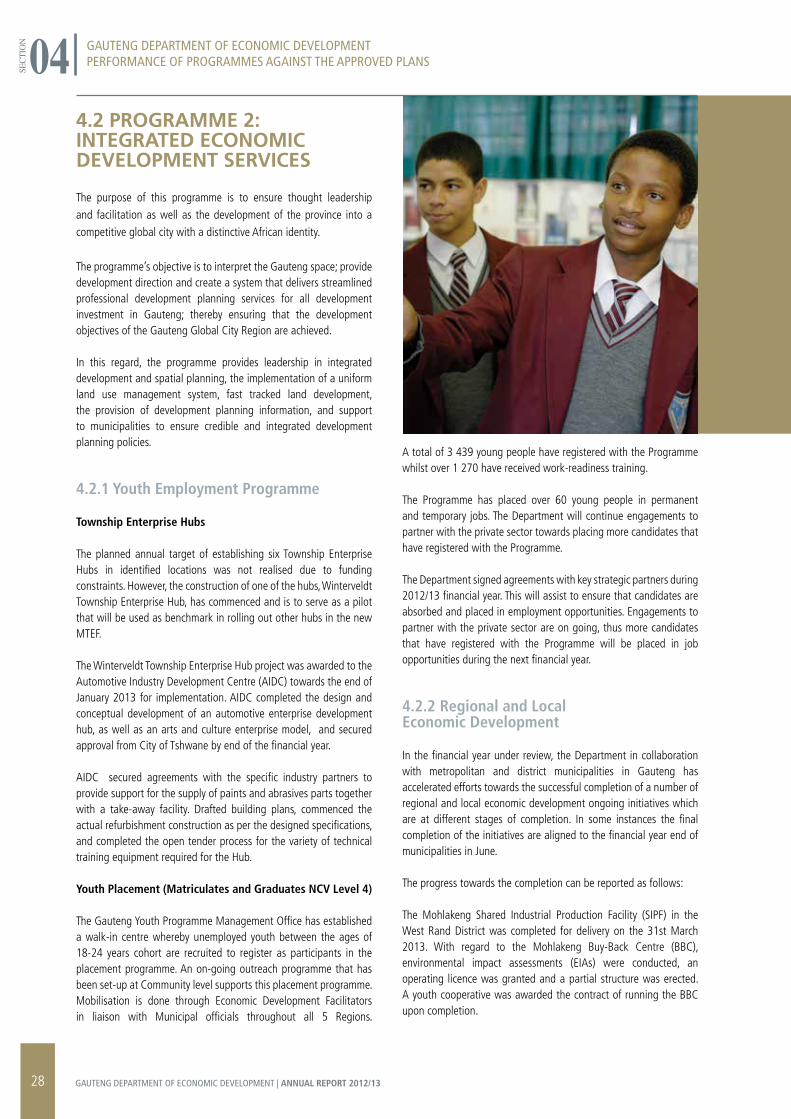
A total of 3 439 young people have registered with the Programme whilst over 1 270 have received work-readiness training.
The Programme has placed over 60 young people in permanent and temporary jobs. The Department will continue engagements to partner with the private sector towards placing more candidates that have registered with the Programme.
The Department signed agreements with key strategic partners during 2012/13 financial year. This will assist to ensure that candidates are absorbed and placed in employment opportunities. Engagements to partner with the private sector are on going, thus more candidates that have registered with the Programme will be placed in job opportunities during the next financial year.
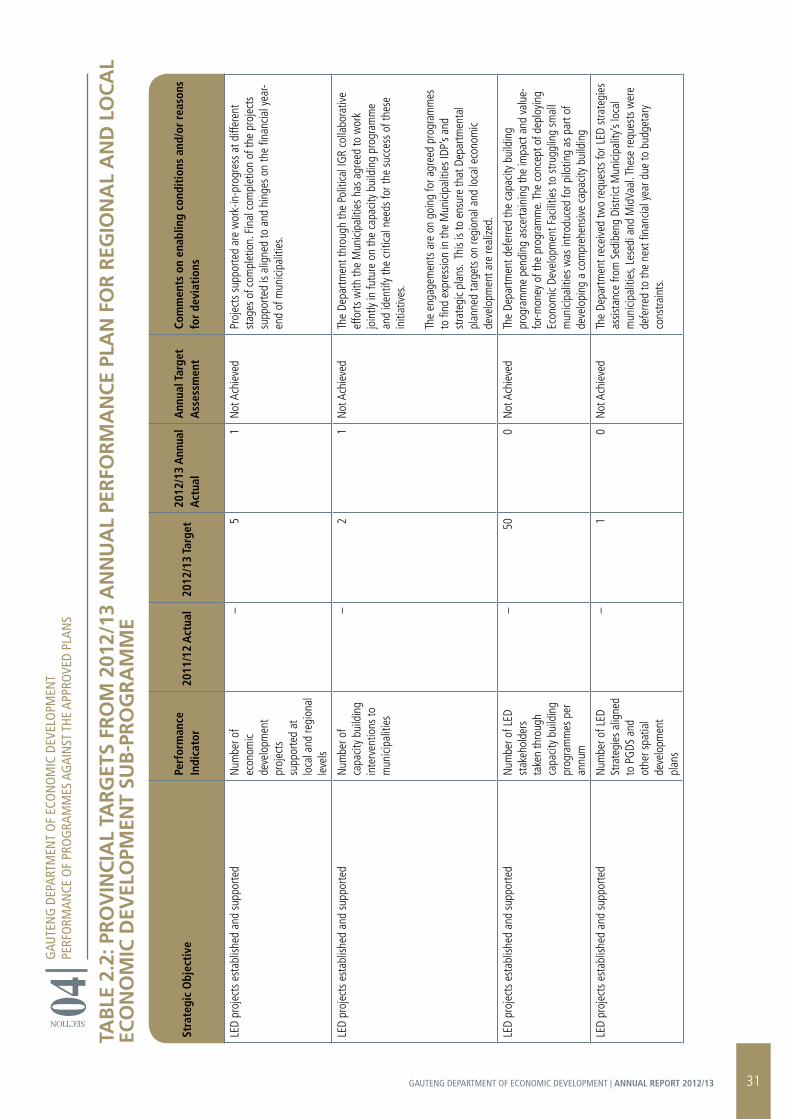
4.2.2 Regional and Local Economic Development
In the financial year under review, the Department in collaboration with metropolitan and district municipalities in Gauteng has accelerated efforts towards the successful completion of a number of regional and local economic development ongoing initiatives which are at different stages of completion. In some instances the final completion of the initiatives are aligned to the financial year end of municipalities in June.
The progress towards the completion can be reported as follows:
The Mohlakeng Shared Industrial Production Facility (SIPF) in the West Rand District was completed for delivery on the 31st March 2013. With regard to the Mohlakeng Buy-Back Centre (BBC), environmental impact assessments (EIAs) were conducted, an operating licence was granted and a partial structure was erected. A youth cooperative was awarded the contract of running the BBC upon completion.
GAUTENG DEPARTMENT OF ECONOMIC DEVELOPMENTPERFORMANCE OF PROGRAMMES AGAINST THE APPROVED PLANS
SECT
ION 04
28 GAUTENG DEPARTMENT OF ECONOMIC DEVELOPMENT | ANNUAL REPORT 2012/13
Two projects sites were selected in the Sedibeng District for the installation of Bio-digesters. Energy usage audits at the two sites were completed. A service provider for the installation was appointed. The site of the Sedibeng Science Park was confirmed as the project site for the Fabrication Laboratory (Fab Lab). A business case and project plan have been developed. Negotiations with Council for Scientific and Industrial Research (CSIR), and Vaal University of Technology (VUT) as strategic partners are at advanced stage towards the finalisation of co-operation agreements.
A Fab Lab in Tokoza was completed for delivery in the reporting period. Refurbishment works on the SIPF existing building in Tembisa are at an advanced stage. Operating machinery have been purchased. Construction is underway on the adjacent portion of the land. Work on the final completion of the Tembisa buy-back centre are at an advanced stage. Bailing machines have been purchased and a cooperative has been awarded the contract to operate the buy-back centre.
The Department through the Political IGR collaborative efforts has signed a cooperative agreement with the City of Ekurhuleni with specific deliverables on programmes and initiatives to be undertaken in the region. The Department will continue with these political engagements to forge partnerships particularly with the remaining two metropolitan and two district municipalities in Gauteng. The primary objective would be to ensure that an integrated and inclusive joint programme of action would be drawn from all the cooperative agreements and agreed upon with a view of developing a number of implementing protocols.
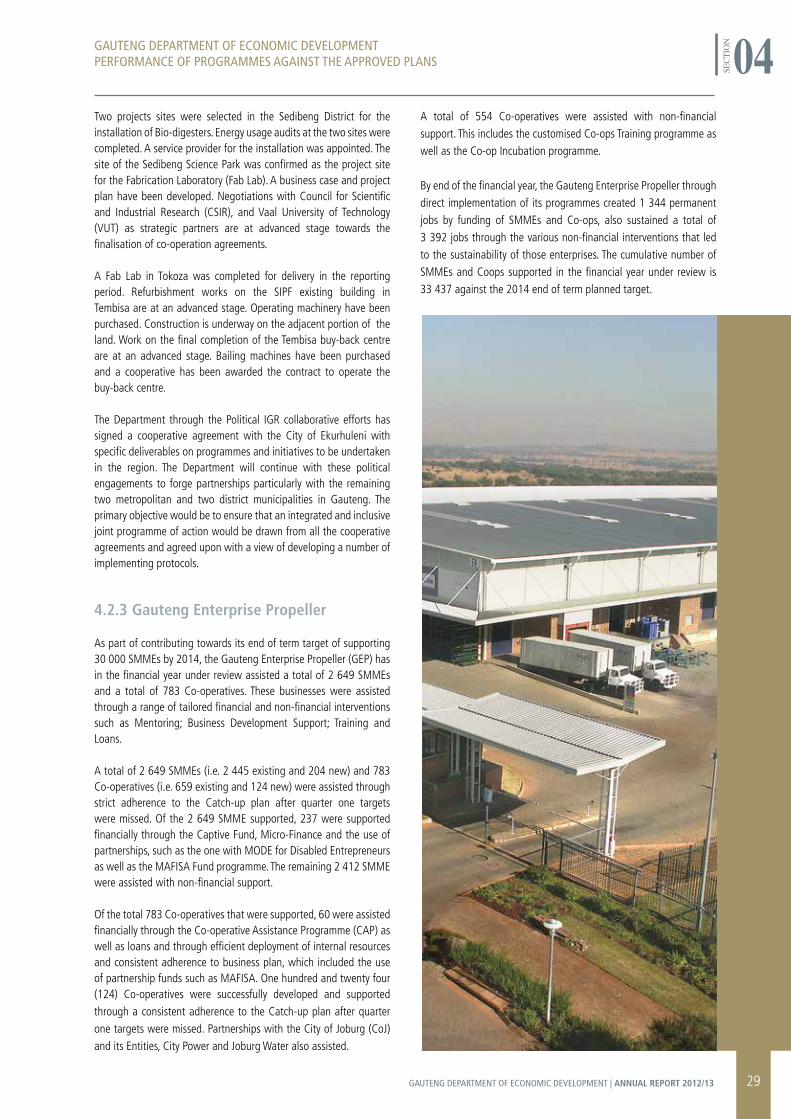
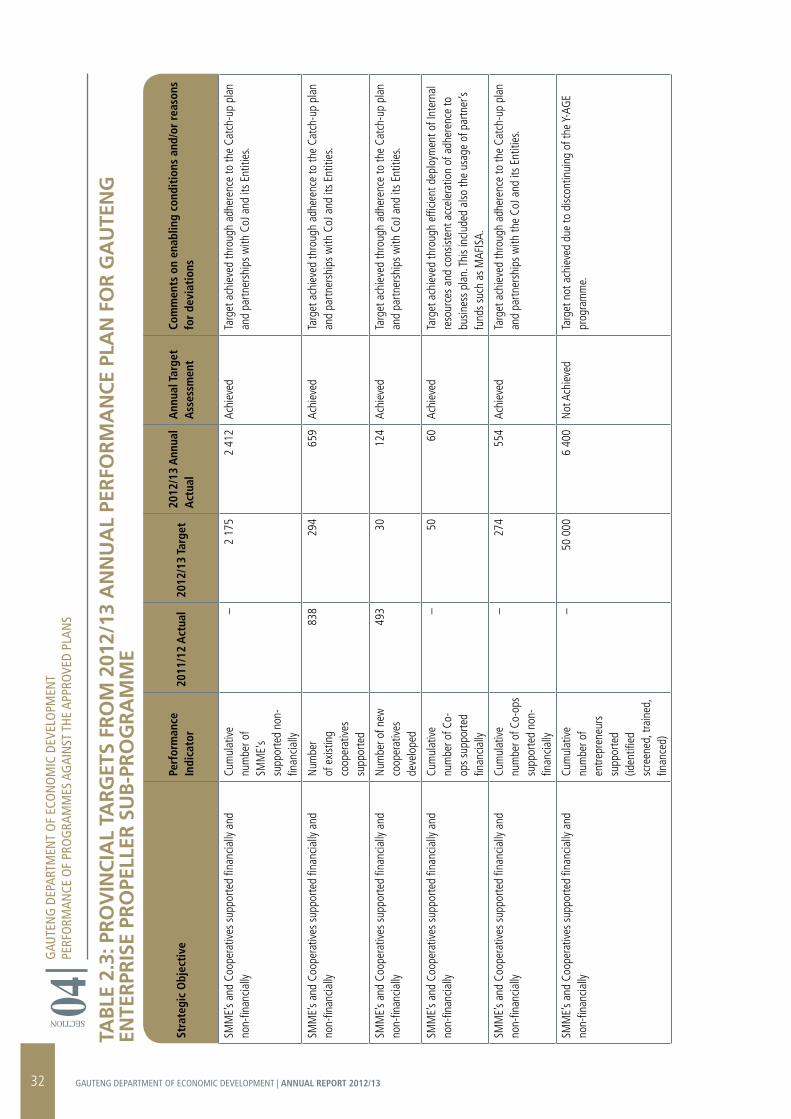
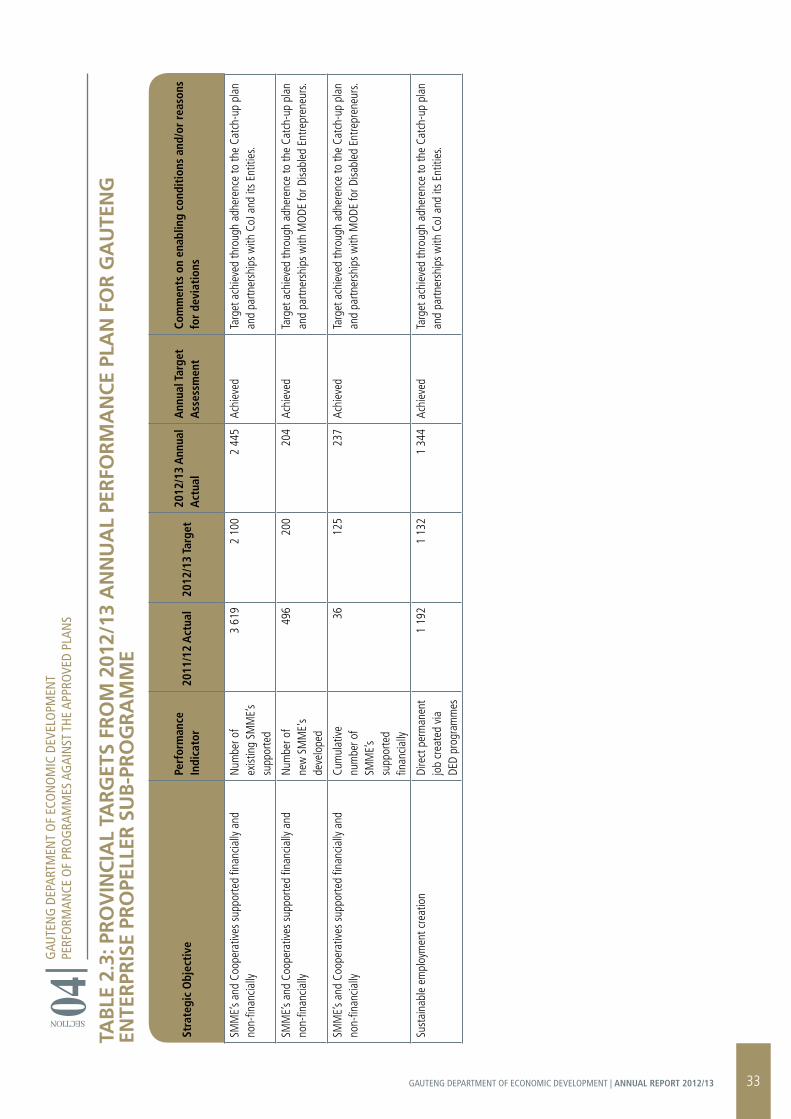
4.2.3 Gauteng Enterprise Propeller
As part of contributing towards its end of term target of supporting 30 000 SMMEs by 2014, the Gauteng Enterprise Propeller (GEP) has in the financial year under review assisted a total of 2 649 SMMEs and a total of 783 Co-operatives. These businesses were assisted through a range of tailored financial and non-financial interventions such as Mentoring; Business Development Support; Training and Loans.
A total of 2 649 SMMEs (i.e. 2 445 existing and 204 new) and 783 Co-operatives (i.e. 659 existing and 124 new) were assisted through strict adherence to the Catch-up plan after quarter one targets were missed. Of the 2 649 SMME supported, 237 were supported financially through the Captive Fund, Micro-Finance and the use of partnerships, such as the one with MODE for Disabled Entrepreneurs as well as the MAFISA Fund programme. The remaining 2 412 SMME were assisted with non-financial support.
Of the total 783 Co-operatives that were supported, 60 were assisted financially through the Co-operative Assistance Programme (CAP) as well as loans and through efficient deployment of internal resources and consistent adherence to business plan, which included the use of partnership funds such as MAFISA. One hundred and twenty four (124) Co-operatives were successfully developed and supported through a consistent adherence to the Catch-up plan after quarter one targets were missed. Partnerships with the City of Joburg (CoJ) and its Entities, City Power and Joburg Water also assisted.
A total of 554 Co-operatives were assisted with non-financial support. This includes the customised Co-ops Training programme as well as the Co-op Incubation programme.
By end of the financial year, the Gauteng Enterprise Propeller through direct implementation of its programmes created 1 344 permanent jobs by funding of SMMEs and Co-ops, also sustained a total of 3 392 jobs through the various non-financial interventions that led to the sustainability of those enterprises. The cumulative number of SMMEs and Coops supported in the financial year under review is 33 437 against the 2014 end of term planned target.
GAUTENG DEPARTMENT OF ECONOMIC DEVELOPMENTPERFORMANCE OF PROGRAMMES AGAINST THE APPROVED PLANS
SECT
ION 04
29GAUTENG DEPARTMENT OF ECONOMIC DEVELOPMENT | ANNUAL REPORT 2012/13
TAB
LE 2
.1: P
rO
VIN
CIA
L TA
rG
ETS
FrO
M 2
012/
13 A
NN
UA
L PE
rFO
rM
AN
CE
PLA
N F
Or
YO
UTH
EM
PLO
YM
ENT
SUB
-Pr
OG
rA
MM
E
GAU
TEN
G D
EPAR
TMEN
T O
F EC
ON
OM
IC D
EVEL
OPM
ENT
PERF
ORM
ANCE
OF
PRO
GRA
MM
ES A
GAI
NST
THE
APP
ROVE
D PL
ANS
SECTION 04
Stra
tegi
c O
bjec
tive
Perf
orm
ance
In
dica
tor
2011
/12
Act
ual
2012
/13
Targ
et20
12/1
3 A
nnua
l A
ctua
lA
nnua
l Tar
get
Ass
essm
ent
Com
men
ts o
n en
ablin
g co
ndit
ions
and
/or
reas
ons
for
devi
atio
ns
Yout
h em
ploy
men
t pro
gram
mes
impl
emen
ted
Num
ber o
f To
wns
hip
Ente
rpris
e Hu
bs
esta
blish
ed
–6
0N
ot A
chie
ved
The
plan
ned
targ
et o
f est
ablis
hing
six
Tow
nshi
p En
terp
rise
Hubs
in id
entifi
ed lo
catio
ns c
ould
not
be
real
ised
due
to fu
ndin
g co
nstra
ints
and
the
cons
truct
ion
of W
inte
rvel
dt To
wns
hip
Ente
rpris
e Hu
b w
as id
entifi
ed to
be
a p
ilot t
hat w
ill b
e us
ed a
s be
nchm
ark
in ro
lling
out
ot
her h
ubs
in th
e ne
w fi
nanc
ial y
ear.
Sust
aina
ble
empl
oym
ent c
reat
ion
Dire
ct p
erm
anen
t jo
b cr
eate
d vi
a DE
D pr
ogra
mm
es
02
484
16N
ot A
chie
ved
A to
tal o
f 3 4
39 y
oung
peo
ple
have
regi
ster
ed w
ith th
e Pr
ogra
mm
e w
hilst
ove
r 1 2
70 h
ave
rece
ived
wor
k-re
adin
ess
train
ing.
The
Pro
gram
me
has
plac
ed o
ver
60 y
oung
peo
ple
in p
erm
anen
t and
tem
pora
ry jo
bs.
Sust
aina
ble
empl
oym
ent c
reat
ion
Dire
ct te
mpo
rary
jo
b cr
eate
d vi
a DE
D pr
ogra
mm
es
01
516
44N
ot A
chie
ved
The
Depa
rtmen
t will
con
tinue
eng
agem
ents
with
th
e pr
ivate
sec
tor t
o pa
rtner
tow
ards
pla
cing
mor
e ca
ndid
ates
that
hav
e re
gist
ered
with
the
Prog
ram
me.
30 GAUTENG DEPARTMENT OF ECONOMIC DEVELOPMENT | ANNUAL REPORT 2012/13
TAB
LE 2
.2: P
rO
VIN
CIA
L TA
rG
ETS
FrO
M 2
012/
13 A
NN
UA
L PE
rFO
rM
AN
CE
PLA
N F
Or
rEG
ION
AL
AN
D L
OC
AL
ECO
NO
MIC
DEV
ELO
PMEN
T SU
B-P
rO
Gr
AM
ME
GAU
TEN
G D
EPAR
TMEN
T O
F EC
ON
OM
IC D
EVEL
OPM
ENT
PERF
ORM
ANCE
OF
PRO
GRA
MM
ES A
GAI
NST
THE
APP
ROVE
D PL
ANS
SECTION 04
Stra
tegi
c O
bjec
tive
Perf
orm
ance
In
dica
tor
2011
/12
Act
ual
2012
/13
Targ
et20
12/1
3 A
nnua
l A
ctua
lA
nnua
l Tar
get
Ass
essm
ent
Com
men
ts o
n en
ablin
g co
ndit
ions
and
/or
reas
ons
for
devi
atio
ns
LED
proj
ects
est
ablis
hed
and
supp
orte
dN
umbe
r of
econ
omic
deve
lopm
ent
proj
ects
su
ppor
ted
at
loca
l and
regi
onal
le
vels
–5
1N
ot A
chie
ved
Proj
ects
sup
porte
d ar
e w
ork-
in-p
rogr
ess
at d
iffer
ent
stag
es o
f com
plet
ion.
Fin
al c
ompl
etio
n of
the
proj
ects
su
ppor
ted
is al
igne
d to
and
hin
ges
on th
e fin
ancia
l yea
r-en
d of
mun
icipa
litie
s.
LED
proj
ects
est
ablis
hed
and
supp
orte
dN
umbe
r of
capa
city
build
ing
inte
rven
tions
to
mun
icipa
litie
s
–2
1N
ot A
chie
ved
The
Depa
rtmen
t thr
ough
the
Polit
ical I
GR
colla
bora
tive
effo
rts w
ith th
e M
unici
palit
ies
has
agre
ed to
wor
k jo
intly
in fu
ture
on
the
capa
city
build
ing
prog
ram
me
and
iden
tify
the
criti
cal n
eeds
for t
he s
ucce
ss o
f the
se
initi
ativ
es.
The
enga
gem
ents
are
on
goin
g fo
r agr
eed
prog
ram
mes
to
find
exp
ress
ion
in th
e M
unici
palit
ies
IDP’
s an
d st
rate
gic
plan
s. Th
is is
to e
nsur
e th
at D
epar
tmen
tal
plan
ned
targ
ets
on re
gion
al a
nd lo
cal e
cono
mic
deve
lopm
ent a
re re
alize
d.
LED
proj
ects
est
ablis
hed
and
supp
orte
dN
umbe
r of L
ED
stak
ehol
ders
ta
ken
thro
ugh
capa
city
build
ing
prog
ram
mes
per
an
num
–50
0N
ot A
chie
ved
The
Depa
rtmen
t def
erre
d th
e ca
pacit
y bu
ildin
g pr
ogra
mm
e pe
ndin
g as
certa
inin
g th
e im
pact
and
val
ue-
for-m
oney
of t
he p
rogr
amm
e. Th
e co
ncep
t of d
eplo
ying
Econ
omic
Deve
lopm
ent F
acili
ties
to s
trugg
ling
smal
l m
unici
palit
ies
was
intro
duce
d fo
r pilo
ting
as p
art o
f de
velo
ping
a c
ompr
ehen
sive
capa
city
build
ing
LED
proj
ects
est
ablis
hed
and
supp
orte
dN
umbe
r of L
ED
Stra
tegi
es a
ligne
d to
PG
DS a
nd
othe
r spa
tial
deve
lopm
ent
plan
s
–1
0N
ot A
chie
ved
The
Depa
rtmen
t rec
eive
d tw
o re
ques
ts fo
r LED
stra
tegi
es
assis
tanc
e fro
m S
edib
eng
Dist
rict M
unici
palit
y’s lo
cal
mun
icipa
litie
s, Le
sedi
and
Mid
Vaal
. The
se re
ques
ts w
ere
defe
rred
to th
e ne
xt fi
nanc
ial y
ear d
ue to
bud
geta
ry
cons
train
ts.
31GAUTENG DEPARTMENT OF ECONOMIC DEVELOPMENT | ANNUAL REPORT 2012/13
TAB
LE 2
.3: P
rO
VIN
CIA
L TA
rG
ETS
FrO
M 2
012/
13 A
NN
UA
L PE
rFO
rM
AN
CE
PLA
N F
Or
GA
UTE
NG
ENTE
rPr
ISE
PrO
PELL
Er S
UB
-Pr
OG
rA
MM
E
GAU
TEN
G D
EPAR
TMEN
T O
F EC
ON
OM
IC D
EVEL
OPM
ENT
PERF
ORM
ANCE
OF
PRO
GRA
MM
ES A
GAI
NST
THE
APP
ROVE
D PL
ANS
SECTION 04
Stra
tegi
c O
bjec
tive
Perf
orm
ance
In
dica
tor
2011
/12
Act
ual
2012
/13
Targ
et20
12/1
3 A
nnua
l A
ctua
lA
nnua
l Tar
get
Ass
essm
ent
Com
men
ts o
n en
ablin
g co
ndit
ions
and
/or
reas
ons
for
devi
atio
ns
SMM
E’s
and
Coop
erat
ives
sup
porte
d fin
ancia
lly a
nd
non-
finan
cially
Cum
ulat
ive
num
ber o
f SM
ME'
s su
ppor
ted
non-
finan
cially
–2
175
2 41
2Ac
hiev
edTa
rget
ach
ieve
d th
roug
h ad
here
nce
to th
e Ca
tch-
up p
lan
and
partn
ersh
ips
with
CoJ
and
its
Entit
ies.
SMM
E’s
and
Coop
erat
ives
sup
porte
d fin
ancia
lly a
nd
non-
finan
cially
Num
ber
of e
xist
ing
coop
erat
ives
su
ppor
ted
838
294
659
Achi
eved
Targ
et a
chie
ved
thro
ugh
adhe
renc
e to
the
Catc
h-up
pla
n an
d pa
rtner
ship
s w
ith C
oJ a
nd it
s En
titie
s.
SMM
E’s
and
Coop
erat
ives
sup
porte
d fin
ancia
lly a
nd
non-
finan
cially
Num
ber o
f new
co
oper
ativ
es
deve
lope
d
493
3012
4Ac
hiev
edTa
rget
ach
ieve
d th
roug
h ad
here
nce
to th
e Ca
tch-
up p
lan
and
partn
ersh
ips
with
CoJ
and
its
Entit
ies.
SMM
E’s
and
Coop
erat
ives
sup
porte
d fin
ancia
lly a
nd
non-
finan
cially
Cum
ulat
ive
num
ber o
f Co-
ops
supp
orte
d fin
ancia
lly
–50
60Ac
hiev
edTa
rget
ach
ieve
d th
roug
h ef
ficie
nt d
eplo
ymen
t of I
nter
nal
reso
urce
s an
d co
nsist
ent a
ccel
erat
ion
of a
dher
ence
to
busin
ess
plan
. Thi
s in
clude
d al
so th
e us
age
of p
artn
er’s
fund
s su
ch a
s M
AFIS
A.
SMM
E’s
and
Coop
erat
ives
sup
porte
d fin
ancia
lly a
nd
non-
finan
cially
Cum
ulat
ive
num
ber o
f Co-
ops
supp
orte
d no
n-fin
ancia
lly
–27
455
4Ac
hiev
edTa
rget
ach
ieve
d th
roug
h ad
here
nce
to th
e Ca
tch-
up p
lan
and
partn
ersh
ips
with
the
CoJ a
nd it
s En
titie
s.
SMM
E’s
and
Coop
erat
ives
sup
porte
d fin
ancia
lly a
nd
non-
finan
cially
Cum
ulat
ive
num
ber o
f en
trepr
eneu
rs
supp
orte
d (id
entifi
ed
scre
ened
, tra
ined
, fin
ance
d)
–50
000
6 40
0N
ot A
chie
ved
Targ
et n
ot a
chie
ved
due
to d
iscon
tinui
ng o
f the
Y-AG
E pr
ogra
mm
e.
32 GAUTENG DEPARTMENT OF ECONOMIC DEVELOPMENT | ANNUAL REPORT 2012/13
TAB
LE 2
.3: P
rO
VIN
CIA
L TA
rG
ETS
FrO
M 2
012/
13 A
NN
UA
L PE
rFO
rM
AN
CE
PLA
N F
Or
GA
UTE
NG
EN
TEr
PrIS
E Pr
OPE
LLEr
SU
B-P
rO
Gr
AM
ME
GAU
TEN
G D
EPAR
TMEN
T O
F EC
ON
OM
IC D
EVEL
OPM
ENT
PERF
ORM
ANCE
OF
PRO
GRA
MM
ES A
GAI
NST
THE
APP
ROVE
D PL
ANS
Stra
tegi
c O
bjec
tive
Perf
orm
ance
In
dica
tor
2011
/12
Act
ual
2012
/13
Targ
et20
12/1
3 A
nnua
l A
ctua
lA
nnua
l Tar
get
Ass
essm
ent
Com
men
ts o
n en
ablin
g co
ndit
ions
and
/or
reas
ons
for
devi
atio
ns
SMM
E’s
and
Coop
erat
ives
sup
porte
d fin
ancia
lly a
nd
non-
finan
cially
Num
ber o
f ex
istin
g SM
ME’
s su
ppor
ted
3 61
92
100
2 44
5Ac
hiev
edTa
rget
ach
ieve
d th
roug
h ad
here
nce
to th
e Ca
tch-
up p
lan
and
partn
ersh
ips
with
CoJ
and
its
Entit
ies.
SMM
E’s
and
Coop
erat
ives
sup
porte
d fin
ancia
lly a
nd
non-
finan
cially
Num
ber o
f ne
w S
MM
E's
deve
lope
d
496
200
204
Achi
eved
Targ
et a
chie
ved
thro
ugh
adhe
renc
e to
the
Catc
h-up
pla
n an
d pa
rtner
ship
s w
ith M
ODE
for D
isabl
ed E
ntre
pren
eurs
.
SMM
E’s
and
Coop
erat
ives
sup
porte
d fin
ancia
lly a
nd
non-
finan
cially
Cum
ulat
ive
num
ber o
f SM
ME’
s su
ppor
ted
finan
cially
3612
523
7Ac
hiev
edTa
rget
ach
ieve
d th
roug
h ad
here
nce
to th
e Ca
tch-
up p
lan
and
partn
ersh
ips
with
MO
DE fo
r Disa
bled
Ent
repr
eneu
rs.
Sust
aina
ble
empl
oym
ent c
reat
ion
Dire
ct p
erm
anen
t jo
b cr
eate
d vi
a DE
D pr
ogra
mm
es
1 19
21
132
1 34
4Ac
hiev
edTa
rget
ach
ieve
d th
roug
h ad
here
nce
to th
e Ca
tch-
up p
lan
and
partn
ersh
ips
with
CoJ
and
its
Entit
ies.
SECTION 04
33GAUTENG DEPARTMENT OF ECONOMIC DEVELOPMENT | ANNUAL REPORT 2012/13
4.3 PrOGrAMME 3: TrADE AND SECTOr DEVELOPMENT
The Trade and Industry programme is responsible for the stimulation of economic growth through industry development, trade and investment promotion, and translating economic policies into implementable strategies.
The programme’s objective is to support the facilitation of trade, export promotion and to attract investment, by developing implementation strategies for the positioning of the industrial sector as a key contributor to economic growth and development; and to facilitate the implementation of strategic programmes that will stimulate the competitiveness of priority sectors. In this regard, the programme provides guidance and support from the GDED to its agencies through the development of costed implementation strategies and exploring opportunities for greater collaboration, thereby ensuring that the economic development objectives of the Gauteng Global City Region are realised.
4.3.1 Gauteng Growth and Development Agency (GGDA)
Freight and Logistics
The Tambo Springs Inland Port project which is a freight transport and logistics focused development on 1 500 ha of land south of Vosloosrus, close to the N3 highway was successfully handed over to the Department of Roads and Transport during the financial year under review.
GGDA continues to work with GDED and GDRT as part of the handover process. The handover report was prepared by GDED and submitted to GDRT. However; it was agreed the GGDA and GDED must complete the feasibility study currently being conducted on the site identified by Mogale City before handing over the project to GDRT. GGDA and GDED had started a process to apply for funding from Gauteng Funding Agency (GFA) to conduct the feasibility study. GFA granted the funding in October 2012. The condition attached to the funding was that GFA would appoint the professional team. This was done in December 2012. The project work commenced in January 2013. The team is completing the study in May 2013, therefore the process of handing over the project report to GDRT will commence.
The IDZ Development Company (IDZ Devco)
The Industrial Development Zone (IDZ) Devco was established by virtue of the Blue IQ Act but remained a shelf company until the operator licences for the IDZ was granted to BIQ by the Department of Trade and Industry in December 2010. The vision for the ORTIA-IDZ is to contribute towards the transformation, development and growth of post-minerals extraction processing and beneficiation industry sectors.
To contribute to the creation of an export-orientated growth centre, this will take advantage of the ORTIA as the primary air transportation hub in South Africa.
The IDZ development is within the Ekurhuleni Metro and it is intrinsically intertwined with the Aerotropolis project that is spearheaded by Ekurhuleni Metro.
The IDZ framework would give impetus to the Aerotropolis and would improve the value proposition. To maximise synergies of these initiatives the GDED has initiated discussions with the Metro and a Memorandum of Understanding (MoU) is in the process of being finalised.
The JMP Commercial Case was presented to the IDZ DEVCO Board and approved for submission to GDED in July 2012. The HOD accepted the commercial case and it was then submitted to National Treasury in August 2012 to register the project as a Private Public Partnership (PPP).
The commercial case was further submitted to the dti for funding application. A letter of confirmation for support was received from the dti to fund the bulk infrastructure. An agreement must be entered between the Department and dti to detail the responsibilities, the grant flow, and the conditions on the Operator Permit have to be executed.
The outcomes of the commercial case recommended that the first phase of the ORTIA IDZ JMP, be procured using the PPP approach, as regulated on Treasury Regulation 16. The commercial case further conducted a stakeholder analysis of key government institutions and through various engagements, the stakeholder model was further refined. Further to the commercial case the GGDA appointed Jewellery Council of South Africa (JCSA) to develop a concept paper which maps out the project framework to be adopted for implementation of the skills development initiative as support to JMP development.
The IDZ steering committee meeting was held in February 2013. National Treasury concurred with the members of the steering committee that Expression of Interest/Request for Quotation (EOI/RFQ) should be issued to market. The IDZ DEVCO is in the process of appointing the procurement advisor to ensure that the document put out to market is competitively packaged to attract the targeted investors. The advisor will offer technical know-how during the tender planning (RFQ/RFP) process. Simultaneous to the Procurement Phase, will be the development of the bulk infrastructure. An Environmental Impact Assessment was conducted for the 6.1ha land. A Record of Decision was then issued by the Gauteng Department of Agriculture and Rural Development. The IDZ DEVCO has since contracted the Environmental Control Officer (ECO).
Skill development component is part of the overall project plan for the implementation of the Jewellery Manufacturing Precinct. To this end, the IDZ Devco has together with the Jewellery Council SA and tertiary institutions like the University of Johannesburg developed and finalised a 3-year training programme for young jewellery designers. The course content was finalised in the 2012/13 and the first 15-student intake is expected to occur in 2013/14.
GAUTENG DEPARTMENT OF ECONOMIC DEVELOPMENTPERFORMANCE OF PROGRAMMES AGAINST THE APPROVED PLANS
SECT
ION 04
34 GAUTENG DEPARTMENT OF ECONOMIC DEVELOPMENT | ANNUAL REPORT 2012/13
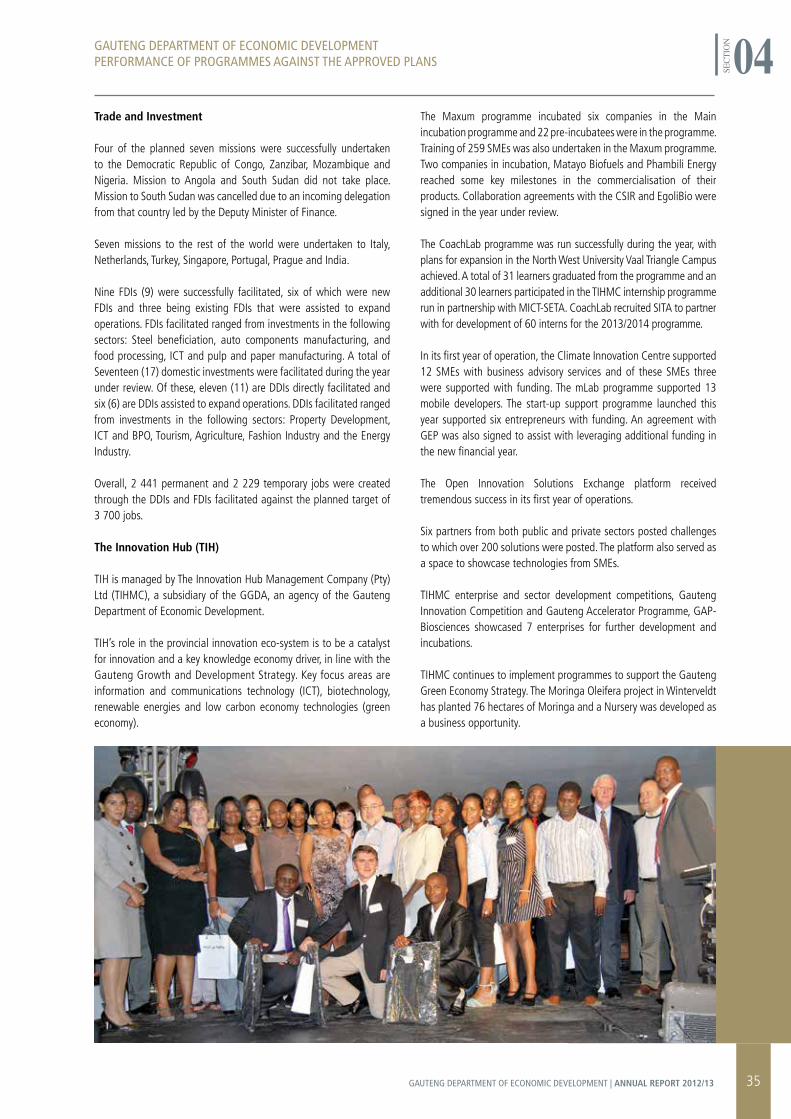
Trade and Investment
Four of the planned seven missions were successfully undertaken to the Democratic Republic of Congo, Zanzibar, Mozambique and Nigeria. Mission to Angola and South Sudan did not take place. Mission to South Sudan was cancelled due to an incoming delegation from that country led by the Deputy Minister of Finance.
Seven missions to the rest of the world were undertaken to Italy, Netherlands, Turkey, Singapore, Portugal, Prague and India.
Nine FDIs (9) were successfully facilitated, six of which were new FDIs and three being existing FDIs that were assisted to expand operations. FDIs facilitated ranged from investments in the following sectors: Steel beneficiation, auto components manufacturing, and food processing, ICT and pulp and paper manufacturing. A total of Seventeen (17) domestic investments were facilitated during the year under review. Of these, eleven (11) are DDIs directly facilitated and six (6) are DDIs assisted to expand operations. DDIs facilitated ranged from investments in the following sectors: Property Development, ICT and BPO, Tourism, Agriculture, Fashion Industry and the Energy Industry.
Overall, 2 441 permanent and 2 229 temporary jobs were created through the DDIs and FDIs facilitated against the planned target of 3 700 jobs.
The Innovation Hub (TIH)
TIH is managed by The Innovation Hub Management Company (Pty) Ltd (TIHMC), a subsidiary of the GGDA, an agency of the Gauteng Department of Economic Development.
TIH’s role in the provincial innovation eco-system is to be a catalyst for innovation and a key knowledge economy driver, in line with the Gauteng Growth and Development Strategy. Key focus areas are information and communications technology (ICT), biotechnology, renewable energies and low carbon economy technologies (green economy).
The Maxum programme incubated six companies in the Main incubation programme and 22 pre-incubatees were in the programme. Training of 259 SMEs was also undertaken in the Maxum programme. Two companies in incubation, Matayo Biofuels and Phambili Energy reached some key milestones in the commercialisation of their products. Collaboration agreements with the CSIR and EgoliBio were signed in the year under review.
The CoachLab programme was run successfully during the year, with plans for expansion in the North West University Vaal Triangle Campus achieved. A total of 31 learners graduated from the programme and an additional 30 learners participated in the TIHMC internship programme run in partnership with MICT-SETA. CoachLab recruited SITA to partner with for development of 60 interns for the 2013/2014 programme.
In its first year of operation, the Climate Innovation Centre supported 12 SMEs with business advisory services and of these SMEs three were supported with funding. The mLab programme supported 13 mobile developers. The start-up support programme launched this year supported six entrepreneurs with funding. An agreement with GEP was also signed to assist with leveraging additional funding in the new financial year.
The Open Innovation Solutions Exchange platform received tremendous success in its first year of operations.
Six partners from both public and private sectors posted challenges to which over 200 solutions were posted. The platform also served as a space to showcase technologies from SMEs.
TIHMC enterprise and sector development competitions, Gauteng Innovation Competition and Gauteng Accelerator Programme, GAP- Biosciences showcased 7 enterprises for further development and incubations.
TIHMC continues to implement programmes to support the Gauteng Green Economy Strategy. The Moringa Oleifera project in Winterveldt has planted 76 hectares of Moringa and a Nursery was developed as a business opportunity.
GAUTENG DEPARTMENT OF ECONOMIC DEVELOPMENTPERFORMANCE OF PROGRAMMES AGAINST THE APPROVED PLANS
SECT
ION 04
35GAUTENG DEPARTMENT OF ECONOMIC DEVELOPMENT | ANNUAL REPORT 2012/13
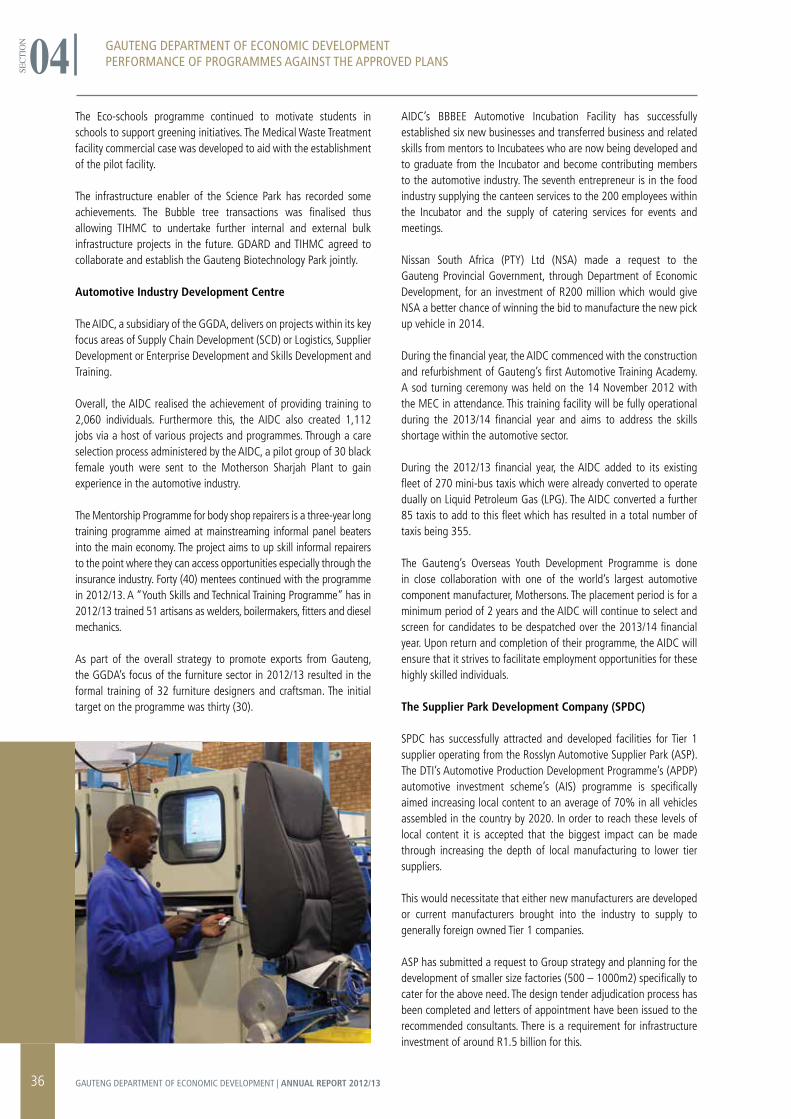
The Eco-schools programme continued to motivate students in schools to support greening initiatives. The Medical Waste Treatment facility commercial case was developed to aid with the establishment of the pilot facility.
The infrastructure enabler of the Science Park has recorded some achievements. The Bubble tree transactions was finalised thus allowing TIHMC to undertake further internal and external bulk infrastructure projects in the future. GDARD and TIHMC agreed to collaborate and establish the Gauteng Biotechnology Park jointly.
Automotive Industry Development Centre
The AIDC, a subsidiary of the GGDA, delivers on projects within its key focus areas of Supply Chain Development (SCD) or Logistics, Supplier Development or Enterprise Development and Skills Development and Training.
Overall, the AIDC realised the achievement of providing training to 2,060 individuals. Furthermore this, the AIDC also created 1,112 jobs via a host of various projects and programmes. Through a care selection process administered by the AIDC, a pilot group of 30 black female youth were sent to the Motherson Sharjah Plant to gain experience in the automotive industry.
The Mentorship Programme for body shop repairers is a three-year long training programme aimed at mainstreaming informal panel beaters into the main economy. The project aims to up skill informal repairers to the point where they can access opportunities especially through the insurance industry. Forty (40) mentees continued with the programme in 2012/13. A “Youth Skills and Technical Training Programme” has in 2012/13 trained 51 artisans as welders, boilermakers, fitters and diesel mechanics.
As part of the overall strategy to promote exports from Gauteng, the GGDA’s focus of the furniture sector in 2012/13 resulted in the formal training of 32 furniture designers and craftsman. The initial target on the programme was thirty (30).
AIDC’s BBBEE Automotive Incubation Facility has successfully established six new businesses and transferred business and related skills from mentors to Incubatees who are now being developed and to graduate from the Incubator and become contributing members to the automotive industry. The seventh entrepreneur is in the food industry supplying the canteen services to the 200 employees within the Incubator and the supply of catering services for events and meetings.
Nissan South Africa (PTY) Ltd (NSA) made a request to the Gauteng Provincial Government, through Department of Economic Development, for an investment of R200 million which would give NSA a better chance of winning the bid to manufacture the new pick up vehicle in 2014.
During the financial year, the AIDC commenced with the construction and refurbishment of Gauteng’s first Automotive Training Academy. A sod turning ceremony was held on the 14 November 2012 with the MEC in attendance. This training facility will be fully operational during the 2013/14 financial year and aims to address the skills shortage within the automotive sector.
During the 2012/13 financial year, the AIDC added to its existing fleet of 270 mini-bus taxis which were already converted to operate dually on Liquid Petroleum Gas (LPG). The AIDC converted a further 85 taxis to add to this fleet which has resulted in a total number of taxis being 355.
The Gauteng’s Overseas Youth Development Programme is done in close collaboration with one of the world’s largest automotive component manufacturer, Mothersons. The placement period is for a minimum period of 2 years and the AIDC will continue to select and screen for candidates to be despatched over the 2013/14 financial year. Upon return and completion of their programme, the AIDC will ensure that it strives to facilitate employment opportunities for these highly skilled individuals.
The Supplier Park Development Company (SPDC)
SPDC has successfully attracted and developed facilities for Tier 1 supplier operating from the Rosslyn Automotive Supplier Park (ASP). The DTI’s Automotive Production Development Programme’s (APDP) automotive investment scheme’s (AIS) programme is specifically aimed increasing local content to an average of 70% in all vehicles assembled in the country by 2020. In order to reach these levels of local content it is accepted that the biggest impact can be made through increasing the depth of local manufacturing to lower tier suppliers.
This would necessitate that either new manufacturers are developed or current manufacturers brought into the industry to supply to generally foreign owned Tier 1 companies.
ASP has submitted a request to Group strategy and planning for the development of smaller size factories (500 – 1000m2) specifically to cater for the above need. The design tender adjudication process has been completed and letters of appointment have been issued to the recommended consultants. There is a requirement for infrastructure investment of around R1.5 billion for this.
GAUTENG DEPARTMENT OF ECONOMIC DEVELOPMENTPERFORMANCE OF PROGRAMMES AGAINST THE APPROVED PLANS
SECT
ION 04
36 GAUTENG DEPARTMENT OF ECONOMIC DEVELOPMENT | ANNUAL REPORT 2012/13
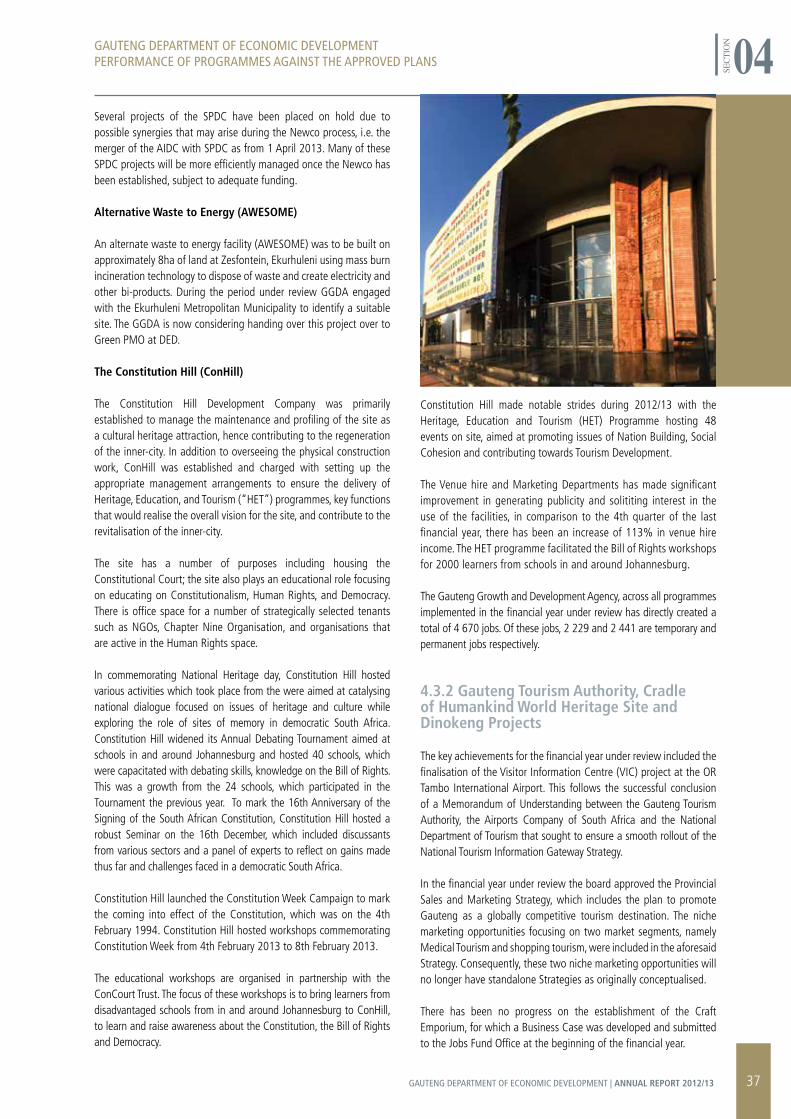
Several projects of the SPDC have been placed on hold due to possible synergies that may arise during the Newco process, i.e. the merger of the AIDC with SPDC as from 1 April 2013. Many of these SPDC projects will be more efficiently managed once the Newco has been established, subject to adequate funding.
Alternative Waste to Energy (AWESOME)
An alternate waste to energy facility (AWESOME) was to be built on approximately 8ha of land at Zesfontein, Ekurhuleni using mass burn incineration technology to dispose of waste and create electricity and other bi-products. During the period under review GGDA engaged with the Ekurhuleni Metropolitan Municipality to identify a suitable site. The GGDA is now considering handing over this project over to Green PMO at DED.
The Constitution Hill (ConHill)
The Constitution Hill Development Company was primarily established to manage the maintenance and profiling of the site as a cultural heritage attraction, hence contributing to the regeneration of the inner-city. In addition to overseeing the physical construction work, ConHill was established and charged with setting up the appropriate management arrangements to ensure the delivery of Heritage, Education, and Tourism (“HET”) programmes, key functions that would realise the overall vision for the site, and contribute to the revitalisation of the inner-city.
The site has a number of purposes including housing the Constitutional Court; the site also plays an educational role focusing on educating on Constitutionalism, Human Rights, and Democracy. There is office space for a number of strategically selected tenants such as NGOs, Chapter Nine Organisation, and organisations that are active in the Human Rights space.
In commemorating National Heritage day, Constitution Hill hosted various activities which took place from the were aimed at catalysing national dialogue focused on issues of heritage and culture while exploring the role of sites of memory in democratic South Africa. Constitution Hill widened its Annual Debating Tournament aimed at schools in and around Johannesburg and hosted 40 schools, which were capacitated with debating skills, knowledge on the Bill of Rights. This was a growth from the 24 schools, which participated in the Tournament the previous year. To mark the 16th Anniversary of the Signing of the South African Constitution, Constitution Hill hosted a robust Seminar on the 16th December, which included discussants from various sectors and a panel of experts to reflect on gains made thus far and challenges faced in a democratic South Africa.
Constitution Hill launched the Constitution Week Campaign to mark the coming into effect of the Constitution, which was on the 4th February 1994. Constitution Hill hosted workshops commemorating Constitution Week from 4th February 2013 to 8th February 2013.
The educational workshops are organised in partnership with the ConCourt Trust. The focus of these workshops is to bring learners from disadvantaged schools from in and around Johannesburg to ConHill, to learn and raise awareness about the Constitution, the Bill of Rights and Democracy.
Constitution Hill made notable strides during 2012/13 with the Heritage, Education and Tourism (HET) Programme hosting 48 events on site, aimed at promoting issues of Nation Building, Social Cohesion and contributing towards Tourism Development.
The Venue hire and Marketing Departments has made significant improvement in generating publicity and solititing interest in the use of the facilities, in comparison to the 4th quarter of the last financial year, there has been an increase of 113% in venue hire income. The HET programme facilitated the Bill of Rights workshops for 2000 learners from schools in and around Johannesburg.
The Gauteng Growth and Development Agency, across all programmes implemented in the financial year under review has directly created a total of 4 670 jobs. Of these jobs, 2 229 and 2 441 are temporary and permanent jobs respectively.
4.3.2 Gauteng Tourism Authority, Cradle of Humankind World Heritage Site and Dinokeng Projects
The key achievements for the financial year under review included the finalisation of the Visitor Information Centre (VIC) project at the OR Tambo International Airport. This follows the successful conclusion of a Memorandum of Understanding between the Gauteng Tourism Authority, the Airports Company of South Africa and the National Department of Tourism that sought to ensure a smooth rollout of the National Tourism Information Gateway Strategy.
In the financial year under review the board approved the Provincial Sales and Marketing Strategy, which includes the plan to promote Gauteng as a globally competitive tourism destination. The niche marketing opportunities focusing on two market segments, namely Medical Tourism and shopping tourism, were included in the aforesaid Strategy. Consequently, these two niche marketing opportunities will no longer have standalone Strategies as originally conceptualised.
There has been no progress on the establishment of the Craft Emporium, for which a Business Case was developed and submitted to the Jobs Fund Office at the beginning of the financial year.
GAUTENG DEPARTMENT OF ECONOMIC DEVELOPMENTPERFORMANCE OF PROGRAMMES AGAINST THE APPROVED PLANS
SECT
ION 04GAUTENG DEPARTMENT OF ECONOMIC DEVELOPMENT
PERFORMANCE OF PROGRAMMES AGAINST THE APPROVED PLANS
37GAUTENG DEPARTMENT OF ECONOMIC DEVELOPMENT | ANNUAL REPORT 2012/13
That was mainly due to the fact that this project was not funded from the very beginning and no funding received either from the Jobs Fund Office. The organisation has since taken a strategic decision not to pursue this project; which if the funding had been successfully secured would have been executed in close cooperation with the Department of Sport, Recreation and Culture under the auspices of their creative industries project.
In the financial year under review, contracts for the upgrading of the Maropeng Interpretation Centre were finalised and preliminary work undertaken. Work on the external infrastructure upgrade, which was earlier split from the Sterkfontein and Maropeng exhibition upgrade, has also been finalised. There were legal challenges that were encountered relating to the poor quality workmanship by the service provider.
Subsequently a panel of experts was appointed in September 2012 to oversee implementation of Phase 2 of the exhibition upgrade and a separate process is underway for the infrastructure upgrades of the external environment at Maropeng.
While considerable progress has been made over the last quarter in terms of developing a Transfer Guideline Protocol for the Ga-Rankuwa Hotel School, the project is still behind the established target. In coordination with the Economic Planning unit at DED, the Ga-Rankuwa Hotel School Infrastructure roll-out plan was developed. This is aimed at regenerating the school to global standards.
The plan identifies a list of infrastructure requirements for the school to be modelled as the best in terms of hospitality skills development. It has been used as a guide for procuring the machinery and equipment for the school. An interim task team is in place and meetings are being held bi-weekly to fast track the pace of execution.
In respect to job creation, 400 tourism safety monitors were employed in the Cradle of Humankind World Heritage Site and Dinokeng areas during the financial year.
The ‘Working for Fire’ project, the management of the Dinokeng Game Reserve and the fossil casting projects in the Cradle of Humankind World Heritage Site and Dinokeng areas also resulted in an additional 123 jobs being created over the year. Of this total, the Working for Fire project in the Cradle created 25 jobs, Dinokeng working for fire 50 jobs, Dinokeng Game Reserve 36 jobs and in the fossil casting project 12 jobs.
The current processes on tourism jobs in the province reflect only permanent jobs. Different processes have been discussed to record temporary jobs but it must be appreciated that the numbers will not be exhaustive as not all value chain players that offer temporary jobs will necessarily provide their inputs. Therefore, these will largely be reported through cooperation with partners that have closer working relationships with the agency. To demonstrate the point, it has been agreed for instance that events sponsored or supported by any other means by the agency will incorporate in the non-negotiable deliverables reports on jobs created. Inopportunely, the sector shed over 1 500 jobs consistent with the prevailing economic conditions in the country.
The Agency has directly created a total of 6 108 jobs. Of these jobs, 6 172 temporary and 36 are permanent respectively.
4.3.3 ICT Programme Management Office
Technical and Services Model Design
Geotechnical, Land Survey, Topographical and base utilities services have resumed and will be totally concluded in the new financial year and form an integral part of the Master Blue Print Development Plan (MBPDP). Existing Environmental Impact Assessment (EIA) reports have been reviewed and commented on accordingly, while new EIAs will be performed on the National Department of Public Works (NPW) land once transferral has been completed from NPW to GDID and or its nominee.
The Urban Designs for both Nasrec Precinct and The Innovation Hub having been completed, Traffic Impact Studies have resumed for both areas.
A detailed infrastructure costing has been concluded for the construction, services, utilities and bulk infrastructure. This costing will be followed by an updated costing upon the conclusion of the ICT infrastructure designs, which were awaiting the finalisation of the Urban Designs. ICT Infrastructure design and costing will be concluded in the next financial year.
This costing forms part of the Gauteng Smart City commercial model and funding models. Major delays to the ICT infrastructure designs have been caused by a lack of information access on the Integrated Business Services (IBC) infrastructure Architecture from the Department of Communications (DOC), thus not fully knowing the extent and design of existing infrastructure within the Nasrec Precinct. The Department has engaged Telkom who are the owners of the infrastructure and a technical team has been established between the two Departments to ensure that DED has access to all the required information as well future rollout plans.
Real Estate and Commercial Feasibility Study
This phase is 90% completed with the development product mix already concluded for both Nasrec Precinct and TIH. The allocations of Residential, Commercial, Industrial and Retail developments has been concluded and costed respectively. Presales will resume upon the conclusion of the MBPDP. A study of the Real Estate surrounding both Nasrec Precinct and TIH is underway (i.e. 90% complete) and will be reflected in a Real Estate Study report as part of the MBPDP. There have been unforeseen delays in finalising the 28ha of land from the National Department of Public Work. Once this has been concluded 100% of this phase will be completed.
Industrial Model Design
Core infrastructure design relating to construction has been 90% concluded. Transport infrastructure relating to Buses, Rail and Mono Rail are 50% completed and will be completed in the next financial year.
GAUTENG DEPARTMENT OF ECONOMIC DEVELOPMENTPERFORMANCE OF PROGRAMMES AGAINST THE APPROVED PLANS
SECT
ION 04
38 GAUTENG DEPARTMENT OF ECONOMIC DEVELOPMENT | ANNUAL REPORT 2012/13
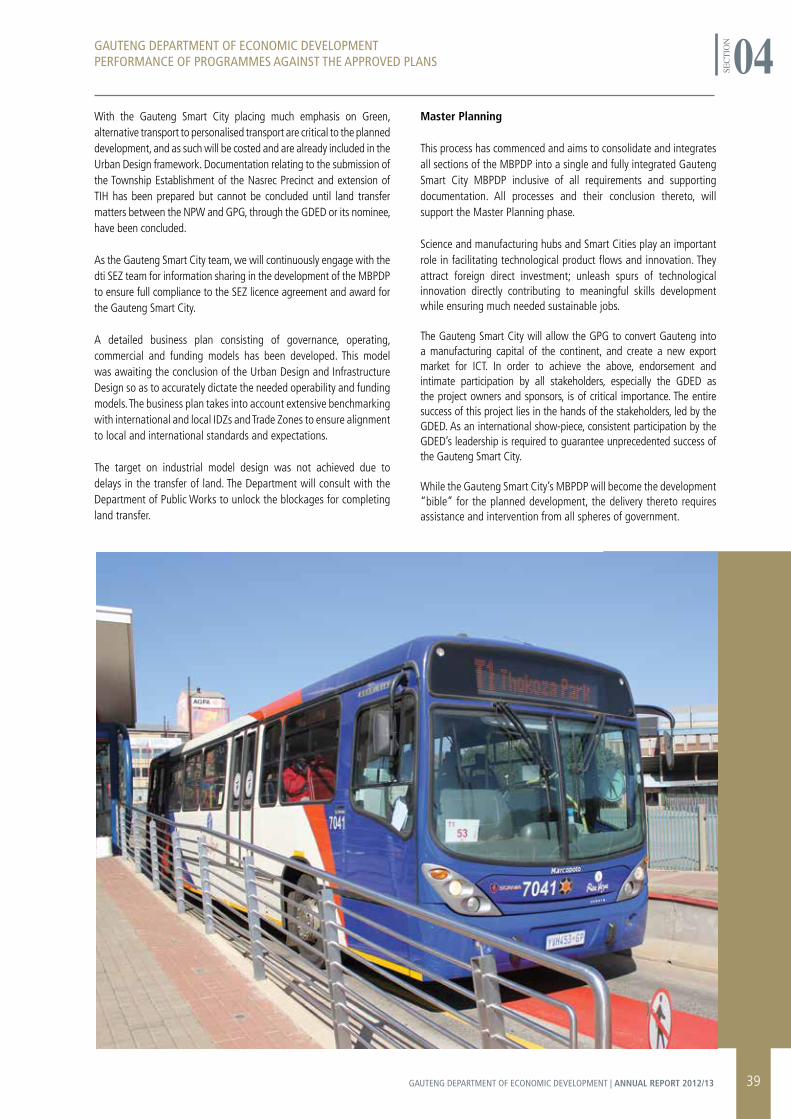
With the Gauteng Smart City placing much emphasis on Green, alternative transport to personalised transport are critical to the planned development, and as such will be costed and are already included in the Urban Design framework. Documentation relating to the submission of the Township Establishment of the Nasrec Precinct and extension of TIH has been prepared but cannot be concluded until land transfer matters between the NPW and GPG, through the GDED or its nominee, have been concluded.
As the Gauteng Smart City team, we will continuously engage with the dti SEZ team for information sharing in the development of the MBPDP to ensure full compliance to the SEZ licence agreement and award for the Gauteng Smart City.
A detailed business plan consisting of governance, operating, commercial and funding models has been developed. This model was awaiting the conclusion of the Urban Design and Infrastructure Design so as to accurately dictate the needed operability and funding models. The business plan takes into account extensive benchmarking with international and local IDZs and Trade Zones to ensure alignment to local and international standards and expectations.
The target on industrial model design was not achieved due to delays in the transfer of land. The Department will consult with the Department of Public Works to unlock the blockages for completing land transfer.
Master Planning
This process has commenced and aims to consolidate and integrates all sections of the MBPDP into a single and fully integrated Gauteng Smart City MBPDP inclusive of all requirements and supporting documentation. All processes and their conclusion thereto, will support the Master Planning phase.
Science and manufacturing hubs and Smart Cities play an important role in facilitating technological product flows and innovation. They attract foreign direct investment; unleash spurs of technological innovation directly contributing to meaningful skills development while ensuring much needed sustainable jobs.
The Gauteng Smart City will allow the GPG to convert Gauteng into a manufacturing capital of the continent, and create a new export market for ICT. In order to achieve the above, endorsement and intimate participation by all stakeholders, especially the GDED as the project owners and sponsors, is of critical importance. The entire success of this project lies in the hands of the stakeholders, led by the GDED. As an international show-piece, consistent participation by the GDED’s leadership is required to guarantee unprecedented success of the Gauteng Smart City.
While the Gauteng Smart City’s MBPDP will become the development “bible” for the planned development, the delivery thereto requires assistance and intervention from all spheres of government.
GAUTENG DEPARTMENT OF ECONOMIC DEVELOPMENTPERFORMANCE OF PROGRAMMES AGAINST THE APPROVED PLANS
SECT
ION 04GAUTENG DEPARTMENT OF ECONOMIC DEVELOPMENT
PERFORMANCE OF PROGRAMMES AGAINST THE APPROVED PLANS
39GAUTENG DEPARTMENT OF ECONOMIC DEVELOPMENT | ANNUAL REPORT 2012/13
A situational analysis on ICT training programme has been completed with Institute of Technical Education Services (ITEES) a Singapore based company. Furthermore the company has submitted recommendation to build a training centre, which will focus on training engineers and IT skills as they are in demand.
Training
The Department managed to train 1 200 people against the set target of 3 000 during 2012/13 financial year. This was due to lack of funding and guaranteed placement for trained candidates impacted negatively towards achieving this target.
The Department signed agreements with key strategic partners during 2012/13 financial year. This will assist with the training budget as well as ensuring that trained candidates are absorbed and placed in employment opportunities.
4.3.4 Green Economy Programme Management Office
Industrial Waste Exchange Programme (IWEX)
Industrial Waste Exchange Programme (IWEX) is meant to create a platform for Industries to exchange their waste material or by-products. The Sedibeng Municipality developed a business plan for IWEX and requested financial support from the Department to pilot this initiative.
The Green PMO examined the business plan and a decision to sponsor this initiative was taken. In the year under review, the Department was unable to appoint a service provider for the Industrial Waste Exchange (IWEX) due to submissions from potential candidates not meeting the minimum criteria. The Request for Proposal (RFP) was published twice and there were no suitable companies with relevant skills and expertise to implement this programme within the Gauteng Province. This programme will be implemented in the new financial year.
Medical Waste Treatment Facility
Medical Waste Treatment Facility is a medium term plan outcome. The intention is to establish a facility that will treat healthcare waste produced by public institutions by using cleaner technologies.
Healthcare waste management has been identified as one of the priority issues in the National Waste Management Strategy and the Gauteng Provincial Government (GPG) acknowledges that proper management of health care waste has important social consequences and can be utilised to achieve some socio-economic objectives.
The Department has managed to conduct and conclude a feasibility study towards the establishment of this facility during the financial year under review. This project will be handed over to the Department of Health for implementation during 2013/14 financial year.
The Department has not achieved the planned annual target to operationalise medical waste treatment facility due to delays in the
appointment of a Green PMO and late take off of the project in the financial year under review. The feasibility study has been completed.
The Deployment of Gas Infrastructure
The deployment of Gas Infrastructure is another important initiative related to alternative energy solutions for the Province. However, the investment in gas infrastructure was independently implemented by some stakeholders with limited or no collaboration. The Department intends to conduct a research so as to understand the existence of this infrastructure in the Province particularly for household utilisation. Unfortunately, due to financial constraints this target was not achieved.
Waste to Energy Plant
Waste to energy plant and conversion of sewer treatment facilities is seen as viable alternative energy option and is highly supported in the Province through various strategies. The project scope has been broadened from the initial focus on Sedibeng Municipality to include West Rand Municipality. This process has caused delays towards achieving this target. However, work has commenced as the feasibility study has been funded by the Gauteng Funding Agency (GFA) to be concluded during 2013/14 financial year.
The appointment of service provider was delayed as the procurement process only commenced during quarter three of the financial year and this process is handled by GFA as the project sponsor.
The Green Programme Office will strengthen its coordination, monitoring and evaluation efforts, build on collaboration with all the spheres of government and mobilise required finances through the private sector to accelerate the implementation of Green Programmes within the Province.
GAUTENG DEPARTMENT OF ECONOMIC DEVELOPMENTPERFORMANCE OF PROGRAMMES AGAINST THE APPROVED PLANS
SECT
ION 04
40 GAUTENG DEPARTMENT OF ECONOMIC DEVELOPMENT | ANNUAL REPORT 2012/13
TAB
LE 3
.1: P
rO
VIN
CIA
L TA
rG
ETS
FrO
M 2
012/
13 A
NN
UA
L PE
rFO
rM
AN
CE
PLA
N F
Or
GA
UTE
NG
Gr
OW
TH
AN
D D
EVEL
OPM
ENT
AG
ENC
Y S
UB
-Pr
OG
rA
MM
E
GAU
TEN
G D
EPAR
TMEN
T O
F EC
ON
OM
IC D
EVEL
OPM
ENT
PERF
ORM
ANCE
OF
PRO
GRA
MM
ES A
GAI
NST
THE
APP
ROVE
D PL
ANS
SECTION 04
Stra
tegi
c O
bjec
tive
Perf
orm
ance
In
dica
tor
2011
/12
Act
ual
2012
/13
Targ
et20
12/1
3 A
nnua
l A
ctua
lA
nnua
l Tar
get
Ass
essm
ent
Com
men
ts o
n en
ablin
g co
ndit
ions
and
/or
reas
ons
for
devi
atio
ns
Stra
tegi
c ec
onom
ic in
frast
ruct
ure
stim
ulat
ing
empl
oym
ent-l
ed g
row
th a
nd d
evel
opm
ent
Perc
enta
ge
com
plet
ion
of
Tam
bo S
prin
gs
Inla
nd P
ort
–30
-N
ot A
pplic
able
The
proj
ect w
as h
ande
d ov
er to
the
Gau
teng
Dep
artm
ent
of Tr
ansp
ort.
Re-In
dust
rialis
atio
n to
sup
port
the
grow
th o
f lab
our-
inte
nsiv
e in
dust
ries
Cum
ulat
ive
num
ber o
f Cr
afts
men
and
de
signe
rs tr
aine
d
–30
32Ac
hiev
edAv
aila
bilit
y of
bud
get a
nd a
dher
ence
to th
e SL
A en
sure
d th
at th
e pr
ojec
t unf
old
as p
lann
ed.
Re-In
dust
rialis
atio
n to
sup
port
the
grow
th o
f lab
our-
inte
nsiv
e in
dust
ries
Num
ber o
f fu
rnitu
re S
MM
E’S
supp
orte
d w
ith
expo
rt m
arke
ting
–50
50Ac
hiev
edTe
n G
aute
ng F
urni
ture
man
ufac
ture
rs w
ere
supp
orte
d w
ith e
xpor
t mar
ketin
g by
par
ticip
atin
g at
DEC
ORE
X in
Au
gust
201
2 an
d th
e ba
lanc
e of
20
com
pani
es w
ere
prov
ided
with
sup
port
at th
e HO
MEM
AKER
S EX
PO,
whi
ch to
ok p
lace
in F
eb 2
013.
Re-In
dust
rialis
atio
n to
sup
port
the
grow
th o
f lab
our-
inte
nsiv
e in
dust
ries
Perc
enta
ge
esta
blish
men
t of
Niss
an S
imul
atio
n pr
ojec
t
–10
010
0Ac
hiev
edAd
here
nce
to G
aute
ng tr
aini
ng a
cade
my
Phas
e1:
Clas
sroo
m b
uild
ing
in li
ne w
ith th
e pr
ojec
t tim
efra
mes
.
Re-In
dust
rialis
atio
n to
sup
port
the
grow
th o
f lab
our-
inte
nsiv
e in
dust
ries
Num
ber o
f be
nefic
iarie
s fro
m Y
outh
re
skill
ing
and
tech
nica
l tra
inin
g pr
ogra
mm
e
–20
51Ac
hiev
edSu
cces
sful
neg
otia
tions
with
the
serv
ice p
rovi
der t
o lo
wer
th
e pr
ices.
The
Depa
rtmen
t man
aged
to s
urpa
ss th
e pl
anne
d ta
rget
Re-In
dust
rialis
atio
n to
sup
port
the
grow
th o
f lab
our-
inte
nsiv
e in
dust
ries
Num
ber o
f be
nefic
iarie
s fro
m M
ento
rshi
p pr
ogra
mm
e fo
r bo
dy re
pair
shop
s
–70
40N
ot A
chie
ved
The
annu
al ta
rget
was
not
met
, as
targ
eted
ben
eficia
ries
coul
d no
t be
reac
hed.
How
ever
, the
AID
C w
as a
ble
to
extra
ct th
e be
st o
ppor
tuni
ties
for t
he in
form
al s
ecto
r en
trepr
eneu
rs re
sulti
ng in
trai
ning
of 6
3 tra
inee
s on
te
chni
cal i
ssue
s.
GAUTENG DEPARTMENT OF ECONOMIC DEVELOPMENTPERFORMANCE OF PROGRAMMES AGAINST THE APPROVED PLANS
41GAUTENG DEPARTMENT OF ECONOMIC DEVELOPMENT | ANNUAL REPORT 2012/13
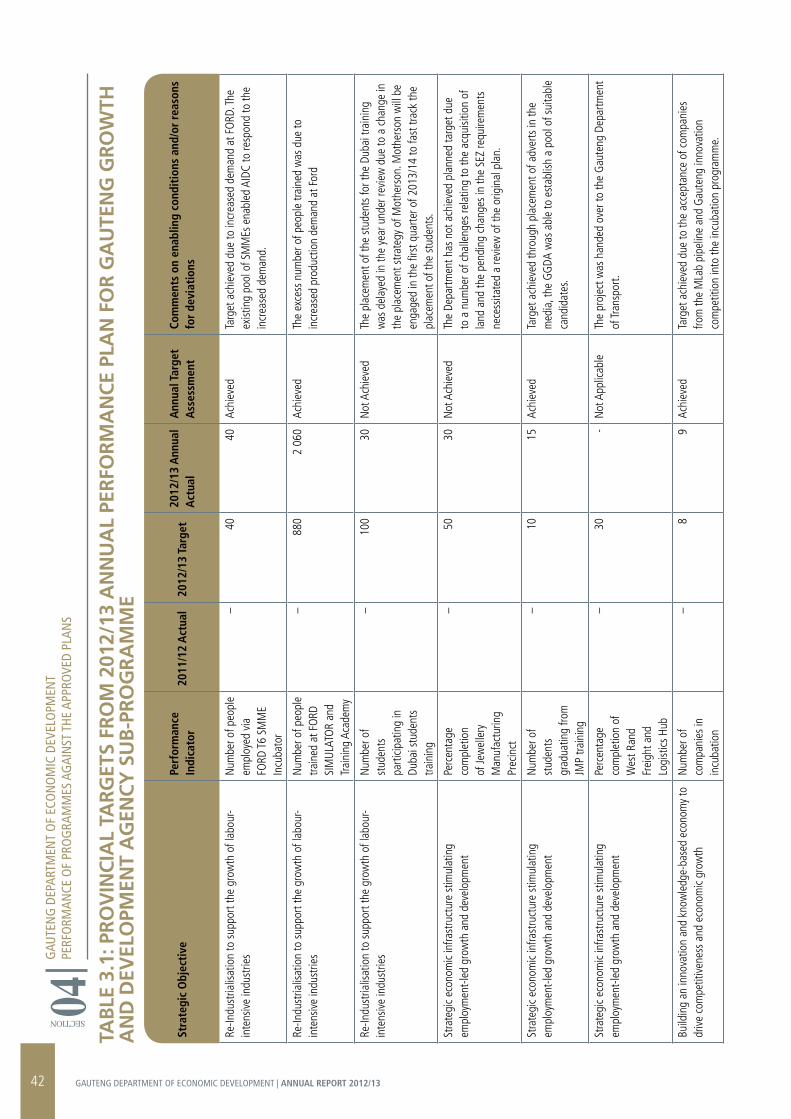
TAB
LE 3
.1: P
rO
VIN
CIA
L TA
rG
ETS
FrO
M 2
012/
13 A
NN
UA
L PE
rFO
rM
AN
CE
PLA
N F
Or
GA
UTE
NG
Gr
OW
THA
ND
DEV
ELO
PMEN
T A
GEN
CY
SU
B-P
rO
Gr
AM
ME
GAU
TEN
G D
EPAR
TMEN
T O
F EC
ON
OM
IC D
EVEL
OPM
ENT
PERF
ORM
ANCE
OF
PRO
GRA
MM
ES A
GAI
NST
THE
APP
ROVE
D PL
ANS
Stra
tegi
c O
bjec
tive
Perf
orm
ance
In
dica
tor
2011
/12
Act
ual
2012
/13
Targ
et20
12/1
3 A
nnua
l A
ctua
lA
nnua
l Tar
get
Ass
essm
ent
Com
men
ts o
n en
ablin
g co
ndit
ions
and
/or
reas
ons
for
devi
atio
ns
Re-In
dust
rialis
atio
n to
sup
port
the
grow
th o
f lab
our-
inte
nsiv
e in
dust
ries
Num
ber o
f peo
ple
empl
oyed
via
FO
RD T
6 SM
ME
Incu
bato
r
–40
40Ac
hiev
edTa
rget
ach
ieve
d du
e to
incr
ease
d de
man
d at
FO
RD. T
he
exist
ing
pool
of S
MM
Es e
nabl
ed A
IDC
to re
spon
d to
the
incr
ease
d de
man
d.
Re-In
dust
rialis
atio
n to
sup
port
the
grow
th o
f lab
our-
inte
nsiv
e in
dust
ries
Num
ber o
f peo
ple
train
ed a
t FO
RD
SIM
ULAT
OR
and
Trai
ning
Aca
dem
y
–88
02
060
Achi
eved
The
exce
ss n
umbe
r of p
eopl
e tra
ined
was
due
to
incr
ease
d pr
oduc
tion
dem
and
at F
ord
Re-In
dust
rialis
atio
n to
sup
port
the
grow
th o
f lab
our-
inte
nsiv
e in
dust
ries
Num
ber o
f st
uden
ts
parti
cipat
ing
in
Duba
i stu
dent
s tra
inin
g
–10
030
Not
Ach
ieve
dTh
e pl
acem
ent o
f the
stu
dent
s fo
r the
Dub
ai tr
aini
ng
was
del
ayed
in th
e ye
ar u
nder
revi
ew d
ue to
a c
hang
e in
th
e pl
acem
ent s
trate
gy o
f Mot
hers
on. M
othe
rson
will
be
enga
ged
in th
e fir
st q
uarte
r of 2
013/
14 to
fast
trac
k th
e pl
acem
ent o
f the
stu
dent
s.
Stra
tegi
c ec
onom
ic in
frast
ruct
ure
stim
ulat
ing
empl
oym
ent-l
ed g
row
th a
nd d
evel
opm
ent
Perc
enta
ge
com
plet
ion
of Je
wel
lery
M
anuf
actu
ring
Prec
inct
– 5
030
Not
Ach
ieve
dTh
e De
partm
ent h
as n
ot a
chie
ved
plan
ned
targ
et d
ue
to a
num
ber o
f cha
lleng
es re
latin
g to
the
acqu
isitio
n of
la
nd a
nd th
e pe
ndin
g ch
ange
s in
the
SEZ
requ
irem
ents
ne
cess
itate
d a
revi
ew o
f the
orig
inal
pla
n.
Stra
tegi
c ec
onom
ic in
frast
ruct
ure
stim
ulat
ing
empl
oym
ent-l
ed g
row
th a
nd d
evel
opm
ent
Num
ber o
f st
uden
ts
grad
uatin
g fro
m
JMP
train
ing
–10
15Ac
hiev
edTa
rget
ach
ieve
d th
roug
h pl
acem
ent o
f adv
erts
in th
e m
edia
, the
GG
DA w
as a
ble
to e
stab
lish
a po
ol o
f sui
tabl
e ca
ndid
ates
.
Stra
tegi
c ec
onom
ic in
frast
ruct
ure
stim
ulat
ing
empl
oym
ent-l
ed g
row
th a
nd d
evel
opm
ent
Perc
enta
ge
com
plet
ion
of
Wes
t Ran
d Fr
eigh
t and
Lo
gist
ics H
ub
–30
-N
ot A
pplic
able
The
proj
ect w
as h
ande
d ov
er to
the
Gau
teng
Dep
artm
ent
of Tr
ansp
ort.
Build
ing
an in
nova
tion
and
know
ledg
e-ba
sed
econ
omy
to
driv
e co
mpe
titiv
enes
s an
d ec
onom
ic gr
owth
Num
ber o
f co
mpa
nies
in
incu
batio
n
–8
9Ac
hiev
edTa
rget
ach
ieve
d du
e to
the
acce
ptan
ce o
f com
pani
es
from
the
MLa
b pi
pelin
e an
d G
aute
ng in
nova
tion
com
petit
ion
into
the
incu
batio
n pr
ogra
mm
e.
SECTION 04
42 GAUTENG DEPARTMENT OF ECONOMIC DEVELOPMENT | ANNUAL REPORT 2012/13
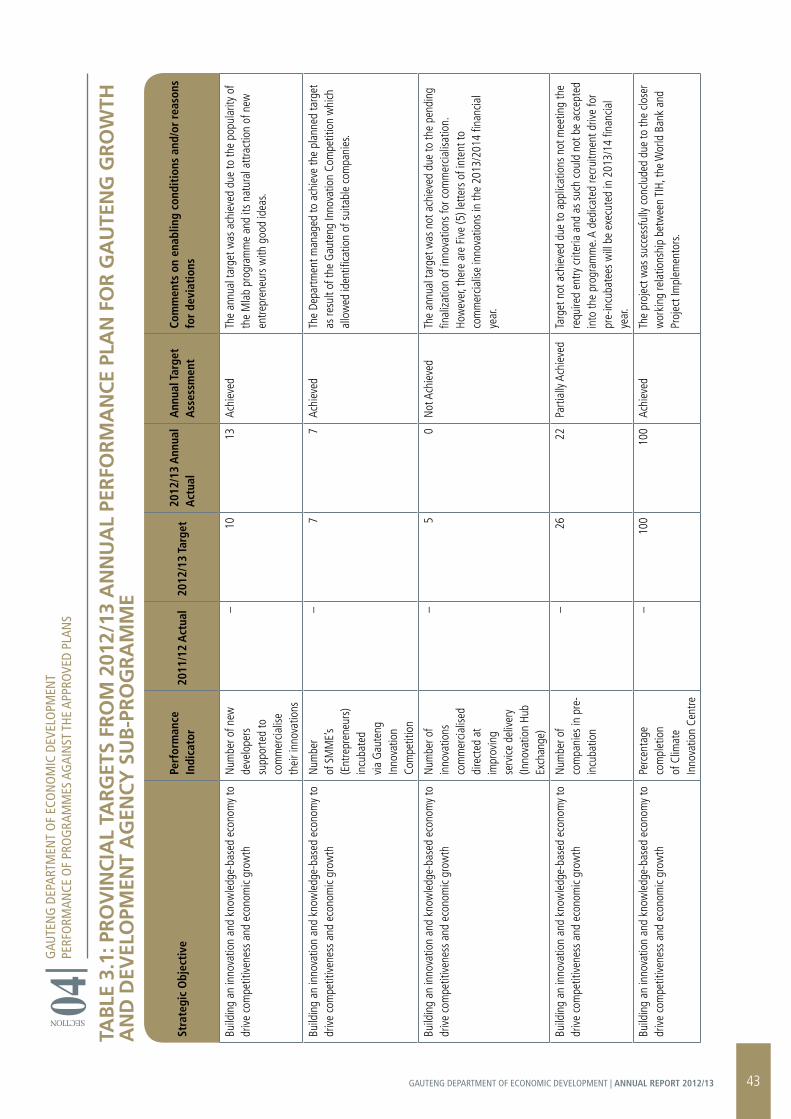
GAU
TEN
G D
EPAR
TMEN
T O
F EC
ON
OM
IC D
EVEL
OPM
ENT
PERF
ORM
ANCE
OF
PRO
GRA
MM
ES A
GAI
NST
THE
APP
ROVE
D PL
ANS
SECTION 04TA
BLE
3.1
: Pr
OV
INC
IAL
TAr
GET
S Fr
OM
201
2/13
AN
NU
AL
PEr
FOr
MA
NC
E PL
AN
FO
r G
AU
TEN
G G
rO
WTH
A
ND
DEV
ELO
PMEN
T A
GEN
CY
SU
B-P
rO
Gr
AM
ME
Stra
tegi
c O
bjec
tive
Perf
orm
ance
In
dica
tor
2011
/12
Act
ual
2012
/13
Targ
et20
12/1
3 A
nnua
l A
ctua
lA
nnua
l Tar
get
Ass
essm
ent
Com
men
ts o
n en
ablin
g co
ndit
ions
and
/or
reas
ons
for
devi
atio
ns
Build
ing
an in
nova
tion
and
know
ledg
e-ba
sed
econ
omy
to
driv
e co
mpe
titiv
enes
s an
d ec
onom
ic gr
owth
Num
ber o
f new
de
velo
pers
su
ppor
ted
to
com
mer
cialis
e th
eir i
nnov
atio
ns
–10
13Ac
hiev
edTh
e an
nual
targ
et w
as a
chie
ved
due
to th
e po
pula
rity
of
the
Mla
b pr
ogra
mm
e an
d its
nat
ural
attr
actio
n of
new
en
trepr
eneu
rs w
ith g
ood
idea
s.
Build
ing
an in
nova
tion
and
know
ledg
e-ba
sed
econ
omy
to
driv
e co
mpe
titiv
enes
s an
d ec
onom
ic gr
owth
Num
ber
of S
MM
E’s
(Ent
repr
eneu
rs)
incu
bate
d vi
a G
aute
ng
Inno
vatio
n Co
mpe
titio
n
–7
7 Ac
hiev
edTh
e De
partm
ent m
anag
ed to
ach
ieve
the
plan
ned
targ
et
as re
sult
of th
e G
aute
ng In
nova
tion
Com
petit
ion
whi
ch
allo
wed
iden
tifica
tion
of s
uita
ble
com
pani
es.
Build
ing
an in
nova
tion
and
know
ledg
e-ba
sed
econ
omy
to
driv
e co
mpe
titiv
enes
s an
d ec
onom
ic gr
owth
Num
ber o
f in
nova
tions
co
mm
ercia
lised
di
rect
ed a
t im
prov
ing
serv
ice d
eliv
ery
(Inno
vatio
n Hu
b Ex
chan
ge)
–5
0N
ot A
chie
ved
The
annu
al ta
rget
was
not
ach
ieve
d du
e to
the
pend
ing
final
izatio
n of
inno
vatio
ns fo
r com
mer
cialis
atio
n.
How
ever
, the
re a
re F
ive
(5) l
ette
rs o
f int
ent t
o co
mm
ercia
lise
inno
vatio
ns in
the
2013
/201
4 fin
ancia
l ye
ar.
Build
ing
an in
nova
tion
and
know
ledg
e-ba
sed
econ
omy
to
driv
e co
mpe
titiv
enes
s an
d ec
onom
ic gr
owth
Num
ber o
f co
mpa
nies
in p
re-
incu
batio
n
–26
22Pa
rtial
ly Ac
hiev
edTa
rget
not
ach
ieve
d du
e to
app
licat
ions
not
mee
ting
the
requ
ired
entry
crit
eria
and
as
such
cou
ld n
ot b
e ac
cept
ed
into
the
prog
ram
me.
A d
edica
ted
recr
uitm
ent d
rive
for
pre-
incu
bate
es w
ill b
e ex
ecut
ed in
201
3/14
fina
ncia
l ye
ar.
Build
ing
an in
nova
tion
and
know
ledg
e-ba
sed
econ
omy
to
driv
e co
mpe
titiv
enes
s an
d ec
onom
ic gr
owth
Perc
enta
ge
com
plet
ion
of C
limat
e In
nova
tion
Cent
re
–10
010
0Ac
hiev
edTh
e pr
ojec
t was
suc
cess
fully
con
clude
d du
e to
the
close
r w
orki
ng re
latio
nshi
p be
twee
n TI
H, th
e W
orld
Ban
k an
d Pr
ojec
t Im
plem
ento
rs.
43GAUTENG DEPARTMENT OF ECONOMIC DEVELOPMENT | ANNUAL REPORT 2012/13
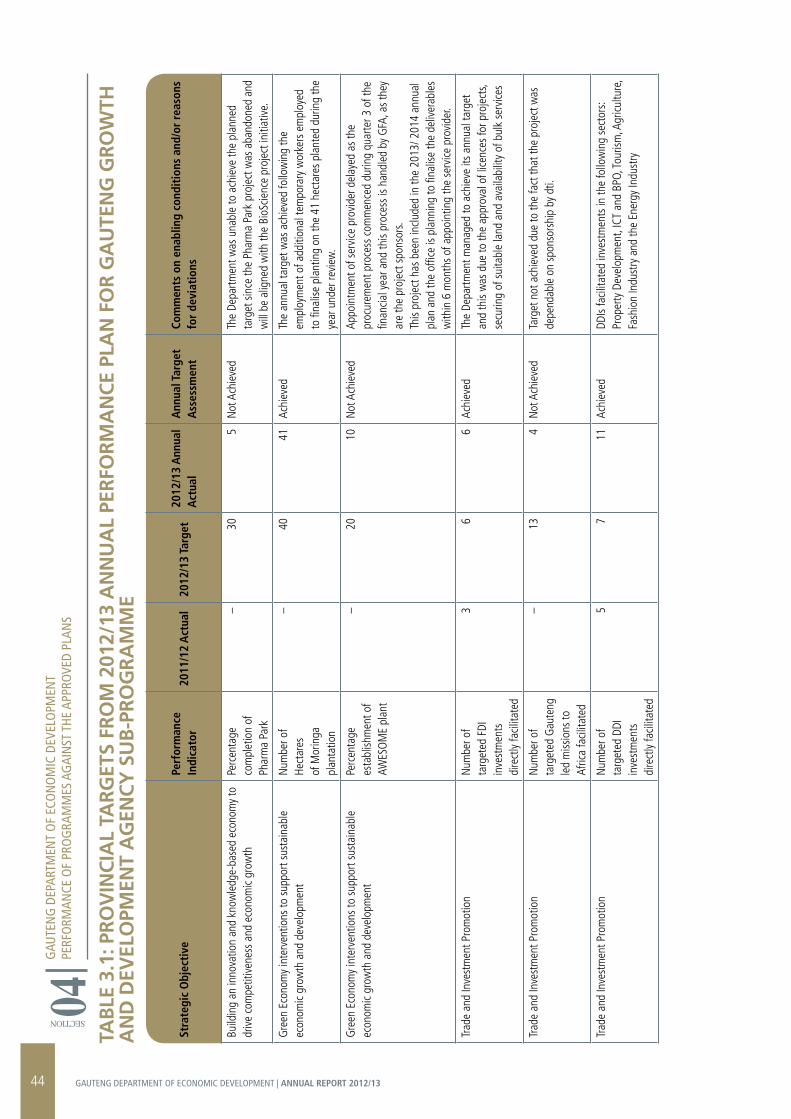
TAB
LE 3
.1: P
rO
VIN
CIA
L TA
rG
ETS
FrO
M 2
012/
13 A
NN
UA
L PE
rFO
rM
AN
CE
PLA
N F
Or
GA
UTE
NG
Gr
OW
TH
AN
D D
EVEL
OPM
ENT
AG
ENC
Y S
UB
-Pr
OG
rA
MM
E
GAU
TEN
G D
EPAR
TMEN
T O
F EC
ON
OM
IC D
EVEL
OPM
ENT
PERF
ORM
ANCE
OF
PRO
GRA
MM
ES A
GAI
NST
THE
APP
ROVE
D PL
ANS
Stra
tegi
c O
bjec
tive
Perf
orm
ance
In
dica
tor
2011
/12
Act
ual
2012
/13
Targ
et20
12/1
3 A
nnua
l A
ctua
lA
nnua
l Tar
get
Ass
essm
ent
Com
men
ts o
n en
ablin
g co
ndit
ions
and
/or
reas
ons
for
devi
atio
ns
Build
ing
an in
nova
tion
and
know
ledg
e-ba
sed
econ
omy
to
driv
e co
mpe
titiv
enes
s an
d ec
onom
ic gr
owth
Perc
enta
ge
com
plet
ion
of
Phar
ma
Park
–30
5N
ot A
chie
ved
The
Depa
rtmen
t was
una
ble
to a
chie
ve th
e pl
anne
d ta
rget
sin
ce th
e Ph
arm
a Pa
rk p
roje
ct w
as a
band
oned
and
w
ill b
e al
igne
d w
ith th
e Bi
oScie
nce
proj
ect i
nitia
tive.
Gre
en E
cono
my
inte
rven
tions
to s
uppo
rt su
stai
nabl
e ec
onom
ic gr
owth
and
dev
elop
men
tN
umbe
r of
Hect
ares
of
Mor
inga
pl
anta
tion
–40
41Ac
hiev
edTh
e an
nual
targ
et w
as a
chie
ved
follo
win
g th
e em
ploy
men
t of a
dditi
onal
tem
pora
ry w
orke
rs e
mpl
oyed
to
fina
lise
plan
ting
on th
e 41
hec
tare
s pl
ante
d du
ring
the
year
und
er re
view
.
Gre
en E
cono
my
inte
rven
tions
to s
uppo
rt su
stai
nabl
e ec
onom
ic gr
owth
and
dev
elop
men
tPe
rcen
tage
es
tabl
ishm
ent o
f AW
ESO
ME
plan
t
–20
10N
ot A
chie
ved
Appo
intm
ent o
f ser
vice
pro
vide
r del
ayed
as
the
proc
urem
ent p
roce
ss c
omm
ence
d du
ring
quar
ter 3
of t
he
finan
cial y
ear a
nd th
is pr
oces
s is
hand
led
by G
FA, a
s th
ey
are
the
proj
ect s
pons
ors.
Th
is pr
ojec
t has
bee
n in
clude
d in
the
2013
/ 201
4 an
nual
pl
an a
nd th
e of
fice
is pl
anni
ng to
fina
lise
the
deliv
erab
les
with
in 6
mon
ths
of a
ppoi
ntin
g th
e se
rvice
pro
vide
r.
Trad
e an
d In
vest
men
t Pro
mot
ion
Num
ber o
f ta
rget
ed F
DI
inve
stm
ents
di
rect
ly fa
cilita
ted
36
6Ac
hiev
edTh
e De
partm
ent m
anag
ed to
ach
ieve
its
annu
al ta
rget
an
d th
is w
as d
ue to
the
appr
oval
of l
icenc
es fo
r pro
ject
s, se
curin
g of
sui
tabl
e la
nd a
nd a
vaila
bilit
y of
bul
k se
rvice
s
Trad
e an
d In
vest
men
t Pro
mot
ion
Num
ber o
f ta
rget
ed G
aute
ng
led
miss
ions
to
Afric
a fa
cilita
ted
–13
4N
ot A
chie
ved
Targ
et n
ot a
chie
ved
due
to th
e fa
ct th
at th
e pr
ojec
t was
de
pend
able
on
spon
sors
hip
by d
ti.
Trad
e an
d In
vest
men
t Pro
mot
ion
Num
ber o
f ta
rget
ed D
DI
inve
stm
ents
di
rect
ly fa
cilita
ted
57
11Ac
hiev
edDD
Is fa
cilita
ted
inve
stm
ents
in th
e fo
llow
ing
sect
ors:
Prop
erty
Dev
elop
men
t, IC
T an
d BP
O, To
urism
, Agr
icultu
re,
Fash
ion
Indu
stry
and
the
Ener
gy In
dust
ry
SECTION 04
44 GAUTENG DEPARTMENT OF ECONOMIC DEVELOPMENT | ANNUAL REPORT 2012/13
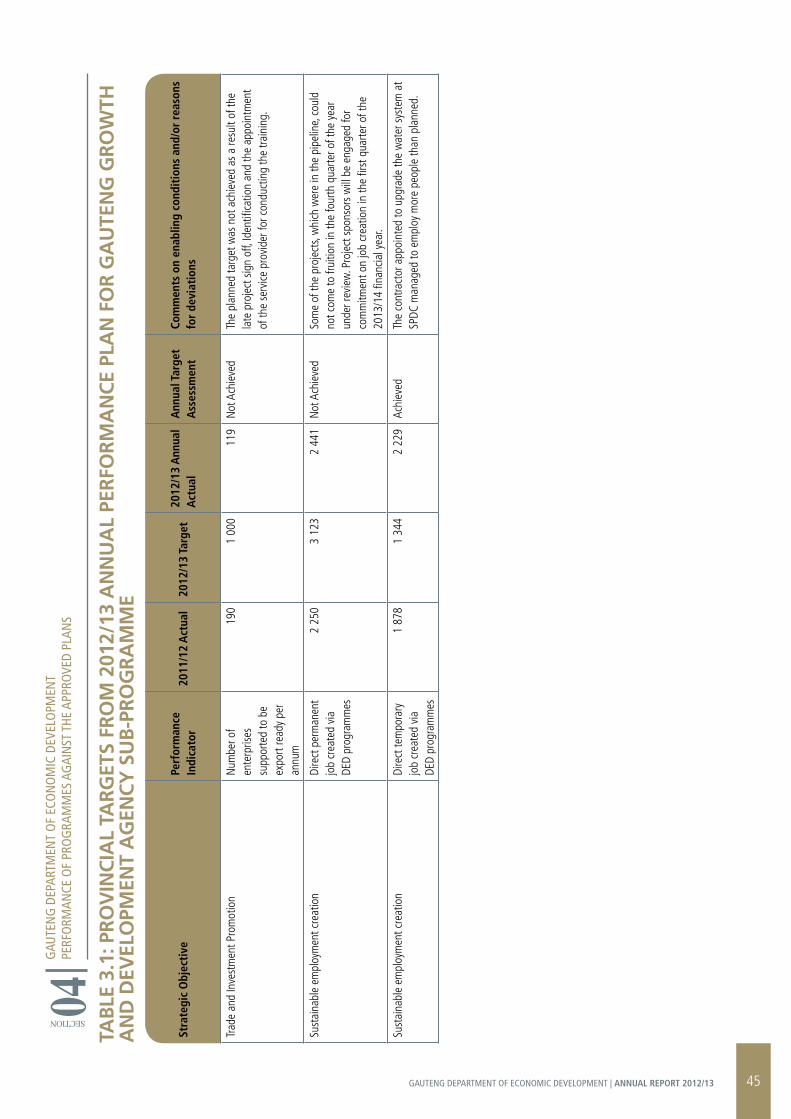
SECTION 04TA
BLE
3.1
: Pr
OV
INC
IAL
TAr
GET
S Fr
OM
201
2/13
AN
NU
AL
PEr
FOr
MA
NC
E PL
AN
FO
r G
AU
TEN
G G
rO
WTH
A
ND
DEV
ELO
PMEN
T A
GEN
CY
SU
B-P
rO
Gr
AM
ME
GAU
TEN
G D
EPAR
TMEN
T O
F EC
ON
OM
IC D
EVEL
OPM
ENT
PERF
ORM
ANCE
OF
PRO
GRA
MM
ES A
GAI
NST
THE
APP
ROVE
D PL
ANS
Stra
tegi
c O
bjec
tive
Perf
orm
ance
In
dica
tor
2011
/12
Act
ual
2012
/13
Targ
et20
12/1
3 A
nnua
l A
ctua
lA
nnua
l Tar
get
Ass
essm
ent
Com
men
ts o
n en
ablin
g co
ndit
ions
and
/or
reas
ons
for
devi
atio
ns
Trad
e an
d In
vest
men
t Pro
mot
ion
Num
ber o
f en
terp
rises
su
ppor
ted
to b
e ex
port
read
y pe
r an
num
190
1 00
011
9N
ot A
chie
ved
The
plan
ned
targ
et w
as n
ot a
chie
ved
as a
resu
lt of
the
late
pro
ject
sig
n of
f, Id
entifi
catio
n an
d th
e ap
poin
tmen
t of
the
serv
ice p
rovi
der f
or c
ondu
ctin
g th
e tra
inin
g.
Sust
aina
ble
empl
oym
ent c
reat
ion
Dire
ct p
erm
anen
t jo
b cr
eate
d vi
a DE
D pr
ogra
mm
es
2 25
03
123
2 44
1N
ot A
chie
ved
Som
e of
the
proj
ects
, whi
ch w
ere
in th
e pi
pelin
e, c
ould
no
t com
e to
frui
tion
in th
e fo
urth
qua
rter o
f the
yea
r un
der r
evie
w. P
roje
ct s
pons
ors
will
be
enga
ged
for
com
mitm
ent o
n jo
b cr
eatio
n in
the
first
qua
rter o
f the
20
13/1
4 fin
ancia
l yea
r.
Sust
aina
ble
empl
oym
ent c
reat
ion
Dire
ct te
mpo
rary
jo
b cr
eate
d vi
a DE
D pr
ogra
mm
es
1 87
81
344
2 22
9Ac
hiev
edTh
e co
ntra
ctor
app
oint
ed to
upg
rade
the
wat
er s
yste
m a
t SP
DC m
anag
ed to
em
ploy
mor
e pe
ople
than
pla
nned
.
45GAUTENG DEPARTMENT OF ECONOMIC DEVELOPMENT | ANNUAL REPORT 2012/13

TAB
LE 3
.2: P
rO
VIN
CIA
L TA
rG
ETS
FrO
M 2
012/
13 A
NN
UA
L PE
rFO
rM
AN
CE
PLA
N F
Or
GA
UTE
NG
TO
Ur
ISM
A
GEN
CY,
Cr
AD
LE O
F H
UM
AN
KIN
D A
ND
DIN
OK
ENG
SU
B-P
rO
Gr
AM
ME
GAU
TEN
G D
EPAR
TMEN
T O
F EC
ON
OM
IC D
EVEL
OPM
ENT
PERF
ORM
ANCE
OF
PRO
GRA
MM
ES A
GAI
NST
THE
APP
ROVE
D PL
ANS
Stra
tegi
c O
bjec
tive
Perf
orm
ance
In
dica
tor
2011
/12
Act
ual
2012
/13
Targ
et20
12/1
3 A
nnua
l A
ctua
lA
nnua
l Tar
get
Ass
essm
ent
Com
men
ts o
n en
ablin
g co
ndit
ions
and
/or
reas
ons
for
devi
atio
ns
Tour
ism s
ecto
r dev
elop
men
t to
driv
e co
mpe
titiv
enes
s an
d ec
onom
ic gr
owth
Perc
enta
ge
rege
nera
tion
of
Ga-
Rank
uwa
Hote
l Sch
ool
–70
40N
ot A
chie
ved
The
trans
fer o
f the
Hot
el S
choo
l fro
m N
orth
Wes
t Pr
ovin
ce to
Gau
teng
is s
till o
utst
andi
ng d
ue to
bud
geta
ry
cons
train
ts. H
owev
er, a
n in
terim
task
team
is in
pla
ce a
nd
mee
tings
are
bei
ng h
eld
bi-w
eekl
y to
fast
-trac
k th
e pa
ce
of th
is pr
ojec
t.
In a
dditi
on m
onth
ly m
eetin
gs a
re b
eing
hel
d w
ith th
e N
orth
Wes
t Pro
vinc
e to
ens
ure
a sm
ooth
tran
sfer
of t
he
inst
itutio
n.
Tour
ism s
ecto
r dev
elop
men
t to
driv
e co
mpe
titiv
enes
s an
d ec
onom
ic gr
owth
Perc
enta
ge
upgr
ade
of
Mar
open
g To
urism
in
frast
ruct
ure
–10
030
Not
Ach
ieve
dTh
e ta
rget
cou
ld n
ot b
e m
et d
ue to
oth
er o
utst
andi
ng
lega
litie
s, w
hich
are
sta
lling
pro
gres
s of
the
proj
ect,
whi
ch in
clude
s th
e te
rmin
atio
n of
the
cont
ract
of t
he
serv
ice p
rovi
der f
or th
e up
grad
e of
the
exhi
bitio
ns a
t St
erkf
onte
in a
nd M
arop
eng
due
to p
oor q
ualit
y w
ork
cond
ucte
d.
Tour
ism s
ecto
r dev
elop
men
t to
driv
e co
mpe
titiv
enes
s an
d ec
onom
ic gr
owth
Num
ber o
f loc
al
com
mun
ity
mem
bers
em
ploy
ed a
s sa
fety
mon
itors
an
nual
ly
–40
040
0Ac
hiev
ed40
0 to
urism
saf
ety
mon
itors
wer
e em
ploy
ed in
the
Crad
le
of H
uman
kind
Wor
ld H
erita
ge S
ite a
nd D
inok
eng
area
s.
The
proj
ect w
as a
suc
cess
.
Tour
ism s
ecto
r dev
elop
men
t to
driv
e co
mpe
titiv
enes
s an
d ec
onom
ic gr
owth
Perc
enta
ge
com
plet
ion
of
VIC
proj
ect
–10
010
0Ac
hiev
edTh
e pr
ojec
t was
ach
ieve
d w
hich
inclu
des
the
final
izatio
n of
the
Visit
or In
form
atio
n Ce
ntre
(VIC
) pro
ject
at O
R Ta
mbo
Inte
rnat
iona
l Airp
ort.
Sust
aina
ble
empl
oym
ent c
reat
ion
Dire
ct p
erm
anen
t jo
bs c
reat
ed v
ia
DED
prog
ram
mes
370
6 53
536
Not
Ach
ieve
dTh
e ta
rget
was
not
ach
ieve
d du
e to
lack
of c
apac
ity a
nd
syst
ems
to c
olle
ct th
e re
quire
d da
ta in
tern
ally.
The
actu
al
curre
nt d
ata
inclu
ded
is pu
rely
for t
he d
irect
jobs
cre
ated
in
the
Crad
le o
f Hum
anki
nd W
orld
Her
itage
Site
and
Di
noke
ng a
reas
. Th
ere
will
be
enga
gem
ent w
ith S
tats
SA
to e
stab
lish
the
right
tool
s to
col
lect
the
prov
incia
l dat
a.
SECTION 04
46 GAUTENG DEPARTMENT OF ECONOMIC DEVELOPMENT | ANNUAL REPORT 2012/13
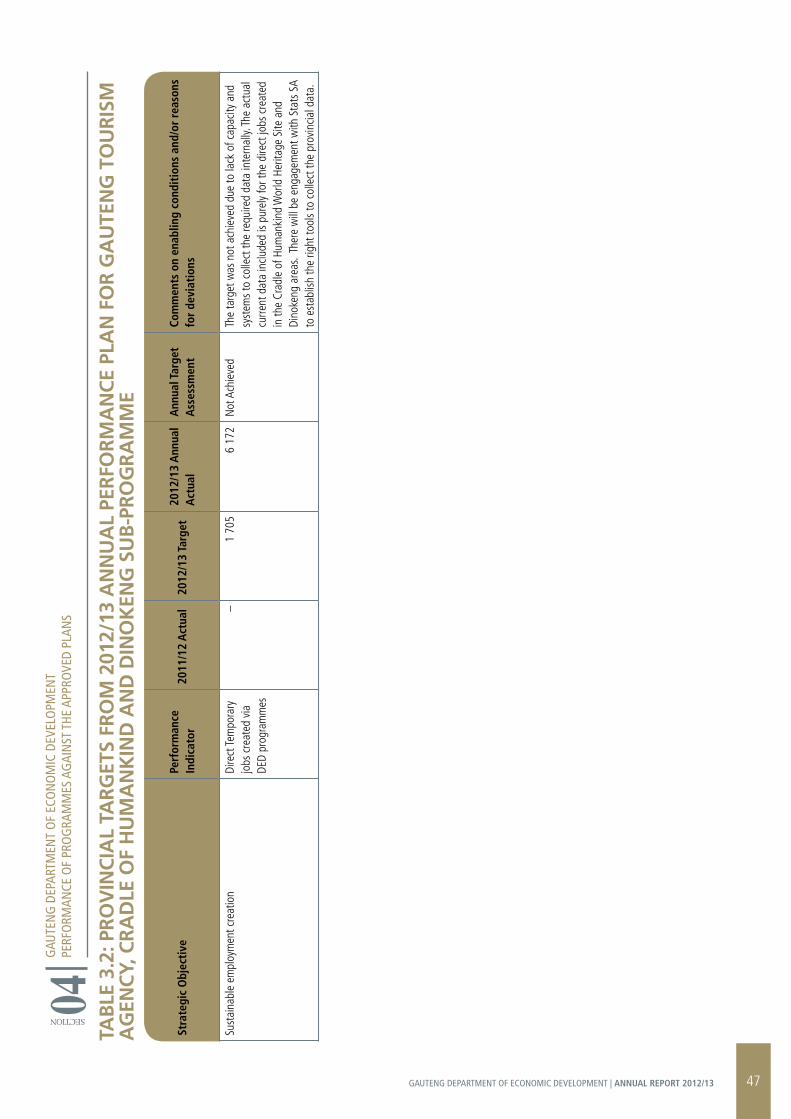
SECTION 04TA
BLE
3.2
: Pr
OV
INC
IAL
TAr
GET
S Fr
OM
201
2/13
AN
NU
AL
PEr
FOr
MA
NC
E PL
AN
FO
r G
AU
TEN
G T
OU
rIS
M
AG
ENC
Y, C
rA
DLE
OF
HU
MA
NK
IND
AN
D D
INO
KEN
G S
UB
-Pr
OG
rA
MM
E
GAU
TEN
G D
EPAR
TMEN
T O
F EC
ON
OM
IC D
EVEL
OPM
ENT
PERF
ORM
ANCE
OF
PRO
GRA
MM
ES A
GAI
NST
THE
APP
ROVE
D PL
ANS
Stra
tegi
c O
bjec
tive
Perf
orm
ance
In
dica
tor
2011
/12
Act
ual
2012
/13
Targ
et20
12/1
3 A
nnua
l A
ctua
lA
nnua
l Tar
get
Ass
essm
ent
Com
men
ts o
n en
ablin
g co
ndit
ions
and
/or
reas
ons
for
devi
atio
ns
Sust
aina
ble
empl
oym
ent c
reat
ion
Dire
ct Te
mpo
rary
jo
bs c
reat
ed v
ia
DED
prog
ram
mes
–1
705
6 17
2N
ot A
chie
ved
The
targ
et w
as n
ot a
chie
ved
due
to la
ck o
f cap
acity
and
sy
stem
s to
col
lect
the
requ
ired
data
inte
rnal
ly. Th
e ac
tual
cu
rrent
dat
a in
clude
d is
pure
ly fo
r the
dire
ct jo
bs c
reat
ed
in th
e Cr
adle
of H
uman
kind
Wor
ld H
erita
ge S
ite a
nd
Dino
keng
are
as.
Ther
e w
ill b
e en
gage
men
t with
Sta
ts S
A to
est
ablis
h th
e rig
ht to
ols
to c
olle
ct th
e pr
ovin
cial d
ata.
47GAUTENG DEPARTMENT OF ECONOMIC DEVELOPMENT | ANNUAL REPORT 2012/13
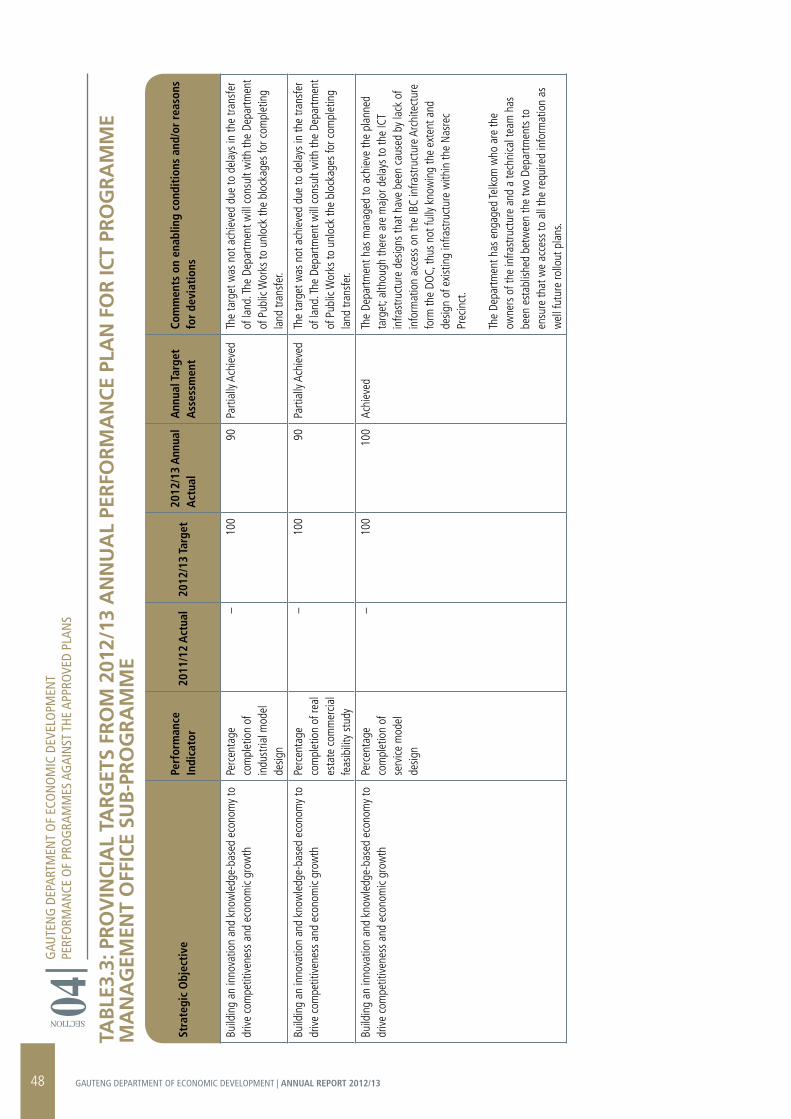
TAB
LE3.
3: P
rO
VIN
CIA
L TA
rG
ETS
FrO
M 2
012/
13 A
NN
UA
L PE
rFO
rM
AN
CE
PLA
N F
Or
ICT
PrO
Gr
AM
ME
MA
NA
GEM
ENT
OFF
ICE
SUB
-Pr
OG
rA
MM
E
GAU
TEN
G D
EPAR
TMEN
T O
F EC
ON
OM
IC D
EVEL
OPM
ENT
PERF
ORM
ANCE
OF
PRO
GRA
MM
ES A
GAI
NST
THE
APP
ROVE
D PL
ANS
Stra
tegi
c O
bjec
tive
Perf
orm
ance
In
dica
tor
2011
/12
Act
ual
2012
/13
Targ
et20
12/1
3 A
nnua
l A
ctua
lA
nnua
l Tar
get
Ass
essm
ent
Com
men
ts o
n en
ablin
g co
ndit
ions
and
/or
reas
ons
for
devi
atio
ns
Build
ing
an in
nova
tion
and
know
ledg
e-ba
sed
econ
omy
to
driv
e co
mpe
titiv
enes
s an
d ec
onom
ic gr
owth
Perc
enta
ge
com
plet
ion
of
indu
stria
l mod
el
desig
n
–10
090
Parti
ally
Achi
eved
The
targ
et w
as n
ot a
chie
ved
due
to d
elay
s in
the
trans
fer
of la
nd. T
he D
epar
tmen
t will
con
sult
with
the
Depa
rtmen
t of
Pub
lic W
orks
to u
nloc
k th
e bl
ocka
ges
for c
ompl
etin
g la
nd tr
ansf
er.
Build
ing
an in
nova
tion
and
know
ledg
e-ba
sed
econ
omy
to
driv
e co
mpe
titiv
enes
s an
d ec
onom
ic gr
owth
Perc
enta
ge
com
plet
ion
of re
al
esta
te c
omm
ercia
l fe
asib
ility
stu
dy
–10
090
Parti
ally
Achi
eved
The
targ
et w
as n
ot a
chie
ved
due
to d
elay
s in
the
trans
fer
of la
nd. T
he D
epar
tmen
t will
con
sult
with
the
Depa
rtmen
t of
Pub
lic W
orks
to u
nloc
k th
e bl
ocka
ges
for c
ompl
etin
g la
nd tr
ansf
er.
Build
ing
an in
nova
tion
and
know
ledg
e-ba
sed
econ
omy
to
driv
e co
mpe
titiv
enes
s an
d ec
onom
ic gr
owth
Perc
enta
ge
com
plet
ion
of
serv
ice m
odel
de
sign
–10
010
0Ac
hiev
edTh
e De
partm
ent h
as m
anag
ed to
ach
ieve
the
plan
ned
targ
et; a
lthou
gh th
ere
are
maj
or d
elay
s to
the
ICT
infra
stru
ctur
e de
signs
that
hav
e be
en c
ause
d by
lack
of
info
rmat
ion
acce
ss o
n th
e IB
C in
frast
ruct
ure
Arch
itect
ure
form
the
DOC,
thus
not
fully
kno
win
g th
e ex
tent
and
de
sign
of e
xist
ing
infra
stru
ctur
e w
ithin
the
Nas
rec
Prec
inct
.
The
Depa
rtmen
t has
eng
aged
Telk
om w
ho a
re th
e ow
ners
of t
he in
frast
ruct
ure
and
a te
chni
cal t
eam
has
be
en e
stab
lishe
d be
twee
n th
e tw
o De
partm
ents
to
ensu
re th
at w
e ac
cess
to a
ll th
e re
quire
d in
form
atio
n as
w
ell f
utur
e ro
llout
pla
ns.
SECTION 04
48 GAUTENG DEPARTMENT OF ECONOMIC DEVELOPMENT | ANNUAL REPORT 2012/13
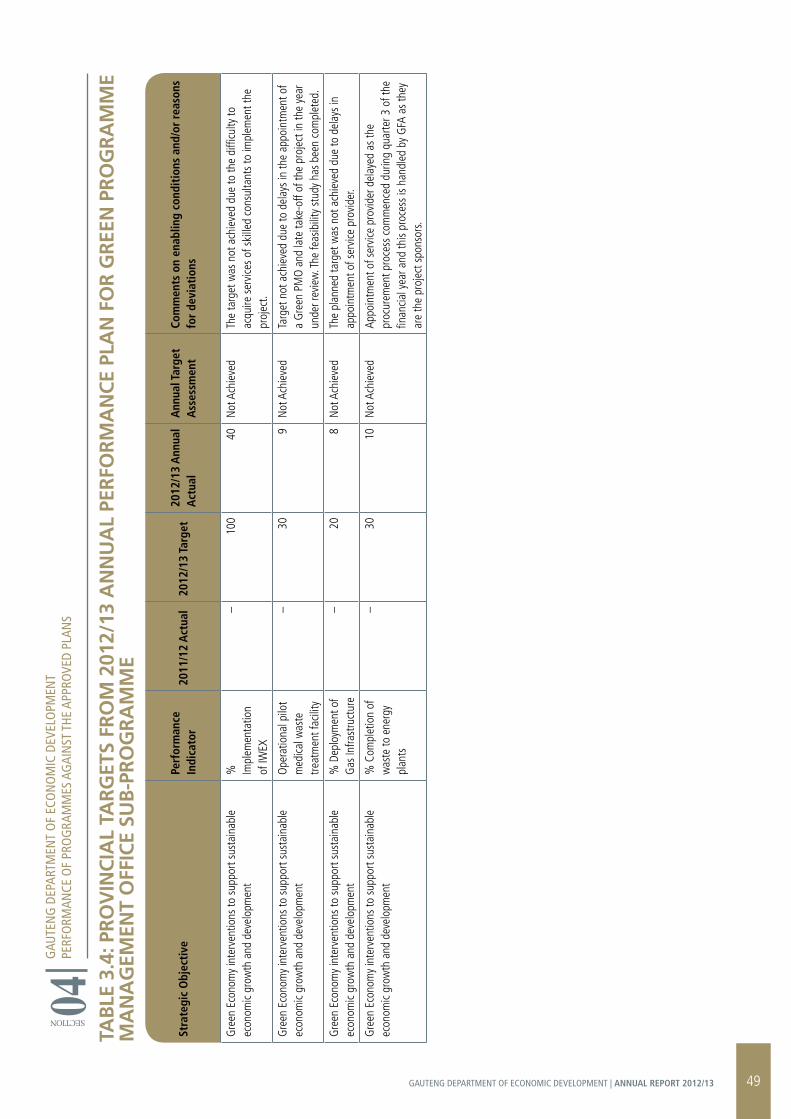
TAB
LE 3
.4: P
rO
VIN
CIA
L TA
rG
ETS
FrO
M 2
012/
13 A
NN
UA
L PE
rFO
rM
AN
CE
PLA
N F
Or
Gr
EEN
Pr
OG
rA
MM
E M
AN
AG
EMEN
T O
FFIC
E SU
B-P
rO
Gr
AM
ME
GAU
TEN
G D
EPAR
TMEN
T O
F EC
ON
OM
IC D
EVEL
OPM
ENT
PERF
ORM
ANCE
OF
PRO
GRA
MM
ES A
GAI
NST
THE
APP
ROVE
D PL
ANS
SECTION 04
Stra
tegi
c O
bjec
tive
Perf
orm
ance
In
dica
tor
2011
/12
Act
ual
2012
/13
Targ
et20
12/1
3 A
nnua
l A
ctua
lA
nnua
l Tar
get
Ass
essm
ent
Com
men
ts o
n en
ablin
g co
ndit
ions
and
/or
reas
ons
for
devi
atio
ns
Gre
en E
cono
my
inte
rven
tions
to s
uppo
rt su
stai
nabl
e ec
onom
ic gr
owth
and
dev
elop
men
t%
Im
plem
enta
tion
of IW
EX
–10
040
Not
Ach
ieve
dTh
e ta
rget
was
not
ach
ieve
d du
e to
the
diffi
culty
to
acqu
ire s
ervi
ces
of s
kille
d co
nsul
tant
s to
impl
emen
t the
pr
ojec
t.
Gre
en E
cono
my
inte
rven
tions
to s
uppo
rt su
stai
nabl
e ec
onom
ic gr
owth
and
dev
elop
men
tO
pera
tiona
l pilo
t m
edica
l was
te
treat
men
t fac
ility
–30
9N
ot A
chie
ved
Targ
et n
ot a
chie
ved
due
to d
elay
s in
the
appo
intm
ent o
f a
Gre
en P
MO
and
late
take
-off
of th
e pr
ojec
t in
the
year
un
der r
evie
w. T
he fe
asib
ility
stu
dy h
as b
een
com
plet
ed.
Gre
en E
cono
my
inte
rven
tions
to s
uppo
rt su
stai
nabl
e ec
onom
ic gr
owth
and
dev
elop
men
t%
Dep
loym
ent o
f G
as In
frast
ruct
ure
–20
8N
ot A
chie
ved
The
plan
ned
targ
et w
as n
ot a
chie
ved
due
to d
elay
s in
ap
poin
tmen
t of s
ervi
ce p
rovi
der.
Gre
en E
cono
my
inte
rven
tions
to s
uppo
rt su
stai
nabl
e ec
onom
ic gr
owth
and
dev
elop
men
t%
Com
plet
ion
of
was
te to
ene
rgy
plan
ts
–30
10N
ot A
chie
ved
Appo
intm
ent o
f ser
vice
pro
vide
r del
ayed
as
the
proc
urem
ent p
roce
ss c
omm
ence
d du
ring
quar
ter 3
of t
he
finan
cial y
ear a
nd th
is pr
oces
s is
hand
led
by G
FA a
s th
ey
are
the
proj
ect s
pons
ors.
49GAUTENG DEPARTMENT OF ECONOMIC DEVELOPMENT | ANNUAL REPORT 2012/13
4.4 PrOGrAMME 4: BUSINESS rEGULATIONS AND GOVErNANCE
The purpose of the programme is to enhance transparency, greater integrity and accountability by providing leadership in effectual enterprise governance.
The programme objective is to lobby against and address barriers in the broader business environment which inhibit business development, implement and promote measures that ensure the rights and interest of all consumers, promote and maintain an effective and efficient accountability of Agencies through effectual governance, regulation and compliance. Furthermore monitor and evaluate the impact of the Broad-Based Black Economic Empowerment (BBBEE).
In this regard, the programme will enhance the association of the Department with its agencies on issues of policy implementation and delivery as well as support functions. It will ensure effective and efficient corporate governance; and the implementation of projects by the agencies; monitor and evaluate the impact of the BBBEE and manage Consumer Affairs issues through the following internal controls:
Legislative framework; Administrative infrastructure; Meeting deadlines in terms of reporting; Qualified staff and committed leadership; Consumer Act and Consumer Court; Political Support; Management Support; and Agencies specialised focus and skills
4.4.1 Liquor Regulation
In the financial year under review, the Department received 3 546 applications which were above the annual target of 1 863. Although the target is demand driven and thereby not within the Department’s control, this target was exceeded due to education and awareness workshops and blitz which were conducted to ensure Compliance and Enforcement. Furthermore, this could also be attributed to proper management and implementation of Liquor System for occasional permit applications which were to be lodged remotely and increased as a result of African Cup of Nations (AFCON) which was held between months of January and February 2013 in the country; and the illegal traders whose businesses were closed down and advised to apply for authentic licenses.
The Department issued a total of 1 685 licenses, 120 applications received and prepared for Board’s consideration as well as the compilation of conversion database for the last three years and reconciliation.
The Department conducted a total of 2 735 proactive inspections against the planned target of 1 800. This achievement could be attributed to joint operations conducted with other law enforcement agencies, adequate tools of trade allocated to Inspectorate unit and internal capacity to execute duties.
A total of 1 604 licences were issued against a planned target of 1 000. This was realised due to the receiving of correct completed applications, most applicants complying with the requirements of the Act and other applicants, which were granted licenses on conditions imposed by the Board.
A total of 1 953 pre-inspections were conducted against 800 planned targets. The target was exceeded due to the appointment of a separate group of inspectors which concentrated mainly on this assignment. This achievement could be attributed to adequate tools of trade allocated to Inspectorate unit and human capacity to execute duties.
The Board considered a total of 89% of applications received within a prescribed turn-around times of 90 days. This was due to the appointment of additional Board members and all Board meetings were held as scheduled to process applications within the prescribed turnaround time and three meetings had taken place per week.
The Department managed to conduct a total of 4 785 inspections against a planned target of 2 600. Of the total, 2 735, 1 953 and 97, were achievement derived from proactive, pre-, and post- inspections respectively. The target was achieved because most applications submitted to the Board were complete and the proposed premises complied with the requirements of the licenses applied for. There were few applications that required this type of inspection to be conducted and therefore, majority of licenses were granted by the Board without conditions.
Total revenue of R23 million was achieved against the planned target of R40 million. The target of R40 million was not informed by any plan and baseline due to unavailability of a credible database to make predictions and justify the set target.
The Liquor Administration, Financial Management with the assistance of Information Technology is in the process of creating a Liquor Database, which will in future be used for revenue collection projections. This will assist the Department to make sound projections in future.
Education and awareness workshops were successfully implemented as planned. This was due to the secondment of personnel from Consumer Affairs, budget availability and joint efforts with other GPG Departments and external Liquor Stakeholders. However, research has revealed that there were increasing patterns of under age drinking by school going minors. Therefore, the Department will need to consult with Gauteng Department of Education so as to consider incorporate liquor awareness studies and its effects in the schools syllabus.
4.4.2 Gambling and Betting
In the financial year under review, the Gauteng Gambling Board achieved all its targets except one relating to the licensing of new enterprises. The Board has, since May 2012, been headed by the Administrator. In terms of Section 18C of the Gauteng Gambling Act, No.4 of 1995, as amended; the Administrator has all the necessary powers except for approval or revocation of licenses. Consequently, licenses could be issued for the applicable period.
GAUTENG DEPARTMENT OF ECONOMIC DEVELOPMENTPERFORMANCE OF PROGRAMMES AGAINST THE APPROVED PLANS
SECT
ION 04
50 GAUTENG DEPARTMENT OF ECONOMIC DEVELOPMENT | ANNUAL REPORT 2012/13
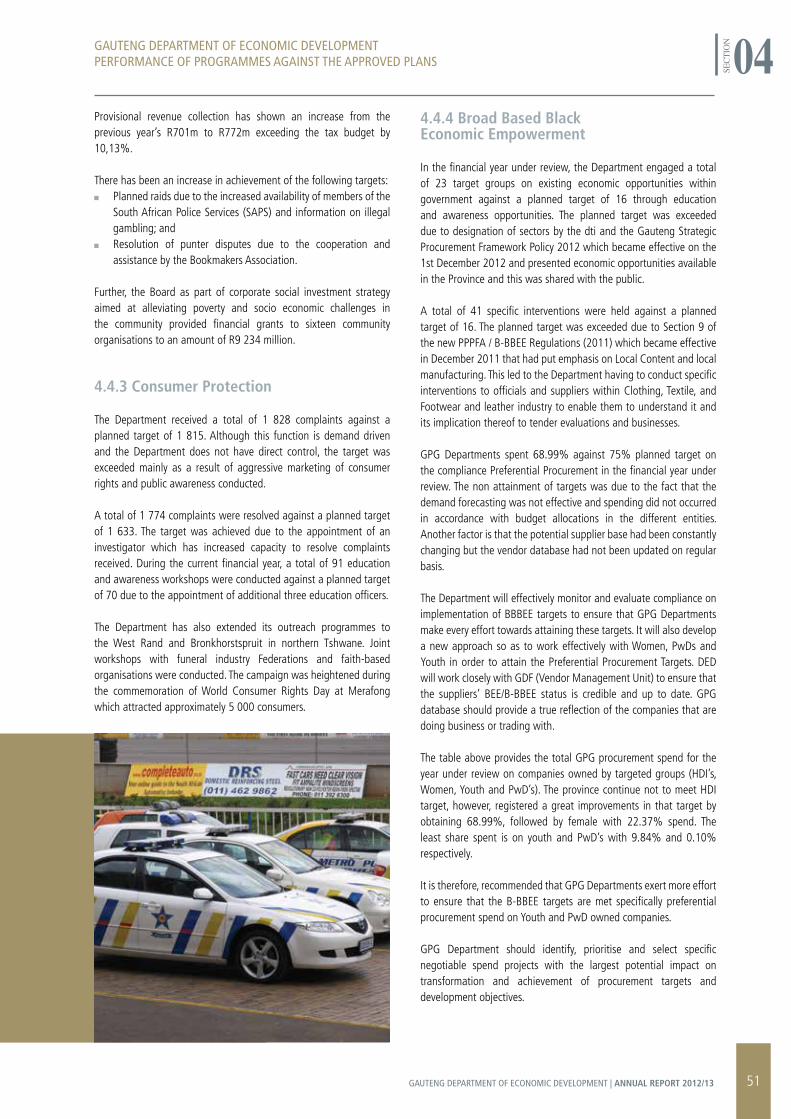
Provisional revenue collection has shown an increase from the previous year’s R701m to R772m exceeding the tax budget by 10,13%.
There has been an increase in achievement of the following targets: Planned raids due to the increased availability of members of the
South African Police Services (SAPS) and information on illegal gambling; and Resolution of punter disputes due to the cooperation and
assistance by the Bookmakers Association.
Further, the Board as part of corporate social investment strategy aimed at alleviating poverty and socio economic challenges in the community provided financial grants to sixteen community organisations to an amount of R9 234 million.
4.4.3 Consumer Protection
The Department received a total of 1 828 complaints against a planned target of 1 815. Although this function is demand driven and the Department does not have direct control, the target was exceeded mainly as a result of aggressive marketing of consumer rights and public awareness conducted.
A total of 1 774 complaints were resolved against a planned target of 1 633. The target was achieved due to the appointment of an investigator which has increased capacity to resolve complaints received. During the current financial year, a total of 91 education and awareness workshops were conducted against a planned target of 70 due to the appointment of additional three education officers.
The Department has also extended its outreach programmes to the West Rand and Bronkhorstspruit in northern Tshwane. Joint workshops with funeral industry Federations and faith-based organisations were conducted. The campaign was heightened during the commemoration of World Consumer Rights Day at Merafong which attracted approximately 5 000 consumers.
4.4.4 Broad Based Black Economic Empowerment
In the financial year under review, the Department engaged a total of 23 target groups on existing economic opportunities within government against a planned target of 16 through education and awareness opportunities. The planned target was exceeded due to designation of sectors by the dti and the Gauteng Strategic Procurement Framework Policy 2012 which became effective on the 1st December 2012 and presented economic opportunities available in the Province and this was shared with the public.
A total of 41 specific interventions were held against a planned target of 16. The planned target was exceeded due to Section 9 of the new PPPFA / B-BBEE Regulations (2011) which became effective in December 2011 that had put emphasis on Local Content and local manufacturing. This led to the Department having to conduct specific interventions to officials and suppliers within Clothing, Textile, and Footwear and leather industry to enable them to understand it and its implication thereof to tender evaluations and businesses.
GPG Departments spent 68.99% against 75% planned target on the compliance Preferential Procurement in the financial year under review. The non attainment of targets was due to the fact that the demand forecasting was not effective and spending did not occurred in accordance with budget allocations in the different entities. Another factor is that the potential supplier base had been constantly changing but the vendor database had not been updated on regular basis.
The Department will effectively monitor and evaluate compliance on implementation of BBBEE targets to ensure that GPG Departments make every effort towards attaining these targets. It will also develop a new approach so as to work effectively with Women, PwDs and Youth in order to attain the Preferential Procurement Targets. DED will work closely with GDF (Vendor Management Unit) to ensure that the suppliers’ BEE/B-BBEE status is credible and up to date. GPG database should provide a true reflection of the companies that are doing business or trading with.
The table above provides the total GPG procurement spend for the year under review on companies owned by targeted groups (HDI’s, Women, Youth and PwD’s). The province continue not to meet HDI target, however, registered a great improvements in that target by obtaining 68.99%, followed by female with 22.37% spend. The least share spent is on youth and PwD’s with 9.84% and 0.10% respectively.
It is therefore, recommended that GPG Departments exert more effort to ensure that the B-BBEE targets are met specifically preferential procurement spend on Youth and PwD owned companies.
GPG Department should identify, prioritise and select specific negotiable spend projects with the largest potential impact on transformation and achievement of procurement targets and development objectives.
GAUTENG DEPARTMENT OF ECONOMIC DEVELOPMENTPERFORMANCE OF PROGRAMMES AGAINST THE APPROVED PLANS
SECT
ION 04GAUTENG DEPARTMENT OF ECONOMIC DEVELOPMENT
PERFORMANCE OF PROGRAMMES AGAINST THE APPROVED PLANS
51GAUTENG DEPARTMENT OF ECONOMIC DEVELOPMENT | ANNUAL REPORT 2012/13
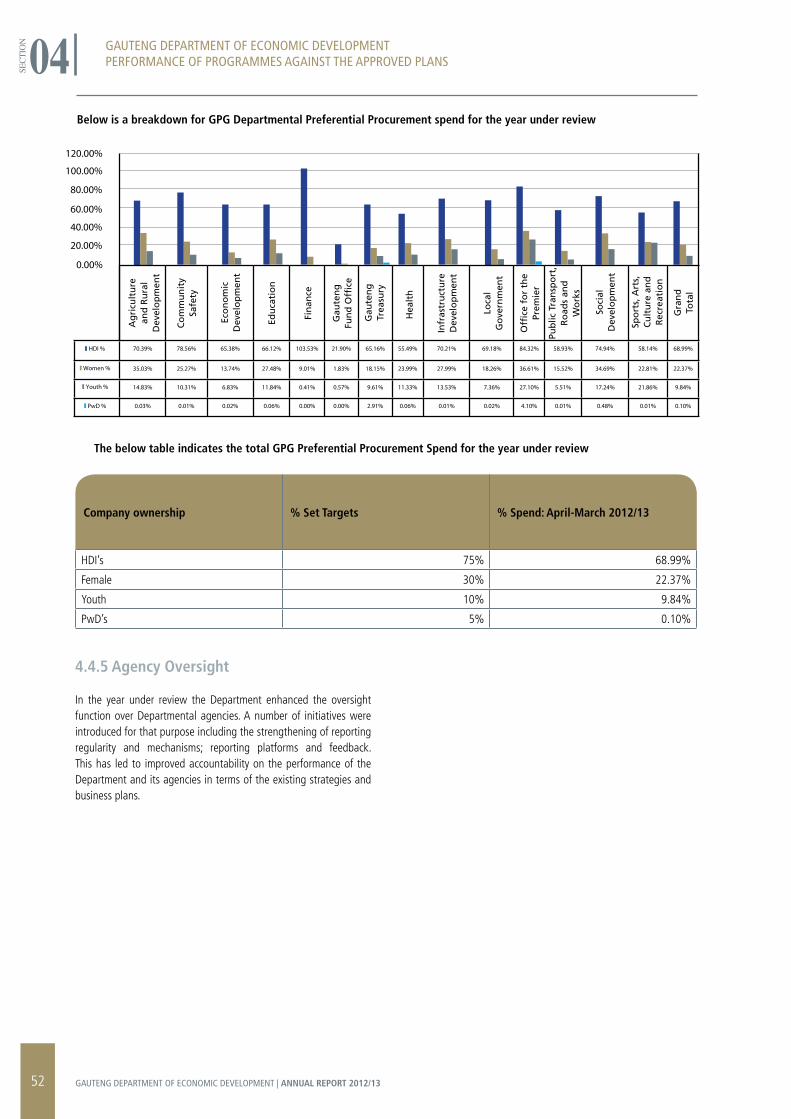
4.4.5 Agency Oversight
In the year under review the Department enhanced the oversight function over Departmental agencies. A number of initiatives were introduced for that purpose including the strengthening of reporting regularity and mechanisms; reporting platforms and feedback. This has led to improved accountability on the performance of the Department and its agencies in terms of the existing strategies and business plans.
GAUTENG DEPARTMENT OF ECONOMIC DEVELOPMENTPERFORMANCE OF PROGRAMMES AGAINST THE APPROVED PLANS
SECT
ION 04
The below table indicates the total GPG Preferential Procurement Spend for the year under review
Company ownership % Set Targets % Spend: April-March 2012/13
HDI’s 75% 68.99%
Female 30% 22.37%
Youth 10% 9.84%
PwD’s 5% 0.10%
Below is a breakdown for GPG Departmental Preferential Procurement spend for the year under review
120.00%
100.00%
80.00%
60.00%
40.00%
20.00%
0.00%
70.39% 78.56% 65.38% 66.12% 103.53% 21.90% 65.16% 55.49% 70.21% 69.18% 84.32% 58.93% 74.94% 58.14% 68.99%
35.03% 25.27% 13.74% 27.48% 9.01% 1.83% 18.15% 23.99% 27.99% 18.26% 36.61% 15.52% 34.69% 22.81% 22.37%
14.83% 10.31% 6.83% 11.84% 0.41% 0.57% 9.61% 11.33% 13.53% 7.36% 27.10% 5.51% 17.24% 21.86% 9.84%
0.03% 0.01% 0.02% 0.06% 0.00% 0.00% 2.91% 0.06% 0.01% 0.02% 4.10% 0.01% 0.48% 0.01% 0.10%
HDI %
Women %
Youth %
PwD %
Ag
ricu
ltu
rean
d R
ura
lD
evel
op
men
t
Co
mm
un
ity
Safe
ty
Eco
no
mic
Dev
elo
pm
ent
Infr
astr
uct
ure
Dev
elo
pm
ent
Soci
alD
evel
op
men
t
Loca
lG
ove
rnm
ent
Edu
cati
on
Fin
ance
Gau
ten
gFu
nd
Offi
ce
Offi
ce f
or
the
Prem
ier
Pub
lic T
ran
spo
rt,
Ro
ads
and
Wo
rks
Spo
rts,
Art
s,C
ult
ure
an
dR
ecre
atio
n
Gra
nd
Tota
l
Hea
lth
Gau
ten
gTr
easu
ry
52 GAUTENG DEPARTMENT OF ECONOMIC DEVELOPMENT | ANNUAL REPORT 2012/13
GAUTENG DEPARTMENT OF ECONOMIC DEVELOPMENTPERFORMANCE OF PROGRAMMES AGAINST THE APPROVED PLANS
SECT
ION 04GAUTENG DEPARTMENT OF ECONOMIC DEVELOPMENT
PERFORMANCE OF PROGRAMMES AGAINST THE APPROVED PLANS
53GAUTENG DEPARTMENT OF ECONOMIC DEVELOPMENT | ANNUAL REPORT 2012/13
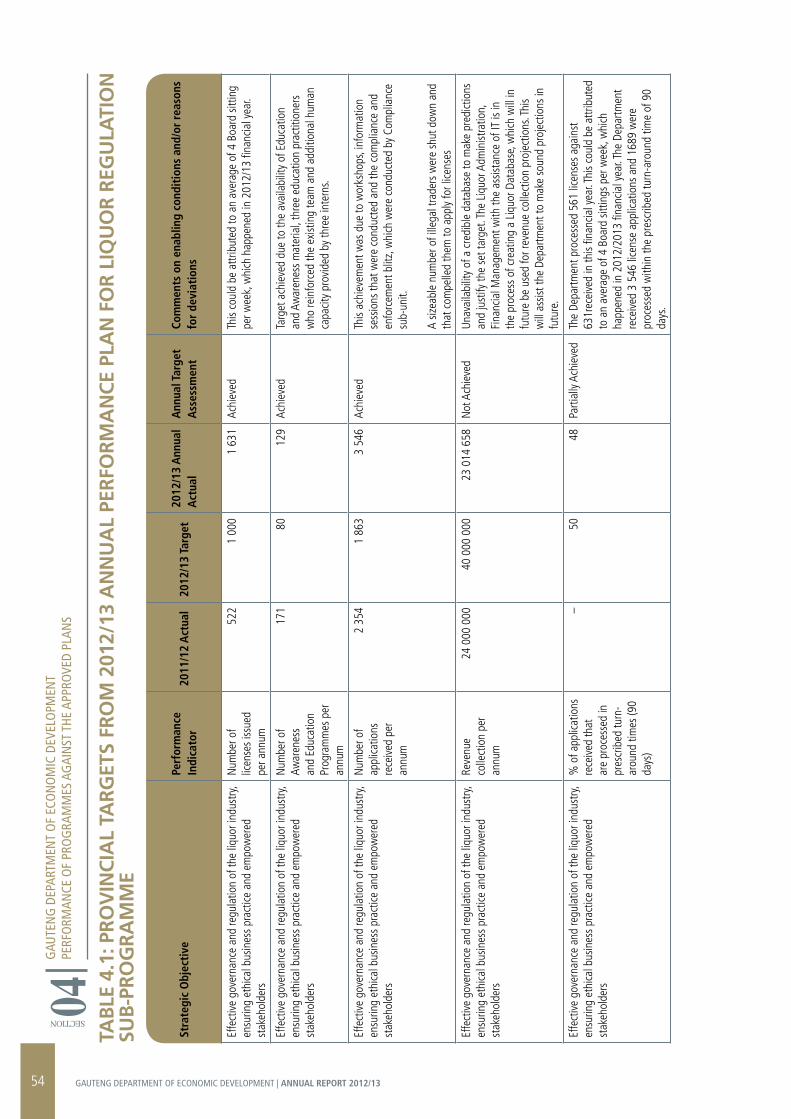
TAB
LE 4
.1: P
rO
VIN
CIA
L TA
rG
ETS
FrO
M 2
012/
13 A
NN
UA
L PE
rFO
rM
AN
CE
PLA
N F
Or
LIq
UO
r r
EGU
LATI
ON
SU
B-P
rO
Gr
AM
ME
GAU
TEN
G D
EPAR
TMEN
T O
F EC
ON
OM
IC D
EVEL
OPM
ENT
PERF
ORM
ANCE
OF
PRO
GRA
MM
ES A
GAI
NST
THE
APP
ROVE
D PL
ANS
SECTION 04
Stra
tegi
c O
bjec
tive
Perf
orm
ance
In
dica
tor
2011
/12
Act
ual
2012
/13
Targ
et20
12/1
3 A
nnua
l A
ctua
lA
nnua
l Tar
get
Ass
essm
ent
Com
men
ts o
n en
ablin
g co
ndit
ions
and
/or
reas
ons
for
devi
atio
ns
Effe
ctiv
e go
vern
ance
and
regu
latio
n of
the
liquo
r ind
ustry
, en
surin
g et
hica
l bus
ines
s pr
actic
e an
d em
pow
ered
st
akeh
olde
rs
Num
ber o
f lic
ense
s iss
ued
per a
nnum
522
1 00
01
631
Achi
eved
This
coul
d be
attr
ibut
ed to
an
aver
age
of 4
Boa
rd s
ittin
g pe
r wee
k, w
hich
hap
pene
d in
201
2/13
fina
ncia
l yea
r.
Effe
ctiv
e go
vern
ance
and
regu
latio
n of
the
liquo
r ind
ustry
, en
surin
g et
hica
l bus
ines
s pr
actic
e an
d em
pow
ered
st
akeh
olde
rs
Num
ber o
f Aw
aren
ess
and
Educ
atio
n Pr
ogra
mm
es p
er
annu
m
171
8012
9Ac
hiev
edTa
rget
ach
ieve
d du
e to
the
avai
labi
lity
of E
duca
tion
and
Awar
enes
s m
ater
ial,
thre
e ed
ucat
ion
prac
titio
ners
w
ho re
info
rced
the
exist
ing
team
and
add
ition
al h
uman
ca
pacit
y pr
ovid
ed b
y th
ree
inte
rns.
Effe
ctiv
e go
vern
ance
and
regu
latio
n of
the
liquo
r ind
ustry
, en
surin
g et
hica
l bus
ines
s pr
actic
e an
d em
pow
ered
st
akeh
olde
rs
Num
ber o
f ap
plica
tions
re
ceiv
ed p
er
annu
m
2 35
41
863
3 54
6Ac
hiev
edTh
is ac
hiev
emen
t was
due
to w
orks
hops
, inf
orm
atio
n se
ssio
ns th
at w
ere
cond
ucte
d an
d th
e co
mpl
ianc
e an
d en
forc
emen
t blit
z, w
hich
wer
e co
nduc
ted
by C
ompl
ianc
e su
b-un
it.
A siz
eabl
e nu
mbe
r of i
llega
l tra
ders
wer
e sh
ut d
own
and
that
com
pelle
d th
em to
app
ly fo
r lice
nses
Effe
ctiv
e go
vern
ance
and
regu
latio
n of
the
liquo
r ind
ustry
, en
surin
g et
hica
l bus
ines
s pr
actic
e an
d em
pow
ered
st
akeh
olde
rs
Reve
nue
colle
ctio
n pe
r an
num
24 0
00 0
0040
000
000
23 0
14 6
58N
ot A
chie
ved
Unav
aila
bilit
y of
a c
redi
ble
data
base
to m
ake
pred
ictio
ns
and
just
ify th
e se
t tar
get.
The
Liqu
or A
dmin
istra
tion,
Fi
nanc
ial M
anag
emen
t with
the
assis
tanc
e of
IT is
in
the
proc
ess
of c
reat
ing
a Li
quor
Dat
abas
e, w
hich
will
in
futu
re b
e us
ed fo
r rev
enue
col
lect
ion
proj
ectio
ns. T
his
will
ass
ist th
e De
partm
ent t
o m
ake
soun
d pr
ojec
tions
in
futu
re.
Effe
ctiv
e go
vern
ance
and
regu
latio
n of
the
liquo
r ind
ustry
, en
surin
g et
hica
l bus
ines
s pr
actic
e an
d em
pow
ered
st
akeh
olde
rs
% o
f app
licat
ions
re
ceiv
ed th
at
are
proc
esse
d in
pr
escr
ibed
turn
-ar
ound
tim
es (9
0 da
ys)
–50
48Pa
rtial
ly Ac
hiev
edTh
e De
partm
ent p
roce
ssed
561
lice
nses
aga
inst
63
1rec
eive
d in
this
finan
cial y
ear. T
his
coul
d be
attr
ibut
ed
to a
n av
erag
e of
4 B
oard
sitt
ings
per
wee
k, w
hich
ha
ppen
ed in
201
2/20
13 fi
nanc
ial y
ear. T
he D
epar
tmen
t re
ceiv
ed 3
546
lice
nse
appl
icatio
ns a
nd 1
689
wer
e pr
oces
sed
with
in th
e pr
escr
ibed
turn
-aro
und
time
of 9
0 da
ys.
54 GAUTENG DEPARTMENT OF ECONOMIC DEVELOPMENT | ANNUAL REPORT 2012/13
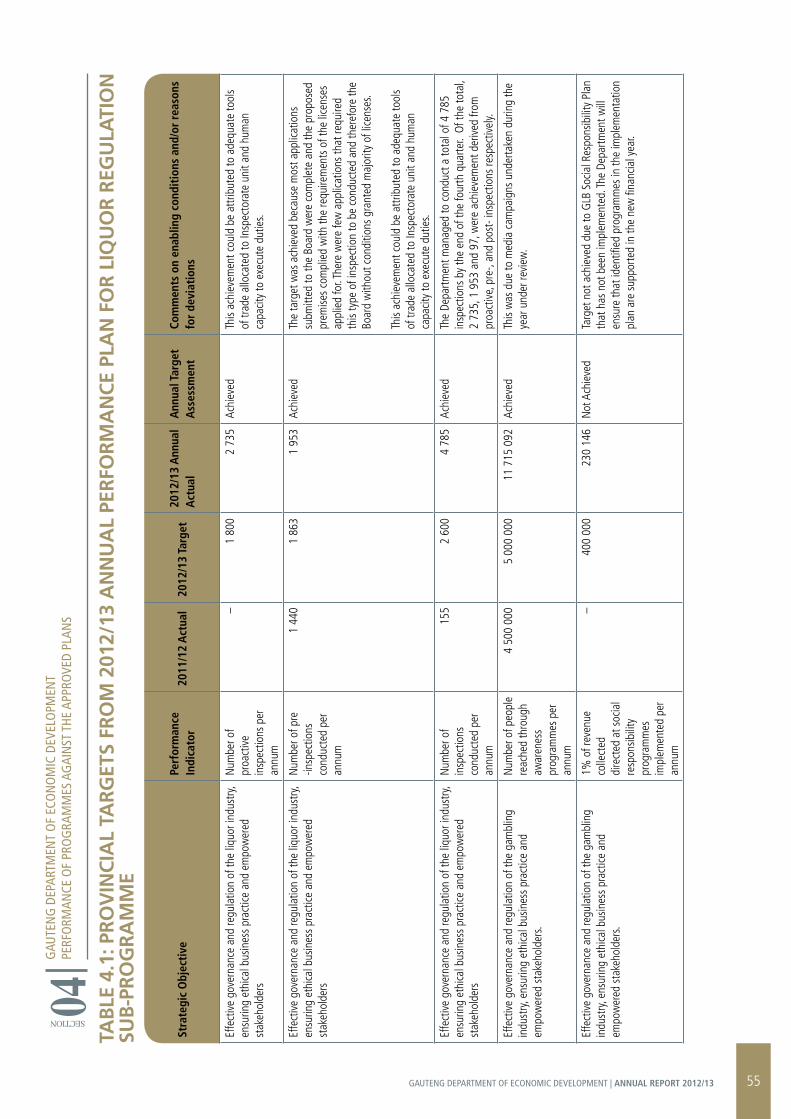
TAB
LE 4
.1: P
rO
VIN
CIA
L TA
rG
ETS
FrO
M 2
012/
13 A
NN
UA
L PE
rFO
rM
AN
CE
PLA
N F
Or
LIq
UO
r r
EGU
LATI
ON
SU
B-P
rO
Gr
AM
ME
GAU
TEN
G D
EPAR
TMEN
T O
F EC
ON
OM
IC D
EVEL
OPM
ENT
PERF
ORM
ANCE
OF
PRO
GRA
MM
ES A
GAI
NST
THE
APP
ROVE
D PL
ANS
Stra
tegi
c O
bjec
tive
Perf
orm
ance
In
dica
tor
2011
/12
Act
ual
2012
/13
Targ
et20
12/1
3 A
nnua
l A
ctua
lA
nnua
l Tar
get
Ass
essm
ent
Com
men
ts o
n en
ablin
g co
ndit
ions
and
/or
reas
ons
for
devi
atio
ns
Effe
ctiv
e go
vern
ance
and
regu
latio
n of
the
liquo
r ind
ustry
, en
surin
g et
hica
l bus
ines
s pr
actic
e an
d em
pow
ered
st
akeh
olde
rs
Num
ber o
f pr
oact
ive
insp
ectio
ns p
er
annu
m
–1
800
2 73
5Ac
hiev
edTh
is ac
hiev
emen
t cou
ld b
e at
tribu
ted
to a
dequ
ate
tool
s of
trad
e al
loca
ted
to In
spec
tora
te u
nit a
nd h
uman
ca
pacit
y to
exe
cute
dut
ies.
Effe
ctiv
e go
vern
ance
and
regu
latio
n of
the
liquo
r ind
ustry
, en
surin
g et
hica
l bus
ines
s pr
actic
e an
d em
pow
ered
st
akeh
olde
rs
Num
ber o
f pre
-in
spec
tions
co
nduc
ted
per
annu
m
1 44
01
863
1 95
3Ac
hiev
edTh
e ta
rget
was
ach
ieve
d be
caus
e m
ost a
pplic
atio
ns
subm
itted
to th
e Bo
ard
wer
e co
mpl
ete
and
the
prop
osed
pr
emise
s co
mpl
ied
with
the
requ
irem
ents
of t
he li
cens
es
appl
ied
for. T
here
wer
e fe
w a
pplic
atio
ns th
at re
quire
d th
is ty
pe o
f ins
pect
ion
to b
e co
nduc
ted
and
ther
efor
e th
e Bo
ard
with
out c
ondi
tions
gra
nted
maj
ority
of l
icens
es.
This
achi
evem
ent c
ould
be
attri
bute
d to
ade
quat
e to
ols
of tr
ade
allo
cate
d to
Insp
ecto
rate
uni
t and
hum
an
capa
city
to e
xecu
te d
utie
s.
Effe
ctiv
e go
vern
ance
and
regu
latio
n of
the
liquo
r ind
ustry
, en
surin
g et
hica
l bus
ines
s pr
actic
e an
d em
pow
ered
st
akeh
olde
rs
Num
ber o
f in
spec
tions
co
nduc
ted
per
annu
m
155
2 60
04
785
Achi
eved
The
Depa
rtmen
t man
aged
to c
ondu
ct a
tota
l of 4
785
in
spec
tions
by
the
end
of th
e fo
urth
qua
rter.
Of t
he to
tal,
2 73
5, 1
953
and
97,
wer
e ac
hiev
emen
t der
ived
from
pr
oact
ive,
pre
-, an
d po
st- i
nspe
ctio
ns re
spec
tivel
y.
Effe
ctiv
e go
vern
ance
and
regu
latio
n of
the
gam
blin
g in
dust
ry, e
nsur
ing
ethi
cal b
usin
ess
prac
tice
and
empo
wer
ed s
take
hold
ers.
Num
ber o
f peo
ple
reac
hed
thro
ugh
awar
enes
s pr
ogra
mm
es p
er
annu
m
4 50
0 00
05
000
000
11 7
15 0
92Ac
hiev
edTh
is w
as d
ue to
med
ia c
ampa
igns
und
erta
ken
durin
g th
e ye
ar u
nder
revi
ew.
Effe
ctiv
e go
vern
ance
and
regu
latio
n of
the
gam
blin
g in
dust
ry, e
nsur
ing
ethi
cal b
usin
ess
prac
tice
and
empo
wer
ed s
take
hold
ers.
1% o
f rev
enue
co
llect
ed
dire
cted
at s
ocia
l re
spon
sibili
ty
prog
ram
mes
im
plem
ente
d pe
r an
num
–40
0 00
023
0 14
6N
ot A
chie
ved
Targ
et n
ot a
chie
ved
due
to G
LB S
ocia
l Res
pons
ibili
ty P
lan
that
has
not
bee
n im
plem
ente
d. Th
e De
partm
ent w
ill
ensu
re th
at id
entifi
ed p
rogr
amm
es in
the
impl
emen
tatio
n pl
an a
re s
uppo
rted
in th
e ne
w fi
nanc
ial y
ear.
SECTION 04
55GAUTENG DEPARTMENT OF ECONOMIC DEVELOPMENT | ANNUAL REPORT 2012/13
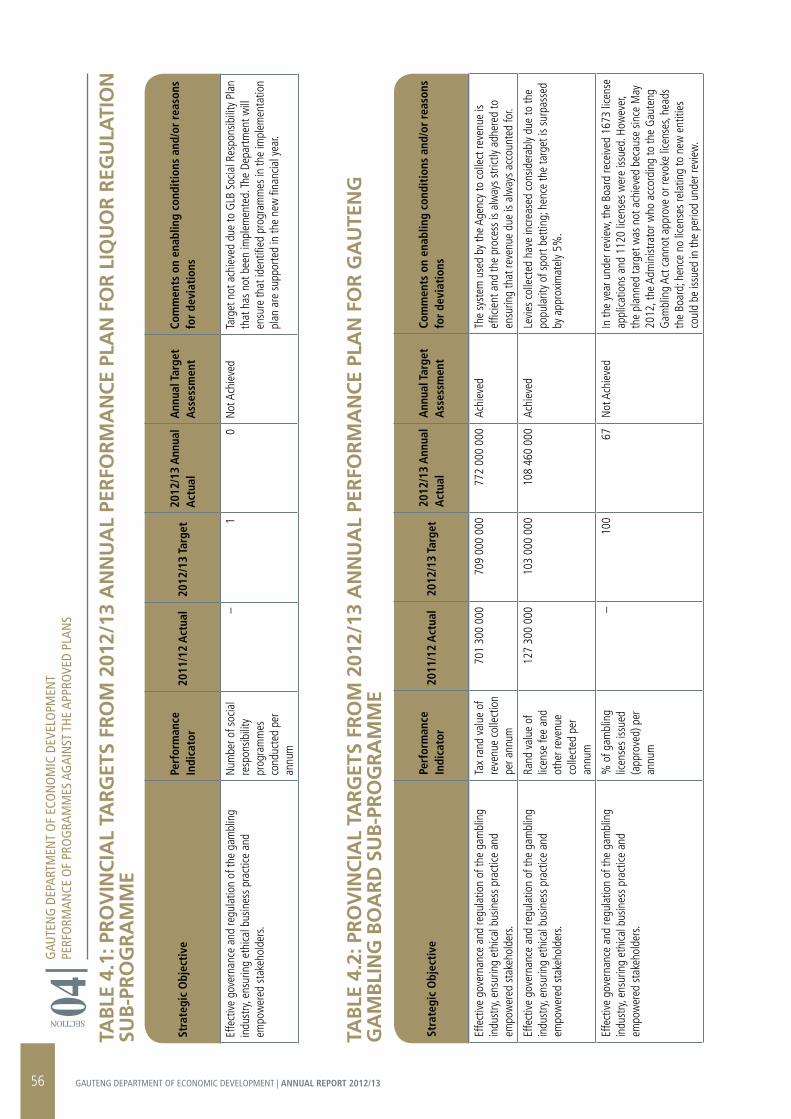
TAB
LE 4
.1: P
rO
VIN
CIA
L TA
rG
ETS
FrO
M 2
012/
13 A
NN
UA
L PE
rFO
rM
AN
CE
PLA
N F
Or
LIq
UO
r r
EGU
LATI
ON
SU
B-P
rO
Gr
AM
ME
TAB
LE 4
.2: P
rO
VIN
CIA
L TA
rG
ETS
FrO
M 2
012/
13 A
NN
UA
L PE
rFO
rM
AN
CE
PLA
N F
Or
GA
UTE
NG
G
AM
BLI
NG
BO
Ar
D S
UB
-Pr
OG
rA
MM
E
GAU
TEN
G D
EPAR
TMEN
T O
F EC
ON
OM
IC D
EVEL
OPM
ENT
PERF
ORM
ANCE
OF
PRO
GRA
MM
ES A
GAI
NST
THE
APP
ROVE
D PL
ANS
SECTION 04
Stra
tegi
c O
bjec
tive
Perf
orm
ance
In
dica
tor
2011
/12
Act
ual
2012
/13
Targ
et20
12/1
3 A
nnua
l A
ctua
lA
nnua
l Tar
get
Ass
essm
ent
Com
men
ts o
n en
ablin
g co
ndit
ions
and
/or
reas
ons
for
devi
atio
ns
Effe
ctiv
e go
vern
ance
and
regu
latio
n of
the
gam
blin
g in
dust
ry, e
nsur
ing
ethi
cal b
usin
ess
prac
tice
and
empo
wer
ed s
take
hold
ers.
Num
ber o
f soc
ial
resp
onsib
ility
pr
ogra
mm
es
cond
ucte
d pe
r an
num
–1
0N
ot A
chie
ved
Targ
et n
ot a
chie
ved
due
to G
LB S
ocia
l Res
pons
ibili
ty P
lan
that
has
not
bee
n im
plem
ente
d. Th
e De
partm
ent w
ill
ensu
re th
at id
entifi
ed p
rogr
amm
es in
the
impl
emen
tatio
n pl
an a
re s
uppo
rted
in th
e ne
w fi
nanc
ial y
ear.
Stra
tegi
c O
bjec
tive
Perf
orm
ance
In
dica
tor
2011
/12
Act
ual
2012
/13
Targ
et20
12/1
3 A
nnua
l A
ctua
lA
nnua
l Tar
get
Ass
essm
ent
Com
men
ts o
n en
ablin
g co
ndit
ions
and
/or
reas
ons
for
devi
atio
ns
Effe
ctiv
e go
vern
ance
and
regu
latio
n of
the
gam
blin
g in
dust
ry, e
nsur
ing
ethi
cal b
usin
ess
prac
tice
and
empo
wer
ed s
take
hold
ers.
Tax
rand
val
ue o
f re
venu
e co
llect
ion
per a
nnum
701
300
000
709
000
000
772
000
000
Achi
eved
The
syst
em u
sed
by th
e Ag
ency
to c
olle
ct re
venu
e is
effic
ient
and
the
proc
ess
is al
way
s st
rictly
adh
ered
to
ensu
ring
that
reve
nue
due
is al
way
s ac
coun
ted
for.
Effe
ctiv
e go
vern
ance
and
regu
latio
n of
the
gam
blin
g in
dust
ry, e
nsur
ing
ethi
cal b
usin
ess
prac
tice
and
empo
wer
ed s
take
hold
ers.
Rand
val
ue o
f lic
ense
fee
and
othe
r rev
enue
co
llect
ed p
er
annu
m
127
300
000
103
000
000
108
460
000
Achi
eved
Levi
es c
olle
cted
hav
e in
crea
sed
cons
ider
ably
due
to th
e po
pula
rity
of s
port
betti
ng; h
ence
the
targ
et is
sur
pass
ed
by a
ppro
xim
atel
y 5%
.
Effe
ctiv
e go
vern
ance
and
regu
latio
n of
the
gam
blin
g in
dust
ry, e
nsur
ing
ethi
cal b
usin
ess
prac
tice
and
empo
wer
ed s
take
hold
ers.
% o
f gam
blin
g lic
ense
s iss
ued
(app
rove
d) p
er
annu
m
–10
0 6
7 N
ot A
chie
ved
In th
e ye
ar u
nder
revi
ew, t
he B
oard
rece
ived
167
3 lic
ense
ap
plica
tions
and
112
0 lic
ense
s w
ere
issue
d. H
owev
er,
the
plan
ned
targ
et w
as n
ot a
chie
ved
beca
use
since
May
20
12, t
he A
dmin
istra
tor w
ho a
ccor
ding
to th
e G
aute
ng
Gam
blin
g Ac
t can
not a
ppro
ve o
r rev
oke
licen
ses,
head
s th
e Bo
ard;
hen
ce n
o lic
ense
s re
latin
g to
new
ent
ities
co
uld
be is
sued
in th
e pe
riod
unde
r rev
iew
.
56 GAUTENG DEPARTMENT OF ECONOMIC DEVELOPMENT | ANNUAL REPORT 2012/13
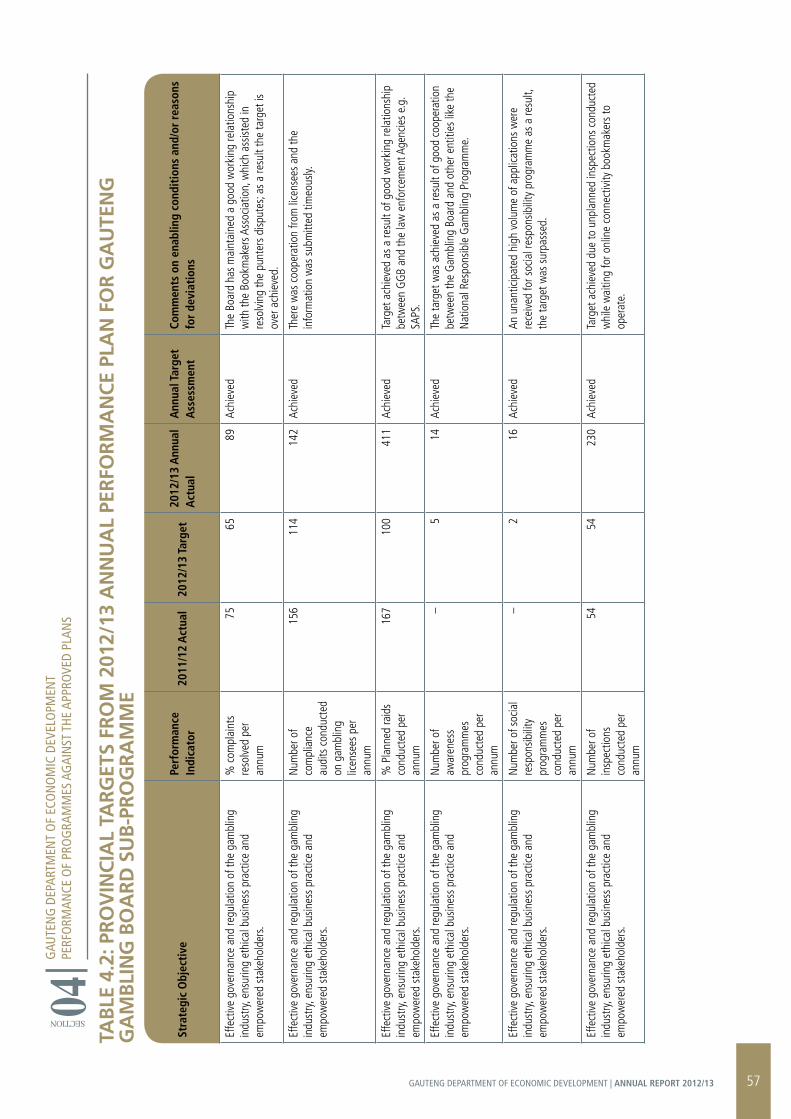
TAB
LE 4
.2: P
rO
VIN
CIA
L TA
rG
ETS
FrO
M 2
012/
13 A
NN
UA
L PE
rFO
rM
AN
CE
PLA
N F
Or
GA
UTE
NG
G
AM
BLI
NG
BO
Ar
D S
UB
-Pr
OG
rA
MM
E
GAU
TEN
G D
EPAR
TMEN
T O
F EC
ON
OM
IC D
EVEL
OPM
ENT
PERF
ORM
ANCE
OF
PRO
GRA
MM
ES A
GAI
NST
THE
APP
ROVE
D PL
ANS
Stra
tegi
c O
bjec
tive
Perf
orm
ance
In
dica
tor
2011
/12
Act
ual
2012
/13
Targ
et20
12/1
3 A
nnua
l A
ctua
lA
nnua
l Tar
get
Ass
essm
ent
Com
men
ts o
n en
ablin
g co
ndit
ions
and
/or
reas
ons
for
devi
atio
ns
Effe
ctiv
e go
vern
ance
and
regu
latio
n of
the
gam
blin
g in
dust
ry, e
nsur
ing
ethi
cal b
usin
ess
prac
tice
and
empo
wer
ed s
take
hold
ers.
% c
ompl
aint
s re
solv
ed p
er
annu
m
7565
89
Achi
eved
The
Boar
d ha
s m
aint
aine
d a
good
wor
king
rela
tions
hip
with
the
Book
mak
ers A
ssoc
iatio
n, w
hich
ass
isted
in
reso
lvin
g th
e pu
nter
s di
sput
es; a
s a
resu
lt th
e ta
rget
is
over
ach
ieve
d.
Effe
ctiv
e go
vern
ance
and
regu
latio
n of
the
gam
blin
g in
dust
ry, e
nsur
ing
ethi
cal b
usin
ess
prac
tice
and
empo
wer
ed s
take
hold
ers.
Num
ber o
f co
mpl
ianc
e au
dits
con
duct
ed
on g
ambl
ing
licen
sees
per
an
num
156
114
142
Achi
eved
Ther
e w
as c
oope
ratio
n fro
m li
cens
ees
and
the
info
rmat
ion
was
sub
mitt
ed ti
meo
usly.
Effe
ctiv
e go
vern
ance
and
regu
latio
n of
the
gam
blin
g in
dust
ry, e
nsur
ing
ethi
cal b
usin
ess
prac
tice
and
empo
wer
ed s
take
hold
ers.
% P
lann
ed ra
ids
cond
ucte
d pe
r an
num
167
100
411
Achi
eved
Targ
et a
chie
ved
as a
resu
lt of
goo
d w
orki
ng re
latio
nshi
p be
twee
n G
GB
and
the
law
enf
orce
men
t Age
ncie
s e.
g.
SAPS
.
Effe
ctiv
e go
vern
ance
and
regu
latio
n of
the
gam
blin
g in
dust
ry, e
nsur
ing
ethi
cal b
usin
ess
prac
tice
and
empo
wer
ed s
take
hold
ers.
Num
ber o
f aw
aren
ess
prog
ram
mes
co
nduc
ted
per
annu
m
–5
14Ac
hiev
edTh
e ta
rget
was
ach
ieve
d as
a re
sult
of g
ood
coop
erat
ion
betw
een
the
Gam
blin
g Bo
ard
and
othe
r ent
ities
like
the
Nat
iona
l Res
pons
ible
Gam
blin
g Pr
ogra
mm
e.
Effe
ctiv
e go
vern
ance
and
regu
latio
n of
the
gam
blin
g in
dust
ry, e
nsur
ing
ethi
cal b
usin
ess
prac
tice
and
empo
wer
ed s
take
hold
ers.
Num
ber o
f soc
ial
resp
onsib
ility
pr
ogra
mm
es
cond
ucte
d pe
r an
num
–2
16Ac
hiev
edAn
una
ntici
pate
d hi
gh v
olum
e of
app
licat
ions
wer
e re
ceiv
ed fo
r soc
ial r
espo
nsib
ility
pro
gram
me
as a
resu
lt,
the
targ
et w
as s
urpa
ssed
.
Effe
ctiv
e go
vern
ance
and
regu
latio
n of
the
gam
blin
g in
dust
ry, e
nsur
ing
ethi
cal b
usin
ess
prac
tice
and
empo
wer
ed s
take
hold
ers.
Num
ber o
f in
spec
tions
co
nduc
ted
per
annu
m
5454
230
Achi
eved
Targ
et a
chie
ved
due
to u
npla
nned
insp
ectio
ns c
ondu
cted
w
hile
wai
ting
for o
nlin
e co
nnec
tivity
boo
kmak
ers
to
oper
ate.
SECTION 04
57GAUTENG DEPARTMENT OF ECONOMIC DEVELOPMENT | ANNUAL REPORT 2012/13

TAB
LE 4
.3: P
rO
VIN
CIA
L TA
rG
ETS
FrO
M 2
012/
13 A
NN
UA
L PE
rFO
rM
AN
CE
PLA
N F
Or
CO
NSU
MEr
Pr
OTE
CTI
ON
SU
B-P
rO
Gr
AM
ME
GAU
TEN
G D
EPAR
TMEN
T O
F EC
ON
OM
IC D
EVEL
OPM
ENT
PERF
ORM
ANCE
OF
PRO
GRA
MM
ES A
GAI
NST
THE
APP
ROVE
D PL
ANS
SECTION 04
Stra
tegi
c O
bjec
tive
Perf
orm
ance
In
dica
tor
2011
/12
Act
ual
2012
/13
Targ
et20
12/1
3 A
nnua
l A
ctua
lA
nnua
l Tar
get
Ass
essm
ent
Com
men
ts o
n en
ablin
g co
ndit
ions
and
/or
reas
ons
for
devi
atio
ns
Effe
ctiv
e re
gula
tion
for i
ncre
ased
leve
ls of
con
sum
er
prot
ectio
nN
umbe
r of
com
plai
nts
rece
ived
per
an
num
–1
815
1 82
8Ac
hiev
edTa
rget
ach
ieve
d du
e to
the
heig
hten
ed a
war
enes
s cr
eate
d th
roug
h m
edia
cam
paig
n du
ring
Wor
ld C
onsu
mer
Ri
ghts
Day
.
Effe
ctiv
e re
gula
tion
for i
ncre
ased
leve
ls of
con
sum
er
prot
ectio
nN
umbe
r of
Cons
umer
Co
mpl
aint
s re
solv
ed p
er
annu
m
2716
1 63
31
774
Achi
eved
Targ
et a
chie
ved
thro
ugh
build
ing
bette
r rel
atio
nshi
ps
with
sta
keho
lder
s to
ens
ure
the
fast
er re
solu
tion
of
com
plai
nts.
Effe
ctiv
e re
gula
tion
for i
ncre
ased
leve
ls of
con
sum
er
prot
ectio
nN
umbe
r of
cons
umer
aw
aren
ess
and
educ
atio
n pr
ogra
mm
es
(wor
ksho
ps)
cond
ucte
d
6970
91Ac
hiev
edTa
rget
ach
ieve
d th
roug
h ad
here
nce
to a
war
enes
s an
d ed
ucat
ion
plan
and
cre
atin
g aw
aren
ess
abou
t the
ex
isten
ce o
f an
offic
e an
d co
nsum
ers
serv
ices
with
in
DED.
The
high
light
was
an
even
t hos
ted
by th
e DE
D to
ce
lebr
ate
Wor
ld C
onsu
mer
Rig
hts
Day,
whi
ch w
as h
eld
in M
eraf
ong
in M
arch
201
3 w
here
app
roxi
mat
ely
five
thou
sand
con
sum
ers
in th
e ar
ea a
nd b
eyon
d at
tend
ed.
58 GAUTENG DEPARTMENT OF ECONOMIC DEVELOPMENT | ANNUAL REPORT 2012/13
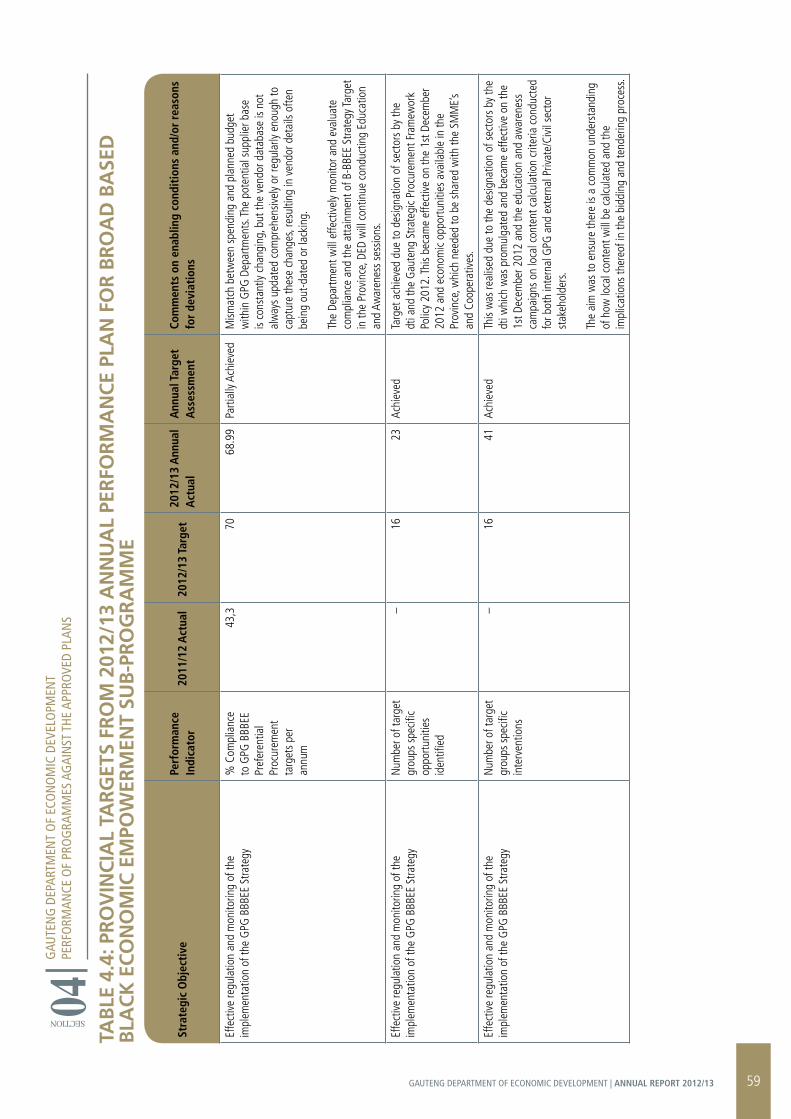
TAB
LE 4
.4: P
rO
VIN
CIA
L TA
rG
ETS
FrO
M 2
012/
13 A
NN
UA
L PE
rFO
rM
AN
CE
PLA
N F
Or
Br
OA
D B
ASE
D
BLA
CK
EC
ON
OM
IC E
MPO
WEr
MEN
T SU
B-P
rO
Gr
AM
ME
GAU
TEN
G D
EPAR
TMEN
T O
F EC
ON
OM
IC D
EVEL
OPM
ENT
PERF
ORM
ANCE
OF
PRO
GRA
MM
ES A
GAI
NST
THE
APP
ROVE
D PL
ANS
Stra
tegi
c O
bjec
tive
Perf
orm
ance
In
dica
tor
2011
/12
Act
ual
2012
/13
Targ
et20
12/1
3 A
nnua
l A
ctua
lA
nnua
l Tar
get
Ass
essm
ent
Com
men
ts o
n en
ablin
g co
ndit
ions
and
/or
reas
ons
for
devi
atio
ns
Effe
ctiv
e re
gula
tion
and
mon
itorin
g of
the
impl
emen
tatio
n of
the
GPG
BBB
EE S
trate
gy%
Com
plia
nce
to G
PG B
BBEE
Pr
efer
entia
l Pr
ocur
emen
t ta
rget
s pe
r an
num
43,3
7068
.99
Parti
ally
Achi
eved
Mism
atch
bet
wee
n sp
endi
ng a
nd p
lann
ed b
udge
t w
ithin
GPG
Dep
artm
ents
. The
pot
entia
l sup
plie
r bas
e is
cons
tant
ly ch
angi
ng, b
ut th
e ve
ndor
dat
abas
e is
not
alw
ays
upda
ted
com
preh
ensiv
ely
or re
gula
rly e
noug
h to
ca
ptur
e th
ese
chan
ges,
resu
lting
in v
endo
r det
ails
ofte
n be
ing
out-d
ated
or l
acki
ng.
The
Depa
rtmen
t will
effe
ctiv
ely
mon
itor a
nd e
valu
ate
com
plia
nce
and
the
atta
inm
ent o
f B-B
BEE
Stra
tegy
Targ
et
in th
e Pr
ovin
ce, D
ED w
ill c
ontin
ue c
ondu
ctin
g Ed
ucat
ion
and
Awar
enes
s se
ssio
ns.
Effe
ctiv
e re
gula
tion
and
mon
itorin
g of
the
impl
emen
tatio
n of
the
GPG
BBB
EE S
trate
gyN
umbe
r of t
arge
t gr
oups
spe
cific
oppo
rtuni
ties
iden
tified
–16
23Ac
hiev
edTa
rget
ach
ieve
d du
e to
des
igna
tion
of s
ecto
rs b
y th
e dt
i and
the
Gau
teng
Stra
tegi
c Pr
ocur
emen
t Fra
mew
ork
Polic
y 20
12. T
his
beca
me
effe
ctiv
e on
the
1st D
ecem
ber
2012
and
eco
nom
ic op
portu
nitie
s av
aila
ble
in th
e Pr
ovin
ce, w
hich
nee
ded
to b
e sh
ared
with
the
SMM
E’s
and
Coop
erat
ives
.
Effe
ctiv
e re
gula
tion
and
mon
itorin
g of
the
impl
emen
tatio
n of
the
GPG
BBB
EE S
trate
gyN
umbe
r of t
arge
t gr
oups
spe
cific
inte
rven
tions
–16
41Ac
hiev
edTh
is w
as re
alise
d du
e to
the
desig
natio
n of
sec
tors
by
the
dti w
hich
was
pro
mul
gate
d an
d be
cam
e ef
fect
ive
on th
e 1s
t Dec
embe
r 201
2 an
d th
e ed
ucat
ion
and
awar
enes
s ca
mpa
igns
on
loca
l con
tent
cal
cula
tion
crite
ria c
ondu
cted
fo
r bot
h in
tern
al G
PG a
nd e
xter
nal P
rivat
e/Ci
vil s
ecto
r st
akeh
olde
rs.
The
aim
was
to e
nsur
e th
ere
is a
com
mon
und
erst
andi
ng
of h
ow lo
cal c
onte
nt w
ill b
e ca
lcula
ted
and
the
impl
icatio
ns th
ereo
f in
the
bidd
ing
and
tend
erin
g pr
oces
s.
SECTION 04
59GAUTENG DEPARTMENT OF ECONOMIC DEVELOPMENT | ANNUAL REPORT 2012/13
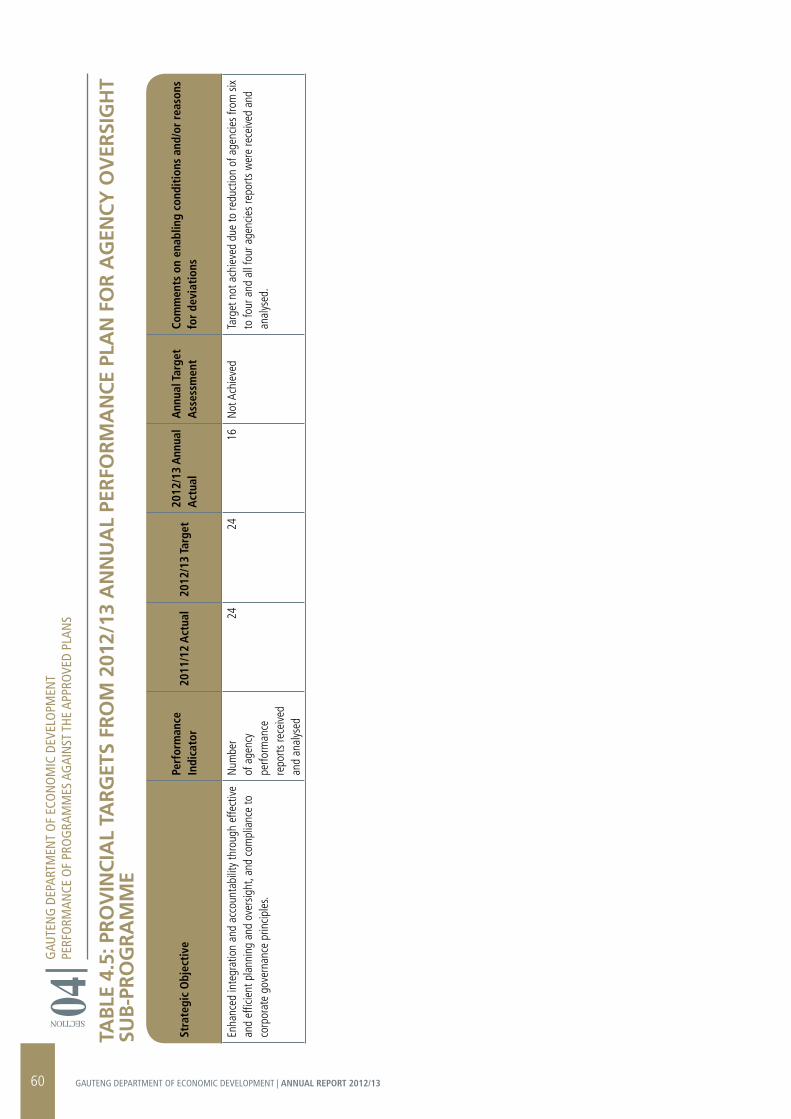
TAB
LE 4
.5: P
rO
VIN
CIA
L TA
rG
ETS
FrO
M 2
012/
13 A
NN
UA
L PE
rFO
rM
AN
CE
PLA
N F
Or
AG
ENC
Y O
VEr
SIG
HT
SUB
-Pr
OG
rA
MM
E
GAU
TEN
G D
EPAR
TMEN
T O
F EC
ON
OM
IC D
EVEL
OPM
ENT
PERF
ORM
ANCE
OF
PRO
GRA
MM
ES A
GAI
NST
THE
APP
ROVE
D PL
ANS
SECTION 04
Stra
tegi
c O
bjec
tive
Perf
orm
ance
In
dica
tor
2011
/12
Act
ual
2012
/13
Targ
et20
12/1
3 A
nnua
l A
ctua
lA
nnua
l Tar
get
Ass
essm
ent
Com
men
ts o
n en
ablin
g co
ndit
ions
and
/or
reas
ons
for
devi
atio
ns
Enha
nced
inte
grat
ion
and
acco
unta
bilit
y th
roug
h ef
fect
ive
and
effic
ient
pla
nnin
g an
d ov
ersig
ht, a
nd c
ompl
ianc
e to
co
rpor
ate
gove
rnan
ce p
rincip
les.
Num
ber
of a
genc
y pe
rform
ance
re
ports
rece
ived
an
d an
alys
ed
2424
16N
ot A
chie
ved
Targ
et n
ot a
chie
ved
due
to re
duct
ion
of a
genc
ies
from
six
to
four
and
all
four
age
ncie
s re
ports
wer
e re
ceiv
ed a
nd
anal
ysed
.
60 GAUTENG DEPARTMENT OF ECONOMIC DEVELOPMENT | ANNUAL REPORT 2012/13

4.5 PrOGrAMME 5: ECONOMIC PLANNING
The programme purpose is to provide economic thought leadership that ensures a synthesised, aligned and integrated economic agenda for the Gauteng Global City Region.
The programme objective is to develop provincial economic policies and strategies, conduct economic research, contribute to the creation of knowledge economy and determine the effectiveness and impact of provincial policy objectives and strategies.
In this regard, the programme will inform evidence based policy decision making, ensure sound analytical reporting, focus on the achievement of intended impact, and promote a more informed understanding of the economic agenda.
4.5.1 Economic Planning
Strategic Competitiveness
The Department developed two sector programmes, namely Gauteng Skills for the Economy and the Gauteng Mineral Beneficiation Programme. The former was developed through a partnership with Gauteng City Region Academy, industry and Sector Education and Training Authorities and the latter is a conceptual Framework on how Gauteng can implement the Jewellery Manufacturing Precinct based on international benchmarking.
The Department also developed Gauteng Furniture Skills Development and SMME/Cooperative Incubation Programme which aimed at mobilising 50 youth from Gauteng’s five municipalities to be trained for furniture skills (Wood work and Upholstery) and thereafter divided to form ten cooperatives. This programme intends to incubate youth for a period of two years benefitting from public procurement spending on office and school furniture as well as the broader furniture market.
The Gauteng Trade and Investment Gateway Strategy which is meant to enhance Gauteng as the factory for exported goods and services for Southern Africa and the rest of the African continent was also developed. It means that Gauteng becomes a platform for investors who want to produce goods and services for the bigger African market, given its advantage in productive infrastructure, financial hub, and centre for Research and Development. This strategy is a guide for Gauteng Growth and Development Agency on its trade and investment promotional activities in the African continent. The National Electric Vehicle Strategy 2011 for the Department of Trade and Industry and the analyses of the critical success factors that must be in place for this sub-sector to take off was also reviewed.
Monitoring and Evaluation
The Department compiled an evaluation report looking at the Gauteng Tooling Initiative in terms of the performance on the Tooling Artisan Skills training, which started during the fall of 2010.
This is a three-and-half year programme aimed at training 280 tooling artisan in Gauteng and their graduation is to take place in June 2014.
The Department also compiled a monitoring report on the implementation of the Foundry Training programme, in which 20 students will be enlisted for training in September 2013, was developed. This forms part of the plan to train 60 foundry practitioners in the next three years, with 20 enlisted on yearly basis.
Economic Research
The Department conducted two research studies, namely, “The Decent Work Deficit amongst Farm Workers in Gauteng. This research outcome will assist GDED and other governmental partners to engage the farming sector to improve the basic condition of employment. The second report was on Productivity Issues, constrains and improvements for Small Micro and Medium scale enterprises in Gauteng Province. On the number of research initiatives supported, a report on the state of freight industry in Gauteng was produced. This study is a benchmark on the costs of doing business in light of major infrastructure projects that are being undertaken in the province to ease the costs of delivery of freight and logistics.
The second research study is the “Identification of Skills Requirements for SMMEs, Cooperatives and the Informal Economy”. The study will assist the government to align its non-financial support (business support) with the requirements of SMMEs and Cooperatives. In addition, a study on the “Role of Information and Communication Technology (ICT) in economic growth/development was developed for developing countries. This was a benchmark study in support of the Gauteng Smart City Special Economic Zone.
The study on the hospitality industry, which measured decent work indicators according to the International Labour Organisation (ILO), was developed. The hospitality industry is one of the labour absorbing sectors made up of a few large enterprises and a number SMMEs, mostly exploiting workers rights. This study seeks to understand the working conditions in the hospitality industry in Gauteng and how the Department of Economic Development in conjunction with other spheres of government and non-governmental organisations can work together in improving working conditions of workers.
In addition, another study was also finalised by the Department on measuring cross border trade on Gauteng based firms. The study focuses on SMMEs and big companies and aimed at understanding the nature of cross-border retail activities as it benefits Gauteng businesses. A province-wide survey covering the broader informal economy sector was conducted. This includes the state of the cooperatives, SMME’s, hawkers etc. The study will assist in developing a deeper understanding of the informal sector and also in shaping the Department’s approach to the sector.
The study also forms an integral part of the inclusive economy agenda and has been conducted alongside other studies that intend to intervene in the critical areas of the informal economy.
GAUTENG DEPARTMENT OF ECONOMIC DEVELOPMENTPERFORMANCE OF PROGRAMMES AGAINST THE APPROVED PLANS
SECT
ION 04
61GAUTENG DEPARTMENT OF ECONOMIC DEVELOPMENT | ANNUAL REPORT 2012/13
A benchmarking study that has been conducted strengthens the Gauteng’s approach to the informal economy and to learn the best practices from other emerging economies. The studies will assist in the forth coming workshop on the informal economy and the summit later in May 2013.
Knowledge Management
The Department compiled a report that analysed Gauteng as an economic hub of the African continent. The report made an analysis of Gauteng Economy in terms of sectors that contribute to the economy and benchmarked it with the other five bigger economies in Africa.
Another economic intelligence report was compiled on Employment/Wage subsidy, which was a benchmarking report on countries with similar programmes. The report found that the adoption of such policy to alleviate high youth unemployment is not a panacea for the problem of youth unemployment. The 3rd economic intelligence report developed was on South Africa’s Electric Vehicle.
The study is about benchmarking the electric vehicle market and measure whether South Africa does have the critical success factors for the sector to be viable. Annual Economic Review, which evaluated the performance of the economy at global, national and provincial level on macroeconomic indicators: GDP, Employment, inflation and international trade and providing an outlook of the economy for years ahead was developed.
Furthermore, an economic intelligence report analysing inequality in South Africa as well as the interventions to reduce the levels of inequality was developed. This was a comparative study with Brazil, which had the highest inequality by 1994 similar to South Africa. The report shows that while Brazil has over the years managed to reduce the inequality, the South Africa’ situation has worsened over the years.
Economic Policy and Planning
Gauteng Manufacturing Survey and the Ekandustria Adjacent Land Business Case were conducted. The Survey was conducted in-house with the support from Executive Management. The Suikerbosrand Nature Reserve Turnaround Strategy was also developed.
The strategy aimed at enhancing its current activities that consist of four elements, namely, Eco tourism, cultural heritage, water ways and camping. The strategy also seeks to introduce additional activities that will encourage people to spend more money and bed nights at Suikerbosrand in order to improve demand for service offerings and ensuring sustainability of the facility. The most fundamental element of the strategy is the review of the current governance structure which is very complicated and serves as a barrier to unlocking the growth and development of Suikerbosrand.
The Ga-Rankuwa Hotel School Infrastructure roll-out plan was developed. This is aimed at regenerating the school to global standards.
The plan identifies a list of infrastructure required for the school to be modelled as the best in terms of hospitality skills development. It has been used as a guide for procuring the machinery and equipment for the school.
The Cooperative Strategy of 2009 was reviewed. It was done to measure the impact of interventions by government in the cooperatives sector with the view to shape the plans as per the needs of the sector. The review makes recommendations that if adhered to can improve the performance of the cooperatives and increase the impact of the interventions by government institutions.
The establishment of research chairs, internal capacity of experienced researchers and policy developers from the graduate trainee programme enabled the Department to achieve set targets.
GAUTENG DEPARTMENT OF ECONOMIC DEVELOPMENTPERFORMANCE OF PROGRAMMES AGAINST THE APPROVED PLANS
SECT
ION 04
62 GAUTENG DEPARTMENT OF ECONOMIC DEVELOPMENT | ANNUAL REPORT 2012/13
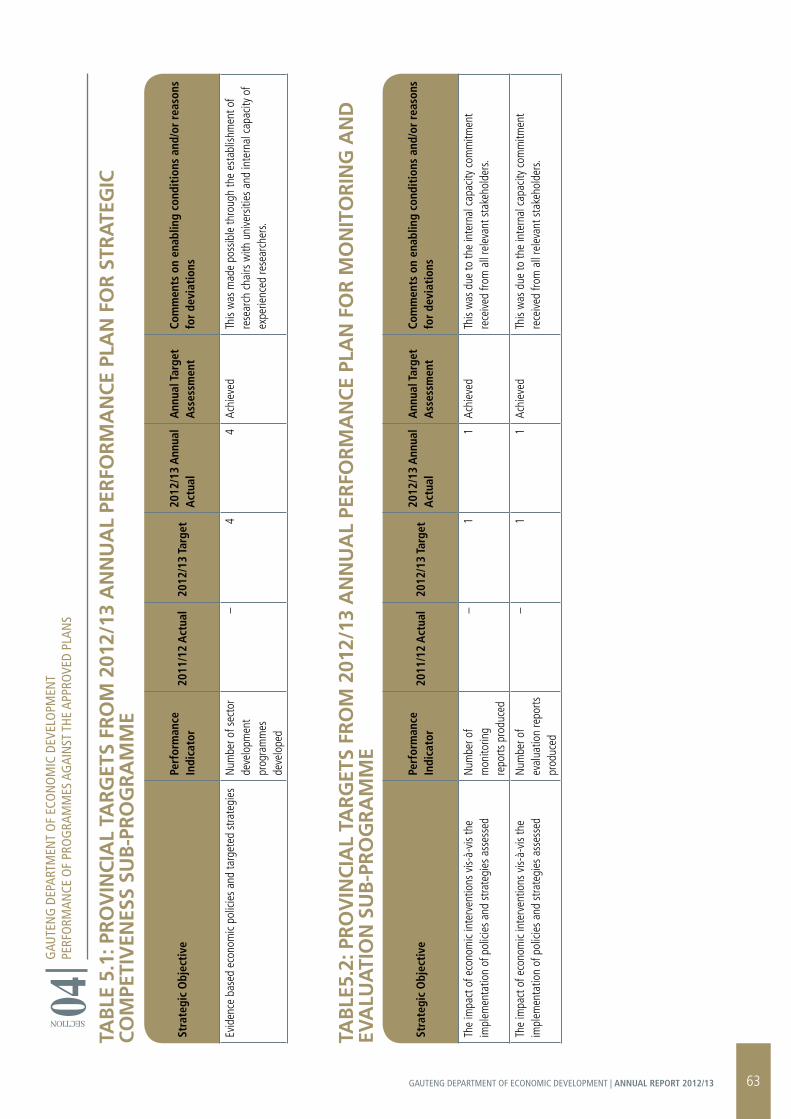
TAB
LE5.
2: P
rO
VIN
CIA
L TA
rG
ETS
FrO
M 2
012/
13 A
NN
UA
L PE
rFO
rM
AN
CE
PLA
N F
Or
MO
NIT
Or
ING
AN
D
EVA
LUA
TIO
N S
UB
-Pr
OG
rA
MM
E
Stra
tegi
c O
bjec
tive
Perf
orm
ance
In
dica
tor
2011
/12
Act
ual
2012
/13
Targ
et20
12/1
3 A
nnua
l A
ctua
lA
nnua
l Tar
get
Ass
essm
ent
Com
men
ts o
n en
ablin
g co
ndit
ions
and
/or
reas
ons
for
devi
atio
ns
The
impa
ct o
f eco
nom
ic in
terv
entio
ns v
is-à-
vis
the
impl
emen
tatio
n of
pol
icies
and
stra
tegi
es a
sses
sed
Num
ber o
f m
onito
ring
repo
rts p
rodu
ced
–1
1Ac
hiev
edTh
is w
as d
ue to
the
inte
rnal
cap
acity
com
mitm
ent
rece
ived
from
all
rele
vant
sta
keho
lder
s.
The
impa
ct o
f eco
nom
ic in
terv
entio
ns v
is-à-
vis
the
impl
emen
tatio
n of
pol
icies
and
stra
tegi
es a
sses
sed
Num
ber o
f ev
alua
tion
repo
rts
prod
uced
–1
1Ac
hiev
edTh
is w
as d
ue to
the
inte
rnal
cap
acity
com
mitm
ent
rece
ived
from
all
rele
vant
sta
keho
lder
s.
TAB
LE 5
.1: P
rO
VIN
CIA
L TA
rG
ETS
FrO
M 2
012/
13 A
NN
UA
L PE
rFO
rM
AN
CE
PLA
N F
Or
STr
ATE
GIC
C
OM
PETI
VEN
ESS
SUB
-Pr
OG
rA
MM
E
GAU
TEN
G D
EPAR
TMEN
T O
F EC
ON
OM
IC D
EVEL
OPM
ENT
PERF
ORM
ANCE
OF
PRO
GRA
MM
ES A
GAI
NST
THE
APP
ROVE
D PL
ANS
Stra
tegi
c O
bjec
tive
Perf
orm
ance
In
dica
tor
2011
/12
Act
ual
2012
/13
Targ
et20
12/1
3 A
nnua
l A
ctua
lA
nnua
l Tar
get
Ass
essm
ent
Com
men
ts o
n en
ablin
g co
ndit
ions
and
/or
reas
ons
for
devi
atio
ns
Evid
ence
bas
ed e
cono
mic
polic
ies
and
targ
eted
stra
tegi
esN
umbe
r of s
ecto
r de
velo
pmen
t pr
ogra
mm
es
deve
lope
d
–4
4Ac
hiev
edTh
is w
as m
ade
poss
ible
thro
ugh
the
esta
blish
men
t of
rese
arch
cha
irs w
ith u
nive
rsiti
es a
nd in
tern
al c
apac
ity o
f ex
perie
nced
rese
arch
ers.
SECTION 04GAUTENG DEPARTMENT OF ECONOMIC DEVELOPMENTPERFORMANCE OF PROGRAMMES AGAINST THE APPROVED PLANS
63GAUTENG DEPARTMENT OF ECONOMIC DEVELOPMENT | ANNUAL REPORT 2012/13
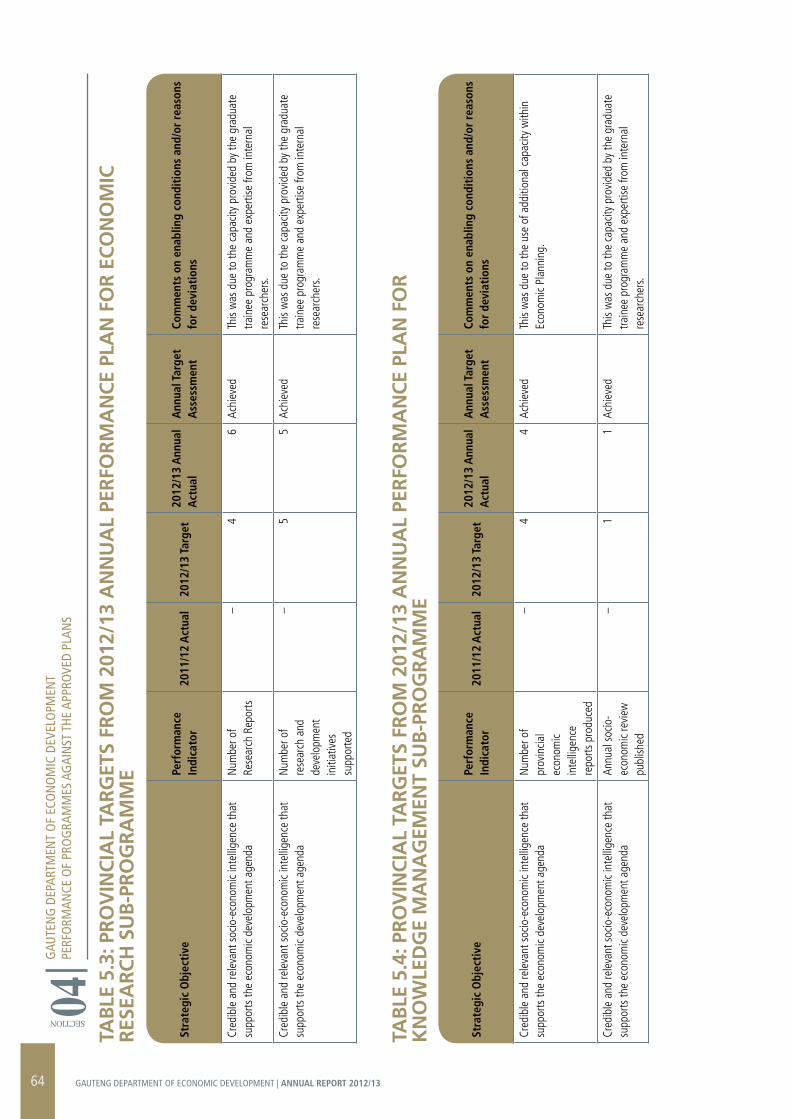
TAB
LE 5
.3: P
rO
VIN
CIA
L TA
rG
ETS
FrO
M 2
012/
13 A
NN
UA
L PE
rFO
rM
AN
CE
PLA
N F
Or
EC
ON
OM
IC
rES
EAr
CH
SU
B-P
rO
Gr
AM
ME
TAB
LE 5
.4: P
rO
VIN
CIA
L TA
rG
ETS
FrO
M 2
012/
13 A
NN
UA
L PE
rFO
rM
AN
CE
PLA
N F
Or
K
NO
WLE
DG
E M
AN
AG
EMEN
T SU
B-P
rO
Gr
AM
ME
GAU
TEN
G D
EPAR
TMEN
T O
F EC
ON
OM
IC D
EVEL
OPM
ENT
PERF
ORM
ANCE
OF
PRO
GRA
MM
ES A
GAI
NST
THE
APP
ROVE
D PL
ANS
SECTION 04
Stra
tegi
c O
bjec
tive
Perf
orm
ance
In
dica
tor
2011
/12
Act
ual
2012
/13
Targ
et20
12/1
3 A
nnua
l A
ctua
lA
nnua
l Tar
get
Ass
essm
ent
Com
men
ts o
n en
ablin
g co
ndit
ions
and
/or
reas
ons
for
devi
atio
ns
Cred
ible
and
rele
vant
soc
io-e
cono
mic
inte
llige
nce
that
su
ppor
ts th
e ec
onom
ic de
velo
pmen
t age
nda
Num
ber o
f Re
sear
ch R
epor
ts
–4
6Ac
hiev
edTh
is w
as d
ue to
the
capa
city
prov
ided
by
the
grad
uate
tra
inee
pro
gram
me
and
expe
rtise
from
inte
rnal
re
sear
cher
s.
Cred
ible
and
rele
vant
soc
io-e
cono
mic
inte
llige
nce
that
su
ppor
ts th
e ec
onom
ic de
velo
pmen
t age
nda
Num
ber o
f re
sear
ch a
nd
deve
lopm
ent
initi
ativ
es
supp
orte
d
–5
5Ac
hiev
edTh
is w
as d
ue to
the
capa
city
prov
ided
by
the
grad
uate
tra
inee
pro
gram
me
and
expe
rtise
from
inte
rnal
re
sear
cher
s.
Stra
tegi
c O
bjec
tive
Perf
orm
ance
In
dica
tor
2011
/12
Act
ual
2012
/13
Targ
et20
12/1
3 A
nnua
l A
ctua
lA
nnua
l Tar
get
Ass
essm
ent
Com
men
ts o
n en
ablin
g co
ndit
ions
and
/or
reas
ons
for
devi
atio
ns
Cred
ible
and
rele
vant
soc
io-e
cono
mic
inte
llige
nce
that
su
ppor
ts th
e ec
onom
ic de
velo
pmen
t age
nda
Num
ber o
f pr
ovin
cial
econ
omic
inte
llige
nce
repo
rts p
rodu
ced
–4
4Ac
hiev
edTh
is w
as d
ue to
the
use
of a
dditi
onal
cap
acity
with
in
Econ
omic
Plan
ning
.
Cred
ible
and
rele
vant
soc
io-e
cono
mic
inte
llige
nce
that
su
ppor
ts th
e ec
onom
ic de
velo
pmen
t age
nda
Annu
al s
ocio
-ec
onom
ic re
view
pu
blish
ed
–1
1Ac
hiev
edTh
is w
as d
ue to
the
capa
city
prov
ided
by
the
grad
uate
tra
inee
pro
gram
me
and
expe
rtise
from
inte
rnal
re
sear
cher
s.
64 GAUTENG DEPARTMENT OF ECONOMIC DEVELOPMENT | ANNUAL REPORT 2012/13
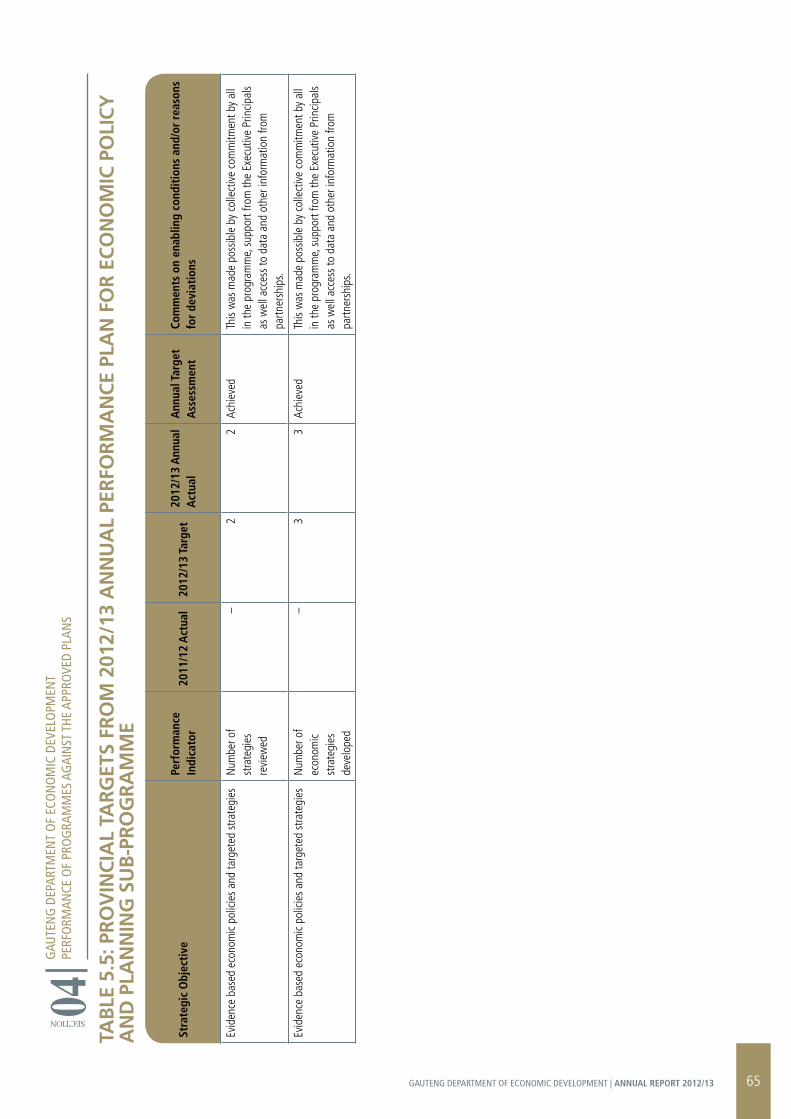
Stra
tegi
c O
bjec
tive
Perf
orm
ance
In
dica
tor
2011
/12
Act
ual
2012
/13
Targ
et20
12/1
3 A
nnua
l A
ctua
lA
nnua
l Tar
get
Ass
essm
ent
Com
men
ts o
n en
ablin
g co
ndit
ions
and
/or
reas
ons
for
devi
atio
ns
Evid
ence
bas
ed e
cono
mic
polic
ies
and
targ
eted
stra
tegi
esN
umbe
r of
stra
tegi
es
revi
ewed
–2
2Ac
hiev
edTh
is w
as m
ade
poss
ible
by
colle
ctiv
e co
mm
itmen
t by
all
in th
e pr
ogra
mm
e, s
uppo
rt fro
m th
e Ex
ecut
ive
Prin
cipal
s as
wel
l acc
ess
to d
ata
and
othe
r inf
orm
atio
n fro
m
partn
ersh
ips.
Evid
ence
bas
ed e
cono
mic
polic
ies
and
targ
eted
stra
tegi
esN
umbe
r of
econ
omic
stra
tegi
es
deve
lope
d
–3
3Ac
hiev
edTh
is w
as m
ade
poss
ible
by
colle
ctiv
e co
mm
itmen
t by
all
in th
e pr
ogra
mm
e, s
uppo
rt fro
m th
e Ex
ecut
ive
Prin
cipal
s as
wel
l acc
ess
to d
ata
and
othe
r inf
orm
atio
n fro
m
partn
ersh
ips.
TAB
LE 5
.5: P
rO
VIN
CIA
L TA
rG
ETS
FrO
M 2
012/
13 A
NN
UA
L PE
rFO
rM
AN
CE
PLA
N F
Or
EC
ON
OM
IC P
OLI
CY
A
ND
PLA
NN
ING
SU
B-P
rO
Gr
AM
ME
SECTION 04G
AUTE
NG
DEP
ARTM
ENT
OF
ECO
NO
MIC
DEV
ELO
PMEN
TPE
RFO
RMAN
CE O
F PR
OG
RAM
MES
AG
AIN
ST T
HE A
PPRO
VED
PLAN
S
65GAUTENG DEPARTMENT OF ECONOMIC DEVELOPMENT | ANNUAL REPORT 2012/13

66 GAUTENG DEPARTMENT OF ECONOMIC DEVELOPMENT | ANNUAL REPORT 2012/13
SECT
ION 05
GAUTENG DEPARTMENT OF ECONOMIC DEVELOPMENT | VOTE 3
ANNUAL FINANCIAL STATEMENTSFOR THE YEAR ENDED 31 MARCH 2013
67GAUTENG DEPARTMENT OF ECONOMIC DEVELOPMENT | ANNUAL REPORT 2012/13
TABLE OF CONTENTS
GAUTENG DEPARTMENT OF ECONOMIC DEVELOPMENT | VOTE 3ANNUAL FINANCIAL STATEMENTS FOR THE YEAR ENDED 31 MARCH 2013
SECT
ION 05
REPORT OF THE AUDIT COMMITTEE
REPORT OF THE ACCOUNTING OFFICER
REPORT OF THE AUDITOR-GENERAL
APPROPRIATION STATEMENT
NOTES TO THE APPROPRIATION STATEMENT
STATEMENT OF FINANCIAL PERFORMANCE
STATEMENT OF FINANCIAL POSITION
STATEMENT OF CHANGES IN NET ASSETS
CASH FLOW STATEMENT
ACCOUNTING POLICIES
NOTES TO THE ANNUAL FINANCIAL STATEMENTS
DISCLOSURES NOTES TO THE ANNUAL FINANCIAL STATEMENTS
ANNEXURES
69
71
78
80
94
96
97
98
99
100
104
113
122
68 GAUTENG DEPARTMENT OF ECONOMIC DEVELOPMENT | ANNUAL REPORT 2012/13

GAUTENG PrOVINCIAL GOVErNMENTRepoRt of the Audit Committee – ClusteR 1
Department of Economic Development
We are pleased to present our report for the financial year ended 31 March 2013.
The Audit Committee consists of the external members listed hereunder and is required to meet a minimum of at least two times per annum as per provisions of the Public Finance Management Act (PFMA). In terms of the approved Terms of Reference (GPG Audit Committee Charter), five meetings were held during the current year, i.e. three meetings for Quarterly Performance Reporting (financial and non-financial) and two meetings to review and discuss the Annual Financial Statements and the Auditor-General Report.
Name of Member Number of Meetings Attended Vishnu Naicker (Chairperson) 05Tshidi Molala (Member) 05Wayne Poggenpoel (Member) 04
Audit Committee Member Mr. Wayne Poggenpoel did not attend one meeting since he was appointed after the first quarter reporting period. However, all meetings were quorate.
Executive Members:
in terms of the GPG Audit Committee Charter, the Officials listed hereunder are obliged to attend the meetings of the Audit Committee:
Compulsory Attendees Number of Meetings Attended
Khulu Radebe (Head of Department) 01Albert Chanee (Acting Head of Department) 04 Preston Mabena (Chief Financial Officer) 04Oupa Tshule (Chief Risk Officer) 03
During the financial year under review, Mr. Khulu Radebe has been put on suspension as the Head of Department and Mr. Albert Chanee was appointed to act in the capacity of the Head of Department. Therefore, the Audit Committee is satisfied that the Department adhered to the provisions of the GPG Audit Committee Charter.
The Members of the Audit Committee met with the Senior Management of the Department and Internal Audit, collectively to address risks and challenges facing the Departments. A number of in-committee meetings were held to address control weaknesses and conflicts with the Department.
Audit Committee Responsibility
The Audit Committee reports that it has complied with its responsibilities arising from section 38 (1) (a) of the PFMA and Treasury Regulation 3.1.13.
The Audit Committee also reports that it has adopted appropriate formal terms of reference as its Audit Committee Charter, has regulated its affairs in compliance with this Charter and has discharged all its responsibilities as contained therein.
The Effectiveness of Internal Control
The Audit Committee has observed that the overall control environment has continued to improve during the year under review. However, there are still some concerns with the level of internal controls within the Department where evidence of lapses of effective monitoring and enforcement by Management were observed.
During the year under review, several deficiencies in the system of internal control and deviations were reported by the Auditor-General South Africa. In certain instances, the matters reported previously have not been fully and satisfactorily addressed.
The Quality of in Year Management and Monthly / Quarterly Reports Submitted in Terms of the PFMA and the Division of Revenue Act
The Audit Committee is satisfied with the content and quality of monthly and quarterly reports prepared and issued by the Accounting Officer of the Department during the year under review, in compliance with the statutory reporting framework.
Evaluation of Financial Statements
The Audit Committee has:
reviewed and discussed the audited Annual Financial Statements to be included in the Annual Report, with the Auditor-General and the Accounting Officer; reviewed the Auditor-General’s management report and
management’s response thereto; reviewed the Department’s compliance with legal and regulatory
provisions; and reviewed significant adjustments resulting from the audit.
The Audit Committee concurs with and accepts the Auditor-General’s conclusions on the Annual Financial Statements, and is of the opinion that the audited Annual Financial Statements be accepted and read together with the report of the Auditor-General.
Internal Audit
The Audit Committee is satisfied that the Internal Audit plans addresses a clear alignment with the major risks, adequate information systems coverage, a good balance between different categories of audits, i.e. risk-based, mandatory, performance and follow-up audits and involvement and support by Management of the plans.
The Audit Committee has noted considerable improvement in the communication between the Executive Management, the Auditor-General and the Internal Audit Function, which has strengthened the Corporate Governance initiatives.
GAUTENG DEPARTMENT OF ECONOMIC DEVELOPMENT | VOTE 3ANNUAL FINANCIAL STATEMENTS FOR THE YEAR ENDED 31 MARCH 2013
SECT
ION 05
69GAUTENG DEPARTMENT OF ECONOMIC DEVELOPMENT | ANNUAL REPORT 2012/13
The Audit Committee wishes to stress that in order for the Internal Audit Function to operate at optimal level as expected by the Audit Committee, it requires more capacity and skills.
Risk Management
Progress on Departmental risk management was reported to the Audit Committee on a quarterly basis. The Audit Committee is satisfied that the actual management of risk is receiving attention, although there are areas that still require improvement. Management must take responsibility for the managing of risk in their respective areas of work. This area will be closely monitored during 2013/14 financial year.
Forensic Investigations
The Audit Committee is not satisfied that the forensic investigations are properly reported with age-analysis of all reported issues indicated. Details of results in respect of investigations conducted as a result of calls through the fraud hotline were not provided to the Committee.
One-on-One Meetings with the Accounting Officer
The Audit Committee has met with the Accounting Officer for the Department to address unresolved issues.
One-on-One Meetings with the Executive Authority
The Audit Committee has met with the Executive Authority for the Department to apprise him on the performance of the Department.
Evaluation of the Annual Report
The Committee has: - Reviewed and discussed the financial statements; Reviewed the accounting policies and practices; and Reviewed and discussed with Management the annual financial
statements financial statements and performance information included in the Annual Report.
The monitoring of the Department’s performance is a key function of Executive Management of the Department. The Committee has no direct line responsibility for the Department’s performance measurement. However, the Committee has ensured, principally through the internal audit function, that the systems of performance measurement and reporting, as well as the systems of internal control that underpin the performance management framework of the Department, remain robust and are addressed routinely in the audit plans. The Committee also obtained assurance from Management and Internal Audit that the Department’s performance management system adequately and effectively report appropriate and relevant information.
The Committee has accepted the responsibility to ensure adequate reporting on performance information and the policies and that the procedures are of a standard acceptable to the Department.
The Committee’s mandate and charter has been altered to acknowledge this responsibility. The Committee has taken note of the Performance Information Report which compares the actual performance of the organization against the approved Business Plan for the financial year, the strategic objectives, key performance indicators and targets set.
Conclusion
The Committee concurs in general with the conclusions of the Auditor-General on the Annual Financial Report of the Department for the year ended 31st March 2013.
The Committee has once again taken note of the concerns of the Auditor-General and accepts that there is further room for improvement in the areas of human resources, procurement and contract management. As in previous years the Audit Committee will ensure that the internal audit plan addresses these issues and will monitor the implementation of the recommendations contained in the Auditor-General’s Report. The Committee will continue to monitor and ensure that the internal control environment for the public entities under the jurisdiction of this department is improved upon.
I would like to thank all members of the Committee for their contribution and the professional way in which meetings were conducted. The Committee wishes to express its sincere appreciation to the Department for the progress made this year and the manner in which the Department engaged with the Committee.
Mr Vishnu Naicker,Chairperson of the Audit Committee31 July 2013
GAUTENG DEPARTMENT OF ECONOMIC DEVELOPMENT | VOTE 3ANNUAL FINANCIAL STATEMENTS FOR THE YEAR ENDED 31 MARCH 2013
SECT
ION 05
70 GAUTENG DEPARTMENT OF ECONOMIC DEVELOPMENT | ANNUAL REPORT 2012/13
GAUTENG DEPARTMENT OF ECONOMIC DEVELOPMENT | VOTE 3ANNUAL FINANCIAL STATEMENTS FOR THE YEAR ENDED 31 MARCH 2013
SECT
ION 05
rEPOrT OF THE ACCOUNTING OFFICErfoR the YeAR eNded 31 mARCh 2013
1. General Review of the State of Financial Affairs
The Department has managed to spend 99.9% of R874.4m allocated budget for 2012/13 and the actual expenditure is R873.4m
The year to-date achievement was realised due to proper spending in accordance with planned priorities and prescribed needs, monthly spending analysis drawn-up; and continuous interaction with programmes/sub-programmes on their spending trends and how to address identified discrepancies which results in over and under spending of the allocated budget.
On average, the Department reduced 30 days payment of suppliers to 14,5 days. The achievement realised is due to internal daily payment monitoring tracking system, which was put in place and centralisation of invoice submission. The Provincial Treasury was constantly engaged to ensure that there were sufficient funds to enable payment of suppliers within the prescribed days.
Important Policy Decisions and Strategic Issues Facing the Department
During the period under review, the national sphere of government developed the National Development Plan, NDP (2030), which the long-term plan for the country to create employment, growth the economy inclusively and reduce poverty. At a provincial level, the NDP it aligns with the G2055.
During the period under review, the national sphere of government developed the National Development Plan, NDP (2030), which the long-term plan for the country to create employment, growth the economy inclusively and reduce poverty. At a provincial level, the NDP it aligns with the G2055.
Through the Gauteng Employment, Growth and Development Strategy, which is the short-term plan (2009-2014 and aligned to the National Growth Path), Gauteng Department of Economic Development (GDED) is mandated to achieve the following objectives: Job creation; Development of skills for the economy in line with the Gauteng
Master Skills Plan; Enterprise development; Export and investment promotion; and Reducing the costs of doing business through productive
infrastructure planning and facilitating the ease of doing business in partnership with other sector departments, agencies and the private sector.
It must be said that GDED was faced with the challenges to achieve many of these objectives of given its resource limitations as well as well as unfavourable economic climate.
Furthermore, the department has only been in existence for the past four year, and as a result, the current period of mandate was dominated by policy and strategy development in all the functional areas thus laying the foundation for implementation in the next term (2014-2019).
In review of the current mandate (GEGDS 2009-2014), GDED will ensure that its resources are prioritized for the implementation of the plans in the new mandate and increase its capacity to deliver thus why there was a need to restructure the department and Gauteng Growth and Development Agency with the view of strengthening the human resources capacity to deliver on the mandate.
In the period under review, number of supporting strategies aligned to the NGP, the Industrial Policy Action Plans (IPAPs 1-3) and Gauteng Industrial Policy Framework (GIPF) were reviewed and developed, this include among others, the following:
The Gauteng as an Africa’s Gateway for Trade and Investment Strategy: The strategy is meant to enhance Gauteng as the factory for manufacturing goods and provide services for Southern Africa and the rest of the African continent. It is a value proposition for Gauteng to becomes a platform for investors who want to produce for the bigger African markets, given its advantage in productive infrastructure, financial hub, centre for Research and Development. This strategy is a guide to Gauteng Growth and Development Agency on its trade and investment promotional activities in the African continent. This strategy will be merged with the overall Gauteng Trade and Investment Strategy for submission to EXCO in Financial Year 2013/14.
The National Electric Vehicle Strategy 2011: The Department reviewed this strategy for the Department of Trade and Industry on the critical success factors that must be in place for this sub-sector to take off. Using benchmarking with countries that had a success with the manufacturing and intake of electric vehicles, GDED made recommendation to the dti to address issues ranging from funding, charging infrastructure and pricing to offset the challenges that hamper the manufacturing of electric vehicle in South Africa.
The Cooperative Strategy of 2009: The Department has also reviewed the strategy to measure the impact of interventions by government in the cooperatives sector with the view to shape the plans as per the needs of the sector. The review makes recommendations that if adhered to can improve the performance of the cooperatives and increase the impact of the interventions by government institutions.
Significant Events that have Taken Place During the Year
The department has formed partnership with industry to train 60 Foundry students for over three years (20 students per year) at Ekurhuleni East College, in Kwa-Thema. Furthermore, GDED has developed the Furniture skills development and SMME Incubation programme. Through the programme, 50 students have been enlisted with Furntech, and it runs for a period of three years, with 2012/13 for training at the remainder two years for SMME incubation, which will result in the creation of 10 Cooperatives comprising those trained.
71GAUTENG DEPARTMENT OF ECONOMIC DEVELOPMENT | ANNUAL REPORT 2012/13

The cooperatives will benefit from Gauteng procurement on furniture as well as the bigger national market estimated at R10 billion.
Major Projects that have Taken Place During the Year
In the 2012/13 financial year, the Department planned and implemented projects aimed to achieve the Gauteng Employment Growth and Development Strategy’s (GEGDS) goals and objectives that are linked to leadership and accountability of Provincial Outcome 4 on “Decent employment through inclusive growth”. The Department embarked on various major projects focusing and aligned to its five year strategic planning objectives:
The Youth Employment Programme in which six Township Enterprise Hubs (TEH) were expected to be established in indentified economically depressed regions of the province could not be realised due to budgetary constraints. The construction of Winterveldt hub in North East of Tshwane is underway and will be used as a pilot and lessons learned be applied in the rolling out of other planned hub in the new financial year. On enterprise development, the joint partnership with the City of Joburg and its entities such as the City Power and Joburg Water has assisted in increased number of SMMEs and Cooperatives to be financially and non-financially supported. The financial assistance was through the Captive fund, Micro-Finance, partnership with MODE for the Disabled Entrepreneurs, Mafisa Fund and Co-operative Assistance Programme (CAP).
The strategic economic infrastructure initiatives aimed at stimulating employment-led growth and development were undertaken in the year under review. This entails freight and logistics projects such as the completion of Tambo Springs, Vaal Logistic and West Rand Inland hubs which were later in the year handed over to the Department of Roads and Transport after their feasibility studies are finalised. The completion of the Jewellery Manufacturing Precinct is at an advance stage and intense negotiations are underway with relevant stakeholders to finalise the acquisition of earmarked land and to align with the Special Economic Zone (SEZ) requirements that could change the original plan. A suitable pool of candidates with required scares skills were recruited for the JMP training in the year under review.
The Department is engaged in implementation of re-industrialisation projects aimed at supporting the growth of labour-intensive industries and this was undertaken in joint partnership with Nissan SA and the grant agreement which was approved by DBSA jobs fund for the establishment of the Nissan Simulator and training academy. In the same breath, the FORD T6 SMME Incubator managed to increase its employment numbers in the year under review due to demand expansion, which led to high production capacity requirement.
The Youth Skills and Technical Training Programme which will increase required skilled personnel in the automotive industry, has recruited a significant number of youth to be trained as artisans in the field of boilers makers, welders, fitters and diesel mechanics.
In building an innovative and knowledge based economy that will drive competitiveness and economic growth, the Department committed resources for the development of the Gauteng Smart City which the culminated into years of planning and thinking about the positioning of the Gauteng Province as the globally competitive city region in the ICT sector. It is destined to play an important role in the socio economic development in the Province and global economy.
It is also appropriate to state that one of the distinct advantages of the Gauteng Smart City is that it has been endorsed as one of the 10 Special Economic Zone by the dti, a factor that will make it particularly attractive to foreign direct investment. This will encourage new firm formation and stands to be a positive foreign exchange injector into the economy.
The Department has managed to show great stride in the development of the Master Blue Print that will encompass the real estate commercial viability, industrial and service design models. The major challenges to pull this project off the ground are in the form of delays in land transfers and infrastructure designed that are still to be being finalised.
The implementation of the Provincial Green Strategic Programme, which came as, an intervention to support economic growth and development emerged with Industrial Waste Exchange (IWEX), medical waste treatment pilot, gas infrastructure and waste to energy plant projects. These pivotal green economy projects could not take-off due to delays in the appointment of a Green PMO and procurement process, which commenced late in the third quarter of the year under review.
On the tourism front, the Department continues to drive support and development of the sector through the engagement with the North West Province on the transfer of the Ga-Rankuwa Hotel School to Gauteng. Currently the project transfer guideline protocol has been established.
Other achievements could be attributed to the finalisation of the Visitor Information Centre (VIC) at OR Tambo International Airport in collaboration with Airport Company South Africa (ACSA) and National Department of Tourism; preliminary work that has begin for the upgrading of Maropeng Interpretation Centre; and the Working on Fire, the management of Dinokeng and the fossils casting project which has recorded increased job creation figures at the end of March 2013.
GAUTENG DEPARTMENT OF ECONOMIC DEVELOPMENT | VOTE 3ANNUAL FINANCIAL STATEMENTS FOR THE YEAR ENDED 31 MARCH 2013
SECT
ION 05
72 GAUTENG DEPARTMENT OF ECONOMIC DEVELOPMENT | ANNUAL REPORT 2012/13
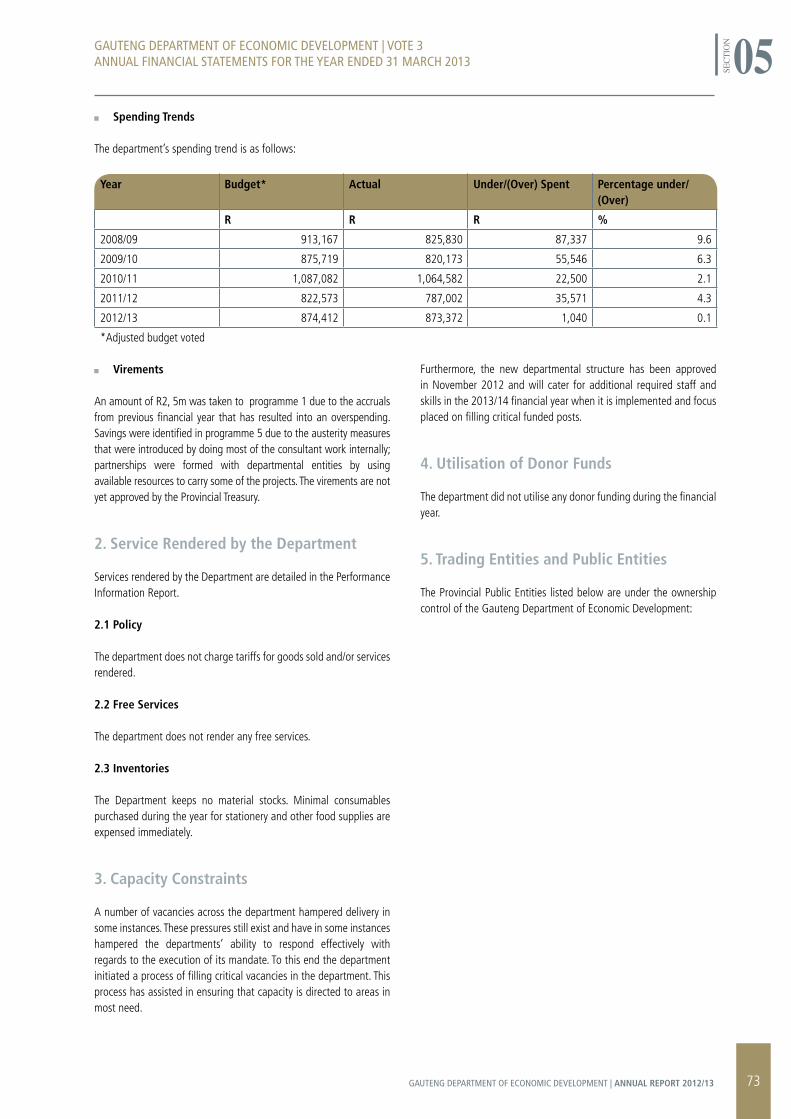
GAUTENG DEPARTMENT OF ECONOMIC DEVELOPMENT | VOTE 3ANNUAL FINANCIAL STATEMENTS FOR THE YEAR ENDED 31 MARCH 2013
SECT
ION 05
Spending Trends
The department’s spending trend is as follows:
Year Budget* Actual Under/(Over) Spent Percentage under/(Over)
R R R %
2008/09 913,167 825,830 87,337 9.6
2009/10 875,719 820,173 55,546 6.3
2010/11 1,087,082 1,064,582 22,500 2.1
2011/12 822,573 787,002 35,571 4.3
2012/13 874,412 873,372 1,040 0.1
*Adjusted budget voted
Virements
An amount of R2, 5m was taken to programme 1 due to the accruals from previous financial year that has resulted into an overspending. Savings were identified in programme 5 due to the austerity measures that were introduced by doing most of the consultant work internally; partnerships were formed with departmental entities by using available resources to carry some of the projects. The virements are not yet approved by the Provincial Treasury.
2. Service Rendered by the Department
Services rendered by the Department are detailed in the Performance Information Report.
2.1 Policy
The department does not charge tariffs for goods sold and/or services rendered.
2.2 Free Services
The department does not render any free services.
2.3 Inventories
The Department keeps no material stocks. Minimal consumables purchased during the year for stationery and other food supplies are expensed immediately.
3. Capacity Constraints
A number of vacancies across the department hampered delivery in some instances. These pressures still exist and have in some instances hampered the departments’ ability to respond effectively with regards to the execution of its mandate. To this end the department initiated a process of filling critical vacancies in the department. This process has assisted in ensuring that capacity is directed to areas in most need.
Furthermore, the new departmental structure has been approved in November 2012 and will cater for additional required staff and skills in the 2013/14 financial year when it is implemented and focus placed on filling critical funded posts.
4. Utilisation of Donor Funds
The department did not utilise any donor funding during the financial year.
5. Trading Entities and Public Entities
The Provincial Public Entities listed below are under the ownership control of the Gauteng Department of Economic Development:
73GAUTENG DEPARTMENT OF ECONOMIC DEVELOPMENT | ANNUAL REPORT 2012/13
GAUTENG DEPARTMENT OF ECONOMIC DEVELOPMENT | VOTE 3ANNUAL FINANCIAL STATEMENTS FOR THE YEAR ENDED 31 MARCH 2013
SECT
ION 05
Nature of Entity Name of Entity
Development Finance Gauteng Economic Development Agency
Gauteng Enterprise Propeller
Blue IQ Investment Holdings (Pty) Ltd
Regulatory Body Gauteng Gambling Board
Gauteng Tourism Authority
Gauteng Liquor Board
Special Project Cradle of Humankind World Heritage Site
Dinokeng
Each of these entities prepares their individual Annual Report.
6. Organisations to whom Transfer Payments have been made
The transfer payments made towards entities are reflected in the department’s Annual Financial Statements in Annexures 1E and 1F. These entities are:
Gauteng Economic Development Agency Gauteng Tourism Agency Gauteng Enterprise Propeller Gauteng Liquor Board Blue IQ Investment Holding (Pty) Ltd Cradle of Humankind World Heritage Site Dinokeng
7. Public Private Partnerships (PPP)
The Department has entered into a partnership with the National Tooling Initiative for the establishment of the Gauteng Tooling Initiative (GTI), which will be housed in a section 21 vehicle. The purpose of the GTI is to revive and enhance the Tool, Die and MoUlding industry, which is vital for the manufacturing sector in the province.
8. Corporate Governance Arrangements
With a view to improve and strengthen corporate processes pertaining to strategic planning, financial management and performance oversight, the following processes were initiated:
The DED and its agencies complies strictly with the National Treasury Framework on strategic planning A framework on financial planning and management has been
finalised. The Monitoring and Evaluation Framework for the DED Group
has been finalised.
The approach to monitoring financial and non-financial performance has been strengthened. An internal planning calendar has been designed to assist the
department with day to day operations including compliance and regulatory obligations.
The Departmental Acquisition Council (DAC) has been operational throughout the year and regular meetings are held. Treasury regulations and practice notes were enforced.
8.1 Risk Management Approach
The Department’s risk management approach is aligned with the Provincial Treasury’s Risk Management Framework. A Strategic Risk Assessment workshop, attended by the Department’s Senior Management, was convened during the year under review. Action plans to address risks identified were developed and implemented.
The Risk and Audit Management Committee (RAMC) facilitates the resolution of audit findings raised by Auditor-General (AG) and Gauteng Audit Services (GAS). All audit matters raised by AG in the 2011/12 audits were addressed by the Department. The Department also addressed audit matters raised by GAS. The RAMC comprises heads of all business units. The committee met monthly, with members providing progress reports.
8.2 Fraud Prevention Policies
A fraud risk assessment workshop was held to update the Fraud Prevention Plan during the year under review. Progress on implementation of fraud prevention strategies was tracked throughout the year.
The Department is a member of the Provincial Anti-Corruption Co-ordinating Committee. Matters referred by the National Anti-Corruption Hotline are duly investigated.
74 GAUTENG DEPARTMENT OF ECONOMIC DEVELOPMENT | ANNUAL REPORT 2012/13
GAUTENG DEPARTMENT OF ECONOMIC DEVELOPMENT | VOTE 3ANNUAL FINANCIAL STATEMENTS FOR THE YEAR ENDED 31 MARCH 2013
SECT
ION 05
8.3 Audit Cluster Committee
The audit committee serves a cluster of departments and provides oversight mainly on audit, performance and financial management issues. During the year under review, the committee also focused on departments’ risk management activities, with specific reference to the top ten risks. The audit committee approved the department’s 3 year rolling Internal Audit Plan.
8.4 Internal Audit
Gauteng Audit Services (GAS), a unit within the Department of Finance provides internal audit services to the Department and other provincial departments. GAS provides assurance on the Department’s effectiveness and efficiency of internal controls, governance and risk management processes. During the year under review, GAS completed its Annual Audit Plan.
The Risk and Audit Management Committee (RAMC) was instrumental in facilitating the implementation of GAS recommendations emanating from audits performed in the last three years. Significant progress has been achieved in this regard. GAS is invited to all RAMC meetings in the 2012/13 financial year. They will present new findings and assist with the tracking thereof.
8.5 Processes to Minimise Conflict of Interest
In line with the requirements of the Department of Public Service and Administration, the Department requires its senior managers to disclose their financial interests on an annual basis. All SMS members have signed the financial disclosure forms and all Departmental Acquisition Committee (DAC) members sign the declaration of interest register in every meeting.
8.6 Implementation of the Code of Conduct
The code of conduct is available and forms part of the employment contract for each staff member.
8.7 Safety, Health and Environmental Issues
The Department has nominated OHS representatives. The Department follows the OHS Act guidelines as well as the OHS policy. OHS is reported on as a regular feature in the departmental internal newsletter.
9. Discontinued Activities/Activities to be Discontinued
The Gauteng Provincial Government (GPG) concern about the issue of the high level of unemployment, especially among the youth led to the development of the Gauteng Youth Employment Strategy (GYES). This strategy aimed among others to establish a graduate entrepreneurship development programme, better known as Y-Age, with the aim of recruiting 125000 young people in Gauteng to be trained, mentored, funded and assisted to run their own businesses.
Through this programme, we hope that these entrepreneurs will then return to their various businesses, where they will each endeavour to employ three to five people. The ultimate goal is to create 1 million jobs. At a time when the programme was discontinued, i.e. in quarter one of 2012/13, the programme supported 6 400 entrepreneurs. The programme was discontinued and mainstreamed into GEP entrepreneurial programme.
10. New/Proposed Activities
On the strategic economic infrastructure that is required to stimulate employment-led economic growth and development, the Department will continue to increase its efforts in the development of projects that will serve as the bedrock for business and economic development. Investment in network and connectivity infrastructure such as the NASREC Development Precinct SEZ will continue. Furthermore, phase 1 of the Diepsloot Industrial Park will be completed; this will include the Incubation Centre and Practical University.
The Department will re-industrialise the provincial economy through to support the growth of labour intensive industries. The focus will be on addressing skills gaps and creating jobs through partnerships with industries to deliver skills for the economy in labour intensive sectors such as the automotive, furniture, fashion, metal fabrication and mineral beneficiation sectors. The Nissan Simulator will be finalised and an investment in the expansion of the mini-factories at the Automotive Supplier Park will be concluded.
To building an innovative and knowledge-based economy that will drive provincial competitiveness and economic growth, the Department plans to continue with finalization of four enterprise development business cases for the NASREC Precinct and the establishment of BPO centres, mobile walk-in centres and ICT centres at the NASREC Precinct. The programmes of the Innovation Hub and the Gauteng Innovation Exchange Programme will continue with an enhanced focus on addressing skills gaps and creating jobs through partnerships with industries and the skills development sector to deliver skills for the economy in the ICT and knowledge sector.
The provincial Green economy interventions that supports sustainable economic growth and interventions will form part of the green agenda which will incubate companies via the Climate Innovation Centre, identifying and mentoring bio-science innovation through the Gauteng Accelerator Programme (GAP), completing and commissioning the Sedibeng and West Rand Bio-digestor projects and the Ekurhuleni Waste to Energy project.
In support and development of the tourism sector, which is aimed to drive competitiveness and economic growth, the Department will continue with the merger of the Gauteng Tourism Agency, Cradle of Humankind World Heritage Site and Dinokeng projects into a “single unified tourism entity”. The purpose of the merger is to improve the drive to position Gauteng as a tourism destination for business and leisure, growing the visitor economy and effectively managing destination Gauteng in a responsible and sustainable manner.
75GAUTENG DEPARTMENT OF ECONOMIC DEVELOPMENT | ANNUAL REPORT 2012/13

Other specific project will entail finalising the transfer and operating model for the Ga-Rankuwa Hotel School, the refurbishment of ramparts and interior office space at Constitution Hill, and continuing with the infrastructure upgrade at the Cradle of Humankind World Heritage Site. In terms of developing Constitution Hill Precinct as a lead project in city renewal and for the establishment of a struggle history route, the Nelson Mandela Centre of Memory will be developed as an anchor attraction to enhance the visitor experience to Constitution Hill.
The SMME and Cooperatives support and development for sustainable employment creation will continue to be the focus of the Department. This will be realised through the strengthening partnerships with the private sector and government agencies in order to create SMME incubators that will be employment creators and aggressively drive greater involvement of SMMEs and cooperatives in the economy.
The Department will continue with the implementation of the Youth Employment Strategy through the establishment of Township Enterprise Hubs, the refurbishment of old township industrial sites, the roll-out of the Gauteng Youth Placement Programme and the focused establishment of youth business.
The Gauteng Growth and Development Agency (GGDA) will ensure that emphasis is placed on positioning Gauteng-based companies to benefit from procurement in strategic economic infrastructure projects such as rail-road construction, independent power production and manufacture of rolling stock. The highlight will be to position Gauteng as the gateway to benefit from bilateral and regional trade agreements through implementation of the Gauteng Investment Centre (One-Stop Shop).
The Department will be finalising and implementing of the Automated Liquor Licensing System (ALLS), intensifying liquor abuse education and awareness programmes, and increasing the number of inspections in order to enforce compliance. In terms of governance, the Department will conduct a review of the current funding model and finalise the migration of shebeen permits into the ambit of the Gauteng Liquor Act of 2003.
In terms of Gauteng Gambling Board (GGB) mandate to regulate and control gambling, the Department will pay particular attention to a review of the impact of the proposed withholding tax on punters winnings and contribute to the deliberations on the proposed amendments to the Taxation Laws Amendment Bill.
11. Asset Management
The Department continues to improve on asset management, and some of the achievements amongst others include:
The verification of assets has been done for the Department and Gauteng Liquor Board; and Asset register updated according to the asset verification,
acquisitions and disposal.
12. Inventories
All inventory opening and closing balances, together with movements for the year are reflected in the Annexure on Inventory
13. Events after the Reporting Date
None
14. Performance Information Management
In the year under review, the Department continued to use an electronic Monitoring and Evaluation Reporting Management System (MERMS) to enhance collection of performance information and job creation data on monthly and quarterly basis from programmes/sub-programmes and agencies; and provincial sector departments respectively.
The departmental Monitoring, Evaluation and Reporting Management System (MERMS) forms part of the broader Business Intelligence tool. Currently the system is accessible to all through an executable file that is loaded to departmental M&E Officials; the system is also available on the web that is outside the GPG network. Reporting champion and their respective managers can now access the MERMS from anywhere in the world for reporting purposes.
The Department has developed the Automated Liquor Licensing System (ALLS) will be finalising and implementing it fully with the intention to creating efficiencies and for application to be done on-line. The system will also allow the Department to create a backup on the existing and new files that will be change from hard copies and be uploaded into an electronic system.
15. SCOPA Resolutions
The Department has responded to each of the SCOPA resolutions as well as AG findings and we have improved the internal control environment as per these recommendations. We continue to engage the Committee and the AG on internal control matters.
GAUTENG DEPARTMENT OF ECONOMIC DEVELOPMENT | VOTE 3ANNUAL FINANCIAL STATEMENTS FOR THE YEAR ENDED 31 MARCH 2013
SECT
ION 05
76 GAUTENG DEPARTMENT OF ECONOMIC DEVELOPMENT | ANNUAL REPORT 2012/13
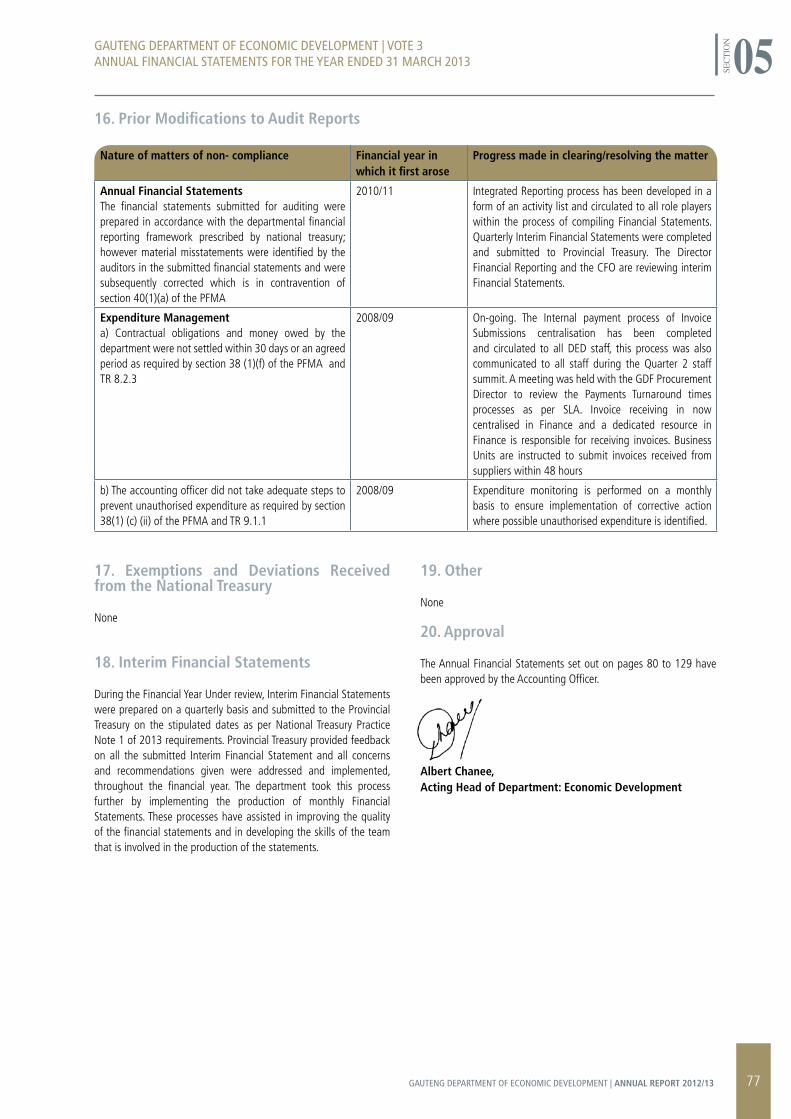
GAUTENG DEPARTMENT OF ECONOMIC DEVELOPMENT | VOTE 3ANNUAL FINANCIAL STATEMENTS FOR THE YEAR ENDED 31 MARCH 2013
SECT
ION 05
16. Prior Modifications to Audit Reports
Nature of matters of non- compliance Financial year in which it first arose
Progress made in clearing/resolving the matter
Annual Financial Statements The financial statements submitted for auditing were prepared in accordance with the departmental financial reporting framework prescribed by national treasury; however material misstatements were identified by the auditors in the submitted financial statements and were subsequently corrected which is in contravention of section 40(1)(a) of the PFMA
2010/11 Integrated Reporting process has been developed in a form of an activity list and circulated to all role players within the process of compiling Financial Statements. Quarterly Interim Financial Statements were completed and submitted to Provincial Treasury. The Director Financial Reporting and the CFO are reviewing interim Financial Statements.
Expenditure Management a) Contractual obligations and money owed by the department were not settled within 30 days or an agreed period as required by section 38 (1)(f) of the PFMA and TR 8.2.3
2008/09 On-going. The Internal payment process of Invoice Submissions centralisation has been completed and circulated to all DED staff, this process was also communicated to all staff during the Quarter 2 staff summit. A meeting was held with the GDF Procurement Director to review the Payments Turnaround times processes as per SLA. Invoice receiving in now centralised in Finance and a dedicated resource in Finance is responsible for receiving invoices. Business Units are instructed to submit invoices received from suppliers within 48 hours
b) The accounting officer did not take adequate steps to prevent unauthorised expenditure as required by section 38(1) (c) (ii) of the PFMA and TR 9.1.1
2008/09 Expenditure monitoring is performed on a monthly basis to ensure implementation of corrective action where possible unauthorised expenditure is identified.
17. Exemptions and Deviations Received from the National Treasury
None
18. Interim Financial Statements
During the Financial Year Under review, Interim Financial Statements were prepared on a quarterly basis and submitted to the Provincial Treasury on the stipulated dates as per National Treasury Practice Note 1 of 2013 requirements. Provincial Treasury provided feedback on all the submitted Interim Financial Statement and all concerns and recommendations given were addressed and implemented, throughout the financial year. The department took this process further by implementing the production of monthly Financial Statements. These processes have assisted in improving the quality of the financial statements and in developing the skills of the team that is involved in the production of the statements.
19. Other
None
20. Approval
The Annual Financial Statements set out on pages 80 to 129 have been approved by the Accounting Officer.
Albert Chanee, Acting Head of Department: Economic Development
77GAUTENG DEPARTMENT OF ECONOMIC DEVELOPMENT | ANNUAL REPORT 2012/13

rEPOrT OF THE AUDITOr-GENErAL TO THE GAUTENG PrOVINCIAL LEGISLATUrE ON VOTE NO. 3: GAUTENG DEPArTMENT OF ECONOMIC DEVELOPMENT
Report on the Financial Statements
Introduction
1. I have audited the financial statements of the Gauteng Department of Economic Development set out on pages 80 to 129 which comprise the appropriation statement, the statement of financial position as at 31 March 2013, the statement of financial performance, statement of changes in net assets and the cash flow statement for the year then ended, and the notes, comprising a summary of significant accounting policies and other explanatory information.
Accounting Officer’s Responsibility for the Financial Statements
2. The accounting officer is responsible for the preparation of these financial statements in accordance with the Departmental Financial Reporting Framework prescribed by the National Treasury and the requirements of the Public Finance Management Act,1999 (Act No.1 of 1999) (PFMA), and for such internal control as the accounting officer determines is necessary to enable the preparation of financial statements that are free from material misstatement, whether due to fraud or error.
Auditor-General’s Responsibility
3. My responsibility is to express an opinion on these financial statements based on my audit. I conducted my audit in accordance with the Public Audit Act of South Africa, 2004 (Act No. 25 of 2004) (PAA), the General Notice issued in terms thereof and International Standards on Auditing. Those standards require that I comply with ethical requirements and plan and perform the audit to obtain reasonable assurance about whether the financial statements are free from material misstatement.
4. An audit involves performing procedures to obtain audit evidence about the amounts and disclosures in the financial statements. The procedures selected depend on the auditor’s judgement, including the assessment of the risks of material misstatement of the financial statements, whether due to fraud or error. In making those risk assessments, the auditor considers internal control relevant to the entity’s preparation and fair presentation of the financial statements in order to design audit procedures that are appropriate in the circumstances, but not for the purpose of expressing an opinion on the effectiveness of the entity’s internal control. An audit also includes evaluating the appropriateness of accounting policies used and the reasonableness of accounting estimates made by management, as well as evaluating the overall presentation of the financial statements.
5. I believe that the audit evidence I have obtained is sufficient and appropriate to provide a basis for my audit opinion.
Opinion
6. In my opinion, the financial statements present fairly, in all material respects, the financial position of the Gauteng Department of Economic Development as at 31 March 2013,
and its financial performance and cash flows for the year then ended in accordance with the Departmental Financial Reporting Framework prescribed by the National Treasury and the requirements of PFMA.
Emphasis of Matter
7. I draw attention to the matter below. My opinion is not modified in respect of this matter.
Accruals
8. The department incurred accruals amounting to R25 410 000 for the financial year ended 31 March 2013 This amount, in turn, exceeds the voted funds to be surrendered of R1 040 000 as per the statement of financial performance by R24 730 000. The amount of R24 730 000 would have resulted in unauthorised expenditure if the balance was settled at year end.
Additional Matters
9. I draw attention to the matters below. My opinion is not modified in respect of these matters.
Unaudited Supplementary Schedules
10. The supplementary information set out on pages 122 to 129 do not form part of the financial statements and is presented as additional information. I have not audited these schedules and, accordingly, I do not express an opinion thereon.
Financial Reporting Framework
11. The financial reporting framework prescribed by the National Treasury and applied by the Gauteng Department of Economic Development is a compliance framework. The wording of my opinion on a compliance framework should reflect that the financial statements have been prepared in accordance with this framework and not that they “present fairly”. Section 20(2)(a) of the PAA, however, requires me to express an opinion on the fair presentation of the financial statements. The wording of my opinion therefore reflects this requirement.
Report on Other Legal and Regulatory Requirements
12. In accordance with the PAA and the General Notice issued in terms thereof, I report the following findings relevant to performance against predetermined objectives, compliance with laws and regulations and internal control, but not for the purpose of expressing an opinion.
Predetermined Objectives
13. I performed procedures to obtain evidence about the usefulness and reliability of the information in the annual performance report as set out on pages 24 to 65 of the annual report.
14. The reported performance against predetermined objectives was evaluated against the overall criteria of usefulness and reliability. The usefulness of information in the annual performance report relates to whether it is presented in accordance with the National Treasury’s annual reporting principles and whether the reported performance is consistent with the planned objectives. The usefulness of information further relates to whether indicators and targets are measurable (i.e. well defined, verifiable, specific, measurable and time bound) and relevant as required by the National Treasury Framework for managing programme performance information.
GAUTENG DEPARTMENT OF ECONOMIC DEVELOPMENT | VOTE 3ANNUAL FINANCIAL STATEMENTS FOR THE YEAR ENDED 31 MARCH 2013
SECT
ION 05
78 GAUTENG DEPARTMENT OF ECONOMIC DEVELOPMENT | ANNUAL REPORT 2012/13
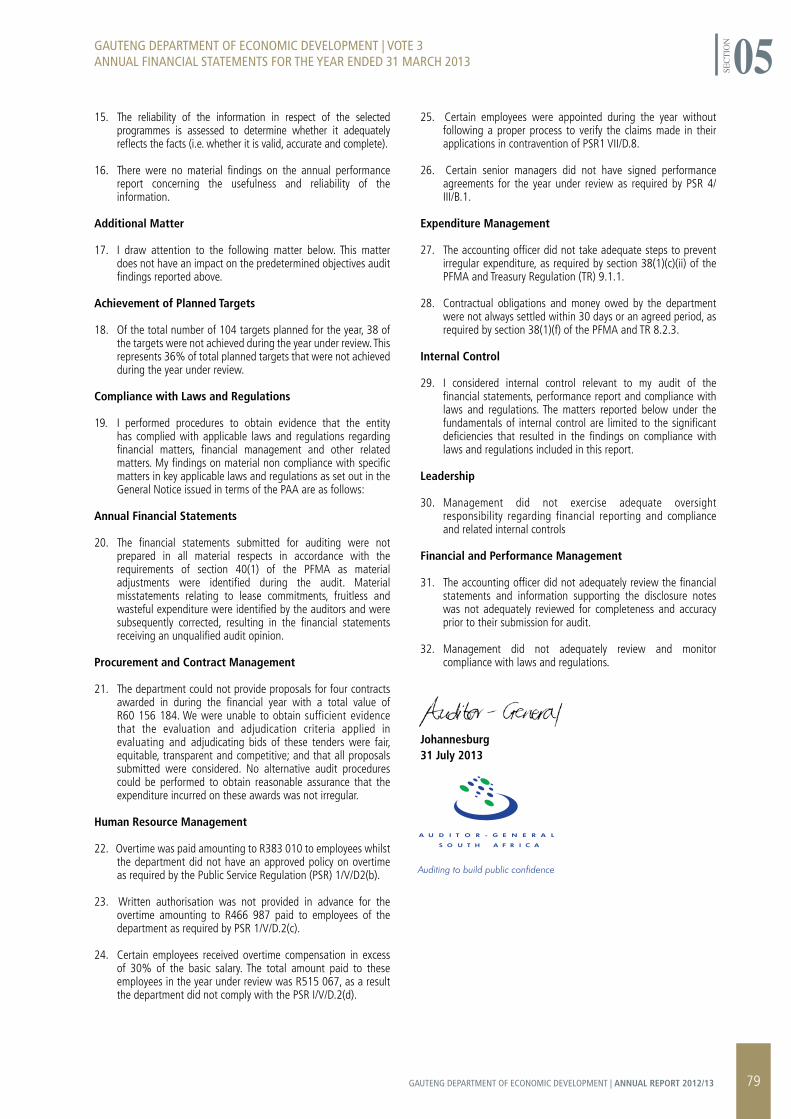
15. The reliability of the information in respect of the selected programmes is assessed to determine whether it adequately reflects the facts (i.e. whether it is valid, accurate and complete).
16. There were no material findings on the annual performance report concerning the usefulness and reliability of the information.
Additional Matter
17. I draw attention to the following matter below. This matter does not have an impact on the predetermined objectives audit findings reported above.
Achievement of Planned Targets
18. Of the total number of 104 targets planned for the year, 38 of the targets were not achieved during the year under review. This represents 36% of total planned targets that were not achieved during the year under review.
Compliance with Laws and Regulations
19. I performed procedures to obtain evidence that the entity has complied with applicable laws and regulations regarding financial matters, financial management and other related matters. My findings on material non compliance with specific matters in key applicable laws and regulations as set out in the General Notice issued in terms of the PAA are as follows:
Annual Financial Statements
20. The financial statements submitted for auditing were not prepared in all material respects in accordance with the requirements of section 40(1) of the PFMA as material adjustments were identified during the audit. Material misstatements relating to lease commitments, fruitless and wasteful expenditure were identified by the auditors and were subsequently corrected, resulting in the financial statements receiving an unqualified audit opinion.
Procurement and Contract Management
21. The department could not provide proposals for four contracts awarded in during the financial year with a total value of R60 156 184. We were unable to obtain sufficient evidence that the evaluation and adjudication criteria applied in evaluating and adjudicating bids of these tenders were fair, equitable, transparent and competitive; and that all proposals submitted were considered. No alternative audit procedures could be performed to obtain reasonable assurance that the expenditure incurred on these awards was not irregular.
Human Resource Management
22. Overtime was paid amounting to R383 010 to employees whilst the department did not have an approved policy on overtime as required by the Public Service Regulation (PSR) 1/V/D2(b).
23. Written authorisation was not provided in advance for the overtime amounting to R466 987 paid to employees of the department as required by PSR 1/V/D.2(c).
24. Certain employees received overtime compensation in excess of 30% of the basic salary. The total amount paid to these employees in the year under review was R515 067, as a result the department did not comply with the PSR I/V/D.2(d).
25. Certain employees were appointed during the year without following a proper process to verify the claims made in their applications in contravention of PSR1 VII/D.8.
26. Certain senior managers did not have signed performance agreements for the year under review as required by PSR 4/III/B.1.
Expenditure Management
27. The accounting officer did not take adequate steps to prevent irregular expenditure, as required by section 38(1)(c)(ii) of the PFMA and Treasury Regulation (TR) 9.1.1.
28. Contractual obligations and money owed by the department were not always settled within 30 days or an agreed period, as required by section 38(1)(f) of the PFMA and TR 8.2.3.
Internal Control
29. I considered internal control relevant to my audit of the financial statements, performance report and compliance with laws and regulations. The matters reported below under the fundamentals of internal control are limited to the significant deficiencies that resulted in the findings on compliance with laws and regulations included in this report.
Leadership
30. Management did not exercise adequate oversight responsibility regarding financial reporting and compliance and related internal controls
Financial and Performance Management
31. The accounting officer did not adequately review the financial statements and information supporting the disclosure notes was not adequately reviewed for completeness and accuracy prior to their submission for audit.
32. Management did not adequately review and monitor compliance with laws and regulations.
Johannesburg31 July 2013
GAUTENG DEPARTMENT OF ECONOMIC DEVELOPMENT | VOTE 3ANNUAL FINANCIAL STATEMENTS FOR THE YEAR ENDED 31 MARCH 2013
SECT
ION 05
79GAUTENG DEPARTMENT OF ECONOMIC DEVELOPMENT | ANNUAL REPORT 2012/13
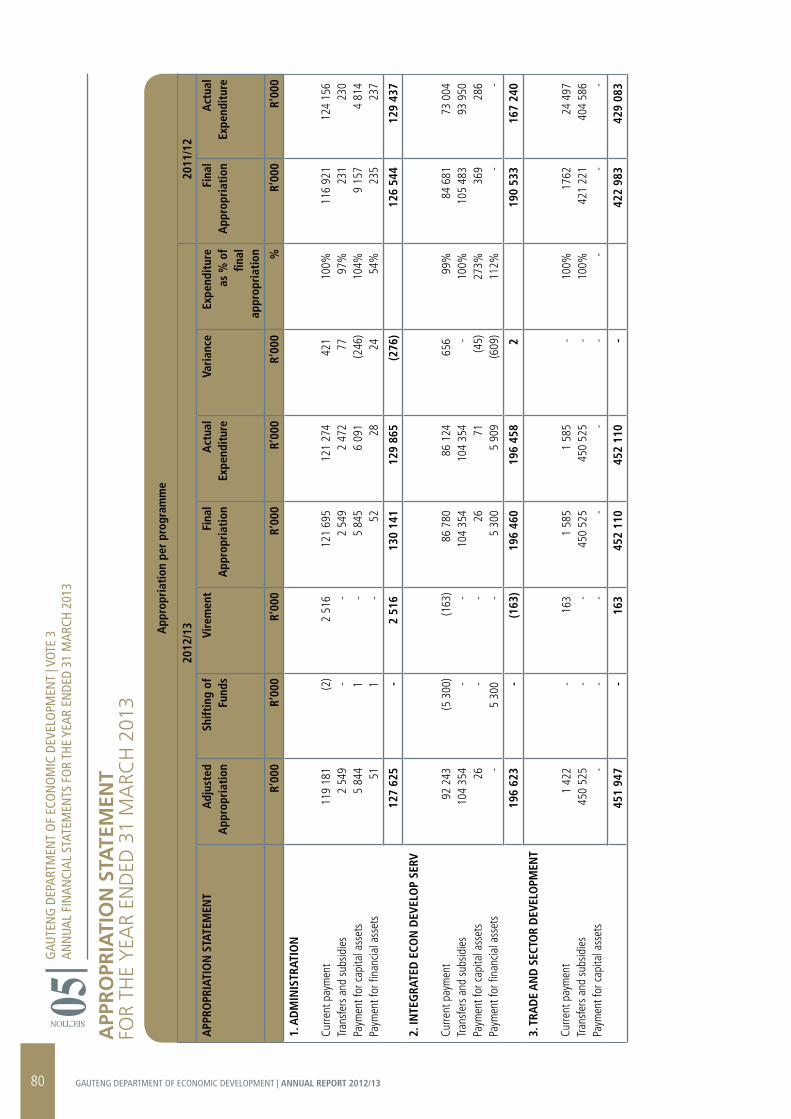
APP
rO
PrIA
TIO
N S
TATE
MEN
Tfo
R th
e Y
eAR
eNd
ed 3
1 m
ARC
h 2
013
2012
/13
2011
/12
APP
ROPR
IATI
ON
STA
TEM
ENT
Adj
uste
d A
ppro
pria
tion
Shift
ing
of
Fund
sVi
rem
ent
Fina
lA
ppro
pria
tion
Act
ual
Expe
ndit
ure
Vari
ance
Expe
ndit
ure
as %
of
final
ap
prop
riat
ion
Fina
lA
ppro
pria
tion
Act
ual
Expe
ndit
ure
R’00
0R’
000
R’00
0R’
000
R’00
0R’
000
%R’
000
R’00
0
1. A
DM
INIS
TRAT
ION
Curre
nt p
aym
ent
Tran
sfer
s an
d su
bsid
ies
Paym
ent f
or c
apita
l ass
ets
Paym
ent f
or fi
nanc
ial a
sset
s
2. IN
TEG
RATE
D E
CON
DEV
ELO
P SE
RV
Curre
nt p
aym
ent
Tran
sfer
s an
d su
bsid
ies
Paym
ent f
or c
apita
l ass
ets
Paym
ent f
or fi
nanc
ial a
sset
s
3. T
RAD
E A
ND
SEC
TOR
DEV
ELO
PMEN
T
Curre
nt p
aym
ent
Tran
sfer
s an
d su
bsid
ies
Paym
ent f
or c
apita
l ass
ets
119
181
2 54
95
844 51
(2) - 1 1
2 5
16- - -
121
695
2 54
95
845 52
121
274
2 47
26
091 28
421 77
(246
)24
100% 97
%10
4% 54%
116
921
231
9 15
723
5
124
156
230
4 81
423
7
127
625
-2
516
130
141
129
865
(276
)12
6 54
412
9 43
7
92 2
4310
4 35
4 26-
(5 3
00) - -
5 30
0
(163
) - - -
86 7
8010
4 35
4 265
300
86 1
2410
4 35
4 715
909
656 -
(45)
(609
)
99%
100%
273%
112%
84 6
8110
5 48
336
9 -
73 0
0493
950 28
6 -
196
623
-(1
63)
196
460
196
458
219
0 53
316
7 24
0
1 42
245
0 52
5 -
- - -
163 - -
1 58
545
0 52
5 -
1 58
545
0 52
5 -
- - -
100%
100%
-
1762
421
221 -
24 4
9740
4 58
6 -
451
947
-16
345
2 11
045
2 11
0-
422
983
429
083
GAU
TEN
G D
EPAR
TMEN
T O
F EC
ON
OM
IC D
EVEL
OPM
ENT
| VOT
E 3
ANN
UAL
FIN
ANCI
AL S
TATE
MEN
TS F
OR
THE
YEAR
EN
DED
31 M
ARCH
201
3
SECTION 05A
ppro
pria
tion
per
pro
gram
me
80 GAUTENG DEPARTMENT OF ECONOMIC DEVELOPMENT | ANNUAL REPORT 2012/13
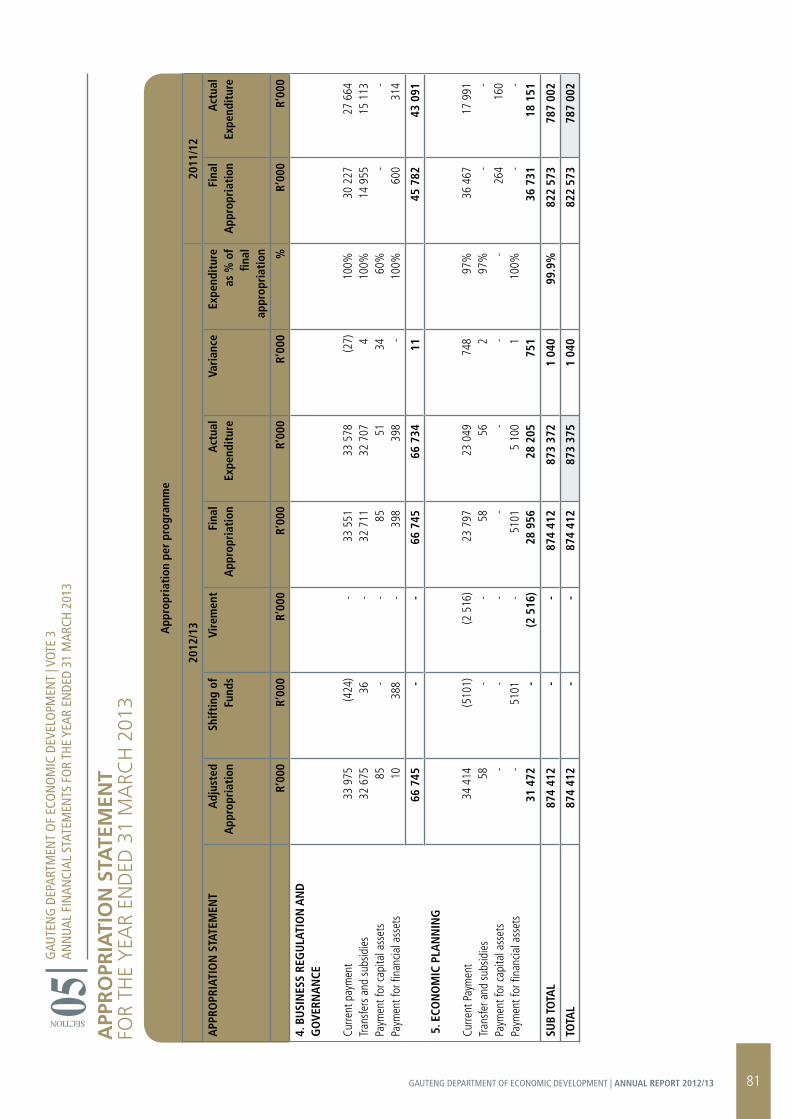
APP
rO
PrIA
TIO
N S
TATE
MEN
Tfo
R th
e Y
eAR
eNd
ed 3
1 m
ARC
h 2
013
2012
/13
2011
/12
APP
ROPR
IATI
ON
STA
TEM
ENT
Adj
uste
d A
ppro
pria
tion
Shift
ing
of
Fund
sVi
rem
ent
Fina
lA
ppro
pria
tion
Act
ual
Expe
ndit
ure
Vari
ance
Expe
ndit
ure
as %
of
final
ap
prop
riat
ion
Fina
lA
ppro
pria
tion
Act
ual
Expe
ndit
ure
R’00
0R’
000
R’00
0R’
000
R’00
0R’
000
%R’
000
R’00
0
4. B
USI
NES
S RE
GU
LATI
ON
AN
D
GO
VERN
AN
CE
Curre
nt p
aym
ent
Tran
sfer
s an
d su
bsid
ies
Paym
ent f
or c
apita
l ass
ets
Paym
ent f
or fi
nanc
ial a
sset
s
5. E
CON
OM
IC P
LAN
NIN
G
Curre
nt P
aym
ent
Tran
sfer
and
sub
sidie
sPa
ymen
t for
cap
ital a
sset
sPa
ymen
t for
fina
ncia
l ass
ets
33 9
7532
675 85 10
(424
)36
-38
8
- - - -
33 5
5132
711 85 398
33 5
7832
707 51 39
8
(27) 4 34-
100%
100% 60
%10
0%
30 2
2714
955
-60
0
27 6
6415
113
-31
4
66 7
45-
-66
745
66 7
3411
45 7
8243
091
34 4
14 58- -
31 4
72
(510
1) - -51
01-
(2 5
16) - - -
(2 5
16)
23 7
97 58-
5101
28 9
56
23 0
49 56-
5 10
028
205
748 2 - 1
751
97%
97% -
100%
36 4
67-
264 -
36 7
31
17 9
91-
160 -
18 1
51
SUB
TOTA
L87
4 41
2-
-87
4 41
287
3 37
21
040
99.9
%82
2 57
378
7 00
2
TOTA
L87
4 41
2-
-87
4 41
287
3 37
51
040
822
573
787
002
GAU
TEN
G D
EPAR
TMEN
T O
F EC
ON
OM
IC D
EVEL
OPM
ENT
| VOT
E 3
ANN
UAL
FIN
ANCI
AL S
TATE
MEN
TS F
OR
THE
YEAR
EN
DED
31 M
ARCH
201
3
SECTION 05A
ppro
pria
tion
per
pro
gram
me
81GAUTENG DEPARTMENT OF ECONOMIC DEVELOPMENT | ANNUAL REPORT 2012/13
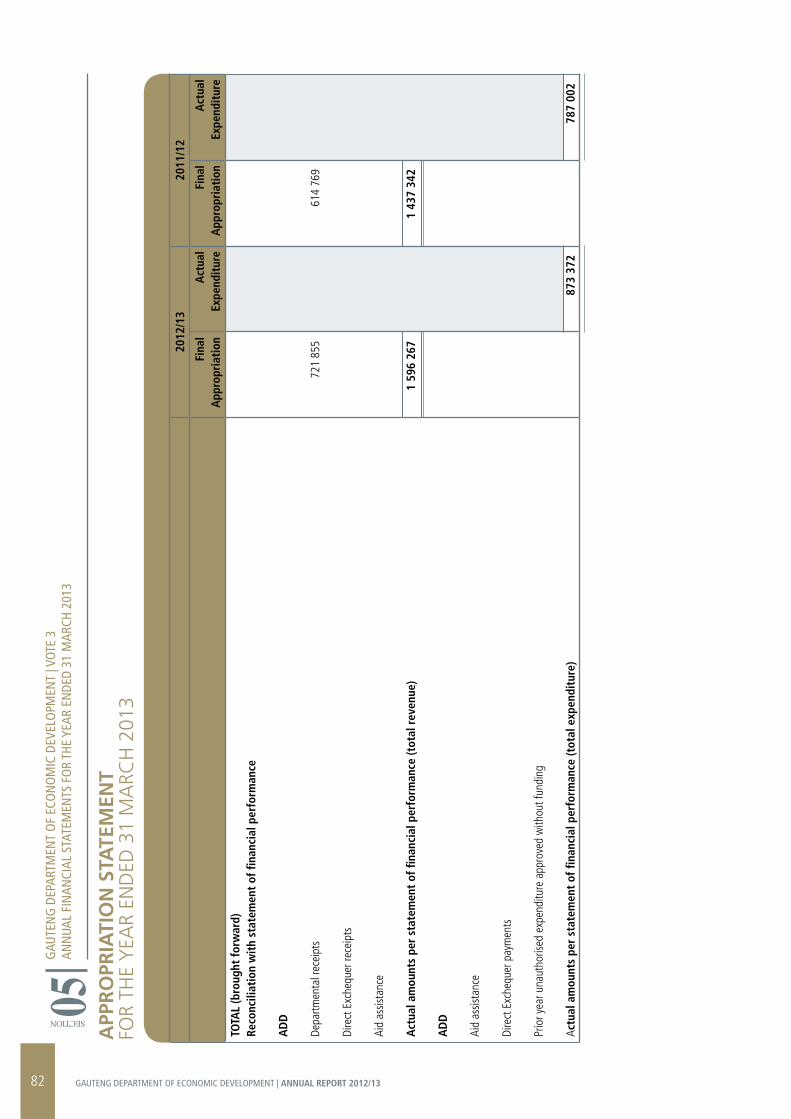
APP
rO
PrIA
TIO
N S
TATE
MEN
Tfo
R th
e Y
eAR
eNd
ed 3
1 m
ARC
h 2
013
GAU
TEN
G D
EPAR
TMEN
T O
F EC
ON
OM
IC D
EVEL
OPM
ENT
| VOT
E 3
ANN
UAL
FIN
ANCI
AL S
TATE
MEN
TS F
OR
THE
YEAR
EN
DED
31 M
ARCH
201
3
SECTION 05
2012
/13
2011
/12
Fina
lA
ppro
pria
tion
Act
ual
Expe
ndit
ure
Fina
lA
ppro
pria
tion
Act
ual
Expe
ndit
ure
TOTA
L (b
roug
ht fo
rwar
d)Re
conc
iliat
ion
wit
h st
atem
ent
of fi
nanc
ial p
erfo
rman
ce
AD
D
Depa
rtmen
tal r
ecei
pts
Dire
ct E
xche
quer
rece
ipts
Aid
assis
tanc
e
Act
ual a
mou
nts
per
stat
emen
t of
fina
ncia
l per
form
ance
(tot
al r
even
ue)
AD
D
Aid
assis
tanc
e
Dire
ct E
xche
quer
pay
men
ts
Prio
r yea
r una
utho
rised
exp
endi
ture
app
rove
d w
ithou
t fun
ding
Actu
al a
mou
nts
per
stat
emen
t of
fina
ncia
l per
form
ance
(tot
al e
xpen
ditu
re)
721
855
1 59
6 26
7
873
372
614
769
1 43
7 34
2
787
002
82 GAUTENG DEPARTMENT OF ECONOMIC DEVELOPMENT | ANNUAL REPORT 2012/13
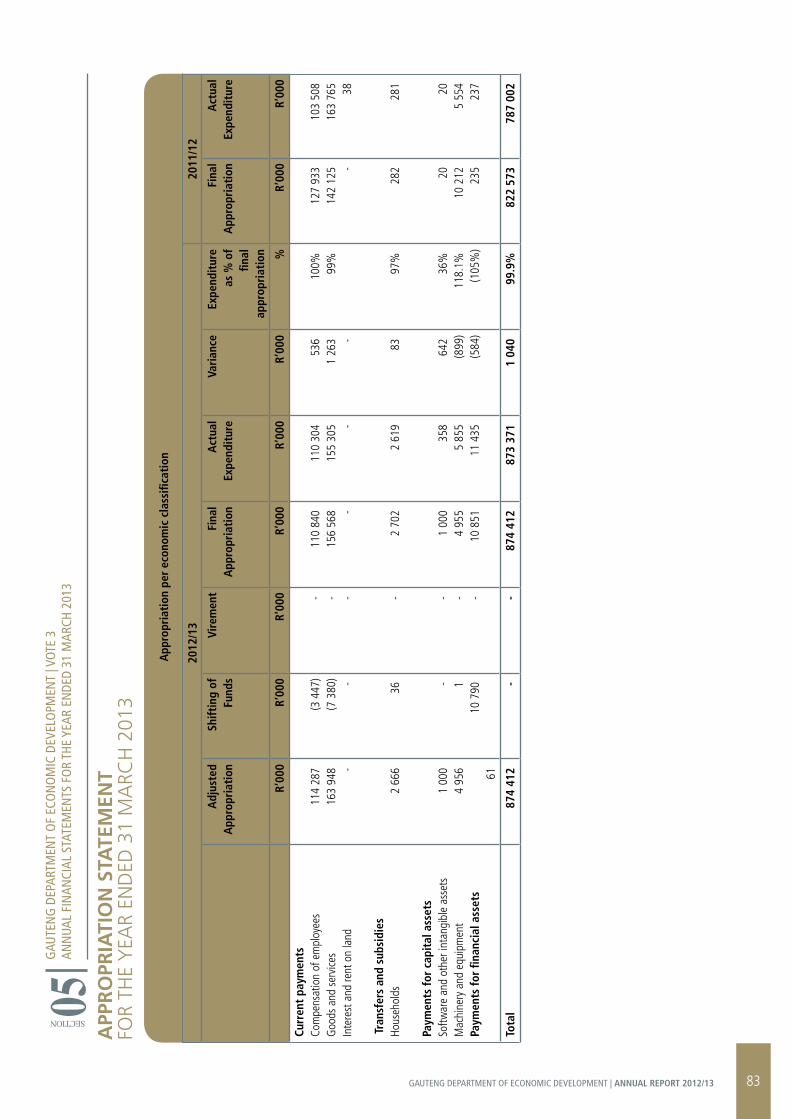
APP
rO
PrIA
TIO
N S
TATE
MEN
Tfo
R th
e Y
eAR
eNd
ed 3
1 m
ARC
h 2
013
GAU
TEN
G D
EPAR
TMEN
T O
F EC
ON
OM
IC D
EVEL
OPM
ENT
| VOT
E 3
ANN
UAL
FIN
ANCI
AL S
TATE
MEN
TS F
OR
THE
YEAR
EN
DED
31 M
ARCH
201
3
SECTION 05
2012
/13
2011
/12
Adj
uste
d A
ppro
pria
tion
Shift
ing
of
Fund
sVi
rem
ent
Fina
lA
ppro
pria
tion
Act
ual
Expe
ndit
ure
Vari
ance
Expe
ndit
ure
as %
of
final
ap
prop
riat
ion
Fina
lA
ppro
pria
tion
Act
ual
Expe
ndit
ure
R’00
0R’
000
R’00
0R’
000
R’00
0R’
000
%R’
000
R’00
0
Curr
ent
paym
ents
Com
pens
atio
n of
em
ploy
ees
Goo
ds a
nd s
ervi
ces
Inte
rest
and
rent
on
land
Tra
nsfe
rs a
nd s
ubsi
dies
Ho
useh
olds
Paym
ents
for
capi
tal a
sset
sSo
ftwar
e an
d ot
her i
ntan
gibl
e as
sets
Mac
hine
ry a
nd e
quip
men
tPa
ymen
ts fo
r fin
anci
al a
sset
s
114
287
163
948 -
2 66
6
1 00
04
956 61
(3 4
47)
(7 3
80) -
36
- 110
790
- - - - - - -
110
840
156
568 -
2 70
2
1 00
04
955
10 8
51
110
304
155
305 -
2 61
9
358
5 85
511
435
536
1 26
3 -
83 642
(899
)(5
84)
100% 99
%
97%
36%
118.
1%(1
05%
)
127
933
142
125 -
282 20
10 2
12 235
103
508
163
765 38 281 20
5 55
423
7
Tota
l87
4 41
2-
-87
4 41
287
3 37
11
040
99.9
%82
2 57
378
7 00
2
App
ropr
iati
on p
er e
cono
mic
cla
ssifi
cati
on
83GAUTENG DEPARTMENT OF ECONOMIC DEVELOPMENT | ANNUAL REPORT 2012/13
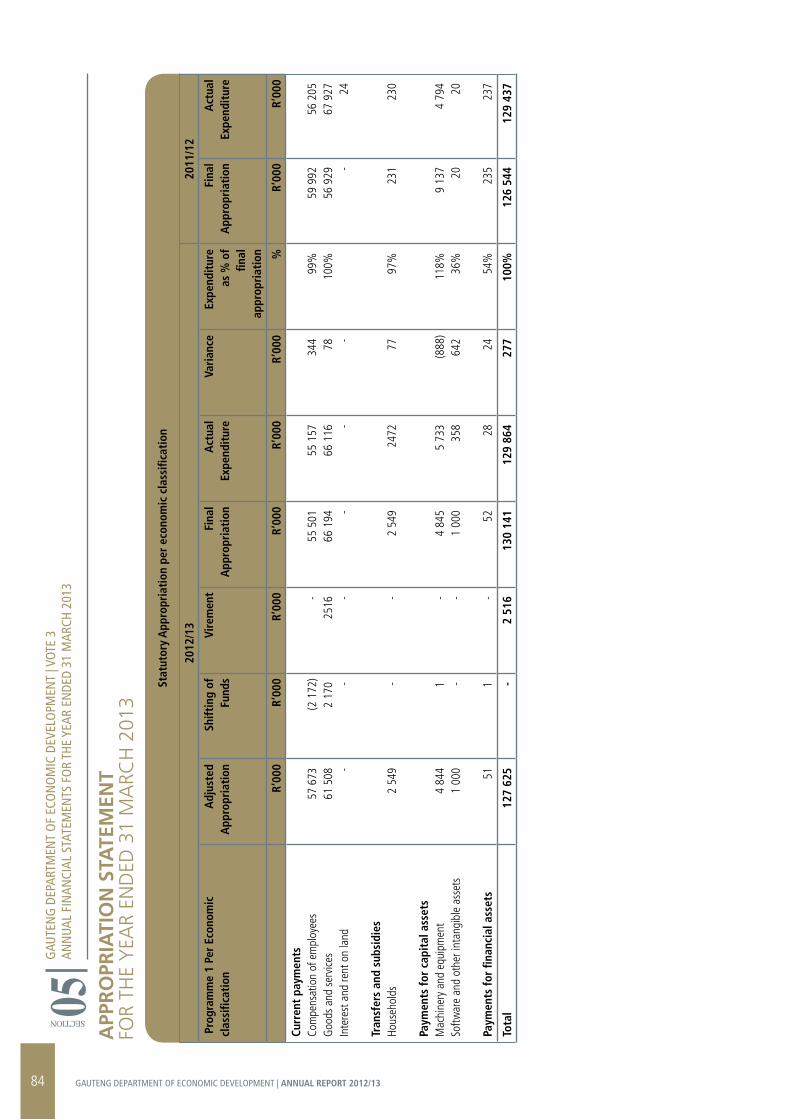
APP
rO
PrIA
TIO
N S
TATE
MEN
Tfo
R th
e Y
eAR
eNd
ed 3
1 m
ARC
h 2
013
2012
/13
2011
/12
Pro
gram
me
1 Pe
r Ec
onom
ic
clas
sific
atio
n
Adj
uste
d A
ppro
pria
tion
Shift
ing
of
Fund
sVi
rem
ent
Fina
lA
ppro
pria
tion
Act
ual
Expe
ndit
ure
Vari
ance
Expe
ndit
ure
as %
of
final
ap
prop
riat
ion
Fina
lA
ppro
pria
tion
Act
ual
Expe
ndit
ure
R’00
0R’
000
R’00
0R’
000
R’00
0R’
000
%R’
000
R’00
0
Curr
ent
paym
ents
Com
pens
atio
n of
em
ploy
ees
Goo
ds a
nd s
ervi
ces
Inte
rest
and
rent
on
land
Tran
sfer
s an
d su
bsid
ies
Ho
useh
olds
Paym
ents
for
capi
tal a
sset
sM
achi
nery
and
equ
ipm
ent
Softw
are
and
othe
r int
angi
ble
asse
ts
Paym
ents
for
finan
cial
ass
ets
57 6
7361
508
-
2 54
9
4 84
41
000 51
(2 1
72)
2 17
0 - - 1 - 1
-25
16- - - - -
55 5
0166
194
-
2 54
9
4 84
51
000 52
55 1
5766
116
-
2472
5 73
335
8 28
344 78-
77
(888
)64
2 24
99%
100% 97
%
118% 36
%
54%
59 9
9256
929
-
231
9 13
7 20 235
56 2
0567
927 24 23
0
4 79
4 20 237
Tota
l12
7 62
5-
2 51
613
0 14
112
9 86
427
710
0%12
6 54
412
9 43
7
GAU
TEN
G D
EPAR
TMEN
T O
F EC
ON
OM
IC D
EVEL
OPM
ENT
| VOT
E 3
ANN
UAL
FIN
ANCI
AL S
TATE
MEN
TS F
OR
THE
YEAR
EN
DED
31 M
ARCH
201
3
SECTION 05St
atut
ory
App
ropr
iati
on p
er e
cono
mic
cla
ssifi
cati
on
84 GAUTENG DEPARTMENT OF ECONOMIC DEVELOPMENT | ANNUAL REPORT 2012/13

2012
/13
2011
/12
Prog
ram
me1
Det
ail p
er s
ub-
prog
ram
me
Adj
uste
d A
ppro
pria
tion
Shift
ing
of
Fund
sVi
rem
ent
Fina
lA
ppro
pria
tion
Act
ual
Expe
ndit
ure
Vari
ance
Expe
ndit
ure
as %
of
final
ap
prop
riat
ion
Fina
lA
ppro
pria
tion
Act
ual
Expe
ndit
ure
R’00
0R’
000
R’00
0R’
000
R’00
0R’
000
%R’
000
R’00
0
1.1
OFF
ICE
OF
THE
MEC
Curre
nt p
aym
ent
Tran
sfer
s an
d su
bsid
ies
Paym
ent f
or c
apita
l ass
ets
Paym
ent f
or fi
nanc
ial a
sset
s
1.2
OFF
ICE
OF
THE
HO
DCu
rrent
pay
men
t Tr
ansf
ers
and
subs
idie
sPa
ymen
t for
cap
ital a
sset
sPa
ymen
t for
fina
ncia
l ass
ets
1.3
FIN
AN
CIA
L M
AN
AGEM
ENT
Curre
nt p
aym
ent
Tran
sfer
s an
d su
bsid
ies
Paym
ent f
or c
apita
l ass
ets
Paym
ent f
or fi
nanc
ial a
sset
s 1.
4 C
ORP
ORA
TE S
UPP
ORT
SER
VICE
SCu
rrent
pay
men
tsTr
ansf
ers a
nd su
bsid
ies
Paym
ent f
or c
apita
l ass
ets
Paym
ent f
or fi
nanc
ial a
sset
12 5
492
400
274 30
11 6
55 86 34 10
18 5
60-
12 11
76 4
17 635
524 -
(113
6) -(8
5)(1
0)
2 29
1 - - 4 60-
(10) -
(1 2
17) -
96 7
- - - -
2 51
6 - - - - - - - - - - -
11 4
132
400
189 20
16 4
62 86 34 14
18 6
20- 2 11
75 2
00 635
620 7
11 4
092
373
189 2
16 3
30 77 34 13
18 5
91- 2 6
74 9
44 225
866 7
4 27-
18 132 9 - 1 29- - 5
256 41
(246
) -
100% 99
%10
0% 10%
99%
90%
100% 93
%
100%
100% 55
%
100% 34
%10
4%10
0%
13 8
42-
220 -
18 6
02-
498 -
14 7
13 47 100
235
69 7
64 184
8 33
9 -
13 8
62-
220 -
27 6
21-
498 -
12 8
16 46 14 237
69 5
57 184
4 25
7 -
Tota
l12
7 62
5-
2 51
613
0 14
112
9 86
527
610
0%12
6 54
412
9 43
7
APP
rO
PrIA
TIO
N S
TATE
MEN
Tfo
R th
e Y
eAR
eNd
ed 3
1 m
ARC
h 2
013
GAU
TEN
G D
EPAR
TMEN
T O
F EC
ON
OM
IC D
EVEL
OPM
ENT
| VOT
E 3
ANN
UAL
FIN
ANCI
AL S
TATE
MEN
TS F
OR
THE
YEAR
EN
DED
31 M
ARCH
201
3
SECTION 05
85GAUTENG DEPARTMENT OF ECONOMIC DEVELOPMENT | ANNUAL REPORT 2012/13
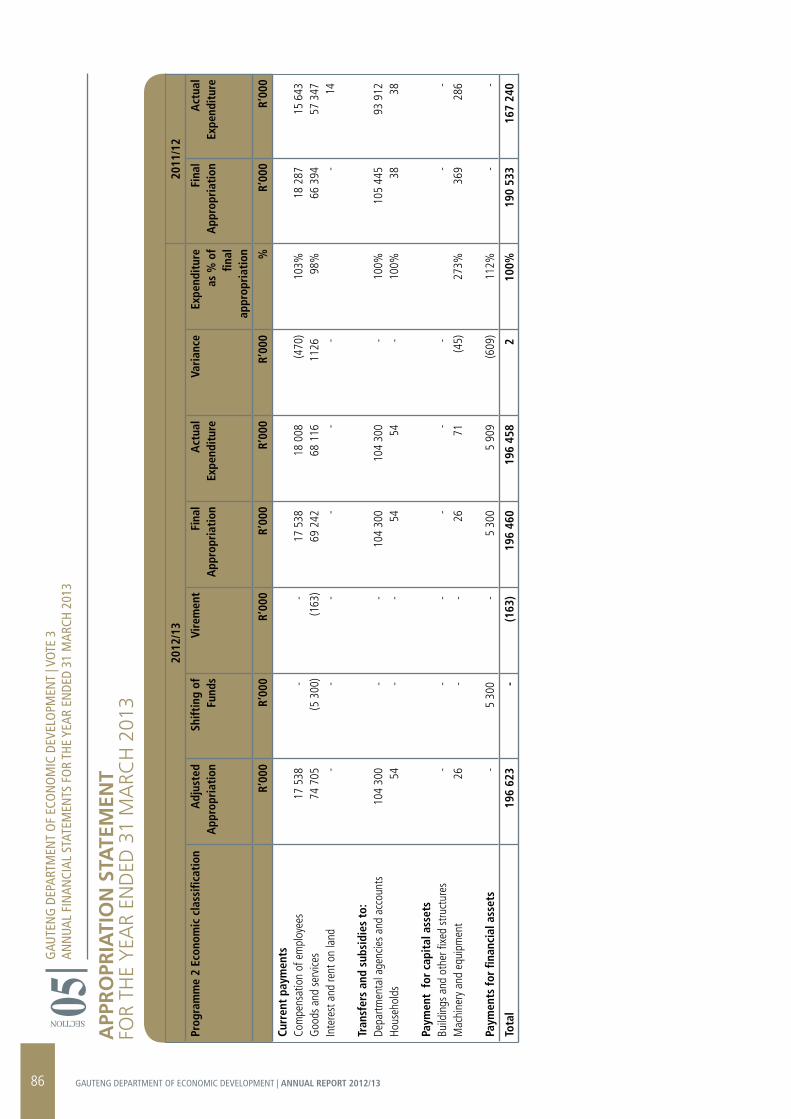
APP
rO
PrIA
TIO
N S
TATE
MEN
Tfo
R th
e Y
eAR
eNd
ed 3
1 m
ARC
h 2
013
GAU
TEN
G D
EPAR
TMEN
T O
F EC
ON
OM
IC D
EVEL
OPM
ENT
| VOT
E 3
ANN
UAL
FIN
ANCI
AL S
TATE
MEN
TS F
OR
THE
YEAR
EN
DED
31 M
ARCH
201
3
SECTION 05
2012
/13
2011
/12
Prog
ram
me
2 Ec
onom
ic c
lass
ifica
tion
A
djus
ted
App
ropr
iati
onSh
iftin
g of
Fu
nds
Vire
men
tFi
nal
App
ropr
iati
onA
ctua
lEx
pend
itur
eVa
rian
ceEx
pend
itur
eas
% o
f fin
al
appr
opri
atio
n
Fina
lA
ppro
pria
tion
Act
ual
Expe
ndit
ure
R’00
0R’
000
R’00
0R’
000
R’00
0R’
000
%R’
000
R’00
0
Curr
ent
paym
ents
Com
pens
atio
n of
em
ploy
ees
Goo
ds a
nd s
ervi
ces
Inte
rest
and
rent
on
land
Tran
sfer
s an
d su
bsid
ies
to:
Depa
rtmen
tal a
genc
ies
and
acco
unts
Hous
ehol
ds
Paym
ent
for
capi
tal a
sset
sBu
ildin
gs a
nd o
ther
fixe
d st
ruct
ures
Mac
hine
ry a
nd e
quip
men
t
Paym
ents
for
finan
cial
ass
ets
17 5
3874
705
-
104
300 54
-26
-
-(5
300
) - - - - -
5 30
0
-(1
63) - - - - - -
17 5
3869
242
-
104
300 54
-26
5 30
0
18 0
0868
116
-
104
300 54
-71
5 90
9
(470
)11
26- - - -
(45)
(609
)
103% 98
%
100%
100%
273%
112%
18 2
8766
394
-
105
445 38
-36
9 -
15 6
4357
347 14
93 9
12 38
-28
6 -
Tota
l19
6 62
3-
(163
)19
6 46
019
6 45
82
100%
190
533
167
240
86 GAUTENG DEPARTMENT OF ECONOMIC DEVELOPMENT | ANNUAL REPORT 2012/13

2012
/13
2011
/12
Prog
ram
me
2 D
etai
l per
sub
-pr
ogra
mm
e
A
djus
ted
App
ropr
iati
onSh
iftin
g of
Fu
nds
Vire
men
tFi
nal
App
ropr
iati
onA
ctua
lEx
pend
itur
eVa
rian
ceEx
pend
itur
eas
% o
f fin
al
appr
opri
atio
n
Fina
lA
ppro
pria
tion
Act
ual
Expe
ndit
ure
R’00
0R’
000
R’00
0R’
000
R’00
0R’
000
%R’
000
R’00
0
2.1
ECO
NO
MIC
EM
POW
ERM
ENT
Curre
nt p
aym
ent
Tran
sfer
s an
d su
bsid
ies
Paym
ent f
or c
apita
l ass
ets
Paym
ent f
or fi
nanc
ial a
sset
s
2.2
ENTE
RPRI
SE D
EVEL
OPM
ENT
Curre
nt p
aym
ent
Tran
sfer
s an
d su
bsid
ies
Paym
ent f
or c
apita
l ass
ets
2.3
LOCA
L EC
ON
OM
IC D
EVEL
OPM
ENT
Curre
nt p
aym
ent
Tran
sfer
s an
d su
bsid
ies
Paym
ent f
or c
apita
l ass
ets
Paym
ent f
or fi
nanc
ial a
sset
s
81 7
72 54 17-
6 36
510
4 30
0 -
4 10
6 - 9 -
(4 3
83) - -
3 90
9
485 - -
(1 4
02) - -
1 39
1
(163
) - - - - - - - - - -
77 2
26 54 173
909
6 85
010
4 30
0 -
2 70
4 - 91
391
76 4
25 54 643
909
6 84
210
4 30
0 -
2 85
7 - 72
000
801 -
(47) - 8 - -
(153
) - 2(6
09)
99%
100%
376%
100%
100%
100%
105% 78
%14
4%
78 9
58 38 187 -
2 59
710
5 44
510
8
3 12
6 -74
-
66 6
85 38 132 -
3 41
593
912 10
8
2 90
4 -46
-
Tota
l19
6 62
3-
(163
)19
6 46
019
6 45
82
100%
190
533
167
240
APP
rO
PrIA
TIO
N S
TATE
MEN
Tfo
R th
e Y
eAR
eNd
ed 3
1 m
ARC
h 2
013
GAU
TEN
G D
EPAR
TMEN
T O
F EC
ON
OM
IC D
EVEL
OPM
ENT
| VOT
E 3
ANN
UAL
FIN
ANCI
AL S
TATE
MEN
TS F
OR
THE
YEAR
EN
DED
31 M
ARCH
201
3
SECTION 05
87GAUTENG DEPARTMENT OF ECONOMIC DEVELOPMENT | ANNUAL REPORT 2012/13
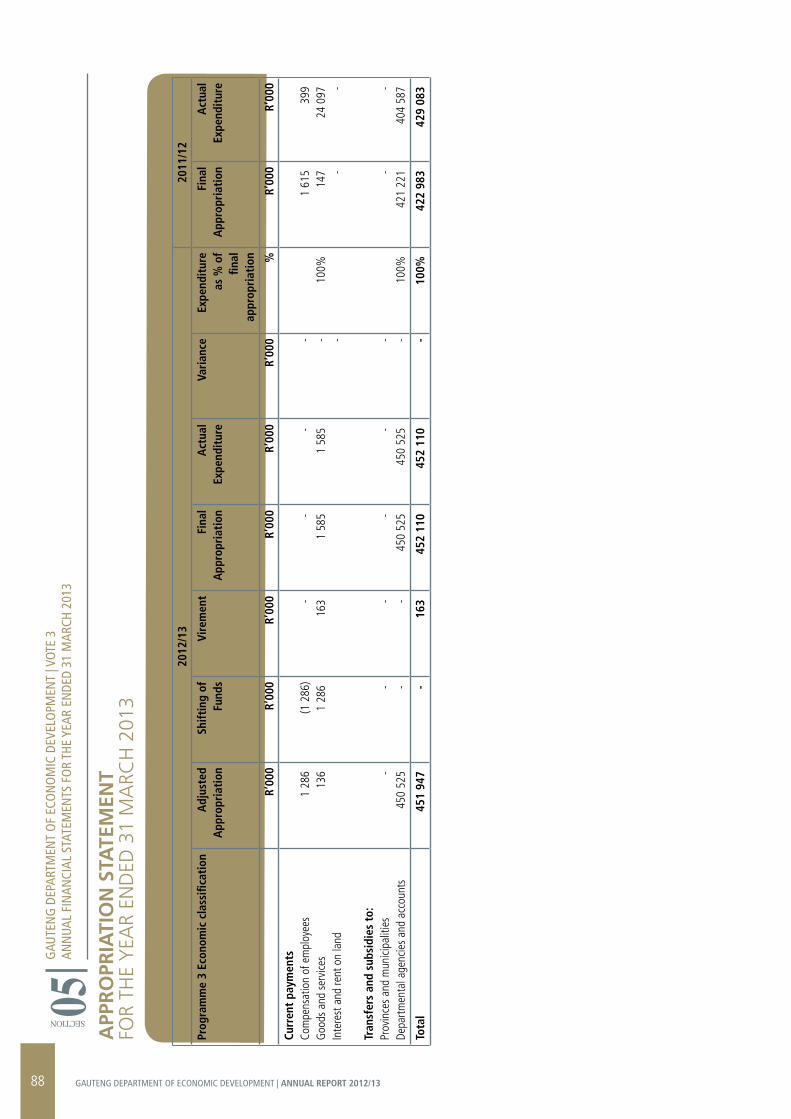
APP
rO
PrIA
TIO
N S
TATE
MEN
Tfo
R th
e Y
eAR
eNd
ed 3
1 m
ARC
h 2
013
GAU
TEN
G D
EPAR
TMEN
T O
F EC
ON
OM
IC D
EVEL
OPM
ENT
| VOT
E 3
ANN
UAL
FIN
ANCI
AL S
TATE
MEN
TS F
OR
THE
YEAR
EN
DED
31 M
ARCH
201
3
SECTION 05
2012
/13
2011
/12
Prog
ram
me
3 Ec
onom
ic c
lass
ifica
tion
Adj
uste
d A
ppro
pria
tion
Shift
ing
of
Fund
sVi
rem
ent
Fina
lA
ppro
pria
tion
Act
ual
Expe
ndit
ure
Vari
ance
Expe
ndit
ure
as %
of
final
ap
prop
riat
ion
Fina
lA
ppro
pria
tion
Act
ual
Expe
ndit
ure
R’00
0R’
000
R’00
0R’
000
R’00
0R’
000
%R’
000
R’00
0
Curr
ent
paym
ents
Com
pens
atio
n of
em
ploy
ees
Goo
ds a
nd s
ervi
ces
Inte
rest
and
rent
on
land
Tran
sfer
s an
d su
bsid
ies
to:
Prov
ince
s an
d m
unici
palit
ies
Depa
rtmen
tal a
genc
ies
and
acco
unts
1 28
613
6 -45
0 52
5
(1 2
86)
1 28
6 - -
-16
3 - -
-1
585 -
450
525
-1
585 -
450
525
- - - - -
100%
100%
1 61
514
7 - -42
1 22
1
399
24 0
97- -
404
587
Tota
l45
1 94
7-
163
452
110
452
110
-10
0%42
2 98
342
9 08
3
88 GAUTENG DEPARTMENT OF ECONOMIC DEVELOPMENT | ANNUAL REPORT 2012/13
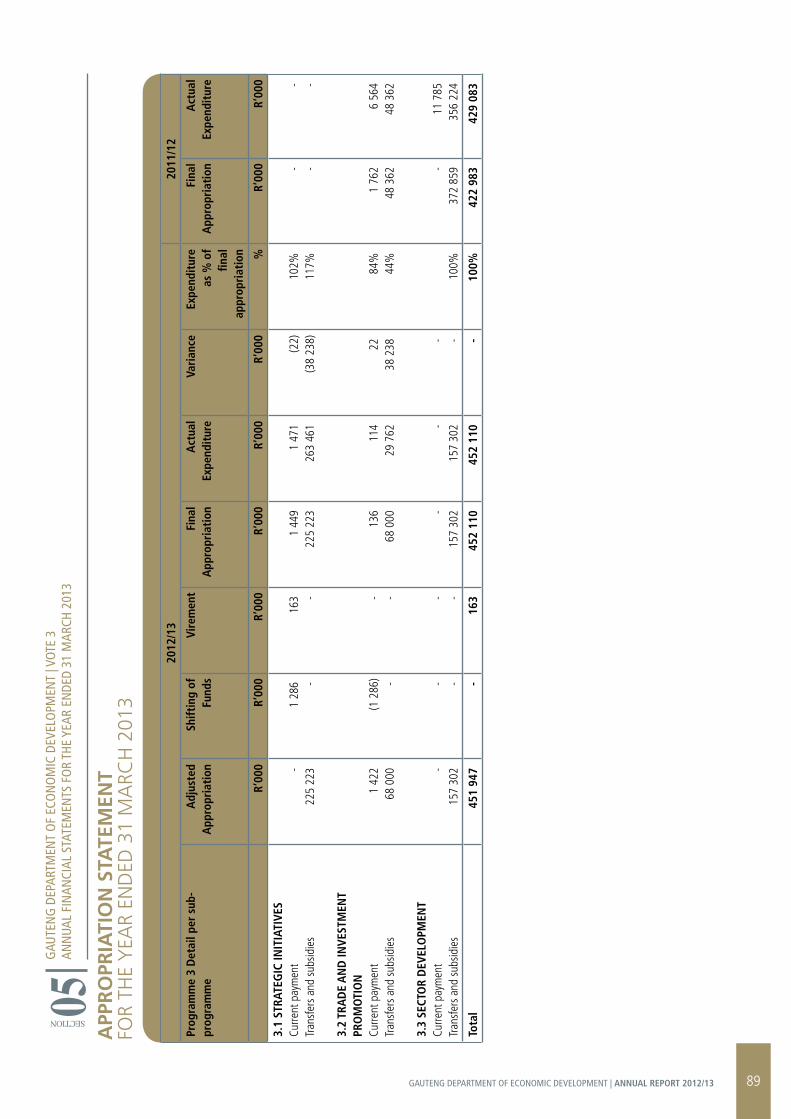
2012
/13
2011
/12
Prog
ram
me
3 Ec
onom
ic c
lass
ifica
tion
Adj
uste
d A
ppro
pria
tion
Shift
ing
of
Fund
sVi
rem
ent
Fina
lA
ppro
pria
tion
Act
ual
Expe
ndit
ure
Vari
ance
Expe
ndit
ure
as %
of
final
ap
prop
riat
ion
Fina
lA
ppro
pria
tion
Act
ual
Expe
ndit
ure
R’00
0R’
000
R’00
0R’
000
R’00
0R’
000
%R’
000
R’00
0
Curr
ent
paym
ents
Com
pens
atio
n of
em
ploy
ees
Goo
ds a
nd s
ervi
ces
Inte
rest
and
rent
on
land
Tran
sfer
s an
d su
bsid
ies
to:
Prov
ince
s an
d m
unici
palit
ies
Depa
rtmen
tal a
genc
ies
and
acco
unts
1 28
613
6 -45
0 52
5
(1 2
86)
1 28
6 - -
-16
3 - -
-1
585 -
450
525
-1
585 -
450
525
- - - - -
100%
100%
1 61
514
7 - -42
1 22
1
399
24 0
97- -
404
587
Tota
l45
1 94
7-
163
452
110
452
110
-10
0%42
2 98
342
9 08
3
2012
/13
2011
/12
Prog
ram
me
3 D
etai
l per
sub
-pr
ogra
mm
e
Adj
uste
d A
ppro
pria
tion
Shift
ing
of
Fund
sVi
rem
ent
Fina
lA
ppro
pria
tion
Act
ual
Expe
ndit
ure
Vari
ance
Expe
ndit
ure
as %
of
final
ap
prop
riat
ion
Fina
lA
ppro
pria
tion
Act
ual
Expe
ndit
ure
R’00
0R’
000
R’00
0R’
000
R’00
0R’
000
%R’
000
R’00
0
3.1
STRA
TEG
IC IN
ITIA
TIVE
SCu
rrent
pay
men
tTr
ansf
ers
and
subs
idie
s
3.2
TRA
DE
AN
D IN
VEST
MEN
T PR
OM
OTI
ON
Curre
nt p
aym
ent
Tran
sfer
s an
d su
bsid
ies
3.3
SECT
OR
DEV
ELO
PMEN
TCu
rrent
pay
men
tTr
ansf
ers
and
subs
idie
s
-22
5 22
3
1 42
268
000
-15
7 30
2
1 28
6 -
(1 2
86) - - -
163 - - - - -
1 44
922
5 22
3
136
68 0
00
-15
7 30
2
1 47
126
3 46
1
114
29 7
62
-15
7 30
2
(22)
(38
238) 22
38 2
38
- -
102%
117% 84
%44
%
100%
- -
1 76
248
362
-37
2 85
9
- -
6 56
448
362
11 7
8535
6 22
4
Tota
l45
1 94
7-
163
452
110
452
110
-10
0%42
2 98
342
9 08
3
APP
rO
PrIA
TIO
N S
TATE
MEN
Tfo
R th
e Y
eAR
eNd
ed 3
1 m
ARC
h 2
013
GAU
TEN
G D
EPAR
TMEN
T O
F EC
ON
OM
IC D
EVEL
OPM
ENT
| VOT
E 3
ANN
UAL
FIN
ANCI
AL S
TATE
MEN
TS F
OR
THE
YEAR
EN
DED
31 M
ARCH
201
3
SECTION 05
89GAUTENG DEPARTMENT OF ECONOMIC DEVELOPMENT | ANNUAL REPORT 2012/13
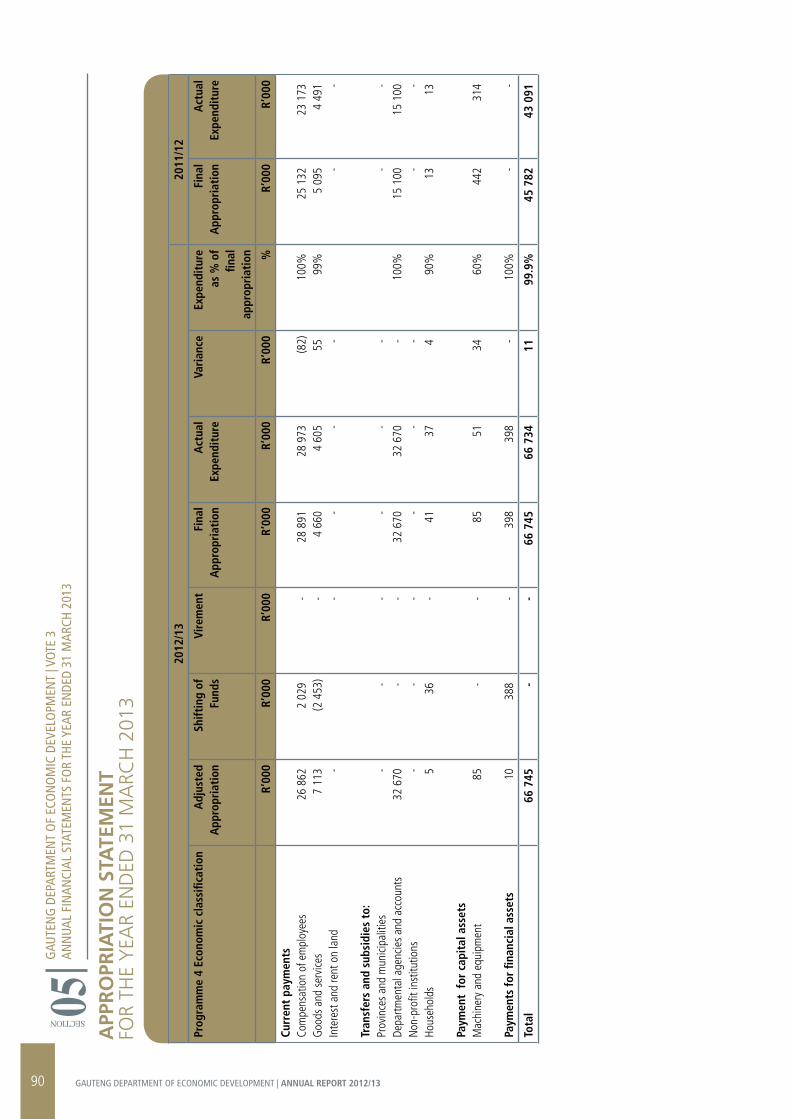
APP
rO
PrIA
TIO
N S
TATE
MEN
Tfo
R th
e Y
eAR
eNd
ed 3
1 m
ARC
h 2
013
GAU
TEN
G D
EPAR
TMEN
T O
F EC
ON
OM
IC D
EVEL
OPM
ENT
| VOT
E 3
ANN
UAL
FIN
ANCI
AL S
TATE
MEN
TS F
OR
THE
YEAR
EN
DED
31 M
ARCH
201
3
SECTION 05
2012
/13
2011
/12
Prog
ram
me
4 Ec
onom
ic c
lass
ifica
tion
Adj
uste
d A
ppro
pria
tion
Shift
ing
of
Fund
sVi
rem
ent
Fina
lA
ppro
pria
tion
Act
ual
Expe
ndit
ure
Vari
ance
Expe
ndit
ure
as %
of
final
ap
prop
riat
ion
Fina
lA
ppro
pria
tion
Act
ual
Expe
ndit
ure
R’00
0R’
000
R’00
0R’
000
R’00
0R’
000
%R’
000
R’00
0
Curr
ent
paym
ents
Com
pens
atio
n of
em
ploy
ees
Goo
ds a
nd s
ervi
ces
Inte
rest
and
rent
on
land
Tran
sfer
s an
d su
bsid
ies
to:
Prov
ince
s an
d m
unici
palit
ies
Depa
rtmen
tal a
genc
ies
and
acco
unts
Non
-pro
fit in
stitu
tions
Ho
useh
olds
Paym
ent
for
capi
tal a
sset
sM
achi
nery
and
equ
ipm
ent
Paym
ents
for
finan
cial
ass
ets
26 8
627
113 - -
32 6
70- 5 85 10
2 02
9(2
453
) - - -36
-
388
- - - - - - - - -
28 8
914
660 - -
32 6
70-
41 85 398
28 9
734
605 - -
32 6
70-
37 51 398
(82) 55- - - - 4 34
-
100% 99
%
100% 90
%
60%
100%
25 1
325
095 - -
15 1
00-
13 442 -
23 1
734
491 - -
15 1
00-
13 314 -
Tota
l66
745
--
66 7
4566
734
1199
.9%
45 7
8243
091
90 GAUTENG DEPARTMENT OF ECONOMIC DEVELOPMENT | ANNUAL REPORT 2012/13
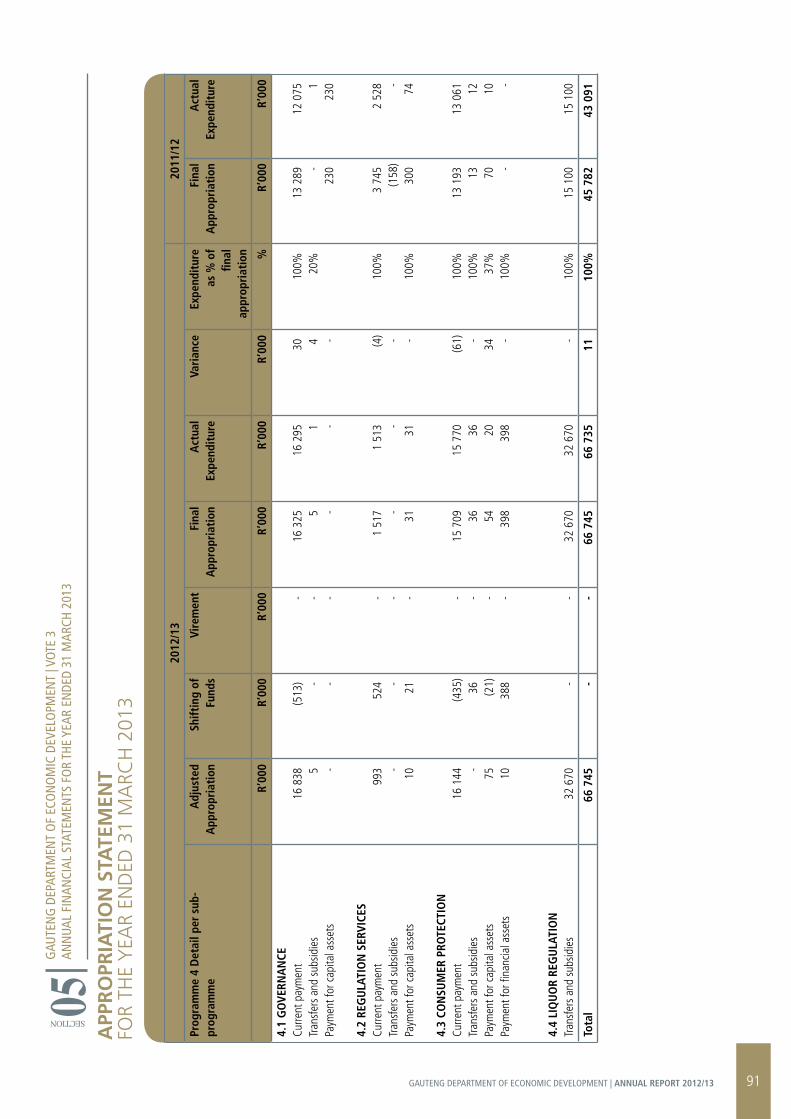
2012
/13
2011
/12
Prog
ram
me
4 D
etai
l per
sub
-pr
ogra
mm
e
A
djus
ted
App
ropr
iati
onSh
iftin
g of
Fu
nds
Vire
men
tFi
nal
App
ropr
iati
onA
ctua
lEx
pend
itur
eVa
rian
ceEx
pend
itur
eas
% o
f fin
al
appr
opri
atio
n
Fina
lA
ppro
pria
tion
Act
ual
Expe
ndit
ure
R’00
0R’
000
R’00
0R’
000
R’00
0R’
000
%R’
000
R’00
0
4.1
GO
VERN
AN
CECu
rrent
pay
men
tTr
ansf
ers
and
subs
idie
sPa
ymen
t for
cap
ital a
sset
s
4.2
REG
ULA
TIO
N S
ERVI
CES
Curre
nt p
aym
ent
Tran
sfer
s an
d su
bsid
ies
Paym
ent f
or c
apita
l ass
ets
4.3
CON
SUM
ER P
ROTE
CTIO
NCu
rrent
pay
men
tTr
ansf
ers
and
subs
idie
sPa
ymen
t for
cap
ital a
sset
sPa
ymen
t for
fina
ncia
l ass
ets
4.4
LIQ
UO
R RE
GU
LATI
ON
Tran
sfer
s an
d su
bsid
ies
16 8
38 5 -
993 -
10
16 1
44-
75 10
32 6
70
(513
) - -
524 -
21
(435
)36 (2
1)38
8 -
- - - - - - - - - - -
16 3
25 5 -
1 51
7 -31
15 7
09 36 54 398
32 6
70
16 2
95 1 -
1 51
3 -31
15 7
70 36 20 398
32 6
70
30 4 - (4) - -
(61) -
34- -
100% 20
%
100%
100%
100%
100% 37
%10
0%
100%
13 2
89-
230
3 74
5(1
58)
300
13 1
93 13 70-
15 1
00
12 0
75 123
0
2 52
8 -74
13 0
61 12 10-
15 1
00
Tota
l66
745
--
66 7
4566
735
1110
0%45
782
43 0
91
APP
rO
PrIA
TIO
N S
TATE
MEN
Tfo
R th
e Y
eAR
eNd
ed 3
1 m
ARC
h 2
013
GAU
TEN
G D
EPAR
TMEN
T O
F EC
ON
OM
IC D
EVEL
OPM
ENT
| VOT
E 3
ANN
UAL
FIN
ANCI
AL S
TATE
MEN
TS F
OR
THE
YEAR
EN
DED
31 M
ARCH
201
3
SECTION 05
91GAUTENG DEPARTMENT OF ECONOMIC DEVELOPMENT | ANNUAL REPORT 2012/13
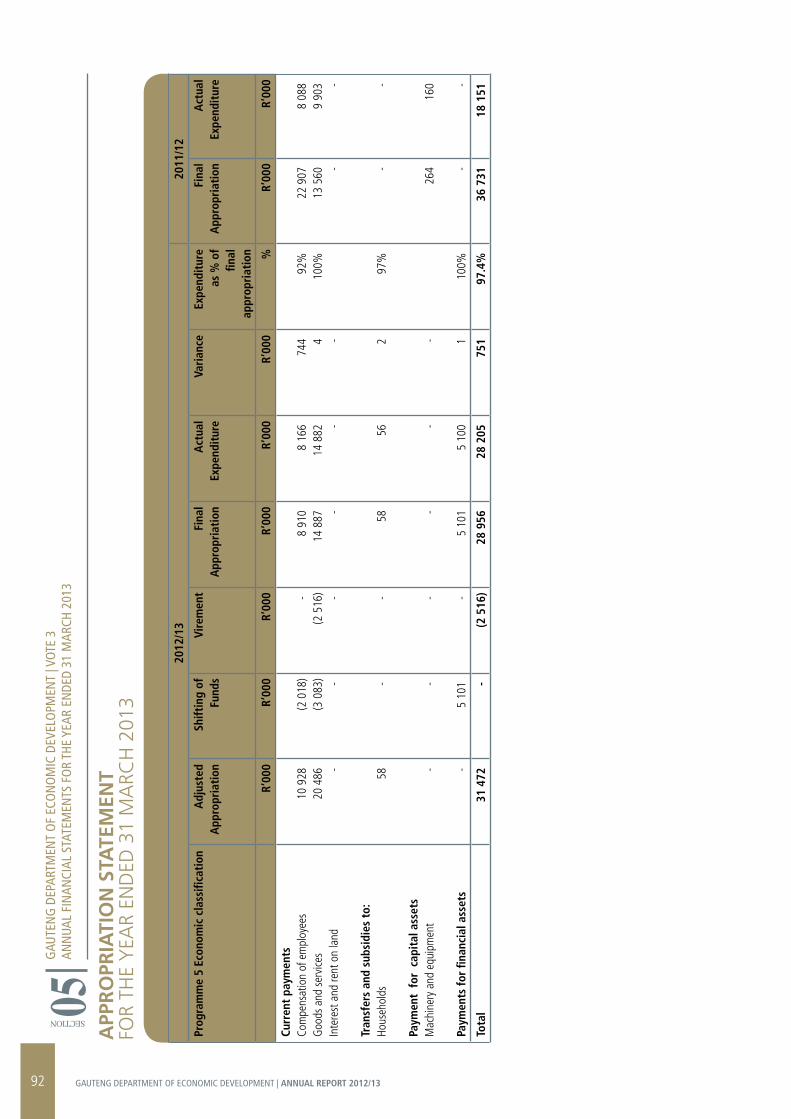
APP
rO
PrIA
TIO
N S
TATE
MEN
Tfo
R th
e Y
eAR
eNd
ed 3
1 m
ARC
h 2
013
GAU
TEN
G D
EPAR
TMEN
T O
F EC
ON
OM
IC D
EVEL
OPM
ENT
| VOT
E 3
ANN
UAL
FIN
ANCI
AL S
TATE
MEN
TS F
OR
THE
YEAR
EN
DED
31 M
ARCH
201
3
SECTION 05
2012
/13
2011
/12
Prog
ram
me
5 Ec
onom
ic c
lass
ifica
tion
Adj
uste
d A
ppro
pria
tion
Shift
ing
of
Fund
sVi
rem
ent
Fina
lA
ppro
pria
tion
Act
ual
Expe
ndit
ure
Vari
ance
Expe
ndit
ure
as %
of
final
ap
prop
riat
ion
Fina
lA
ppro
pria
tion
Act
ual
Expe
ndit
ure
R’00
0R’
000
R’00
0R’
000
R’00
0R’
000
%R’
000
R’00
0
Curr
ent
paym
ents
Com
pens
atio
n of
em
ploy
ees
Goo
ds a
nd s
ervi
ces
Inte
rest
and
rent
on
land
Tran
sfer
s an
d su
bsid
ies
to:
Hous
ehol
ds
Paym
ent
for
cap
ital
ass
ets
Mac
hine
ry a
nd e
quip
men
t
Paym
ents
for
finan
cial
ass
ets
10 9
2820
486
-
58
- -
(2 0
18)
(3 0
83) - - -
5 10
1
-(2
516
) - - - -
8 91
014
887
-
58
-
5 10
1
8 16
614
882
-
56
-
5 10
0
744 4 - 2 - 1
92%
100% 97
%
100%
22 9
0713
560
- -
264 -
8 08
89
903 - -
160 -
Tota
l31
472
-(2
516
)28
956
28 2
0575
197
.4%
36 7
3118
151
92 GAUTENG DEPARTMENT OF ECONOMIC DEVELOPMENT | ANNUAL REPORT 2012/13

2012
/13
2011
/12
Prog
ram
me
5 D
etai
l per
sub
-pr
ogra
mm
e
A
djus
ted
App
ropr
iati
onSh
iftin
g of
Fu
nds
Vire
men
tFi
nal
App
ropr
iati
onA
ctua
lEx
pend
itur
eVa
rian
ceEx
pend
itur
eas
% o
f fin
al
appr
opri
atio
n
Fina
lA
ppro
pria
tion
Act
ual
Expe
ndit
ure
R’00
0R’
000
R’00
0R’
000
R’00
0R’
000
%R’
000
R’00
0
5.1
MO
NIT
ORI
NG
AN
D E
VALU
ATIO
NCu
rrent
pay
men
tTr
ansf
ers
and
subs
idie
sPa
ymen
t for
fina
ncia
l ass
ets
5.2
POLI
CY A
ND
PLA
NN
ING
Curre
nt p
aym
ent
Tran
sfer
s an
d su
bsid
ies
Paym
ent f
or c
apita
l ass
ets
Paym
ent f
or fi
nanc
ial a
sset
s
5.3
RESE
ARC
H A
ND
DEV
ELO
PMEN
TCu
rrent
pay
men
tTr
ansf
ers
and
subs
idie
sPa
ymen
t for
cap
ital a
sset
sPa
ymen
t for
fina
ncia
l ass
ets
5.4
KNO
WLE
DG
E M
AN
AGEM
ENT
Curre
nt p
aym
ents
13 6
42- -
9 29
0 58- -
4 66
8
- - -
3 81
4
(2 7
30) -
1 10
0
(624
) - -2
001
142 - -
2 00
0
(1 8
89)
- - -
(2 5
16) - - - - - - - -
10 9
12-
1 10
0
6 15
0 58-
2 00
1
4 31
0 - -2
000
1 92
5
10 1
74-
1 10
0
6 14
2 56-
2 00
0
4 80
9 - -2
000
1 92
4
738 - - 8 2 - 1 1 - - - 1
93%
100% 99
%97
%
100%
100%
100%
100%
- - -
7 55
0 -10
-
28 9
17-
254 - -
- - -
4 3
57- - -
13 6
34-
160 - -
Tota
l31
472
-(2
516
)28
956
28 2
0575
197
%36
731
18 1
51
APP
rO
PrIA
TIO
N S
TATE
MEN
Tfo
R th
e Y
eAR
eNd
ed 3
1 m
ARC
h 2
013
GAU
TEN
G D
EPAR
TMEN
T O
F EC
ON
OM
IC D
EVEL
OPM
ENT
| VOT
E 3
ANN
UAL
FIN
ANCI
AL S
TATE
MEN
TS F
OR
THE
YEAR
EN
DED
31 M
ARCH
201
3
SECTION 05
93GAUTENG DEPARTMENT OF ECONOMIC DEVELOPMENT | ANNUAL REPORT 2012/13
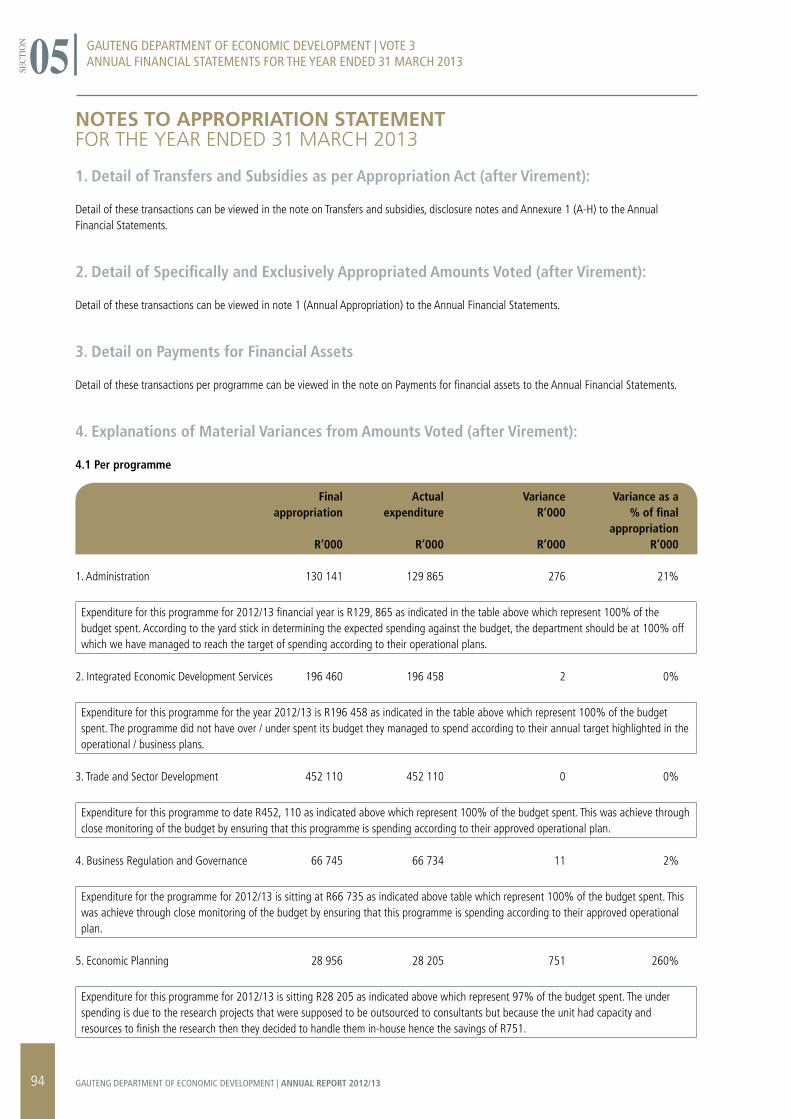
NOTES TO APPrOPrIATION STATEMENTfoR the YeAR eNded 31 mARCh 2013
1. Detail of Transfers and Subsidies as per Appropriation Act (after Virement):
Detail of these transactions can be viewed in the note on Transfers and subsidies, disclosure notes and Annexure 1 (A-H) to the Annual Financial Statements.
2. Detail of Specifically and Exclusively Appropriated Amounts Voted (after Virement):
Detail of these transactions can be viewed in note 1 (Annual Appropriation) to the Annual Financial Statements.
3. Detail on Payments for Financial Assets
Detail of these transactions per programme can be viewed in the note on Payments for financial assets to the Annual Financial Statements.
4. Explanations of Material Variances from Amounts Voted (after Virement):
4.1 Per programme
Final Actual Variance Variance as a appropriation expenditure R’000 % of final appropriation R’000 R’000 R’000 R’000
1. Administration 130 141 129 865 276 21%
Expenditure for this programme for 2012/13 financial year is R129, 865 as indicated in the table above which represent 100% of the budget spent. According to the yard stick in determining the expected spending against the budget, the department should be at 100% off which we have managed to reach the target of spending according to their operational plans.
2. Integrated Economic Development Services 196 460 196 458 2 0%
Expenditure for this programme for the year 2012/13 is R196 458 as indicated in the table above which represent 100% of the budget spent. The programme did not have over / under spent its budget they managed to spend according to their annual target highlighted in the operational / business plans.
3. Trade and Sector Development 452 110 452 110 0 0%
Expenditure for this programme to date R452, 110 as indicated above which represent 100% of the budget spent. This was achieve through close monitoring of the budget by ensuring that this programme is spending according to their approved operational plan.
4. Business Regulation and Governance 66 745 66 734 11 2%
Expenditure for the programme for 2012/13 is sitting at R66 735 as indicated above table which represent 100% of the budget spent. This was achieve through close monitoring of the budget by ensuring that this programme is spending according to their approved operational plan.
5. Economic Planning 28 956 28 205 751 260%
Expenditure for this programme for 2012/13 is sitting R28 205 as indicated above which represent 97% of the budget spent. The under spending is due to the research projects that were supposed to be outsourced to consultants but because the unit had capacity and resources to finish the research then they decided to handle them in-house hence the savings of R751.
GAUTENG DEPARTMENT OF ECONOMIC DEVELOPMENT | VOTE 3ANNUAL FINANCIAL STATEMENTS FOR THE YEAR ENDED 31 MARCH 2013
SECT
ION 05
94 GAUTENG DEPARTMENT OF ECONOMIC DEVELOPMENT | ANNUAL REPORT 2012/13
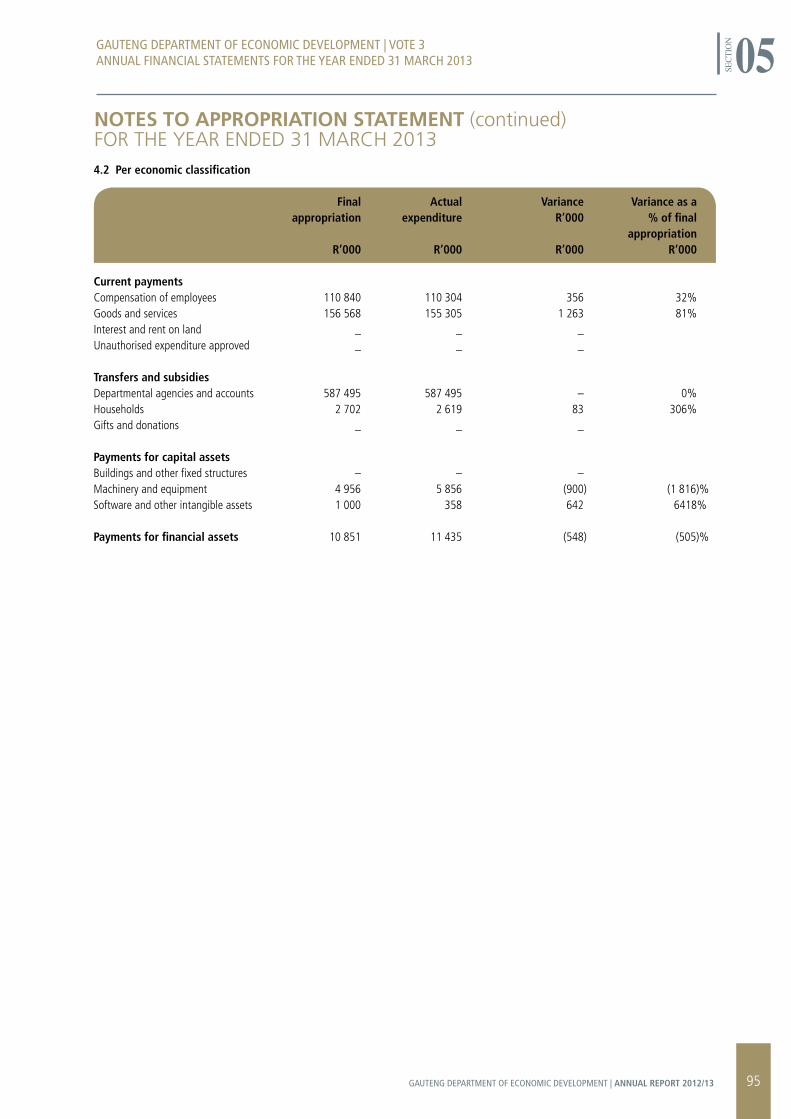
4.2 Per economic classification
Final Actual Variance Variance as a appropriation expenditure R’000 % of final appropriation R’000 R’000 R’000 R’000
Current payments Compensation of employees 110 840 110 304 356 32%Goods and services 156 568 155 305 1 263 81%Interest and rent on land _ _ _ Unauthorised expenditure approved _ _ _
Transfers and subsidies Departmental agencies and accounts 587 495 587 495 – 0%Households 2 702 2 619 83 306%Gifts and donations _ _ _
Payments for capital assets Buildings and other fixed structures – – – Machinery and equipment 4 956 5 856 (900) (1 816)%Software and other intangible assets 1 000 358 642 6418% Payments for financial assets 10 851 11 435 (548) (505)%
GAUTENG DEPARTMENT OF ECONOMIC DEVELOPMENT | VOTE 3ANNUAL FINANCIAL STATEMENTS FOR THE YEAR ENDED 31 MARCH 2013
SECT
ION 05
NOTES TO APPrOPrIATION STATEMENT (continued)foR the YeAR eNded 31 mARCh 2013
95GAUTENG DEPARTMENT OF ECONOMIC DEVELOPMENT | ANNUAL REPORT 2012/13
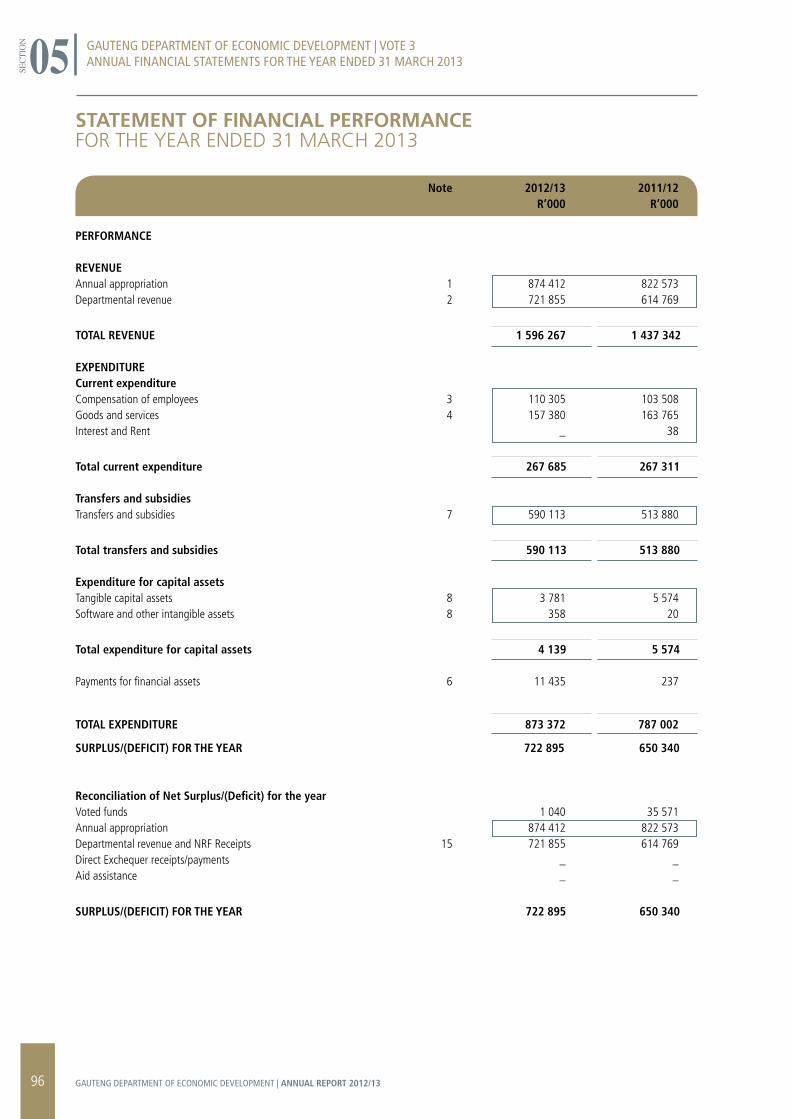
GAUTENG DEPARTMENT OF ECONOMIC DEVELOPMENT | VOTE 3ANNUAL FINANCIAL STATEMENTS FOR THE YEAR ENDED 31 MARCH 2013
SECT
ION 05
STATEMENT OF FINANCIAL PErFOrMANCEfoR the YeAR eNded 31 mARCh 2013
Note 2012/13 2011/12 R’000 R’000
PERFORMANCE
REVENUEAnnual appropriation 1 874 412 822 573Departmental revenue 2 721 855 614 769
TOTAL REVENUE 1 596 267 1 437 342
EXPENDITURECurrent expenditureCompensation of employees 3 110 305 103 508Goods and services 4 157 380 163 765Interest and Rent _ 38
Total current expenditure 267 685 267 311
Transfers and subsidiesTransfers and subsidies 7 590 113 513 880
Total transfers and subsidies 590 113 513 880
Expenditure for capital assetsTangible capital assets 8 3 781 5 574Software and other intangible assets 8 358 20
Total expenditure for capital assets 4 139 5 574
Payments for financial assets 6 11 435 237
TOTAL EXPENDITURE 873 372 787 002
SURPLUS/(DEFICIT) FOR THE YEAR 722 895 650 340
Reconciliation of Net Surplus/(Deficit) for the yearVoted funds 1 040 35 571Annual appropriation 874 412 822 573Departmental revenue and NRF Receipts 15 721 855 614 769Direct Exchequer receipts/payments _ _Aid assistance _ _
SURPLUS/(DEFICIT) FOR THE YEAR 722 895 650 340
96 GAUTENG DEPARTMENT OF ECONOMIC DEVELOPMENT | ANNUAL REPORT 2012/13

GAUTENG DEPARTMENT OF ECONOMIC DEVELOPMENT | VOTE 3ANNUAL FINANCIAL STATEMENTS FOR THE YEAR ENDED 31 MARCH 2013
SECT
ION 05
STATEMENT OF FINANCIAL POSITIONfoR the YeAR eNded 31 mARCh 2013
Note 2012/13 2011/12 R’000 R’000
POSITION
ASSETSCurrent assets 134 056 176 566Unauthorised expenditure 9 68 968 69 744Cash and cash equivalents 10 58 811 82 728Prepayments and advances 11 18 84Receivables 12 6 259 24 010
Non-current assets 4 4Investments 13 4 4
TOTAL ASSETS 134 060 176 570
LIABILITIESCurrent liabilities 134 056 176 566Voted funds to be surrendered to the Revenue Fund 14 65 032 99 562Departmental revenue and NRF Receipts to be surrendered to the Revenue Fund 15 54 540 55 481Payables 16 14 484 21 523
Non-current liabilitiesPayables – –
TOTAL LIABILITIES 134 056 176 566
NET ASSETS 4 4
Note 2012/13 2011/12 R’000 R’000
Represented by:Capitalisation reserve 4 4
TOTAL 4 4
97GAUTENG DEPARTMENT OF ECONOMIC DEVELOPMENT | ANNUAL REPORT 2012/13
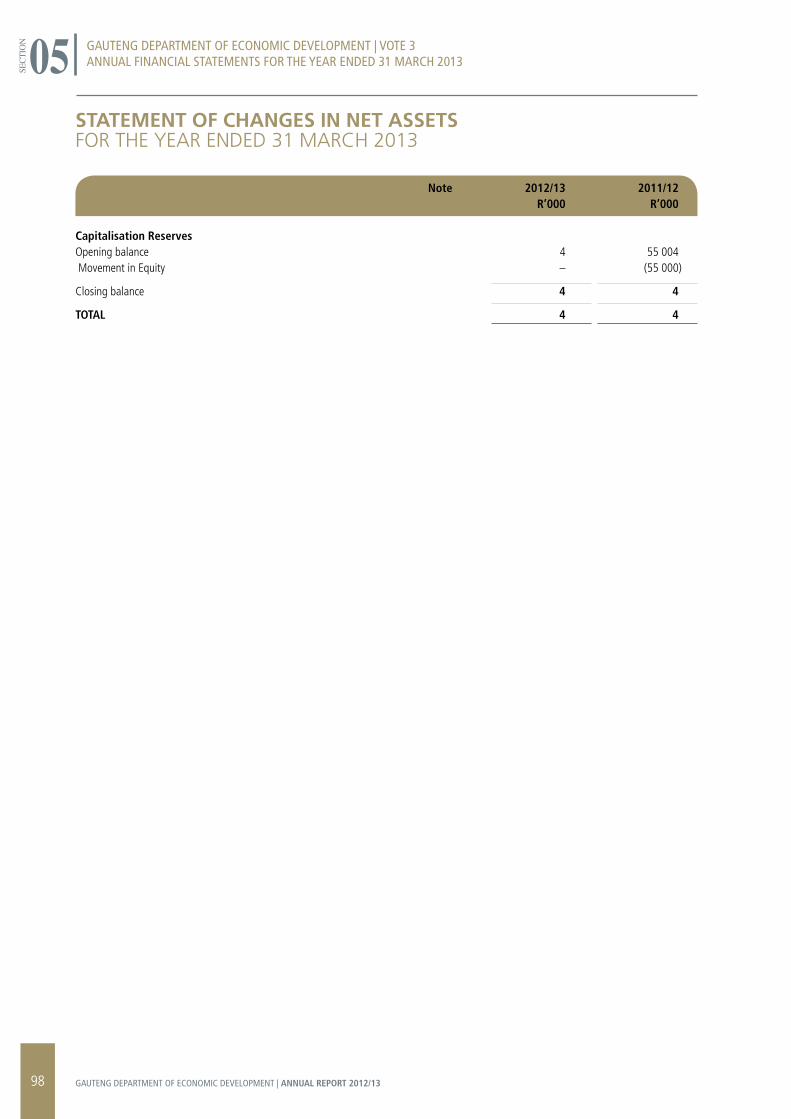
STATEMENT OF CHANGES IN NET ASSETSfoR the YeAR eNded 31 mARCh 2013
Note 2012/13 2011/12 R’000 R’000
Capitalisation ReservesOpening balance 4 55 004 Movement in Equity – (55 000)
Closing balance 4 4
TOTAL 4 4
GAUTENG DEPARTMENT OF ECONOMIC DEVELOPMENT | VOTE 3ANNUAL FINANCIAL STATEMENTS FOR THE YEAR ENDED 31 MARCH 2013
SECT
ION 05
98 GAUTENG DEPARTMENT OF ECONOMIC DEVELOPMENT | ANNUAL REPORT 2012/13
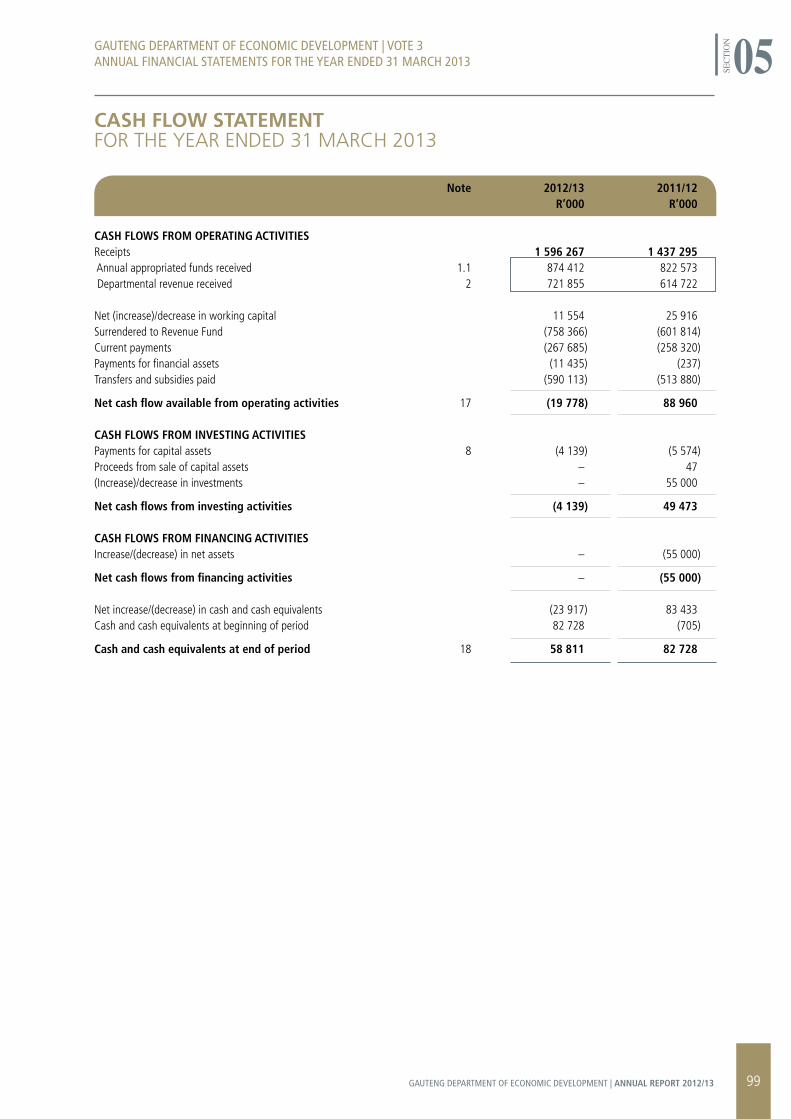
CASH FLOW STATEMENTfoR the YeAR eNded 31 mARCh 2013
Note 2012/13 2011/12 R’000 R’000
CASH FLOWS FROM OPERATING ACTIVITIESReceipts 1 596 267 1 437 295 Annual appropriated funds received 1.1 874 412 822 573 Departmental revenue received 2 721 855 614 722
Net (increase)/decrease in working capital 11 554 25 916Surrendered to Revenue Fund (758 366) (601 814)Current payments (267 685) (258 320)Payments for financial assets (11 435) (237)Transfers and subsidies paid (590 113) (513 880)
Net cash flow available from operating activities 17 (19 778) 88 960
CASH FLOWS FROM INVESTING ACTIVITIESPayments for capital assets 8 (4 139) (5 574)Proceeds from sale of capital assets – 47(Increase)/decrease in investments – 55 000
Net cash flows from investing activities (4 139) 49 473
CASH FLOWS FROM FINANCING ACTIVITIESIncrease/(decrease) in net assets – (55 000)
Net cash flows from financing activities – (55 000)
Net increase/(decrease) in cash and cash equivalents (23 917) 83 433Cash and cash equivalents at beginning of period 82 728 (705)
Cash and cash equivalents at end of period 18 58 811 82 728
GAUTENG DEPARTMENT OF ECONOMIC DEVELOPMENT | VOTE 3ANNUAL FINANCIAL STATEMENTS FOR THE YEAR ENDED 31 MARCH 2013
SECT
ION 05
99GAUTENG DEPARTMENT OF ECONOMIC DEVELOPMENT | ANNUAL REPORT 2012/13
ACCOUNTING POLICIESfoR the YeAR eNded 31 mARCh 2013
The Financial Statements have been prepared in accordance with the following policies, which have been applied consistently in all material aspects, unless otherwise indicated. However, where appropriate and meaningful, additional information has been disclosed to enhance the usefulness of the Financial Statements and to comply with the statutory requirements of the Public Finance Management Act, Act 1 of 1999 (as amended by Act 29 of 1999), and the Treasury Regulations issued in terms of the Act and the Division of Revenue Act, Act 1 of 2010.
1. Presentation of the Financial Statements
1.1 Basis of Preparation
The financial statements have been prepared on a modified cash basis of accounting.
Under this basis, the effects of transactions and other events are recognised in the financial records when the resulting cash is received or paid. The “modification” results from the recognition of certain near-cash balances in the financial statements as well as the revaluation of foreign investments and loans and the recognition of resulting revaluation gains and losses.
In addition supplementary information is provided in the disclosure notes to the financial statements where it is deemed to be useful to the users of the financial statements.
1.2 Presentation Currency
All amounts have been presented in the currency of the South African Rand (R) which is also the functional currency of the department.
1.3 Rounding
Unless otherwise stated all financial figures have been rounded to the nearest one thousand Rand (R’000).
1.4 Comparative Figures
Prior period comparative information has been presented in the current year’s financial statements. Where necessary figures included in the prior period financial statements have been reclassified to ensure that the format in which the information is presented is consistent with the format of the current year’s financial statements.
1.5 Comparative Figures – Appropriation Statement
A comparison between actual amounts and final appropriation per major classification of expenditure is included in the Appropriation Statement.
2. Revenue
2.1 Appropriated Funds
Appropriated funds comprises of departmental allocations as well as direct charges against revenue fund (i.e. statutory appropriation).
Appropriated funds are recognised in the financial records on the date the appropriation becomes effective. Adjustments made in terms of the adjustments budget process are recognised in the financial records on the date the adjustments become effective.
Unexpended appropriated funds are surrendered to the National/Provincial Revenue Fund. Any amounts owing to the National/Provincial Revenue Fund at the end of the financial year are recognised as payable in the statement of financial position.
Any amount due from the National/Provincial Revenue Fund at the end of the financial year is recognised as a receivable in the statement of financial position.
2.2 Departmental Revenue
All departmental revenue is recognised in the statement of financial performance when received and is subsequently paid into the National/Provincial Revenue Fund, unless stated otherwise.
Any amount owing to the National/Provincial Revenue Fund at the end if the financial year is recognised as a payable in the statement of financial position.
No accrual is made for amounts receivable from the last receipt date to the end of the reporting period. These amounts are however disclosed in the disclosure notes to the annual financial statements.
2.3 Direct Exchequer Receipts
All direct exchequer receipts are recognised in the statement of financial performance when the cash is received and is subsequently paid into the National/Provincial Revenue Fund, unless stated otherwise.
Any amount owing to the National/Provincial Revenue Funds at the end of the financial year is recognised as a payable in the statement of financial position.
2.4 Direct Exchequer Payments
All direct exchequer payments are recognised in the statement of financial performance when final authorisation for payment is effected on the system (by no later than 31 March of each year).
2.5 Aid Assistance
Aids assistance is recognised as revenue when received
All in-kind aid assistance is disclosed at fair value on the date of receipt in the annexures to the Annual Financial Statements
The cash payments made during the year relating to aid assistance projects are recognised as expenditure in the statement of financial performance when final authorisation for payments is effected on the system (by no later than 31 March of each year).
The value of the assistance expensed prior to the receipt of funds is recognised as a receivable in the statement of financial position.
Inappropriately expensed amounts using aid assistance and any unutilised amounts are recognised as payables in the statement of financial position.
GAUTENG DEPARTMENT OF ECONOMIC DEVELOPMENT | VOTE 3ANNUAL FINANCIAL STATEMENTS FOR THE YEAR ENDED 31 MARCH 2013
SECT
ION 05
100 GAUTENG DEPARTMENT OF ECONOMIC DEVELOPMENT | ANNUAL REPORT 2012/13
All CARA funds received must be recorded as revenue when funds are received. The cash payments made during the year relating to CARA earmarked projects are recognised as expenditure in the statement of financial performance when final authorisation for payments effected on the system (by no later then 31 March of each year).
Inappropriately expensed amounts using CARA funds are recognised as payables in the statement of financial position. Any unutilised amounts are transferred to retained funds as they are not surrendered to the revenue fund.
3. Expenditure
3.1 Compensation of Employees
3.1.1 Salaries and WagesSalaries and wages are expensed in the statement of financial performance when the final authorisation for payment is effected on the system (by no later than 31 March of each year).
Other employee benefits that give rise to a present legal or constructive obligation are disclosed in the disclosure notes to the financial statements at its face value and are not recognised in the statement of financial performance or position.
Employee costs are capitalised to the cost of a capital project when an employee spends more than 50% of his/her time on the project. These payments form part of expenditure for capital assets in the statement of financial performance.
3.1.2 Social ContributionsEmployer contributions to post employment benefit plans in respect of current employees are expensed in the statement of financial performance when the final authorisation for payment is effected on the system (by no later than 31 March of each year).
No provision is made for retirement benefits in the financial statements of the department. Any potential liabilities are disclosed in the financial statements of the National Revenue Fund and not in the financial statements of the employer department. Employer contributions made by the department for certain of its ex-employees (such as medical benefits) are classified as transfers to households in the statement of financial performance.
3.2 Goods and Services
Payments made during the year for goods and/or services are recognised as an expense in the statement of financial performance when the final authorisation for payment is effected on the system (by no later than 31 March of each year).
The expense is classified as capital if the goods and/or services were acquired for a capital project or if the total purchase price exceeds the capitalisation threshold (currently R5, 000). All other expenditures are classified as current.
Rental paid for the use of buildings or other fixed structures is classified as goods and services and not as rent on land.
3.3 Interest and Rent on Land
Interest and rental payments are recognised as an expense in the statement of financial performance when the final authorisation for payment is effected on the system (by no later than 31 March of each
year). This item excludes rental for the use of buildings or other fixed structures. If it is not possible to distinguish between payment for the use of land and the fixed structures on it, the whole amount should be recorded under goods and services.
3.4 Payments for Financial Assets
Debts are written off when identified as irrecoverable. Debts written-off are limited to the amount of savings and/or underspending of appropriated funds. The write off occurs at year-end or when funds are available. No provision is made for irrecoverable amounts but an estimate is included in the disclosure notes to the financial statements.
All other losses are recognised when authorisation has been granted for the recognition thereof.
3.5 Transfers and Subsidies
Transfers and subsidies are recognised as an expense when the final authorisation for payment is effected on the system (by no later than 31 March of each year).
3.6 Unauthorised Expenditure
When confirmed unauthorised expenditure is recognised as an asset in the statement of financial position until such time as the expenditure is either approved by the relevant authority, recovered from the responsible person or written off as irrecoverable in the statement of financial performance.
Unauthorised expenditure approved with funding is derecognised from the statement of financial position when the unauthorised expenditure is approved and the related funds are received.
Where the amount is approved without funding it is recognised as expenditure in the statement of financial performance on the date stipulated in the Act.
3.7 Fruitless and Wasteful Expenditure
Fruitless and wasteful expenditure is recognised as expenditure in the statement of financial performance according to the nature of the payment and not as a separate line item on the face of the statement. If the expenditure is recoverable it is treated as an asset until it is recovered from the responsible person or written off as irrecoverable in the statement of financial performance.
3.8 Irregular Expenditure
Irregular expenditure is recognised as expenditure in the statement of financial performance. If the expenditure is not condoned by the relevant authority it is treated as an asset until it is recovered or written off as irrecoverable.
4. Assets
4.1 Cash and Cash Equivalents
Cash and cash equivalents are carried in the statement of financial position at cost.
Bank overdrafts are shown separately on the face of the statement of financial position. For the purposes of the cash flow statement, cash
GAUTENG DEPARTMENT OF ECONOMIC DEVELOPMENT | VOTE 3ANNUAL FINANCIAL STATEMENTS FOR THE YEAR ENDED 31 MARCH 2013
SECT
ION 05
101GAUTENG DEPARTMENT OF ECONOMIC DEVELOPMENT | ANNUAL REPORT 2012/13
and cash equivalents comprise cash on hand, deposits held, other short-term highly liquid investments and bank overdrafts.
4.2 Other Financial Assets
Other financial assets are carried in the statement of financial position at cost.
4.3 Prepayments and Advances
Amounts prepaid or advanced are recognised in the statement of financial position when the payments are made and are derecognised as and when the goods/services are received or the funds are utilised. Prepayments and advances outstanding at the end of the year are carried in the statement of financial position at cost.
4.4 Receivables
Receivables included in the statement of financial position arise from cash payments made that are recoverable from another party (including departmental employees) and are derecognised upon recovery or write-off.
Receivables outstanding at year-end are carried in the statement of financial position at cost plus any accrued interest. Amounts that are potentially irrecoverable are included in the disclosure notes.
4.5 Investments
Capitalised investments are shown at cost in the statement of financial position.
Investments are tested for an impairment loss whenever events or changes in circumstances indicate that the investment may be impaired. Any impairment loss is included in the disclosure notes.
4.6 Loans
Loans are recognised in the statement of financial position when the cash is paid to the beneficiary. Loans that are outstanding at year-end are carried in the statement of financial position at cost plus accrued interest.
Amounts that are potentially irrecoverable are included in the disclosure notes.
4.7 Inventory
Inventories that qualify for recognition must be initially reflected at cost. Where inventories are acquired at no cost, or for nominal consideration, their cost shall be their fair value at the date of acquisition.
All inventory items at year-end are reflected using the weighted average cost or FIFO cost formula.
4.8 Capital Assets
4.8.1 Movable Assets
Initial RecognitionA capital asset is recorded in the asset register on receipt of the item at cost. Cost of an asset is defined as the total cost of acquisition.
Where the cost cannot be determined accurately, the movable capital asset is stated at fair value. Where fair value cannot be determined, the capital asset is included in the asset register at R1.
All assets acquired prior to 1 April 2002 are included in the register R1.
Subsequent RecognitionSubsequent expenditure of a capital nature is recorded in the statement of financial performance as “expenditure for capital assets” and is capitalised in the asset register of the department on completion of the project. Repairs and maintenance is expensed as current “goods and services” in the statement of financial performance.
4.8.2 Immovable Assets
Initial RecognitionA capital asset is recorded on receipt of the item at cost. Cost of an asset is defined as the total cost of acquisition. Where the cost cannot be determined accurately, the immovable capital asset is stated at R1 unless the fair value for the asset has been reliably estimated.
Subsequent RecognitionWork-in-progress of a capital nature is recorded in the statement of financial performance as “expenditure for capital assets”. On completion, the total cost of the project is included in the asset register of the department that is accountable for the asset.
Repairs and maintenance is expensed as current “goods and services” in the statement of financial performance.
4.8.3 Intangible Assets
Initial RecognitionAn intangible asset is recorded in the asset register on receipt of the item at cost. Cost of an intangible asset is defined as the total cost of acquisition. Where the cost cannot be determined accurately, the intangible asset is stated at fair value. Where fair value cannot be determined, the intangible asset is included in the asset register at R1.
All intangible assets acquired prior to 1 April 2002 can be included in the asset register at R1.*
Subsequent ExpenditureSubsequent expenditure of a capital nature is recorded in the statement of financial performance as “expenditure for capital asset” and is capitalised in the asset register of the department.
Maintenance is expensed as current “goods and services” in the statement of financial performance.
5. Liabilities
5.1 Payables
Recognised payables mainly comprise of amounts owing to other governmental entities. These payables are carried at cost in the statement of financial position.
GAUTENG DEPARTMENT OF ECONOMIC DEVELOPMENT | VOTE 3ANNUAL FINANCIAL STATEMENTS FOR THE YEAR ENDED 31 MARCH 2013
SECT
ION 05
102 GAUTENG DEPARTMENT OF ECONOMIC DEVELOPMENT | ANNUAL REPORT 2012/13
5.2 Contingent Liabilities
Contingent liabilities are included in the disclosure notes to the financial statements when it is possible that economic benefits will flow from the department, or when an outflow of economic benefits or service potential is probable but cannot be measured reliably.
5.3 Contingent Assets
Contingent assets are included in the disclosure notes to the financial statements when it is probable that an inflow of economic benefits will flow to the entity.
5.4 Commitments
Commitments are not recognised in the statement of financial position as a liability or as expenditure in the statement of financial performance but are included in the disclosure notes.
5.5 Accruals
Accruals are not recognised in the statement of financial position as a liability or as expenditure in the statement of financial performance but are included in the disclosure notes.
5.6 Employee Benefits
Short-term employee benefits that give rise to a present legal or constructive obligation are disclosed in the disclosure notes to the financial statements. These amounts are not recognised in the statement of financial performance or the statement of financial position.
5.7 Lease Commitments
Finance LeaseFinance leases are not recognised as assets and liabilities in the statement of financial position. Finance lease payments are recognised as a capital expense in the statement of financial performance and are not apportioned between the capital and the interest portions. The total finance lease payment is disclosed in the disclosure notes to the financial statements.
Operating LeaseOperating lease payments are recognised as an expense in the statement of financial performance. The operating lease commitments are disclosed in the discloser notes to the financial statement.
5.8 Impairment
The department tests for impairment where there is an indication that a receivable, loan or investment may be impaired. An assessment of whether there is an indication of possible impairment is done at each reporting date. An estimate is made for doubtful loans and receivables based on a review of all outstanding amounts at year-end. Impairments on investments are calculated as being the difference between the carrying amount and the present value of the expected future cash flows/service potential flowing from the instrument.
5.9 Provisions
Provisions are disclosed when there is a present legal or constructive obligation to forfeit economic benefits as a result of events in the past and it is probable that an outflow of resources embodying economic benefits will be required to settle the obligation and a reliable estimate of the obligation can be made.
6. Receivables for Departmental Revenue
Receivables for departmental revenue are disclosed in the disclosure notes to the annual financial statements. These receivables are written off when identified as irrecoverable and are disclosed separately.
7. Net Assets
7.1 Capitalisation Reserve
The capitalisation reserve comprises of financial assets and/or liabilities originating in a prior reporting period but which are recognised in the statement of financial position for the first time in the current reporting period. Amounts are recognised in the capitalisation reserves when identified in the current period and are transferred to the National/Provincial Revenue Fund when the underlying asset is disposed and the related funds are received.
7.2 Recoverable Revenue
Amounts are recognised as recoverable revenue when a payment made in a previous financial year becomes recoverable from a debtor in the current financial year. Amounts are either transferred to the National/Provincial Revenue Fund when recovered or are transferred to the statement of financial performance when written-off.
8. Related Party Transactions
Specific information with regards to related party transactions is included in the disclosure notes.
9. Key Management Personnel
Compensation paid to key management personnel including their family members where relevant, is included in the disclosure notes.
10. Public Private Partnerships
A description of the PPP arrangement, the contract fees and current and capital expenditure relating to the PPP arrangement is included in the disclosure notes.
GAUTENG DEPARTMENT OF ECONOMIC DEVELOPMENT | VOTE 3ANNUAL FINANCIAL STATEMENTS FOR THE YEAR ENDED 31 MARCH 2013
SECT
ION 05
103GAUTENG DEPARTMENT OF ECONOMIC DEVELOPMENT | ANNUAL REPORT 2012/13
NOTES TO THE ANNUAL FINANCIAL STATEMENTSfoR the YeAR eNded 31 mARCh 2013
1. Annual Appropriation
1.1 Annual Appropriation
Included are funds appropriated in terms of the Appropriation Act (and the Adjustments Appropriation Act) for National Departments (Voted funds) and Provincial Departments:
Programmes 2012/13 2011/12 Final Actual Funds not Appropriation Appropriation Received requested/ received received not received R’000 R’000 R’000 R’000
Administration 130 141 130 141 – 126 544Integrated Economic Development Services 196 460 196 460 – 190 533Trade and Sector Development 452 110 452 110 – 422 983Business Regulation and Governance 66 745 66 745 – 45 782Economic Planning 28 956 28 956 – 36 731
Total 874 412 874 412 – 822 573
2. Departmental Revenue
Note 2012/13 2011/12 R’000 R’000
Tax revenue 719 343 612 939Sales of goods and services other than capital assets 2.1 288 125Interest, dividends and rent on land 2.3 2 006 1 579Sales of capital assets 2.4 – 47Transactions in financial assets and liabilities 2.5 218 79
Total revenue collected 721 855 614 769
Departmental Revenue Collected 721 855 614 769
2.1 Sales of Goods and Services other than Capital Assets
Sales of goods and services produced by the department 286 124Administrative fees 8 7Other sales 278 117Sales of scrap, waste and other used current goods 2 1
Total 288 125
2.2 Interest, Dividends and Rent on Land
Interest 2 006 1 579
Total 2 006 1 579
GAUTENG DEPARTMENT OF ECONOMIC DEVELOPMENT | VOTE 3ANNUAL FINANCIAL STATEMENTS FOR THE YEAR ENDED 31 MARCH 2013
SECT
ION 05
104 GAUTENG DEPARTMENT OF ECONOMIC DEVELOPMENT | ANNUAL REPORT 2012/13
Note 2012/13 2011/12 R’000 R’000
2.3 Sale of Capital Assets
Tangible Assets – 47Machinery and equipment – 47
Total – 47
2.4 Transactions in Financial Assets and Liabilities
Receivables 12 21Other Receipts including Recoverable Revenue 206 58
Total 218 79
3. Compensation of Employees
3.1 Salaries and Wages
Basic salary 72 747 66 906Performance award 827 1 068Service Based 4 285 4 502Compensative/circumstantial 2 077 2 354Periodic payments 561 783Other non-pensionable allowances 16 154 14 806
Total 96 651 90 419
3.2 Social Contributions
Employer Contributions Pension 8 038 7 757Medical 5 601 5 318Bargaining council 15 14
Total 13 654 13 089 Total Compensation of Employees 110 305 103 508 Average number of employees 328 335
GAUTENG DEPARTMENT OF ECONOMIC DEVELOPMENT | VOTE 3ANNUAL FINANCIAL STATEMENTS FOR THE YEAR ENDED 31 MARCH 2013
SECT
ION 05
105GAUTENG DEPARTMENT OF ECONOMIC DEVELOPMENT | ANNUAL REPORT 2012/13
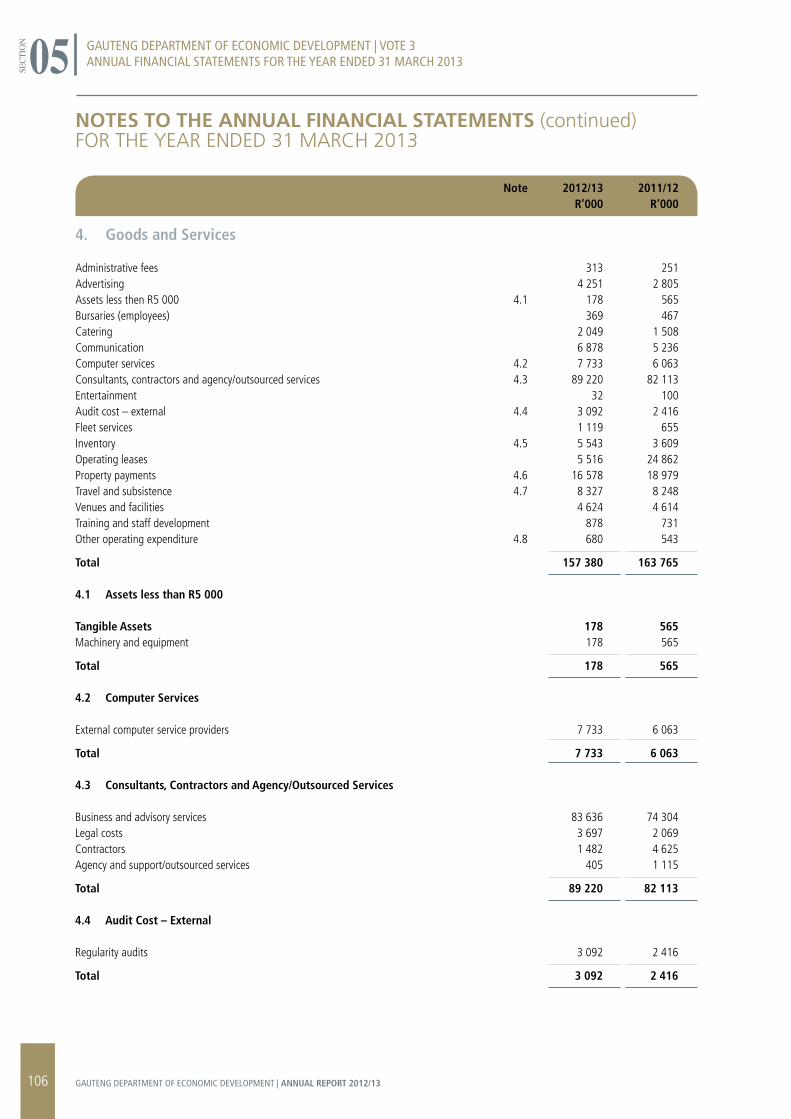
NOTES TO THE ANNUAL FINANCIAL STATEMENTS (continued)foR the YeAR eNded 31 mARCh 2013
Note 2012/13 2011/12 R’000 R’000
4. Goods and Services
Administrative fees 313 251Advertising 4 251 2 805Assets less then R5 000 4.1 178 565Bursaries (employees) 369 467Catering 2 049 1 508Communication 6 878 5 236Computer services 4.2 7 733 6 063Consultants, contractors and agency/outsourced services 4.3 89 220 82 113Entertainment 32 100Audit cost – external 4.4 3 092 2 416Fleet services 1 119 655Inventory 4.5 5 543 3 609Operating leases 5 516 24 862Property payments 4.6 16 578 18 979Travel and subsistence 4.7 8 327 8 248Venues and facilities 4 624 4 614Training and staff development 878 731Other operating expenditure 4.8 680 543
Total 157 380 163 765
4.1 Assets less than R5 000
Tangible Assets 178 565Machinery and equipment 178 565
Total 178 565
4.2 Computer Services
External computer service providers 7 733 6 063
Total 7 733 6 063
4.3 Consultants, Contractors and Agency/Outsourced Services
Business and advisory services 83 636 74 304Legal costs 3 697 2 069Contractors 1 482 4 625Agency and support/outsourced services 405 1 115
Total 89 220 82 113
4.4 Audit Cost – External
Regularity audits 3 092 2 416
Total 3 092 2 416
GAUTENG DEPARTMENT OF ECONOMIC DEVELOPMENT | VOTE 3ANNUAL FINANCIAL STATEMENTS FOR THE YEAR ENDED 31 MARCH 2013
SECT
ION 05
106 GAUTENG DEPARTMENT OF ECONOMIC DEVELOPMENT | ANNUAL REPORT 2012/13
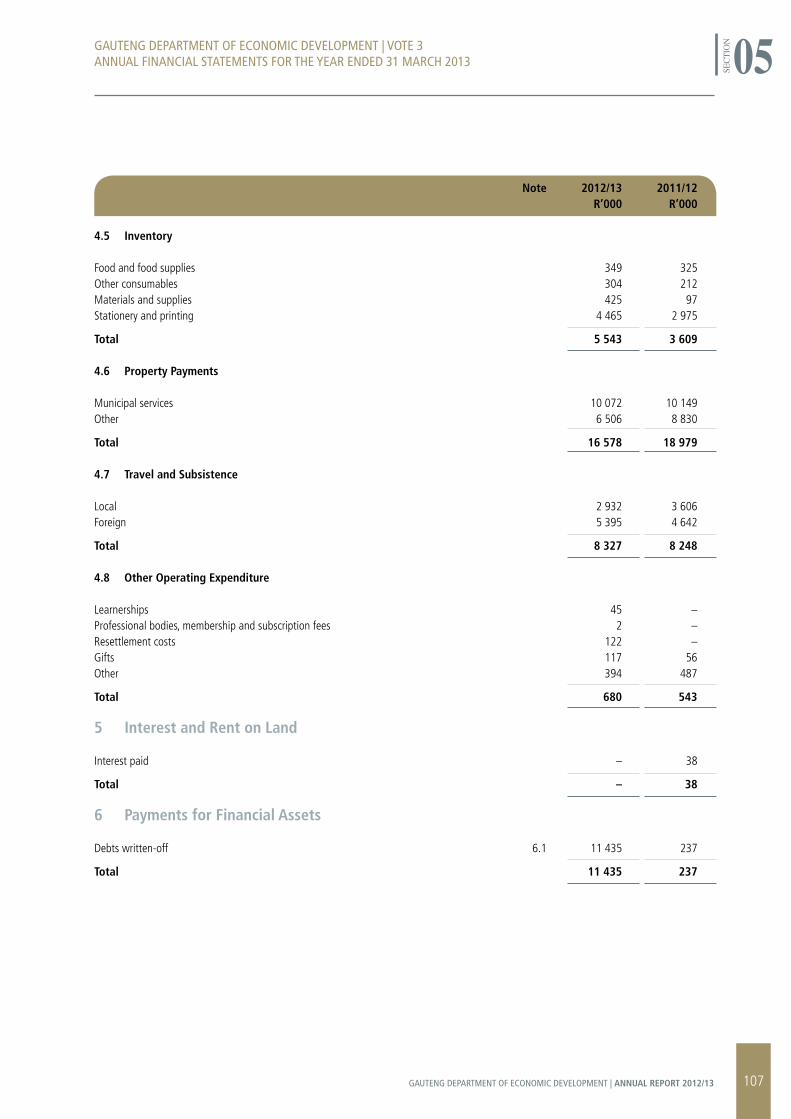
Note 2012/13 2011/12 R’000 R’000
4.5 Inventory Food and food supplies 349 325Other consumables 304 212Materials and supplies 425 97Stationery and printing 4 465 2 975
Total 5 543 3 609
4.6 Property Payments
Municipal services 10 072 10 149Other 6 506 8 830
Total 16 578 18 979
4.7 Travel and Subsistence
Local 2 932 3 606Foreign 5 395 4 642
Total 8 327 8 248
4.8 Other Operating Expenditure
Learnerships 45 –Professional bodies, membership and subscription fees 2 –Resettlement costs 122 –Gifts 117 56Other 394 487
Total 680 543
5 Interest and Rent on Land
Interest paid – 38
Total – 38
6 Payments for Financial Assets
Debts written-off 6.1 11 435 237
Total 11 435 237
GAUTENG DEPARTMENT OF ECONOMIC DEVELOPMENT | VOTE 3ANNUAL FINANCIAL STATEMENTS FOR THE YEAR ENDED 31 MARCH 2013
SECT
ION 05
107GAUTENG DEPARTMENT OF ECONOMIC DEVELOPMENT | ANNUAL REPORT 2012/13
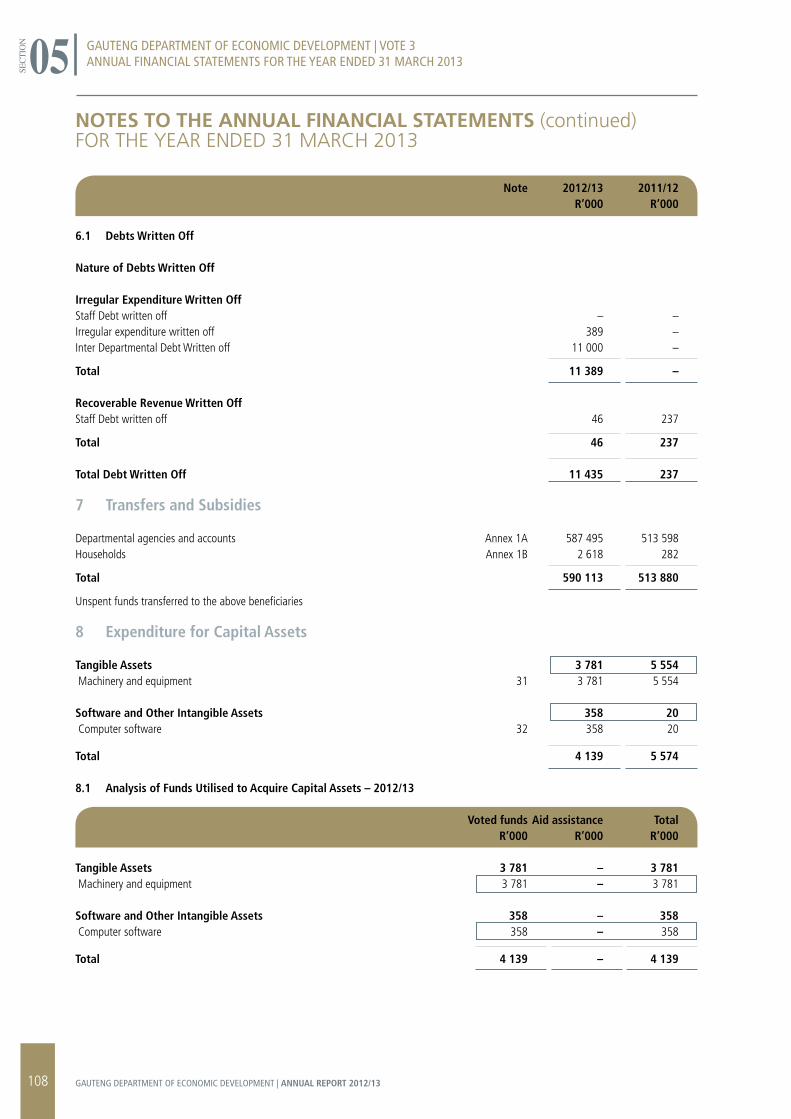
NOTES TO THE ANNUAL FINANCIAL STATEMENTS (continued)foR the YeAR eNded 31 mARCh 2013
Note 2012/13 2011/12 R’000 R’000
6.1 Debts Written Off
Nature of Debts Written Off
Irregular Expenditure Written Off Staff Debt written off – –Irregular expenditure written off 389 –Inter Departmental Debt Written off 11 000 –
Total 11 389 – Recoverable Revenue Written Off Staff Debt written off 46 237
Total 46 237
Total Debt Written Off 11 435 237 7 Transfers and Subsidies
Departmental agencies and accounts Annex 1A 587 495 513 598Households Annex 1B 2 618 282
Total 590 113 513 880
Unspent funds transferred to the above beneficiaries
8 Expenditure for Capital Assets
Tangible Assets 3 781 5 554 Machinery and equipment 31 3 781 5 554
Software and Other Intangible Assets 358 20 Computer software 32 358 20
Total 4 139 5 574
8.1 Analysis of Funds Utilised to Acquire Capital Assets – 2012/13
Voted funds Aid assistance Total R’000 R’000 R’000
Tangible Assets 3 781 – 3 781 Machinery and equipment 3 781 – 3 781
Software and Other Intangible Assets 358 – 358 Computer software 358 – 358
Total 4 139 – 4 139
GAUTENG DEPARTMENT OF ECONOMIC DEVELOPMENT | VOTE 3ANNUAL FINANCIAL STATEMENTS FOR THE YEAR ENDED 31 MARCH 2013
SECT
ION 05
108 GAUTENG DEPARTMENT OF ECONOMIC DEVELOPMENT | ANNUAL REPORT 2012/13
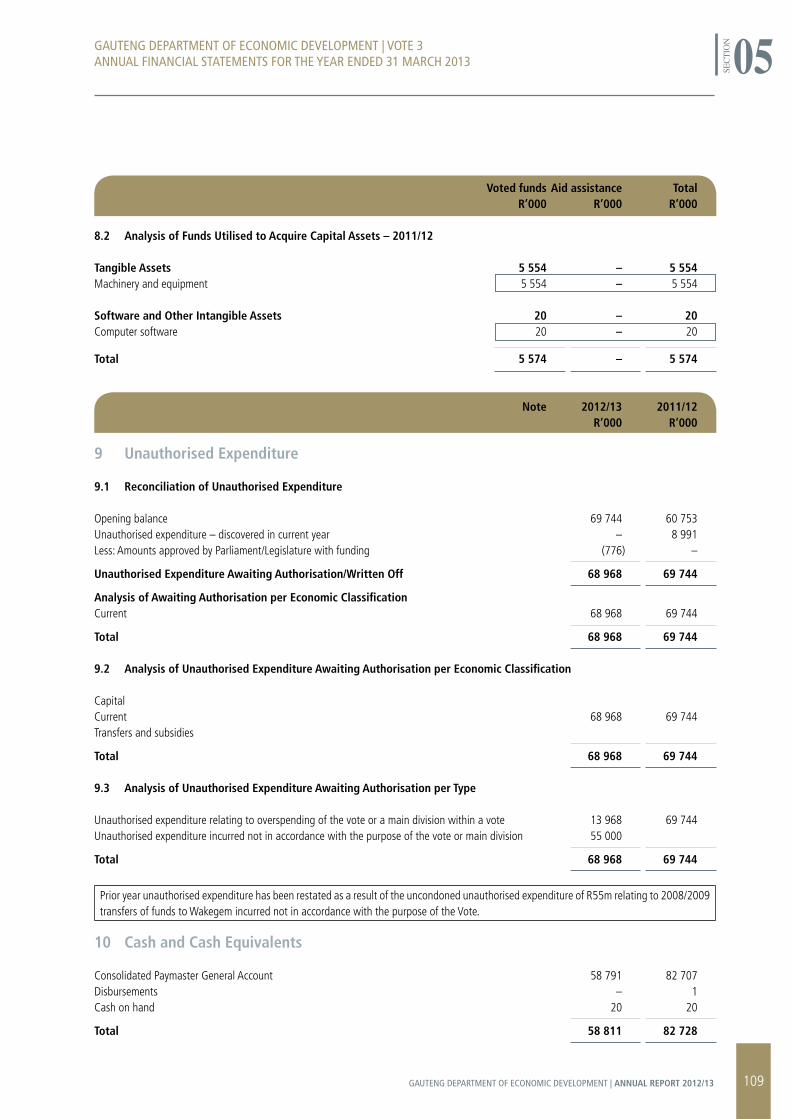
Voted funds Aid assistance Total R’000 R’000 R’000
8.2 Analysis of Funds Utilised to Acquire Capital Assets – 2011/12
Tangible Assets 5 554 – 5 554Machinery and equipment 5 554 – 5 554
Software and Other Intangible Assets 20 – 20Computer software 20 – 20
Total 5 574 – 5 574
Note 2012/13 2011/12 R’000 R’000
9 Unauthorised Expenditure
9.1 Reconciliation of Unauthorised Expenditure
Opening balance 69 744 60 753Unauthorised expenditure – discovered in current year – 8 991Less: Amounts approved by Parliament/Legislature with funding (776) –
Unauthorised Expenditure Awaiting Authorisation/Written Off 68 968 69 744
Analysis of Awaiting Authorisation per Economic ClassificationCurrent 68 968 69 744
Total 68 968 69 744
9.2 Analysis of Unauthorised Expenditure Awaiting Authorisation per Economic Classification
CapitalCurrent 68 968 69 744Transfers and subsidies
Total 68 968 69 744
9.3 Analysis of Unauthorised Expenditure Awaiting Authorisation per Type
Unauthorised expenditure relating to overspending of the vote or a main division within a vote 13 968 69 744Unauthorised expenditure incurred not in accordance with the purpose of the vote or main division 55 000
Total 68 968 69 744
Prior year unauthorised expenditure has been restated as a result of the uncondoned unauthorised expenditure of R55m relating to 2008/2009 transfers of funds to Wakegem incurred not in accordance with the purpose of the Vote.
10 Cash and Cash Equivalents
Consolidated Paymaster General Account 58 791 82 707Disbursements – 1Cash on hand 20 20
Total 58 811 82 728
GAUTENG DEPARTMENT OF ECONOMIC DEVELOPMENT | VOTE 3ANNUAL FINANCIAL STATEMENTS FOR THE YEAR ENDED 31 MARCH 2013
SECT
ION 05
109GAUTENG DEPARTMENT OF ECONOMIC DEVELOPMENT | ANNUAL REPORT 2012/13
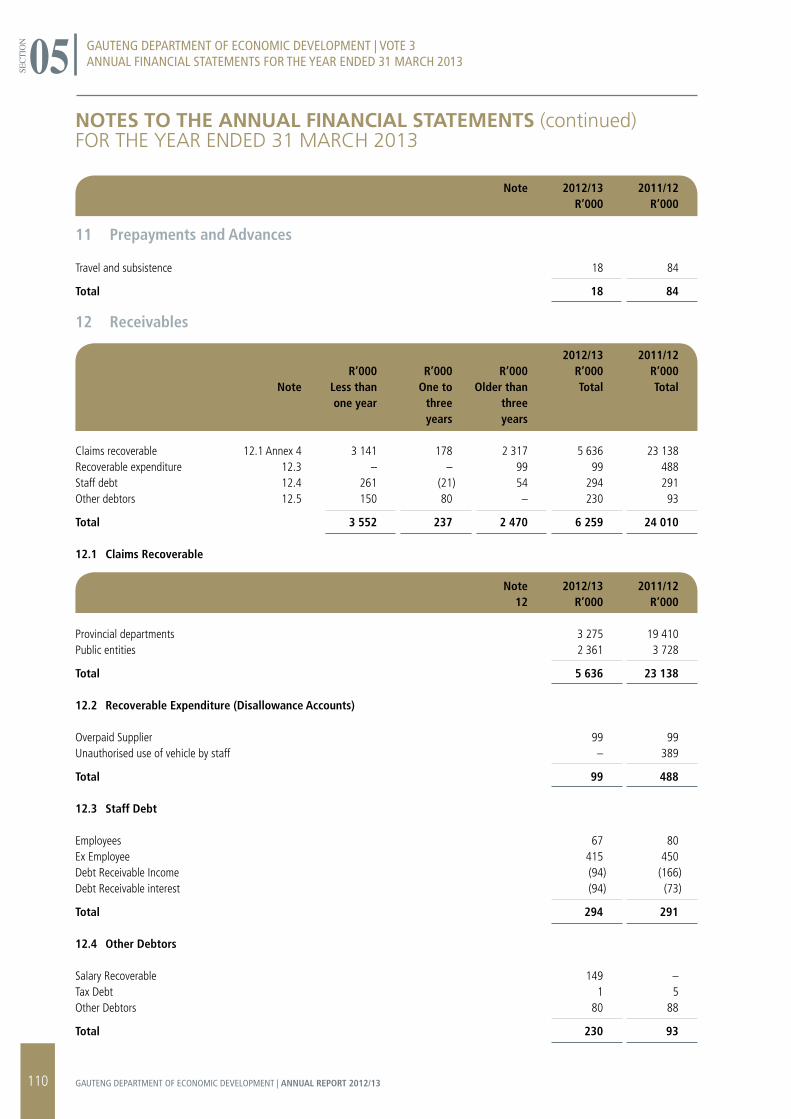
NOTES TO THE ANNUAL FINANCIAL STATEMENTS (continued)foR the YeAR eNded 31 mARCh 2013
Note 2012/13 2011/12 R’000 R’000
11 Prepayments and Advances
Travel and subsistence 18 84
Total 18 84
12 Receivables
2012/13 2011/12 R’000 R’000 R’000 R’000 R’000 Note Less than One to Older than Total Total one year three three years years
Claims recoverable 12.1 Annex 4 3 141 178 2 317 5 636 23 138Recoverable expenditure 12.3 – – 99 99 488Staff debt 12.4 261 (21) 54 294 291Other debtors 12.5 150 80 – 230 93
Total 3 552 237 2 470 6 259 24 010
12.1 Claims Recoverable
Note 2012/13 2011/12 12 R’000 R’000
Provincial departments 3 275 19 410Public entities 2 361 3 728
Total 5 636 23 138
12.2 Recoverable Expenditure (Disallowance Accounts)
Overpaid Supplier 99 99Unauthorised use of vehicle by staff – 389
Total 99 488
12.3 Staff Debt
Employees 67 80Ex Employee 415 450Debt Receivable Income (94) (166)Debt Receivable interest (94) (73)
Total 294 291
12.4 Other Debtors
Salary Recoverable 149 –Tax Debt 1 5Other Debtors 80 88
Total 230 93
GAUTENG DEPARTMENT OF ECONOMIC DEVELOPMENT | VOTE 3ANNUAL FINANCIAL STATEMENTS FOR THE YEAR ENDED 31 MARCH 2013
SECT
ION 05
110 GAUTENG DEPARTMENT OF ECONOMIC DEVELOPMENT | ANNUAL REPORT 2012/13
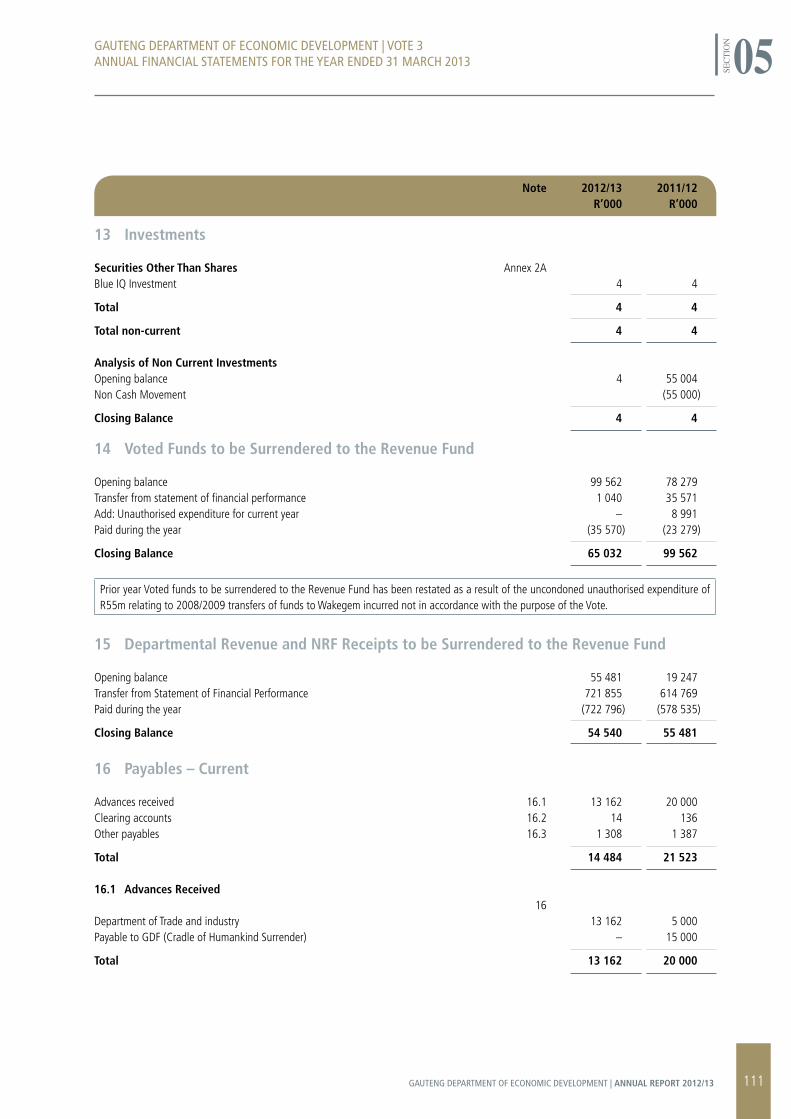
Note 2012/13 2011/12 R’000 R’000
13 Investments
Securities Other Than Shares Annex 2ABlue IQ Investment 4 4
Total 4 4
Total non-current 4 4
Analysis of Non Current Investments Opening balance 4 55 004Non Cash Movement (55 000)
Closing Balance 4 4 14 Voted Funds to be Surrendered to the Revenue Fund
Opening balance 99 562 78 279Transfer from statement of financial performance 1 040 35 571Add: Unauthorised expenditure for current year – 8 991Paid during the year (35 570) (23 279)
Closing Balance 65 032 99 562
Prior year Voted funds to be surrendered to the Revenue Fund has been restated as a result of the uncondoned unauthorised expenditure of R55m relating to 2008/2009 transfers of funds to Wakegem incurred not in accordance with the purpose of the Vote.
15 Departmental Revenue and NRF Receipts to be Surrendered to the Revenue Fund
Opening balance 55 481 19 247Transfer from Statement of Financial Performance 721 855 614 769Paid during the year (722 796) (578 535)
Closing Balance 54 540 55 481
16 Payables – Current
Advances received 16.1 13 162 20 000Clearing accounts 16.2 14 136Other payables 16.3 1 308 1 387
Total 14 484 21 523
16.1 Advances Received 16 Department of Trade and industry 13 162 5 000Payable to GDF (Cradle of Humankind Surrender) – 15 000
Total 13 162 20 000
GAUTENG DEPARTMENT OF ECONOMIC DEVELOPMENT | VOTE 3ANNUAL FINANCIAL STATEMENTS FOR THE YEAR ENDED 31 MARCH 2013
SECT
ION 05
111GAUTENG DEPARTMENT OF ECONOMIC DEVELOPMENT | ANNUAL REPORT 2012/13
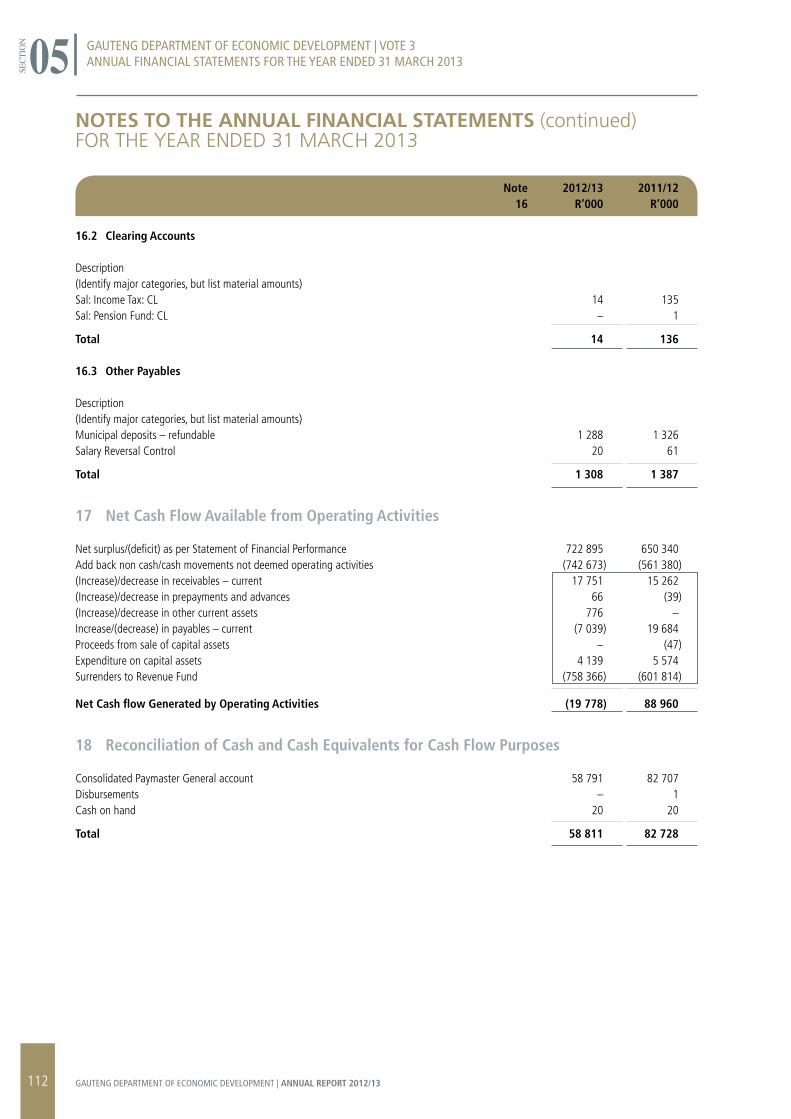
NOTES TO THE ANNUAL FINANCIAL STATEMENTS (continued)foR the YeAR eNded 31 mARCh 2013
Note 2012/13 2011/12 16 R’000 R’000
16.2 Clearing Accounts
Description(Identify major categories, but list material amounts)Sal: Income Tax: CL 14 135Sal: Pension Fund: CL – 1
Total 14 136
16.3 Other Payables
Description (Identify major categories, but list material amounts)Municipal deposits – refundable 1 288 1 326Salary Reversal Control 20 61
Total 1 308 1 387
17 Net Cash Flow Available from Operating Activities
Net surplus/(deficit) as per Statement of Financial Performance 722 895 650 340Add back non cash/cash movements not deemed operating activities (742 673) (561 380)(Increase)/decrease in receivables – current 17 751 15 262(Increase)/decrease in prepayments and advances 66 (39)(Increase)/decrease in other current assets 776 – Increase/(decrease) in payables – current (7 039) 19 684Proceeds from sale of capital assets – (47)Expenditure on capital assets 4 139 5 574Surrenders to Revenue Fund (758 366) (601 814)
Net Cash flow Generated by Operating Activities (19 778) 88 960
18 Reconciliation of Cash and Cash Equivalents for Cash Flow Purposes
Consolidated Paymaster General account 58 791 82 707Disbursements – 1Cash on hand 20 20
Total 58 811 82 728
GAUTENG DEPARTMENT OF ECONOMIC DEVELOPMENT | VOTE 3ANNUAL FINANCIAL STATEMENTS FOR THE YEAR ENDED 31 MARCH 2013
SECT
ION 05
112 GAUTENG DEPARTMENT OF ECONOMIC DEVELOPMENT | ANNUAL REPORT 2012/13
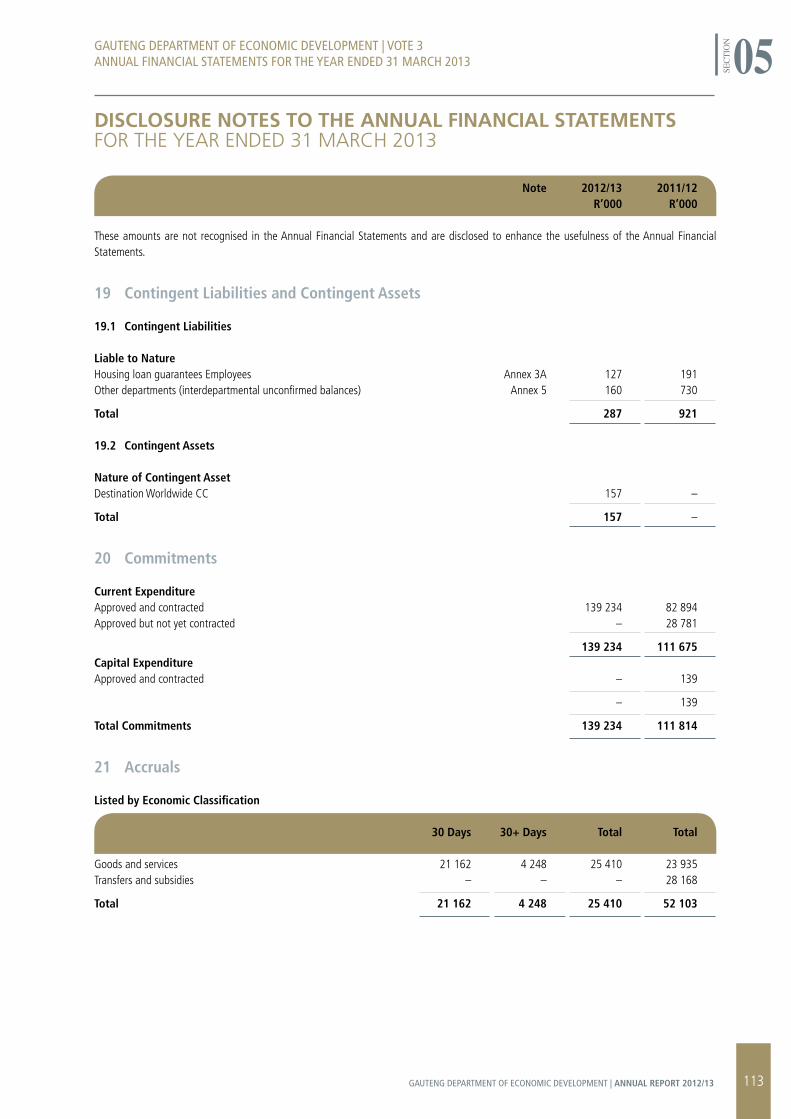
Note 2012/13 2011/12 R’000 R’000
These amounts are not recognised in the Annual Financial Statements and are disclosed to enhance the usefulness of the Annual Financial Statements.
19 Contingent Liabilities and Contingent Assets
19.1 Contingent Liabilities
Liable to Nature Housing loan guarantees Employees Annex 3A 127 191Other departments (interdepartmental unconfirmed balances) Annex 5 160 730
Total 287 921
19.2 Contingent Assets
Nature of Contingent Asset Destination Worldwide CC 157 –
Total 157 –
20 Commitments
Current Expenditure Approved and contracted 139 234 82 894Approved but not yet contracted – 28 781
139 234 111 675Capital Expenditure Approved and contracted – 139
– 139
Total Commitments 139 234 111 814
21 Accruals
Listed by Economic Classification
30 Days 30+ Days Total Total
Goods and services 21 162 4 248 25 410 23 935Transfers and subsidies – – – 28 168
Total 21 162 4 248 25 410 52 103
DISCLOSUrE NOTES TO THE ANNUAL FINANCIAL STATEMENTSfoR the YeAR eNded 31 mARCh 2013
GAUTENG DEPARTMENT OF ECONOMIC DEVELOPMENT | VOTE 3ANNUAL FINANCIAL STATEMENTS FOR THE YEAR ENDED 31 MARCH 2013
SECT
ION 05
113GAUTENG DEPARTMENT OF ECONOMIC DEVELOPMENT | ANNUAL REPORT 2012/13
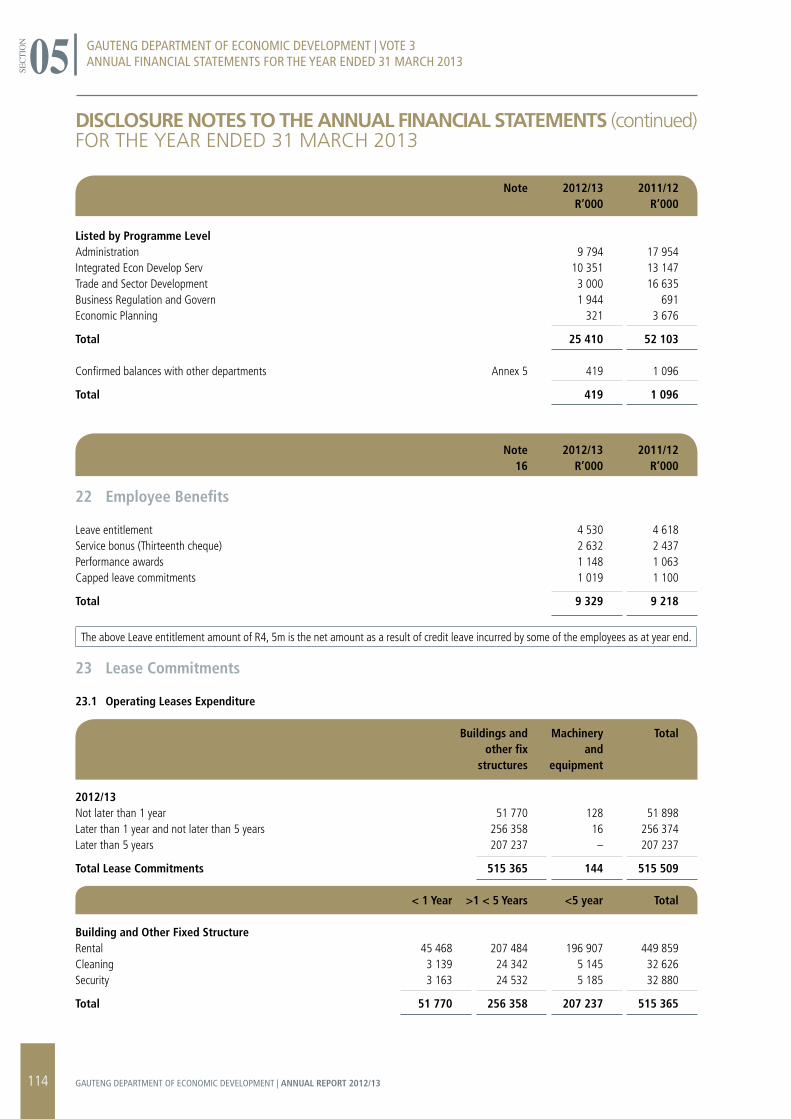
DISCLOSUrE NOTES TO THE ANNUAL FINANCIAL STATEMENTS (continued)foR the YeAR eNded 31 mARCh 2013
Note 2012/13 2011/12 R’000 R’000
Listed by Programme Level Administration 9 794 17 954Integrated Econ Develop Serv 10 351 13 147Trade and Sector Development 3 000 16 635Business Regulation and Govern 1 944 691Economic Planning 321 3 676
Total 25 410 52 103
Confirmed balances with other departments Annex 5 419 1 096
Total 419 1 096
Note 2012/13 2011/12 16 R’000 R’000
22 Employee Benefits
Leave entitlement 4 530 4 618Service bonus (Thirteenth cheque) 2 632 2 437Performance awards 1 148 1 063Capped leave commitments 1 019 1 100
Total 9 329 9 218
The above Leave entitlement amount of R4, 5m is the net amount as a result of credit leave incurred by some of the employees as at year end.
23 Lease Commitments
23.1 Operating Leases Expenditure
Buildings and Machinery Total other fix and structures equipment
2012/13Not later than 1 year 51 770 128 51 898Later than 1 year and not later than 5 years 256 358 16 256 374Later than 5 years 207 237 – 207 237
Total Lease Commitments 515 365 144 515 509
< 1 Year >1 < 5 Years <5 year Total
Building and Other Fixed StructureRental 45 468 207 484 196 907 449 859Cleaning 3 139 24 342 5 145 32 626Security 3 163 24 532 5 185 32 880
Total 51 770 256 358 207 237 515 365
GAUTENG DEPARTMENT OF ECONOMIC DEVELOPMENT | VOTE 3ANNUAL FINANCIAL STATEMENTS FOR THE YEAR ENDED 31 MARCH 2013
SECT
ION 05
114 GAUTENG DEPARTMENT OF ECONOMIC DEVELOPMENT | ANNUAL REPORT 2012/13
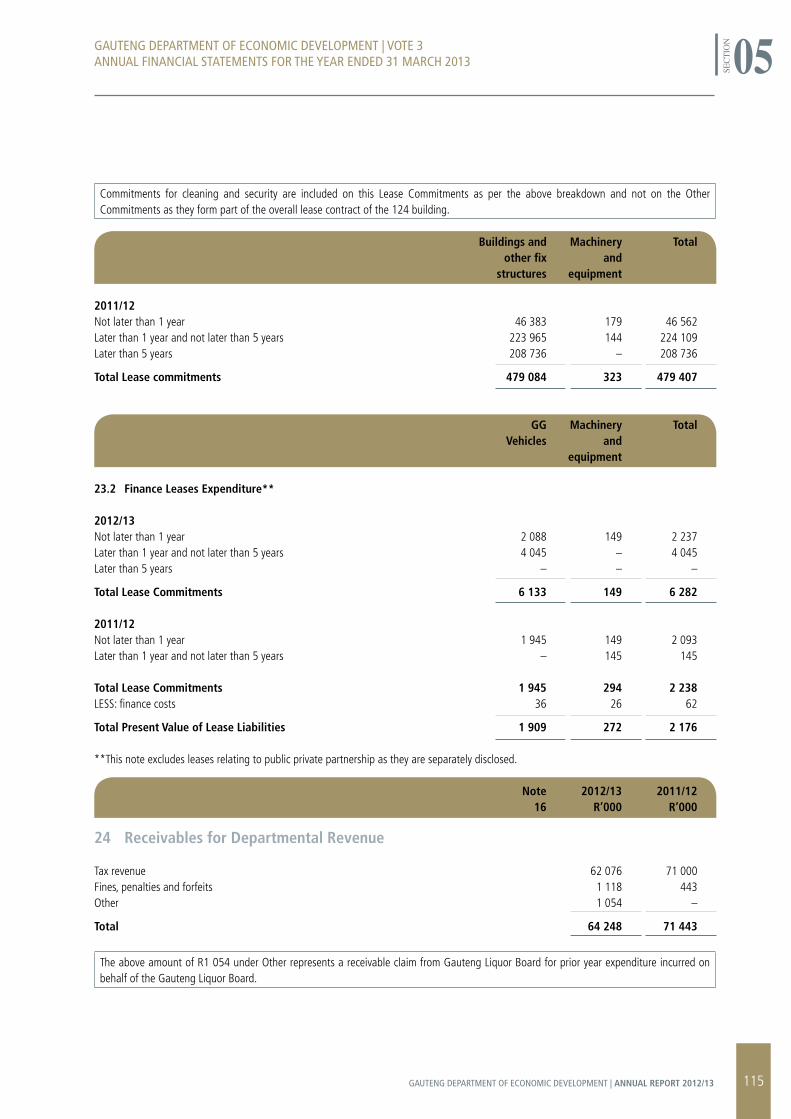
Commitments for cleaning and security are included on this Lease Commitments as per the above breakdown and not on the Other Commitments as they form part of the overall lease contract of the 124 building.
Buildings and Machinery Total other fix and structures equipment
2011/12 Not later than 1 year 46 383 179 46 562Later than 1 year and not later than 5 years 223 965 144 224 109Later than 5 years 208 736 – 208 736
Total Lease commitments 479 084 323 479 407
GG Machinery Total Vehicles and equipment
23.2 Finance Leases Expenditure**
2012/13 Not later than 1 year 2 088 149 2 237Later than 1 year and not later than 5 years 4 045 – 4 045Later than 5 years – – –
Total Lease Commitments 6 133 149 6 282
2011/12 Not later than 1 year 1 945 149 2 093Later than 1 year and not later than 5 years – 145 145 Total Lease Commitments 1 945 294 2 238LESS: finance costs 36 26 62
Total Present Value of Lease Liabilities 1 909 272 2 176
**This note excludes leases relating to public private partnership as they are separately disclosed.
Note 2012/13 2011/12 16 R’000 R’000
24 Receivables for Departmental Revenue
Tax revenue 62 076 71 000Fines, penalties and forfeits 1 118 443Other 1 054 –
Total 64 248 71 443
The above amount of R1 054 under Other represents a receivable claim from Gauteng Liquor Board for prior year expenditure incurred on behalf of the Gauteng Liquor Board.
GAUTENG DEPARTMENT OF ECONOMIC DEVELOPMENT | VOTE 3ANNUAL FINANCIAL STATEMENTS FOR THE YEAR ENDED 31 MARCH 2013
SECT
ION 05
115GAUTENG DEPARTMENT OF ECONOMIC DEVELOPMENT | ANNUAL REPORT 2012/13
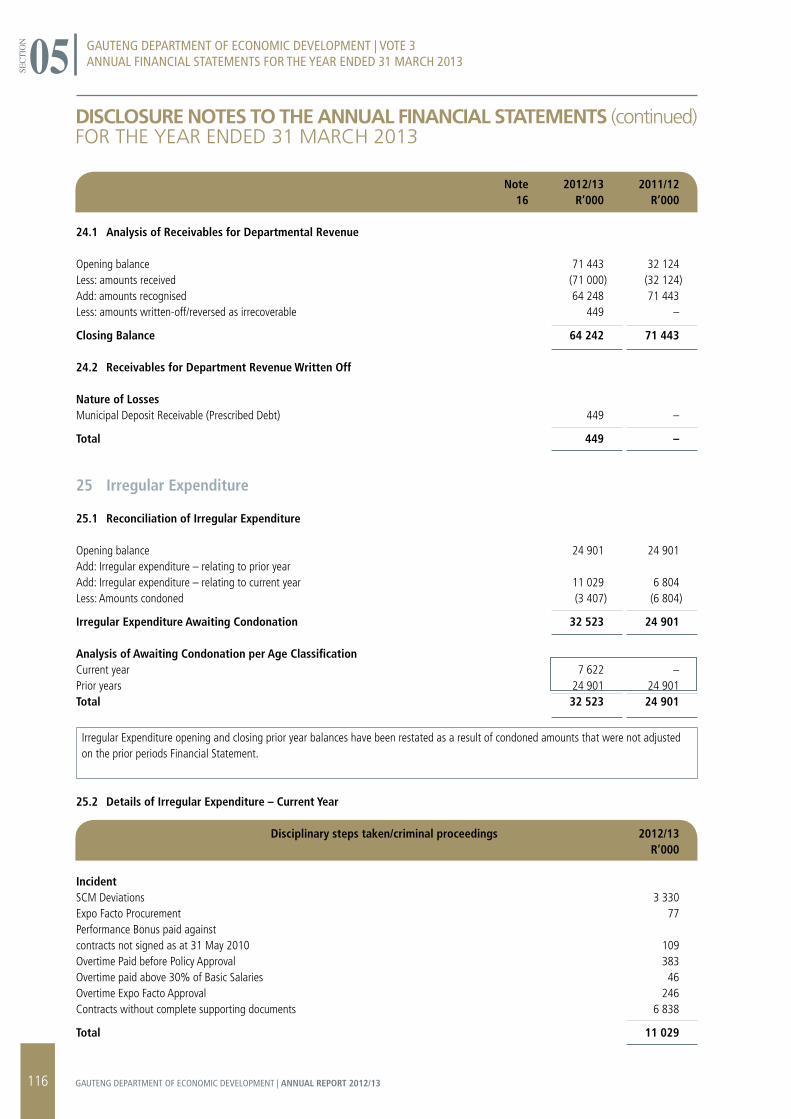
DISCLOSUrE NOTES TO THE ANNUAL FINANCIAL STATEMENTS (continued)foR the YeAR eNded 31 mARCh 2013
Note 2012/13 2011/12 16 R’000 R’000
24.1 Analysis of Receivables for Departmental Revenue
Opening balance 71 443 32 124Less: amounts received (71 000) (32 124)Add: amounts recognised 64 248 71 443Less: amounts written-off/reversed as irrecoverable 449 –
Closing Balance 64 242 71 443
24.2 Receivables for Department Revenue Written Off
Nature of LossesMunicipal Deposit Receivable (Prescribed Debt) 449 –
Total 449 –
25 Irregular Expenditure
25.1 Reconciliation of Irregular Expenditure
Opening balance 24 901 24 901Add: Irregular expenditure – relating to prior year Add: Irregular expenditure – relating to current year 11 029 6 804Less: Amounts condoned (3 407) (6 804)
Irregular Expenditure Awaiting Condonation 32 523 24 901
Analysis of Awaiting Condonation per Age ClassificationCurrent year 7 622 –Prior years 24 901 24 901Total 32 523 24 901
Irregular Expenditure opening and closing prior year balances have been restated as a result of condoned amounts that were not adjusted on the prior periods Financial Statement.
25.2 Details of Irregular Expenditure – Current Year
Disciplinary steps taken/criminal proceedings 2012/13 R’000
IncidentSCM Deviations 3 330Expo Facto Procurement 77Performance Bonus paid against contracts not signed as at 31 May 2010 109Overtime Paid before Policy Approval 383Overtime paid above 30% of Basic Salaries 46Overtime Expo Facto Approval 246Contracts without complete supporting documents 6 838
Total 11 029
GAUTENG DEPARTMENT OF ECONOMIC DEVELOPMENT | VOTE 3ANNUAL FINANCIAL STATEMENTS FOR THE YEAR ENDED 31 MARCH 2013
SECT
ION 05
116 GAUTENG DEPARTMENT OF ECONOMIC DEVELOPMENT | ANNUAL REPORT 2012/13
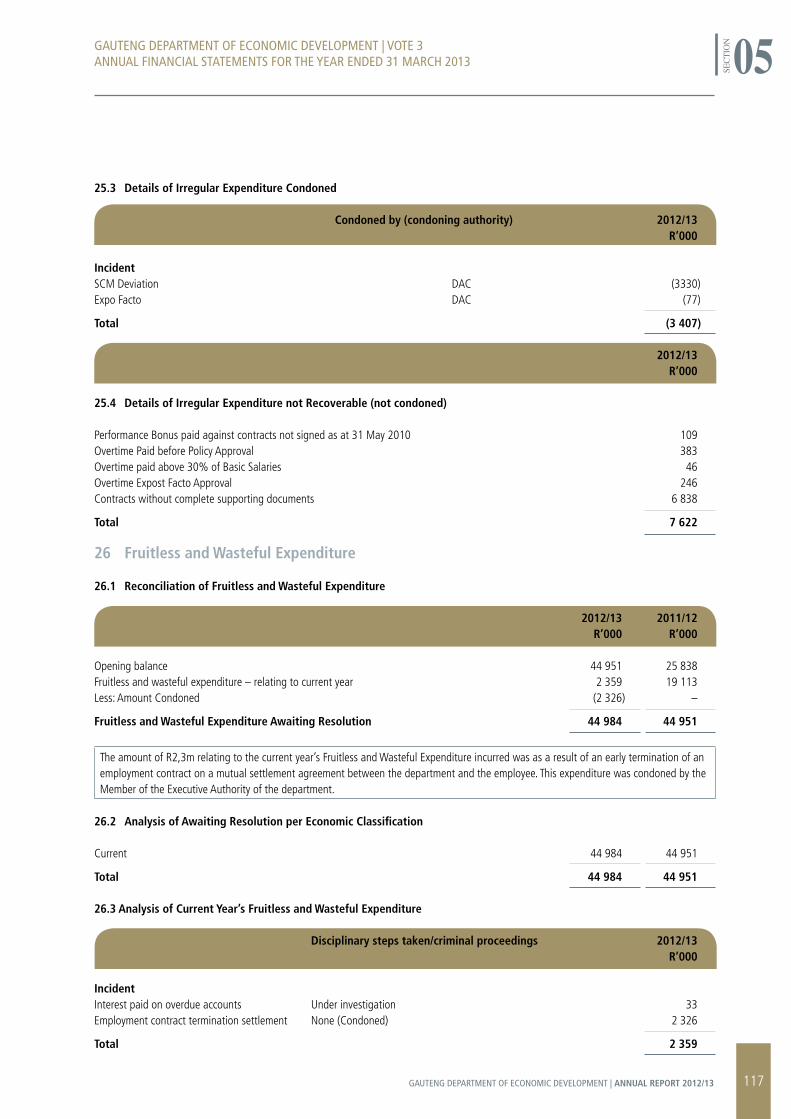
25.3 Details of Irregular Expenditure Condoned
Condoned by (condoning authority) 2012/13 R’000
IncidentSCM Deviation DAC (3330)Expo Facto DAC (77)
Total (3 407) 2012/13 R’000
25.4 Details of Irregular Expenditure not Recoverable (not condoned)
Performance Bonus paid against contracts not signed as at 31 May 2010 109Overtime Paid before Policy Approval 383Overtime paid above 30% of Basic Salaries 46Overtime Expost Facto Approval 246Contracts without complete supporting documents 6 838
Total 7 622
26 Fruitless and Wasteful Expenditure
26.1 Reconciliation of Fruitless and Wasteful Expenditure
2012/13 2011/12 R’000 R’000
Opening balance 44 951 25 838Fruitless and wasteful expenditure – relating to current year 2 359 19 113Less: Amount Condoned (2 326) –
Fruitless and Wasteful Expenditure Awaiting Resolution 44 984 44 951
The amount of R2,3m relating to the current year’s Fruitless and Wasteful Expenditure incurred was as a result of an early termination of an employment contract on a mutual settlement agreement between the department and the employee. This expenditure was condoned by the Member of the Executive Authority of the department.
26.2 Analysis of Awaiting Resolution per Economic Classification Current 44 984 44 951
Total 44 984 44 951
26.3 Analysis of Current Year’s Fruitless and Wasteful Expenditure Disciplinary steps taken/criminal proceedings 2012/13 R’000 IncidentInterest paid on overdue accounts Under investigation 33Employment contract termination settlement None (Condoned) 2 326
Total 2 359
GAUTENG DEPARTMENT OF ECONOMIC DEVELOPMENT | VOTE 3ANNUAL FINANCIAL STATEMENTS FOR THE YEAR ENDED 31 MARCH 2013
SECT
ION 05
117GAUTENG DEPARTMENT OF ECONOMIC DEVELOPMENT | ANNUAL REPORT 2012/13
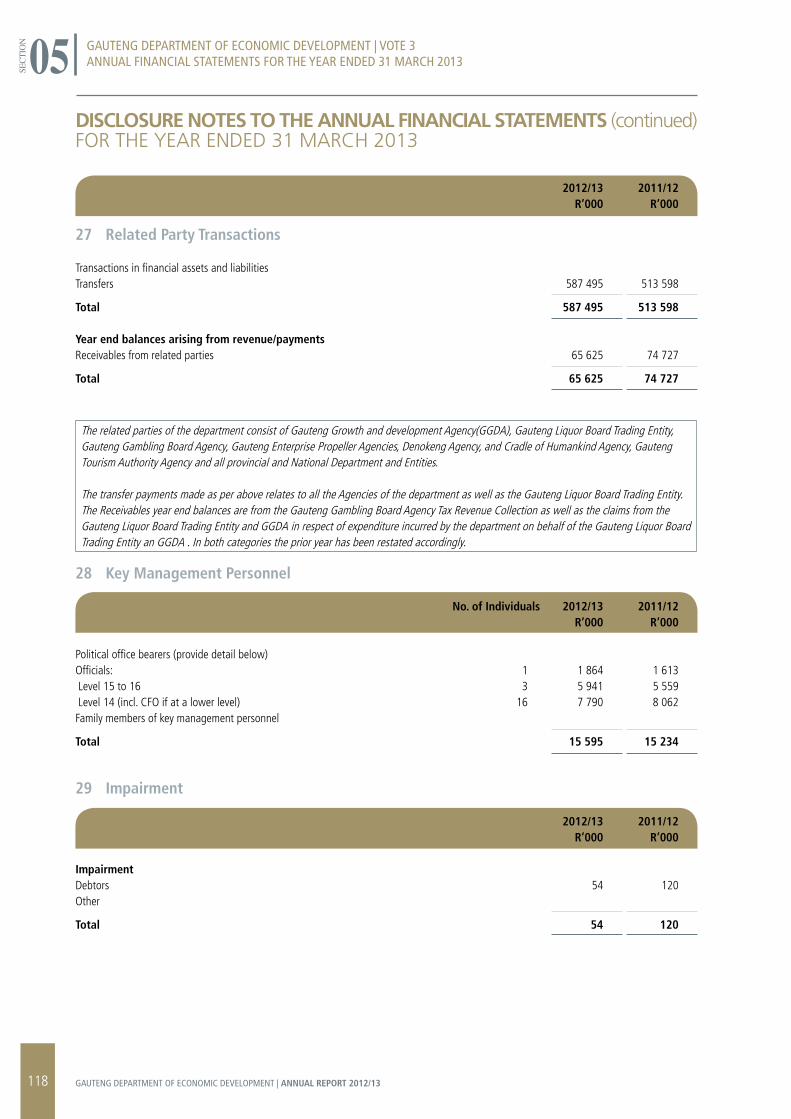
DISCLOSUrE NOTES TO THE ANNUAL FINANCIAL STATEMENTS (continued)foR the YeAR eNded 31 mARCh 2013
2012/13 2011/12 R’000 R’000
27 Related Party Transactions
Transactions in financial assets and liabilitiesTransfers 587 495 513 598
Total 587 495 513 598
Year end balances arising from revenue/paymentsReceivables from related parties 65 625 74 727
Total 65 625 74 727
The related parties of the department consist of Gauteng Growth and development Agency(GGDA), Gauteng Liquor Board Trading Entity, Gauteng Gambling Board Agency, Gauteng Enterprise Propeller Agencies, Denokeng Agency, and Cradle of Humankind Agency, Gauteng Tourism Authority Agency and all provincial and National Department and Entities.
The transfer payments made as per above relates to all the Agencies of the department as well as the Gauteng Liquor Board Trading Entity. The Receivables year end balances are from the Gauteng Gambling Board Agency Tax Revenue Collection as well as the claims from the Gauteng Liquor Board Trading Entity and GGDA in respect of expenditure incurred by the department on behalf of the Gauteng Liquor Board Trading Entity an GGDA . In both categories the prior year has been restated accordingly.
28 Key Management Personnel
No. of Individuals 2012/13 2011/12 R’000 R’000
Political office bearers (provide detail below) Officials: 1 1 864 1 613 Level 15 to 16 3 5 941 5 559 Level 14 (incl. CFO if at a lower level) 16 7 790 8 062Family members of key management personnel
Total 15 595 15 234
29 Impairment
2012/13 2011/12 R’000 R’000
Impairment Debtors 54 120Other
Total 54 120
GAUTENG DEPARTMENT OF ECONOMIC DEVELOPMENT | VOTE 3ANNUAL FINANCIAL STATEMENTS FOR THE YEAR ENDED 31 MARCH 2013
SECT
ION 05
118 GAUTENG DEPARTMENT OF ECONOMIC DEVELOPMENT | ANNUAL REPORT 2012/13
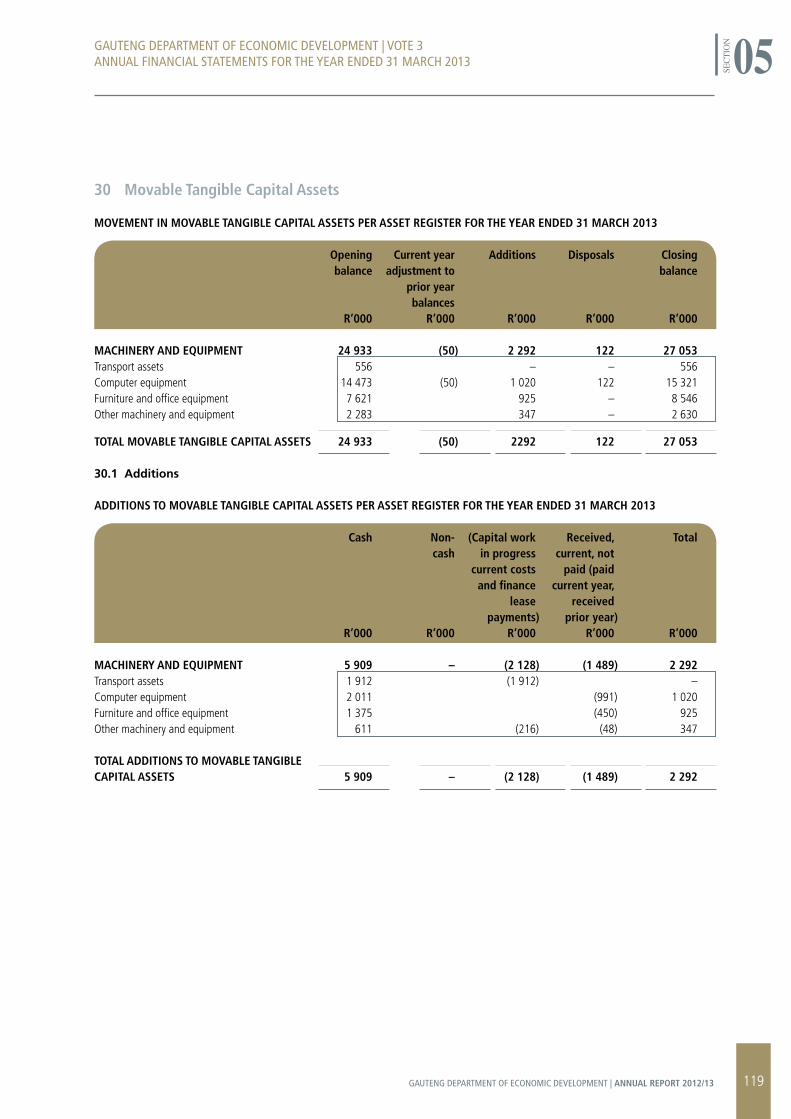
30 Movable Tangible Capital Assets
MOVEMENT IN MOVABLE TANGIBLE CAPITAL ASSETS PER ASSET REGISTER FOR THE YEAR ENDED 31 MARCH 2013
Opening Current year Additions Disposals Closing balance adjustment to balance prior year balances R’000 R’000 R’000 R’000 R’000
MACHINERY AND EQUIPMENT 24 933 (50) 2 292 122 27 053Transport assets 556 – – 556Computer equipment 14 473 (50) 1 020 122 15 321Furniture and office equipment 7 621 925 – 8 546Other machinery and equipment 2 283 347 – 2 630
TOTAL MOVABLE TANGIBLE CAPITAL ASSETS 24 933 (50) 2292 122 27 053
30.1 Additions
ADDITIONS TO MOVABLE TANGIBLE CAPITAL ASSETS PER ASSET REGISTER FOR THE YEAR ENDED 31 MARCH 2013
Cash Non- (Capital work Received, Total cash in progress current, not current costs paid (paid and finance current year, lease received payments) prior year) R’000 R’000 R’000 R’000 R’000
MACHINERY AND EQUIPMENT 5 909 – (2 128) (1 489) 2 292Transport assets 1 912 (1 912) –Computer equipment 2 011 (991) 1 020Furniture and office equipment 1 375 (450) 925Other machinery and equipment 611 (216) (48) 347 TOTAL ADDITIONS TO MOVABLE TANGIBLE CAPITAL ASSETS 5 909 – (2 128) (1 489) 2 292
GAUTENG DEPARTMENT OF ECONOMIC DEVELOPMENT | VOTE 3ANNUAL FINANCIAL STATEMENTS FOR THE YEAR ENDED 31 MARCH 2013
SECT
ION 05
119GAUTENG DEPARTMENT OF ECONOMIC DEVELOPMENT | ANNUAL REPORT 2012/13
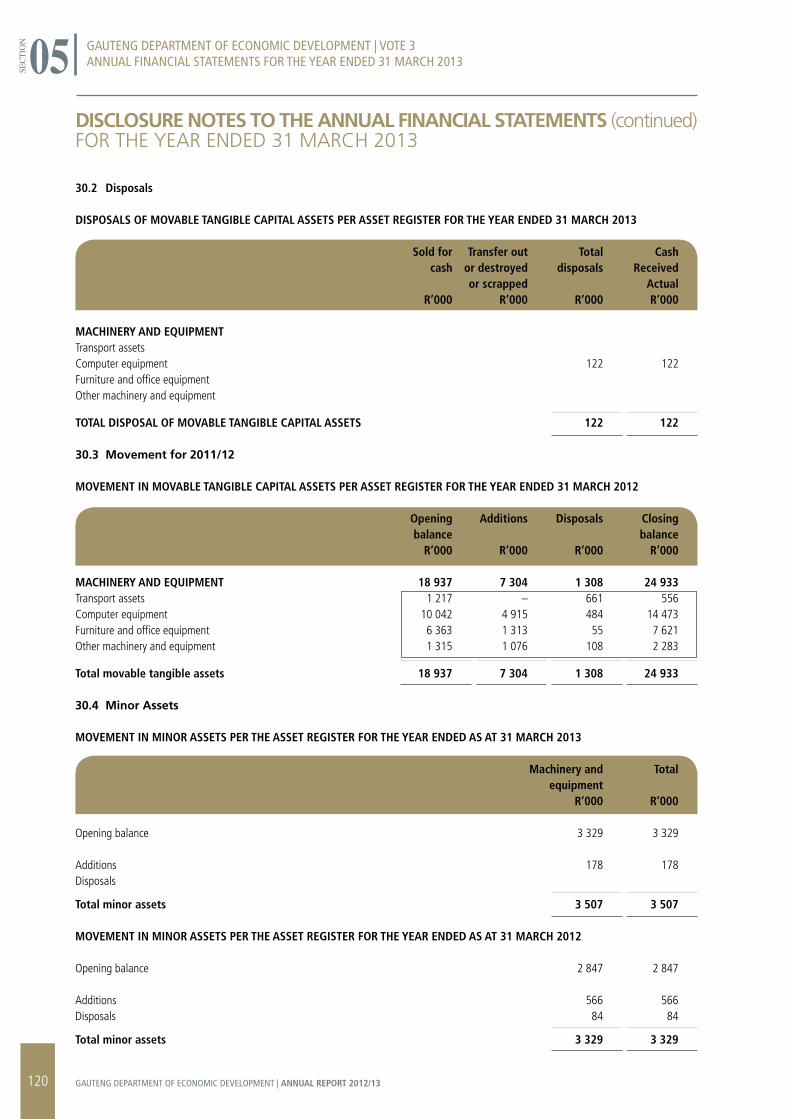
DISCLOSUrE NOTES TO THE ANNUAL FINANCIAL STATEMENTS (continued)foR the YeAR eNded 31 mARCh 2013
30.2 Disposals
DISPOSALS OF MOVABLE TANGIBLE CAPITAL ASSETS PER ASSET REGISTER FOR THE YEAR ENDED 31 MARCH 2013
Sold for Transfer out Total Cash cash or destroyed disposals Received or scrapped Actual R’000 R’000 R’000 R’000
MACHINERY AND EQUIPMENT Transport assets Computer equipment 122 122Furniture and office equipment Other machinery and equipment
TOTAL DISPOSAL OF MOVABLE TANGIBLE CAPITAL ASSETS 122 122
30.3 Movement for 2011/12
MOVEMENT IN MOVABLE TANGIBLE CAPITAL ASSETS PER ASSET REGISTER FOR THE YEAR ENDED 31 MARCH 2012
Opening Additions Disposals Closing balance balance R’000 R’000 R’000 R’000 MACHINERY AND EQUIPMENT 18 937 7 304 1 308 24 933 Transport assets 1 217 – 661 556Computer equipment 10 042 4 915 484 14 473Furniture and office equipment 6 363 1 313 55 7 621Other machinery and equipment 1 315 1 076 108 2 283
Total movable tangible assets 18 937 7 304 1 308 24 933
30.4 Minor Assets
MOVEMENT IN MINOR ASSETS PER THE ASSET REGISTER FOR THE YEAR ENDED AS AT 31 MARCH 2013
Machinery and Total equipment R’000 R’000
Opening balance 3 329 3 329
Additions 178 178Disposals
Total minor assets 3 507 3 507
MOVEMENT IN MINOR ASSETS PER THE ASSET REGISTER FOR THE YEAR ENDED AS AT 31 MARCH 2012 Opening balance 2 847 2 847
Additions 566 566Disposals 84 84
Total minor assets 3 329 3 329
GAUTENG DEPARTMENT OF ECONOMIC DEVELOPMENT | VOTE 3ANNUAL FINANCIAL STATEMENTS FOR THE YEAR ENDED 31 MARCH 2013
SECT
ION 05
120 GAUTENG DEPARTMENT OF ECONOMIC DEVELOPMENT | ANNUAL REPORT 2012/13
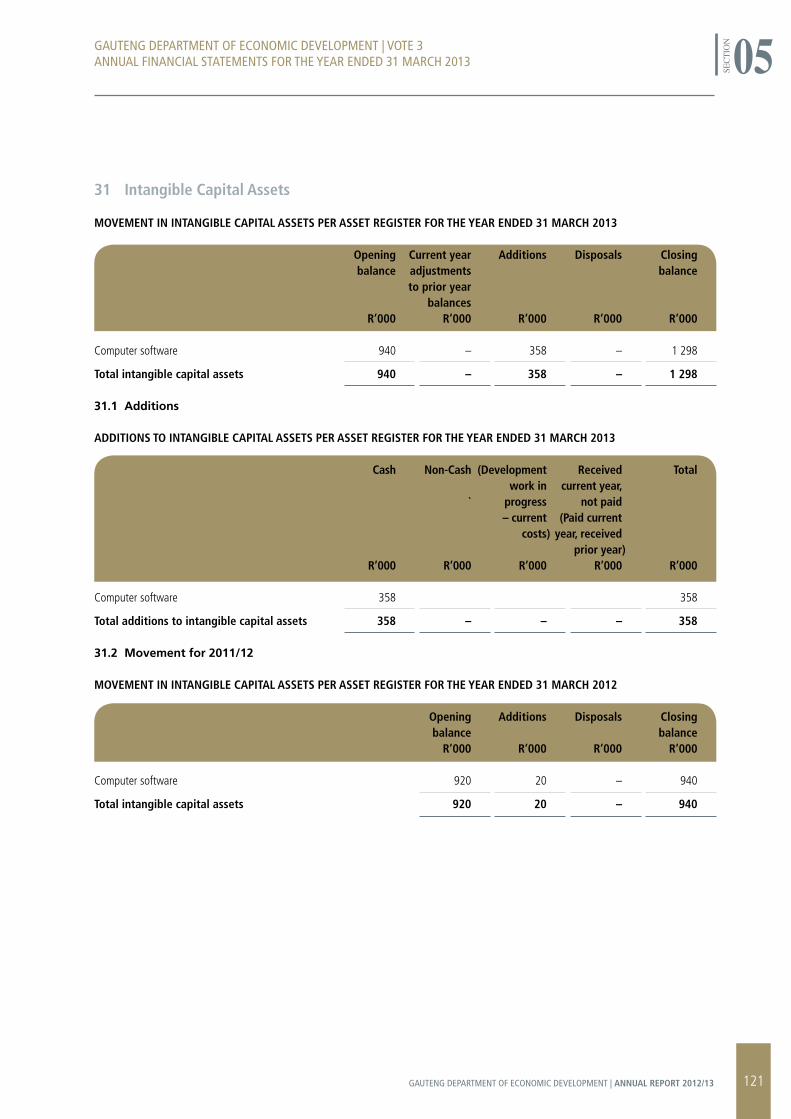
31 Intangible Capital Assets
MOVEMENT IN INTANGIBLE CAPITAL ASSETS PER ASSET REGISTER FOR THE YEAR ENDED 31 MARCH 2013
Opening Current year Additions Disposals Closing balance adjustments balance to prior year balances R’000 R’000 R’000 R’000 R’000 Computer software 940 – 358 – 1 298
Total intangible capital assets 940 – 358 – 1 298
31.1 Additions
ADDITIONS TO INTANGIBLE CAPITAL ASSETS PER ASSET REGISTER FOR THE YEAR ENDED 31 MARCH 2013
Cash Non-Cash (Development Received Total work in current year, ` progress not paid – current (Paid current costs) year, received prior year) R’000 R’000 R’000 R’000 R’000 Computer software 358 358
Total additions to intangible capital assets 358 – – – 358
31.2 Movement for 2011/12
MOVEMENT IN INTANGIBLE CAPITAL ASSETS PER ASSET REGISTER FOR THE YEAR ENDED 31 MARCH 2012
Opening Additions Disposals Closing balance balance R’000 R’000 R’000 R’000 Computer software 920 20 – 940
Total intangible capital assets 920 20 – 940
GAUTENG DEPARTMENT OF ECONOMIC DEVELOPMENT | VOTE 3ANNUAL FINANCIAL STATEMENTS FOR THE YEAR ENDED 31 MARCH 2013
SECT
ION 05
121GAUTENG DEPARTMENT OF ECONOMIC DEVELOPMENT | ANNUAL REPORT 2012/13
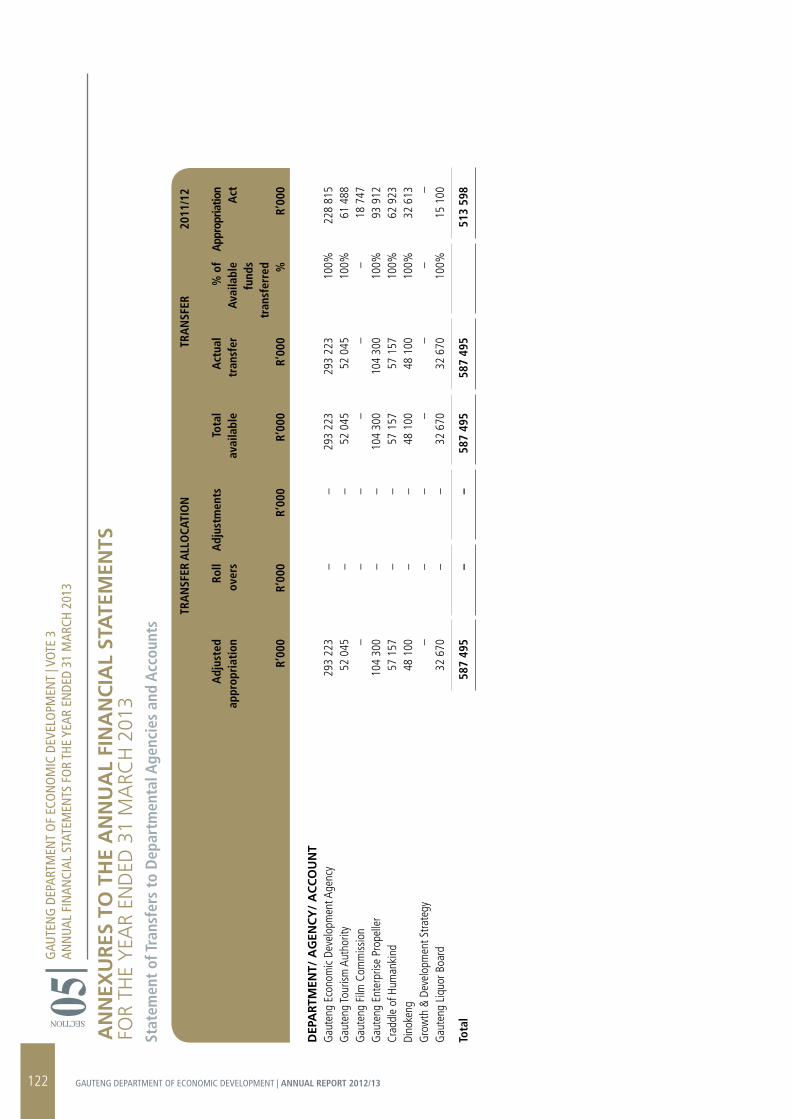
AN
NEX
Ur
ES T
O T
HE
AN
NU
AL
FIN
AN
CIA
L ST
ATE
MEN
TSfo
R th
e Y
eAR
eNd
ed 3
1 m
ARC
h 2
013
Stat
emen
t of
Tra
nsfe
rs t
o D
epar
tmen
tal A
genc
ies
and
Acc
ount
s
TR
AN
SFER
ALL
OCA
TIO
N
TRA
NSF
ER
2011
/12
Adj
uste
d Ro
ll A
djus
tmen
ts
Tota
l A
ctua
l %
of
Appr
opria
tion
appr
opri
atio
n ov
ers
av
aila
ble
tran
sfer
Av
aila
ble
Act
fund
s
tr
ansf
erre
d
R’
000
R’00
0 R’
000
R’00
0 R’
000
%
R’00
0
DEP
Ar
TMEN
T/ A
GEN
CY
/ A
CC
OU
NT
Gau
teng
Eco
nom
ic De
velo
pmen
t Age
ncy
293
223
– –
293
223
293
223
100%
22
8 81
5G
aute
ng To
urism
Aut
horit
y
52 0
45
– –
52 0
45
52 0
45
100%
61
488
Gau
teng
Film
Com
miss
ion
– –
– –
– –
18 7
47G
aute
ng E
nter
prise
Pro
pelle
r 10
4 30
0 –
– 10
4 30
0 10
4 30
0 10
0%
93 9
12Cr
addl
e of
Hum
anki
nd
57 1
57
– –
57 1
57
57 1
57
100%
62
923
Dino
keng
48
100
–
– 48
100
48
100
10
0%
32 6
13G
row
th &
Dev
elop
men
t Stra
tegy
–
– –
– –
– –
Gau
teng
Liq
uor B
oard
32
670
–
– 32
670
32
670
10
0%
15 1
00
Tota
l
587
495
– –
587
495
587
495
51
3 59
8
GAU
TEN
G D
EPAR
TMEN
T O
F EC
ON
OM
IC D
EVEL
OPM
ENT
| VOT
E 3
ANN
UAL
FIN
ANCI
AL S
TATE
MEN
TS F
OR
THE
YEAR
EN
DED
31 M
ARCH
201
3
SECTION 05
122 GAUTENG DEPARTMENT OF ECONOMIC DEVELOPMENT | ANNUAL REPORT 2012/13
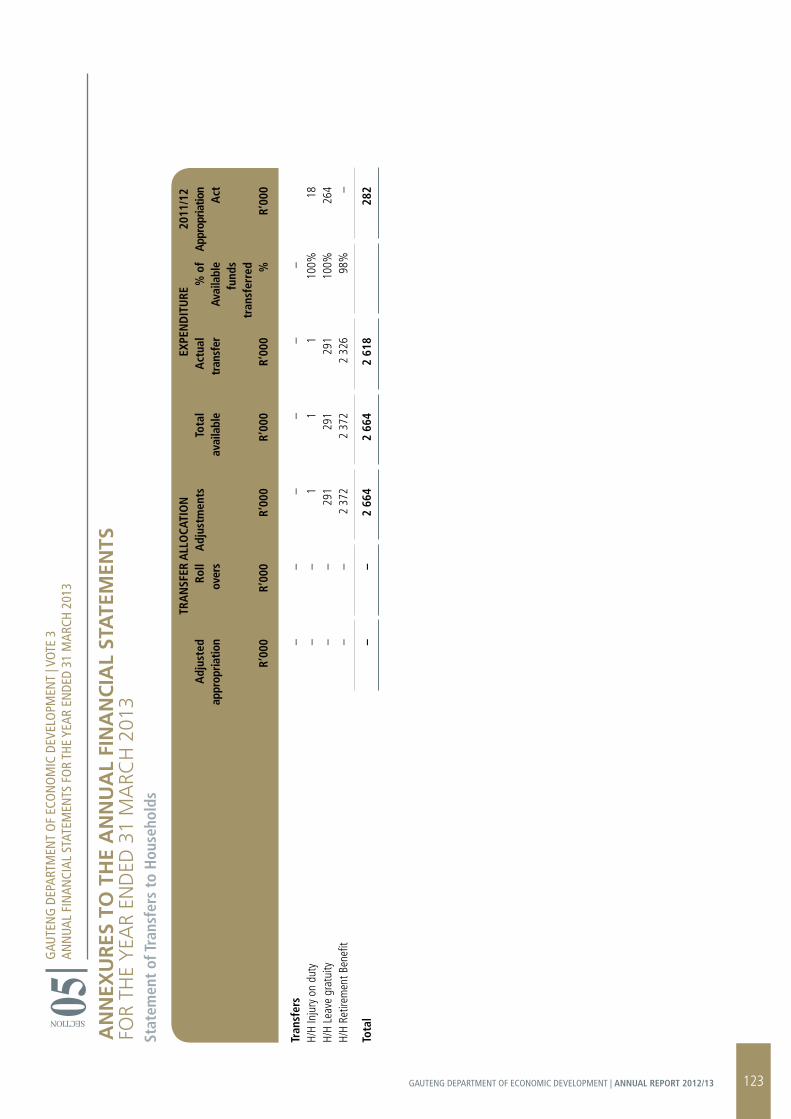
GAU
TEN
G D
EPAR
TMEN
T O
F EC
ON
OM
IC D
EVEL
OPM
ENT
| VOT
E 3
ANN
UAL
FIN
ANCI
AL S
TATE
MEN
TS F
OR
THE
YEAR
EN
DED
31 M
ARCH
201
3
SECTION 05A
NN
EXU
rES
TO
TH
E A
NN
UA
L FI
NA
NC
IAL
STA
TEM
ENTS
foR
the
YeA
R eN
ded
31
mA
RCh
201
3St
atem
ent
of T
rans
fers
to
Hou
seho
lds
TR
AN
SFER
ALL
OCA
TIO
N
EXPE
ND
ITU
RE
2011
/12
Adj
uste
d Ro
ll A
djus
tmen
ts
Tota
l A
ctua
l %
of
Appr
opria
tion
appr
opria
tion
over
s
avai
labl
e tr
ansf
er
Avai
labl
e A
ct
fu
nds
tran
sfer
red
R’00
0 R’
000
R’00
0 R’
000
R’00
0 %
R’
000
Tr
ansf
ers
– –
– –
– –
H/H
Inju
ry o
n du
ty
– –
1 1
1 10
0%
18H/
H Le
ave
grat
uity
–
– 29
1 29
1 29
1 10
0%
264
H/H
Retir
emen
t Ben
efit
– –
2 37
2 2
372
2 32
6 98
%
–
Tota
l
– –
2 66
4 2
664
2 61
8
282
123GAUTENG DEPARTMENT OF ECONOMIC DEVELOPMENT | ANNUAL REPORT 2012/13
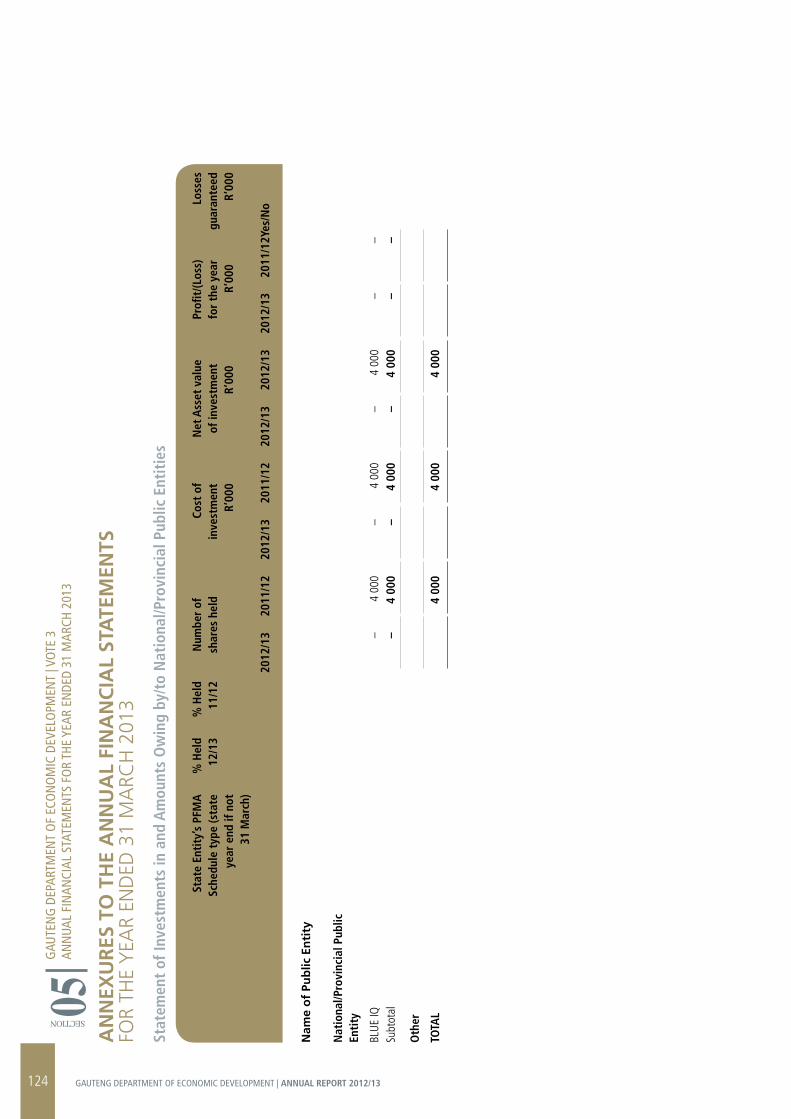
AN
NEX
Ur
ES T
O T
HE
AN
NU
AL
FIN
AN
CIA
L ST
ATE
MEN
TSfo
R th
e Y
eAR
eNd
ed 3
1 m
ARC
h 2
013
Stat
emen
t of
Inve
stm
ents
in a
nd A
mou
nts
Ow
ing
by/t
o N
atio
nal/P
rovi
ncia
l Pub
lic E
ntit
ies
St
ate
Enti
ty’s
PFM
A
Sche
dule
typ
e (s
tate
ye
ar e
nd if
not
31
Mar
ch)
% H
eld
12/1
3%
Hel
d11
/12
Num
ber
ofsh
ares
hel
d
C
ost
of
inve
stm
ent
R’
000
Net
Ass
et v
alue
of
inve
stm
ent
R’00
0
Profi
t/(L
oss)
fo
r th
e ye
ar
R
’000
Loss
es
guar
ante
edR’
000
2012
/13
2011
/12
2012
/13
2011
/12
2012
/13
2012
/13
2012
/13
2011
/12Y
es/N
o
Nam
e o
f Pu
blic
En
tity
Nat
iona
l/Pro
vinc
ial P
ublic
En
tity
BLUE
IQ
–
4 00
0 –
4 00
0 –
4 00
0 –
–Su
btot
al
–4
000
–4
000
–4
000
––
Oth
er
TOTA
L
4
000
4
000
4
000
GAU
TEN
G D
EPAR
TMEN
T O
F EC
ON
OM
IC D
EVEL
OPM
ENT
| VOT
E 3
ANN
UAL
FIN
ANCI
AL S
TATE
MEN
TS F
OR
THE
YEAR
EN
DED
31 M
ARCH
201
3
SECTION 05
124 GAUTENG DEPARTMENT OF ECONOMIC DEVELOPMENT | ANNUAL REPORT 2012/13
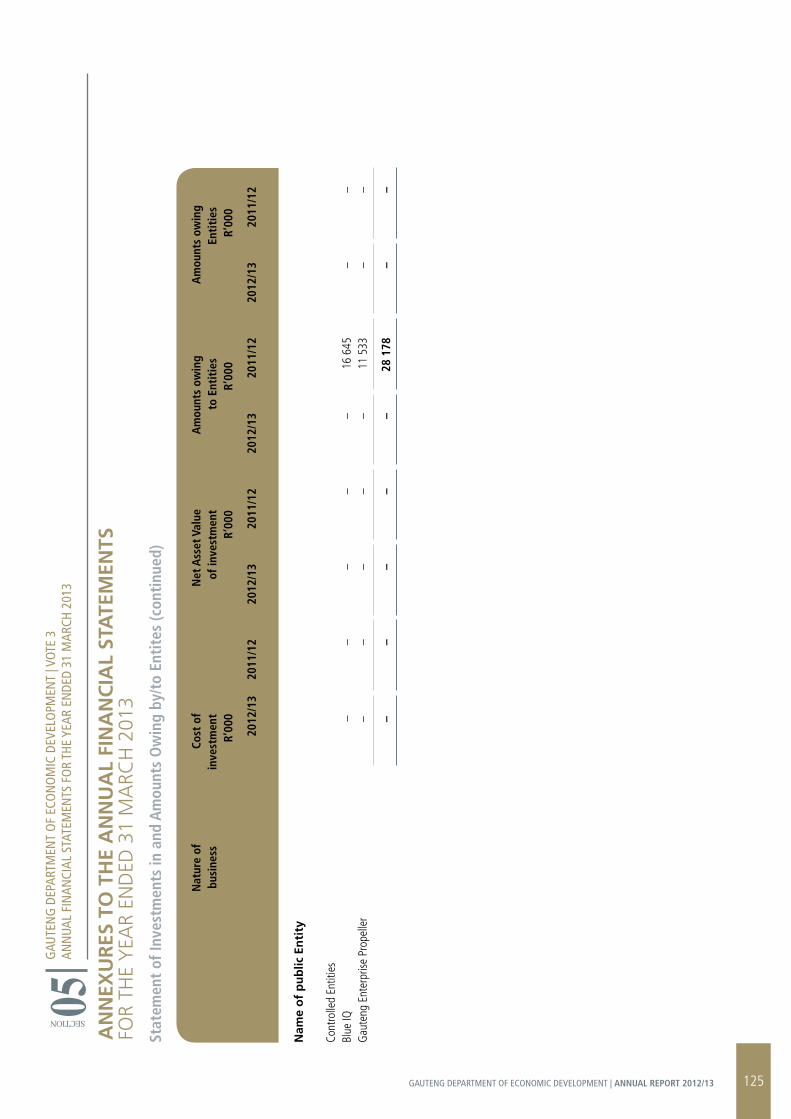
GAU
TEN
G D
EPAR
TMEN
T O
F EC
ON
OM
IC D
EVEL
OPM
ENT
| VOT
E 3
ANN
UAL
FIN
ANCI
AL S
TATE
MEN
TS F
OR
THE
YEAR
EN
DED
31 M
ARCH
201
3
SECTION 05A
NN
EXU
rES
TO
TH
E A
NN
UA
L FI
NA
NC
IAL
STA
TEM
ENTS
foR
the
YeA
R eN
ded
31
mA
RCh
201
3
Stat
emen
t of
Inve
stm
ents
in a
nd A
mou
nts
Ow
ing
by/t
o En
tite
s (c
onti
nued
)
N
atur
e of
C
ost
of
Net
Ass
et V
alue
A
mou
nts
owin
g
Am
ount
s ow
ing
b
usin
ess
inve
stm
ent
of i
nves
tmen
t
t
o En
titi
es
Enti
ties
R’00
0
R’00
0
R’
000
R’0
00
201
2/13
20
11/1
2 2
012/
13
2011
/12
201
2/13
20
11/1
2 2
012/
13
2011
/12
Nam
e o
f p
ub
lic E
nti
ty
Cont
rolle
d En
titie
sBl
ue IQ
–
–
– –
– 16
645
–
–
Gau
teng
Ent
erpr
ise P
rope
ller
–
–
– –
– 11
533
–
–
–
–
– –
– 28
178
–
–
125GAUTENG DEPARTMENT OF ECONOMIC DEVELOPMENT | ANNUAL REPORT 2012/13
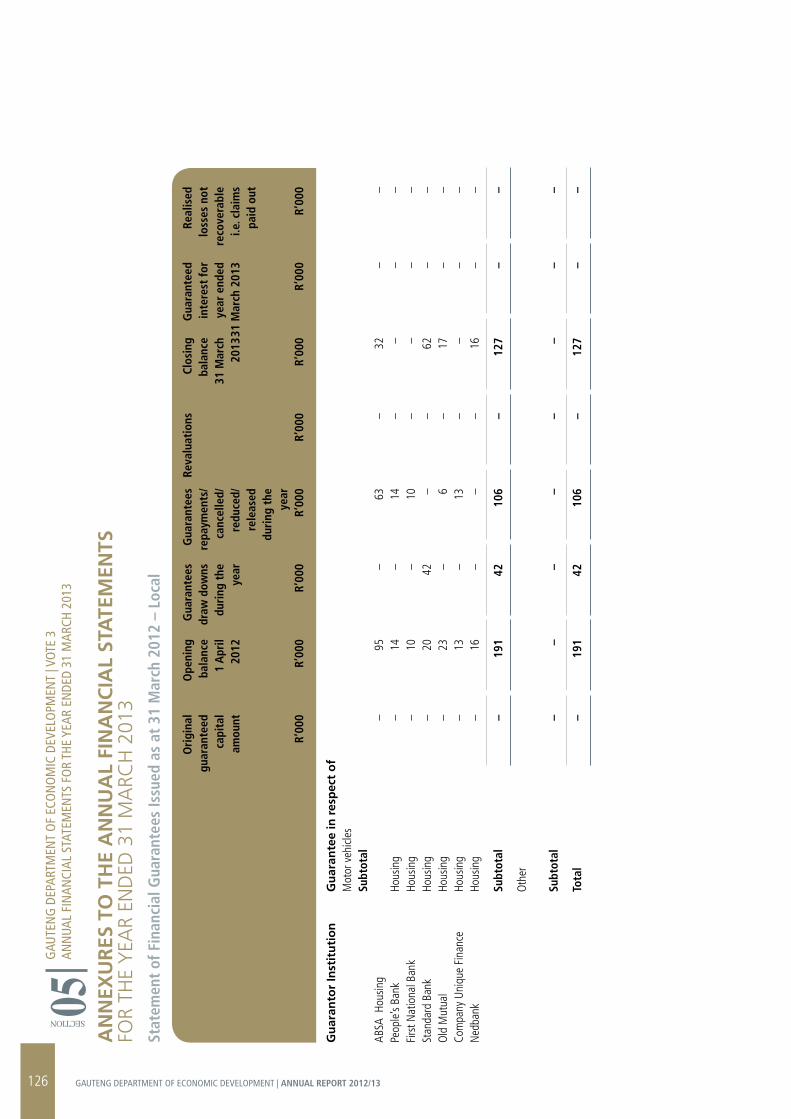
AN
NEX
Ur
ES T
O T
HE
AN
NU
AL
FIN
AN
CIA
L ST
ATE
MEN
TSfo
R th
e Y
eAR
eNd
ed 3
1 m
ARC
h 2
013
Stat
emen
t of
Fin
anci
al G
uara
ntee
s Is
sued
as
at 3
1 M
arch
201
2 –
Loca
l
O
rigi
nal
Ope
ning
G
uara
ntee
s G
uara
ntee
s Re
valu
atio
ns
Clos
ing
Gua
rant
eed
Real
ised
gu
aran
teed
ba
lanc
e dr
aw d
owns
re
paym
ents
/
bala
nce
inte
rest
for
loss
es n
ot
ca
pita
l 1
Apr
il du
ring
the
ca
ncel
led/
31 M
arch
ye
ar e
nded
re
cove
rabl
e
amou
nt
2012
ye
ar
redu
ced/
2013
31 M
arch
201
3 i.e
. cla
ims
rele
ased
paid
out
duri
ng t
he
year
R’
000
R’00
0 R’
000
R’00
0 R’
000
R’00
0 R’
000
R’00
0
Gu
aran
tor
Inst
itu
tio
n
Gu
aran
tee
in r
esp
ect
of
Mot
or v
ehicl
es
Su
btot
al
AB
SA H
ousin
g
– 95
–
63
– 32
–
–Pe
ople
’s Ba
nk
Hous
ing
– 14
–
14
– –
– –
Firs
t Nat
iona
l Ban
k Ho
usin
g –
10
– 10
–
– –
–St
anda
rd B
ank
Hous
ing
– 20
42
–
– 62
–
–O
ld M
utua
l Ho
usin
g –
23
– 6
– 17
–
–Co
mpa
ny U
niqu
e Fi
nanc
e Ho
usin
g –
13
– 13
–
– –
–N
edba
nk
Hous
ing
– 16
–
– –
16
– –
Subt
otal
–
191
42
106
– 12
7 –
–
Oth
er
Subt
otal
–
– –
– –
– –
–
Tota
l –
191
42
106
– 12
7 –
–
GAU
TEN
G D
EPAR
TMEN
T O
F EC
ON
OM
IC D
EVEL
OPM
ENT
| VOT
E 3
ANN
UAL
FIN
ANCI
AL S
TATE
MEN
TS F
OR
THE
YEAR
EN
DED
31 M
ARCH
201
3
SECTION 05
126 GAUTENG DEPARTMENT OF ECONOMIC DEVELOPMENT | ANNUAL REPORT 2012/13
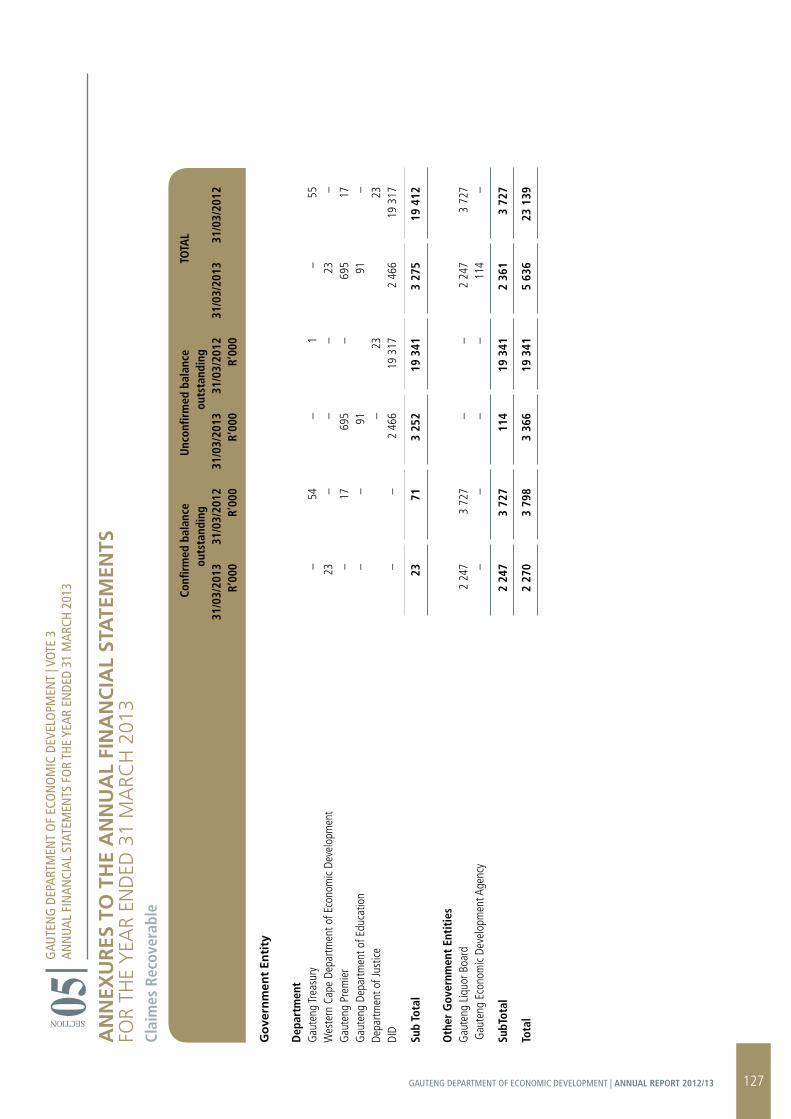
GAU
TEN
G D
EPAR
TMEN
T O
F EC
ON
OM
IC D
EVEL
OPM
ENT
| VOT
E 3
ANN
UAL
FIN
ANCI
AL S
TATE
MEN
TS F
OR
THE
YEAR
EN
DED
31 M
ARCH
201
3
SECTION 05A
NN
EXU
rES
TO
TH
E A
NN
UA
L FI
NA
NC
IAL
STA
TEM
ENTS
foR
the
YeA
R eN
ded
31
mA
RCh
201
3Cl
aim
es R
ecov
erab
le
Co
nfirm
ed b
alan
ce
Unc
onfir
med
bal
ance
TO
TAL
outs
tand
ing
ou
tsta
ndin
g
31/0
3/20
13
31/0
3/20
12
31/0
3/20
13
31/0
3/20
12
31/0
3/20
13
31/0
3/20
12
R’00
0 R’
000
R’00
0 R’
000
Go
vern
men
t En
tity
Dep
artm
ent
G
aute
ng Tr
easu
ry
–
54
– 1
– 55
Wes
tern
Cap
e De
partm
ent o
f Eco
nom
ic De
velo
pmen
t
23
–
– –
23
–G
aute
ng P
rem
ier
–
17
695
– 69
5 17
Gau
teng
Dep
artm
ent o
f Edu
catio
n
– –
91
91
–
Depa
rtmen
t of J
ustic
e
– 23
23DI
D
–
– 2
466
19 3
17
2 46
6 19
317
Sub
Tota
l
23
71
3 25
2 19
341
3
275
19 4
12
O
ther
Gov
ernm
ent
Enti
ties
Gau
teng
Liq
uor B
oard
2 24
7 3
727
– –
2 24
7 3
727
Gau
teng
Eco
nom
ic De
velo
pmen
t Age
ncy
– –
– –
114
–
SubT
otal
2 24
7 3
727
114
19 3
41
2 36
1 3
727
Tota
l
2
270
3 79
8 3
366
19 3
41
5 63
6 23
139
127GAUTENG DEPARTMENT OF ECONOMIC DEVELOPMENT | ANNUAL REPORT 2012/13
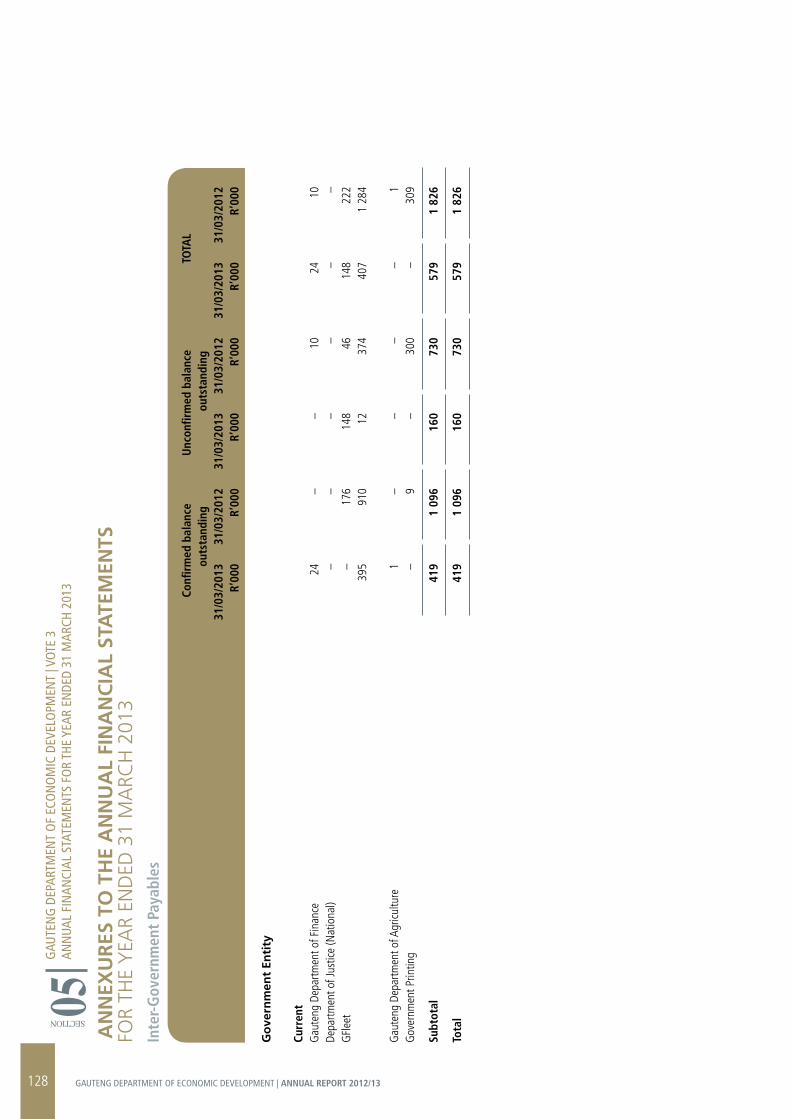
AN
NEX
Ur
ES T
O T
HE
AN
NU
AL
FIN
AN
CIA
L ST
ATE
MEN
TSfo
R th
e Y
eAR
eNd
ed 3
1 m
ARC
h 2
013
Inte
r-Gov
ernm
ent
Paya
bles
Co
nfirm
ed b
alan
ce
Unc
onfir
med
bal
ance
TO
TAL
outs
tand
ing
out
stan
ding
31
/03/
2013
31
/03/
2012
31
/03/
2013
31
/03/
2012
31
/03/
2013
31
/03/
2012
R’
000
R’00
0 R’
000
R’00
0 R’
000
R’00
0
Go
vern
men
t En
tity
Curr
ent
G
aute
ng D
epar
tmen
t of F
inan
ce
24
–
– 10
24
10
Depa
rtmen
t of J
ustic
e (N
atio
nal)
–
– –
– –
–G
Flee
t
– 17
6 14
8 46
14
8 22
2
395
910
12
374
407
1 28
4
Gau
teng
Dep
artm
ent o
f Agr
icultu
re
1 –
– –
– 1
Gov
ernm
ent P
rintin
g
–
9 –
300
– 30
9
Subt
otal
419
1 09
6 16
0 73
0 57
9 1
826
Tota
l
41
9 1
096
160
730
579
1 82
6
GAU
TEN
G D
EPAR
TMEN
T O
F EC
ON
OM
IC D
EVEL
OPM
ENT
| VOT
E 3
ANN
UAL
FIN
ANCI
AL S
TATE
MEN
TS F
OR
THE
YEAR
EN
DED
31 M
ARCH
201
3
SECTION 05
128 GAUTENG DEPARTMENT OF ECONOMIC DEVELOPMENT | ANNUAL REPORT 2012/13
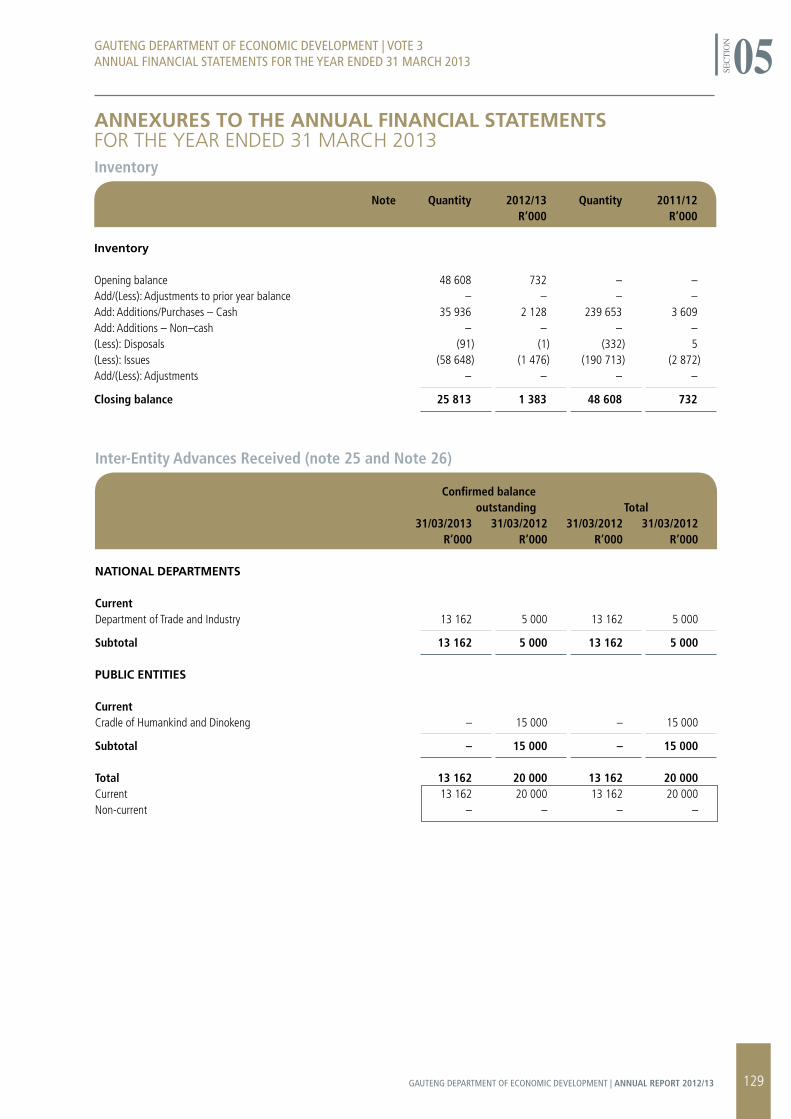
Inventory
Note Quantity 2012/13 Quantity 2011/12 R’000 R’000
Inventory
Opening balance 48 608 732 – –Add/(Less): Adjustments to prior year balance – – – –Add: Additions/Purchases – Cash 35 936 2 128 239 653 3 609Add: Additions – Non–cash – – – –(Less): Disposals (91) (1) (332) 5(Less): Issues (58 648) (1 476) (190 713) (2 872)Add/(Less): Adjustments – – – –
Closing balance 25 813 1 383 48 608 732
ANNEXUrES TO THE ANNUAL FINANCIAL STATEMENTSfoR the YeAR eNded 31 mARCh 2013
GAUTENG DEPARTMENT OF ECONOMIC DEVELOPMENT | VOTE 3ANNUAL FINANCIAL STATEMENTS FOR THE YEAR ENDED 31 MARCH 2013
SECT
ION 05
Inter-Entity Advances Received (note 25 and Note 26)
Confirmed balance outstanding Total 31/03/2013 31/03/2012 31/03/2012 31/03/2012 R’000 R’000 R’000 R’000
NATIONAL DEPArTMENTS
Current Department of Trade and Industry 13 162 5 000 13 162 5 000
Subtotal 13 162 5 000 13 162 5 000
PUBLIC ENTITIES
Current Cradle of Humankind and Dinokeng – 15 000 – 15 000
Subtotal – 15 000 – 15 000 Total 13 162 20 000 13 162 20 000Current 13 162 20 000 13 162 20 000Non-current – – – –
129GAUTENG DEPARTMENT OF ECONOMIC DEVELOPMENT | ANNUAL REPORT 2012/13

130 GAUTENG DEPARTMENT OF ECONOMIC DEVELOPMENT | ANNUAL REPORT 2012/13
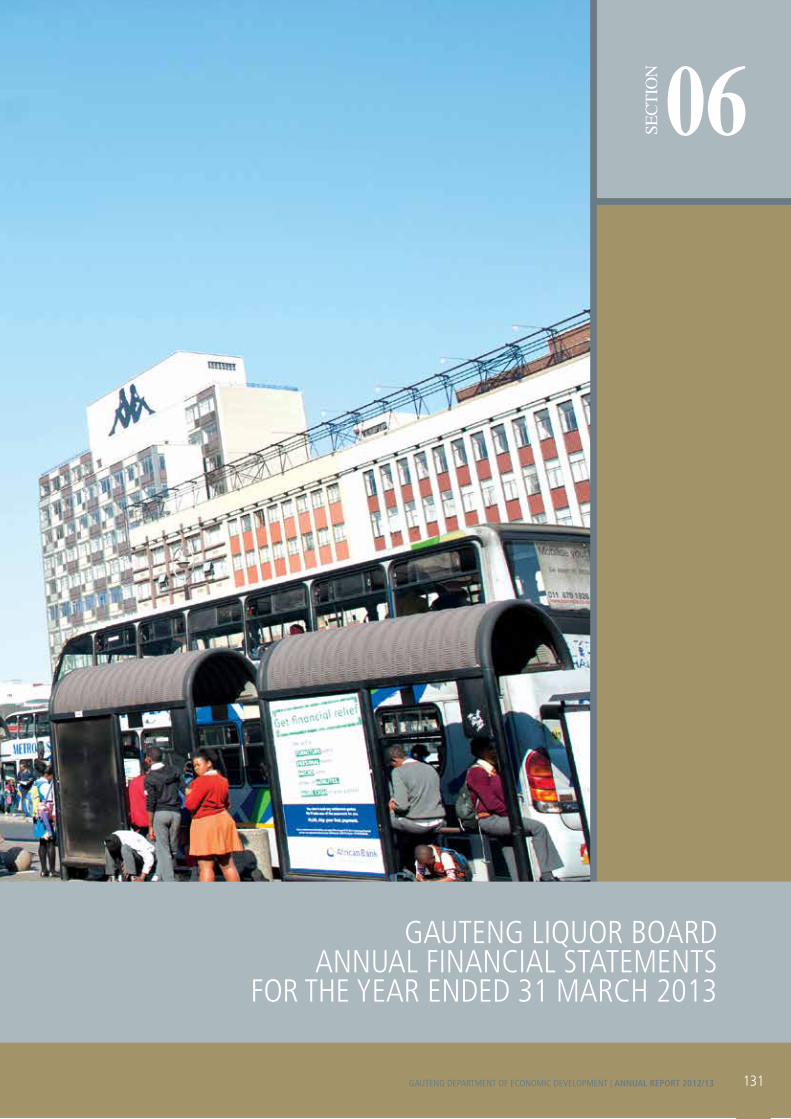
SECT
ION 06
GAUTENG LIQUOR BOARDANNUAL FINANCIAL STATEMENTS
FOR THE YEAR ENDED 31 MARCH 2013
131GAUTENG DEPARTMENT OF ECONOMIC DEVELOPMENT | ANNUAL REPORT 2012/13
SECT
ION 06 GAUTENG LIQUOR BOARD
ANNUAL FINANCIAL STATEMENTS FOR THE YEAR ENDED 31 MARCH 2013
TABLE OF CONTENTSACCOUNTING OFFICER’S REPORT & STATEMENT OF RESPONSIBILITY
REPORT OF THE AUDIT COMMITTEE
REPORT OF THE AUDITOR-GENERAL
STATEMENT OF FINANCIAL POSITION
STATEMENT OF COMPREHENSIVE INCOME
STATEMENT OF CHANGES IN EQUITY
STATEMENT OF CASH FLOWS
ACCOUNTING POLICIES & NOTES TO THE ANNUAL FINANCIAL STATEMENTS
133
138
140
142
143
144
145
146
132 GAUTENG DEPARTMENT OF ECONOMIC DEVELOPMENT | ANNUAL REPORT 2012/13

1. General Review of the State of Financial Affairs
The main income of the Gauteng Liquor Board (GLB) consists of license fees. The license fees (inclusive of renewals) are valid for one year. Prior to the current financial year, the GLB deferred revenue to the year it was deemed as earned. However the income for the year under review was disclosed in full not providing for income received in advance. The GLB received R33million in grants from the department of Economic Development. The GLB collected R27 million for licenses. The operating results for GLB is a surplus balance of R7million (2012, deficit of – R4.2 million restated).
As a trading account the GLB should be financially self-supportive in accordance with Treasury Regulation 19 and should not rely on grants from the Department of Economic Development. Based on the proposed financial model and changes in the regulation and legislation, the GLB is expected to become a self-sustaining entity after issues of revenue collection have been addressed.
2. Important Policy Decisions and Strategic Issues Facing the Gauteng Liquor Board
The change in the strategic direction, the Gauteng Liquor Board has been appraised of areas where internal controls and risk management should be designed to provide reasonable, but not absolute assurance against material misstatements and losses. The GLB has put internal financial controls to provide assurance regarding: The safeguarding of assets against unauthorised use or
disposition, The maintenance of proper accounting records, The reliability of financial information used within the business
or for publication.
The controls developed contain self-monitoring mechanisms and actions are taken to correct deficiencies as they are identified. Furthermore, because of changes in conditions, the effectiveness of internal financial controls may vary over time and based on management diligence. The Liquor Licensing turnaround strategy has so far made some inroads into major project undertaken by the department.
3. Major Projects that have taken Place During the Year
This report will elaborate on the implementation of Gauteng Liquor Board programme of action and activities in relation to administration, compliance, Board Secretariat, education and awareness as the main core programmes.
3.1 Administration
The turnaround plan has been implemented the following key focus areas in the 2012/13 financial year:
To date, the Board has introduced various measures to curb fraudulent issuing of licenses. The issuing of licenses has now been centralized and only the Chairperson and the Secretariat have access to any pro-forma licenses and issuing system with chronologically verified numbers. The only remaining aspect which is of concern to the Board pertains to renewal licenses. It is however important to note that with the introduction of the new IT system, these concerns regarding the reissuing of the renewal licenses will be eliminated as they will be migrated into this system.
The IT system yields the following benefits respectively, the easiness of liquor application process, the swiftness in process applications at Regional level, introduction of reliable data and creation of accountability and responsibility by various personnel through the licensing process. The Board has been advised by the IT Team that the system is capable of handling voluminous applications at any time should this occur.
The Business Process Re-engineering Process has led to an analysis of the organizational structure and service delivery model completed in order to ensure the sustainability of increased efficiency as a result of automation.
(i) The Gauteng Liquor Act and the Bill
Some of the challenges that plagued the liquor licensing environment were as a result of the provisions that were made (or not made) in the legislative framework. The subsequently, the Board undertook a review of the Gauteng Liquor Act of 2003, including its regulations. The Draft Bill that emerged as a result, was published for public comments in February 2012, and is currently following the prescribed legislative process.
In order to address concerns regarding monopolistic tendencies, especially in black townships, a framework agreement has been entered into with the Competition Commission. This framework seeks to eliminate unethical business practices by large corporations and advance black economic empowerment.
(ii) Improving the Capacity of the Board
The Board has been operating at a full staff compliment. As a result, there have been regular sittings, which immensely contributed to eradication of the backlog.
(iii) Effective Operations of Regional Offices
The Manager responsible for Regional co-ordination was appointed. Through this co-ordination, performance reporting was enhanced and brought about a certain degree of improvement in Regional performance and management.
However, Regional offices have been restructured with the view of the impending introduction of the IT and business systems.
SECT
ION 06
ACCOUNTING OFFICEr’S rEPOrTfoR the YeAR eNded 31 mARCh 2013
GAUTENG LIQUOR BOARDANNUAL FINANCIAL STATEMENTS FOR THE YEAR ENDED 31 MARCH 2013
133GAUTENG DEPARTMENT OF ECONOMIC DEVELOPMENT | ANNUAL REPORT 2012/13

This is however a continuing process. The IT Team has already commenced training Regional Managers regarding the utilization of the new IT and business systems. The Board will ensure that the Secretariat is also trained in the utilization of the system to ensure continued harmonization of the process.
During the previous years there were no formal requirements which Shebeen permit holders were expected to meet and as a result majority of the Shebeen Owners were not observing the laws, and they were always. The Department has taken steps to recognize and formalize the Shebeens as formal businesses in the Liquor Industry, by introducing the Shebeen regulations which outlines the minimal requirements for valid Shebeen outlets to operate. The Department has developed a rolled schedule to consider the application for the Shebeen license.
(iv) Improving the Trading Account of the Liquor Licensing and Regulation Office
To enhance and improve the management of the Liquor Licensing and Regulation Office Trading Account so that the Office has sound financial management, since the appointment of the new collection agent (FNB), revenue collected can be categorized into the different revue streams as per the Financial Reporting requirements. Revenue collection is also recorded timeously. The Liquor licensing Unit, has begun to improve on revenue collection, a total annual revenue target of R40 million has been set. During the last quarter, the fourth quarter revenue collection target was exceeded as a clear indication that when measures are in place the annual target as set is achievable.
(v) Ensuring Compliance to Gauteng Liquor Act, No 2 of 2003, Regulations in Terms of Section 141 of Gauteng Liquor Act and Other Legislation such as National Liquor Act, No 27 of 1989
A decision is taken to separate the inspection division into two areas Pre- Inspection Officers
This team of Inspection Officers are responsible for inspection of the premises before the Board can consider the applications. Their main function is to advise the Gauteng Liquor Board about the suitability of the premises for the sale of alcohol. A total of 15 Inspection Officers will be appointed to conduct this function.
Monitoring and enforcement of compliance of liquor traders intensified by: – Appointment of 15 inspection officers to address capacity constraints; and – Additional capacity enables continued operations to rigorously facilitate the responsible trading in alcohol.
(vi) Ensure Effective Communications, Education, Awareness and Stakeholder Relations
A Director responsible for Education and Awareness was appointed. Education and awareness programmes were implemented, that were geared towards enhancing stakeholder relations. The Liquor Hotline will be launched as a Liquor Communication Project.
The division will be responsible for profiling the work of the Board and including all the Campaigns to be carried by the Liquor licensing Unit, conducting quarterly media briefings on the progress made in the Liquor Unit, managing customer satisfaction surveys, receiving and responding to queries within the provincial turnaround time, and the management of the website content of the Liquor Licensing Unit.
(vii) The Eradication of the Backlog in Liquor Licensing Application
In order to address the backlog, the Board sat at least four times a week. Additional staff capacity linked to the Board secretariat functions has been recruited. As a result substantial progress has been made in ensuring that the feedback on the lodged application is received within the timeframes, and other areas were progress is made includes: Measures introduced by the Gauteng Liquor Board to curb
fraudulent issuing of licenses by way of: – Streamlining processes; – Managers are appointed to conduct quality checks on the reports submitted by the pre-inspection Officers. – Centralizing the issuing of licenses; and – Limitation on the relevant officials that are authorized to issue a license at any given time.
(viii) Improving the Liquor Operations System
In an attempt to address the operational inefficiencies, various systems have been identified and implemented. Among the systems introduced, there is an IT and Business systems to assist with the processing of liquor applications in the most efficient manner. This system is currently yielding positive results. The Liquor Licensing Unit has also introduced a license renewal system that will assist in matching the revenue collected figures from the bank account with the data captured in the administration‘s data base. Furthermore, appropriate measures had been introduced and are currently under way to address risk management measures in respect of data and document management systems.
3.2 Compliance
The Department has strengthened relations with the SAPS and Metro Police. Through this initiative, joint operations are held to combat illegal trading in alcohol. Illegal outlet have been shut down and alcohol confiscated by the SAPS. The relationship with Liquor Traders associations ensures compliance to the Act through codes of conduct developed and enforced by those associations.
The Compliance unit responds to complaints and queries, and investigations are conducted to ensure that corrective action is taken. The department will continue to recruit additional personnel as liquor inspectors to ensure compliance with the Liquor Laws, and revoke the licenses of the liquor outlets where criminal activities are happening and where the traders are not observing the laws governing the Liquor trade.
SECT
ION 06 GAUTENG LIQUOR BOARD
ANNUAL FINANCIAL STATEMENTS FOR THE YEAR ENDED 31 MARCH 2013
134 GAUTENG DEPARTMENT OF ECONOMIC DEVELOPMENT | ANNUAL REPORT 2012/13
3.3 Secretariat
Amongst the mechanisms proposed and authorized related to the introductions of the moratorium for a period of six months to eliminate the backlog on certain types of liquor licenses. To date no backlog exists and liquor applications are being processed in an ordinary cause of duty.
The Board centralized Secretariat services in order to standardize Board support and ensure a seamless application system.
3.4 Education and Awareness
The GLB continues to be involved in joint awareness and education programmes with key departments, the traders’ associations and the players in the industry. The department is currently engaging the SAB, as a stakeholder to explore legacy projects aimed at empowering the small businesses in the Liquor Industry. A joined research study will be conducted with an aim to fast track transformation and empowerment of the small business operators.
The department of transport has also been identified as a key stakeholder during the festive month’s campaign of Arrive Alive. We continue to partner with this department in the campaigns about
No to abuse of alcohol during the festive season. No to drinking and driving. No to selling alcohol to under-age and school children. No to violation of liquor trading hours.
3.5 Review of the Gauteng Liquor Act2, 2003 and New Bill
The Department has completed the path to legislation drafting adopted by the Province. The Bill has been introduced at the Legislature, and is now at the Legislature process. After the Legislature adopts the Bill, it will be submitted to the Premier for assent. When the Premier assents the Bill it becomes law.
Once the Bill is passed into law, members of the public will have the right to raise objections to the issuing of renewal licenses to the outlets which are causing nuisance to the communities, the department will be obliged to conduct education and awareness workshops to educate Liquor traders about the laws which regulate the industry, so that they could trade responsibly. The emphasis of the messages will be as follows: no sale of alcohol to minors, no sale of alcohol to visibly intoxicated people.
There will not be automatic renewal of licenses and the inspections will be conducted to ascertain whether the outlets are trading in accordance with the issued license conditions.
4. Services Rendered by the Gauteng Liquor Board
The services rendered by the Gauteng Liquor Board are detailed in the Performance Information Report.
The Department will sign the performance Charter with the Gauteng Liquor Board, which include the commitment to ensure the Board process the license application within the turnaround time of 41 days.
4.1 Tariff Policy
The Gauteng Liquor Board charges license fees as per Gauteng Liquor Act 9 of 2003 tariff structures.
4.2 Inventories
The Gauteng Liquor Board keeps no material stocks. Minimal consumables purchased during the year for stationery and other food supplies are expensed immediately.
5. Utilization of Donor Funds
The Gauteng Liquor Board did not receive any donor funding during the financial year.
6. Organizations to whom Transfer Payments have been made
The Gauteng Liquor Board did not make any transfer payments during the year under review.
7. Public Private Partnerships (PPP)
The Gauteng Liquor Board did not have any public private partnerships during the year under review.
8. Corporate Governance Arrangements
With a view to improve and strengthen corporate processes pertaining to strategic planning, financial management and performance oversight, the following processes were initiated: The GLB complies strictly with the National Treasury Framework
on strategic planning; A framework on financial planning and management has been
finalised; The Monitoring and Evaluation Framework for the DED Group
has been finalised; The approach to monitoring financial and non-financial
performance has been strengthened; and An internal planning calendar has been designed to assist GLB
with day to day operations including compliance and regulatory obligations.
8.1 Risk Management Approach
The GLB risk management approach is aligned with the Provincial Treasury’s Risk Management Framework.
SECT
ION 06GAUTENG LIQUOR BOARD
ANNUAL FINANCIAL STATEMENTS FOR THE YEAR ENDED 31 MARCH 2013
135GAUTENG DEPARTMENT OF ECONOMIC DEVELOPMENT | ANNUAL REPORT 2012/13

A Strategic Risk Assessment workshop, attended by the Department’s Senior Management, was convened during the year under review. Action plans to address risks identified were developed and implemented.
The Risk and Audit Management Committee (RAMC) facilitates the resolution of audit findings raised by Auditor-General (AG) and Gauteng Audit Services (GAS). All audit matters raised by AG in the 2011/12 audits were addressed by the Department. The GLB also addressed audit matters raised by GAS. The RAMC comprises heads of all business units. The committee met monthly, with members providing progress reports.
8.2 Fraud Prevention Policies
A fraud risk assessment workshop was held to update the Fraud Prevention Plan during the year under review. Progress on implementation of fraud prevention strategies was tracked throughout the year.
The GLB through the Department of Economic Development is a member of the Provincial Anti-Corruption Coordinating Committee. Matters referred by the National Anti-Corruption Hotline are duly investigated.
8.3 Audit Cluster Committee
The audit committee serves a cluster of departments and provides oversight mainly on audit, performance and financial management issues. During the year under review, the committee also focused on GLB’s risk management activities, with specific reference to the top ten risks. The audit committee approved the department’s 3 year rolling Internal Audit Plan which included the GLB risks.
8.4 Internal Audit
Gauteng Audit Services (GAS), a unit within the Department of Finance provides internal audit services to GLB and other provincial departments. GAS provides assurance on the GLB effectiveness and efficiency of internal controls, governance and risk management processes. During the year under review, GAS completed its Annual Audit Plan.
The Risk and Audit Management Committee (RAMC) was instrumental in facilitating the implementation of GAS recommendations emanating from audits performed in the last three years. Significant progress has been achieved in this regard. GAS is invited to all RAMC meetings in the 2012/13 financial year. They will present new findings and assist with the tracking thereof.
8.5 Processes to Minimize Conflict of Interest
In line with the requirements of the Department of Public Service and Administration, GLB requires its senior managers to disclose their financial interests on an annual basis. All SMS members have signed the financial disclosure forms and all Departmental Acquisition Committee (DAC) members sign the declaration of interest register in every meeting.
8.6 Implementation of the Code of Conduct
The code of conduct is available and forms part of the employment contract for each staff member.
8.7 Safety, Health and Environmental Issues
The Gauteng Liquor Board has nominated OHS representatives. The Gauteng Liquor Board follows the OHS Act guidelines as well as the OHS policy. OHS is reported on as a regular feature in the departmental internal newsletter.
9. Discontinued Activities/Activities to be Discontinued
There were no discontinued activities in the Gauteng Liquor Board within the financial period under review.
10. New/Proposed Activities
None
11. Asset Management
The GLB has done the assets verification for the financial year under review and updated its asset register and the accounting treatment of fixed assets as required by the relevant legislation has been updated accordingly.
12. Events after the Reporting Date
There are no reportable events after the reporting date.
13. Performance Information
The internal controls to strengthen the quality of reported information were put in place by ensuring that reported information had to be consolidated per sub-programme and programme, where applicable, and submitted to the M&E unit by the respective sub-programme and programme managers. Programmes and sub-programmes were further required to provide portfolio of evidence on all reported information.
The board further embarked on the process to determine the extent to which planned targets in the annual performance were met by preparing the summary of technical assessment per indicators across all budget programmes. One on one discussions with programmes that did not perform well were undertaken and guidance provided on improving performance.
The departmental-wide Monitoring and Evaluation Policy Framework has been revised, the consultative process with respective programmes undertaken and will be approved in the next financial year.
SECT
ION 06 GAUTENG LIQUOR BOARD
ANNUAL FINANCIAL STATEMENTS FOR THE YEAR ENDED 31 MARCH 2013
136 GAUTENG DEPARTMENT OF ECONOMIC DEVELOPMENT | ANNUAL REPORT 2012/13
14. SCOPA Resolutions
The GLB has responded to each of the SCOPA resolutions as well as AG findings and we have improved the internal control environment as per these recommendations. We continue to engage the Committee and the AG on internal control matters.
15. Prior Modifications to Audit Reports
Modification of audit report Findings on progress
Revenue and Receivables A process is under way to establish a database for the 2013/2014 financial year.
Expenditure Management A payment monitoring system is in place. Cash-flow projections are prepared in advance to engage Provincial Treasury where challenges are identified in advance.
Financial and performance management Key accounts are reconciled monthly, signed-off by senior officials.
16. Exemptions and Deviations Received from the National Treasury
None
17. Other
None
18. Approval
The Annual Financial Statements set out on pages 16 to 36 have been approved by the Accounting Officer.
Albert Chanee, Acting Head of Department: Economic Development
SECT
ION 06GAUTENG LIQUOR BOARD
ANNUAL FINANCIAL STATEMENTS FOR THE YEAR ENDED 31 MARCH 2013
137GAUTENG DEPARTMENT OF ECONOMIC DEVELOPMENT | ANNUAL REPORT 2012/13
SECT
ION 06 GAUTENG LIQUOR BOARD
ANNUAL FINANCIAL STATEMENTS FOR THE YEAR ENDED 31 MARCH 2013
GAUTENG PrOVINCIAL GOVErNMENTReport of the Audit Committee – Cluster 1
Gauteng Liquor Board
We are pleased to present our report for the financial year ended 31 March 2013.
The Audit Committee consists of the external members listed hereunder and is required to meet a minimum of at least two times per annum as per provisions of the Public Finance Management Act (PFMA). In terms of the approved Terms of Reference (GPG Audit Committee Charter), five meetings were held during the current year, i.e. three meetings for Quarterly Performance Reporting (financial and non-financial) and two meetings to review and discuss the Annual Financial Statements and the Auditor-General Report.
Name of Member Number of Meetings Attended Vishnu Naicker (Chairperson) 05 Tshidi Molala (Member) 05Wayne Poggenpoel (Member) 04
Audit Committee Member Mr. Wayne Poggenpoel did not attend one meeting since he was appointed after the first quarter reporting period. However, all meetings were quorate. Executive Members:
In terms of the GPG Audit Committee Charter, the Officials listed hereunder are obliged to attend the meetings of the Audit Committee:
Compulsory Attendees Number of Meetings Attended
Khulu Radebe (Head of Department) 01Albert Chanee (Acting Head of Department) 04 Preston Mabena (Chief Financial Officer) 04Oupa Tshule (Chief Risk Officer) 03
During the financial year under review, Mr. Khulu Radebe has been put on suspension as the Head of Department and Mr. Albert Chanee was appointed to act in the capacity of the Head of Department. Therefore, the Audit Committee is satisfied that the Trading Entity adhered to the provisions of the GPG Audit Committee Charter.
The Members of the Audit Committee met with the Senior Management of the Department and Internal Audit, collectively to address risks and challenges facing the Departments. A number of in-committee meetings were held to address control weaknesses and conflicts with the Department.
Audit Committee Responsibility
The Audit Committee reports that it has complied with its responsibilities arising from section 38 (1) (a) of the PFMA and Treasury Regulation 3.1.13. The Audit Committee also reports that it has adopted appropriate formal terms of reference as its Audit Committee Charter, has regulated its affairs in compliance with this Charter and has discharged all its responsibilities as contained therein.
The Effectiveness of Internal Control
The Audit Committee has observed that the overall control environment has continued to improve during the year under review. However, there are still some concerns with the level of internal controls within the entity where evidence of lapses of effective monitoring and enforcement by Management were observed.
During the year under review, several deficiencies in the system of internal control and deviations were reported by the Auditor-General South Africa. In certain instances, the matters reported previously have not been fully and satisfactorily addressed.
The quality of in year management and monthly / quarterly reports submitted in terms of the PFMA and the Division of Revenue Act.
The Audit Committee has not reviewed the monthly and quarterly reports of the Gauteng Liquor Board and will ensure that this is done in the forthcoming financial year.
Evaluation of Financial Statements
The Audit Committee has:
reviewed and discussed the audited Annual Financial Statements to be included in the Annual Report, with the Auditor-General and the Accounting Officer; reviewed the Auditor-General’s management report and
Management’s response thereto; reviewed the Department’s compliance with legal and regulatory
provisions; and reviewed significant adjustments resulting from the audit.
The Audit Committee concurs with and accepts the Auditor-General’s conclusions on the Annual Financial Statements, and is of the opinion that the audited Annual Financial Statements be accepted and read together with the report of the Auditor-General.
138 GAUTENG DEPARTMENT OF ECONOMIC DEVELOPMENT | ANNUAL REPORT 2012/13
Internal Audit
The Audit Committee is satisfied that the Internal Audit plans addresses a clear alignment with the major risks, adequate information systems coverage, a good balance between different categories of audits, i.e. risk-based, mandatory, performance and follow-up audits and involvement and support by Management.
The Audit Committee has noted considerable improvement in the communication between the Executive Management, the Auditor-General and the Internal Audit Function, which has strengthened the Corporate Governance initiatives.
The Audit Committee wishes to stress that in order for the Internal Audit Function to operate at optimal level as expected by the Audit Committee, it requires more capacity and skills.
Risk Management
Progress on entity’s risk management was reported to the Audit Committee on a quarterly basis. The Audit Committee is not satisfied that the actual management of risk is receiving attention and the areas of revenue management and asset management still require significant improvement. Management must take responsibility for the managing of risk in their respective areas of work. This area will be closely monitored during 2013/14 financial year. Forensic Investigations
The Audit Committee is not entirely satisfied that the forensic investigations are properly reported with age-analysis of all reported issues indicated. Details of results in respect of investigations conducted as a result of calls through the fraud hotline were not provided to the Committee. This is an area of improvement going forward.
One-on-One Meetings with the Accounting Officer
The Audit Committee has met with the Accounting Officer from the Department of Economic Development to address unresolved issues relating to the Gauteng Liquor Board.
One-on-One Meetings with the Executive Authority
The Audit Committee has met with the Executive Authority for the Department of Economic Development to apprise him on the performance of the Gauteng Liquor Board.
Conclusion
The Committee concurs in general with the conclusions of the Auditor-General on the Annual Financial Report of the entity for the year ended 31st March 2013.
The Committee has once again taken note of the concerns of the Auditor-General and accepts that there is further room for improvement in the areas of asset management, revenue management, expenditure and the internal control environment. The Audit Committee will ensure that the internal audit plan addresses these issues and will monitor the implementation of the recommendations contained in the Auditor-General’s Report.
I would like to thank all members of the Committee for their contribution and the professional way in which meetings were conducted. To the Honorable MEC, Acting Chief Executive Officer and the staff of the Gauteng Liquor Board, the Committee wishes to express its sincere appreciation for the progress made this year and the manner in which the Entity engaged with the Audit Committee.
Mr Vishnu Naicker,Chairperson of the Audit Committee31 July 2013
SECT
ION 06GAUTENG LIQUOR BOARD
ANNUAL FINANCIAL STATEMENTS FOR THE YEAR ENDED 31 MARCH 2013
139GAUTENG DEPARTMENT OF ECONOMIC DEVELOPMENT | ANNUAL REPORT 2012/13
SECT
ION 06 GAUTENG LIQUOR BOARD
ANNUAL FINANCIAL STATEMENTS FOR THE YEAR ENDED 31 MARCH 2013
rEPOrT OF THE AUDITOr-GENErAL TO THE GAUTENG PrOVINCIAL LEGISLATUrE ON GAUTENG LIqUOr BOArD
Report on the Financial Statements
Introduction
1. I have audited the financial statements of the Gauteng Liquor Board set out on pages 142 to 157, which comprise, the statement of financial position as at 31 March 2013, the statement of comprehensive income, statement of changes in equity and statement of cash flows for the year then ended, and the notes, comprising a summary of significant accounting policies and other explanatory information.
Accounting Officer’s Responsibility for the Financial Statements
2. The accounting officer is responsible for the preparation and fair presentation of these financial statements in accordance with the South African Standards of Generally Recognised Accounting Practice (SA Standards of GRAP and the requirements of the Public Finance Management Act 1. 2009 (Act No.1 of 1999) (PFMA) for such internal control as the accounting officer determines is necessary to enable the preparation of financial statements that are free from material misstatement, whether due to fraud or error.
Auditor-General’s Responsibility
3. My responsibility is to express an opinion on these financial statements based on my audit. I conducted my audit in accordance with the Public Audit Act of South Africa, 2004 (Act No. 25 of 2004) (PAA), the General Notice issued in terms thereof and International Standards on Auditing. Those standards require that I comply with ethical requirements and plan and perform the audit to obtain reasonable assurance about whether the financial statements are free from material misstatement.
4. An audit involves performing procedures to obtain audit evidence about the amounts and disclosures in the financial statements. The procedures selected depend on the auditor’s judgement, including the assessment of the risks of material misstatement of the financial statements, whether due to fraud or error. In making those risk assessments, the auditor considers internal control relevant to the entity’s preparation and fair presentation of the financial statements in order to design audit procedures that are appropriate in the circumstances, but not for the purpose of expressing an opinion on the effectiveness of the entity’s internal control. An audit also includes evaluating the appropriateness of accounting policies used and the reasonableness of accounting estimates made by management, as well as evaluating the overall presentation of the financial statements.
5. I believe that the audit evidence I have obtained is sufficient and appropriate to provide a basis for my qualified audit opinion.
Basis for Qualified Opinion
Revenue and Receivables
6. The trading entity did not have adequate internal controls to maintain records of revenue from liquor licenses, due to inadequate record keeping. The entity’s records did not permit the application of alternative audit procedures regarding liquor licenses revenue. Consequently, I was unable to obtain sufficient appropriate audit evidence to satisfy myself as to the completeness of licensing revenue amounting to R26 643 000. I was also unable to satisfy myself with the completeness, valuation, existence and cut off of the related receivable.
Opinion
7. In my opinion, except for the effects of the matters described in the Basis for qualified opinion paragraphs, the financial statements present fairly, in all material respects, the financial position of the Gauteng Liquor Board as at 31 March 2013 and financial performance and cash flows for the year then ended, in accordance with the SA Standard of GRAP and the requirements of the PFMA.
Emphasis of Matter
8. I draw attention to the matter below. My opinion is not modified in respect of this matter.
Restatement of Corresponding Figures
9. As disclosed in note 4 to the financial statements, the corresponding figures for 31 March 2012 have been restated as a result of an error discovered during 2012/13 in the financial statements of the Gauteng Liquor Board at, and for the year ended, 31 March 2012.
Report on Other Legal and Regulatory Requirements
10. In accordance with the PAA and the General Notice issued in terms thereof, I report the following findings relevant to performance against predetermined objectives, compliance with laws and regulations and internal control, but not for the purpose of expressing an opinion.
Predetermined Objectives
11. I performed procedures to obtain evidence about the usefulness and reliability of the information in the annual performance report as set out on pages 24 to 65 of the annual report.
12. The reported performance against predetermined objectives was evaluated against the overall criteria of usefulness and reliability. The usefulness of information in the annual performance report relates to whether it is presented in accordance with the National Treasury’s annual reporting principles and whether the reported performance is consistent with the planned objectives.
140 GAUTENG DEPARTMENT OF ECONOMIC DEVELOPMENT | ANNUAL REPORT 2012/13
SECT
ION 06GAUTENG LIQUOR BOARD
ANNUAL FINANCIAL STATEMENTS FOR THE YEAR ENDED 31 MARCH 2013
The usefulness of information further relates to whether indicators and targets are measurable (i.e. well defined, verifiable, specific, measurable and time bound) and relevant as required by the National Treasury Framework for managing programme performance information.
The reliability of the information in respect of the selected objectives is assessed to determine whether it adequately reflects the facts (i.e. whether it is valid, accurate and complete).
13. There were no material findings on the annual performance report concerning the usefulness and reliability of the information.
Additional Matter
14. Although no material findings concerning the usefulness and reliability of the performance information was identified in the performance report, I draw attention to the following matter below.
Achievement of Planned Targets
15. Of the total number of 11 targets planned for the year, 3 of targets were not achieved during the year under review. This represents 27% of total planned targets that were not achieved during the year under review.
Compliance with Laws and Regulations
16. I performed procedures to obtain evidence that the entity has complied with applicable laws and regulations regarding financial matters, financial management and other related matters. My findings on material non compliance with specific matters in key applicable laws and regulations as set out in the General Notice issued in terms of the PAA are as follows:
Annual Financial Statement
17. The financial statements submitted for auditing were not prepared in all material respects in accordance with the requirements of section 40(1) of the PFMA as material adjustments were identified during the audit. As reported in Section 2, Part A above, some of the material misstatements in disclosure items identified by the auditors were corrected, however the uncorrected misstatements resulted in the financial statements in qualified opinion.
Expenditure Management
18. The accounting officer did not take adequate steps to prevent irregular expenditure, as required by section 38(1)(c)(ii) of the Public Finance Management Act and National Treasury Regulation 9.1.1.
19. Contractual obligations and money owed by the department were not always settled within 30 days or an agreed period, as required by section 38(1)(f) of the Public Finance Management Act and Treasury Regulation 8.2.3.
Revenue Management
20. Penalties were not always charged on late renewals as required by section 100 of the Gauteng Liquor Act.
21. The compliance unit did not always ensure that liquor license traders with lapsed licenses complied with section 98 of the Gauteng Liquor Act and renewed. Furthermore there was not inspection done to ensure that liquor license holders with lapsed license stopped trading.
22. Occasional licenses were issued to outlets whose primary business is to sell liquor which is in contravention of section 31 of the Gauteng Liquor Act.
Asset Management
23. Due to the number of errors identified during the review of the asset register and process undertaken by management to verify its assets, the Accounting officer did not adequately safeguard assets in contravention of section 38(1) d of the Public Finance Management Act No.1 of 1999.
Internal Control
24. I considered internal control relevant to my audit of the financial statements, the performance report and compliance with laws and regulations. The matters reported below under the fundamentals of internal control are limited to the significant deficiencies that resulted in the basis for qualified opinion and the findings on compliance with laws and regulations included in this report.
Leadership
25. Management did not provide adequate oversight responsibility regarding financial reporting and compliance and related internal controls.
financial and Performance Management
26. The financial statements and information supporting disclosure notes was not adequately reviewed for completeness and accuracy prior to their submission for audit.
27. Management did not adequately review and monitor controls with laws and regulations.
28. Monthly revenue reconciliation prepared were not adequate to address completeness of revenue as compliance unit is not involved in the processes of reconciling revenue received to database held.
Johannesburg31 July 2013
141GAUTENG DEPARTMENT OF ECONOMIC DEVELOPMENT | ANNUAL REPORT 2012/13
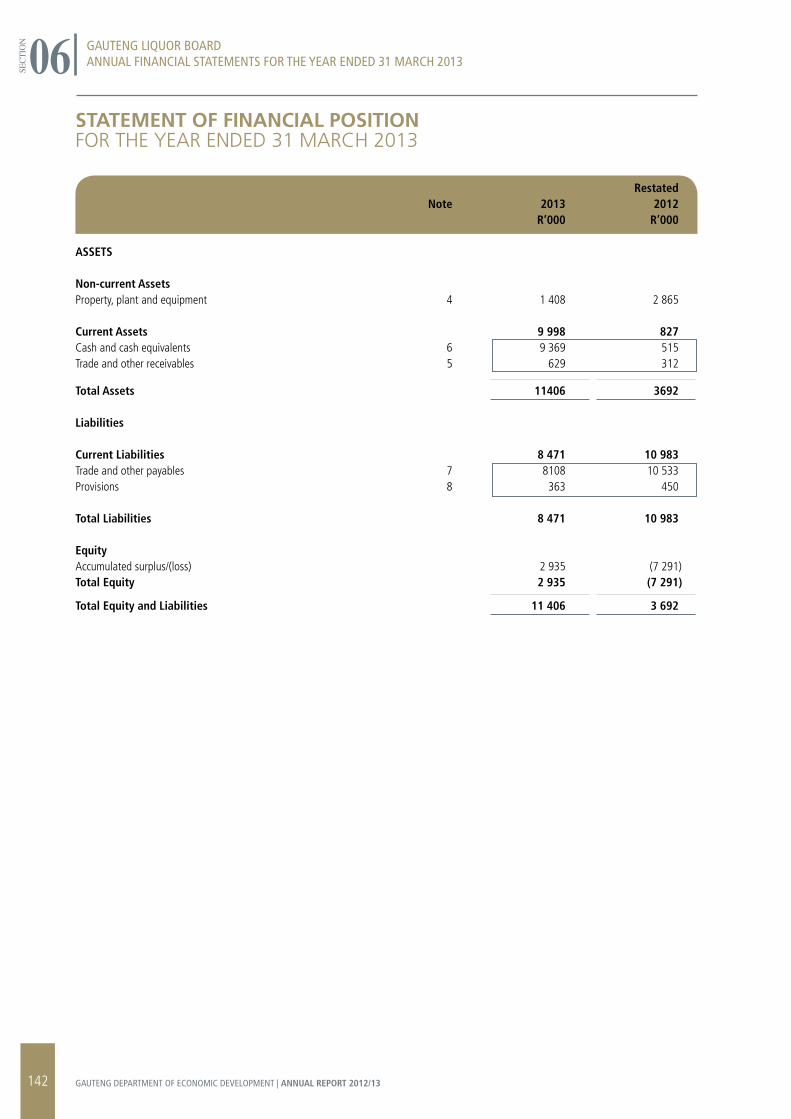
Restated Note 2013 2012 R’000 R’000
ASSETS
Non-current Assets Property, plant and equipment 4 1 408 2 865 Current Assets 9 998 827Cash and cash equivalents 6 9 369 515Trade and other receivables 5 629 312
Total Assets 11406 3692
Liabilities Current Liabilities 8 471 10 983Trade and other payables 7 8108 10 533Provisions 8 363 450 Total Liabilities 8 471 10 983 Equity Accumulated surplus/(loss) 2 935 (7 291)Total Equity 2 935 (7 291)
Total Equity and Liabilities 11 406 3 692
STATEMENT OF FINANCIAL POSITIONfoR the YeAR eNded 31 mARCh 2013
SECT
ION 06 GAUTENG LIQUOR BOARD
ANNUAL FINANCIAL STATEMENTS FOR THE YEAR ENDED 31 MARCH 2013
142 GAUTENG DEPARTMENT OF ECONOMIC DEVELOPMENT | ANNUAL REPORT 2012/13
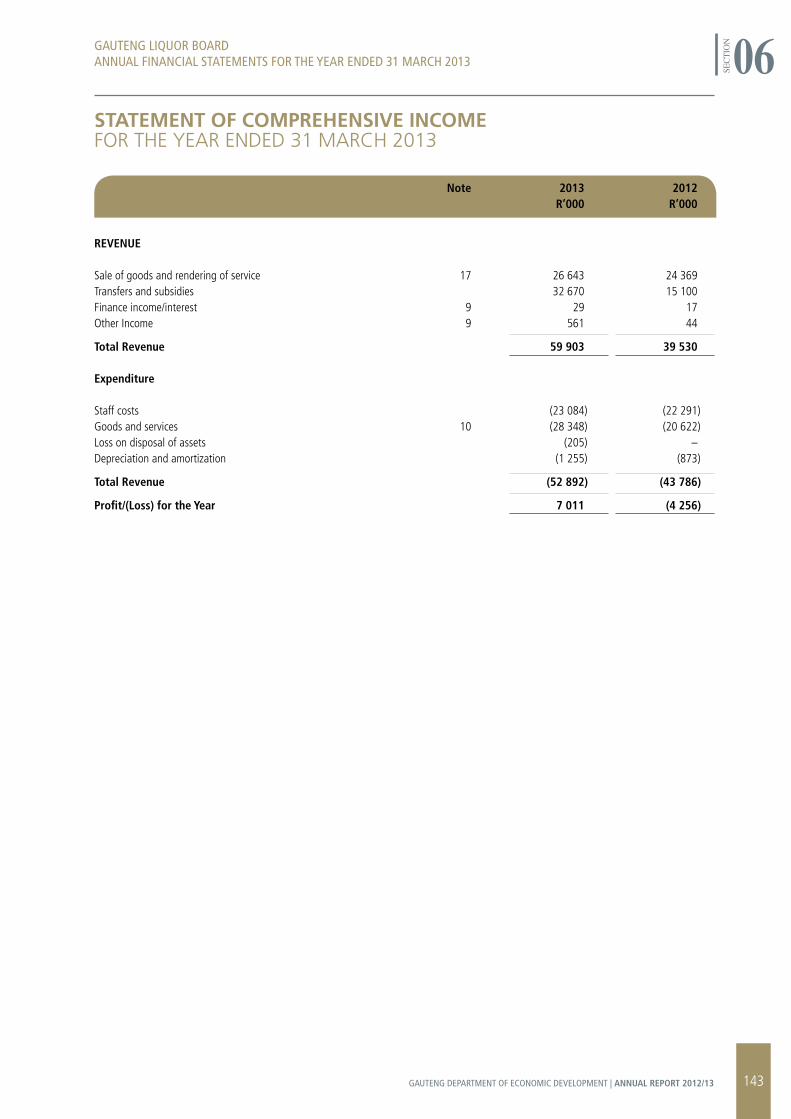
Note 2013 2012 R’000 R’000
REVENUE
Sale of goods and rendering of service 17 26 643 24 369Transfers and subsidies 32 670 15 100Finance income/interest 9 29 17Other Income 9 561 44
Total Revenue 59 903 39 530 Expenditure
Staff costs (23 084) (22 291)Goods and services 10 (28 348) (20 622)Loss on disposal of assets (205) –Depreciation and amortization (1 255) (873)
Total Revenue (52 892) (43 786)
Profit/(Loss) for the Year 7 011 (4 256)
STATEMENT OF COMPrEHENSIVE INCOMEfoR the YeAR eNded 31 mARCh 2013
SECT
ION 06GAUTENG LIQUOR BOARD
ANNUAL FINANCIAL STATEMENTS FOR THE YEAR ENDED 31 MARCH 2013
143GAUTENG DEPARTMENT OF ECONOMIC DEVELOPMENT | ANNUAL REPORT 2012/13
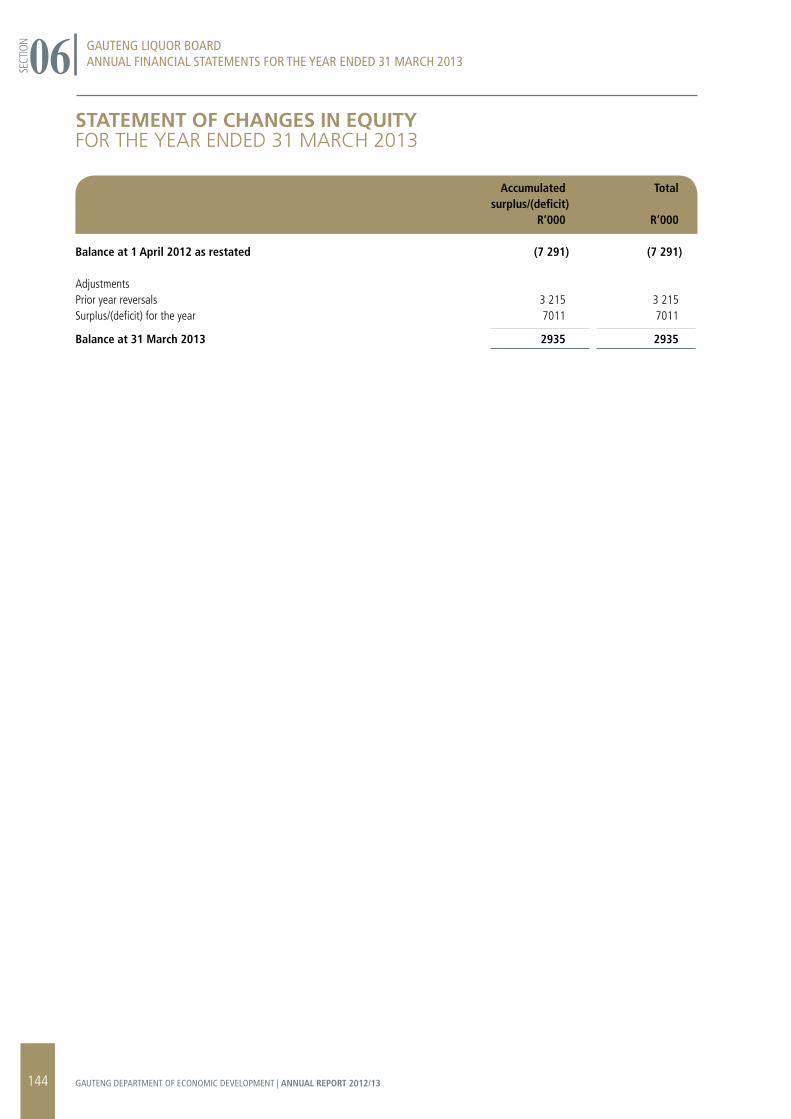
STATEMENT OF CHANGES IN EqUITYfoR the YeAR eNded 31 mARCh 2013
Accumulated Total surplus/(deficit) R’000 R’000
Balance at 1 April 2012 as restated (7 291) (7 291)
AdjustmentsPrior year reversals 3 215 3 215Surplus/(deficit) for the year 7011 7011
Balance at 31 March 2013 2935 2935
SECT
ION06 GAUTENG LIQUOR BOARD
ANNUAL FINANCIAL STATEMENTS FOR THE YEAR ENDED 31 MARCH 2013
144 GAUTENG DEPARTMENT OF ECONOMIC DEVELOPMENT | ANNUAL REPORT 2012/13
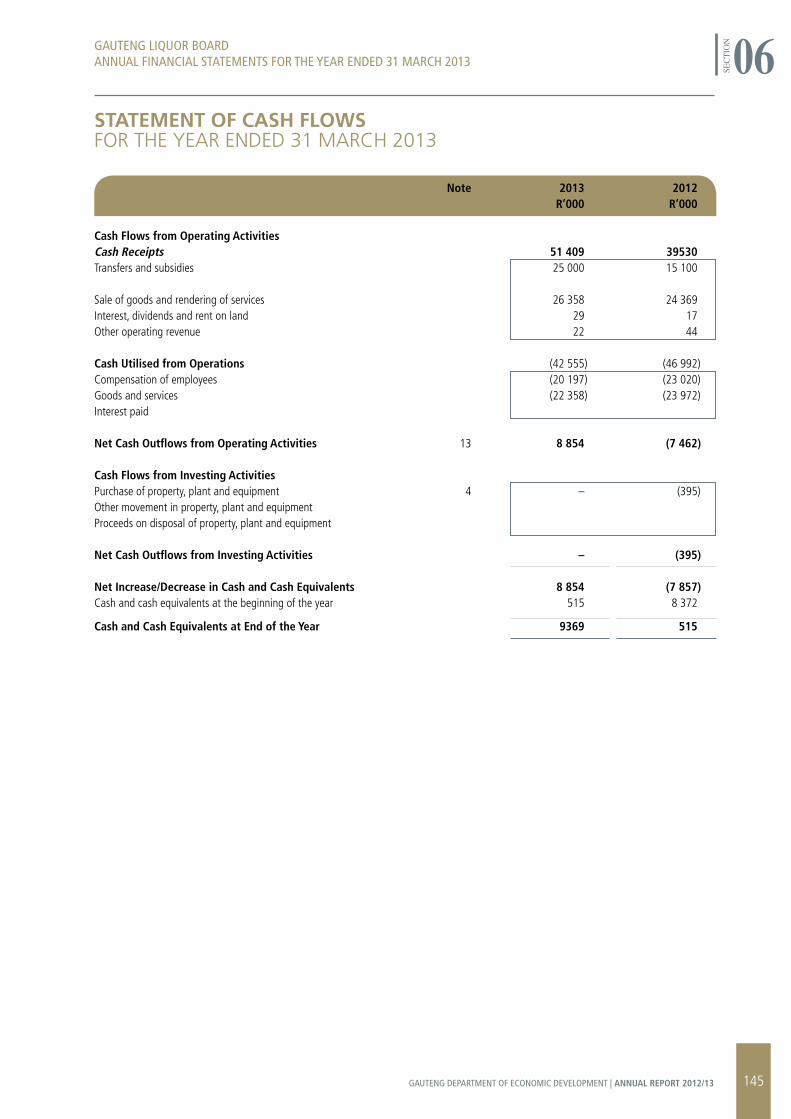
STATEMENT OF CASH FLOWSfoR the YeAR eNded 31 mARCh 2013
Note 2013 2012 R’000 R’000
Cash Flows from Operating ActivitiesCash Receipts 51 409 39530Transfers and subsidies 25 000 15 100
Sale of goods and rendering of services 26 358 24 369Interest, dividends and rent on land 29 17Other operating revenue 22 44 Cash Utilised from Operations (42 555) (46 992)Compensation of employees (20 197) (23 020)Goods and services (22 358) (23 972)Interest paid Net Cash Outflows from Operating Activities 13 8 854 (7 462) Cash Flows from Investing Activities Purchase of property, plant and equipment 4 – (395)Other movement in property, plant and equipment Proceeds on disposal of property, plant and equipment Net Cash Outflows from Investing Activities – (395) Net Increase/Decrease in Cash and Cash Equivalents 8 854 (7 857)Cash and cash equivalents at the beginning of the year 515 8 372
Cash and Cash Equivalents at End of the Year 9369 515
SECT
ION 06GAUTENG LIQUOR BOARD
ANNUAL FINANCIAL STATEMENTS FOR THE YEAR ENDED 31 MARCH 2013
145GAUTENG DEPARTMENT OF ECONOMIC DEVELOPMENT | ANNUAL REPORT 2012/13
1. Reporting Entity
The Gauteng Liquor Board (GLB) is a trading entity of the Department of Economic Development – Gauteng Provincial Government and is domiciled in South Africa. The address of the entity’s registered office is Matlotlo House, 1st floor94 Main Street, Johannesburg, 2000. The entity is tasked with the challenge of regulating the liquor retail and micro manufacturing industries as stipulated by the Gauteng Liquor Act No. 2 of 2003.
2. Basis of Preparation
a) Statement of Compliance
The financial statements have been prepared in accordance with, and comply with, South African Statements of Generally Accepted Accounting Practice (SA GAAP) including any interpretations of such Statements issued by the Accounting Practices Board and the Public Finance Management Act, 1999 (Act No 1 of 1999).
b) The Application of the Standards of GRAP by Trading Entities
It must be noted that public entities, as defined in the Public Finance Management Act will be reporting on South African Generally Recognized Accounting Practice (SA GRAP) including any interpretations of such Statements issued by the Accounting Practices Board and the Public Finance Management Act, 1999 (Act No 1 of 1999) with effect from 1 April 2013.
c) Basis of Measurement
The financial statements have been prepared in accordance with the going-concern principle on the historical basis except for the following material items in the statement of financial position:
The entity recognised and measured its assets for the first-time during the year under review by applying the following policy:
Initial measurement was measured at a deemed cost, using fair value at the date of initially recognising and measuring the assets.
The fair value of items of property, plant and equipment is determined with reference to a market based appraisal performed professionally by valuers. Where no evidence is available to determine the market value in an active and liquid market, the fair value of the item of property, plant and equipment is established by reference to other items with similar characteristics, in similar circumstances and location.
Financial instruments - refer to note 3(e) below.
d) Functional and Presentation Currency
These financial statements are presented in Rands which is the entity’s functional currency.
All financial information presented in Rands has been rounded to the nearest thousand rands.
e) Use of Estimates and Judgments
The preparation of financial statements in conformity with SA GAAP requires management to make judgments, estimates and assumptions that affect the application of accounting policies and the reported amounts of assets, liabilities, income and expenses. Actual results may differ from these estimates. It also requires management to exercise its judgment in the process of applying the GLB’s accounting policies.
Estimates and underlying assumptions are reviewed on an ongoing basis. Revisions to accounting estimates are recognized in the period in which the estimates are revised and in any future periods affected.
The areas involving a higher degree of judgment or complexity or areas where assumptions and estimates are significant to the financial statements are disclosed in note 3(k) (Critical accounting estimates and judgments).
3. Significant Accounting Policies
The accounting policies set out below have been applied consistently to all periods presented in these financial statements, except as explained in note 2(e), which addresses changes in accounting policies.
a) Revenue
Revenue from the sale of goods is recognised when significant risks and rewards of ownership of the goods have been transferred to the buyer, recovery of the consideration is probable, the associated costs and possible return of goods can be estimated reliably, there is no continuing involvement with the goods and the amount of revenue can be measured reliably. Transfers of risks and rewards vary depending on the individual terms of the contract of sale.
Revenue arising from the rendering of services is based on the stage of completion of the transaction at the reporting date. The stage of completion can be determined by reference to various methods such as the physical amount of work performed in relation to the total project when the outcome can be estimated reliably, services performed to date as a percentage of total services to be performed, the proportion that costs incurred to date bear to the estimated total costs of the transaction.
The main income of the GLB consists of license fees. The license fees (inclusive of renewals) are valid for one year. The Gauteng Liquor board shall recognize revenue if, and only if, the actual payment for a particular source of revenue has been received by the Gauteng Liquor Board in the bank account. This policy applies to the following source of revenue of the Gauteng Liquor Board:
NOTES TO THE FINANCIAL STATEMENTSfoR the YeAR eNded 31 mARCh 2013
SECT
ION 06 GAUTENG LIQUOR BOARD
ANNUAL FINANCIAL STATEMENTS FOR THE YEAR ENDED 31 MARCH 2013
146 GAUTENG DEPARTMENT OF ECONOMIC DEVELOPMENT | ANNUAL REPORT 2012/13
Application fees for liquor licences; Activation fees; Renewals of licenses; and Payment received for occasional fees.
b) Government Grants
Government grant includes allocations received during the period from the Gauteng Provincial Government. Government grants are recognised as income on a systematic and rational basis over the periods necessary to match the grants with the related costs which they are intended to compensate.
c) Property, Plant and Equipment
Property, plant and equipment is recognized as an asset when it is probable that future economic benefits associated with the use of the asset will flow to the organisation and the cost of the item can be reliably measured. Property, plant and equipment are carried at historical cost less accumulated depreciation and impairment losses.
Residual values are reviewed annually and any fair market value gains treated as capital reserves.
All cost associated with development and maintenance of computer software programmes are recognized as an expense when incurred and cost related to the upgrades of existing computer software by developers is capitalised when incurred and the amount is above the threshold for capitalization.
Depreciation on property, plant and equipment is calculated using the straight-line method to allocate their cost (including capitalised leased assets) over the estimated useful lives, as follows: Computer Equipment 20% - 33, 33% per annumLeasehold Improvements 33, 33% per annumOffice Furniture and Fittings 11% - 16, 67% per annum
An asset’s carrying amount is written down immediately to its recoverable amount if the carrying amount is greater than its estimated recoverable amount. Gains and losses on disposals are determined by comparing the proceeds with the carrying amount. These are included in profit or loss.
d) Impairment
At each balance sheet date, the GLB reviews the carrying amounts of its assets to determine whether there is any indication that the assets may be impaired. If any such indication exists, the recoverable amount of the asset is estimated in order to determine the extent of the impairment loss (if any). Where it is not possible to estimate the recoverable amount for an individual asset, the recoverable amount is determined for the cash-generating unit to which the asset belongs.If the recoverable amount of an asset (cash-generating unit) is estimated to be less than its carrying amount, the carrying amount of the asset (cash-generating unit) is reduced to its recoverable amount. Impairment losses are immediately taken to the income statement and reversals are recouped the income statement, unless the relevant asset is carried at a revalued amount under another standard, in which case the impairment loss is treated as a revaluation decrease under the standard.
e) Leases
(1) Operating Lease
Leases where the lessor retains and rewards of ownership of the underlying assets are classified as operating leases. Rentals payable under operating leases are charged to the income statement on a straight line basis over the period of the lease.
(2) Finance Lease
Leases are classified as finance leases whenever the terms of the lease transfer substantially all the risks and rewards of ownership to the lessee.
Assets held under finance leases are recognised as assets at their fair value at the date of acquisition. The corresponding liability to the lessor is included in the statement of financial position as a finance lease obligation. Finance costs, which represent the difference between the total leasing commitments and the fair value of the assets acquired, are charged to the statement of financial performance over the term of the relevant lease so as to produce a constant periodic rate of interest on the remaining balance of the obligations for each accounting period.
f) Financial Instruments
Financial assets and financial liabilities are recognised on the GLB balance sheet when the GLB becomes a party to the contractual provisions of the instrument. Financial instruments are initially measured at cost. Subsequent to initial recognition these instruments are measured as set out below.
(1) Trade and Other Receivables
Receivables are initially recognised at their fair values and reduced by appropriate allowances for estimated irrecoverable amounts, but are carried at amortised cost using the effective interest rate method at year end.
(2) Cash and Cash Equivalents
Cash and cash equivalents are carried on the statement of financial position at cost. For the purpose of the cash flow statement, cash and cash equivalents comprise cash on hand and bank current accounts.
(3) Trade and Other Payables
Trade and other payables are stated at their amortised cost.
g) Financial Risks and Guarantees
The GLB exposure to credit risk with respect to trade and other receivables is low as revenue is recognised when license fees are paid over to revenue agent. The Liquidity risk is significant as the GLB has been experiencing difficulty in meeting obligations associated with financial instruments. Guarantees are treated as a contingent liability.
SECT
ION 06GAUTENG LIQUOR BOARD
ANNUAL FINANCIAL STATEMENTS FOR THE YEAR ENDED 31 MARCH 2013
147GAUTENG DEPARTMENT OF ECONOMIC DEVELOPMENT | ANNUAL REPORT 2012/13
h) Provisions
Provisions are recognised when the GLB has a present legal or constructive obligation is as a result of a past event, it is probable that an outflow of resources will be required to settle the obligation and a reliable estimate of the amount can be made. Employees’ entitlement to annual leave and bonuses represents a present obligation to pay as a result of employee’s service. Provisions are measured at current salary rates and discounted to present value where the effect of the time value of money is material.
The GLB has exposure to some onerous contracts where the futuristic commitment on the party of the entity does not justify the benefit derived. The expenditure on such contracts is provided annually and treated as wasteful.
i) Related Parties
GLB operates in an economic environment currently dominated by entities directly or indirectly owned by the South African government. As a result of the constitutional independence of all three spheres of government in South Africa, only parties within the national sphere of government will be related parties. Related parties also include key management personnel, which are persons having authority and responsibility for planning, directing and controlling the activities of the entity, directly or indirectly.
j) Critical Accounting Estimates and Judgments
The GLB makes estimates and assumptions concerning the future. The resulting accounting estimates will, by definition, seldom equal the related actual results. Estimates and judgments are continually evaluated and are based on historical experience and other factors, including expectations of future events that are believed to be reasonable under the circumstances. The estimates and assumptions that have a significant risk of causing material adjustments to the carrying amounts of assets and liabilities within the next financial year are as follows:
(1) Estimates of Residual Values and Useful Lives of Equipment
The GLB reassesses annually the residual values and remaining useful lives of fixed assets. The residual values of these assets have been estimated as the amount that the GLB would currently obtain from disposal of each asset, in its current location, if the asset were already of the age and in the condition expected at the end of its useful life. The useful life is estimated as the period over which an asset is expected to be available for use by the GLB. Technological innovation and maintenance programmes impact the useful lives and residual values of the assets.
(2) Contingent Liabilities
Management applies its judgment to the patterns and advice it receives from its attorneys, advocates and other advisors in assessing if an obligation is probable, more likely than not, or remote. This judgment application is used to determine whether the obligation is recognised as a liability or disclosed as a contingent liability.
k) Irregular, Fruitless and Wasteful Expenditure
Irregular expenditure means expenditure incurred in contravention of, or not in accordance with, a requirement of any applicable legislation, including: The PFMA, or Any national/provincial legislation providing for procurement
procedures in that national/provincial government.
Fruitless and wasteful expenditure means expenditure that was made in vain and would have been avoided had reasonable care been exercised.
All irregular, fruitless and wasteful expenditure is charged against income in the period in which it is incurred.
l) Employee Benefits
Short term employee benefits
Short term employee benefits are recognised as an expense when an employee has rendered service to the GLB that entitles the employee to the short term benefits. The amount of the expense is the undiscounted amount of the short term employee benefits that are expected to be paid in exchange for that service.
ii) Retirement Benefits
The GLB provides retirement benefits for certain of its employees through a defined benefit plan for government employees. These benefits are funded by both employer and employee contributions. No provision is made for retirement benefits in the Annual Financial Statements of the GLB. Any potential liabilities are disclosed in the Annual Financial Statements of the National Revenue Fund and not in the Annual Financial Statements of the GLB.
m) Comparative Figures
Comparative figures have been adjusted to conform to changes in presentation in the current year where necessary.
SECT
ION 06 GAUTENG LIQUOR BOARD
ANNUAL FINANCIAL STATEMENTS FOR THE YEAR ENDED 31 MARCH 2013
148 GAUTENG DEPARTMENT OF ECONOMIC DEVELOPMENT | ANNUAL REPORT 2012/13
SECT
ION 06GAUTENG DEPARTMENT OF ECONOMIC DEVELOPMENT | VOTE 3
GAUTENG LIQUOR BOARD ANNUAL FINANCIAL STATEMENTS FOR THE YEAR ENDED 31 MARCH 2013
149GAUTENG DEPARTMENT OF ECONOMIC DEVELOPMENT | ANNUAL REPORT 2012/13
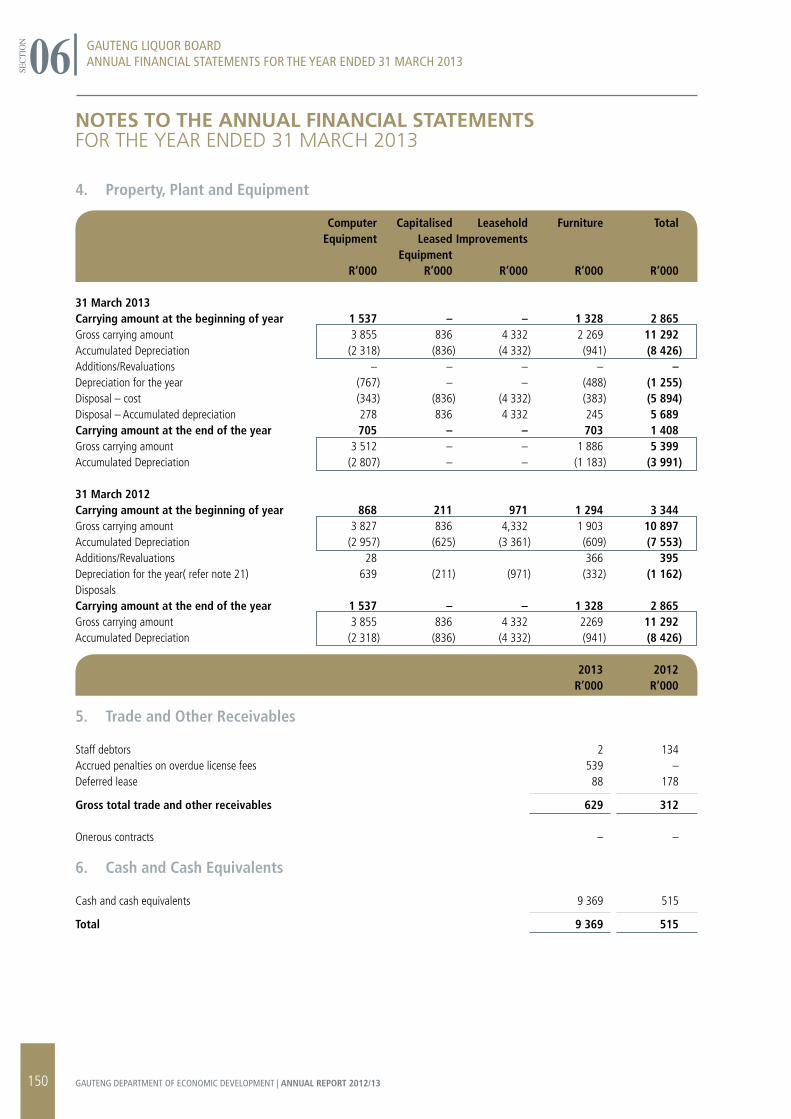
NOTES TO THE ANNUAL FINANCIAL STATEMENTSfoR the YeAR eNded 31 mARCh 2013
4. Property, Plant and Equipment
Computer Capitalised Leasehold Furniture Total Equipment Leased Improvements Equipment R’000 R’000 R’000 R’000 R’000
31 March 2013Carrying amount at the beginning of year 1 537 – – 1 328 2 865Gross carrying amount 3 855 836 4 332 2 269 11 292Accumulated Depreciation (2 318) (836) (4 332) (941) (8 426)Additions/Revaluations – – – – –Depreciation for the year (767) – – (488) (1 255)Disposal – cost (343) (836) (4 332) (383) (5 894)Disposal – Accumulated depreciation 278 836 4 332 245 5 689Carrying amount at the end of the year 705 – – 703 1 408Gross carrying amount 3 512 – – 1 886 5 399Accumulated Depreciation (2 807) – – (1 183) (3 991)
31 March 2012Carrying amount at the beginning of year 868 211 971 1 294 3 344Gross carrying amount 3 827 836 4,332 1 903 10 897 Accumulated Depreciation (2 957) (625) (3 361) (609) (7 553)Additions/Revaluations 28 366 395Depreciation for the year( refer note 21) 639 (211) (971) (332) (1 162)Disposals Carrying amount at the end of the year 1 537 – – 1 328 2 865Gross carrying amount 3 855 836 4 332 2269 11 292Accumulated Depreciation (2 318) (836) (4 332) (941) (8 426) 2013 2012 R’000 R’000
5. Trade and Other Receivables
Staff debtors 2 134Accrued penalties on overdue license fees 539 –Deferred lease 88 178
Gross total trade and other receivables 629 312
Onerous contracts – –
6. Cash and Cash Equivalents
Cash and cash equivalents 9 369 515
Total 9 369 515
SECT
ION 06 GAUTENG LIQUOR BOARD
ANNUAL FINANCIAL STATEMENTS FOR THE YEAR ENDED 31 MARCH 2013
150 GAUTENG DEPARTMENT OF ECONOMIC DEVELOPMENT | ANNUAL REPORT 2012/13
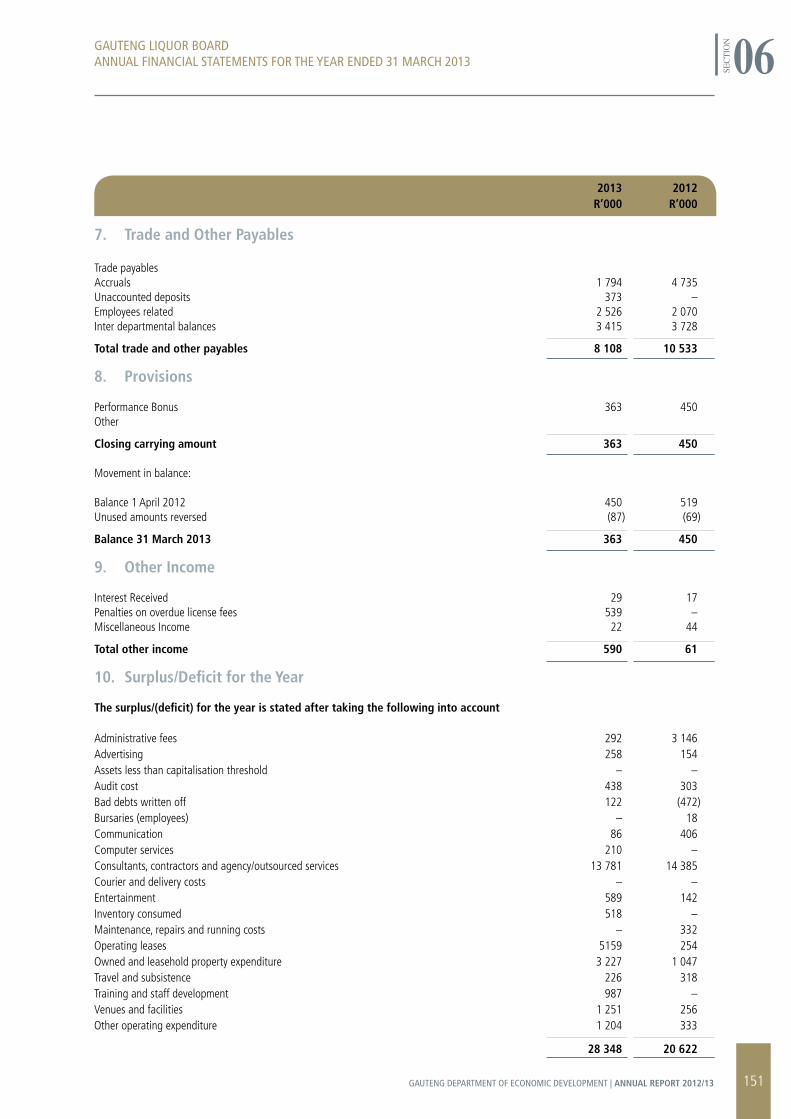
2013 2012 R’000 R’000
7. Trade and Other Payables
Trade payables Accruals 1 794 4 735Unaccounted deposits 373 –Employees related 2 526 2 070Inter departmental balances 3 415 3 728
Total trade and other payables 8 108 10 533
8. Provisions
Performance Bonus 363 450Other
Closing carrying amount 363 450
Movement in balance:
Balance 1 April 2012 450 519Unused amounts reversed (87) (69)
Balance 31 March 2013 363 450
9. Other Income
Interest Received 29 17Penalties on overdue license fees 539 –Miscellaneous Income 22 44
Total other income 590 61
10. Surplus/Deficit for the Year
The surplus/(deficit) for the year is stated after taking the following into account
Administrative fees 292 3 146 Advertising 258 154 Assets less than capitalisation threshold – –Audit cost 438 303 Bad debts written off 122 (472) Bursaries (employees) – 18Communication 86 406 Computer services 210 – Consultants, contractors and agency/outsourced services 13 781 14 385 Courier and delivery costs – –Entertainment 589 142 Inventory consumed 518 – Maintenance, repairs and running costs – 332 Operating leases 5159 254 Owned and leasehold property expenditure 3 227 1 047 Travel and subsistence 226 318 Training and staff development 987 –Venues and facilities 1 251 256 Other operating expenditure 1 204 333
28 348 20 622
SECT
ION 06GAUTENG LIQUOR BOARD
ANNUAL FINANCIAL STATEMENTS FOR THE YEAR ENDED 31 MARCH 2013
151GAUTENG DEPARTMENT OF ECONOMIC DEVELOPMENT | ANNUAL REPORT 2012/13
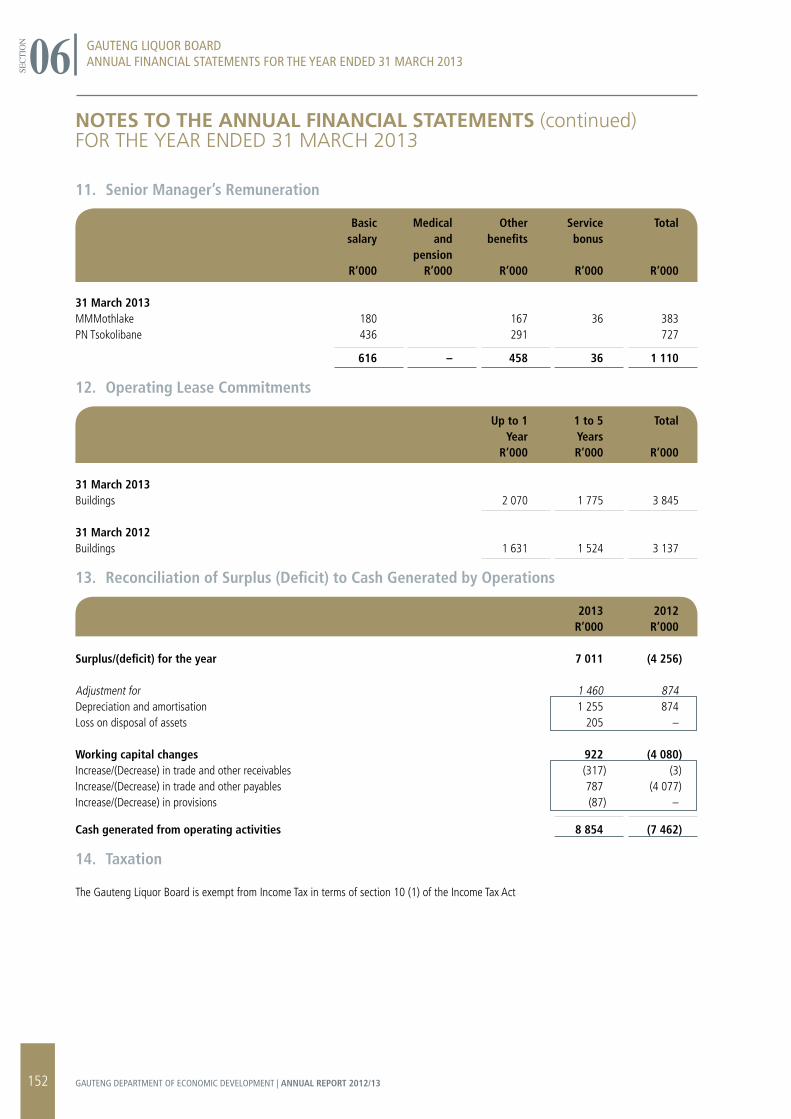
NOTES TO THE ANNUAL FINANCIAL STATEMENTS (continued)foR the YeAR eNded 31 mARCh 2013
11. Senior Manager’s Remuneration
Basic Medical Other Service Total salary and benefits bonus pension R’000 R’000 R’000 R’000 R’000
31 March 2013MMMothlake 180 167 36 383PN Tsokolibane 436 291 727
616 – 458 36 1 110
12. Operating Lease Commitments
Up to 1 1 to 5 Total Year Years R’000 R’000 R’000
31 March 2013Buildings 2 070 1 775 3 845
31 March 2012 Buildings 1 631 1 524 3 137
13. Reconciliation of Surplus (Deficit) to Cash Generated by Operations
2013 2012 R’000 R’000
Surplus/(deficit) for the year 7 011 (4 256)
Adjustment for 1 460 874Depreciation and amortisation 1 255 874Loss on disposal of assets 205 – Working capital changes 922 (4 080)Increase/(Decrease) in trade and other receivables (317) (3)Increase/(Decrease) in trade and other payables 787 (4 077)Increase/(Decrease) in provisions (87) –
Cash generated from operating activities 8 854 (7 462)
14. Taxation
The Gauteng Liquor Board is exempt from Income Tax in terms of section 10 (1) of the Income Tax Act
SECT
ION 06 GAUTENG LIQUOR BOARD
ANNUAL FINANCIAL STATEMENTS FOR THE YEAR ENDED 31 MARCH 2013
152 GAUTENG DEPARTMENT OF ECONOMIC DEVELOPMENT | ANNUAL REPORT 2012/13
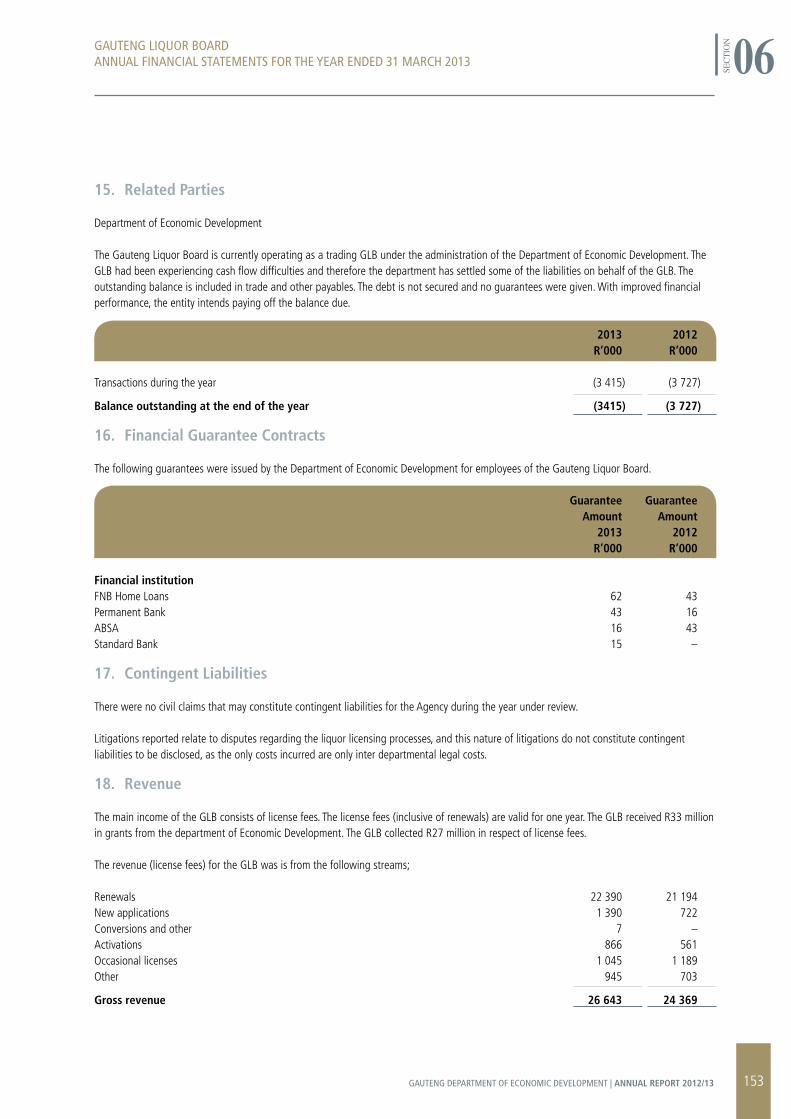
15. Related Parties
Department of Economic Development
The Gauteng Liquor Board is currently operating as a trading GLB under the administration of the Department of Economic Development. The GLB had been experiencing cash flow difficulties and therefore the department has settled some of the liabilities on behalf of the GLB. The outstanding balance is included in trade and other payables. The debt is not secured and no guarantees were given. With improved financial performance, the entity intends paying off the balance due.
2013 2012 R’000 R’000
Transactions during the year (3 415) (3 727)
Balance outstanding at the end of the year (3415) (3 727)
16. Financial Guarantee Contracts
The following guarantees were issued by the Department of Economic Development for employees of the Gauteng Liquor Board.
Guarantee Guarantee Amount Amount 2013 2012 R’000 R’000
Financial institution FNB Home Loans 62 43Permanent Bank 43 16ABSA 16 43Standard Bank 15 –
17. Contingent Liabilities
There were no civil claims that may constitute contingent liabilities for the Agency during the year under review.
Litigations reported relate to disputes regarding the liquor licensing processes, and this nature of litigations do not constitute contingent liabilities to be disclosed, as the only costs incurred are only inter departmental legal costs. 18. Revenue
The main income of the GLB consists of license fees. The license fees (inclusive of renewals) are valid for one year. The GLB received R33 million in grants from the department of Economic Development. The GLB collected R27 million in respect of license fees.
The revenue (license fees) for the GLB was is from the following streams;
Renewals 22 390 21 194New applications 1 390 722Conversions and other 7 –Activations 866 561Occasional licenses 1 045 1 189Other 945 703
Gross revenue 26 643 24 369
SECT
ION 06GAUTENG LIQUOR BOARD
ANNUAL FINANCIAL STATEMENTS FOR THE YEAR ENDED 31 MARCH 2013
153GAUTENG DEPARTMENT OF ECONOMIC DEVELOPMENT | ANNUAL REPORT 2012/13
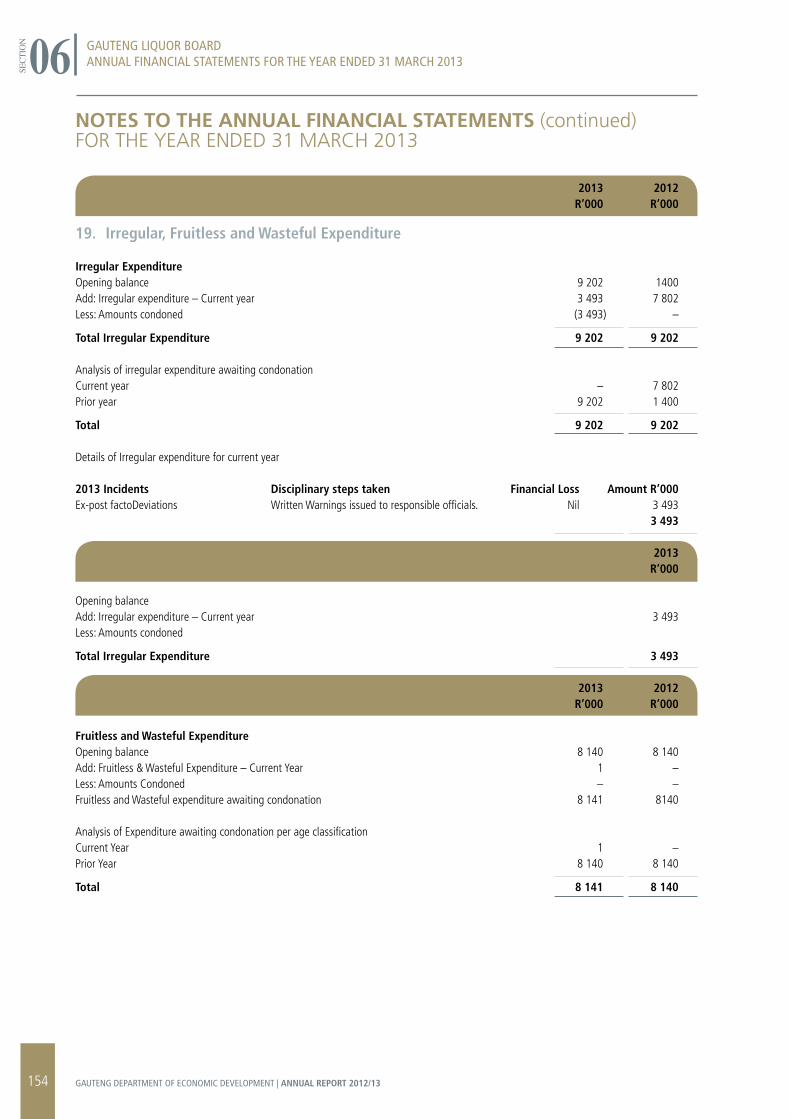
NOTES TO THE ANNUAL FINANCIAL STATEMENTS (continued)foR the YeAR eNded 31 mARCh 2013
2013 2012 R’000 R’000
19. Irregular, Fruitless and Wasteful Expenditure
Irregular ExpenditureOpening balance 9 202 1400Add: Irregular expenditure – Current year 3 493 7 802Less: Amounts condoned (3 493) –
Total Irregular Expenditure 9 202 9 202
Analysis of irregular expenditure awaiting condonation Current year – 7 802Prior year 9 202 1 400
Total 9 202 9 202
Details of Irregular expenditure for current year
2013 Incidents Disciplinary steps taken Financial Loss Amount R’000Ex-post factoDeviations Written Warnings issued to responsible officials. Nil 3 493 3 493 2013 R’000
Opening balance Add: Irregular expenditure – Current year 3 493Less: Amounts condoned
Total Irregular Expenditure 3 493 2013 2012 R’000 R’000
Fruitless and Wasteful Expenditure Opening balance 8 140 8 140 Add: Fruitless & Wasteful Expenditure – Current Year 1 –Less: Amounts Condoned – –Fruitless and Wasteful expenditure awaiting condonation 8 141 8140
Analysis of Expenditure awaiting condonation per age classification Current Year 1 –Prior Year 8 140 8 140
Total 8 141 8 140
SECT
ION 06 GAUTENG LIQUOR BOARD
ANNUAL FINANCIAL STATEMENTS FOR THE YEAR ENDED 31 MARCH 2013
154 GAUTENG DEPARTMENT OF ECONOMIC DEVELOPMENT | ANNUAL REPORT 2012/13
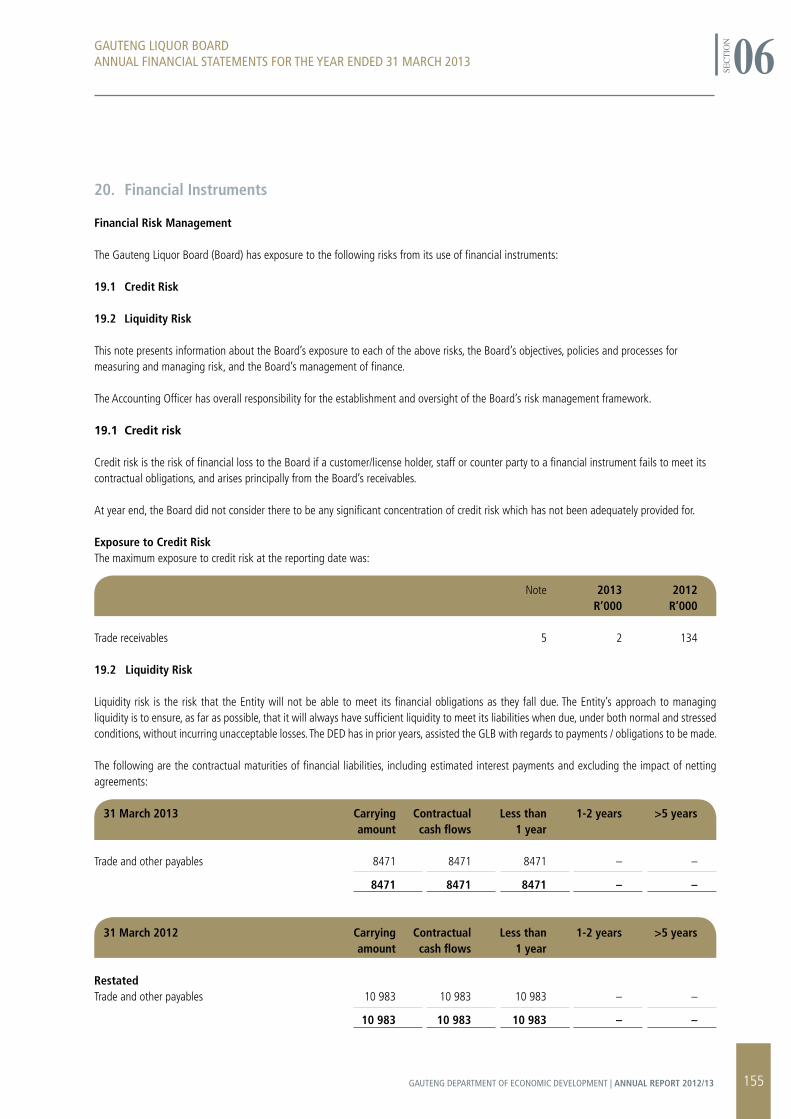
20. Financial Instruments
Financial Risk Management
The Gauteng Liquor Board (Board) has exposure to the following risks from its use of financial instruments:
19.1 Credit Risk
19.2 Liquidity Risk
This note presents information about the Board’s exposure to each of the above risks, the Board’s objectives, policies and processes for measuring and managing risk, and the Board’s management of finance.
The Accounting Officer has overall responsibility for the establishment and oversight of the Board’s risk management framework. 19.1 Credit risk
Credit risk is the risk of financial loss to the Board if a customer/license holder, staff or counter party to a financial instrument fails to meet its contractual obligations, and arises principally from the Board’s receivables. At year end, the Board did not consider there to be any significant concentration of credit risk which has not been adequately provided for.
Exposure to Credit Risk The maximum exposure to credit risk at the reporting date was:
Note 2013 2012 R’000 R’000
Trade receivables 5 2 134
19.2 Liquidity Risk
Liquidity risk is the risk that the Entity will not be able to meet its financial obligations as they fall due. The Entity’s approach to managing liquidity is to ensure, as far as possible, that it will always have sufficient liquidity to meet its liabilities when due, under both normal and stressed conditions, without incurring unacceptable losses. The DED has in prior years, assisted the GLB with regards to payments / obligations to be made.
The following are the contractual maturities of financial liabilities, including estimated interest payments and excluding the impact of netting agreements:
31 March 2013 Carrying Contractual Less than 1-2 years >5 years amount cash flows 1 year Trade and other payables 8471 8471 8471 – –
8471 8471 8471 – –
31 March 2012 Carrying Contractual Less than 1-2 years >5 years amount cash flows 1 year
RestatedTrade and other payables 10 983 10 983 10 983 – –
10 983 10 983 10 983 – –
SECT
ION 06GAUTENG LIQUOR BOARD
ANNUAL FINANCIAL STATEMENTS FOR THE YEAR ENDED 31 MARCH 2013
155GAUTENG DEPARTMENT OF ECONOMIC DEVELOPMENT | ANNUAL REPORT 2012/13
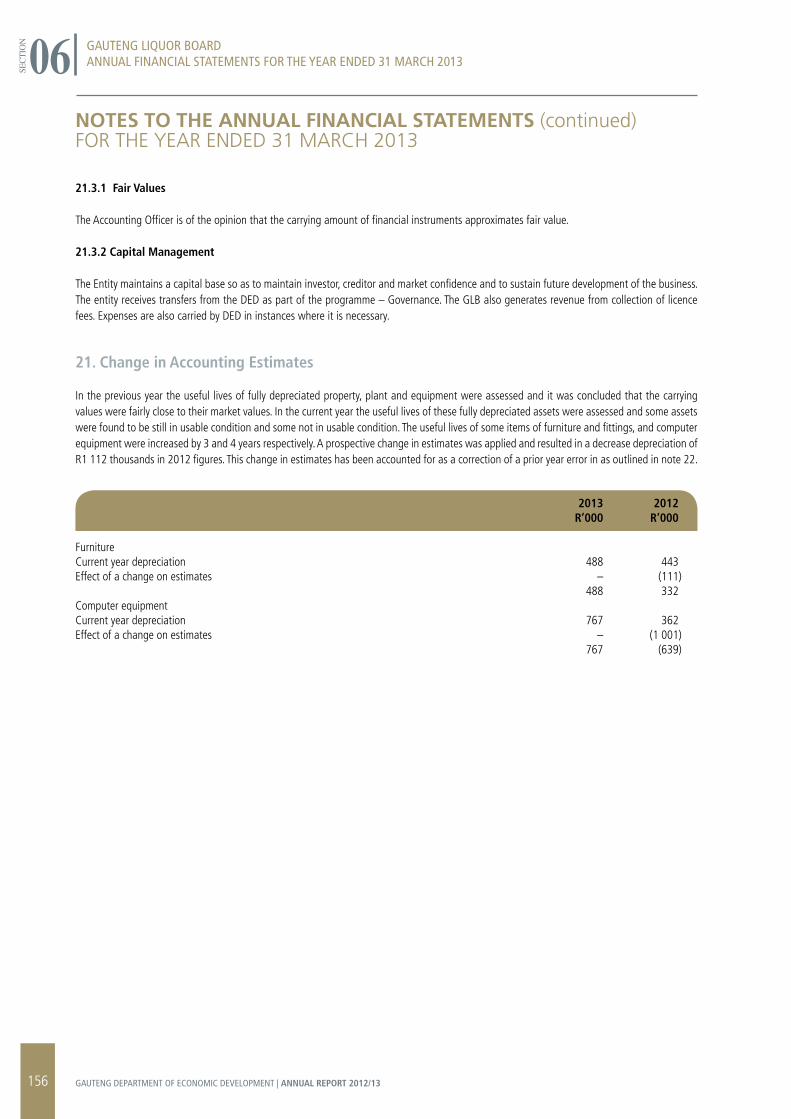
NOTES TO THE ANNUAL FINANCIAL STATEMENTS (continued)foR the YeAR eNded 31 mARCh 2013
21.3.1 Fair Values
The Accounting Officer is of the opinion that the carrying amount of financial instruments approximates fair value.
21.3.2 Capital Management
The Entity maintains a capital base so as to maintain investor, creditor and market confidence and to sustain future development of the business. The entity receives transfers from the DED as part of the programme – Governance. The GLB also generates revenue from collection of licence fees. Expenses are also carried by DED in instances where it is necessary.
21. Change in Accounting Estimates
In the previous year the useful lives of fully depreciated property, plant and equipment were assessed and it was concluded that the carrying values were fairly close to their market values. In the current year the useful lives of these fully depreciated assets were assessed and some assets were found to be still in usable condition and some not in usable condition. The useful lives of some items of furniture and fittings, and computer equipment were increased by 3 and 4 years respectively. A prospective change in estimates was applied and resulted in a decrease depreciation of R1 112 thousands in 2012 figures. This change in estimates has been accounted for as a correction of a prior year error in as outlined in note 22.
2013 2012 R’000 R’000
FurnitureCurrent year depreciation 488 443Effect of a change on estimates – (111) 488 332Computer equipmentCurrent year depreciation 767 362Effect of a change on estimates – (1 001) 767 (639)
SECT
ION 06 GAUTENG LIQUOR BOARD
ANNUAL FINANCIAL STATEMENTS FOR THE YEAR ENDED 31 MARCH 2013
156 GAUTENG DEPARTMENT OF ECONOMIC DEVELOPMENT | ANNUAL REPORT 2012/13
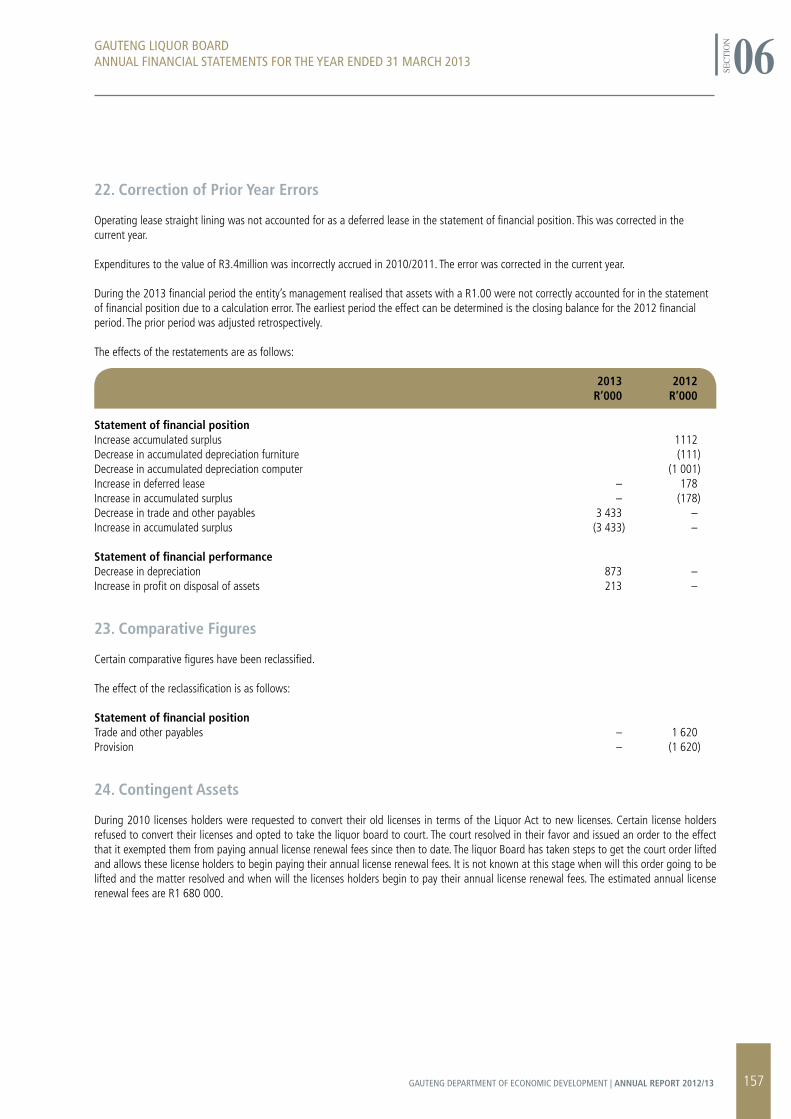
22. Correction of Prior Year Errors
Operating lease straight lining was not accounted for as a deferred lease in the statement of financial position. This was corrected in the current year.
Expenditures to the value of R3.4million was incorrectly accrued in 2010/2011. The error was corrected in the current year.
During the 2013 financial period the entity’s management realised that assets with a R1.00 were not correctly accounted for in the statement of financial position due to a calculation error. The earliest period the effect can be determined is the closing balance for the 2012 financial period. The prior period was adjusted retrospectively.
The effects of the restatements are as follows:
2013 2012 R’000 R’000
Statement of financial positionIncrease accumulated surplus 1112Decrease in accumulated depreciation furniture (111)Decrease in accumulated depreciation computer (1 001)Increase in deferred lease – 178 Increase in accumulated surplus – (178)Decrease in trade and other payables 3 433 –Increase in accumulated surplus (3 433) –
Statement of financial performanceDecrease in depreciation 873 –Increase in profit on disposal of assets 213 –
23. Comparative Figures
Certain comparative figures have been reclassified.
The effect of the reclassification is as follows:
Statement of financial positionTrade and other payables – 1 620Provision – (1 620)
24. Contingent Assets
During 2010 licenses holders were requested to convert their old licenses in terms of the Liquor Act to new licenses. Certain license holders refused to convert their licenses and opted to take the liquor board to court. The court resolved in their favor and issued an order to the effect that it exempted them from paying annual license renewal fees since then to date. The liquor Board has taken steps to get the court order lifted and allows these license holders to begin paying their annual license renewal fees. It is not known at this stage when will this order going to be lifted and the matter resolved and when will the licenses holders begin to pay their annual license renewal fees. The estimated annual license renewal fees are R1 680 000.
SECT
ION 06GAUTENG LIQUOR BOARD
ANNUAL FINANCIAL STATEMENTS FOR THE YEAR ENDED 31 MARCH 2013
157GAUTENG DEPARTMENT OF ECONOMIC DEVELOPMENT | ANNUAL REPORT 2012/13

158 GAUTENG DEPARTMENT OF ECONOMIC DEVELOPMENT | ANNUAL REPORT 2012/13
SECT
ION 07
GAUTENG DEPARTMENT OF ECONOMIC DEVELOPMENT | HUMAN
RESOURCE OVERSIGHT REPORT
159GAUTENG DEPARTMENT OF ECONOMIC DEVELOPMENT | ANNUAL REPORT 2012/13
GAU
TEN
G D
EPAR
TMEN
T O
F EC
ON
OM
IC D
EVEL
OPM
ENT
| VOT
E 3
HUM
AN R
ESO
URC
E O
VERS
IGHT
REP
ORT
SECTION 07TA
BLE
1.1
- M
AIN
SEr
VIC
E FO
r S
ErV
ICE
DEL
IVEr
Y IM
PrO
VEM
ENT
AN
D S
TAN
DA
rD
S
Mai
n Se
rvic
esA
ctua
l Cus
tom
ers
Pote
ntia
l Cus
tom
ers
Stan
dard
of S
ervi
ceA
ctua
l Ach
ieve
men
t ag
ains
t St
anda
rds
Liqu
or L
icen
sing
Liqu
or tr
ader
s G
PG P
ublic
Pr
oces
s liq
uor a
pplic
atio
ns w
ithin
ni
nety
(90)
wor
king
day
s.23
86 L
iquo
r tra
ding
lice
nces
gra
nted
tim
eous
ly
Ende
avou
r to
resp
ond
to y
ou in
a
lang
uage
of y
our p
refe
renc
e
Clie
nts
will
not
wai
t mor
e th
an fi
ve(5
) m
inut
es w
ithou
t bei
ng a
ttend
ed to
.
Info
rm c
usto
mer
s on
wha
t to
expe
ct
and
norm
al p
roce
ss ti
me.
Offi
cials
iden
tify
them
selv
es a
nd
sect
ion
whe
n an
swer
ing
all c
alls.
Switc
hboa
rd o
pera
tors
iden
tify
the
nam
e of
dep
artm
ent w
hen
answ
erin
g ou
tsid
e ca
lls.
Cons
umer
Pub
lic S
ervi
ceAl
l con
sum
er in
Gau
teng
G
PG P
ublic
Re
solv
e al
l con
sum
er c
ompl
aint
s th
roug
h m
edia
tion
and
arbi
tratio
n w
ithin
60
days
.
3893
Com
plai
nts
reso
lved
with
in
60 d
ays
Ende
avou
r to
resp
ond
to y
ou in
a
lang
uage
of y
our p
refe
renc
e
Clie
nts
will
not
wai
t mor
e th
an fi
ve(5
) m
inut
es w
ithou
t bei
ng a
ttend
ed to
.
Ende
avou
r to
resp
ond
to y
ou in
a
lang
uage
of y
our p
refe
renc
e
Info
rm c
usto
mer
s on
wha
t to
expe
ct
and
norm
al p
roce
ss ti
me.
Offi
cials
iden
tify
them
selv
es a
nd
sect
ion
whe
n an
swer
ing
all c
alls.
Switc
hboa
rd o
pera
tors
iden
tify
the
nam
e of
dep
artm
ent w
hen
answ
erin
g ou
tsid
e ca
lls
160 GAUTENG DEPARTMENT OF ECONOMIC DEVELOPMENT | ANNUAL REPORT 2012/13
Mai
n Se
rvic
esA
ctua
l Cus
tom
ers
Pote
ntia
l Cus
tom
ers
Stan
dard
of S
ervi
ceA
ctua
l Ach
ieve
men
t ag
ains
t St
anda
rds
Broa
d Ba
sed
Blac
k Ec
onom
ic E
mpo
wer
men
t Pu
blic
Sect
or:
GPG
Pub
lic
GPG
Dep
artm
ents
.En
deav
our t
o re
spon
d to
you
in a
la
ngua
ge o
f you
r pre
fere
nce.
Agen
cies
and
Mun
icipa
litie
s.Cl
ient
s w
ill n
ot w
ait m
ore
than
five
(5)
min
utes
with
out b
eing
atte
nded
to.
Priva
te s
ecto
r and
Civ
il So
ciety
En
deav
our t
o re
spon
d to
you
in a
la
ngua
ge o
f you
r pre
fere
nce.
(GPG
sup
plie
rs c
urre
ntly
regi
ster
ed o
n th
e da
taba
se)
Info
rm c
usto
mer
s on
wha
t to
expe
ct
and
norm
al p
roce
ss ti
me.
Type
of A
rran
gem
ent
Act
ual C
usto
mer
Pote
ntia
l Cus
tom
erA
ctua
l Ach
ieve
men
ts
Liqu
or L
icen
sing
Al
l Alco
hol s
elle
rs
GPG
Pub
lic
Not
App
licab
le
Wor
ksho
ps c
ondu
cted
104
Wor
ksho
p co
nduc
ted
Publ
ic pa
rticip
atio
n pr
ogra
mm
es c
ondu
cted
17 P
ublic
par
ticip
atio
ns
Stak
ehol
der m
eetin
gs c
ondu
cted
77 S
take
hold
ers
mee
ting
held
Road
Sho
ws
cond
ucte
d17
Roa
dsho
ws
cond
ucte
d
Imbi
zos
cond
ucte
d 15
Imbi
zos
cond
ucte
d
TAB
LE 1
.1 -
MA
IN S
ErV
ICE
FOr
SEr
VIC
E D
ELIV
ErY
IMPr
OV
EMEN
T A
ND
STA
ND
Ar
DS
TAB
LE 1
.2 -
CO
NSU
LTA
TIO
N A
rr
AN
GEM
ENTS
FO
r C
UST
OM
ErS
GAU
TEN
G D
EPAR
TMEN
T O
F EC
ON
OM
IC D
EVEL
OPM
ENT
| VOT
E 3
HUM
AN R
ESO
URC
E O
VERS
IGHT
REP
ORT
SECTION 07
161GAUTENG DEPARTMENT OF ECONOMIC DEVELOPMENT | ANNUAL REPORT 2012/13
GAU
TEN
G D
EPAR
TMEN
T O
F EC
ON
OM
IC D
EVEL
OPM
ENT
| VOT
E 3
HUM
AN R
ESO
URC
E O
VERS
IGHT
REP
ORT
SECTION 07Ty
pe o
f Arr
ange
men
tA
ctua
l Cus
tom
erPo
tent
ial C
usto
mer
Act
ual A
chie
vem
ents
Cons
umer
Pro
tect
ion
Serv
ice
All c
onsu
mer
in G
aute
ng
GPG
Pub
lic
Wor
ksho
ps c
ondu
cted
20
5 W
orks
hops
con
duct
ed
Road
sho
ws
cond
ucte
d29
Roa
dsho
ws
cond
ucte
d
Imbi
zos
cond
ucte
d 9
Imbi
zos
cond
ucte
d
Exhi
bitio
ns11
exh
ibiti
ons
held
Broa
d Ba
sed
Blac
k Ec
onom
ic Em
pow
erm
ent
Publ
ic se
ctor
: G
PG P
ublic
Cons
ulta
tions
GPG
Dep
artm
ents
Agen
cies
and
mun
icipa
litie
s
Priva
te s
ecto
r and
civ
il so
ciety
(GPG
sup
plie
rs c
urre
ntly
regi
ster
ed o
n th
e da
taba
se)
TAB
LE 1
.2 -
CO
NSU
LTA
TIO
N A
rr
AN
GEM
ENTS
FO
r C
UST
OM
ErS
162 GAUTENG DEPARTMENT OF ECONOMIC DEVELOPMENT | ANNUAL REPORT 2012/13
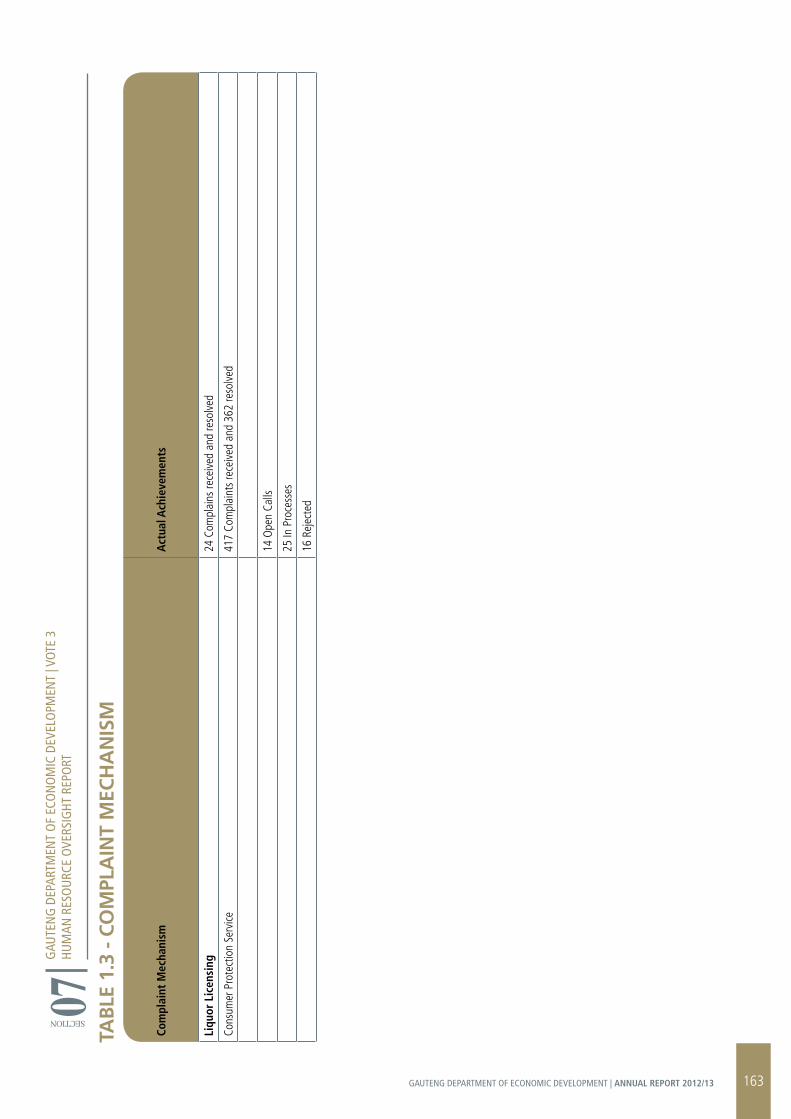
GAU
TEN
G D
EPAR
TMEN
T O
F EC
ON
OM
IC D
EVEL
OPM
ENT
| VOT
E 3
HUM
AN R
ESO
URC
E O
VERS
IGHT
REP
ORT
SECTION 07TA
BLE
1.3
- C
OM
PLA
INT
MEC
HA
NIS
M
Com
plai
nt M
echa
nism
Act
ual A
chie
vem
ents
Liqu
or L
icen
sing
24
Com
plai
ns re
ceiv
ed a
nd re
solv
ed
Cons
umer
Pro
tect
ion
Serv
ice
417
Com
plai
nts
rece
ived
and
362
reso
lved
14 O
pen
Calls
25 In
Pro
cess
es
16 R
ejec
ted
163GAUTENG DEPARTMENT OF ECONOMIC DEVELOPMENT | ANNUAL REPORT 2012/13
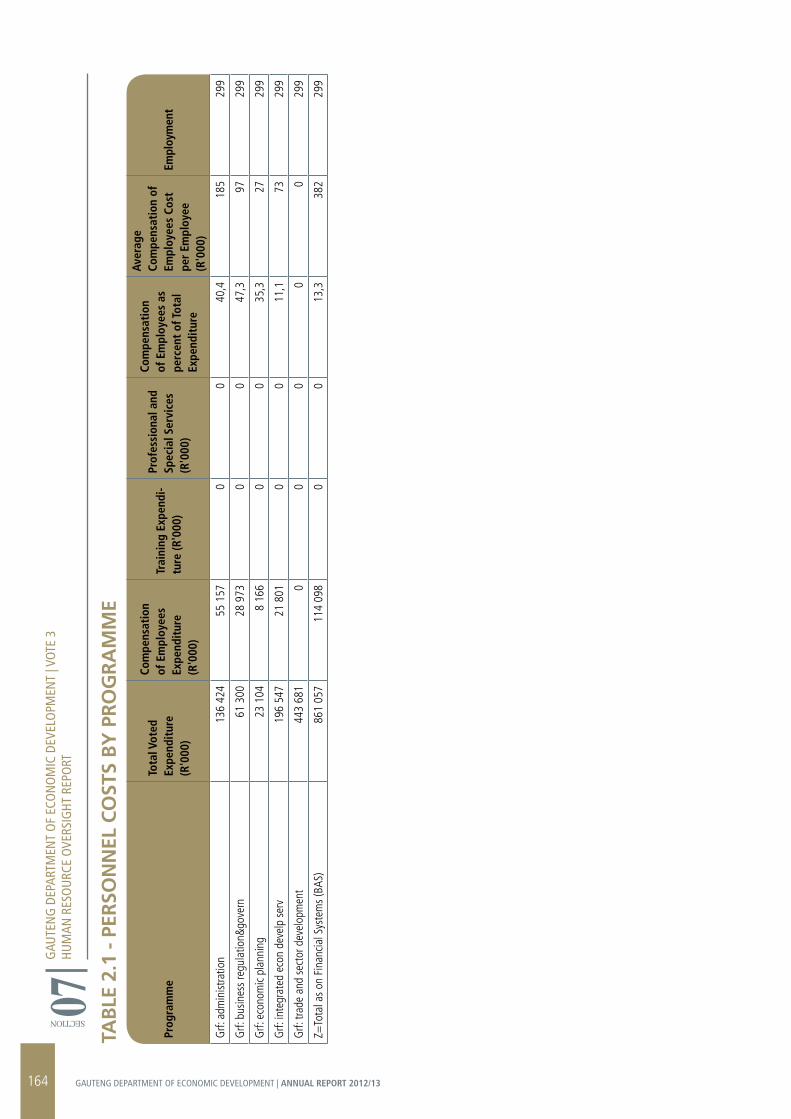
GAU
TEN
G D
EPAR
TMEN
T O
F EC
ON
OM
IC D
EVEL
OPM
ENT
| VOT
E 3
HUM
AN R
ESO
URC
E O
VERS
IGHT
REP
ORT
SECTION 07TA
BLE
2.1
- P
ErSO
NN
EL C
OST
S B
Y P
rO
Gr
AM
ME
Prog
ram
me
Tota
l Vot
ed
Expe
ndit
ure
(R'0
00)
Com
pens
atio
n of
Em
ploy
ees
Expe
ndit
ure
(R'0
00)
Trai
ning
Exp
endi
-tu
re (R
'000
)
Prof
essi
onal
and
Sp
ecia
l Ser
vice
s (R
'000
)
Com
pens
atio
n of
Em
ploy
ees
as
perc
ent
of T
otal
Ex
pend
itur
e
Aver
age
Com
pens
atio
n of
Em
ploy
ees
Cost
pe
r Em
ploy
ee
(R'0
00)
Empl
oym
ent
Grf:
adm
inist
ratio
n 13
6 42
455
157
00
40,4
185
299
Grf:
bus
ines
s re
gula
tion&
gove
rn
61 3
0028
973
00
47,3
9729
9
Grf:
eco
nom
ic pl
anni
ng
23 1
048
166
00
35,3
2729
9
Grf:
inte
grat
ed e
con
deve
lp s
erv
196
547
21 8
010
011
,173
299
Grf:
trad
e an
d se
ctor
dev
elop
men
t 44
3 68
10
00
00
299
Z=To
tal a
s on
Fin
ancia
l Sys
tem
s (B
AS)
861
057
114
098
00
13,3
382
299
164 GAUTENG DEPARTMENT OF ECONOMIC DEVELOPMENT | ANNUAL REPORT 2012/13
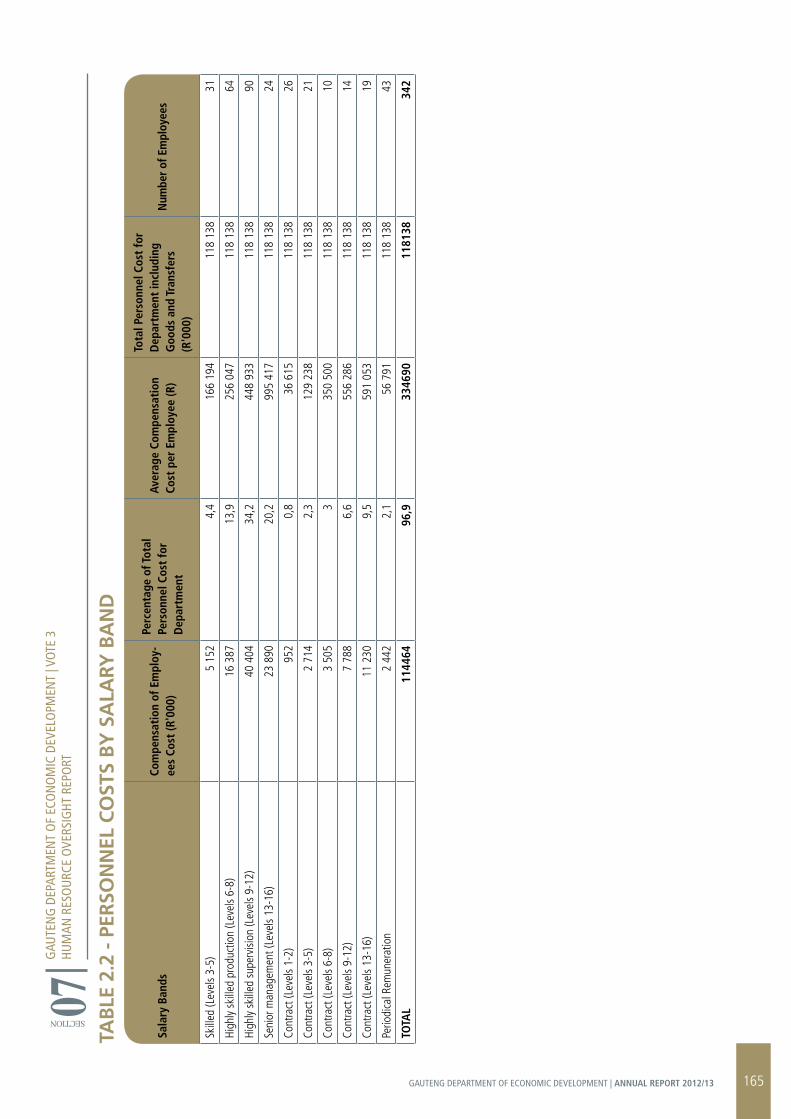
GAU
TEN
G D
EPAR
TMEN
T O
F EC
ON
OM
IC D
EVEL
OPM
ENT
| VOT
E 3
HUM
AN R
ESO
URC
E O
VERS
IGHT
REP
ORT
SECTION 07TA
BLE
2.2
- P
ErSO
NN
EL C
OST
S B
Y S
ALA
rY B
AN
D
Sala
ry B
ands
Com
pens
atio
n of
Em
ploy
-ee
s Co
st (R
'000
)
Perc
enta
ge o
f Tot
al
Pers
onne
l Cos
t fo
r D
epar
tmen
t
Aver
age
Com
pens
atio
n Co
st p
er E
mpl
oyee
(R)
Tota
l Per
sonn
el C
ost
for
Dep
artm
ent
incl
udin
g G
oods
and
Tra
nsfe
rs
(R'0
00)
Num
ber o
f Em
ploy
ees
Skill
ed (L
evel
s 3-
5)
5 15
24,
416
6 19
411
8 13
831
High
ly sk
illed
pro
duct
ion
(Lev
els
6-8)
16
387
13,9
256
047
118
138
64
High
ly sk
illed
sup
ervi
sion
(Lev
els
9-12
) 40
404
34,2
448
933
118
138
90
Seni
or m
anag
emen
t (Le
vels
13-1
6)
23 8
9020
,299
5 41
711
8 13
824
Cont
ract
(Lev
els
1-2)
95
20,
836
615
118
138
26
Cont
ract
(Lev
els
3-5)
2
714
2,3
129
238
118
138
21
Cont
ract
(Lev
els
6-8)
3
505
335
0 50
011
8 13
810
Cont
ract
(Lev
els
9-12
) 7
788
6,6
556
286
118
138
14
Cont
ract
(Lev
els
13-1
6)
11 2
309,
559
1 05
311
8 13
819
Perio
dica
l Rem
uner
atio
n 2
442
2,1
56 7
9111
8 13
843
TOTA
L11
4464
96,9
3346
9011
8138
342
165GAUTENG DEPARTMENT OF ECONOMIC DEVELOPMENT | ANNUAL REPORT 2012/13
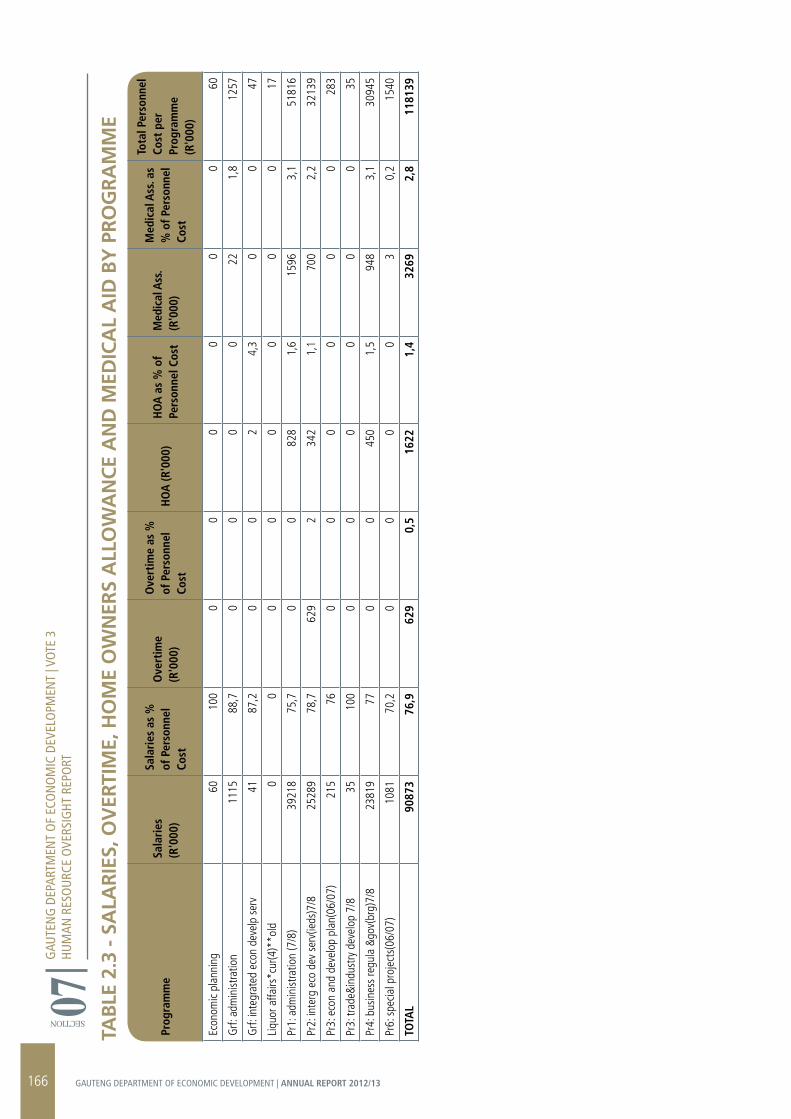
GAU
TEN
G D
EPAR
TMEN
T O
F EC
ON
OM
IC D
EVEL
OPM
ENT
| VOT
E 3
HUM
AN R
ESO
URC
E O
VERS
IGHT
REP
ORT
SECTION 07Pr
ogra
mm
eSa
lari
es
(R'0
00)
Sala
ries
as
%
of P
erso
nnel
Co
st
Ove
rtim
e (R
'000
)
Ove
rtim
e as
%
of P
erso
nnel
Co
stH
OA
(R'0
00)
HO
A a
s %
of
Pers
onne
l Cos
tM
edic
al A
ss.
(R'0
00)
Med
ical
Ass
. as
% o
f Per
sonn
el
Cost
Tota
l Per
sonn
el
Cost
per
Pr
ogra
mm
e (R
'000
)
Econ
omic
plan
ning
60
100
00
00
00
60
Grf:
adm
inist
ratio
n 11
1588
,70
00
022
1,8
1257
Grf:
inte
grat
ed e
con
deve
lp s
erv
4187
,20
02
4,3
00
47
Liqu
or a
ffairs
*cur
(4)*
*old
0
00
00
00
017
Pr1:
adm
inist
ratio
n (7
/8)
3921
875
,70
082
81,
615
963,
151
816
Pr2:
inte
rg e
co d
ev s
erv(
ieds
)7/8
25
289
78,7
629
234
21,
170
02,
232
139
Pr3:
eco
n an
d de
velo
p pl
an(0
6/07
) 21
576
00
00
00
283
Pr3:
trad
e&in
dust
ry d
evel
op 7
/8
3510
00
00
00
035
Pr4:
bus
ines
s re
gula
&go
v(br
g)7/
8 23
819
770
045
01,
594
83,
130
945
Pr6:
spe
cial p
roje
cts(
06/0
7)
1081
70,2
00
00
30,
215
40
TOTA
L90
873
76,9
629
0,5
1622
1,4
3269
2,8
1181
39
TAB
LE 2
.3 -
SA
LAr
IES,
OV
ErTI
ME,
HO
ME
OW
NEr
S A
LLO
WA
NC
E A
ND
MED
ICA
L A
ID B
Y P
rO
Gr
AM
ME
166 GAUTENG DEPARTMENT OF ECONOMIC DEVELOPMENT | ANNUAL REPORT 2012/13
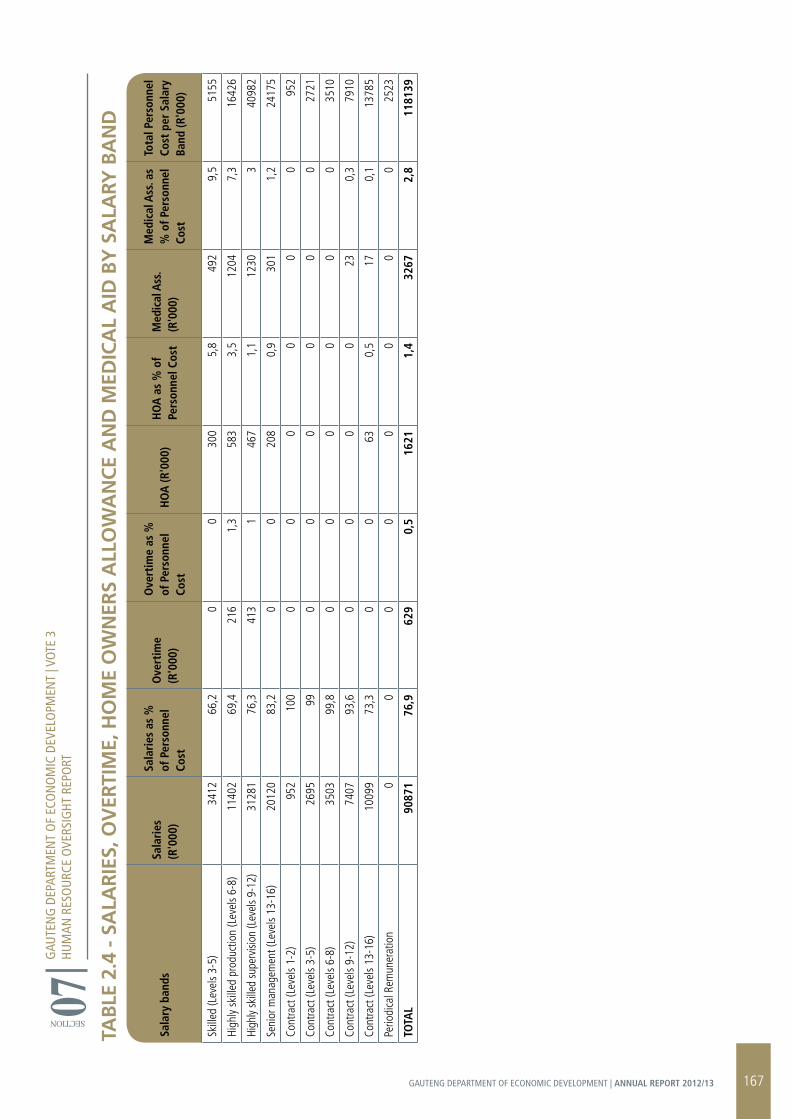
GAU
TEN
G D
EPAR
TMEN
T O
F EC
ON
OM
IC D
EVEL
OPM
ENT
| VOT
E 3
HUM
AN R
ESO
URC
E O
VERS
IGHT
REP
ORT
SECTION 07TA
BLE
2.4
- S
ALA
rIE
S, O
VEr
TIM
E, H
OM
E O
WN
ErS
ALL
OW
AN
CE
AN
D M
EDIC
AL
AID
BY
SA
LArY
BA
ND
Sala
ry b
ands
Sala
ries
(R
'000
)
Sala
ries
as
%
of P
erso
nnel
Co
st
Ove
rtim
e (R
'000
)
Ove
rtim
e as
%
of P
erso
nnel
Co
stH
OA
(R'0
00)
HO
A a
s %
of
Pers
onne
l Cos
tM
edic
al A
ss.
(R'0
00)
Med
ical
Ass
. as
% o
f Per
sonn
el
Cost
Tota
l Per
sonn
el
Cost
per
Sal
ary
Band
(R'0
00)
Skill
ed (L
evel
s 3-
5)
3412
66,2
00
300
5,8
492
9,5
5155
High
ly sk
illed
pro
duct
ion
(Lev
els
6-8)
11
402
69,4
216
1,3
583
3,5
1204
7,3
1642
6
High
ly sk
illed
supe
rvisi
on (L
evel
s 9-1
2)
3128
176
,341
31
467
1,1
1230
340
982
Seni
or m
anag
emen
t (Le
vels
13-1
6)
2012
083
,20
020
80,
930
11,
224
175
Cont
ract
(Lev
els
1-2)
95
210
00
00
00
095
2
Cont
ract
(Lev
els
3-5)
26
9599
00
00
00
2721
Cont
ract
(Lev
els
6-8)
35
0399
,80
00
00
035
10
Cont
ract
(Lev
els
9-12
) 74
0793
,60
00
023
0,3
7910
Cont
ract
(Lev
els
13-1
6)
1009
973
,30
063
0,5
170,
113
785
Perio
dica
l Rem
uner
atio
n 0
00
00
00
025
23
TOTA
L90
871
76,9
629
0,5
1621
1,4
3267
2,8
1181
39
167GAUTENG DEPARTMENT OF ECONOMIC DEVELOPMENT | ANNUAL REPORT 2012/13
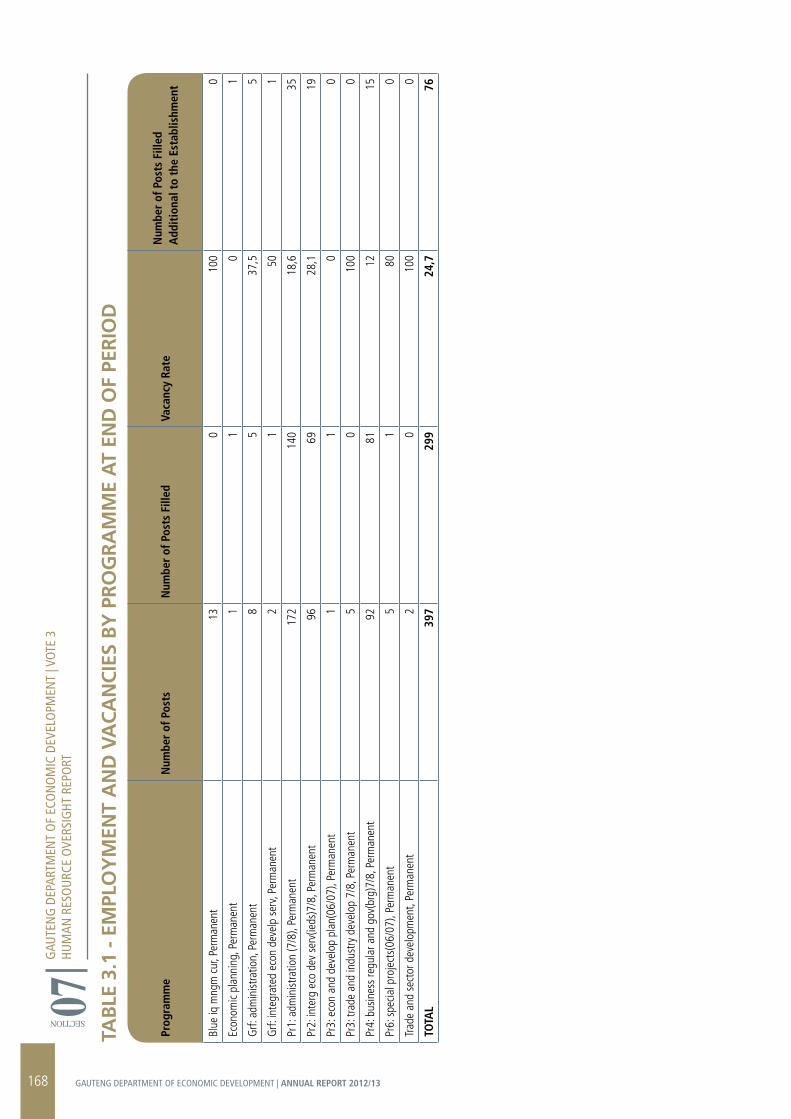
GAU
TEN
G D
EPAR
TMEN
T O
F EC
ON
OM
IC D
EVEL
OPM
ENT
| VOT
E 3
HUM
AN R
ESO
URC
E O
VERS
IGHT
REP
ORT
SECTION 07Pr
ogra
mm
eN
umbe
r of
Pos
tsN
umbe
r of
Pos
ts F
illed
Vaca
ncy
Rate
Num
ber
of P
osts
Fill
ed
Add
itio
nal t
o th
e Es
tabl
ishm
ent
Blue
iq m
ngm
cur
, Per
man
ent
130
100
0
Econ
omic
plan
ning
, Per
man
ent
11
01
Grf:
adm
inist
ratio
n, P
erm
anen
t 8
537
,55
Grf:
inte
grat
ed e
con
deve
lp s
erv,
Perm
anen
t 2
150
1
Pr1:
adm
inist
ratio
n (7
/8),
Perm
anen
t 17
214
018
,635
Pr2:
inte
rg e
co d
ev s
erv(
ieds
)7/8
, Per
man
ent
9669
28,1
19
Pr3:
eco
n an
d de
velo
p pl
an(0
6/07
), Pe
rman
ent
11
00
Pr3:
trad
e an
d in
dust
ry d
evel
op 7
/8, P
erm
anen
t 5
010
00
Pr4:
bus
ines
s re
gula
r and
gov
(brg
)7/8
, Per
man
ent
9281
1215
Pr6:
spe
cial p
roje
cts(
06/0
7), P
erm
anen
t 5
180
0
Trad
e an
d se
ctor
dev
elop
men
t, Pe
rman
ent
20
100
0
TOTA
L39
729
924
,776
TAB
LE 3
.1 -
EM
PLO
YM
ENT
AN
D V
AC
AN
CIE
S B
Y P
rO
Gr
AM
ME
AT
END
OF
PEr
IOD
168 GAUTENG DEPARTMENT OF ECONOMIC DEVELOPMENT | ANNUAL REPORT 2012/13
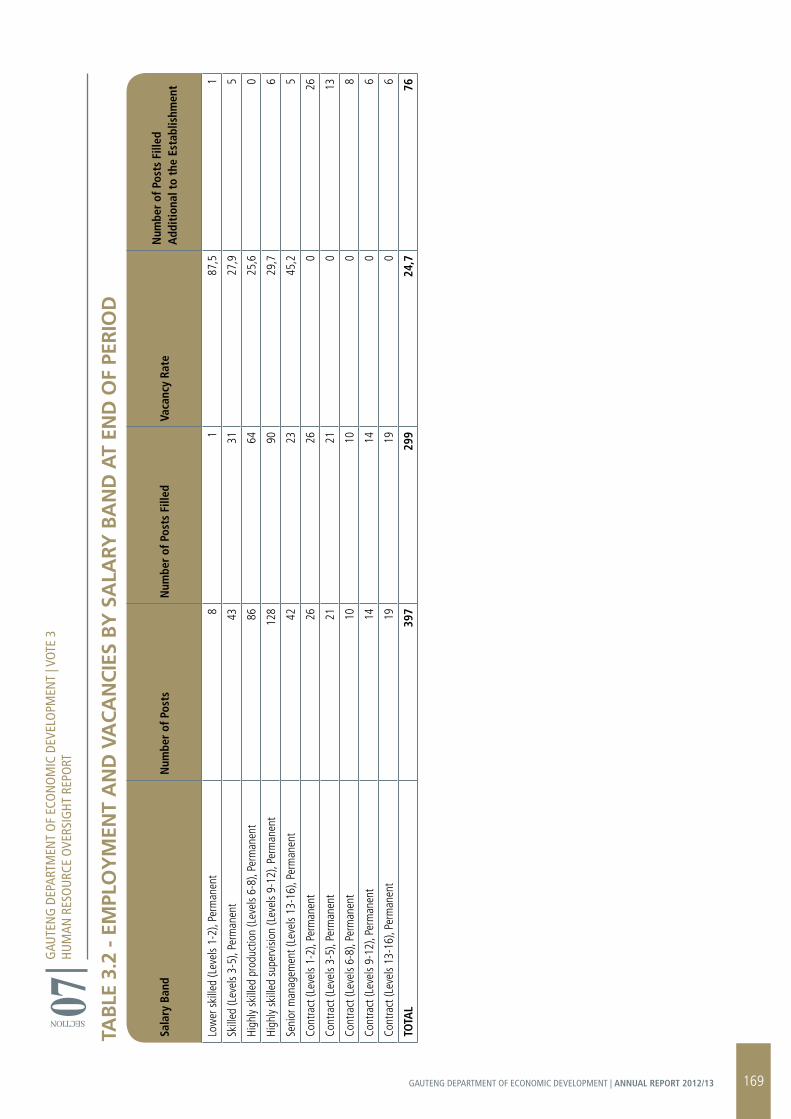
Sala
ry B
and
Num
ber
of P
osts
Num
ber
of P
osts
Fill
edVa
canc
y Ra
teN
umbe
r of
Pos
ts F
illed
A
ddit
iona
l to
the
Esta
blis
hmen
t
Low
er s
kille
d (L
evel
s 1-
2), P
erm
anen
t 8
187
,51
Skill
ed (L
evel
s 3-
5), P
erm
anen
t 43
3127
,95
High
ly sk
illed
pro
duct
ion
(Lev
els
6-8)
, Per
man
ent
8664
25,6
0
High
ly sk
illed
sup
ervi
sion
(Lev
els
9-12
), Pe
rman
ent
128
9029
,76
Seni
or m
anag
emen
t (Le
vels
13-1
6), P
erm
anen
t 42
2345
,25
Cont
ract
(Lev
els
1-2)
, Per
man
ent
2626
026
Cont
ract
(Lev
els
3-5)
, Per
man
ent
2121
013
Cont
ract
(Lev
els
6-8)
, Per
man
ent
1010
08
Cont
ract
(Lev
els
9-12
), Pe
rman
ent
1414
06
Cont
ract
(Lev
els
13-1
6), P
erm
anen
t 19
190
6
TOTA
L39
729
924
,776
GAU
TEN
G D
EPAR
TMEN
T O
F EC
ON
OM
IC D
EVEL
OPM
ENT
| VOT
E 3
HUM
AN R
ESO
URC
E O
VERS
IGHT
REP
ORT
SECTION 07TA
BLE
3.2
- E
MPL
OY
MEN
T A
ND
VA
CA
NC
IES
BY
SA
LArY
BA
ND
AT
END
OF
PEr
IOD
169GAUTENG DEPARTMENT OF ECONOMIC DEVELOPMENT | ANNUAL REPORT 2012/13
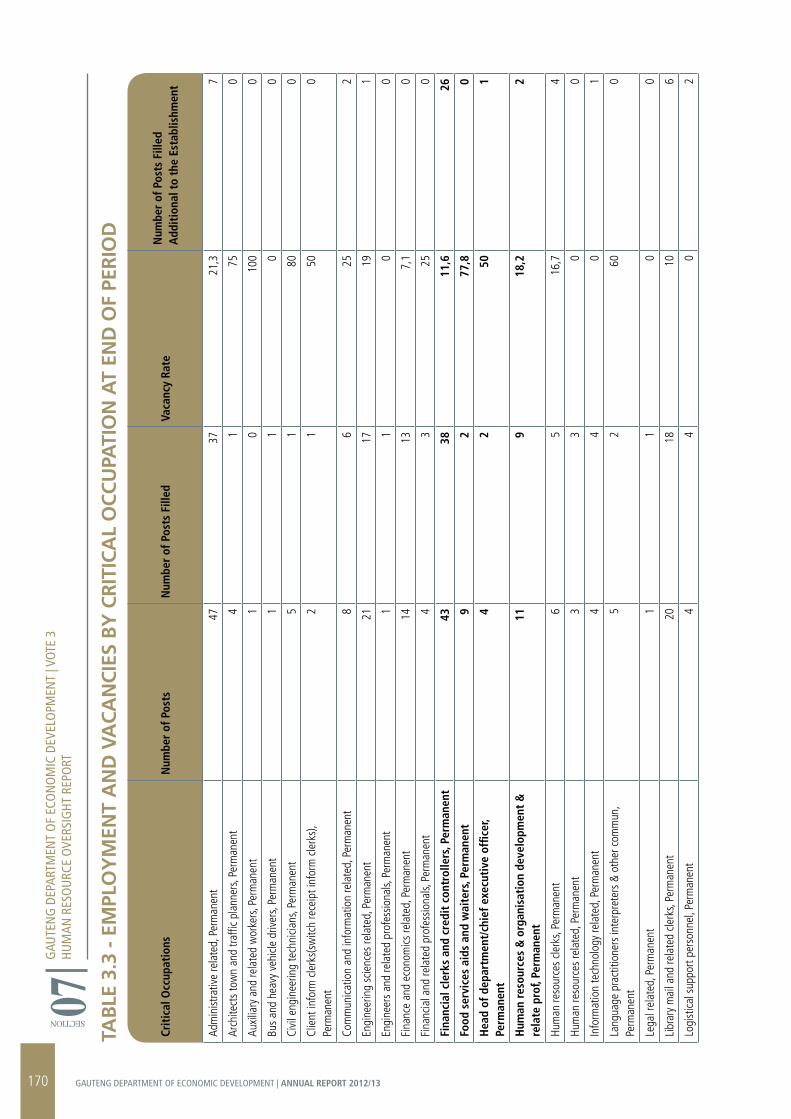
GAU
TEN
G D
EPAR
TMEN
T O
F EC
ON
OM
IC D
EVEL
OPM
ENT
| VOT
E 3
HUM
AN R
ESO
URC
E O
VERS
IGHT
REP
ORT
SECTION 07Cr
itic
al O
ccup
atio
nsN
umbe
r of
Pos
tsN
umbe
r of
Pos
ts F
illed
Vaca
ncy
Rate
Num
ber
of P
osts
Fill
ed
Add
itio
nal t
o th
e Es
tabl
ishm
ent
Adm
inist
rativ
e re
late
d, P
erm
anen
t 47
3721
,37
Arch
itect
s to
wn
and
traffi
c pl
anne
rs, P
erm
anen
t 4
175
0
Auxi
liary
and
rela
ted
wor
kers
, Per
man
ent
10
100
0
Bus
and
heav
y ve
hicle
driv
ers,
Perm
anen
t 1
10
0
Civi
l eng
inee
ring
tech
nicia
ns, P
erm
anen
t 5
180
0
Clie
nt in
form
cle
rks(
switc
h re
ceip
t inf
orm
cle
rks)
, Pe
rman
ent
21
500
Com
mun
icatio
n an
d in
form
atio
n re
late
d, P
erm
anen
t 8
625
2
Engi
neer
ing
scie
nces
rela
ted,
Per
man
ent
2117
191
Engi
neer
s an
d re
late
d pr
ofes
siona
ls, P
erm
anen
t 1
10
0
Fina
nce
and
econ
omics
rela
ted,
Per
man
ent
1413
7,1
0
Fina
ncia
l and
rela
ted
prof
essio
nals,
Per
man
ent
43
250
Fina
ncia
l cle
rks
and
cred
it c
ontr
olle
rs, P
erm
anen
t 43
3811
,626
Food
ser
vice
s ai
ds a
nd w
aite
rs, P
erm
anen
t 9
277
,80
Hea
d of
dep
artm
ent/
chie
f exe
cuti
ve o
ffice
r, Pe
rman
ent
42
501
Hum
an r
esou
rces
& o
rgan
isat
ion
deve
lopm
ent
&
rela
te p
rof,
Perm
anen
t 11
918
,22
Hum
an re
sour
ces
clerk
s, Pe
rman
ent
65
16,7
4
Hum
an re
sour
ces
rela
ted,
Per
man
ent
33
00
Info
rmat
ion
tech
nolo
gy re
late
d, P
erm
anen
t 4
40
1
Lang
uage
pra
ctiti
oner
s in
terp
rete
rs &
oth
er c
omm
un,
Perm
anen
t 5
260
0
Lega
l rel
ated
, Per
man
ent
11
00
Libr
ary
mai
l and
rela
ted
clerk
s, Pe
rman
ent
2018
106
Logi
stica
l sup
port
pers
onne
l, Pe
rman
ent
44
02
TAB
LE 3
.3 -
EM
PLO
YM
ENT
AN
D V
AC
AN
CIE
S B
Y C
rIT
ICA
L O
CC
UPA
TIO
N A
T EN
D O
F PE
rIO
D
170 GAUTENG DEPARTMENT OF ECONOMIC DEVELOPMENT | ANNUAL REPORT 2012/13
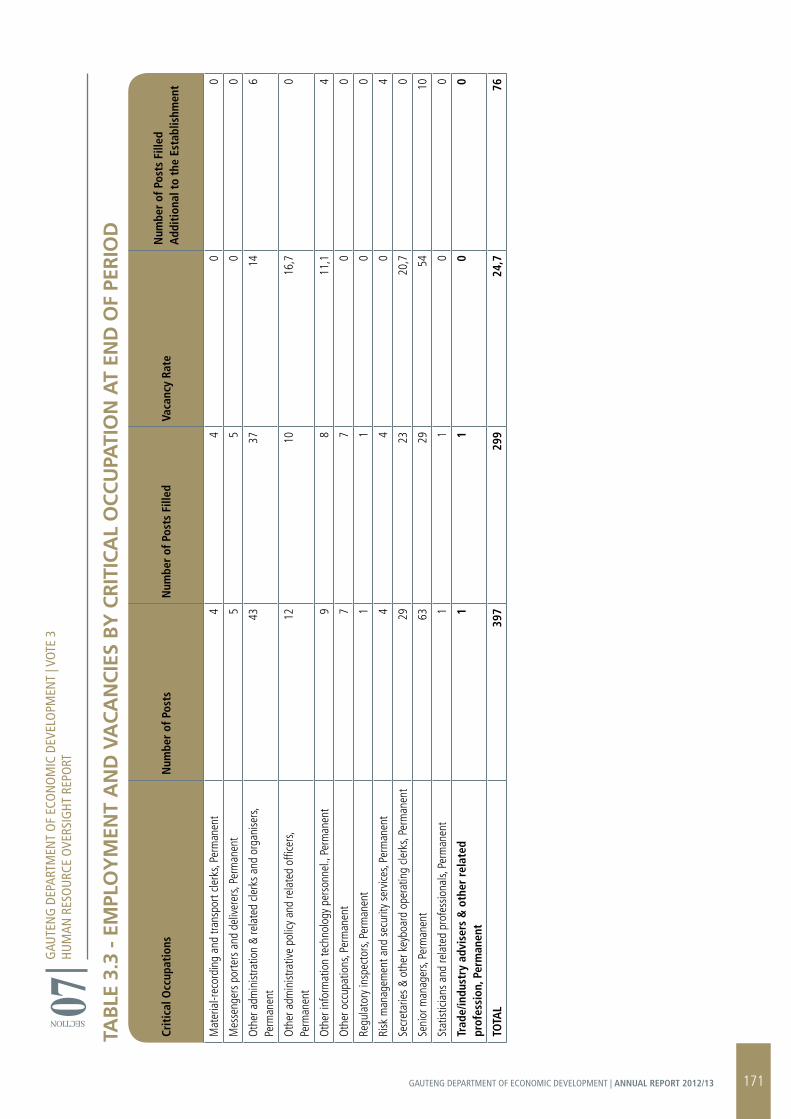
Crit
ical
Occ
upat
ions
Num
ber
of P
osts
Num
ber
of P
osts
Fill
edVa
canc
y Ra
teN
umbe
r of
Pos
ts F
illed
A
ddit
iona
l to
the
Esta
blis
hmen
t
Mat
eria
l-rec
ordi
ng a
nd tr
ansp
ort c
lerk
s, Pe
rman
ent
44
00
Mes
seng
ers
porte
rs a
nd d
eliv
erer
s, Pe
rman
ent
55
00
Oth
er a
dmin
istra
tion
& re
late
d cle
rks
and
orga
nise
rs,
Perm
anen
t 43
3714
6
Oth
er a
dmin
istra
tive
polic
y an
d re
late
d of
ficer
s, Pe
rman
ent
1210
16,7
0
Oth
er in
form
atio
n te
chno
logy
per
sonn
el.,
Perm
anen
t 9
811
,14
Oth
er o
ccup
atio
ns, P
erm
anen
t 7
70
0
Regu
lato
ry in
spec
tors
, Per
man
ent
11
00
Risk
man
agem
ent a
nd s
ecur
ity s
ervi
ces,
Perm
anen
t 4
40
4
Secr
etar
ies
& ot
her k
eybo
ard
oper
atin
g cle
rks,
Perm
anen
t 29
2320
,70
Seni
or m
anag
ers,
Perm
anen
t 63
2954
10
Stat
istici
ans
and
rela
ted
prof
essio
nals,
Per
man
ent
11
00
Trad
e/in
dust
ry a
dvis
ers
& o
ther
rel
ated
pr
ofes
sion
, Per
man
ent
11
00
TOTA
L39
729
924
,776
TAB
LE 3
.3 -
EM
PLO
YM
ENT
AN
D V
AC
AN
CIE
S B
Y C
rIT
ICA
L O
CC
UPA
TIO
N A
T EN
D O
F PE
rIO
D
GAU
TEN
G D
EPAR
TMEN
T O
F EC
ON
OM
IC D
EVEL
OPM
ENT
| VOT
E 3
HUM
AN R
ESO
URC
E O
VERS
IGHT
REP
ORT
SECTION 07
171GAUTENG DEPARTMENT OF ECONOMIC DEVELOPMENT | ANNUAL REPORT 2012/13
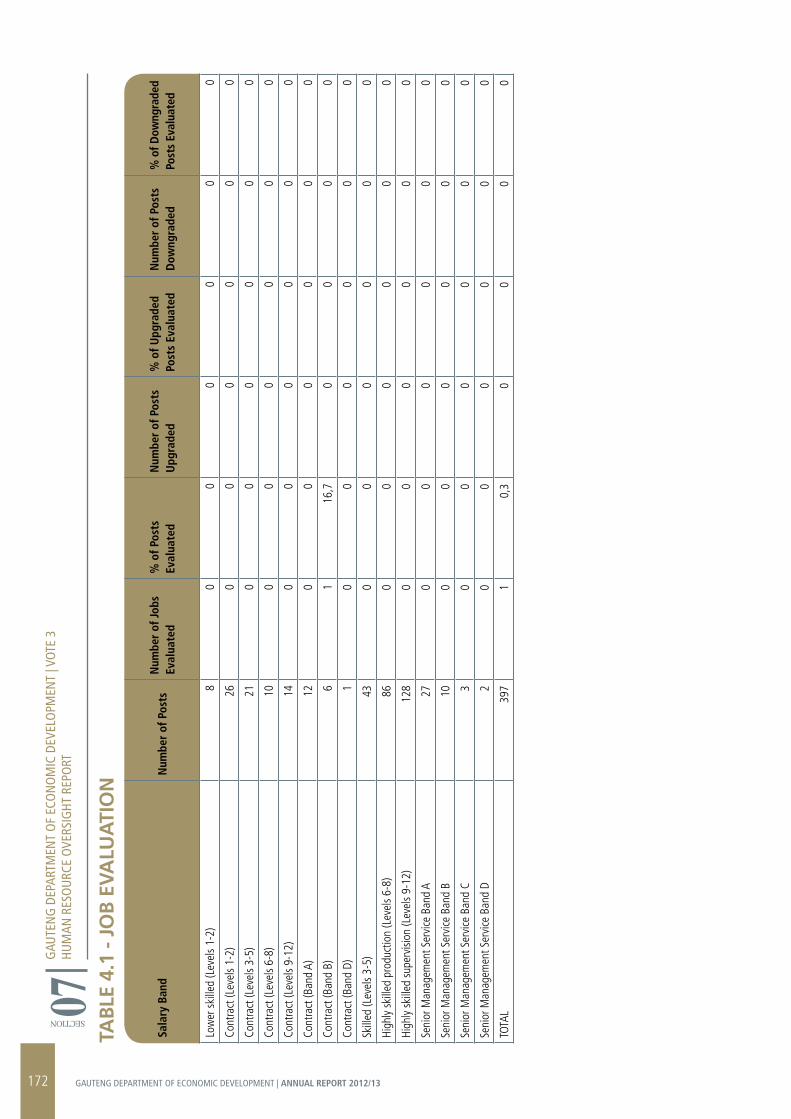
GAU
TEN
G D
EPAR
TMEN
T O
F EC
ON
OM
IC D
EVEL
OPM
ENT
| VOT
E 3
HUM
AN R
ESO
URC
E O
VERS
IGHT
REP
ORT
SECTION 07TA
BLE
4.1
- J
OB
EV
ALU
ATI
ON
Sala
ry B
and
Num
ber
of P
osts
Num
ber
of Jo
bs
Eval
uate
d%
of P
osts
Ev
alua
ted
Num
ber
of P
osts
U
pgra
ded
% o
f Upg
rade
d Po
sts
Eval
uate
dN
umbe
r of
Pos
ts
Dow
ngra
ded
% o
f Dow
ngra
ded
Post
s Ev
alua
ted
Low
er s
kille
d (L
evel
s 1-
2)8
00
00
00
Cont
ract
(Lev
els
1-2)
26
00
00
00
Cont
ract
(Lev
els
3-5)
21
00
00
00
Cont
ract
(Lev
els
6-8)
10
00
00
00
Cont
ract
(Lev
els
9-12
) 14
00
00
00
Cont
ract
(Ban
d A)
12
00
00
00
Cont
ract
(Ban
d B)
6
116
,70
00
0
Cont
ract
(Ban
d D)
1
00
00
00
Skill
ed (L
evel
s 3-
5)
430
00
00
0
High
ly sk
illed
pro
duct
ion
(Lev
els
6-8)
86
00
00
00
High
ly sk
illed
sup
ervi
sion
(Lev
els
9-12
) 12
80
00
00
0
Seni
or M
anag
emen
t Ser
vice
Ban
d A
270
00
00
0
Seni
or M
anag
emen
t Ser
vice
Ban
d B
100
00
00
0
Seni
or M
anag
emen
t Ser
vice
Ban
d C
30
00
00
0
Seni
or M
anag
emen
t Ser
vice
Ban
d D
20
00
00
0
TOTA
L39
71
0,3
00
00
172 GAUTENG DEPARTMENT OF ECONOMIC DEVELOPMENT | ANNUAL REPORT 2012/13
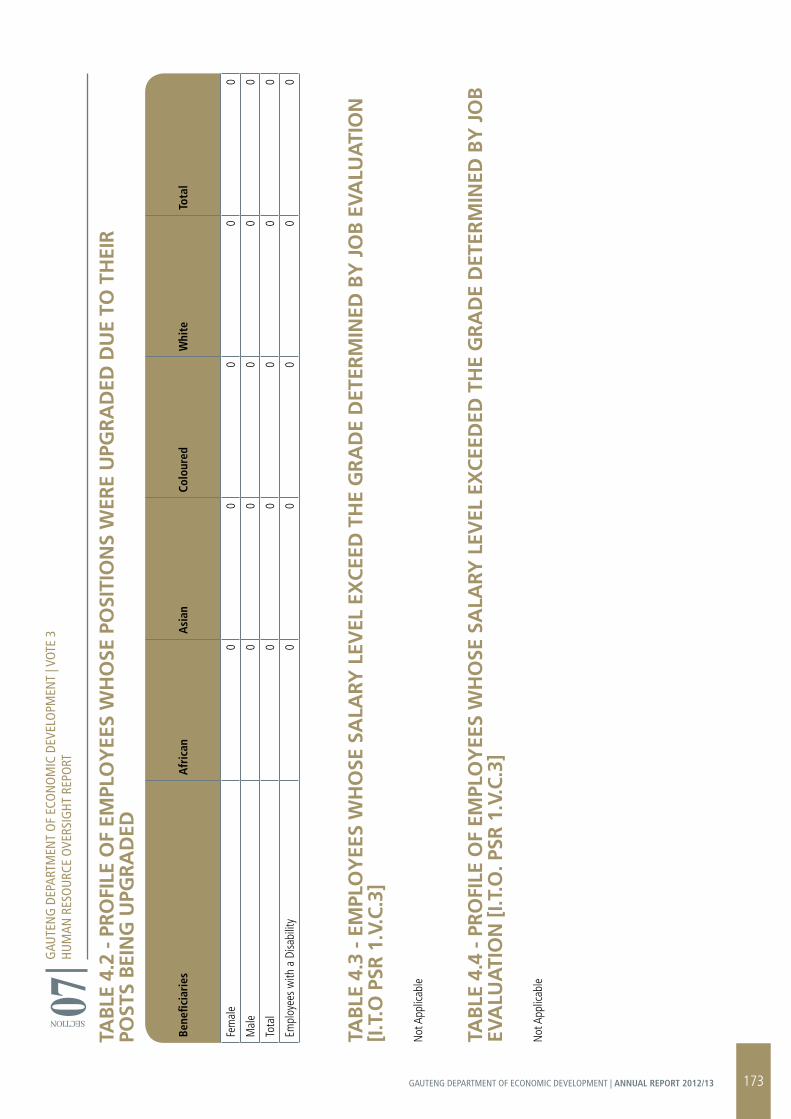
TAB
LE 4
.2 -
Pr
OFI
LE O
F EM
PLO
YEE
S W
HO
SE P
OSI
TIO
NS
WEr
E U
PGr
AD
ED D
UE
TO T
HEI
r
POST
S B
EIN
G U
PGr
AD
ED
TAB
LE 4
.3 -
EM
PLO
YEE
S W
HO
SE S
ALA
rY L
EVEL
EX
CEE
D T
HE
Gr
AD
E D
ETEr
MIN
ED B
Y J
OB
EV
ALU
ATI
ON
[I
.T.O
PSr
1.V
.C.3
]
Not
App
licab
le
TAB
LE 4
.4 -
Pr
OFI
LE O
F EM
PLO
YEE
S W
HO
SE S
ALA
rY L
EVEL
EX
CEE
DED
TH
E G
rA
DE
DET
ErM
INED
BY
JO
B
EVA
LUA
TIO
N [
I.T.O
. PSr
1.V
.C.3
]
Not
App
licab
le
GAU
TEN
G D
EPAR
TMEN
T O
F EC
ON
OM
IC D
EVEL
OPM
ENT
| VOT
E 3
HUM
AN R
ESO
URC
E O
VERS
IGHT
REP
ORT
SECTION 07
Bene
ficia
ries
Afr
ican
Asi
anCo
lour
edW
hite
Tota
l
Fem
ale
00
00
0
Mal
e 0
00
00
Tota
l 0
00
00
Empl
oyee
s w
ith a
Disa
bilit
y 0
00
00
173GAUTENG DEPARTMENT OF ECONOMIC DEVELOPMENT | ANNUAL REPORT 2012/13
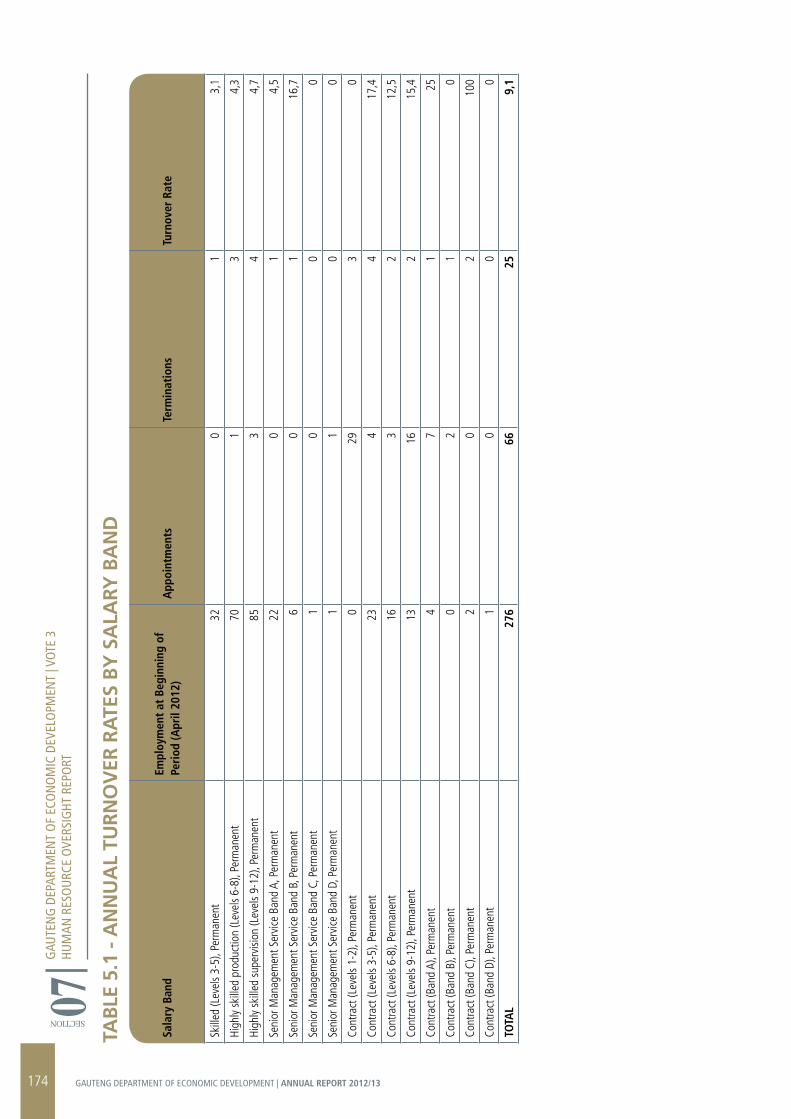
GAU
TEN
G D
EPAR
TMEN
T O
F EC
ON
OM
IC D
EVEL
OPM
ENT
| VOT
E 3
HUM
AN R
ESO
URC
E O
VERS
IGHT
REP
ORT
SECTION 07TA
BLE
5.1
- A
NN
UA
L TU
rN
OV
Er r
ATE
S B
Y S
ALA
rY B
AN
D
Sala
ry B
and
Empl
oym
ent
at B
egin
ning
of
Peri
od (A
pril
2012
)A
ppoi
ntm
ents
Term
inat
ions
Turn
over
Rat
e
Skill
ed (L
evel
s 3-
5), P
erm
anen
t 32
01
3,1
High
ly sk
illed
pro
duct
ion
(Lev
els
6-8)
, Per
man
ent
701
34,
3
High
ly sk
illed
sup
ervi
sion
(Lev
els
9-12
), Pe
rman
ent
853
44,
7
Seni
or M
anag
emen
t Ser
vice
Ban
d A,
Per
man
ent
220
14,
5
Seni
or M
anag
emen
t Ser
vice
Ban
d B,
Per
man
ent
60
116
,7
Seni
or M
anag
emen
t Ser
vice
Ban
d C,
Per
man
ent
10
00
Seni
or M
anag
emen
t Ser
vice
Ban
d D,
Per
man
ent
11
00
Cont
ract
(Lev
els
1-2)
, Per
man
ent
029
30
Cont
ract
(Lev
els
3-5)
, Per
man
ent
234
417
,4
Cont
ract
(Lev
els
6-8)
, Per
man
ent
163
212
,5
Cont
ract
(Lev
els
9-12
), Pe
rman
ent
1316
215
,4
Cont
ract
(Ban
d A)
, Per
man
ent
47
125
Cont
ract
(Ban
d B)
, Per
man
ent
02
10
Cont
ract
(Ban
d C)
, Per
man
ent
20
210
0
Cont
ract
(Ban
d D)
, Per
man
ent
10
00
TOTA
L27
666
259,
1
174 GAUTENG DEPARTMENT OF ECONOMIC DEVELOPMENT | ANNUAL REPORT 2012/13
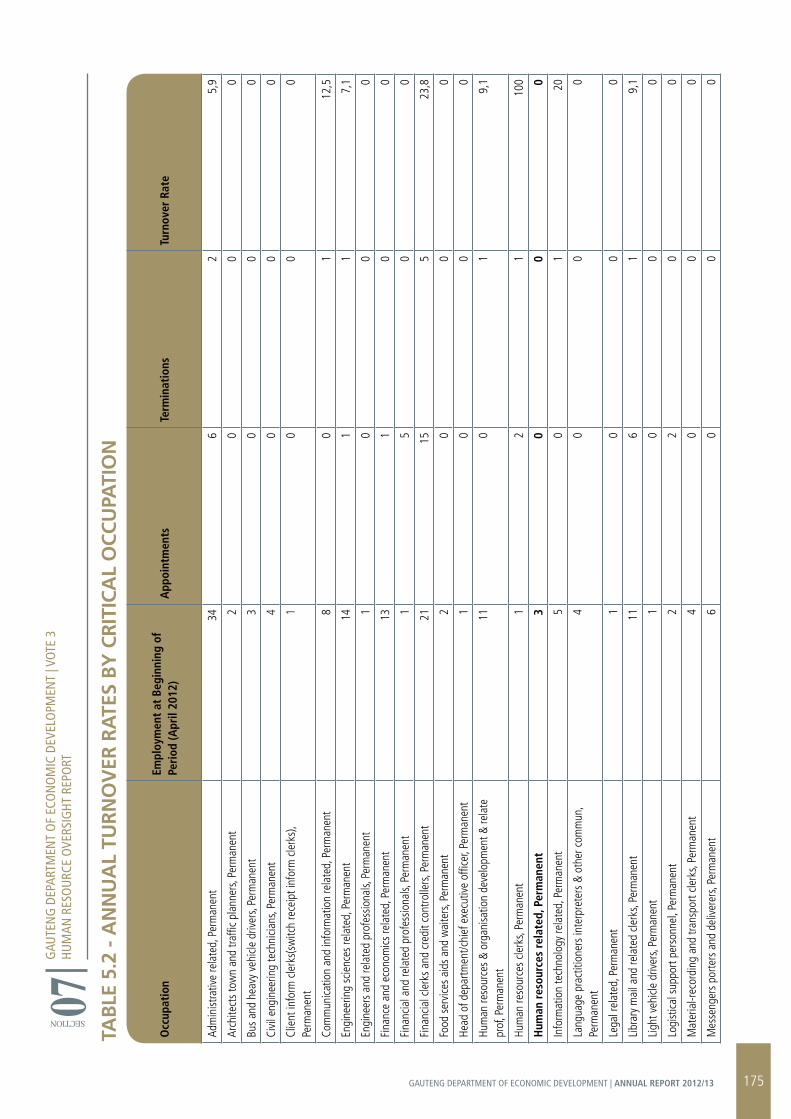
GAU
TEN
G D
EPAR
TMEN
T O
F EC
ON
OM
IC D
EVEL
OPM
ENT
| VOT
E 3
HUM
AN R
ESO
URC
E O
VERS
IGHT
REP
ORT
SECTION 07TA
BLE
5.2
- A
NN
UA
L TU
rN
OV
Er r
ATE
S B
Y C
rIT
ICA
L O
CC
UPA
TIO
N
Occ
upat
ion
Empl
oym
ent
at B
egin
ning
of
Peri
od (A
pril
2012
)A
ppoi
ntm
ents
Term
inat
ions
Turn
over
Rat
e
Adm
inist
rativ
e re
late
d, P
erm
anen
t 34
62
5,9
Arch
itect
s to
wn
and
traffi
c pl
anne
rs, P
erm
anen
t 2
00
0
Bus
and
heav
y ve
hicle
driv
ers,
Perm
anen
t 3
00
0
Civi
l eng
inee
ring
tech
nicia
ns, P
erm
anen
t 4
00
0
Clie
nt in
form
cle
rks(
switc
h re
ceip
t inf
orm
cle
rks)
, Pe
rman
ent
10
00
Com
mun
icatio
n an
d in
form
atio
n re
late
d, P
erm
anen
t 8
01
12,5
Engi
neer
ing
scie
nces
rela
ted,
Per
man
ent
141
17,
1
Engi
neer
s an
d re
late
d pr
ofes
siona
ls, P
erm
anen
t 1
00
0
Fina
nce
and
econ
omics
rela
ted,
Per
man
ent
131
00
Fina
ncia
l and
rela
ted
prof
essio
nals,
Per
man
ent
15
00
Fina
ncia
l cle
rks
and
cred
it co
ntro
llers
, Per
man
ent
2115
523
,8
Food
ser
vice
s ai
ds a
nd w
aite
rs, P
erm
anen
t 2
00
0
Head
of d
epar
tmen
t/chi
ef e
xecu
tive
offic
er, P
erm
anen
t 1
00
0
Hum
an re
sour
ces
& or
gani
satio
n de
velo
pmen
t & re
late
pr
of, P
erm
anen
t 11
01
9,1
Hum
an re
sour
ces
clerk
s, Pe
rman
ent
12
110
0
Hum
an r
esou
rces
rel
ated
, Per
man
ent
30
00
Info
rmat
ion
tech
nolo
gy re
late
d, P
erm
anen
t 5
01
20
Lang
uage
pra
ctiti
oner
s in
terp
rete
rs &
oth
er c
omm
un,
Perm
anen
t 4
00
0
Lega
l rel
ated
, Per
man
ent
10
00
Libr
ary
mai
l and
rela
ted
clerk
s, Pe
rman
ent
116
19,
1
Ligh
t veh
icle
driv
ers,
Perm
anen
t 1
00
0
Logi
stica
l sup
port
pers
onne
l, Pe
rman
ent
22
00
Mat
eria
l-rec
ordi
ng a
nd tr
ansp
ort c
lerk
s, Pe
rman
ent
40
00
Mes
seng
ers
porte
rs a
nd d
eliv
erer
s, Pe
rman
ent
60
00
175GAUTENG DEPARTMENT OF ECONOMIC DEVELOPMENT | ANNUAL REPORT 2012/13
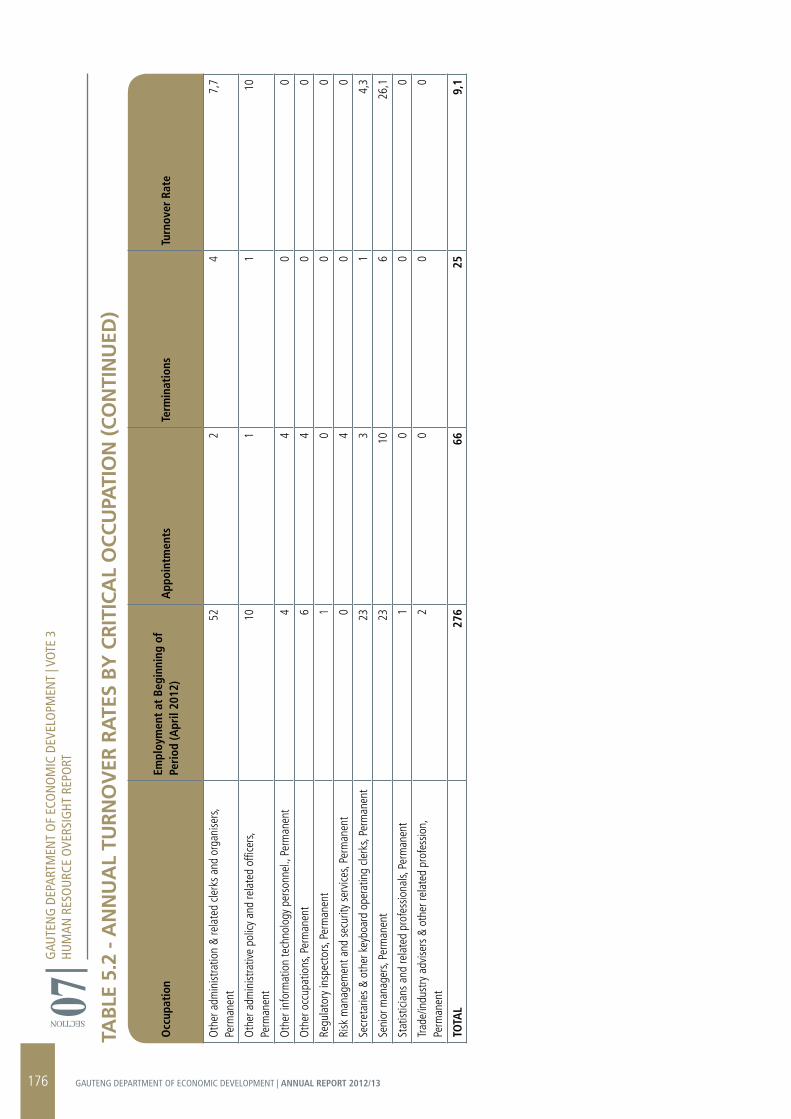
GAU
TEN
G D
EPAR
TMEN
T O
F EC
ON
OM
IC D
EVEL
OPM
ENT
| VOT
E 3
HUM
AN R
ESO
URC
E O
VERS
IGHT
REP
ORT
SECTION 07TA
BLE
5.2
- A
NN
UA
L TU
rN
OV
Er r
ATE
S B
Y C
rIT
ICA
L O
CC
UPA
TIO
N (
CO
NTI
NU
ED)
Occ
upat
ion
Empl
oym
ent
at B
egin
ning
of
Peri
od (A
pril
2012
)A
ppoi
ntm
ents
Term
inat
ions
Turn
over
Rat
e
Oth
er a
dmin
istra
tion
& re
late
d cle
rks
and
orga
nise
rs,
Perm
anen
t 52
24
7,7
Oth
er a
dmin
istra
tive
polic
y an
d re
late
d of
ficer
s, Pe
rman
ent
101
110
Oth
er in
form
atio
n te
chno
logy
per
sonn
el.,
Perm
anen
t 4
40
0
Oth
er o
ccup
atio
ns, P
erm
anen
t 6
40
0
Regu
lato
ry in
spec
tors
, Per
man
ent
10
00
Risk
man
agem
ent a
nd s
ecur
ity s
ervi
ces,
Perm
anen
t 0
40
0
Secr
etar
ies
& ot
her k
eybo
ard
oper
atin
g cle
rks,
Perm
anen
t 23
31
4,3
Seni
or m
anag
ers,
Perm
anen
t 23
106
26,1
Stat
istici
ans
and
rela
ted
prof
essio
nals,
Per
man
ent
10
00
Trad
e/in
dust
ry a
dvise
rs &
oth
er re
late
d pr
ofes
sion,
Pe
rman
ent
20
00
TOTA
L27
666
259,
1
176 GAUTENG DEPARTMENT OF ECONOMIC DEVELOPMENT | ANNUAL REPORT 2012/13
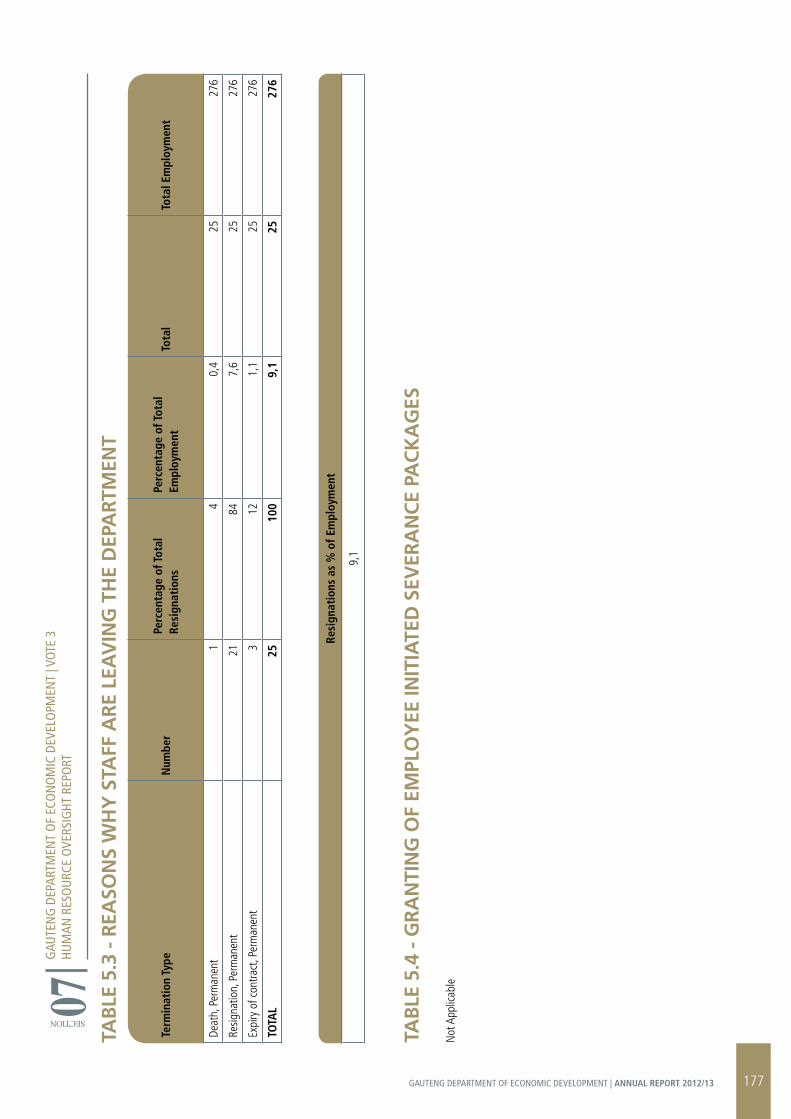
TAB
LE 5
.3 -
rEA
SON
S W
HY
STA
FF A
rE
LEA
VIN
G T
HE
DEP
Ar
TMEN
T
Term
inat
ion
Type
Num
ber
Perc
enta
ge o
f Tot
al
Resi
gnat
ions
Perc
enta
ge o
f Tot
al
Empl
oym
ent
Tota
lTo
tal E
mpl
oym
ent
Deat
h, P
erm
anen
t 1
40,
425
276
Resig
natio
n, P
erm
anen
t 21
847,
625
276
Expi
ry o
f con
tract
, Per
man
ent
312
1,1
2527
6
TOTA
L25
100
9,1
2527
6
TAB
LE 5
.4 -
Gr
AN
TIN
G O
F EM
PLO
YEE
INIT
IATE
D S
EVEr
AN
CE
PAC
KA
GES
Not
App
licab
le
Resi
gnat
ions
as
% o
f Em
ploy
men
t
9,1
GAU
TEN
G D
EPAR
TMEN
T O
F EC
ON
OM
IC D
EVEL
OPM
ENT
| VOT
E 3
HUM
AN R
ESO
URC
E O
VERS
IGHT
REP
ORT
SECTION 07
177GAUTENG DEPARTMENT OF ECONOMIC DEVELOPMENT | ANNUAL REPORT 2012/13
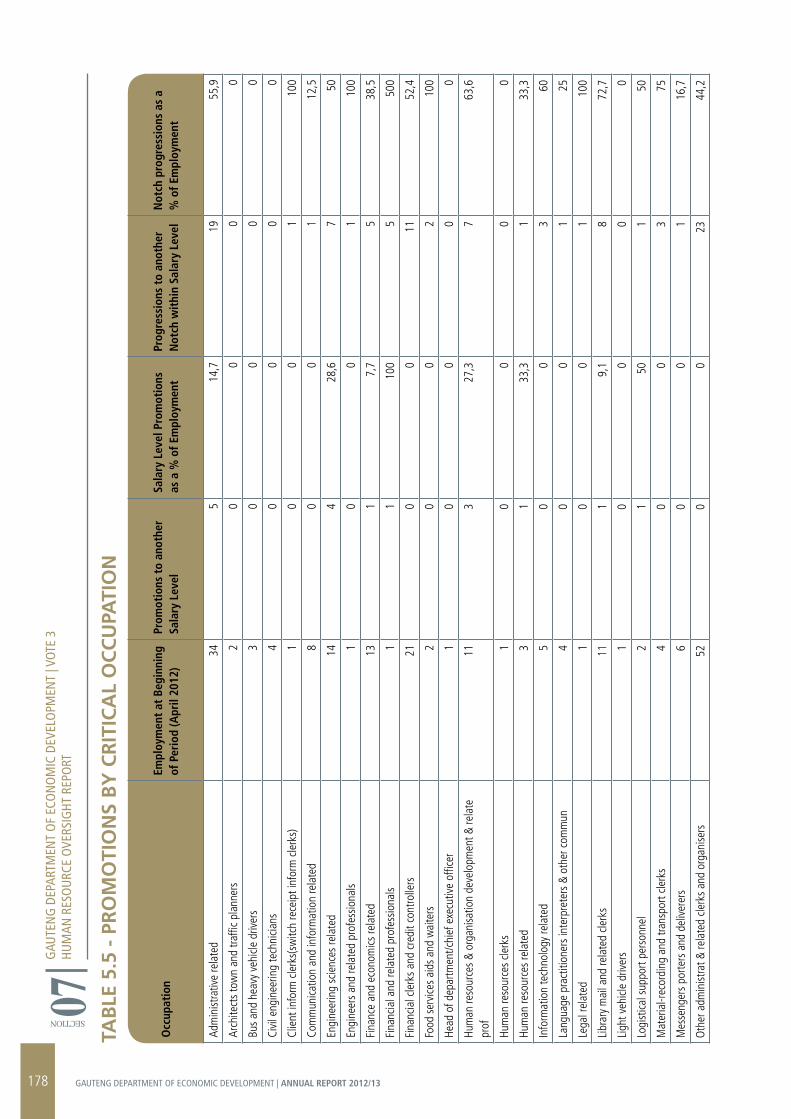
GAU
TEN
G D
EPAR
TMEN
T O
F EC
ON
OM
IC D
EVEL
OPM
ENT
| VOT
E 3
HUM
AN R
ESO
URC
E O
VERS
IGHT
REP
ORT
SECTION 07TA
BLE
5.5
- P
rO
MO
TIO
NS
BY
Cr
ITIC
AL
OC
CU
PATI
ON
Occ
upat
ion
Empl
oym
ent
at B
egin
ning
of
Per
iod
(Apr
il 20
12)
Prom
otio
ns t
o an
othe
r Sa
lary
Lev
elSa
lary
Lev
el P
rom
otio
ns
as a
% o
f Em
ploy
men
tPr
ogre
ssio
ns t
o an
othe
r N
otch
wit
hin
Sala
ry L
evel
Not
ch p
rogr
essi
ons
as a
%
of E
mpl
oym
ent
Adm
inist
rativ
e re
late
d 34
514
,719
55,9
Arch
itect
s to
wn
and
traffi
c pl
anne
rs
20
00
0
Bus
and
heav
y ve
hicle
driv
ers
30
00
0
Civi
l eng
inee
ring
tech
nicia
ns
40
00
0
Clie
nt in
form
cle
rks(
switc
h re
ceip
t inf
orm
cle
rks)
1
00
110
0
Com
mun
icatio
n an
d in
form
atio
n re
late
d 8
00
112
,5
Engi
neer
ing
scie
nces
rela
ted
144
28,6
750
Engi
neer
s an
d re
late
d pr
ofes
siona
ls 1
00
110
0
Fina
nce
and
econ
omics
rela
ted
131
7,7
538
,5
Fina
ncia
l and
rela
ted
prof
essio
nals
11
100
550
0
Fina
ncia
l cle
rks
and
cred
it co
ntro
llers
21
00
1152
,4
Food
ser
vice
s ai
ds a
nd w
aite
rs
20
02
100
Head
of d
epar
tmen
t/chi
ef e
xecu
tive
offic
er
10
00
0
Hum
an re
sour
ces
& or
gani
satio
n de
velo
pmen
t & re
late
pr
of
113
27,3
763
,6
Hum
an re
sour
ces
clerk
s 1
00
00
Hum
an re
sour
ces
rela
ted
31
33,3
133
,3
Info
rmat
ion
tech
nolo
gy re
late
d 5
00
360
Lang
uage
pra
ctiti
oner
s in
terp
rete
rs &
oth
er c
omm
un
40
01
25
Lega
l rel
ated
1
00
110
0
Libr
ary
mai
l and
rela
ted
clerk
s 11
19,
18
72,7
Ligh
t veh
icle
driv
ers
10
00
0
Logi
stica
l sup
port
pers
onne
l 2
150
150
Mat
eria
l-rec
ordi
ng a
nd tr
ansp
ort c
lerk
s 4
00
375
Mes
seng
ers
porte
rs a
nd d
eliv
erer
s 6
00
116
,7
Oth
er a
dmin
istra
t & re
late
d cle
rks
and
orga
nise
rs
520
023
44,2
178 GAUTENG DEPARTMENT OF ECONOMIC DEVELOPMENT | ANNUAL REPORT 2012/13
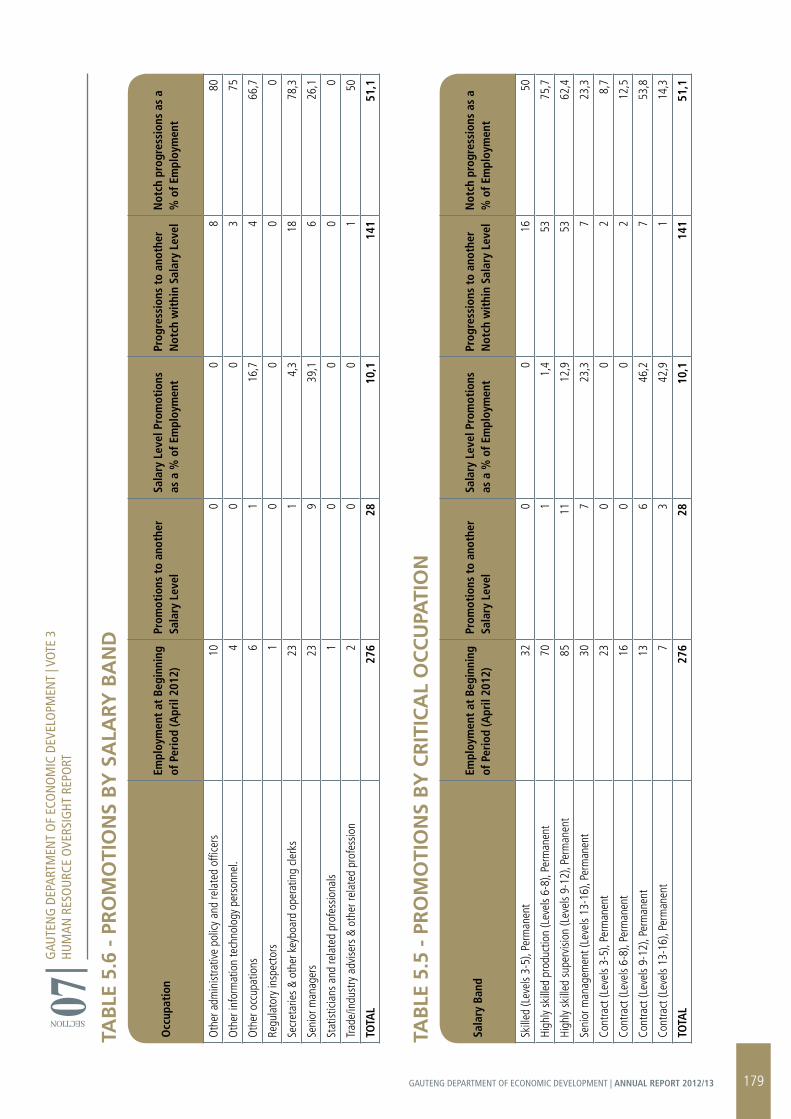
TAB
LE 5
.6 -
Pr
OM
OTI
ON
S B
Y S
ALA
rY B
AN
D
TAB
LE 5
.5 -
Pr
OM
OTI
ON
S B
Y C
rIT
ICA
L O
CC
UPA
TIO
N
Occ
upat
ion
Empl
oym
ent
at B
egin
ning
of
Per
iod
(Apr
il 20
12)
Prom
otio
ns t
o an
othe
r Sa
lary
Lev
elSa
lary
Lev
el P
rom
otio
ns
as a
% o
f Em
ploy
men
tPr
ogre
ssio
ns t
o an
othe
r N
otch
wit
hin
Sala
ry L
evel
Not
ch p
rogr
essi
ons
as a
%
of E
mpl
oym
ent
Oth
er a
dmin
istra
tive
polic
y an
d re
late
d of
ficer
s 10
00
880
Oth
er in
form
atio
n te
chno
logy
per
sonn
el.
40
03
75
Oth
er o
ccup
atio
ns
61
16,7
466
,7
Regu
lato
ry in
spec
tors
1
00
00
Secr
etar
ies
& ot
her k
eybo
ard
oper
atin
g cle
rks
231
4,3
1878
,3
Seni
or m
anag
ers
239
39,1
626
,1
Stat
istici
ans
and
rela
ted
prof
essio
nals
10
00
0
Trad
e/in
dust
ry a
dvise
rs &
oth
er re
late
d pr
ofes
sion
20
01
50
TOTA
L27
628
10,1
141
51,1
Sala
ry B
and
Empl
oym
ent
at B
egin
ning
of
Per
iod
(Apr
il 20
12)
Prom
otio
ns t
o an
othe
r Sa
lary
Lev
elSa
lary
Lev
el P
rom
otio
ns
as a
% o
f Em
ploy
men
tPr
ogre
ssio
ns t
o an
othe
r N
otch
wit
hin
Sala
ry L
evel
Not
ch p
rogr
essi
ons
as a
%
of E
mpl
oym
ent
Skill
ed (L
evel
s 3-
5), P
erm
anen
t 32
00
1650
High
ly sk
illed
pro
duct
ion
(Lev
els
6-8)
, Per
man
ent
701
1,4
5375
,7
High
ly sk
illed
sup
ervi
sion
(Lev
els
9-12
), Pe
rman
ent
8511
12,9
5362
,4
Seni
or m
anag
emen
t (Le
vels
13-1
6), P
erm
anen
t 30
723
,37
23,3
Cont
ract
(Lev
els
3-5)
, Per
man
ent
230
02
8,7
Cont
ract
(Lev
els
6-8)
, Per
man
ent
160
02
12,5
Cont
ract
(Lev
els
9-12
), Pe
rman
ent
136
46,2
753
,8
Cont
ract
(Lev
els
13-1
6), P
erm
anen
t 7
342
,91
14,3
TOTA
L27
628
10,1
141
51,1
GAU
TEN
G D
EPAR
TMEN
T O
F EC
ON
OM
IC D
EVEL
OPM
ENT
| VOT
E 3
HUM
AN R
ESO
URC
E O
VERS
IGHT
REP
ORT
SECTION 07
179GAUTENG DEPARTMENT OF ECONOMIC DEVELOPMENT | ANNUAL REPORT 2012/13
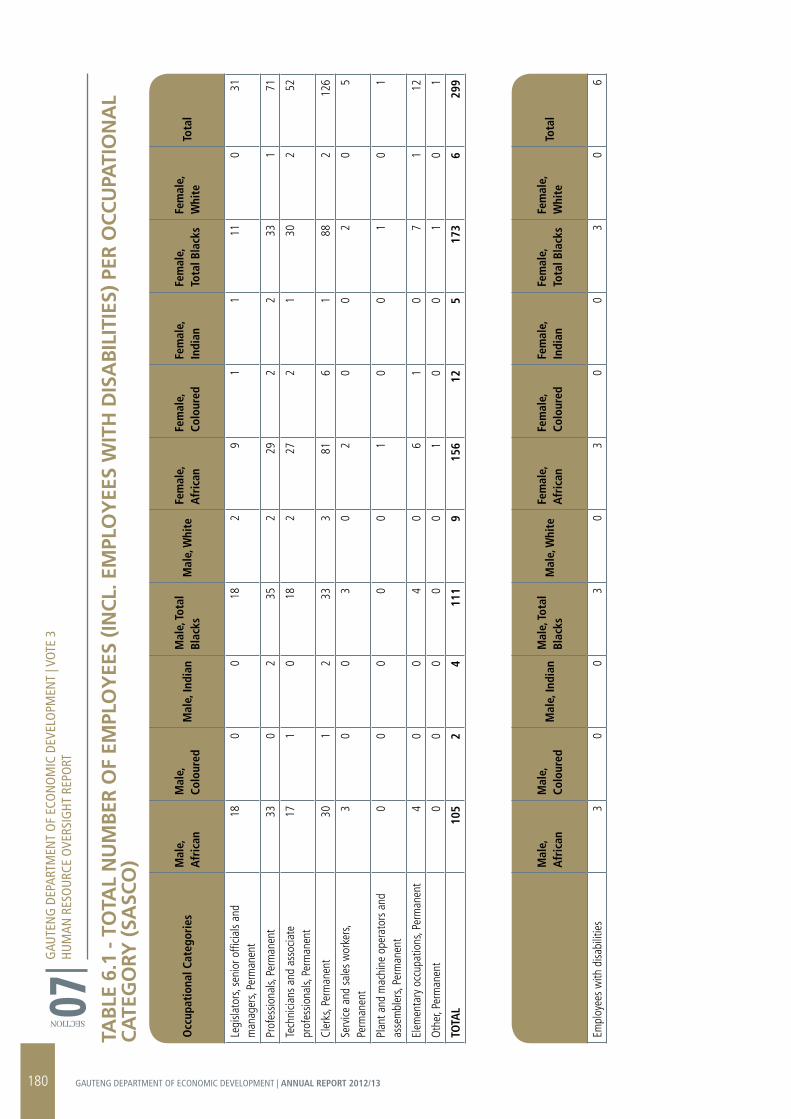
GAU
TEN
G D
EPAR
TMEN
T O
F EC
ON
OM
IC D
EVEL
OPM
ENT
| VOT
E 3
HUM
AN R
ESO
URC
E O
VERS
IGHT
REP
ORT
SECTION 07TA
BLE
6.1
- T
OTA
L N
UM
BEr
OF
EMPL
OY
EES
(IN
CL.
EM
PLO
YEE
S W
ITH
DIS
AB
ILIT
IES)
PEr
OC
CU
PATI
ON
AL
CA
TEG
OrY
(SA
SCO
)
Occ
upat
iona
l Cat
egor
ies
Mal
e,
Afr
ican
Mal
e,
Colo
ured
Mal
e, In
dian
Mal
e, T
otal
Bl
acks
Mal
e, W
hite
Fem
ale,
A
fric
anFe
mal
e,
Colo
ured
Fem
ale,
In
dian
Fem
ale,
To
tal B
lack
sFe
mal
e,
Whi
teTo
tal
Legi
slato
rs, s
enio
r offi
cials
and
man
ager
s, Pe
rman
ent
180
018
29
11
110
31
Prof
essio
nals,
Per
man
ent
330
235
229
22
331
71
Tech
nicia
ns a
nd a
ssoc
iate
pr
ofes
siona
ls, P
erm
anen
t 17
10
182
272
130
252
Cler
ks, P
erm
anen
t 30
12
333
816
188
212
6
Serv
ice a
nd s
ales
wor
kers
, Pe
rman
ent
30
03
02
00
20
5
Plan
t and
mac
hine
ope
rato
rs a
nd
asse
mbl
ers,
Perm
anen
t 0
00
00
10
01
01
Elem
enta
ry o
ccup
atio
ns, P
erm
anen
t 4
00
40
61
07
112
Oth
er, P
erm
anen
t 0
00
00
10
01
01
TOTA
L10
52
411
19
156
125
173
629
9
M
ale,
A
fric
anM
ale,
Co
lour
edM
ale,
Indi
anM
ale,
Tot
al
Blac
ksM
ale,
Whi
teFe
mal
e,
Afr
ican
Fem
ale,
Co
lour
edFe
mal
e,
Indi
anFe
mal
e,
Tota
l Bla
cks
Fem
ale,
W
hite
Tota
l
Empl
oyee
s w
ith d
isabi
litie
s 3
00
30
30
03
06
180 GAUTENG DEPARTMENT OF ECONOMIC DEVELOPMENT | ANNUAL REPORT 2012/13
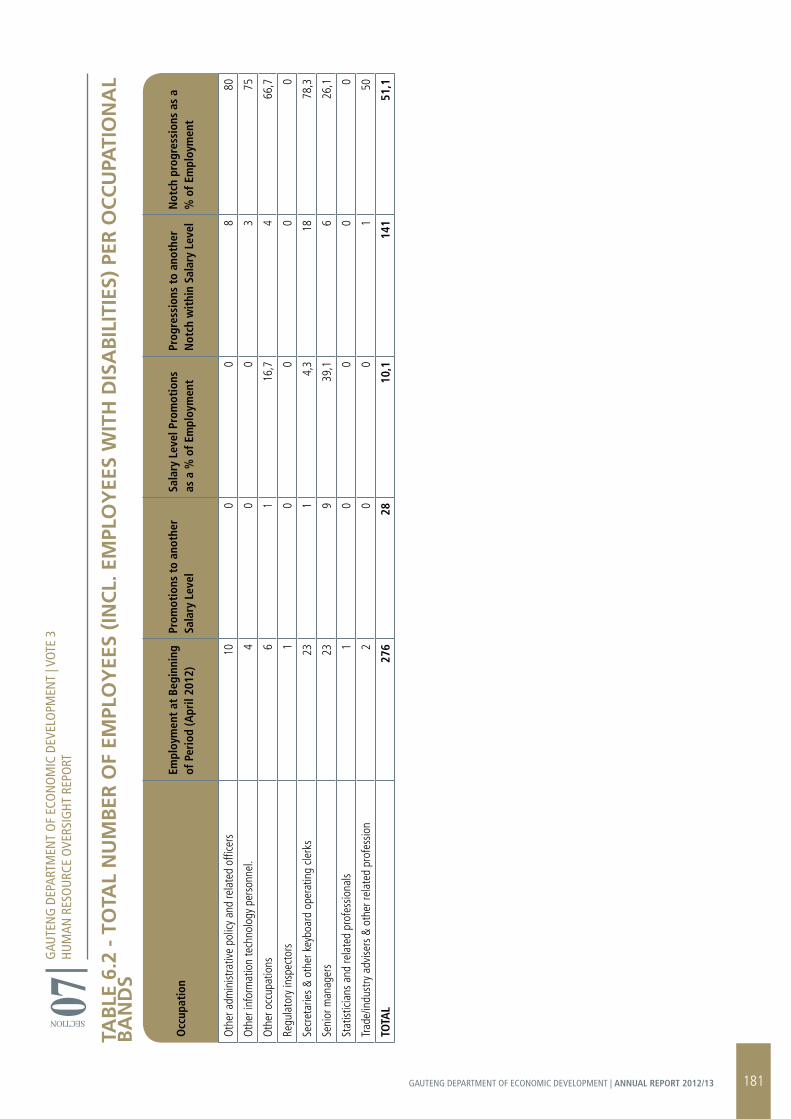
TAB
LE 6
.2 -
TO
TAL
NU
MB
Er O
F EM
PLO
YEE
S (I
NC
L. E
MPL
OY
EES
WIT
H D
ISA
BIL
ITIE
S) P
Er O
CC
UPA
TIO
NA
L B
AN
DS
Occ
upat
ion
Empl
oym
ent
at B
egin
ning
of
Per
iod
(Apr
il 20
12)
Prom
otio
ns t
o an
othe
r Sa
lary
Lev
elSa
lary
Lev
el P
rom
otio
ns
as a
% o
f Em
ploy
men
tPr
ogre
ssio
ns t
o an
othe
r N
otch
wit
hin
Sala
ry L
evel
Not
ch p
rogr
essi
ons
as a
%
of E
mpl
oym
ent
Oth
er a
dmin
istra
tive
polic
y an
d re
late
d of
ficer
s 10
00
880
Oth
er in
form
atio
n te
chno
logy
per
sonn
el.
40
03
75
Oth
er o
ccup
atio
ns
61
16,7
466
,7
Regu
lato
ry in
spec
tors
1
00
00
Secr
etar
ies
& ot
her k
eybo
ard
oper
atin
g cle
rks
231
4,3
1878
,3
Seni
or m
anag
ers
239
39,1
626
,1
Stat
istici
ans
and
rela
ted
prof
essio
nals
10
00
0
Trad
e/in
dust
ry a
dvise
rs &
oth
er re
late
d pr
ofes
sion
20
01
50
TOTA
L27
628
10,1
141
51,1
GAU
TEN
G D
EPAR
TMEN
T O
F EC
ON
OM
IC D
EVEL
OPM
ENT
| VOT
E 3
HUM
AN R
ESO
URC
E O
VERS
IGHT
REP
ORT
SECTION 07
181GAUTENG DEPARTMENT OF ECONOMIC DEVELOPMENT | ANNUAL REPORT 2012/13
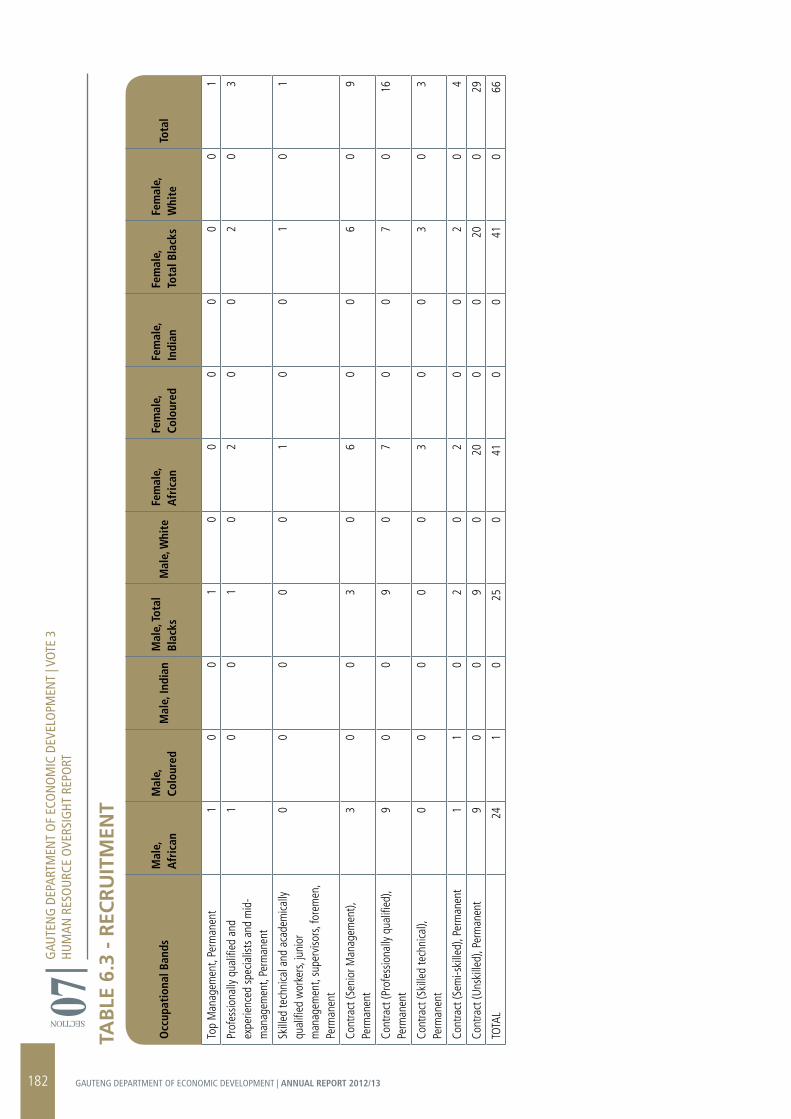
TAB
LE 6
.3 -
rEC
rU
ITM
ENT
Occ
upat
iona
l Ban
dsM
ale,
A
fric
anM
ale,
Co
lour
edM
ale,
Indi
anM
ale,
Tot
al
Blac
ksM
ale,
Whi
teFe
mal
e,
Afr
ican
Fem
ale,
Co
lour
edFe
mal
e,
Indi
anFe
mal
e,
Tota
l Bla
cks
Fem
ale,
W
hite
Tota
l
Top
Man
agem
ent,
Perm
anen
t 1
00
10
00
00
01
Prof
essio
nally
qua
lified
and
ex
perie
nced
spe
cialis
ts a
nd m
id-
man
agem
ent,
Perm
anen
t
10
01
02
00
20
3
Skill
ed te
chni
cal a
nd a
cade
mica
lly
qual
ified
wor
kers
, jun
ior
man
agem
ent,
supe
rviso
rs, f
orem
en,
Perm
anen
t
00
00
01
00
10
1
Cont
ract
(Sen
ior M
anag
emen
t),
Perm
anen
t 3
00
30
60
06
09
Cont
ract
(Pro
fess
iona
lly q
ualifi
ed),
Perm
anen
t 9
00
90
70
07
016
Cont
ract
(Ski
lled
tech
nica
l),
Perm
anen
t 0
00
00
30
03
03
Cont
ract
(Sem
i-ski
lled)
, Per
man
ent
11
02
02
00
20
4
Cont
ract
(Uns
kille
d), P
erm
anen
t 9
00
90
200
020
029
TOTA
L24
10
250
410
041
066
GAU
TEN
G D
EPAR
TMEN
T O
F EC
ON
OM
IC D
EVEL
OPM
ENT
| VOT
E 3
HUM
AN R
ESO
URC
E O
VERS
IGHT
REP
ORT
SECTION 07
182 GAUTENG DEPARTMENT OF ECONOMIC DEVELOPMENT | ANNUAL REPORT 2012/13
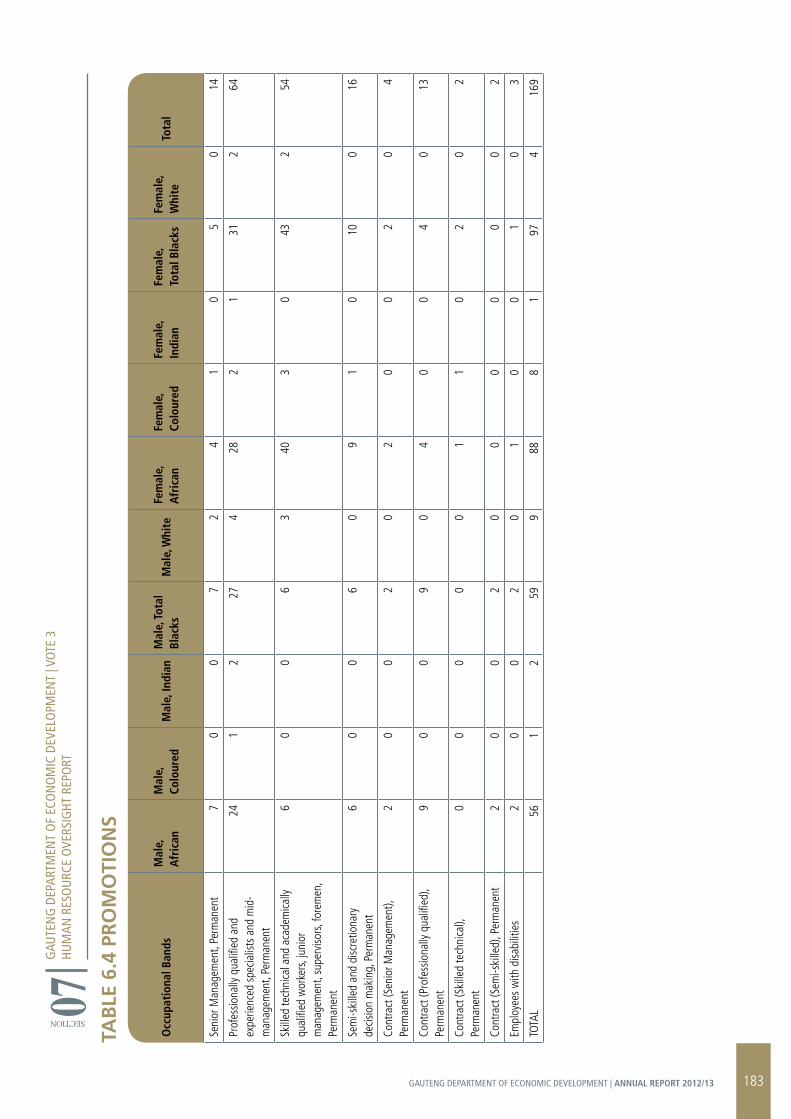
GAU
TEN
G D
EPAR
TMEN
T O
F EC
ON
OM
IC D
EVEL
OPM
ENT
| VOT
E 3
HUM
AN R
ESO
URC
E O
VERS
IGHT
REP
ORT
SECTION 07TA
BLE
6.4
Pr
OM
OTI
ON
S
Occ
upat
iona
l Ban
dsM
ale,
A
fric
anM
ale,
Co
lour
edM
ale,
Indi
anM
ale,
Tot
al
Blac
ksM
ale,
Whi
teFe
mal
e,
Afr
ican
Fem
ale,
Co
lour
edFe
mal
e,
Indi
anFe
mal
e,
Tota
l Bla
cks
Fem
ale,
W
hite
Tota
l
Seni
or M
anag
emen
t, Pe
rman
ent
70
07
24
10
50
14
Prof
essio
nally
qua
lified
and
ex
perie
nced
spe
cialis
ts a
nd m
id-
man
agem
ent,
Perm
anen
t
241
227
428
21
312
64
Skill
ed te
chni
cal a
nd a
cade
mica
lly
qual
ified
wor
kers
, jun
ior
man
agem
ent,
supe
rviso
rs, f
orem
en,
Perm
anen
t
60
06
340
30
432
54
Sem
i-ski
lled
and
disc
retio
nary
de
cisio
n m
akin
g, P
erm
anen
t 6
00
60
91
010
016
Cont
ract
(Sen
ior M
anag
emen
t),
Perm
anen
t 2
00
20
20
02
04
Cont
ract
(Pro
fess
iona
lly q
ualifi
ed),
Perm
anen
t 9
00
90
40
04
013
Cont
ract
(Ski
lled
tech
nica
l),
Perm
anen
t 0
00
00
11
02
02
Cont
ract
(Sem
i-ski
lled)
, Per
man
ent
20
02
00
00
00
2
Empl
oyee
s w
ith d
isabi
litie
s2
00
20
10
01
03
TOTA
L56
12
599
888
197
416
9
183GAUTENG DEPARTMENT OF ECONOMIC DEVELOPMENT | ANNUAL REPORT 2012/13
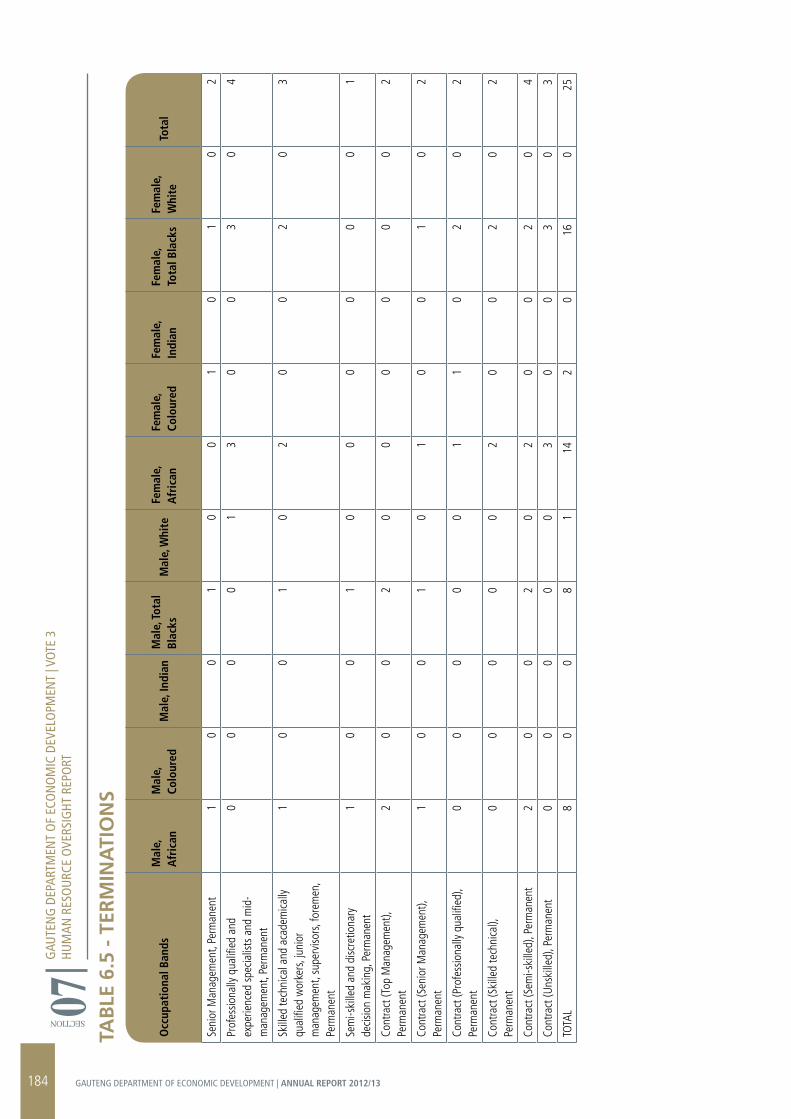
GAU
TEN
G D
EPAR
TMEN
T O
F EC
ON
OM
IC D
EVEL
OPM
ENT
| VOT
E 3
HUM
AN R
ESO
URC
E O
VERS
IGHT
REP
ORT
SECTION 07TA
BLE
6.5
- T
ErM
INA
TIO
NS
Occ
upat
iona
l Ban
dsM
ale,
A
fric
anM
ale,
Co
lour
edM
ale,
Indi
anM
ale,
Tot
al
Blac
ksM
ale,
Whi
teFe
mal
e,
Afr
ican
Fem
ale,
Co
lour
edFe
mal
e,
Indi
anFe
mal
e,
Tota
l Bla
cks
Fem
ale,
W
hite
Tota
l
Seni
or M
anag
emen
t, Pe
rman
ent
10
01
00
10
10
2
Prof
essio
nally
qua
lified
and
ex
perie
nced
spe
cialis
ts a
nd m
id-
man
agem
ent,
Perm
anen
t
00
00
13
00
30
4
Skill
ed te
chni
cal a
nd a
cade
mica
lly
qual
ified
wor
kers
, jun
ior
man
agem
ent,
supe
rviso
rs, f
orem
en,
Perm
anen
t
10
01
02
00
20
3
Sem
i-ski
lled
and
disc
retio
nary
de
cisio
n m
akin
g, P
erm
anen
t 1
00
10
00
00
01
Cont
ract
(Top
Man
agem
ent),
Pe
rman
ent
20
02
00
00
00
2
Cont
ract
(Sen
ior M
anag
emen
t),
Perm
anen
t 1
00
10
10
01
02
Cont
ract
(Pro
fess
iona
lly q
ualifi
ed),
Perm
anen
t 0
00
00
11
02
02
Cont
ract
(Ski
lled
tech
nica
l),
Perm
anen
t 0
00
00
20
02
02
Cont
ract
(Sem
i-ski
lled)
, Per
man
ent
20
02
02
00
20
4
Cont
ract
(Uns
kille
d), P
erm
anen
t 0
00
00
30
03
03
TOTA
L8
00
81
142
016
025
184 GAUTENG DEPARTMENT OF ECONOMIC DEVELOPMENT | ANNUAL REPORT 2012/13
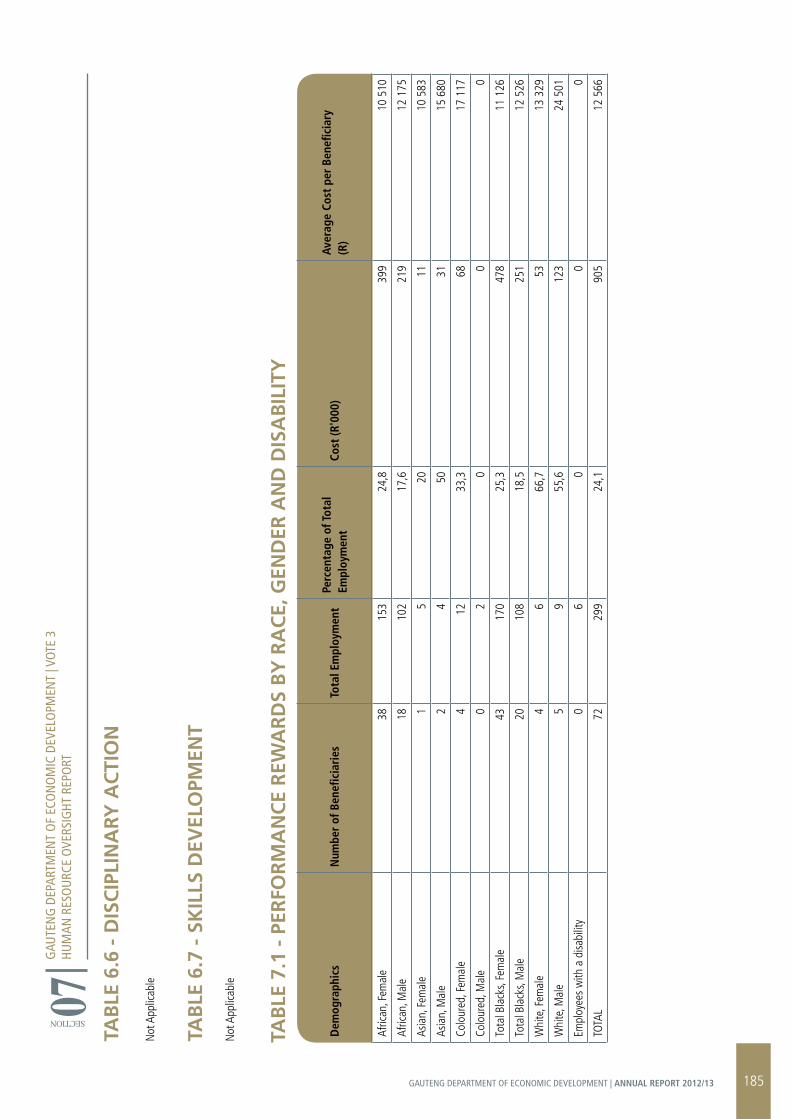
GAU
TEN
G D
EPAR
TMEN
T O
F EC
ON
OM
IC D
EVEL
OPM
ENT
| VOT
E 3
HUM
AN R
ESO
URC
E O
VERS
IGHT
REP
ORT
SECTION 07TA
BLE
6.6
- D
ISC
IPLI
NA
rY A
CTI
ON
Not
App
licab
le
TAB
LE 6
.7 -
SK
ILLS
DEV
ELO
PMEN
T
Not
App
licab
le
TAB
LE 7
.1 -
PEr
FOr
MA
NC
E r
EWA
rD
S B
Y r
AC
E, G
END
Er A
ND
DIS
AB
ILIT
Y
Dem
ogra
phic
sN
umbe
r of
Ben
efici
arie
sTo
tal E
mpl
oym
ent
Perc
enta
ge o
f Tot
al
Empl
oym
ent
Cost
(R'0
00)
Aver
age
Cost
per
Ben
efici
ary
(R)
Afric
an, F
emal
e 38
153
24,8
399
10 5
10
Afric
an, M
ale
1810
217
,621
912
175
Asia
n, F
emal
e 1
520
1110
583
Asia
n, M
ale
24
5031
15 6
80
Colo
ured
, Fem
ale
412
33,3
6817
117
Colo
ured
, Mal
e 0
20
00
Tota
l Bla
cks,
Fem
ale
4317
025
,347
811
126
Tota
l Bla
cks,
Mal
e 20
108
18,5
251
12 5
26
Whi
te, F
emal
e 4
666
,753
13 3
29
Whi
te, M
ale
59
55,6
123
24 5
01
Empl
oyee
s w
ith a
disa
bilit
y 0
60
00
TOTA
L 72
299
24,1
905
12 5
66
185GAUTENG DEPARTMENT OF ECONOMIC DEVELOPMENT | ANNUAL REPORT 2012/13
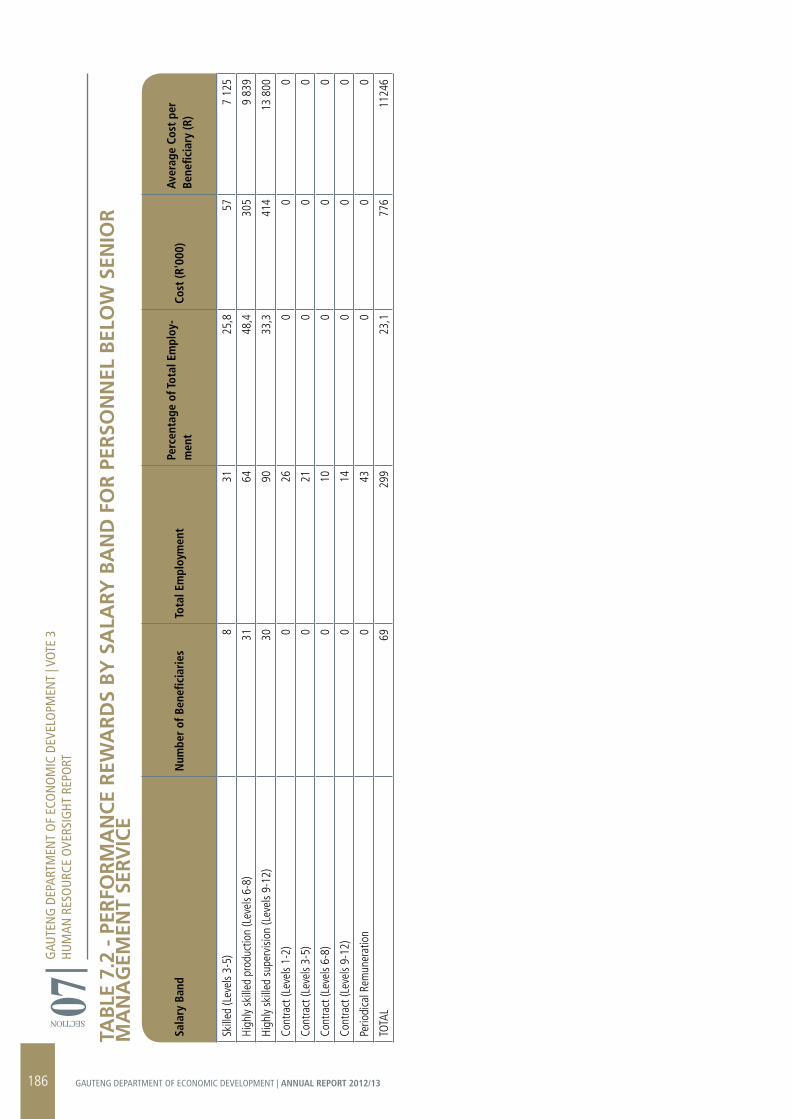
GAU
TEN
G D
EPAR
TMEN
T O
F EC
ON
OM
IC D
EVEL
OPM
ENT
| VOT
E 3
HUM
AN R
ESO
URC
E O
VERS
IGHT
REP
ORT
SECTION 07
Sala
ry B
and
Num
ber
of B
enefi
ciar
ies
Tota
l Em
ploy
men
tPe
rcen
tage
of T
otal
Em
ploy
-m
ent
Cost
(R'0
00)
Aver
age
Cost
per
Be
nefic
iary
(R)
Skill
ed (L
evel
s 3-
5)
831
25,8
577
125
High
ly sk
illed
pro
duct
ion
(Lev
els
6-8)
31
6448
,430
59
839
High
ly sk
illed
sup
ervi
sion
(Lev
els
9-12
) 30
9033
,341
413
800
Cont
ract
(Lev
els
1-2)
0
260
00
Cont
ract
(Lev
els
3-5)
0
210
00
Cont
ract
(Lev
els
6-8)
0
100
00
Cont
ract
(Lev
els
9-12
) 0
140
00
Perio
dica
l Rem
uner
atio
n 0
430
00
TOTA
L69
299
23,1
776
1124
6
TAB
LE 7
.2 -
PEr
FOr
MA
NC
E r
EWA
rD
S B
Y S
ALA
rY B
AN
D F
Or
PEr
SON
NEL
BEL
OW
SEN
IOr
M
AN
AG
EMEN
T SE
rV
ICE
186 GAUTENG DEPARTMENT OF ECONOMIC DEVELOPMENT | ANNUAL REPORT 2012/13
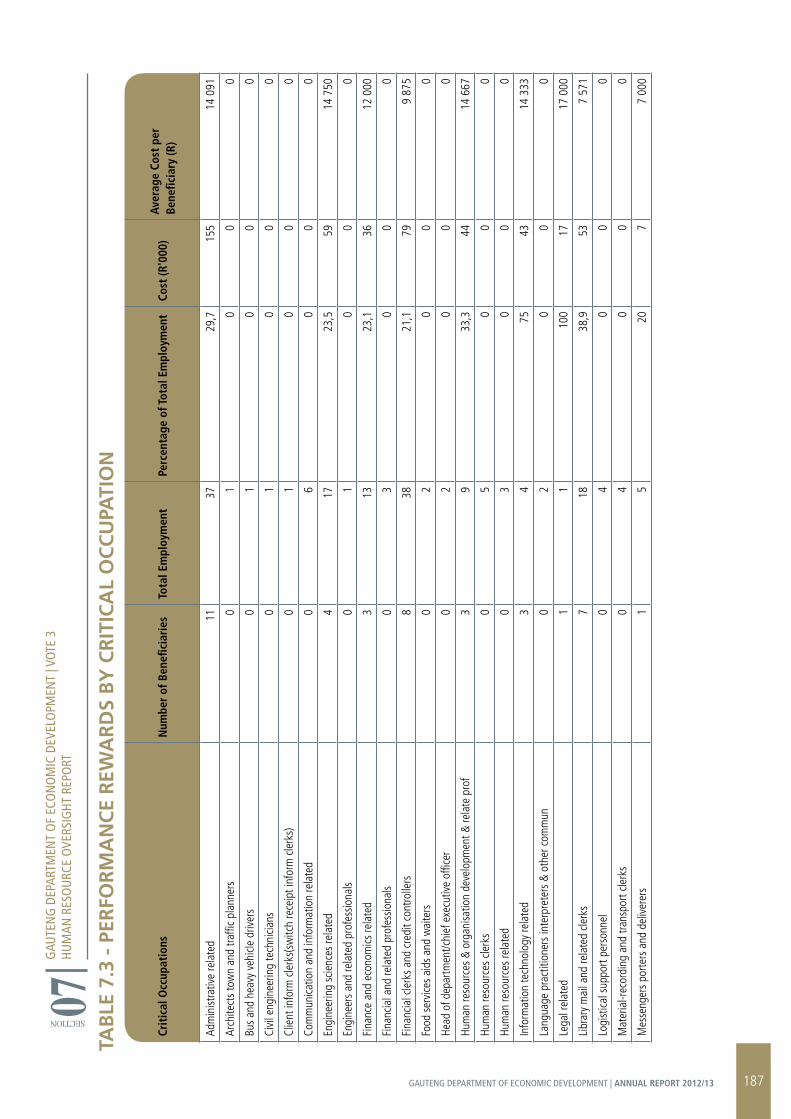
GAU
TEN
G D
EPAR
TMEN
T O
F EC
ON
OM
IC D
EVEL
OPM
ENT
| VOT
E 3
HUM
AN R
ESO
URC
E O
VERS
IGHT
REP
ORT
SECTION 07TA
BLE
7.3
- P
ErFO
rM
AN
CE
rEW
Ar
DS
BY
Cr
ITIC
AL
OC
CU
PATI
ON
Crit
ical
Occ
upat
ions
Num
ber
of B
enefi
ciar
ies
Tota
l Em
ploy
men
tPe
rcen
tage
of T
otal
Em
ploy
men
tCo
st (R
'000
)Av
erag
e Co
st p
er
Bene
ficia
ry (R
)
Adm
inist
rativ
e re
late
d 11
3729
,715
514
091
Arch
itect
s to
wn
and
traffi
c pl
anne
rs
01
00
0
Bus
and
heav
y ve
hicle
driv
ers
01
00
0
Civi
l eng
inee
ring
tech
nicia
ns
01
00
0
Clie
nt in
form
cle
rks(
switc
h re
ceip
t inf
orm
cle
rks)
0
10
00
Com
mun
icatio
n an
d in
form
atio
n re
late
d 0
60
00
Engi
neer
ing
scie
nces
rela
ted
417
23,5
5914
750
Engi
neer
s an
d re
late
d pr
ofes
siona
ls 0
10
00
Fina
nce
and
econ
omics
rela
ted
313
23,1
3612
000
Fina
ncia
l and
rela
ted
prof
essio
nals
03
00
0
Fina
ncia
l cle
rks
and
cred
it co
ntro
llers
8
3821
,179
9 87
5
Food
ser
vice
s ai
ds a
nd w
aite
rs
02
00
0
Head
of d
epar
tmen
t/chi
ef e
xecu
tive
offic
er
02
00
0
Hum
an re
sour
ces
& or
gani
satio
n de
velo
pmen
t & re
late
pro
f 3
933
,344
14 6
67
Hum
an re
sour
ces
clerk
s 0
50
00
Hum
an re
sour
ces
rela
ted
03
00
0
Info
rmat
ion
tech
nolo
gy re
late
d 3
475
4314
333
Lang
uage
pra
ctiti
oner
s in
terp
rete
rs &
oth
er c
omm
un
02
00
0
Lega
l rel
ated
1
110
017
17 0
00
Libr
ary
mai
l and
rela
ted
clerk
s 7
1838
,953
7 57
1
Logi
stica
l sup
port
pers
onne
l 0
40
00
Mat
eria
l-rec
ordi
ng a
nd tr
ansp
ort c
lerk
s 0
40
00
Mes
seng
ers
porte
rs a
nd d
eliv
erer
s 1
520
77
000
187GAUTENG DEPARTMENT OF ECONOMIC DEVELOPMENT | ANNUAL REPORT 2012/13

GAU
TEN
G D
EPAR
TMEN
T O
F EC
ON
OM
IC D
EVEL
OPM
ENT
| VOT
E 3
HUM
AN R
ESO
URC
E O
VERS
IGHT
REP
ORT
SECTION 07TA
BLE
7.3
- P
ErFO
rM
AN
CE
rEW
Ar
DS
BY
Cr
ITIC
AL
OC
CU
PATI
ON
(C
ON
TIN
UED
)
Oth
er a
dmin
istra
tion
& re
late
d cle
rks
and
orga
nise
rs
837
21,6
779
625
Oth
er a
dmin
istra
tive
polic
y an
d re
late
d of
ficer
s 7
1070
8011
429
Oth
er in
form
atio
n te
chno
logy
per
sonn
el.
28
2526
13 0
00
Oth
er o
ccup
atio
ns
17
14,3
88
000
Rank
: Unk
now
n 0
10
00
Regu
lato
ry in
spec
tors
0
10
00
Risk
man
agem
ent a
nd s
ecur
ity s
ervi
ces
04
00
0
Secr
etar
ies
& ot
her k
eybo
ard
oper
atin
g cle
rks
1123
47,8
112
10 1
82
Seni
or m
anag
ers
228
7,1
109
54 5
00
Stat
istici
ans
and
rela
ted
prof
essio
nals
01
00
0
Trad
e/in
dust
ry a
dvise
rs &
oth
er re
late
d pr
ofes
sion
01
00
0
TOTA
L72
299
24,1
905
1256
9
TAB
LE 7
.4 -
PEr
FOr
MA
NC
E r
ELA
TED
rEW
Ar
DS
(CA
SH B
ON
US)
BY
SA
LArY
BA
ND
FO
r S
ENIO
r
MA
NA
GEM
ENT
SEr
VIC
E
SMS
Band
Num
ber
of
Bene
ficia
ries
Tota
l Em
ploy
men
tPe
rcen
tage
of T
otal
Em
ploy
men
tCo
st (R
'000
)Av
erag
e Co
st p
er
Bene
ficia
ry (R
)%
of S
MS
Wag
e Bi
llPe
rson
nel C
ost
SMS
(R'0
00)
Band
A
128
3,6
2020
000
0,1
22 9
70
Band
B
212
16,7
109
54 5
001,
57
362
Band
C
01
00
00
0
Band
D
02
00
00
0
TOTA
L3
437
129
4300
00,
430
332
TOTA
L72
299
24,1
905
1256
9
Crit
ical
Occ
upat
ions
Num
ber
of B
enefi
ciar
ies
Tota
l Em
ploy
men
tPe
rcen
tage
of T
otal
Em
ploy
men
tCo
st (R
'000
)Av
erag
e Co
st p
er
Bene
ficia
ry (R
)
188 GAUTENG DEPARTMENT OF ECONOMIC DEVELOPMENT | ANNUAL REPORT 2012/13
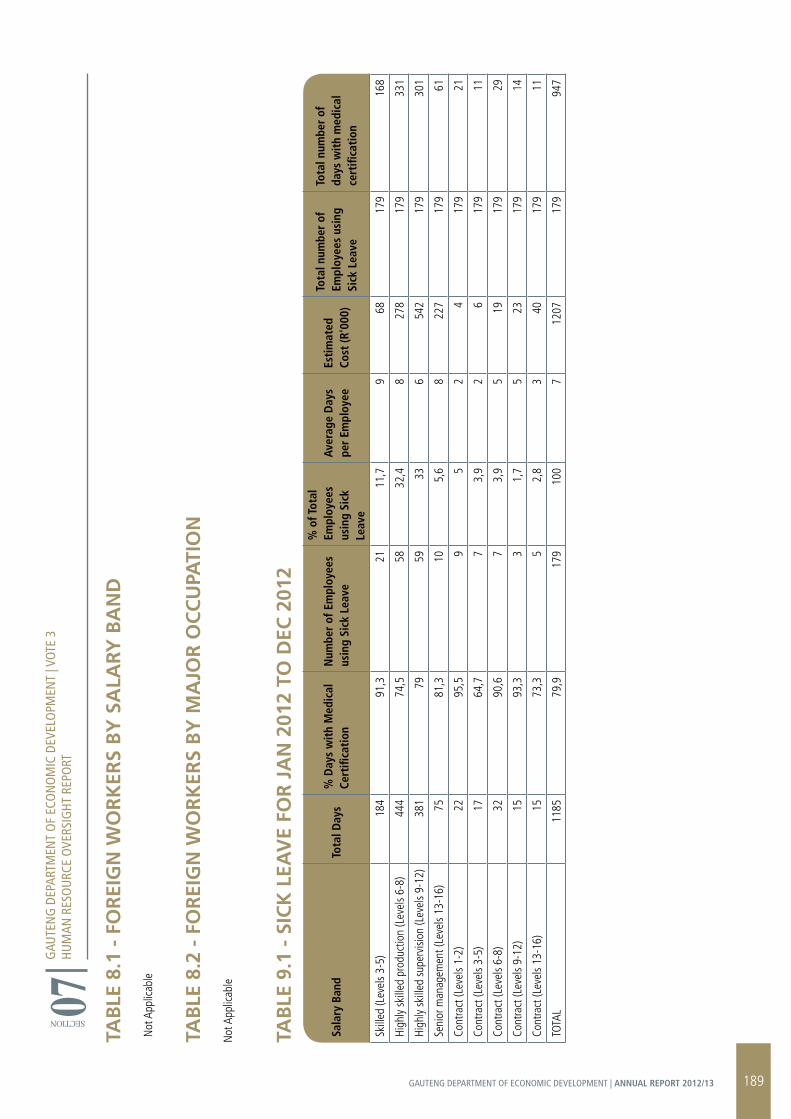
TAB
LE 8
.1 -
FO
rEI
GN
WO
rK
ErS
BY
SA
LArY
BA
ND
Not
App
licab
le
TAB
LE 8
.2 -
FO
rEI
GN
WO
rK
ErS
BY
MA
JOr
OC
CU
PATI
ON
Not
App
licab
le
GAU
TEN
G D
EPAR
TMEN
T O
F EC
ON
OM
IC D
EVEL
OPM
ENT
| VOT
E 3
HUM
AN R
ESO
URC
E O
VERS
IGHT
REP
ORT
SECTION 07
TAB
LE 9
.1 -
SIC
K L
EAV
E FO
r J
AN
201
2 TO
DEC
201
2
Sala
ry B
and
Tota
l Day
s%
Day
s w
ith
Med
ical
Ce
rtifi
cati
onN
umbe
r of
Em
ploy
ees
usin
g Si
ck L
eave
% o
f Tot
al
Empl
oyee
s us
ing
Sick
Le
ave
Aver
age
Day
s pe
r Em
ploy
eeEs
tim
ated
Co
st (R
'000
)
Tota
l num
ber
of
Empl
oyee
s us
ing
Sick
Lea
ve
Tota
l num
ber
of
days
wit
h m
edic
al
cert
ifica
tion
Skill
ed (L
evel
s 3-
5)
184
91,3
2111
,79
6817
916
8
High
ly sk
illed
pro
duct
ion
(Lev
els
6-8)
44
474
,558
32,4
827
817
933
1
High
ly sk
illed
sup
ervi
sion
(Lev
els
9-12
) 38
179
5933
654
217
930
1
Seni
or m
anag
emen
t (Le
vels
13-1
6)
7581
,310
5,6
822
717
961
Cont
ract
(Lev
els
1-2)
22
95,5
95
24
179
21
Cont
ract
(Lev
els
3-5)
17
64,7
73,
92
617
911
Cont
ract
(Lev
els
6-8)
32
90,6
73,
95
1917
929
Cont
ract
(Lev
els
9-12
) 15
93,3
31,
75
2317
914
Cont
ract
(Lev
els
13-1
6)
1573
,35
2,8
340
179
11
TOTA
L11
8579
,917
910
07
1207
179
947
189GAUTENG DEPARTMENT OF ECONOMIC DEVELOPMENT | ANNUAL REPORT 2012/13
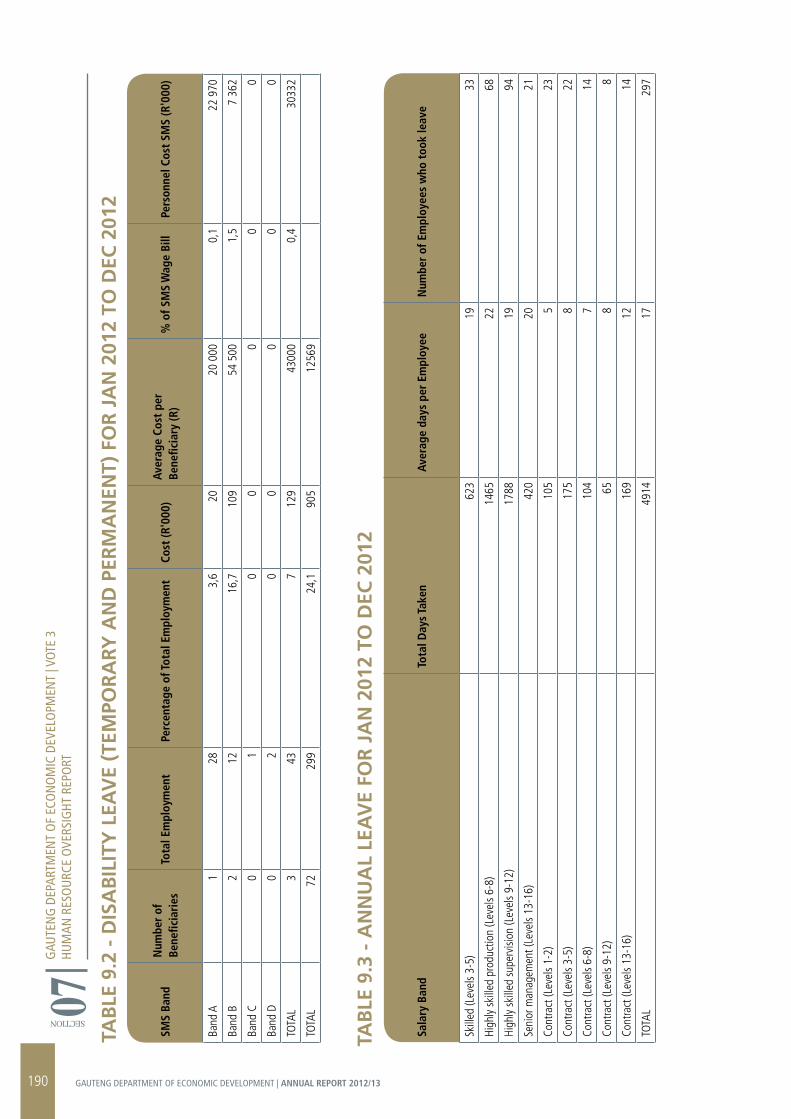
GAU
TEN
G D
EPAR
TMEN
T O
F EC
ON
OM
IC D
EVEL
OPM
ENT
| VOT
E 3
HUM
AN R
ESO
URC
E O
VERS
IGHT
REP
ORT
SECTION 07
TAB
LE 9
.3 -
AN
NU
AL
LEA
VE
FOr
JA
N 2
012
TO D
EC 2
012
Sala
ry B
and
Tota
l Day
s Ta
ken
Aver
age
days
per
Em
ploy
eeN
umbe
r of
Em
ploy
ees
who
too
k le
ave
Skill
ed (L
evel
s 3-
5)
623
1933
High
ly sk
illed
pro
duct
ion
(Lev
els
6-8)
14
6522
68
High
ly sk
illed
sup
ervi
sion
(Lev
els
9-12
) 17
8819
94
Seni
or m
anag
emen
t (Le
vels
13-1
6)
420
2021
Cont
ract
(Lev
els
1-2)
10
55
23
Cont
ract
(Lev
els
3-5)
17
58
22
Cont
ract
(Lev
els
6-8)
10
47
14
Cont
ract
(Lev
els
9-12
) 65
88
Cont
ract
(Lev
els
13-1
6)
169
1214
TOTA
L49
1417
297
TAB
LE 9
.2 -
DIS
AB
ILIT
Y L
EAV
E (T
EMPO
rA
rY A
ND
PEr
MA
NEN
T) F
Or
JA
N 2
012
TO D
EC 2
012
SMS
Band
Num
ber
of
Bene
ficia
ries
Tota
l Em
ploy
men
tPe
rcen
tage
of T
otal
Em
ploy
men
tCo
st (R
'000
)Av
erag
e Co
st p
er
Bene
ficia
ry (R
)%
of S
MS
Wag
e Bi
llPe
rson
nel C
ost
SMS
(R'0
00)
Band
A
128
3,6
2020
000
0,1
22 9
70
Band
B
212
16,7
109
54 5
001,
57
362
Band
C
01
00
00
0
Band
D
02
00
00
0
TOTA
L3
437
129
4300
00,
430
332
TOTA
L72
299
24,1
905
1256
9
190 GAUTENG DEPARTMENT OF ECONOMIC DEVELOPMENT | ANNUAL REPORT 2012/13
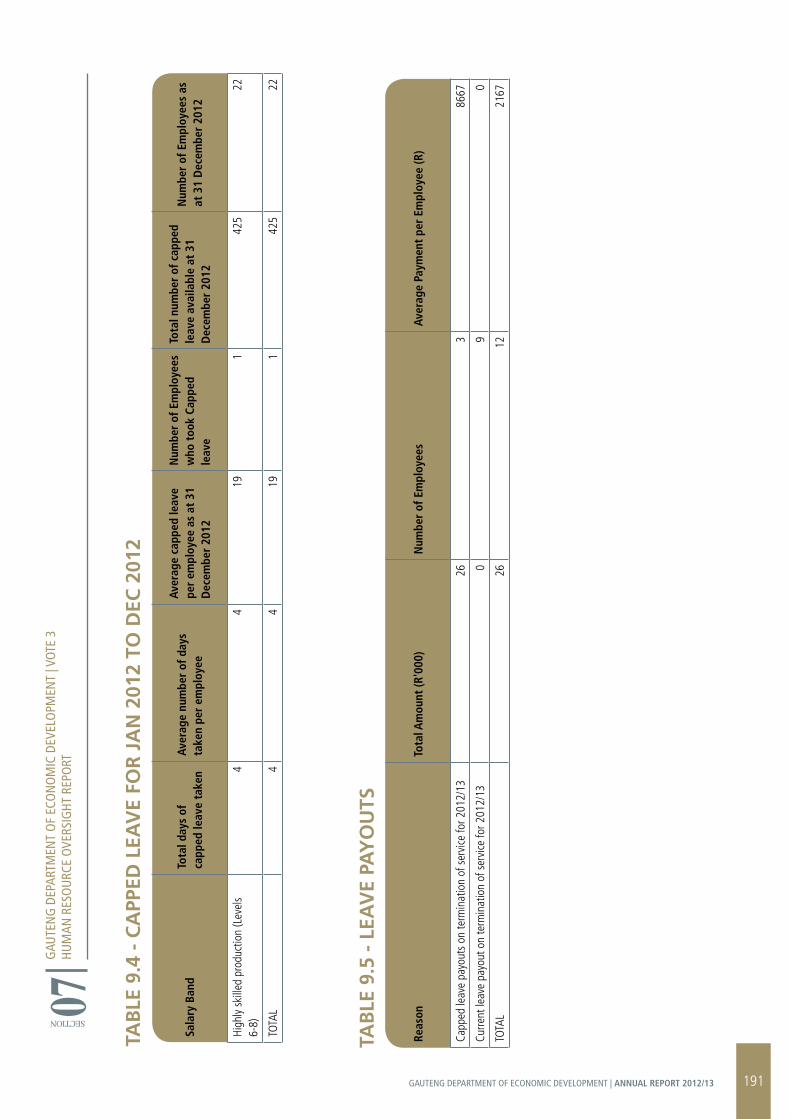
TAB
LE 9
.4 -
CA
PPED
LEA
VE
FOr
JA
N 2
012
TO D
EC 2
012
Sala
ry B
and
Tota
l day
s of
ca
pped
leav
e ta
ken
Aver
age
num
ber
of d
ays
take
n pe
r em
ploy
ee
Aver
age
capp
ed le
ave
per
empl
oyee
as
at 3
1 D
ecem
ber
2012
Num
ber
of E
mpl
oyee
s w
ho t
ook
Capp
ed
leav
e
Tota
l num
ber
of c
appe
d le
ave
avai
labl
e at
31
Dec
embe
r 20
12
Num
ber
of E
mpl
oyee
s as
at
31
Dec
embe
r 20
12
High
ly sk
illed
pro
duct
ion
(Lev
els
6-8)
4
419
142
522
TOTA
L4
419
142
522
GAU
TEN
G D
EPAR
TMEN
T O
F EC
ON
OM
IC D
EVEL
OPM
ENT
| VOT
E 3
HUM
AN R
ESO
URC
E O
VERS
IGHT
REP
ORT
SECTION 07
Reas
onTo
tal A
mou
nt (R
'000
)N
umbe
r of
Em
ploy
ees
Aver
age
Paym
ent
per
Empl
oyee
(R)
Capp
ed le
ave
payo
uts
on te
rmin
atio
n of
ser
vice
for 2
012/
13
263
8667
Curre
nt le
ave
payo
ut o
n te
rmin
atio
n of
ser
vice
for 2
012/
13
09
0
TOTA
L26
1221
67
TAB
LE 9
.5 -
LEA
VE
PAY
OU
TS
191GAUTENG DEPARTMENT OF ECONOMIC DEVELOPMENT | ANNUAL REPORT 2012/13

Que
stio
nYe
sN
oD
etai
ls, i
f yes
1. H
as th
e de
partm
ent d
esig
nate
d a
mem
ber o
f the
SM
S to
impl
emen
t the
pro
visio
ns c
onta
ined
in P
art V
I E o
f Cha
pter
1 o
f the
Pu
blic
Serv
ice R
egul
atio
ns, 2
001?
If s
o, p
rovi
de h
er/h
is na
me
and
posit
ion.
X
Ca
thrin
e M
amab
olo
2. D
oes
the
depa
rtmen
t hav
e a
dedi
cate
d un
it or
hav
e yo
u de
signa
ted
spec
ific
staf
f mem
bers
to p
rom
ote
heal
th a
nd w
ell
bein
g of
you
r em
ploy
ees?
If s
o, in
dica
te th
e nu
mbe
r of e
mpl
oyee
s w
ho a
re in
volv
ed in
this
task
and
the
annu
al b
udge
t tha
t is
avai
labl
e fo
r thi
s pu
rpos
e.
X
One
per
son
3. H
as th
e de
partm
ent i
ntro
duce
d an
Em
ploy
ee A
ssist
ance
or H
ealth
Pro
mot
ion
Prog
ram
me
for y
our e
mpl
oyee
s? If
so,
indi
cate
th
e ke
y el
emen
ts/s
ervi
ces
of th
e pr
ogra
mm
e.
X
HIV
and
AIDS
and
TB
Man
agem
ent P
rogr
amm
e, W
elln
ess
Man
agem
ent
4. H
as th
e de
partm
ent e
stab
lishe
d (a
) com
mitt
ee(s
) as
cont
empl
ated
in P
art V
I E.5
(e) o
f Cha
pter
1 o
f the
Pub
lic S
ervi
ce
Regu
latio
ns, 2
001?
If s
o, p
leas
e pr
ovid
e th
e na
mes
of t
he m
embe
rs o
f the
com
mitt
ee a
nd th
e st
akeh
olde
r(s) t
hat t
hey
repr
esen
t. X
Dept
is in
a p
roce
ss o
f est
ablis
hing
a c
omm
ittee
5. H
as th
e de
partm
ent r
evie
wed
the
empl
oym
ent p
olici
es a
nd p
ract
ices
of y
our d
epar
tmen
t to
ensu
re th
at th
ese
do n
ot u
nfai
rly
disc
rimin
ate
agai
nst e
mpl
oyee
s on
the
basis
of t
heir
HIV
stat
us?
If so
, list
the
empl
oym
ent p
olici
es/p
ract
ices
so re
view
ed.
X
HIV,
AID
S an
d TB
pol
icy, S
exua
l Har
assm
ent a
nd W
elln
ess
Polic
y
6. H
as th
e de
partm
ent i
ntro
duce
d m
easu
res
to p
rote
ct H
IV-p
ositi
ve e
mpl
oyee
s or
thos
e pe
rcei
ved
to b
e HI
V-po
sitiv
e fro
m
disc
rimin
atio
n? If
so,
list
the
key
elem
ents
of t
hese
mea
sure
s.
Polic
y de
velo
pmen
t, Im
plem
enta
tion
Hum
an R
ight
s ba
sed
prog
ram
me
7. D
oes
the
depa
rtmen
t enc
oura
ge it
s em
ploy
ees
to u
nder
go V
olun
tary
Cou
nsel
ling
and
Test
ing?
If s
o, li
st th
e re
sults
that
you
ha
ve a
chie
ved.
X
26
Mal
es a
nd 3
1 Fe
mal
es.
57 N
egat
ive
resu
lts, 0
pos
itive
s re
sult
8. H
as th
e de
partm
ent d
evel
oped
mea
sure
s/in
dica
tors
to m
onito
r & e
valu
ate
the
impa
ct o
f you
r hea
lth p
rom
otio
n pr
ogra
mm
e?
If so
, list
thes
e m
easu
res/
indi
cato
rs.
X
Non
e
TAB
LE 1
0.1
- ST
EPS
TAK
EN T
O r
EDU
CE
THE
rIS
K O
F O
CC
UPA
TIO
NA
L EX
POSU
rE
Not
App
licab
le
TAB
LE 1
0.2
- D
ETA
ILS
OF
HEA
LTH
Pr
OM
OTI
ON
AN
D H
IV/A
IDS
PrO
Gr
AM
MES
[TI
CK
YES
/NO
AN
D
PrO
VID
E r
EqU
IrED
INFO
rM
ATI
ON
]
GAU
TEN
G D
EPAR
TMEN
T O
F EC
ON
OM
IC D
EVEL
OPM
ENT
| VOT
E 3
HUM
AN R
ESO
URC
E O
VERS
IGHT
REP
ORT
SECTION 07
192 GAUTENG DEPARTMENT OF ECONOMIC DEVELOPMENT | ANNUAL REPORT 2012/13
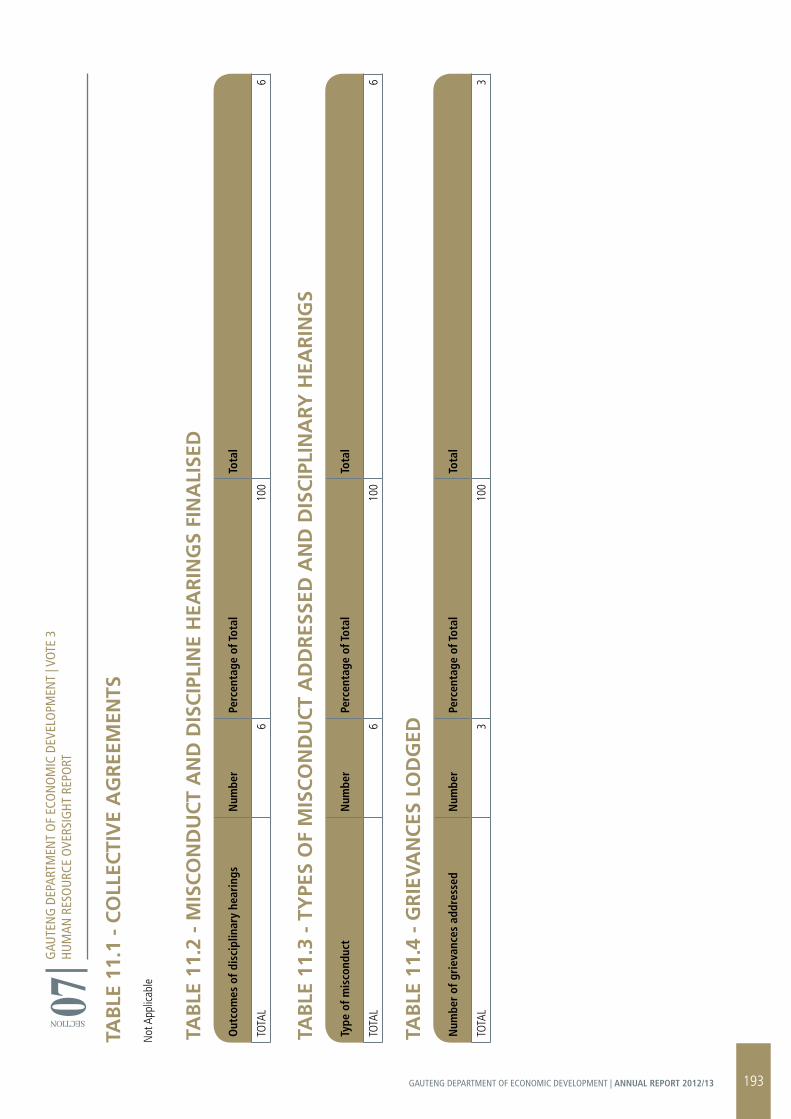
TAB
LE 1
1.1
- C
OLL
ECTI
VE
AG
rEE
MEN
TS
Not
App
licab
le
TAB
LE 1
1.2
- M
ISC
ON
DU
CT
AN
D D
ISC
IPLI
NE
HEA
rIN
GS
FIN
ALI
SED
Out
com
es o
f dis
cipl
inar
y he
arin
gsN
umbe
rPe
rcen
tage
of T
otal
Tota
l
TOTA
L6
100
6
TAB
LE 1
1.3
- TY
PES
OF
MIS
CO
ND
UC
T A
DD
rES
SED
AN
D D
ISC
IPLI
NA
rY H
EAr
ING
S
Type
of m
isco
nduc
tN
umbe
rPe
rcen
tage
of T
otal
Tota
l
TOTA
L6
100
6
TAB
LE 1
1.4
- G
rIE
VA
NC
ES L
OD
GED
Num
ber
of g
riev
ance
s ad
dres
sed
Num
ber
Perc
enta
ge o
f Tot
alTo
tal
TOTA
L3
100
3
GAU
TEN
G D
EPAR
TMEN
T O
F EC
ON
OM
IC D
EVEL
OPM
ENT
| VOT
E 3
HUM
AN R
ESO
URC
E O
VERS
IGHT
REP
ORT
SECTION 07
193GAUTENG DEPARTMENT OF ECONOMIC DEVELOPMENT | ANNUAL REPORT 2012/13
TAB
LE 1
1.5
- D
ISPU
TES
LOD
GED
Not
App
licab
le
TAB
LE 1
1.6
- ST
rIK
E A
CTI
ON
S
Not
App
licab
le
TAB
LE 1
1.7
- Pr
ECA
UTI
ON
ArY
SU
SPEN
SIO
NS
Not
App
licab
le
GAU
TEN
G D
EPAR
TMEN
T O
F EC
ON
OM
IC D
EVEL
OPM
ENT
| VOT
E 3
HUM
AN R
ESO
URC
E O
VERS
IGHT
REP
ORT
SECTION 07
194 GAUTENG DEPARTMENT OF ECONOMIC DEVELOPMENT | ANNUAL REPORT 2012/13
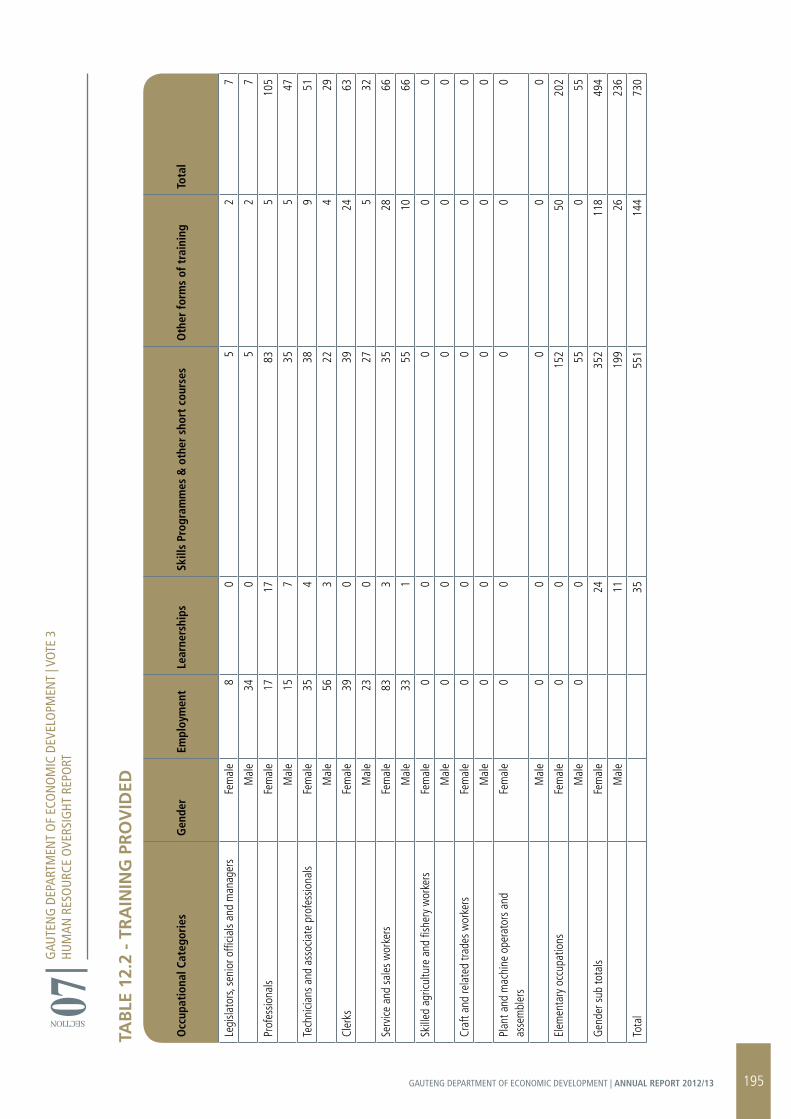
Occ
upat
iona
l Cat
egor
ies
Gen
der
Empl
oym
ent
Lear
ners
hips
Skill
s Pr
ogra
mm
es &
oth
er s
hort
cou
rses
Oth
er fo
rms
of t
rain
ing
Tota
l
Legi
slato
rs, s
enio
r offi
cials
and
man
ager
s Fe
mal
e 8
05
27
M
ale
340
52
7
Prof
essio
nals
Fem
ale
1717
835
105
M
ale
157
355
47
Tech
nicia
ns a
nd a
ssoc
iate
pro
fess
iona
ls Fe
mal
e 35
438
951
M
ale
563
224
29
Cler
ks
Fem
ale
390
3924
63
M
ale
230
275
32
Serv
ice a
nd s
ales
wor
kers
Fe
mal
e 83
335
2866
M
ale
331
5510
66
Skill
ed a
gricu
lture
and
fish
ery
wor
kers
Fe
mal
e 0
00
00
M
ale
00
00
0
Craf
t and
rela
ted
trade
s w
orke
rs
Fem
ale
00
00
0
M
ale
00
00
0
Plan
t and
mac
hine
ope
rato
rs a
nd
asse
mbl
ers
Fem
ale
00
00
0
M
ale
00
00
0
Elem
enta
ry o
ccup
atio
ns
Fem
ale
00
152
5020
2
M
ale
00
550
55
Gen
der s
ub to
tals
Fem
ale
2435
211
849
4
M
ale
1119
926
236
Tota
l
3555
114
473
0
TAB
LE 1
2.2
- Tr
AIN
ING
Pr
OV
IDED
GAU
TEN
G D
EPAR
TMEN
T O
F EC
ON
OM
IC D
EVEL
OPM
ENT
| VOT
E 3
HUM
AN R
ESO
URC
E O
VERS
IGHT
REP
ORT
SECTION 07
195GAUTENG DEPARTMENT OF ECONOMIC DEVELOPMENT | ANNUAL REPORT 2012/13
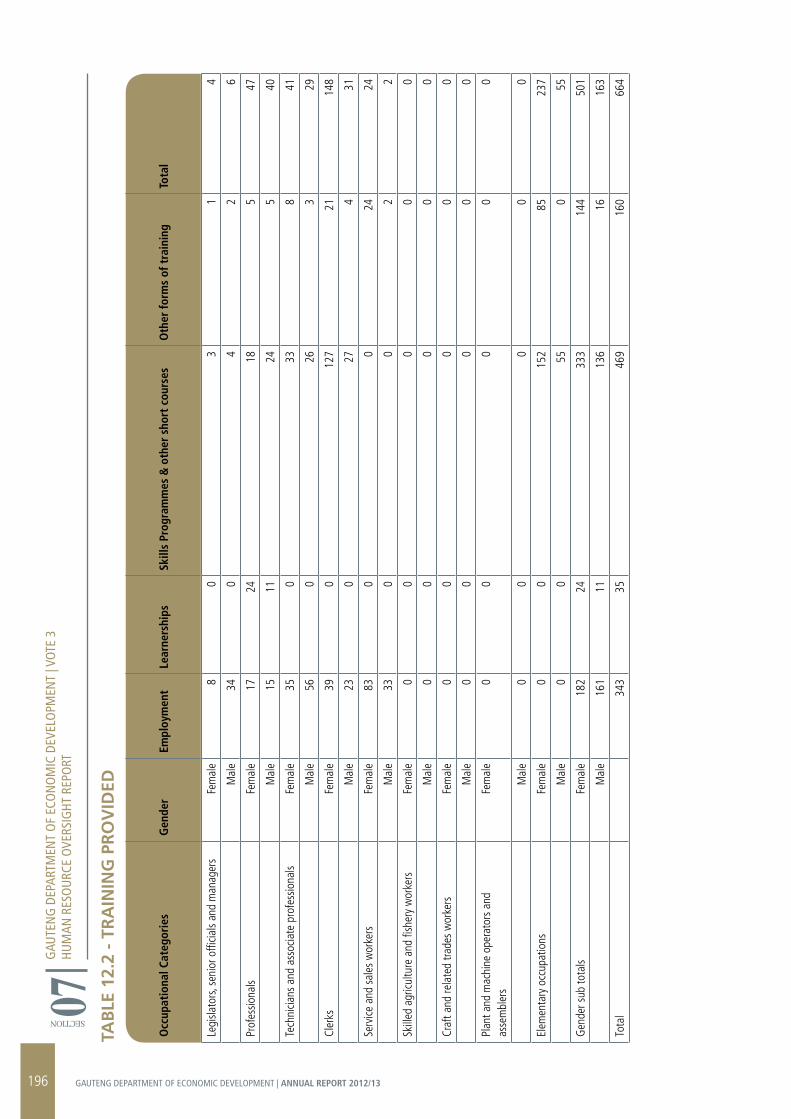
GAU
TEN
G D
EPAR
TMEN
T O
F EC
ON
OM
IC D
EVEL
OPM
ENT
| VOT
E 3
HUM
AN R
ESO
URC
E O
VERS
IGHT
REP
ORT
SECTION 07O
ccup
atio
nal C
ateg
orie
sG
ende
rEm
ploy
men
tLe
arne
rshi
psSk
ills
Prog
ram
mes
& o
ther
sho
rt c
ours
esO
ther
form
s of
tra
inin
gTo
tal
Legi
slato
rs, s
enio
r offi
cials
and
man
ager
s Fe
mal
e 8
03
14
M
ale
340
42
6
Prof
essio
nals
Fem
ale
1724
185
47
M
ale
1511
245
40
Tech
nicia
ns a
nd a
ssoc
iate
pro
fess
iona
ls Fe
mal
e 35
033
841
M
ale
560
263
29
Cler
ks
Fem
ale
390
127
2114
8
M
ale
230
274
31
Serv
ice a
nd s
ales
wor
kers
Fe
mal
e 83
00
2424
M
ale
330
02
2
Skill
ed a
gricu
lture
and
fish
ery
wor
kers
Fe
mal
e 0
00
00
M
ale
00
00
0
Craf
t and
rela
ted
trade
s w
orke
rs
Fem
ale
00
00
0
M
ale
00
00
0
Plan
t and
mac
hine
ope
rato
rs a
nd
asse
mbl
ers
Fem
ale
00
00
0
M
ale
00
00
0
Elem
enta
ry o
ccup
atio
ns
Fem
ale
00
152
8523
7
M
ale
00
550
55
Gen
der s
ub to
tals
Fem
ale
182
2433
314
450
1
M
ale
161
1113
616
163
Tota
l
343
3546
916
066
4
TAB
LE 1
2.2
- Tr
AIN
ING
Pr
OV
IDED
196 GAUTENG DEPARTMENT OF ECONOMIC DEVELOPMENT | ANNUAL REPORT 2012/13
GAU
TEN
G D
EPAR
TMEN
T O
F EC
ON
OM
IC D
EVEL
OPM
ENT
| VOT
E 3
HUM
AN R
ESO
URC
E O
VERS
IGHT
REP
ORT
SECTION 07TA
BLE
13.
1 -
INJU
rY O
N D
UTY
Not
App
licab
le
TAB
LE 1
4.1
- r
EPO
rT
ON
CO
NSU
LTA
NT
APP
OIN
TMEN
TS U
SIN
G A
PPr
OPr
IATE
D F
UN
DS
Not
App
licab
le
TAB
LE 1
4.2
- A
NA
LYSI
S O
F C
ON
SULT
AN
T A
PPO
INTM
ENTS
USI
NG
APP
rO
PrIA
TED
FU
ND
S, I.
T.O
. HD
IS
Not
App
licab
le
TAB
LE 1
4.3
- r
EPO
rT
ON
CO
NSU
LTA
NT
APP
OIN
TMEN
TS U
SIN
G D
ON
Or
FU
ND
S
Not
App
licab
le
TAB
LE 1
4.4
- A
NA
LYSI
S O
F C
ON
SULT
AN
T A
PPO
INTM
ENTS
USI
NG
DO
NO
r F
UN
DS,
I.T.
O. H
DIS
Not
App
licab
le
197GAUTENG DEPARTMENT OF ECONOMIC DEVELOPMENT | ANNUAL REPORT 2012/13

198 GAUTENG DEPARTMENT OF ECONOMIC DEVELOPMENT | ANNUAL REPORT 2012/13
SECT
ION 08
GAUTENG DEPARTMENT OF ECONOMIC DEVELOPMENT | OUTLOOK FOR THE
COMING YEAR
199GAUTENG DEPARTMENT OF ECONOMIC DEVELOPMENT | ANNUAL REPORT 2012/13
The Department of Economic Development, in aligning with the Gauteng MTSF and the outcomes of the provincial government, has led the development of the Gauteng Employment, Growth and Development Strategy (GEGDS) which is the framework that underpins the developmental objectives of the province to achieve decent work creation and sustainable economic growth.
In order to support these objectives, the Department of Economic Development has also formulated key economic policies and strategies, namely but not least, the Industrial policy which will now be implemented through specific priority sector development strategies; BBBEE strategy; Green Economy strategy; SMME and Cooperatives strategies which have all recently been finalised.
The focus now shifts to enhancing the effective implementation of these strategies, and this critically informs the reprioritisation and reconfiguration of the Department, and has been considered in the development of the Department’s 2013/14 Annual Performance Plan and Budget. The demand for DED services and other factors that have informed the development of the 2013/14 Annual Performance Plan is discussed in more detail below in accordance to the provincial Outcome 4 Plan and outputs thereof:
Output 1: Strategic Economic Infrastructure Stimulating Employment-led Economic Growth and Development
Gauteng Growth and Development Agency will continue to increase its efforts in the development of strategic economic infrastructure to serve as the bedrock for business and economic development.
Investment in network and connectivity infrastructure such as the NASREC Development Precinct SEZ will continue. Furthermore, phase 1 of the Diepsloot Industrial Park will be completed; this will include the Incubation Centre and Practical University.
Output 2: Re-industrialisation to Support the Growth of Labour Intensive Industries
Gauteng Growth and Development Agency will to continue to focus on addressing skills gaps and creating jobs through partnerships with industries to deliver skills for the economy in labour intensive sectors such as the automotive, furniture, fashion, metal fabrication and mineral beneficiation sectors. The Nissan Simulator will be finalised and an investment in the expansion of the mini-factories at the Automotive Supplier Park will be concluded.
Output 3: Building an Innovation and Knowledge-based Economy to drive Competitiveness and Economic Growth
The Department plans to finalise the four enterprise development business cases for the NASREC Precinct and the establishment of BPO centres, mobile walk-in centres and ICT centres at the NASREC Precinct. The programmes of the Innovation Hub and the Gauteng Innovation Exchange Programme will continue with an enhanced focus on addressing skills gaps and creating jobs through partnerships with industries and the skills development sector to deliver skills for the economy in the ICT and knowledge sector.
Output 4: Green Economy Interventions to Support Sustainable Economic Growth and Interventions
The green agenda includes supporting and incubating companies via the Climate Innovation Centre, identifying and mentoring bio-science innovation through the Gauteng Accelerator Programme (GAP), completing and commissioning the Sedibeng and West Rand Bio-digestor projects and the Ekurhuleni Waste to Energy project.
Output 5: Tourism Sector Development to drive Competitiveness and Economic Growth
The focus of the Gauteng Tourism Agency, Cradle of Humankind World Heritage Site and Dinokeng projects will be to continue with the merging of these three entities into a “single unified tourism entity”. The purpose of the merger is to improve the drive to position Gauteng as a tourism destination for business and leisure, growing the visitor economy and effectively managing destination Gauteng in a responsible and sustainable manner. There will be a continued focus on addressing skills gaps and creating jobs through partnerships with industries and the skills development sector to deliver skills for the economy in the tourism sector, so as to address structural unemployment with the view of absorbing trained persons.
Specific priorities for the 2013/14 financial year include finalising the transfer and operating model for the Ga-Rankuwa Hotel School, the refurbishment of ramparts and interior office space at Constitution Hill, and continuing with the infrastructure upgrade at the Cradle of Humankind World Heritage Site. In terms of developing Constitution Hill Precinct as a lead project in city renewal and for the establishment of a struggle history route, the Nelson Mandela Centre of Memory will be developed as an anchor attraction to enhance the visitor experience to Constitution Hill.
GAUTENG DEPARTMENT OF ECONOMIC DEVELOPMENTOUTLOOK FOR THE COMING YEAR
SECT
ION 08
200 GAUTENG DEPARTMENT OF ECONOMIC DEVELOPMENT | ANNUAL REPORT 2012/13
GAUTENG DEPARTMENT OF ECONOMIC DEVELOPMENTOUTLOOK FOR THE COMING YEAR
Output 7: Sustainable Employment Creation
SMME and Cooperatives Support: Gauteng Enterprise Propeller (GEP)
The focus of the Department and the GEP will be to strengthen partnerships with the private sector and government agencies in order to create SMME incubators that will be employment creators and aggressively drive greater involvement of SMMEs and cooperatives in the economy. In the 2013/14 financial year, a targeted focus on providing support and training to informal businesses will be implemented.
Implementation of Youth Employment Strategy
The Department will continue with the implementation of the Youth Employment Strategy through the establishment of Township Enterprise Hubs, the refurbishment of old township industrial sites, the roll-out of the Gauteng Youth Placement Programme and the focused establishment of youth business.
Output 8: Trade and investment Promotion
The Gauteng Economic Development Agency (GEDA) will ensure that Gauteng retains its position as an economic hub of Southern Africa, and will promote trade and investment to maximise Foreign Direct Investment (FDI) and Domestic Direct Investment (DDI) aiming to increase the participation of Gauteng nationally, regionally and internationally.
Furthermore, emphasis will be placed on positioning Gauteng-based companies to benefit from procurement in strategic economic infrastructure projects such as rail-road construction, independent power production and manufacture of rolling stock.
The highlight will be to position Gauteng as the gateway to benefit from bilateral and regional trade agreements through implementation of the Gauteng Investment Centre (One-Stop Shop). This will facilitate trade and investment and the export development programme, ensuring that Gauteng exports increase.
Broad Based Black Economic Empowerment (BBBEE)
The Department will continue to monitor the implementation of the BBBEE strategy. The DED in conjunction with the Gauteng Department of Finance (GDF) (Shared Services Division) will continue to run awareness sessions with Supply Chain Management (SCM) staff in GPG Departments, agencies, municipalities and GPG suppliers.
The Department will also continue to assist GPG entities and suppliers to understand the Preferential Procurement Policy Financial Act (PPPFA) and alignment to B-BBEE Regulations to ensure compliance. A key focus will be to use preferential procurement to leverage a greater supply of locally produced goods and services.
Other Departmental Programmes
Consumer Protection
The Department identified sections in the national legislation that impact on its mandate and role and will review the Consumer Affairs (Unfair Business Practices) Act 7 of 1996 during the year. Consumer education, advocacy and awareness remain the cornerstone upon which consumer protection is built and the new communication and marketing strategy calls for increased use of mass media and social media platforms to educate Gauteng citizens.
Increased access to consumer affairs courts in communities is a top priority, the more so with the passing of the Consumer Affairs (Unfair Business Practices) Act which advocates the promotion and protection of consumer rights in marginalised and rural communities.
Liquor Licencing
Priorities for the 2013/14 financial year include the finalisation and implementation of the Automated Liquor Licensing System (ALLS), intensifying liquor abuse education and awareness programmes, and increasing the number of inspections in order to enforce compliance. A process flow with specific time frames will be developed in this regard. In terms of governance, the Department will conduct a review of the current funding model and finalise the migration of shebeen permits into the ambit of the Gauteng Liquor Act of 2003.
Gambling Regulation
During the 2013/14 financial year, the Gauteng Gambling Board (GGB) will continue to focus on the roll-out of the responsible gambling awareness campaign with particular attention to school awareness programmes, university and college campus visits, awareness sessions at public shows and expos, adult outreach projects (Allpay and transport hubs) and public advertising.
In terms of its mandate to regulate and control gambling, the GGB will pay particular attention to a review of the impact of the proposed withholding tax on punters winnings and contribute to the deliberations on the proposed amendments to the Taxation Laws Amendment Bill.
GAUTENG DEPARTMENT OF ECONOMIC DEVELOPMENTOUTLOOK FOR THE COMING YEAR
SECT
ION 08
201GAUTENG DEPARTMENT OF ECONOMIC DEVELOPMENT | ANNUAL REPORT 2012/13
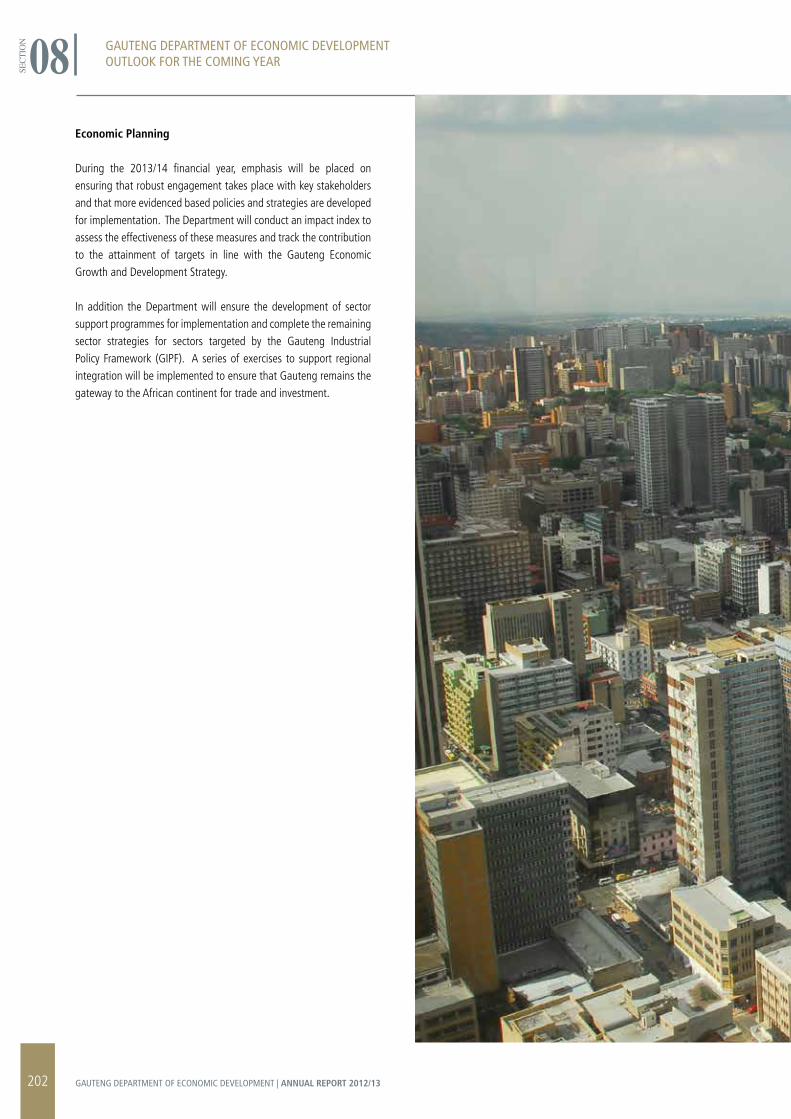
Economic Planning
During the 2013/14 financial year, emphasis will be placed on ensuring that robust engagement takes place with key stakeholders and that more evidenced based policies and strategies are developed for implementation. The Department will conduct an impact index to assess the effectiveness of these measures and track the contribution to the attainment of targets in line with the Gauteng Economic Growth and Development Strategy.
In addition the Department will ensure the development of sector support programmes for implementation and complete the remaining sector strategies for sectors targeted by the Gauteng Industrial Policy Framework (GIPF). A series of exercises to support regional integration will be implemented to ensure that Gauteng remains the gateway to the African continent for trade and investment.
GAUTENG DEPARTMENT OF ECONOMIC DEVELOPMENTOUTLOOK FOR THE COMING YEAR
SECT
ION 08
202 GAUTENG DEPARTMENT OF ECONOMIC DEVELOPMENT | ANNUAL REPORT 2012/13
GAUTENG DEPARTMENT OF ECONOMIC DEVELOPMENTOUTLOOK FOR THE COMING YEAR
GAUTENG DEPARTMENT OF ECONOMIC DEVELOPMENTOUTLOOK FOR THE COMING YEAR
SECT
ION 08
203GAUTENG DEPARTMENT OF ECONOMIC DEVELOPMENT | ANNUAL REPORT 2012/13
204 GAUTENG DEPARTMENT OF ECONOMIC DEVELOPMENT | ANNUAL REPORT 2012/13
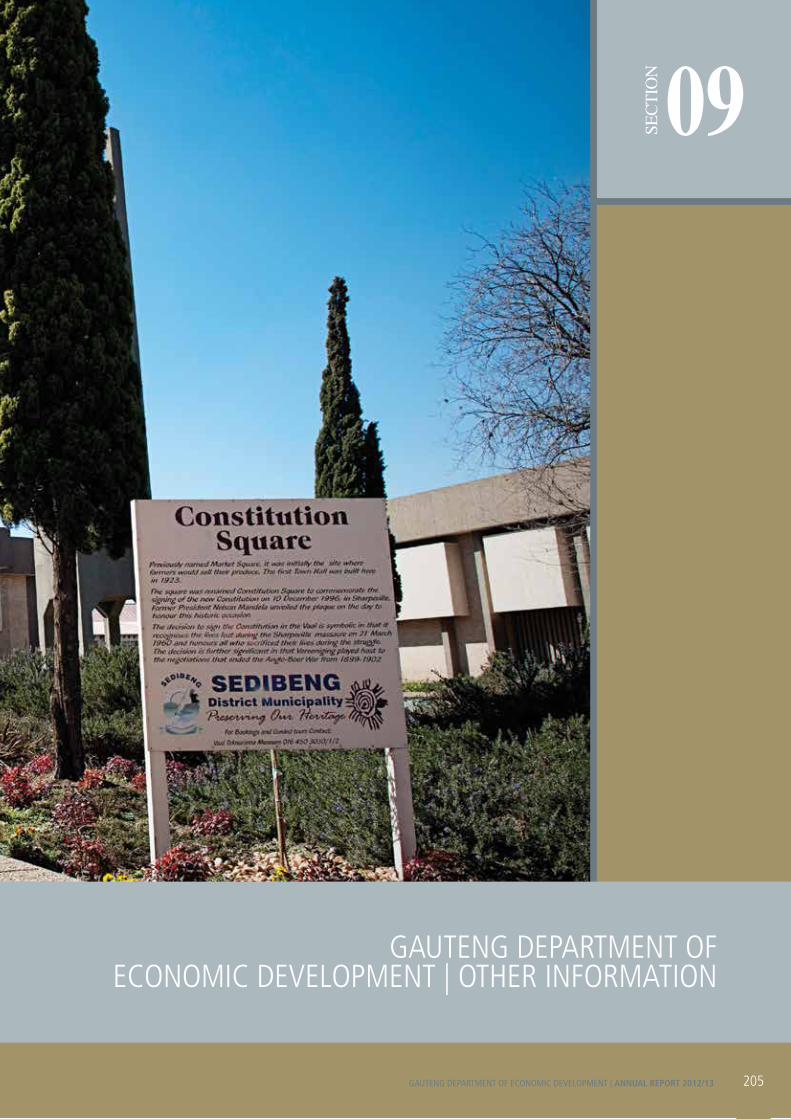
SECT
ION 09
GAUTENG DEPARTMENT OF ECONOMIC DEVELOPMENT | OTHER INFORMATION
205GAUTENG DEPARTMENT OF ECONOMIC DEVELOPMENT | ANNUAL REPORT 2012/13
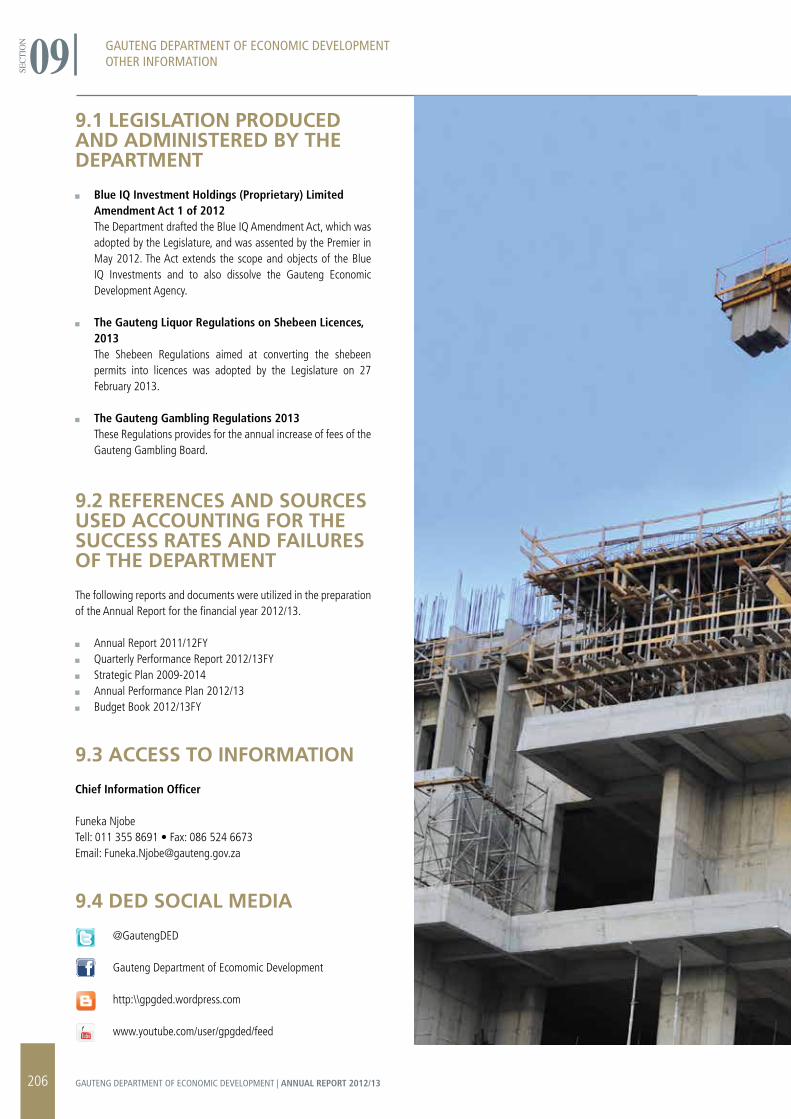
9.1 LEGISLATION PrODUCED AND ADMINISTErED BY THE DEPArTMENT
Blue IQ Investment Holdings (Proprietary) Limited Amendment Act 1 of 2012
The Department drafted the Blue IQ Amendment Act, which was adopted by the Legislature, and was assented by the Premier in May 2012. The Act extends the scope and objects of the Blue IQ Investments and to also dissolve the Gauteng Economic Development Agency.
The Gauteng Liquor Regulations on Shebeen Licences, 2013
The Shebeen Regulations aimed at converting the shebeen permits into licences was adopted by the Legislature on 27 February 2013.
The Gauteng Gambling Regulations 2013These Regulations provides for the annual increase of fees of the Gauteng Gambling Board.
9.2 rEFErENCES AND SOUrCES USED ACCOUNTING FOr THE SUCCESS rATES AND FAILUrES OF THE DEPArTMENT
The following reports and documents were utilized in the preparation of the Annual Report for the financial year 2012/13.
Annual Report 2011/12FY Quarterly Performance Report 2012/13FY Strategic Plan 2009-2014 Annual Performance Plan 2012/13 Budget Book 2012/13FY
9.3 ACCESS TO INFOrMATION
Chief Information Officer
Funeka NjobeTell: 011 355 8691 • Fax: 086 524 6673 Email: [email protected]
9.4 DED SOCIAL MEDIA @GautengDED Gauteng Department of Ecomomic Development http:\\gpgded.wordpress.com www.youtube.com/user/gpgded/feed
GAUTENG DEPARTMENT OF ECONOMIC DEVELOPMENTOTHER INFORMATION
SECT
ION 09
206 GAUTENG DEPARTMENT OF ECONOMIC DEVELOPMENT | ANNUAL REPORT 2012/13
GAUTENG DEPARTMENT OF ECONOMIC DEVELOPMENTOTHER INFORMATION
GAUTENG DEPARTMENT OF ECONOMIC DEVELOPMENTOTHER INFORMATION
SECT
ION 09
207GAUTENG DEPARTMENT OF ECONOMIC DEVELOPMENT | ANNUAL REPORT 2012/13


GPG Contact Centre0860 GAUTENG (0860 428 8364)
Matlotlo House, 94 Main Street, Johannesburg Private Bag X091Marshalltown, 2107T (011) 355-8000F (011) 355-8730
RP225/2013ISBN: 987-0-621-41167-6
2328
| IW
W |
RM