gavesana journal of management - vignana jyothi...
TRANSCRIPT
Gavesana
Journal of Management
Owner’s Name : Vignana Jyothi Institute of Management
Published by : Vignana Jyothi Institute of ManagementVignana Jyothi Nagar, Bachupally, Via Kukatpally,Hyderabad - 500090. Andhra Pradesh.Ph:040-23044901/02E-mail: [email protected]: vjim.edu.in
Editor : Dr. Kamal Ghosh Ray
Printer : Mr. P. Narendra
Printed at : Pragati Offset Pvt. Ltd.,No.17, Red Hills, Hyderabad - 500004. Andhra Pradesh.Phone: 040-23304837.
(i)
Vol. 3 Issue. 1 January 2011 - June 2011
Editorial (ii)
The Relationship Between Accounting Earnings, Stock Return Sanjay J. Bhayani 1Volatility and Corporate Disclosure Practices:Empirical Evidence from the Indian Corporate
Leadership Theory from a Communication Style Perspective: Vinay Kumar Chaganti 16A Critical Analysis Nalini Bikkina
Performance of Microfinance Institutions (MFIs): Bindiya Soni 25An Empirical Study
Talent Management for Organizational Success: G. M. Archana Das 38A Conceptual Framework
Financial Decisions by Small and Medium Enterprises: P. Sheela 44An Empirical Study
Television Advertising: A Study of Changes in Brand Preferences Y. Madhuri Srinivas 55
Purchase Decision and Brand Loyalty: Ch. S. Durga Prasad 63A Study of Toothpaste Brands in India V. Jayashree
Influence of Demographic Factors on Organization Climate K. Suguna 70
Case Study: Step up the Stairs or Stare at the Steps? S. Panda 80
Abstract of Ph.D Thesis : Impact of Financial Sector Reforms on K. Sriharsha Reddy 90Indian Commercial Banking Sector

(ii)
EDITORIALToday, we are living in economically, politically, environmentally and socially turbulent times; be it high-levelcorruption, misgovernance, inflation, ill-policy making, governments’ insensitivity, poverty, lack of properprimary to tertiary education and the like. Gradually, it is becoming difficult to have clear, insightful anddirectional analysis of the economy and business, even though loads of statistics on industries, markets andeconomies are available. In the era of information explosion, understanding how economics influences business,environment and politics, has become increasingly essential. Time and again, financial crises are happeninganywhere in the world due to creation of excess liquidity or illiquidity in the economies. As Adam Smithvisualised, financial crises are the results of ‘moral hazards’ and their ‘immoral results’ in respect of policyissues. It is important to realize that the risks of financial crisis, moral hazard and immoral results cannot beavoided by financial and accounting gimmicks any more and that there is no substitute for creation of wellbalanced liquidity. The United States is now in the midst of another major financial crisis that has downgradedits sovereign rating to AA+ from AAA leading to adverse effects on the financial markets and financial institutionsaround the world. Perhaps, there is no country in the world that did not face economic and financial crises in thehistory. Any economic crisis is the result as well as the cause of business failure, denying welfare to people.Doing business without looking into the dynamics of economics would be a great mistake in modern times.Economics and business have become inseparable. Increasingly, knowledge of business and economics aregetting integrated making ‘business management’ more and more complicated. During the early 1990s, a newdiscipline of knowledge, called ‘Business Economics’ emerged in developed nations and subsequently emergingin other countries.
Business economics originates from that part of economic theory which focuses on business entities and analysingthe factors contributing to the organizational structures and the relationships of firms with capital, labour,products and markets. The fundamental economic theory of firm suggests why firms emerge, exist and expandby explaining the significance of organizational structure and the relationship of firms with the employers,employees, providers of capital, customers, government and the environment. Economics of business aims atapplying the economic principles to the real world of business and managerial decision-making process.
Now a days, many universities in the western world offer courses in Business Economics in the undergraduateand post graduate levels with various interpretations of the subject. According to Harvard University, ‘businesseconomics’ requires the use of economic methods to analyze practical aspects of business and administration.The Miami University explains ‘business economics’ as a study involving how to use resources for the production,distribution, and consumption of goods and services and for this, the business organisations need ‘businesseconomists’ to analyse social institutions, banks, stock market, government by looking at the problems connectedwith labor negotiations, taxes, international trade, urban and environmental issues. The objective of the courseon ‘business economics’ at the University of Manchester is to impart economic analysis of how businessescontribute to welfare of society. They teach the relationship between ownership, control and firm objectives;theories of the growth of the firm; the behavioural theory of the firm; theories of entrepreneurship; that influence

(iii)
the structure, conduct and performance of business at the industry level. According to the University of EastLondon ‘business economics’ is the application of economic theory to business activities and organisations tounderstand the ways markets work, what firms do, what their motives are, how they perform and the role ofgovernment in regulating business activities. Back home, University of Delhi is a pioneer in introducing the‘business economics’ course in the 1990s at the regular masters level incorporating some of the objectives asspelt out above.
In the context of complex socio-economic and political scenario, the Indian businesses do need modulation oftheir strategies towards ownership patterns, management styles, stakeholder engagements and market orientation.And therefore, they require integration of the application of economics with the key management functions.With this end in view, Vignana Jyothi Institute of Management has introduced a course called ‘PGDM-BusinessEconomics’ with the approval of the AICTE, Ministry of HRD, Government of India, which is first of its kindfor any Business School in India. In this regard, I invite the readers, faculty, researchers and industry executivesto contribute research articles in various management functions encompassing theories, philosophies andapplications of Economics.
Dr. Kamal Ghosh RayEditor
Gavesana Journal of Management / Vol. 3. Issue 1. / January 2011 - June 2011. 1
The Relationship Between Accounting Earnings, Stock ReturnVolatility and Corporate Disclosure Practices: Empirical
Evidences from the Indian CorporateSanjay J. Bhayani*
Abstract
In the present paper we have studied effect of disclosure of accounting information on Accounting Earningsand Stock Returns Volatility with reference to India. We develop a disclosure grid that we use to rate 81 firmslisted on the BSE – 100 index between 2005 and 2009. We hypothesize that the decision to voluntarily disclosesome information is a result of the assessment of the economic costs and benefits to be derived from thisadditional disclosure. Relying on a simultaneous equations approach, our results indicate that disclosure strategyis positively related to the level of information costs. To assess the consequences of increased disclosure, wefirst examine the relationship between the use of depreciation/provisions, income smoothing and voluntarydisclosure. Our results suggest that Indian Generally Accepted Accounting Principles(GAAP) firms usedepreciation/provisions to smooth earnings. This relation is reduced for firms with high disclosure quality.Second, we show that the relevance of earnings for stock market valuation is higher for firms complying withIAS/US GAAP.
Keywords: Disclosure Practices, Accounting Earnings, Stock Return Volatility, Accounting Standards.
Introduction
The causes and consequences of voluntary corporate disclosure have been the object of considerableattention in the literature. However, most studies are conducted in the United States, a context in which highdisclosure requirements severely constrain firms’ flexibility in setting their disclosure strategy. Hence, there isonly mixed evidence on the economic determinants and consequences of increased voluntary disclosure. Inlight of these limitations, recent studies focus on settings where it is possible to observe a large change in thedisclosure policy or in which accounting rules and other regulations give managers more discretion in thechoice of the information disclosed (e.g. Chau and Gray, 2002; Leuz and Verrecchia, 2000).
We study the motivation for and consequences of corporate disclosure quality in India, a country thatprovides managers with extensive discretion in corporate disclosure. At a conceptual level, accounting standardboard national standard-setting body has adopted 31 Accounting Standard (AS). To investigate the level ofvoluntary disclosure by Indian firms, we develop a detailed disclosure grid for annual reports. The samplecomprises 81 firms listed on the Bombay Stock Exchange between 2005 and 2009. As suggested by informationeconomics theory, we hypothesize that the decision to voluntarily disclose some information is a result of theassessment of the economic benefits to be derived from this additional disclosure. Therefore, the level ofinformation disclosed should be chosen to minimize the information costs supported by shareholders andinvestors. To assess the consequences of increased disclosure, we examine the relationship between the use ofreserves to smooth earnings, voluntary disclosure, and stock market valuation.
The rest of this paper is organized as follows: Section 2 discusses the theoretical framework and presentsthe research hypotheses, Section 3 details the methodology, Section 4 exposes the results and Section 5 containsthe conclusion.
*Associate Professor, Department of Business Management, Saurashtra University, RAJKOT – 360 005Email: [email protected]
2. Gavesana Journal of Management / Vol. 3. Issue 1. / January 2011 - June 2011.
Theoretical Framework and Research Hypotheses
Fields et al. (2001) argue that a significant shortcoming of numerous empirical disclosure studies is thefailure to address the endogenous nature of the disclosure quality decision. If researchers do not control for thedeterminants of disclosure policy, their inferences regarding the economic consequences of disclosure qualitymay be spurious (Cohen, 2003). Thus, we posit that corporate disclosure strategy affects disclosure quality,earnings quality (smoothing) and stock market valuation. We test for the value relevance of disclosure qualityfor stock price valuation because prior literature suggests that voluntary disclosure extending beyond financialperformance measures may actually be value relevant for investors as it helps bridge the growing gap betweentraditional financial statements and market valuation needs (Leuz, 2003; Botosan and Harris, 2000; Healy andPalepu, 2001). The following structural equations model summarizes the approach to be adopted in the empiricalanalysis:
Disclosure quality it =
f(Information costs, Financial condition, Control variables)i,t (1.1)
Earnings quality it =
f(Earnings target deviation, Disclosure quality, IAS/US GAAP, Control variables)i,t (1.2)
Stock market valuation it =
f(Equity, Earnings, Disclosure quality, IAS/US GAAP, Control variables)i,t (1.3)
Economic Determinants: Information economics theory suggests that the decision to voluntarily disclosesome information is (at least partially) a result of the assessment of the economic benefits to be derived fromthis additional disclosure by management. In the absence of disclosure, investors will bear some costs to collectand analyze data from other sources and reduce the price they are willing to pay for the firm’s shares (informationcosts) (Grossman, 1981; Milgrom, 1981). Since 2001, Indian firms are required to comply with either theIndian Accounting standards. The Institute of Chartered Accountants of India (ICAI) is the Indian accountingstandard-setting body. Its recommendations are largely non-mandatory in initial stage and very general in theircontent and later on its became mandatory for all firms. The market forces and investor interests are expectedto play a major role in the determination of a firm’s accounting policies. However, since few regulatory constraintsare imposed upon managers in financial reporting matters, the information disclosed by firms is likely to be lesscomparable across firms, and less reliable. Consequently, many firms simultaneously choose to use InternationalAccounting Standards (IAS)/ International Financial Reporting Standards(IFRS) to prepare their financialstatements. Complying with IAS/IFRS forces Indian firms to increase their disclosure. As such, it has beenshown that political costs and pressure from outside markets play a major role in the decision to voluntarilycomply with IAS. Overall, we can argue that an important portion of the information that is normally consideredas non-proprietary, such as the content of the notes to financial statements, becomes proprietary in the Indianenvironment. Consequently, the level of information costs to be incurred by shareholders a priori should behigh. This in turn makes it easier to capture the relationship between voluntary disclosure and the latter costs.Thus, when a firm commits to increased disclosure it can be deemed to be so because of the perceived potentialadvantage of reducing the transaction costs and minimizing adverse selection. This discussion allows us todraw the first research hypothesis:
H1: The level of information costs incurred by shareholders is positively related with the quality and quantity ofinformation disclosed by Indian firms.
The Relationship between Voluntary Disclosure or IAS/US GAAP Compliance and EarningsQuality: According to the smoothing hypothesis, income smoothing occurs when the accounting componentsof earnings, i.e. accruals, are managed to reduce the variability of reported earnings around some level considered
The Relationship Between Accounting Earnings, Stock Return Volatility and Corporate Disclosure Practices:
Gavesana Journal of Management / Vol. 3. Issue 1. / January 2011 - June 2011. 3
normal for the firm (Bartov, 1993; Leuz et al., 2003). At the firm-level, the literature generally suggests thatincome smoothing is used to manage earnings towards some predetermined level (e.g. last year’s earnings, thebonus target or the latest analysts’ consensus), to signal private information about the level of future cash flows(Dye, 1988), to protect managers’ job (Fudenberg and Tirole, 1995 and DeFond and Park, 1997) and/or tominimize borrowing costs and income taxes (Trueman and Titman, 1988 and Rozycki, 1997). Indian managerscan benefit from a legal, regulatory and economic environment that allows, if not encourages income smoothing,they also are susceptible to increased pressures from domestic and foreign investors who require moretransparency and accountability. According to Bhattacharya et al. (2003), income smoothing is associated withearnings opacity, reduces earnings informativeness, and ultimately results in an increase in the cost of equitycapital, and a decrease in trading volume. To the extent that 1) managers conceal their firm’s real economicperformance by smoothing earnings and that 2) market participants can detect earnings opacity but cannot seethrough it, managers who are more transparent and voluntarily disclose more information facilitate the detectionof income smoothing and the assessment of their firm’s real economic performance by market participants,thus exposing it to a reduction of its market value. Therefore, in a context where increased disclosure limitsfirms’ ability to smooth earnings, we can expect a reduction in the income smoothing behaviour of moreforthcoming firms. This allows us to draw the second research hypothesis (stated in the alternative form):
H2: The use of provisions to smooth earnings is negatively related to the quality and quantity of informationdisclosed by Indian firms.
Indian firms can also facilitate the detection of income smoothing by market participants if they complywith IAS/IFRS or US GAAP. Voluntary compliance with IAS/IFRS or US GAAP by Indian firms impliesadditional disclosure and renunciation of some discretion in accounting choices. The research study of Ashbaughand Pincus (2001), Leuz and Verrecchia (2000) and Ball et al. (2003) research studies shows that firms whovoluntarily comply with higher quality accounting standards facilitate information intermediation and earnsignificant economic benefits, suggesting that it improves market participants’ ability to assess firms’ realeconomic performance. Thus, consistent with the view that complying with international accounting standardsis likely to improve earnings quality and force firms to be more forthcoming, our third research hypothesis is:
H3: The use of provisions to smooth earnings is reduced for firms complying with IAS/US GAAP.
The Relationship between Earnings Quality and Stock Market Valuation: If increasing voluntarydisclosure or complying with IAS/IFRS or US GAAP effectively increases earnings quality, then earnings ofIndian firms that make such a commitment should have more relevance for stock market valuation. Thisproposition is consistent with two alternative scenarios: managerial discretion improves the ability of earningsto reflect economic value, or discretionary accruals are opportunistic but priced by an efficient market(Subramanyam, 1996). Hence, in light of the endogeneity between earnings quality and voluntary disclosure(or other attributes), the use a three-stage least square regression approach could lead to different conclusions.This allows us to draw the fourth and last research hypothesis:
H4: The relevance of earnings for stock market valuation is higher for firms complying with IAS/US GAAPcompared to firms complying with Indian GAAP.
Methodology
Sample : Sample firms are drawn from the BSE 100 Index, which comprises all the firms quoted on the BSE.All financial services firms are excluded because the financial industry is highly regulated and is subject tospecial disclosure requirements. Firms that were restructured or that ceased to be quoted during the periodstudied are also excluded. This results in a sample of 81 firms over the 2005-2009 periods, for a total of 408firm-year observations. The annual reports are obtained from the respective companies’ offices or from theirwebsites. Financial data is obtained from the CMIE Prowess Database Software.
The Relationship Between Accounting Earnings, Stock Return Volatility and Corporate Disclosure Practices:
4. Gavesana Journal of Management / Vol. 3. Issue 1. / January 2011 - June 2011.
Models
Economic Determinants: The following model is used to assess the relationship between voluntary disclosureand information costs:
DISCOREi,t = b0 + b1VOLi,t + b2DELTALEVi,t + b3FAMOWNi,t + b4INSTOWNi,t +b5CONOWNi,t + b6PERFi,t + b7LEVi,t + b8SIZEi,t -1 + b9FLISTi,t + b10BIG4i,t + b11IASUSi, t +YEARi,t + INDUSTRYi,t + ei,t
Dependent Variable Measurement: To determine the level of voluntary disclosure exhibited by Indianfirms, we develop a coding instrument that measures both the quality and the quantity of information includedin their annual reports. The disclosure index is developed using the information listed in the disclosure checklist.The contents of the annual report were examined and the scoring for the voluntary disclosures is done in theform of 1 and 0. If a disclosure item is present, then a score of (1) is given and if an item is not present then (0)is entered as the score. When a particular item was not applicable, the score of NA was entered. The entireannual report was scrutinized carefully before giving an item 0 or NA. The scores for each company were thenaggregated. The voluntary disclosure index for each of the companies was computed as TVD/MVD where theTVD is the Total voluntary disclosure in proportion to the MVD, the Maximum voluntary disclosure possible.The dependent variable is the voluntary disclosure index computed. This index is a relative index where thecompany’s score are adjusted to the items that are not relevant. The TVD and MVD are hence adjusted for anitem that is not relevant so that they are not penalized for not disclosing.
Independent Variables Measurement Information Costs
Trading volume (VOL): Trading allows for the release of private information to the market (Scott, 1994). It alsocreates a need for information for market participants who want to make an informed decision (Cormier andMagnan, 1999). By increasing their level of voluntary disclosure, firms can then reduce the need for investorsto engage in the collection of private information. Trading volume is measured by dividing the average dailytrading volume by the total number of shares outstanding. In accordance with hypothesis 1, trading volumeshould be positively associated with disclosure quality.
Financing needs (DELTALEV): Security issuance engenders information needs from investors who need toassess the appropriateness of the issuing price (Lang and Lundhom, 1993; Gibbins et al., 1990; Scott, 1994). Ifthe firm does not provide the necessary information, investors will then have to incur information costs toobtain it from other sources. It is difficult to obtain information about new financing. Therefore, we use year-to-year changes in the debt-to-equity ratio as a proxy for capital market reliance. Consistent with hypothesis 1, weexpect a positive association between financing needs and disclosure quality.
Ownership structure (FAMOWN; CONOWN; INSTOWN): The ownership structure of the firm can influence itsdisclosure strategy. Firms that are closely held, either by a single entrepreneur, a family group, or another firm,have less incentive to disclose proprietary information because the latter is already available to the owners(Chau and Gray, 2002). Three variables are used to characterize the ownership structure. Family ownership isthe total percentage of shares held by family groups. Institutional ownership is the total percentage of sharesowned by financial institutions, pension funds and other institutions. Finally, concentrated ownership is thetotal percentage of shares held by other blockholders. We expect a negative association between these threeownership structure variables and voluntary disclosure.
Control Variables
Accounting performance and leverage (PERF and LEV): According to Cormier et al. (2002), assessing themagnitude of potential proprietary costs associated with the disclosure of more private information is difficultbecause it requires the identification of all the parties that could use this information to the firm’s detriment.
The Relationship Between Accounting Earnings, Stock Return Volatility and Corporate Disclosure Practices:
Gavesana Journal of Management / Vol. 3. Issue 1. / January 2011 - June 2011. 5
Two variables are used to measure financial condition and to proxy for firms’ ability to support proprietarycosts: return-on-equity and leverage. We expect a positive association between stock market performance andvoluntary disclosure, and a negative relationship between leverage and voluntary disclosure.
Firm size (SIZE): Prior evidence on the relationship between firm size and the extent of voluntary disclosureconsistently supports a positive association (e.g. Lang and Lundholm, 1993; Scott, 1994; Cormier and Magnan,1999. We measure firm size as the log of total lagged assets. Consistent with prior findings, we predict apositive relationship between firm size and the extent of voluntary disclosure.
Foreign exchange listing (FLIST): Indian firms that are listed on foreign exchanges are likely to be subjected tomore pressure from capital markets. Consequently, these firms typically disclose more information to satisfygreater investor interest (Hope, 2003). As with Hope (2003), foreign exchange listing is measured as the weightednumber of stock exchanges a firm is listed on. Listings on U.S. exchanges are given a weight of 1.5 whereas allother listings are given a weight of 1. We expect a positive relationship between this variable and disclosurequality.
Quality of audit (BIG4): In a context of low mandated financial disclosure like India, we can expect the auditorto play an important role in improving firms’ overall reporting strategies (Hail, 2002). Empirical findingssuggest that firms reviewed by larger audit firms provide higher quality financial statements, ceteris paribus(Becker et al., 1998). We use a dichotomous variable taking the value of 1 if the firm is audited by a Big 4 firmand 0 otherwise to proxy for the quality of audit. We predict a positive relationship between this variable anddisclosure quality.
IAS/IFRS or US GAAP compliance (IASUS): Complying with IAS/IFRS or US GAAP is likely to force firms todisclose more information because these accounting frameworks are conventionally more informative andrestrictive covering a much larger scope of accounting policies with higher disclosure requirements (Babalyan,2001). We use a dichotomous variable taking the value of 1 if the firm is complying with IAS/IFRS or USGAAP and 0 otherwise. We expect a positive association between IASUS and the quality and quantity ofinformation disclosed by Indian firms.
Income Smoothing
The following model is proposed to capture the relationship between voluntary disclosure, IAS/IFRS orUS GAAP compliance and income smoothing:
PROVDEPi,t = b0 + b1ETDi,t + b2DISCOREi,t + b3ETD*DISCOREi,t + b4IASUSi,t + b5ETD*IASUSi,t +b6CAPASSETSi,t-1 + b7REVENUESi,t -1 + YEARi,t + ei,t
Dependent Variable Measurement
Notwithstanding the accounting standards they use (IAS/IFRS or Indian GAAP) Indian firms are allowedto revalue their fixed assets. Furthermore, they are encouraged to take provisions to project an image of financialstability. Therefore, to assess the extent of income smoothing and its relationship with voluntary disclosure inIndia, we focus on one specific smoothing technique: the use of provisions.
While discretionary provisions are allowed under only “substantial” additions or reductions in their level,and not their level per se, had to be reported in a footnote to the annual financial statements, with “substantial”being left undefined. Consequently, we observe a considerable level of variability in the type of provisions usedand the information disclosed regarding these provisions. To the extent that our objective is to measure thelevel of the provisions recorded and not to capture firms’ disclosure behaviour with regard to these provisions(our disclosure index already includes a section on provisions), we limit this variability by using the totalamortization expense as a proxy for the level of provisions. Furthermore, Hillier and McCrae (1998) show thatsystematic depreciation smoothes under-depreciated earnings numbers. In order to control for potential size
The Relationship Between Accounting Earnings, Stock Return Volatility and Corporate Disclosure Practices:

6. Gavesana Journal of Management / Vol. 3. Issue 1. / January 2011 - June 2011.
effects, our dependent variable is scaled by lagged assets.
Independent Variables Measurement - Voluntary Disclosure, IAS/US Compliance and IncomeSmoothing
Earnings target deviation (ETD): To test income smoothing, the level around which income is smoothed mustbe specified. To the extent that Indian firms use smoothing to project an image of financial stability, it is likelythat their most important target is the previous period’s earnings. Similar to Bartov (1993), we define oursmoothing variable as the change in annual net earnings exclusive of depreciation and provision, scaled bylagged assets. We predict a positive relationship between earnings target deviation and the provision/depreciationexpense.
Disclosure score (DISCORE): There is no reason to expect any a priori association between the total amortizationexpense and the extent of voluntary disclosure. Consequently, no prediction is made as to the sign of thisvariable.
Interaction between earnings target deviation and the disclosure score (ETD*DISCORE): To test oursecond research hypothesis, we build an interaction term between earnings target deviation and the disclosurescore. If firms that disclose more indeed reduce the extent to which they use the amortization expense tosmooth earnings, the association between amortization and the interaction term should be negative.
IAS/IFRS or US GAAP compliance (IASUS): There is no reason to expect any a priori association between thetotal amortization expense and IAS/IFRS or US GAAP compliance. Consequently, no prediction is made as tothe sign of this variable.
Interaction between earnings target deviation and IAS/IFRS or US GAAP compliance (ETD*IASUS): To testour third research hypothesis, we build an interaction term between earnings target deviation and IAS/IFRS orUS GAAP compliance. If firms that disclose more indeed reduce the extent to which they use the amortizationexpense to smooth earnings, the association between amortization and the interaction term should be negative.
Control variables: Capital assets (CAPASSETS): The amortization expense more than likely depends on thelevel of capital assets. However, including the current year’s capital assets could introduce multicollinearity inour model, as the amortization expense is already included in their ending balance. To avoid such problem, wetherefore use lagged capital assets scaled by lagged total assets. We predict a positive relationship betweencapital assets and the amortization expense.
Revenues (REVENUES): We also include lagged revenues scaled by lagged assets in our model as a measure ofthe level of operating activities. We can expect that the higher the level of operating activities, the higher theamortization expense will be.
Earnings Quality and Stock Market Valuation
To assess how Indian investors readjust the relationship between reported earnings and a firm’ stock pricein a context where earnings are potentially subject to smoothing, we split earnings into two components: (1)earnings before depreciation and provisions and (2) depreciation/provisions expense. The following model isused (Kothari and Zimmerman, 1995):
MVEQUITYi,t = b0 + b1EQUITYi,t + b2(EARNINGS+PROVDEP)i,t + b3PROVDEPi,t + b4PROVDEP*IASUSi,t +b5IASUSi,t + YEARi,t + ei,t
From this equation, the coefficient b2 provides an estimate of the relative cost of equity for Indian firms aswell as an indication of the usefulness of reported earnings. All variables are scaled by lagged total assets.
The Relationship Between Accounting Earnings, Stock Return Volatility and Corporate Disclosure Practices:

Gavesana Journal of Management / Vol. 3. Issue 1. / January 2011 - June 2011. 7
Results
Disclosure Score: Table 1 presents the evolution of the disclosure score and its “quality” and “quantity”components over the period studied. Between 2005 and 2009, the mean aggregate score has increased from0.368 to 0.424, showing a steady improvement in the extent of voluntary disclosure by Indian firms. Looking atthe specific components of the score, the results show a similar trend, i.e. that the improvement in the aggregatescore is caused by an increase in both the quality and quantity of information disclosed. Overall, these statisticsseem to suggest that Indian managers are not indifferent to the pressures for greater transparency exerted bydomestic and foreign investors.
Table 1 : Disclosure Score
Year N Mean STD MIN MAX2005 81 0.368 0.168 0.000 0.6942006 81 0.381 0.164 0.000 0.6942007 81 0.398 0.159 0.000 0.7222008 81 0.410 0.161 0.000 0.7222009 81 0.424 0.155 0.056 0.722
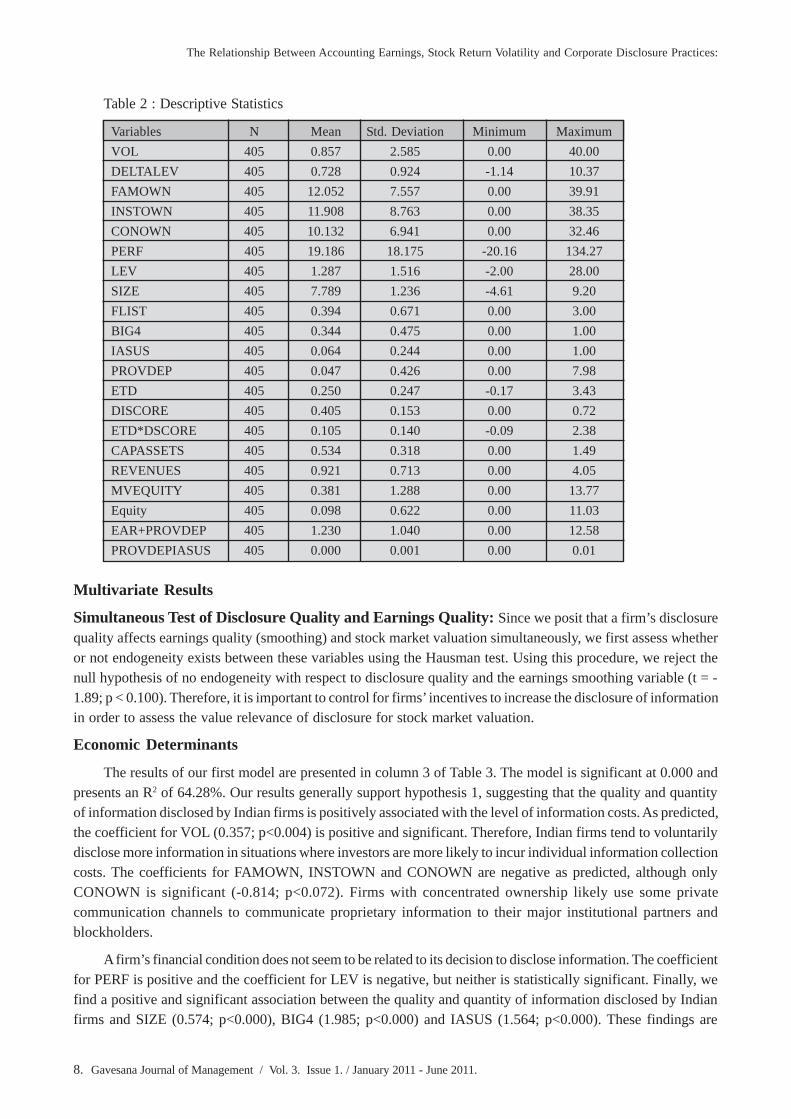
Other Variables: Table 2 provides details on the mean, standard deviation, minimum and maximum valuesof the variables used in the three proposed models. According to Table 2, the average firm in our sample islarge, highly leveraged and profitable. Its ownership structure is relatively concentrated with the mean totalfamily, institutional and other block ownership reaching 12.052%, 11.908% and 110.132% respectively. Theaverage sample firm is audited by a Big 4 auditor and is listed on 0.394 foreign stock exchanges. It enjoys areduction of its leverage ratio and relatively positive trading volume. Ten of sample firms comply with IAS/IFRS or US GAAP.
The Relationship Between Accounting Earnings, Stock Return Volatility and Corporate Disclosure Practices:
8. Gavesana Journal of Management / Vol. 3. Issue 1. / January 2011 - June 2011.
Table 2 : Descriptive Statistics
Variables N Mean Std. Deviation Minimum MaximumVOL 405 0.857 2.585 0.00 40.00DELTALEV 405 0.728 0.924 -1.14 10.37FAMOWN 405 12.052 7.557 0.00 39.91INSTOWN 405 11.908 8.763 0.00 38.35CONOWN 405 10.132 6.941 0.00 32.46PERF 405 19.186 18.175 -20.16 134.27LEV 405 1.287 1.516 -2.00 28.00SIZE 405 7.789 1.236 -4.61 9.20FLIST 405 0.394 0.671 0.00 3.00BIG4 405 0.344 0.475 0.00 1.00IASUS 405 0.064 0.244 0.00 1.00PROVDEP 405 0.047 0.426 0.00 7.98ETD 405 0.250 0.247 -0.17 3.43DISCORE 405 0.405 0.153 0.00 0.72ETD*DSCORE 405 0.105 0.140 -0.09 2.38CAPASSETS 405 0.534 0.318 0.00 1.49REVENUES 405 0.921 0.713 0.00 4.05MVEQUITY 405 0.381 1.288 0.00 13.77Equity 405 0.098 0.622 0.00 11.03EAR+PROVDEP 405 1.230 1.040 0.00 12.58PROVDEPIASUS 405 0.000 0.001 0.00 0.01
Multivariate Results
Simultaneous Test of Disclosure Quality and Earnings Quality: Since we posit that a firm’s disclosurequality affects earnings quality (smoothing) and stock market valuation simultaneously, we first assess whetheror not endogeneity exists between these variables using the Hausman test. Using this procedure, we reject thenull hypothesis of no endogeneity with respect to disclosure quality and the earnings smoothing variable (t = -1.89; p < 0.100). Therefore, it is important to control for firms’ incentives to increase the disclosure of informationin order to assess the value relevance of disclosure for stock market valuation.
Economic Determinants
The results of our first model are presented in column 3 of Table 3. The model is significant at 0.000 andpresents an R2 of 64.28%. Our results generally support hypothesis 1, suggesting that the quality and quantityof information disclosed by Indian firms is positively associated with the level of information costs. As predicted,the coefficient for VOL (0.357; p<0.004) is positive and significant. Therefore, Indian firms tend to voluntarilydisclose more information in situations where investors are more likely to incur individual information collectioncosts. The coefficients for FAMOWN, INSTOWN and CONOWN are negative as predicted, although onlyCONOWN is significant (-0.814; p<0.072). Firms with concentrated ownership likely use some privatecommunication channels to communicate proprietary information to their major institutional partners andblockholders.
A firm’s financial condition does not seem to be related to its decision to disclose information. The coefficientfor PERF is positive and the coefficient for LEV is negative, but neither is statistically significant. Finally, wefind a positive and significant association between the quality and quantity of information disclosed by Indianfirms and SIZE (0.574; p<0.000), BIG4 (1.985; p<0.000) and IASUS (1.564; p<0.000). These findings are
The Relationship Between Accounting Earnings, Stock Return Volatility and Corporate Disclosure Practices:

Gavesana Journal of Management / Vol. 3. Issue 1. / January 2011 - June 2011. 9
consistent with the previous literature. They suggest that larger firms that likely benefit from lower informationpreparation and disseminating costs voluntarily disclose more information. They also imply that auditors playa key role in ensuring that Indian firms disclose more than what is required under their largely unregulatedenvironment. Finally, they support the assumption that firms complying with IAS/IFRS or US GAAP mustincrease their disclosure.
To assess the robustness of our results, we replicate the analysis using the two following recomputeddependent variables. First, consistent with Lang and Lundholm (1993), Botosan (1997) and Hail (2002), wecompute rank scores calculated by dividing the rank of a firm’s DISCORE by the number of firms included inthe sample. This procedure allows for the study of the economic determinants of corporate disclosure qualityby comparing firms with one another, instead of on an arbitrary base of 20 points. Second, we standardize thedisclosure score by the year median. Our results remain virtually similar in both cases. Overall, as predicted byH1, we conclude that Indian firms’ disclosure strategy is associated with the level of information costs faced byinvestors.
Table 3 : Regression Result Total Sample
Variables Predicted Sign DISCLOSURE SMOOTHING MARKET VALUE OFEQUITY
VOL + 0.357 (0.004)
DELTALEV + 0.004 (0.215)
FAMOWN - -0.332 (0.311)
INSTOWN - -0.822 (0.086)
CONOWN - -0.814 (0.072)
PERF + 1.043 (0.321)
LEV - -0.008 (0.345)
SIZE + 0.574 (0.000)
FLIST + -0.0765 (0.238)
BIG4 + 1.985 (0.000)
IASUS ? 1.564 (0.000)
ETD + 0.443 (0.008)
DISCORE ? 0.0058 (0.652)
ETD*DSCORE - -0.004 (0.213)
The Relationship Between Accounting Earnings, Stock Return Volatility and Corporate Disclosure Practices:

10. Gavesana Journal of Management / Vol. 3. Issue 1. / January 2011 - June 2011.
IASUS ? 0.0009 (0.030)
ETD*IASUS - -0.165 (0.000)
CAPASSETS + 0.074 (0.000)
REVENUES + 0.0007 (0.000)
EQUITY + 6.321 (0.000)
EAR+PROVDEP + 5.896 (0.000)
PROVDEP - -3.764 (0.043)
IASUS ? 0.561 (0.000)
PROVDEP*IASUS - -0.003 (0.007)
N 405 405 405R2 64.28% 23.51% 50.21%Chi2 Probability 0.000 0.000 0.000
Year- and industry-specific coefficients not presentedOne-tailed if predicted sign and in the right direction
Income Smoothing: The results for the income smoothing model are presented in column 4 of Table 3. Themodel is significant at 0.000 and presents an adjusted R2 of 23.5%. Our results show a significantly positiveassociation between PROVDEP and ETD (0.443; p<0.008), suggesting that Indian firms use their amortizationexpense to smooth earnings. As predicted, lagged revenues (0.007; p<0.000) and capital assets (0.074; p<0.000)are both positively associated with the amortization expense, and their coefficients are significant. H2 concerningthe relationship between voluntary disclosure and income smoothing is not supported since the coefficient forETD*DISCORE is negative but not significant (-0.004; p<0.213). However, consistent with H3, the coefficientfor ETD*IASUS is negative and highly significant (-0.165; p<0.000). These results suggest that in India, thedecision to comply with international standards has a greater impact on earnings quality than voluntary disclosure.
Stock Market Valuation: The results for the stock market valuation model are presented in column 5 ofTable 3. The model is significant at 0.000 and presents an adjusted R2 of 50.21%. Our results show a negativeand significant association between PROVDEP and stock price (-3.764; p<0.043). Consistent with H4, theinteraction term PROVDEP*IASUS is also negative and significant (-0.003; p<0.007) suggesting that therelevance of earnings for stock market valuation is higher for firms complying with IAS/IFRS or US GAAPcompared to firms complying to Indian GAAP.
When the model is estimated with an OLS regression (results not tabulated), the coefficient for the variablePROVDEP is not significant (-3.159; p < 0.211 one-tailed) while the coefficient for the interaction termPROVDEP*IASUS is negative and significant (-0.006; p < 0.008 one-tailed). This result suggests that it isnecessary to control for endogeneity when we look at the value relevance of earnings. It could also mean thatinvestors see through earnings quality. There is no relationship between a smoothed earnings component amountand market valuation. However, when we control for other firm attributes such as voluntary disclosure, resultssuggest that investors consider the smoothed figure for stock pricing.
The Relationship Between Accounting Earnings, Stock Return Volatility and Corporate Disclosure Practices:

Gavesana Journal of Management / Vol. 3. Issue 1. / January 2011 - June 2011. 11
To assess the sensitivity of our results to the choice of amortization expense as the smoothing vehicle, wefirst alternatively use the total provisions disclosed in the statement of cash flows as our dependent variable andrecompute our smoothing variable and interaction term accordingly. The results of this analysis must be interpretedwith caution as Indian firms benefit from considerable discretion in the choice of what is disclosed. Consequently,we are unable to make sure that the measurement of our dependent variable is constant. Nevertheless, ourresults (not presented) are generally consistent with those presented in Table 3.
Second, given the importance of IAS/US GAAP compliance on earnings quality, we split the samplebetween Indian GAAP and IAS/US GAAP compliers. Results presented in table 4 do not show significantdifferences for determinants of disclosure quality. As for determinants of income smoothing, results (Columns4 of Table 4 and 5) suggest that the extent of voluntary disclosure reduces smoothing for Indian GAAP (coefficient:-0.243; p<0.000) firms while we do not document any smoothing for IASUS firms. Moreover, results presentedin columns 5 of table 4 and 5 show that the relevance for stock market valuation of earnings subject to smoothing(PROVDEP) is only significant for IASUS firms (coefficient: -4.519; p<0.621 for Indian GAAP firms, and –8.970; p<0.043 for IASUS firms).
Table 4 : Regression Result Indian Gaap Firm
Variables Predicted Sign DISCLOSURE SMOOTHING MARKET VALUE OFEQUITY
VOL + 0.587 (0.031) DELTALEV + 0.019
(0.412) FAMOWN - 0.531
(0.612) INSTOWN - 4.521 (0.005) CONOWN - -0.097
(0.527) PERF + 15.398
(0.000) LEV - -0.021
(0.521) SIZE + 1.234
(0.000) FLIST + -0.431
(0.621) BIG4 + 2.363
(0.000) ETD + 2.812
(0.000) DISCORE ? 0.006
(0.000) ETD*DSCORE - -0.243
(0.000) CAPASSETS + 0.006
(0.621)
The Relationship Between Accounting Earnings, Stock Return Volatility and Corporate Disclosure Practices:

12. Gavesana Journal of Management / Vol. 3. Issue 1. / January 2011 - June 2011.
REVENUES + -0.005 -0.731 EQUITY + 2.314
(0.004)EAR+PROVDEP + 10.432
(0.000)PROVDEP - -4.519
(0.621)N 355 355 355R2 59.32% 38.30% 54.34%Chi2 Probability 0.000 0.000 0.000
Table 5 : Regression Result us Gaap
Variables Predicted Sign DISCLOSURE SMOOTHING MARKET VALUE OFEQUITY
VOL + 0.411 (0.081)
DELTALEV + 0.004 (0.412) FAMOWN - -1.123
(0.038) INSTOWN - -5.498
(0.000) CONOWN - -0.846
(0.099) PERF + -0.861
(0.0851) LEV - 0.001
(0.947) SIZE + 0.532 (0.000) FLIST + 0.035
(0.509) BIG4 + 0.865
(0.075) ETD + -0.087
(0.530) DISCORE ? 0.002
(0.345) ETD*DSCORE - 0.021
(0.276) CAPASSETS + 0.078
(0.000) REVENUES + 0.015
(0.000)
The Relationship Between Accounting Earnings, Stock Return Volatility and Corporate Disclosure Practices:

Gavesana Journal of Management / Vol. 3. Issue 1. / January 2011 - June 2011. 13
EQUITY + 8.419 (0.000)
EAR+PROVDEP + 9.741 (0.000)
PROVDEP - -8.970 (0.043)
N 50 50 50R2 61.23% 35.89% 57.90%Chi2 Probability 0.000 0.000 0.000
Table 6 : Correlation
Variables DISCORE VOL DELTALEV FAMOWN INSTOWN CONOWN PERF LEV SIZEDISCORE 1 VOL 0.04 1 DELTALEV 0.199** 0.023 1 FAMOWN -.119* -0.046 0.031 1 INSTOWN -.111* -.114* .159** .221** 1 CONOWN -0.03 .224** .175** -0.003 0.004 1 PERF 0.072 0.038 -.293** -0.084 -0.069 -.115* 1 LEV -0.095 -0.02 .381** -0.024 0.018 0.015 -.121* 1 SIZE .158** -.236** 0.071 .105* 0.05 -0.084 -.127* 0.032 1FLIST .137** -0.051 -0.085 .285** 0 0.041 -0.096 -0.008 .161**BIG4 -.166** 0.008 0.01 .119* -0.023 .108* 0.053 -0.045 -0.044IASUS .284** -0.022 -.184** -0.066 -0.002 0.012 0.09 -0.05 0.075
**. Correlation is significant at the 0.01 level (2-tailed).*. Correlation is significant at the 0.05 level (2-tailed).
Conclusion
This study investigates corporate disclosure quality in India, a country where firms face low-mandateddisclosure requirements. Our analysis of the evolution of the mean disclosure scores between 2005 and 2009shows a steady increase over the period, suggesting that Indian managers are not indifferent to the pressures forgreater transparency exerted by domestic and foreign investors. Nevertheless, a great degree of variability isexhibited across firms. In this context, why are some firms disclosing more than required? As suggested by theinformation economics theory, we expect the level of voluntary disclosure to be positively related to theinformation costs borne by investors, and control for firms’ ability to support proprietary costs. Our resultsgenerally support our hypothesis, suggesting that Indian firms assess the benefits of additional disclosure beforeeffectively releasing more private information. Due to their unique legal, regulatory and economic environment,Indian firms have strong incentives to smooth earnings. To the extent that increased disclosure facilitates thedetection of income smoothing by market participants, we hypothesize that such a commitment limits Indianfirms’ ability to smooth earnings. Similarly, we predict that firms complying with IAS/IFRS or US GAAPreduce their income smoothing behaviour. We focus on the amortization expense as a means of smoothingincome. We find evidence of increased disclosure limiting the use of depreciation to smooth earnings for firmswho comply with Indian GAAP. Furthermore, we show that firms who comply with IAS/IFRS or US GAAPreduce the extent to which they use amortization to smooth earnings. Therefore, our results suggest that thebenefits of more stringent accounting standards include an increase in earnings informativeness and that lower
The Relationship Between Accounting Earnings, Stock Return Volatility and Corporate Disclosure Practices:

14. Gavesana Journal of Management / Vol. 3. Issue 1. / January 2011 - June 2011.
disclosure may be necessary for earnings smoothing to be possible in an environment where accounting standardsprovides extensive discretion in corporate disclosure. Finally, we assess how Indian investors readjust therelationship between reported earnings and a firm’ stock price in a context where earnings are subject tosmoothing. We expect the relevance of earnings for stock market valuation to be higher for firms complyingwith IAS/IFRS or US GAAP. Our results support our prediction. When we partition our sample between firmscomplying with Indian GAAP and firms complying with IAS/IFRS or US GAAP, we further find that depreciationis only value-relevant for the latter group. Overall, our evidence is consistent with stock market participantsbeing able to see through earnings smoothing to price earnings when appropriate information is disclosed.
Scope of Future Research:
Future research should examine other capital market consequences of increased disclosure by Indianfirms. Potentially interesting research questions include the impact of greater transparency on the level ofinformation asymmetries between managers and investors and the accuracy of analysts’ forecasts. It would alsobe interesting to extend the sample to a longer period, and particularly beyond 2009 when Indian firms will berequired to comply with IAS/IFRS.
References
Ashbaugh, H. and M. Pincus (2001), “Domestic Accounting Standards, International Accounting Standards,and Predictability of Earnings.” Journal of Accounting Research 39(3): 417-434.
Babalyan, L. (2001), “Association Between Accounting Earnings and Stock Returns as a Measure of ValueRelevance of Accounting Standards: Empirical Evidence from the Swiss Market”, Working Paper, Universityof Fribourg, Switzerland.
Ball, R., A. Robin and J.S. Wu (2003), “Incentives Versus standards: Properties of Accounting Income infour Asian Countries, and Implications for Acceptance of IAS”. Journal of Accounting and Economics 36(1-3):235-270.
Bartov, E. (1993), “The Timing of Asset Sales and Earnings Manipulation.” The Accounting Review 68(4):840-855.
Becker, C., DeFond, M., Jiambalvo, J., Subramanyam, K., (1998), “The Effect of Audit Quality on EarningsManagement.” Contemporary Accounting Research 15(1), 1-24.
Botosan, C. A. (1997), “Disclosure Level and the Cost of Equity Capital.” The Accounting Review(July): 323-349.
Botosan, C.A. and M.S. Harris (2000), “Motivation for a change in disclosure Frequency and its Consequences:An Examination of Voluntary Quarterly Segment Disclosures.” Journal of accounting Research 38(2): 329-352.
Chau, G. K. and S. J. Gray (2002), “Ownership Structure and Corporate Voluntary Disclosure in Hong Kongand Singapore.” The International Journal of Accounting 37(2): 247-265.
Cormier, D. and M. Magnan (1999), “Corporate Environmental Disclosure Strategies: Determinants, Costs andBenefits.” Journal of Accounting, Auditing and Finance 14(3): 215-241.
Cormier, D., Magnan, M., Van Velthoven, B., (2002), “Environmental Disclosure Quality: Do Firms Respondto Economic Incentives, Public Pressures or Institutional Conditions?” European Accounting Review, 2005.
DeFond, M. L. and C. W. Park (1997), “Smoothing Income in Anticipation of Future Earnings.” Journal ofAccounting and Economics 23: 115-139.
The Relationship Between Accounting Earnings, Stock Return Volatility and Corporate Disclosure Practices:

Gavesana Journal of Management / Vol. 3. Issue 1. / January 2011 - June 2011. 15
Fudenberg, D. and J. Tirole (1995), “A Theory of Income and Dividend Smoothing Based on IncumbencyRents.” Journal of Political Economcy 103(February): 75-93.
Gibbins, M., Richardson, A., Waterhouse, J., (1990), “The Management of Corporate Financial Disclosure:Opportunitism, Ritualism, Policies, and Processes.” Journal of Accounting Research 28(1), 121-143.
Grossman, S. (1981), “The Informational Role of Warranties and Private Disclosure About Product Quality.”Journal of Law and Economics(December): 461-484.
Hail, L., (2002), The Impact of Voluntary Corporate Disclosures on the Ex Ante Cost of Capital for SwissFirms. Working Paper, University of Zurich.
Healy, P. and K. Palepu (2001), “Information Asymmetry, Corporate Disclosure, and the Capital Markets.”Journal of Accounting and Economics 31(1-3): 405-440.
Hillier, J. and M. McCrae (1998), “The Earnings Smoothing Potential of Systematic Depreciation.” Abacus34(1): 75-92.
Hope, O.-K. (2003), “Disclosure Practices, Enforcement of Accounting Standards and Analysts’ ForecastAccuracy: An International Study.” Journal of Accounting Research 41(2): 235-273.
Hope, O.-K. (2003), “Accounting Policy Disclosures and Analysts’ Forecasts.” ContemporaryAccounting Research 20(2): 295-321.
Kothari, S.P. and J. Zimmerman. (1995), “‘Price and Return Models”. Journal of Accounting and Economics20(2): 155-192.
Lang, M. and R. Lundholm (1993), “Cross-Sectional Determinants of Analyst Ratings of Corporate Disclosures.”Journal of Accounting Research 31(2): 246-271.
Leuz, C. (2003), “IAS Versus U.S. GAAP: Information Asymmetry-Based Evidence from Germany’s NewMarket.” Journal of Accounting Research 41(3): 445-472.
Leuz, C. and R. E. Verrecchia (2000), “The Economic Consequences of Increased Disclosure.” Journal ofAccounting Research 38(1): 91-124.
Leuz, C., D. Nanda and P.D. Wysocki (2003), “Earnings Management and Investor Protection: An InternationalComparison.” Journal of Financial Economics 69: 505-527.
Milgrom, P. (1981), “Good News and Bad News: Representation Theorems and Applications.” BellJournal of Economics(Autumn): 380-391.
Rozycki, J. J. (1997), “A Tax Motivation for Smoothing Earnings.” Quarterly Review of Economics andFinance 37(Summer): 563-578.
Scott, T. (1994), “Incentives and Disincentives for Financial Disclosure: Voluntary Disclosure ofDefined Benefit Pension Plan Information by Canadian Firms.” The Accounting Review 69(January): 26-43.
Subramanyam, K.R. (1996), “The Pricing of Discretionary Accruals.” Journal of Accounting and Economics22: 249-281.
Trueman, B. and S. Titman (1988), “An Explanation of Accounting Income Smoothing.” Journal of AccountingResearch 26(Suppl.): 127-139.
The Relationship Between Accounting Earnings, Stock Return Volatility and Corporate Disclosure Practices:

16. Gavesana Journal of Management / Vol. 3. Issue 1. / January 2011 - June 2011.
Leadership Theory from a Communication Style Perspective:A Critical Analysis
Vinay Kumar Chaganti* and Nalini Bikkina**Abstract
In terms of small group research, there is a criticism that leadership theory is a better metaphor comparedto communication style theory. The reason quoted was the emphasis laid on interaction. Surprisingly, it isobserved that there is a stream of research in communication style theory that stresses on the superior-subordinaterelationship and subordinates’ satisfaction with supervision. While the dyadic studies, in general, can beapproached from leadership theory perspective, communication style theory cannot be discounted. After all, allhuman behaviour is some kind of communicative act and all acts are performed with some style. This studycritically analysed the Stogdill’s Leader Behaviour Description Questionnaire which was a result of muchfamed Ohio studies from the view point of Norton’s theory of Communication Style. The links between theoriesare observed, reported and described. Propositions for possible empirical studies are also presented with otherdiscussion.
Keywords: Leader Behaviour Description Questionnaire, Communication Style, Interpersonal Communication,Small group research, Leadership theory, Concept Paper
Introduction
Of all definitions of who makes a leader, one point seems always acceptable; that leader should be a notchbetter than others in the group in at least one dimension. Invariably that dimension happens to be communication.Not all good communicators can be leaders; however, being a good communicator is a necessary qualificationto be a leader. Where there is a leader, there must be a follower and there must have been an interaction. Wherethere was an interaction there was communication; and it must have been effective to attribute roles to theindividuals/groups in interaction as leaders and followers. The role of communication in who becomes a leadercannot be refuted. One needs to also understand that the use of word, communication, must be seen in a broadersense here. The sacred principle is: one cannot not communicate (Watzlawick, Beavin and Jackson, 1967); inthat, any act or any behaviour one exhibits is some form of communication or another. The same applies tobehaviours or acts that make leaders or are classified as being traits of leaders. There is always a way to studyleadership from a interpersonal communication perspective.
In interpersonal communication theory, three constructs got scholars attention most: communicationcompetence (Spitzberg & Cupah, 1984), communication skills (Wellford, 1980), and communication styles(Norton, 1978). The differences in between communication competence and communication skills are subtlewith difference if any in the approach to study and the orientation. While communication competence has beenstudied mostly with the relational significance of communication in focus, communication skills are studiedmostly as an ability that can be trained for and as communication being instrumental in creating economicvalue. In that sense, communication competence is studied in dyadic contexts, while communication skills arestill studied at individual level. Communication styles however have a different development. While the constructreceived significant attention before 1970s, efforts to generalize have been nominal. Once there was a generalizedcommunication style construct for research pursuit, there was heightened emphasis laid on it for about twodecades. And again since the last two decades there seems to be almost no research in this area. Google Scholarsearch showed interesting results. There are 500 studies with communication style in title, while there are close
*Vinay Kumar Chaganti, Assistant Professor, MVGR College of Engineering, E-mail: [email protected]**Nalini Bikkina, Assistant Professor, GITAM University.

Gavesana Journal of Management / Vol. 3. Issue 1. / January 2011 - June 2011. 17
to 15000 studies making a reference to the construct (as browsed on 31st March, 2011). That speaks a lot aboutthe importance of this construct, yet at the same time, lack of attention in developing theory around it.
Today, there is a niche community of scholars trying to resurrect this area, building a new approach thatcan stabilize the discipline. However, it pays heed to look into the reasons cited for recent lack of interest incommunication style. One of them was an argument that communication competence can encompasscommunication style. It is now a philosophical debate between adaptive communication style beingcommunication competence and communication competence being the reason for adaptability. This authorholds a view that it is worthwhile establishing a connection with what is proximate and observable. Thuscommunication style tends to be the starting point to perhaps define communication competence and relookassociated theories accordingly. This means that communication style is more descriptive while communicationcompetence is evaluative. Eventually, one might argue adaptive communication style is an evaluative function,but that comes only after an observation is made; in which case, communication style is a more proximatevariable. Thus was the choice of analyzing leadership theory from a communication style view point. Anotherargument that has limited the development of theory is that small group research and leadership theory can bebetter metaphors to understand organizational behaviour and development. However, one needs to understand,as stated earlier, that there is always a scope to explain behaviour in terms of communicative acts. To demonstratethis point, the author chose to analyze an established leadership theory from a communication style perspective.Thus Stogdill’s Leader Behaviour Description Questionnaire (Form XII) was chosen, and its items were analyzedfor finding if they point to specific communication styles.
Next two sections present an introduction to Stogdill’s LBDQ and Norton’s Communication Style. Thenext section presents an itemized analysis of LBDQ from a Norton’s perspective and makes empirically testablepropositions. Section after that presents other efforts that are in line with this study and offers a conclusion. Thelast section presents the current directions of research in communication style and proposes a new line ofresearch connecting communication styles and leadership.
Stogdill’s Leader Behaviour Description Questionnaire
LBDQ Form XII, as it is most commonly referred to, and its manual were obtained from Fisher College ofBusiness, Ohio State University. The manual gives an insight into the work that went into developing theinstrument. The early efforts to make this instrument began in 1949, and went for a decade before one versionwas developed. After another three years, the next version came out, which is more used more like a standardin assessing leadership behaviours. It has been either used or cited in more than 1700 studies, and its structuralvalidity and reliability have been repeatedly found to be consistent. The same has been used for this study. Theinstrument has 100-items and collects responses on a 5-point likert scale. It can be administered to individuals/groups that have had an opportunity to observe their superior/leader and offer their views about the observedleadership behaviour. The instrument assesses 12-dimensions of leadership behaviour. Each dimension isexplained by a complex set of behaviours. The dimensions and their leader behaviours are given below:
1. Representation: Speaks and acts as the representative of the group
2. Demand reconciliation: Reconciles conflicting demands and disorder to system
3. Tolerance of uncertainty: Is able to tolerate uncertainty and postponement without anxiety or upset
4. Persuasiveness: Uses persuasion and argument effectively; strong convictions
5. Initiation of structure: Clearly defines own role, and lets know what is expected
6. Tolerance and Freedom: Allows followers scope for initiative, and action
7. Role Assumption: Actively exercises the leadership role rather surrendering leadership to others
Critical analysis of a leadership theory from a communication style perspective

18. Gavesana Journal of Management / Vol. 3. Issue 1. / January 2011 - June 2011.
8. Consideration: Regards the comfort, well being, status, and contributors of followers
9. Production Emphasis: Applies pressure for productive output
10. Predictive Accuracy: Exhibits foresight and ability to predict accurately
11. Integration: Maintains a closely knit organizations; resolves member conflicts
12. Superior Orientation: Maintains cordial relations with superiors; influence with them; is striving for higherstatus
An overview of LBDQ already gives an impression that communication is interspersed with its theory.For example, persuasiveness is a construct that is more studied in communication theory. It is well-understoodthat these 12-dimensions of leadership are interconnected with each other, meaning that communicativebehaviours are to be found everywhere. In fact, a closer observation would reveal that all dimensions are eitherdirect communicative acts or need communication as means.
Norton’s Communication Style Theory
Communication style refers to a characteristic way of communicating. It consists of an identifiable patternof linguistic, vocal and nonverbal behaviours which are distinguishable from others’ behavioural patterns. Thefundamental idea of communication style is ‘how’ communication happens more than ‘what’ is beingcommunicated. Norton (1979) defined communication style as the way one verbally and paraverbally interactsto signal how literal meaning should be taken, interpreted, filtered or understood. It serves two critical functions:firstly, form-giving function, in that meaning to what is communicated depends on how it is communicated,thereby making communication style a form of meta communication; secondly, norm-defining function, in thata pattern of behaviours put together explaining one’s choice of communication style can be used to categorizeindividuals and expect the pattern to be reproduced relatively consistently.
The inspiration behind work towards a generic communication style construct, as Norton indicates, isinvolved in partly in the study of leadership theory. For example, as early as 1950s, Bushard found that fromamong a group of men, leaders could be separated based on the exhibited communication pattern. The effect ofcommunication style seemed so large that it was being studied in various domains such as healthcare, sociology,legal issues, and even technology.
Norton’s effort has summed up the then research to identify the theory that can contribute to a genericcommunication style construct. He conceived ten independent variables, also called the subconstructs orcommunication styles, namely animated, attentive, contentious, dominant, dramatic, friendly, impression-leaving,open, precise, and relaxed. With them, he also proposed another dependent variable called communicator image,a measure of one’s own view of how good a communicator one is. He found literature supporting his conceptionof styles and stuck to them. In the initial stages, there were questions posed on the sufficiency of the number ofstyles mentioned in representing all of what is possible. However, he explained that communication style, bynature, is multicollinear and that more than one style can be seen at any instance. Therefore it was possible toexplain any communication style, such as assertive communication style, in terms of combinations of thesefundamental styles proposed. Assertive communication style for instance was found to be a combination of lowanxiety, high dominance, and relaxed communication styles. When there is a possibility to explain communicativebehaviours within the scope of existing theory, there was no need to add to the list of variables. There issignificant literature that shows how Norton’s communication styles were used in combinations, with differentlabels, to point to specific communicative behaviours.
Analysis of LBDQ from Communication style perspective
This section presents the items from each dimension of LBDQ, scrutinizes the items to identify the communicationstyles that might be required to exhibit that specific dimension, and makes empirically testable propositions.
Critical analysis of a leadership theory from a communication style perspective

Gavesana Journal of Management / Vol. 3. Issue 1. / January 2011 - June 2011. 19
There are 12-dimensions that LBDQ assesses, each of which is analyzed below from Norton’s communicationstyle theory perspective.
# Representation (5-items)
1 Acts as the spokesperson of the group
11 Publicizes the activities of the group
21 Speaks as a representative of the group
31 Speaks for the group when visitors are present
41 Represents the group at outside meetings
Items for ‘representation’ dimension indicate the trait of showing the initiative to be the face of the groupand be responsible for it. Such behaviour could be seen in individuals who are relatively dominant, open to theviews of the group, holding precise information, and having low levels of anxiety. These behaviours indicate anassertive communication style.
Proposition 1: Leaders who score highly on representation would be perceived by subordinates as high in open,dominant, precise and relaxed communication styles.
# Demand Reconciliation
51 Handles complex problems efficiently
61 Gets swamped by details
71 Gets things all tangled up
81 Can reduce a madhouse to system and order
91 Gets confused when too many demands are made of him/her.
Items for ‘demand reconciliation’ dimension indicate a problem-solving ability. Here the word ‘problems’can take on two meanings: people related or task related. While task related problems need intelligence, peoplerelated problems need effective communication. Especially, leaders should be aware of the relational significanceof communication. These items indicate a trait of being attentive, precise, and systematic thinking. Openness toideas is another trait that may be implicitly maintained in the structure. Also, task like reconciliation demandsfrequent communication with members of the group/organization, which means leader-member exchange isinfluenced; an idea that is deliberated in literature of communication style.
Proposition 2: Leaders who score highly on demand reconciliation would be perceived by subordinates asattentive, precise, open, and dominant styles of communication.
# Tolerance of Uncertainty
2 Waits patiently for the results of a decision
12 Becomes anxious when he/she cannot find out what is coming next
22 Accepts defeat in stride
32 Accepts delays without becoming upset
42 Become anxious when waiting for new developments
52 Is able to tolerate postponement and uncertainty
62 Can wait just so long, then blows up
72 Remains calm when uncertain about coming events
82 Is able to delay action until the proper time occurs
92 Worries about the outcome of any new procedure
Critical analysis of a leadership theory from a communication style perspective
20. Gavesana Journal of Management / Vol. 3. Issue 1. / January 2011 - June 2011.
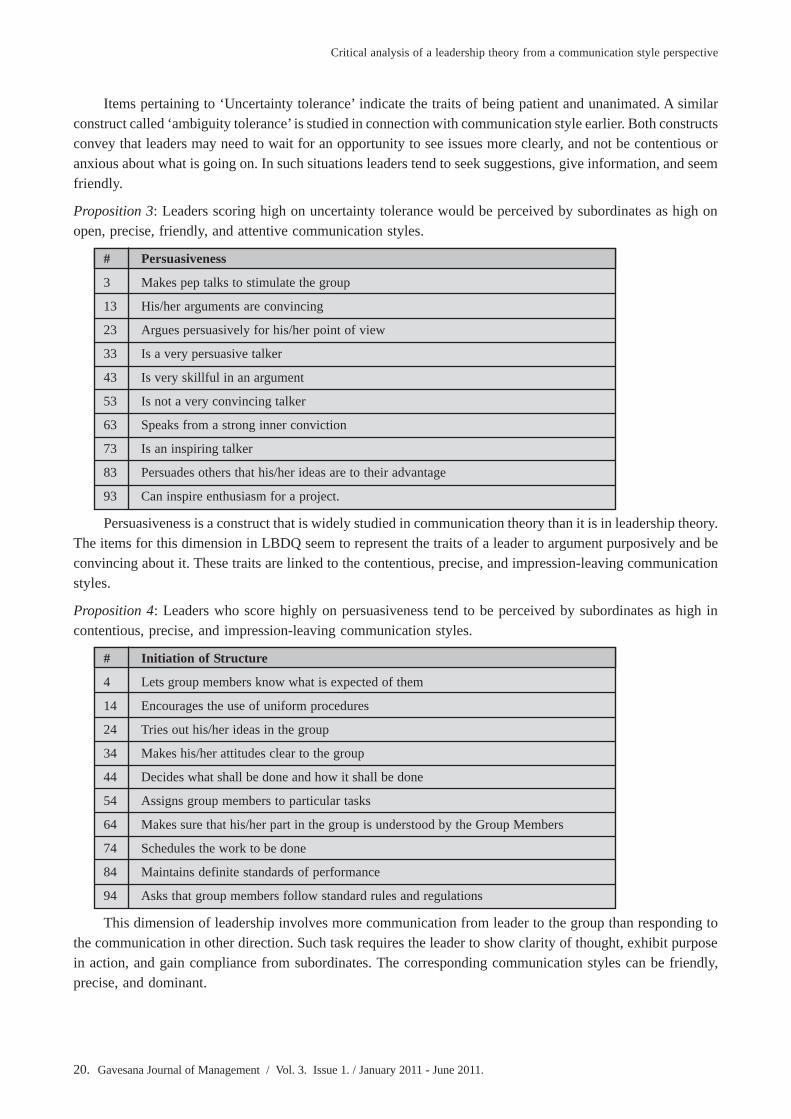
Items pertaining to ‘Uncertainty tolerance’ indicate the traits of being patient and unanimated. A similarconstruct called ‘ambiguity tolerance’ is studied in connection with communication style earlier. Both constructsconvey that leaders may need to wait for an opportunity to see issues more clearly, and not be contentious oranxious about what is going on. In such situations leaders tend to seek suggestions, give information, and seemfriendly.
Proposition 3: Leaders scoring high on uncertainty tolerance would be perceived by subordinates as high onopen, precise, friendly, and attentive communication styles.
# Persuasiveness
3 Makes pep talks to stimulate the group
13 His/her arguments are convincing
23 Argues persuasively for his/her point of view
33 Is a very persuasive talker
43 Is very skillful in an argument
53 Is not a very convincing talker
63 Speaks from a strong inner conviction
73 Is an inspiring talker
83 Persuades others that his/her ideas are to their advantage
93 Can inspire enthusiasm for a project.
Persuasiveness is a construct that is widely studied in communication theory than it is in leadership theory.The items for this dimension in LBDQ seem to represent the traits of a leader to argument purposively and beconvincing about it. These traits are linked to the contentious, precise, and impression-leaving communicationstyles.
Proposition 4: Leaders who score highly on persuasiveness tend to be perceived by subordinates as high incontentious, precise, and impression-leaving communication styles.
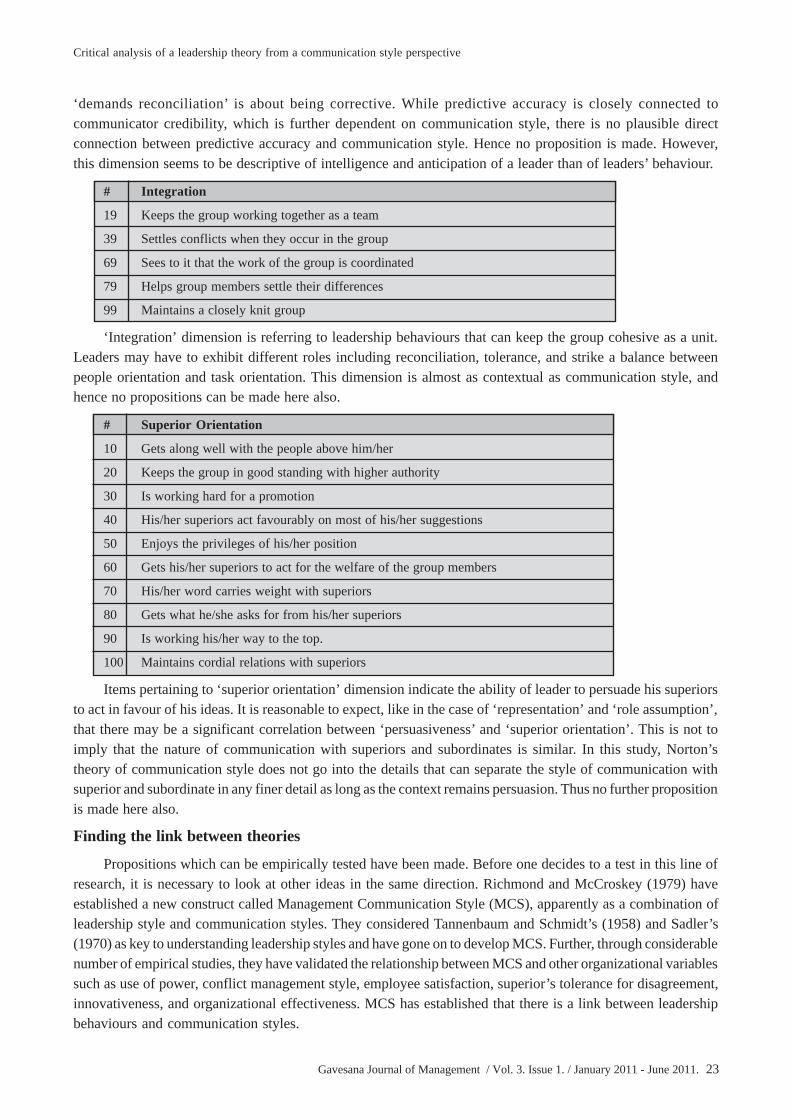
# Initiation of Structure
4 Lets group members know what is expected of them
14 Encourages the use of uniform procedures
24 Tries out his/her ideas in the group
34 Makes his/her attitudes clear to the group
44 Decides what shall be done and how it shall be done
54 Assigns group members to particular tasks
64 Makes sure that his/her part in the group is understood by the Group Members
74 Schedules the work to be done
84 Maintains definite standards of performance
94 Asks that group members follow standard rules and regulations
This dimension of leadership involves more communication from leader to the group than responding tothe communication in other direction. Such task requires the leader to show clarity of thought, exhibit purposein action, and gain compliance from subordinates. The corresponding communication styles can be friendly,precise, and dominant.
Critical analysis of a leadership theory from a communication style perspective

Gavesana Journal of Management / Vol. 3. Issue 1. / January 2011 - June 2011. 21
Proposition 5: Leaders who score highly on initiation of structure tend to be perceived by subordinates as highon friendly, precise and dominant communication styles.
# Tolerance and Freedom
5 Allows the members complete freedom in their work
15 Permits the members to use their own judgment in solving Problems
25 Encourages initiative in the group members
35 Lets the members do their work the way they think best
45 Assigns a task, then lets the members handle it
55 Turns the members loose on a job, and lets them go to it
65 Is reluctant to allow the members any freedom of action
75 Allows the group a high degree of initiative
85 Trusts members to exercise good judgment.
95 Permits the group to set its own pace.
‘Uncertainty tolerance’ and ‘tolerance and freedom’ are shown as two separate dimensions in LBDQ.Assumable, the tolerance and freedom dimension deals with how open the leader is to the ideas of members.Correspondingly, the items display that this dimension of leadership deals with relationships. Role ofcommunication is heightened in this context. The communication styles that can be associated with cohesiverelationships, trust and credibility are open, friendly, relaxed, and attentive styles.
Proposition 6: Leaders who score high on tolerance and freedom dimension tend to perceived by subordinatesas high on open, friendly, relaxed and attentive communication styles.
# Role Assumption
6 Is hesitant about taking initiative in the group
16 Fails to take necessary actions
26 Lets others persons take away his/her leadership in the group
36 Lets some members take advantage of him/her
46 Is the leader of the group in name only
56 Backs down when he/she ought to stand firm
66 Lets some members have authority that he/she should keep
76 Takes full charge when emergencies arise
86 Overcomes attempts made to challenge his/her leadership
96 Is easily recognized as the leader of the group
Items pertaining to ‘Role assumption’ dimension seem to point towards a leadership trait of claiming andsafeguarding one’s position as leader. The behaviours that would be required for role assumption are in somesense encompassed by behaviours for ‘representation’ dimension. It seems reasonable to think that ‘representation’of group is assuming a leadership role. In that sense, it would not be surprising to see if scores on these twodimensions have significantly correlated in past studies. However, the communicative behaviours for both actswould be more or less similar. It would be wise to extend proposition #1 instead of making a new proposition.
Critical analysis of a leadership theory from a communication style perspective

22. Gavesana Journal of Management / Vol. 3. Issue 1. / January 2011 - June 2011.
# Consideration
7 Is friendly and approachable
17 Does little things to make it pleasant to be a member of the group
27 Puts suggestions made by the group into operation
37 Treats all group members as his/her equals
47 Gives advance notice of changes
57 Keeps to himself/herself
67 Looks out for the personal welfare of group members
77 Is willing to make changes
87 Refuses to explain his/her actions
97 Acts without consulting the group.
Most items relating to ‘consideration’ dimension are pointing straight to at least one kind of communicativebehaviour directly. This dimension too seems to overlap with ‘tolerance and freedom’ dimension, and requiresthe leader to display traits of being friendly, proactive, precise, and accommodative. No new proposition ismade; instead proposition #6 may be extended.
# Production Emphasis
8 Encourages overtime work
18 Stresses being ahead of competing groups
28 Needles members for greater effort
38 Keeps the work moving at a rapid pace
48 Pushes for increased production
58 Asks the members to work harder
68 Permits the members to take it easy in their work
78 Drives hard when here is a job to be done
88 Urges the group to beat its previous record
98 Keeps the group working up to capacity.
Items pertaining to ‘production emphasis’ dimension seem to indicate a sense of closed behaviour, andtask oriented leadership. Such leadership trait may be associated with low scores on open, and high scores ondominant and contentious styles of communication.
Proposition 7: Leaders who score high on production emphasis tend to perceived by subordinates as high ondominant and contentious and low on open styles of communication.
# Predictive Accuracy
9 Makes accurate decisions
29 Seems able to predict what is coming next
49 Things usually turn out as he/she predicts
59 Is accurate in predicting the trend of events
89 Anticipates problems and plans for them.
‘Predictive accuracy’ dimension is again conceptually related to ‘demands reconciliation’ dimension. Boththese dimensions deal with problem solving; while ‘predictive accuracy’ is about being futuristic and proactive,
Critical analysis of a leadership theory from a communication style perspective
Gavesana Journal of Management / Vol. 3. Issue 1. / January 2011 - June 2011. 23
‘demands reconciliation’ is about being corrective. While predictive accuracy is closely connected tocommunicator credibility, which is further dependent on communication style, there is no plausible directconnection between predictive accuracy and communication style. Hence no proposition is made. However,this dimension seems to be descriptive of intelligence and anticipation of a leader than of leaders’ behaviour.
# Integration
19 Keeps the group working together as a team
39 Settles conflicts when they occur in the group
69 Sees to it that the work of the group is coordinated
79 Helps group members settle their differences
99 Maintains a closely knit group
‘Integration’ dimension is referring to leadership behaviours that can keep the group cohesive as a unit.Leaders may have to exhibit different roles including reconciliation, tolerance, and strike a balance betweenpeople orientation and task orientation. This dimension is almost as contextual as communication style, andhence no propositions can be made here also.
# Superior Orientation
10 Gets along well with the people above him/her
20 Keeps the group in good standing with higher authority
30 Is working hard for a promotion
40 His/her superiors act favourably on most of his/her suggestions
50 Enjoys the privileges of his/her position
60 Gets his/her superiors to act for the welfare of the group members
70 His/her word carries weight with superiors
80 Gets what he/she asks for from his/her superiors
90 Is working his/her way to the top.
100 Maintains cordial relations with superiors
Items pertaining to ‘superior orientation’ dimension indicate the ability of leader to persuade his superiorsto act in favour of his ideas. It is reasonable to expect, like in the case of ‘representation’ and ‘role assumption’,that there may be a significant correlation between ‘persuasiveness’ and ‘superior orientation’. This is not toimply that the nature of communication with superiors and subordinates is similar. In this study, Norton’stheory of communication style does not go into the details that can separate the style of communication withsuperior and subordinate in any finer detail as long as the context remains persuasion. Thus no further propositionis made here also.
Finding the link between theories
Propositions which can be empirically tested have been made. Before one decides to a test in this line ofresearch, it is necessary to look at other ideas in the same direction. Richmond and McCroskey (1979) haveestablished a new construct called Management Communication Style (MCS), apparently as a combination ofleadership style and communication styles. They considered Tannenbaum and Schmidt’s (1958) and Sadler’s(1970) as key to understanding leadership styles and have gone on to develop MCS. Further, through considerablenumber of empirical studies, they have validated the relationship between MCS and other organizational variablessuch as use of power, conflict management style, employee satisfaction, superior’s tolerance for disagreement,innovativeness, and organizational effectiveness. MCS has established that there is a link between leadershipbehaviours and communication styles.
Critical analysis of a leadership theory from a communication style perspective

24. Gavesana Journal of Management / Vol. 3. Issue 1. / January 2011 - June 2011.
While MCS may appear to be a good alternative for our propositions, we still had to make them consideringthe one major backlog of MCS; that is the unlimited scope of their construct. Though there is a categorizationwithin MCS as management can be telling, selling, consulting, or joining; these are only broad variables underwhich communicative behaviours could be categorized. This construct thus does not give us a chance to identifyspecifically what style of communication is related to what leadership behaviour. On the other hand, Norton’sconceptualization is raw, yet more specific than MCS.
Conclusion
What we have done in this study is to look at leadership behaviours as proposed by Stogdill’s LBDQ fromNorton’s Communication style perspective. This lets us develop a new perspective and perhaps show us differentways of building and validating theory. However, there is one gap in this study which we need to subsequentlyfill—that is—analysis is done with communication styles that are desirable in specific contexts; however,communication styles that are not desirable are only nominally mentioned. Also, one should acknowledge thatNorton’s theory is conceptually strong, but when it comes to measurement, it is still crude. So, any further forempirical validation in this direction using Norton’s CSM may only be treated as a beginning. The same isapplicable to LBDQ in another sense. LBDQ is one of the many instruments available to assess leadershipbehaviours. Therefore it is suggested that one should be cautious about linking specific variables from leadershipto specific communication styles; and that too, only when the hypothesis seems supported by the theory.
References
Norton, R. W., 1978. Foundation of a communicator style construct. Human Communication Research, Vol. 4,No. 2, pp.99-112.
Richmond, V., & McCroskey, J., 1979. Management communication style, tolerance for disagreement, andinnovativeness as predictors of employee satisfaction: a comparison of single factor, two factor, and multiplefactor approaches. In D. Nimmo, ed.. Communication Yearbook 3, New Brunswick: NJ, pp. 160-163.
Sadler, P. J., 1970. Leadership style, confidence in management, and job satisfaction. Journal of AppliedBehavioral Science, 6, pp.3-19.
Spitzberg, B. H., & Cupach, W. R., 1984. Interpersonal communication competence. Beverly Hills, CA: Sage.
Stogdill, R.M., 1974. Handbook of leadership. New York: The Free Press
Tannenbaum, R., & Schmidt, W. H., 1958. How to choose a leadership pattern. Harvard Business Review, 36,pp.95-101.
Watzlawick, Paul, J. H. Beavin, and D. D. Jackson., 1967. Pragmatics of Human Communication. New York:W.W. Norton.
Welford, A., 1980. The concept of skill and its application to performance. In W. Singleton, P. Spurgeon & R.Stammers, eds, The analysis of social skill. New York: Plenum.
Critical analysis of a leadership theory from a communication style perspective

Gavesana Journal of Management / Vol. 3. Issue 1. / January 2011 - June 2011. 25
Performance of Microfinance Institutions (MFIs):An Empirical Study
Bindiya Soni*
Abstract
For global economic development at present, credit is one of the crucial inputs. Microfinance i.e. makingavailable small finance to the poor section of the society can be one intervention to meet this need. Severalmicrofinance institutions (MFIs) have been operating towards resolving the credit access problem of the poor.In view of the importance of microfinance, this paper attempts to look at the functioning of the microfinanceinstitutions (MFIs) in India. The study examines in detail the structure of these institutions in terms of theirlegal form, their product portfolio, details pertaining to the product offering such as interest rate, duration ofthe loan, default on repayment, reasons of default and client selection mechanism. The study also focuses uponthe problems and challenges working with female clients and the approach to deal with the same. Based uponthe study, some important implications have been derived which would benefit various stakeholders ofmicrofinance and will also help in effective penetration of this grassroots innovation. The study concludes withchallenges of functioning as perceived by the MFIs.
Keywords: Microfinance, Self-Help Groups, Poverty Alleviation, Women Empowerment
Introduction
The failure of the formal credit institutions in meeting the credit need of rural poor has been major reasonfor development of micro financing (Das, 2008). Consultative Group to Assist the Poor (CGAP) definesMicrofinance as the supply of loans, savings and other basic financial services to the poor. People living inpoverty, like everyone else, need a diverse range of financial instruments to run their business, build assets,stabilize consumption and shield themselves against risks. Financial services needed by the poor include workingcapital loans, consumer credit, savings, pensions, insurance and money transfer services (Kashyap, 2005). Theway in which the banking sector has evolved the world over has not been truly inclusive. So, people with no ormeager physical collateral get completely marginalized (Swain, 2010).
Microfinance is gathering momentum to become a major force in India. The story of Indian micro financeis associated with both governmental and nongovernmental organizations (NGO) initiatives that took place inthe mid-eighties and early nineties. It incorporated lessons from the micro finance movement in Bangladeshand similar participatory development programmes in India (Acharya, 2008). The success of Grameen Bankmodel in Bangladesh acted as a stimulating factor for the take-off of micro finance in many countries particularlyIndia. Mohammad Yunus, started research on the effective delivery of credit to rural poor, which later grew intomammoth micro credit programme under the brand name of Grameen Bank. In 1983, the project was convertedinto an independent bank by government legislation (Dhal, 2008).
In India, effort of pioneer institution i.e. National Bank for Agriculture and Rural Development (NABARD)through its SHG-Bank Linkage Programme has added more than 22 lakh Self Help Group (SHG) units connectingaround more than 33 million households directly by the end of the year 2005-06 in 31 states and 583 districtswith the participation of 545 banks and 4896 NGOs (Pati and Lyngdoh, 2008). The Bharat Microfinance Reportreveals that Indian microfinance has reached out to 86.2 million clients with outstanding portfolio of Rs. 351billion as of year 2009. As per the report, proportion of women clients in total clients remained 80 per cent and
*Assistant Professor, Institute of Law, NIRMA University, Ahmedabad. Email ID: [email protected]

26. Gavesana Journal of Management / Vol. 3. Issue 1. / January 2011 - June 2011.
about 20 per cent of Microfinance Institutions (MFI) clients belong to Scheduled Castes and Scheduled Tribes(SCs/STs). Now the SHG-bank linkage programme is one of the largest micro finance programmers in theworld.
Various MFIs in India, with different legal structure such as NGOs, Non Banking Finance Companies(NBFCs), Co-operative Societies, Co-operative banks etc., have been involved in this grassroots initiativeenabling the poor to lift themselves from the vicious circle of poverty. In light of this, the paper investigates theoperational aspects of MFIs in India. The study is based upon the primary data collected with the structuredquestionnaires. The research methodology, data analysis and interpretation, findings and finally conclusion andsuggestions have been discussed in the following section.
Literature Review
Though microfinance has started early in 1980s in Bangladesh, the subject is under extensive examinationby the researchers all over the world in past several years. Hence, the resulting literature is now very large. Thescholarly interest in microfinance has been growing rapidly. Many academic journals such as Small EnterpriseDevelopment Journal (SED), The Journal of Microfinance(JMF), World Development(WD), The Journal ofDevelopmental Entrepreneurship(JDE), The Journal of Developmental Entrepreneurship(JDE) have beenpublishing peer-reviewed articles on the topic. Brau and Woller (2004) have provided a synthesized review ofover 350 critically-reviewed articles that address various component of microfinance such as institutionalsustainability, products and services offered by MFIs, and best practice pertaining to MFI management anddevelopment, client targeting, social impact and microfinance policy regulation.
The product portfolio of microfinance is focused more upon micro-credit (Nourse, 2001 and Woller, 2002).However, many MFIs today have started offering additional products, such as savings, consumption or emergencyloans, insurance, and business education. Nourse (2001) has analysed the background and growth of variousmicrofinance products. As per his research, savings and insurance services for poor should also be on offeralong with micro-credit. Regarding interest rates, Robinson (1996) argued that interest rates charged tomicrofinance borrowers should cover all costs and that the working poor can afford these rates which arerelatively low compared to their alternatives. Females account for majority of MFIs clientele. This is becauseof the belief that they invest the loans in family welfare and use the funds more productively as compared tomales. In order to validate this belief that women use borrowed funds more efficiently than men, Pitt andKhandker (1998) carried out a study in Bangladesh using data for 1991-1992. The findings of the study suggestedthat all areas such as household expenditures, non-land assets held by women, male and female labour supply,and boys’ and girls’ schooling were significantly affected when women borrow. However, Mallick (2002) in hisresearch in Bangladesh disapproves this notion and states that this type of client targeting can result into genderconflict.
There are several studies pointing towards impact of microfinance. Findings substantiate a beneficialimpact on income and savings of poor people, social empowerment, growth of assets, better education andhealth of the family etc. Overall there are conclusive and positive economic and social impact on poor peopleas a result of availing microfinance services (Keshava, Mehta and Gill, 2010; Rajendran and Raya, 2010;Puhazhendi and Badatya, 2002; Anand, 2002; Seibel and Dave, 2002).
Review of the above studies reveal that majority of the research in microfinance is concentrated on demandside of micro financing. That is, the perception of microfinance recipients has been evaluated in most of thesestudies. The studies on supply side of microfinance approach, particularly in Indian context, are few and farbetween. Thus, it was felt that there was a real and apparent need to understand the dynamics of this approachin India taking into consideration the supply side of micro-financing i.e. MFIs.
Performance of Microfinance Institutions (MFIs): An Empirical Study

Gavesana Journal of Management / Vol. 3. Issue 1. / January 2011 - June 2011. 27
Research Objectives
Broadly, the purpose for undertaking this research was to contribute to the scientific understanding foroperations of MFIs across India. However, the specific objectives can be described as below:
• To illustrate the profiling of MFIs in terms of their registration form, outreach to poor, composition ofmale and female clients in urban and rural areas, clients with minority background, male and female staffstrength in rural as well as urban areas and their funding sources.
• To study main products and services of MFIs in India, along with features such as average loan size inrural and urban areas, duration of the credit and interest rate charged on the same, policy of differentiationamong clients, rate of default on repayment and the reasons for it.
• To understand the use of various evaluation criteria for the clients used by Indian MFIs.
• To identify the problems and challenges in working with female clients in the rural as well as urban areasand the approach of MFIs to overcome the same.
• To find out the social impact of MFI lending on client as perceived by the MFIs.
• To address the challenges faced by MFIs in India.
Research Methodology
This study is based upon descriptive research design. Both primary and secondary sources of informationhave been used for the research. The primary data for this study was collected from the microfinance institutions(MFIs) in India through a structured questionnaire. MFIs based at Gujarat have been approached telephonically,while MFIs based out of the state have been sent the questionnaire electronically through mails. Data base of 41MFIs has been generated through newspaper articles and various portals featuring list of MFIs in India. Secondarydata gathered from the website of MFIs were supplemented by the primary data collected. Besides, differentbooks, newspapers, articles, journals, magazines and websites were also referred for the purpose.
The questionnaire designed for the survey purpose was mailed to the participants using the contact detailscollected from the web pages. Initially, the responses were quite discouraging as the questionnaire wascomprehensive and these key persons may not have time to respond to the survey in detail. Some of themdeclined saying that they had a lot of these kinds of e-mails which includes interviews. In all such cases, theywere requested again and again through rigorous follow up with the emails and telephone calls to support theresearch initiative. This follow up was successful in generating the useful responses in many of the cases.
The survey was conducted during April 2010 to July 2010. Only 15 responses were considered to beuseful for analysis purpose resulting in the response rate of 37% . Information regarding the profiling of MFIswas obtained through examining variables like presence in rural and urban areas, organisation form staff strength,composition of male and female clients etc. Various questions on products/service types, duration of loan,interest rate charged on the same, default rate, various reasons for default and criteria for selection of clientwere put up in the questionnaire to understand MFI operations in detail. As majority of MFI clientele compriseof females, difficulties encountered by these institutions in dealing with female clients and their strategies toovercome the same have also been addressed through this study. Finally, the perceptions of the MFIs regardingthe impact of their operations and various challenges faced by them have also been incorporated in this survey.The data were analysed using statistical techniques.
Data Analysis
Legal structure/form of MFIs: A large variety of actors provide microfinance in India, using a range ofmicrofinance delivery methods. MFIs can be broadly classified as NGOs which are mainly engaged in linkingSHGs with banks, NGOs directly lending to borrowers, MFIs which are organized as co-operatives such as
Performance of Microfinance Institutions (MFIs): An Empirical Study

28. Gavesana Journal of Management / Vol. 3. Issue 1. / January 2011 - June 2011.
SEWA bank and MFIs organized as NBFCs (Das, 2008).
The MFIs that participated in the survey represented all the categories as described above. As per thesurvey findings, majority of the participant MFIs in the study were registered as NBFCs (40%) followed bySociety Act, 1860 (20%). There were few MFIs registered as Trust (13%), Section 25 company (13%), Co-operative society (7%) and Co-operative banks (7%).
Outreach: Number of clients being served by MFIs in rural and urban areas has been noted in literature as oneof the core performance indicators (Kereta, 2007). To this end, study’s findings revealed that many of the MFIshad presence in all the three areas i.e. rural, urban and semi-urban. Majority of the participant MFIs wereoperating in rural areas (93%), followed by urban area (73%) and semi urban area (53%).
Further, descriptive statistics regarding the number of centres in these areas suggested that sample MFIshad average 14822 centres in the rural areas while 2377 centres in urban areas. Average number of centres byMFIs in semi-urban area was 86. (Table 1) Hence, the rural sector of India clearly dominates the microfinanceoperations. However, the high standard deviation presents wide variations.
Table 1 : Descriptive statistics of number of centres in rural, urban and semi-urban areas.
No. of centres N Mean Std. DeviationNo. of Rural Centres 15 14822 53044No. of Urban Centres 14 2377 7298No. of Semi Urban Centres 14 86 295
Composition of Clients: It is observed in the literature that women constitute the majority of the microfinanceclientele- over 90% on an average and in case of some MFIs like Grameen bank, 97% of the clients are women.There are supporting reasons why women have become the primary target for microfinance services. At macrolevel, it is because 70% of the global poor are women. Women have a higher unemployment rate than men invirtually every country. Targeting women has also proved to be a successful, efficient economic developmenttool (Verma, 2008).
The results of the present study also support the literature. All the MFIs surveyed had female clients whilethere were 60% MFIs with male clients. Further bifurcation in terms of rural and urban area suggests thataverage percentage of female clients in rural as well as urban area was 71% and 29% respectively. Again thehigh standard deviation reveals that there is a wide data. (Table 2)
Table 2 : Descriptive statistics of percentage of female clients in rural and urban area
Female Clients (%) N Mean Std. DeviationFemale clients in rural area 15 71 31Female clients in urban area 15 29 38
The Study also highlights the fact that these MFIs served average 65% clients belonging to SC, ST andother minority community.( Table 3)
Table 3 : Descriptive statistics of percentage of clients from SC, ST and minority community
Percentage of SC, STand minority Clients
N Range Minimum Maximum Mean Std. Deviation
14 73 27 100 65 26
Staff Strength: One important aspect of how gender concerns are incorporated into an MFI’s operations is theplace of women on staff. Women’s access to female clients is the prime advantage of having women on staff.Female staff is often able to talk with women more easily than men, especially when home visits are required.
Performance of Microfinance Institutions (MFIs): An Empirical Study

Gavesana Journal of Management / Vol. 3. Issue 1. / January 2011 - June 2011. 29
Grameen bank in Bangladesh, a pioneer in reaching to women clients has maintained between 5 and 10%female loan officers for many years (Agarwal, 2005). As per the findings of the present study, average femalestaff of the participant MFIs, both in rural and urban area, was 36% while the remaining 64% was male staff.The descriptive statistics are highlighted in the following table. Though clientele of MFIs comprised around90% of female clients, the female staff strength was only 36%.
Table 4 : Descriptive statistics of percentage of male/ female staff in rural/urban area
Staff/Area Rural Urban TotalMale (%) 51 13 64Female (%) 29 7 36Total 80 20 100
Product/Services: MFIs provide similar products and services to their customers as formal sector financialinstitutions. There is a difference, however, in scale and method of delivery. Fundamental services of savings,loans, and insurance are common among formal institutions and MFIs. Notwithstanding, to date most efforts toformalize microfinance have focused on enterprise lending (loans for enterprise formation and development)which remain by far today the dominant product offered by MFIs. This, however, has slowly begun to change.It now refers to loans for consumption and emergency purposes, insurance, transfer services and other financialproducts targeted at low income clients (Bru and Woller, 2004).
As per the survey findings, all participant MFIs provided credit products i.e. loans (100%) followed byinsurance (53%). The findings highlighted the fact that savings which are so integral to poor households’ riskmanagement strategies are still ignored (only 20% MFIs provide savings products). As far as the services areconcerned, there were few MFIs in India which provide capacity building (40%) in terms of training andawareness programmes to its clients along with financial consultancy (20%).
Funding Sources: Findings of the present study described that the major funding source for the participantMFIs was borrowing from nationalized and private sector commercial banks (80%) followed by borrowingfrom financial intuitions(53%) including NBFCs and other MFIs. Equity investment (47%) and funding byvarious local, national and international agencies (40%) were also important sources of funding for these MFIs.There were few instances observed where linkages of SHGs with Banks (13%) and commercial paper (7%)also featured in the funding sources of MFIs.
Details pertaining to Micro-credit: As mentioned above, almost all the MFIs that participated in the surveyprovided loan as their basic portfolio product. In this section, details such as the loan size, duration of the loan,interest rate charged, policy of different interest rates for male and female clients etc. have been analysed.
As far as the loan size is concerned, the MFIs were asked to specify the average amount they lend in therural and urban areas. The descriptive statistics as highlighted below point out that in the urban area theaverage amount was Rs. 9447 while the same in the rural area was 8355. (Table 5)
Table 5 : Descriptive statistics of loan size in rural and urban areas
Loan Size N Mean Std. DeviationRural 15 8355 4971Urban 13 9447 8537
To statistically test the difference between the amount of loan given in the rural and urban area, WilcoxonSigned Ranks test was performed. Hypothesis for the study and the resulting output are described below.(Table 6)
Performance of Microfinance Institutions (MFIs): An Empirical Study

30. Gavesana Journal of Management / Vol. 3. Issue 1. / January 2011 - June 2011.
H0: There is no significant difference between the amount of loan extended by MFIs in the rural and urban area.
H1: Loan size by MFI differs significantly between rural and urban area.
Table 6 : Ranks for loan amount in urban and rural areas(Wilcoxon Signed Rank Test)
Loan Size Ranks N Mean Rank Sum of RanksUrban Negative Ranks 4 6.63 26.50Rural Positive Ranks 8 6.44 51.50
Ties 1Total 13
Table 7 : Test statistics for loan amount in urban and rural areas(Wilcoxon Signed Rank Test)
Particulars Loan Size (Urban)- Loan Size (Rural) Z -.981 Asymp. Sig. (2-tailed) .326
The test statistics suggest that the significance value is 0.326, which is greater than the significance value0.05 i.e., p>0.05. (Table 7) . Hence, H0 can not be rejected. There is no much difference between the mean ranksfor loan amount in the rural and urban area. Hence, it may be concluded that there is no statistically significantdifference in the loan size by MFIs in the rural and urban areas.
It is observed that interest rate on the micro-credits is generally high as compared to the loans by thefinancial institutions but much less than the rates charged by the informal systems in the villages, especiallymoney lenders. MFIs have to cover the transaction cost and the cost of default along with the cost of money thatit lends. Thus, to achieve financial self-sufficiency, MFIs have to charge relatively high interest rates.
Descriptive statistics with respect to the rate of interest charged and the duration of the loan revealed that,the average rate of interest charged on the loan by the MFIs was 17% with a standard deviation of 4%. Themaximum interest rate was 27% while the minimum was 12%. The average duration of the loan was 12 monthswith a standard deviation of 2 months. The maximum duration for which the loan was available for use is 18months while the minimum was 10 months. (Table 8)
Table 8 Descriptive statistics of interest rate and duration of loan
Particulars N Range Minimum Maximum Mean Std. DeviationInterest Rate (%) 14 15 12 27 17 4Loan Period (Months) 15 8 10 18 12 2
These MFIs were asked whether they discriminate between male and female clients while providing theloans. There are few cases (4), in which the MFIs were serving only female clients. So, this question is notapplicable to them. For the remaining, all of them gave a unanimous response that they did not follow thispolicy of differentiation in the interest rates among genders.
The literature regarding the repayment of the micro-credit states that global repayment rate for such loansis higher than 95%. This allows MFIs to relent these funds to even more clients (Verma, 2008).
As per the findings of this study, the average default rate was 1.03% with a standard deviation of 1.37%.The maximum rate for such default was 5% while the minimum being 0%. Hence, the average repayment ratecould be considered as 99%. Such a high repayment rate is possible to be achieved due to social pressure. If any
Performance of Microfinance Institutions (MFIs): An Empirical Study

Gavesana Journal of Management / Vol. 3. Issue 1. / January 2011 - June 2011. 31
member defaults on loan, the fellow members pressure that person to pay up, since otherwise their right toborrow would disappear. (Table 9)
Table 9 : Descriptive statistics for default rate (%) on loan repayment
Particular N Range Minimum Maximum Mean Std. Deviation Rate of default (%) 14 5 0 5 1.03 1.37
Further, an attempt was made to discover the reasons for this 1% default. MFIs were asked to rate variousreasons on an importance scale from 1 (least important) to 5 (most important). In response to this, MFIs gavemore importance to sickness of the borrower (mean value 3.73) or the family members, crop failure in the ruralarea (mean value 3.55) and bankruptcy in the business (mean value 3.27). While they were neutral (mean value3) regarding default due to improper selection of the client or the negligence on the part of the client. For otherfactors such as ineffective enforcement, absence of group pressure and absence of collateral, MFIs had opinionsbetween not so important to neutral on the scale (mean value between 2 and 3). Descriptive statistics of thereason for default are shown in Table 10.
Table 10 : Descriptive statistics of reasons for default on loan repayment
Reasons N Mean Std. DeviationImproper Selection 11 3.00 1.55Ineffective enforcement 11 2.27 1.35Absence of group pressure 11 2.64 1.36Absence of Collateral 11 2.09 1.04Negligence of client 11 3.00 1.26Crop failure in rural area 11 3.55 1.29Sickness of borrower/family member 11 3.73 0.79Bankruptcy in the business 11 3.27 1.19
Selection of the Client: The products and services of microfinance are targeted at economically active poorsection of the society. In order to ensure better utilization of funds and higher repayment, MFIs use certaincriteria to select their clients. Regarding the screening criteria to identify credit worthiness of the borrowers, thestudy found that these institutions used various mechanisms to select their clients. In order to find the importanceof various such criteria, MFIs were asked to rate them on a scale of irrelevant (1), desirable (2), important(3)and essential (4). The descriptive statistics of the same are presented in Table 11
Table 11 : Descriptive statistics of criteria for client selection
Criteria N Mean Std. DeviationClient Self selection 15 2.80 1.01Type of business 15 2.73 0.96Income of the client during last three years 15 2.20 1.01Gender 15 3.00 0.93Credibility in community 15 2.80 0.77Age 15 2.87 1.06Permanent Residence 15 3.07 0.80Character Assessment 15 2.73 0.96Existing loan/debt outstanding 15 3.33 0.82Willingness to join credit group of self selected members 15 3.27 0.96Number of dependants at home 15 2.33 0.82Willingness to save 15 2.60 0.91Capacity to engage in viable Income generating activities 15 3.13 1.06
Performance of Microfinance Institutions (MFIs): An Empirical Study

32. Gavesana Journal of Management / Vol. 3. Issue 1. / January 2011 - June 2011.
Opinions of MFIs varied between important to essential (mean value between 3 and 4) for factors such asoutstanding loans, willingness to join credit group of self selected members, capacity to engage in viableincome generating activity and permanent residence. Participant MFIs considered gender as important factorfor client selection. While for all other factors such as age, self section by client, business type, income duringlast three years, credibility in community, age, character, dependants and willingness to save; MFIs opinionsvaried from desirable to important (mean value between 2 and 3). Few MFIs stated that health of person andfamily members and education were also considered important in addition to the factors as described in thequestionnaire.
Problems and challenges working with female clients in rural and urban areas and the means ofovercoming these problems by MFIs: As mentioned above, majority of the clientele of the MFIs in Indiacomprise of female clients. Hence, a special effort was made to learn the difficulties faced by MFIs in servingthese female clients in rural and urban area. The responses were qualitatively analysed.
The major problem as described by the respondents relates to low literacy level, especially financialliteracy. Due to this the females in urban as well as rural areas have poor understanding regarding credit,savings, pension and insurance products. They have to be oriented repeatedly. They do not possess knowledgeregarding market. They lack skills in maintaining proper cash inflow and outflow account. Besides, they are notable to participate in weekly or monthly meetings meant for collection of savings or loan installment due tofamily commitments and domestic obligation. Few female clients migrate to other places without informingthe institute. One of the MFIs also mentioned that it was very difficult to convince female as compared to male.
The context of Indian socio-economic structure is based on male dominated system. Therefore, there arechances that the loan amount may be surrendered to a male family member. In this context, MFIs were asked tospecify how they ensure that the female clients maintain control over the use of capital as well as income fromthe business and do not surrender the loan to male member of the family.
To this end, the study findings revealed that the MFIs exercised strict vigilance over the use of loan moneyby female members in order to prevent or deal with expropriation of women’s loans by their husbands. ManyMFIs stated that continuous presence in the field was a key in identifying such situations. Close monitoringthrough home visits by field officers and the well defined protocols for instances of loan expropriation, enabledthe staff to intervene in such situation.
Majority of the MFIs, prior to the disbursement of loan programme, arrange some orientation programmeon gender and related issues. Few MFIs prepare visual charts to conceptualize the objective of the micro-creditprogramme. In many instances, MFIs develop clear understanding between the client and trainers on gendersensitive issues such as how females should have custody of income and should not surrender it to their malecounterparts. Few MFIs make it mandatory for female clients to deposit savings amount themselves only.
Some MFIs conduct cross verification routine checks and award utilization certificates as well. One of theMFIs stated that gender training for the male members of the family is necessary to explain the utility of theirfemales becoming economically empowered. There were few instances observed where loan was provided foragricultural\dairy purpose. And this being income generation activity of entire family, male and female membersare going to use the income equally. Therefore, MFIs dealing with such situation, do not bother about whethermale or female members are using the loan money as far as the purpose for which the loan amount was given isachieved.
Further, to ensure that the illiterate females are able to maintain accurate records of their business and loanobligations, regular training is provided to impart credit discipline to these females. This is in addition to grouporientation programme. Most of the MFIs issue loan cards akin to pass book for maintenance of proper recordkeeping. The female clients are advised to take help of field staff, literate family member or the leader of the
Performance of Microfinance Institutions (MFIs): An Empirical Study
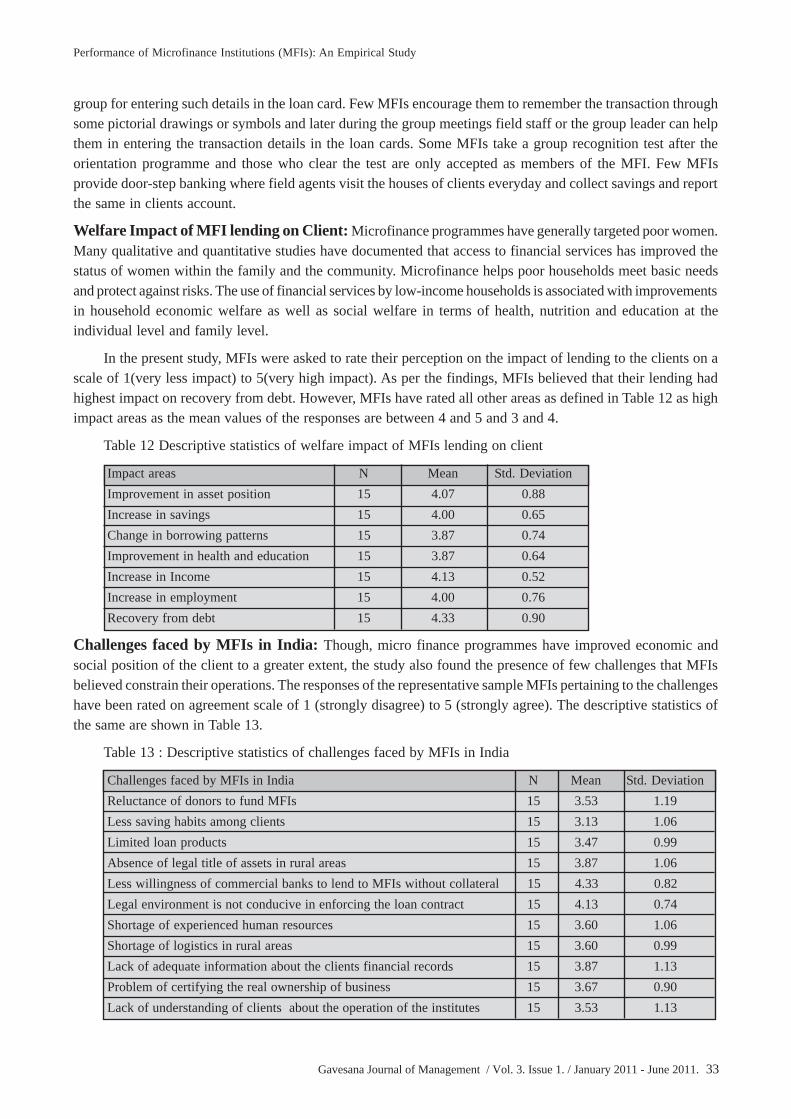
Gavesana Journal of Management / Vol. 3. Issue 1. / January 2011 - June 2011. 33
group for entering such details in the loan card. Few MFIs encourage them to remember the transaction throughsome pictorial drawings or symbols and later during the group meetings field staff or the group leader can helpthem in entering the transaction details in the loan cards. Some MFIs take a group recognition test after theorientation programme and those who clear the test are only accepted as members of the MFI. Few MFIsprovide door-step banking where field agents visit the houses of clients everyday and collect savings and reportthe same in clients account.
Welfare Impact of MFI lending on Client: Microfinance programmes have generally targeted poor women.Many qualitative and quantitative studies have documented that access to financial services has improved thestatus of women within the family and the community. Microfinance helps poor households meet basic needsand protect against risks. The use of financial services by low-income households is associated with improvementsin household economic welfare as well as social welfare in terms of health, nutrition and education at theindividual level and family level.
In the present study, MFIs were asked to rate their perception on the impact of lending to the clients on ascale of 1(very less impact) to 5(very high impact). As per the findings, MFIs believed that their lending hadhighest impact on recovery from debt. However, MFIs have rated all other areas as defined in Table 12 as highimpact areas as the mean values of the responses are between 4 and 5 and 3 and 4.
Table 12 Descriptive statistics of welfare impact of MFIs lending on client
Impact areas N Mean Std. DeviationImprovement in asset position 15 4.07 0.88Increase in savings 15 4.00 0.65Change in borrowing patterns 15 3.87 0.74Improvement in health and education 15 3.87 0.64Increase in Income 15 4.13 0.52Increase in employment 15 4.00 0.76Recovery from debt 15 4.33 0.90
Challenges faced by MFIs in India: Though, micro finance programmes have improved economic andsocial position of the client to a greater extent, the study also found the presence of few challenges that MFIsbelieved constrain their operations. The responses of the representative sample MFIs pertaining to the challengeshave been rated on agreement scale of 1 (strongly disagree) to 5 (strongly agree). The descriptive statistics ofthe same are shown in Table 13.
Table 13 : Descriptive statistics of challenges faced by MFIs in India
Challenges faced by MFIs in India N Mean Std. DeviationReluctance of donors to fund MFIs 15 3.53 1.19Less saving habits among clients 15 3.13 1.06Limited loan products 15 3.47 0.99Absence of legal title of assets in rural areas 15 3.87 1.06Less willingness of commercial banks to lend to MFIs without collateral 15 4.33 0.82Legal environment is not conducive in enforcing the loan contract 15 4.13 0.74Shortage of experienced human resources 15 3.60 1.06Shortage of logistics in rural areas 15 3.60 0.99Lack of adequate information about the clients financial records 15 3.87 1.13Problem of certifying the real ownership of business 15 3.67 0.90Lack of understanding of clients about the operation of the institutes 15 3.53 1.13
Performance of Microfinance Institutions (MFIs): An Empirical Study

34. Gavesana Journal of Management / Vol. 3. Issue 1. / January 2011 - June 2011.
As it can be observed from the mean values, for all the challenges as defined herein, MFIs response variedbetween agree and strongly agree. They did not disagree with any of these challenges. Financial sustainabilityof the MFIs is the key to their long term success. Since many MFIs are started on not-for-profit basis and manystill depend on group of donors for their survival, the lack of willingness by funding agencies might prove to bea barrier in achieving the financial sustainability.
Government has taken an encouraging initiative through its involvement in SHG-based microfinance.However, participant MFIs believed that the legal environment was still not conducive, particularly for the loancontract. For example, there is no provision among these institutions to guard themselves against potentialdefault. Besides, sometimes there is a problem of certifying the real ownership of the assets or business. Theseassets do not have clear legal titles. This makes them more vulnerable to bad debts.
As stated earlier, illiteracy among the clients is a major obstacle for the client as well as the MFIs. Theclients fail to understand the products properly. Majority of the MFIs have spread of operations in rural areas ascompared to the urban part and the field staff have to go regularly to these areas for verification and checks. Thelogistics problems in these areas again are an operational obstacle. MFIs sometimes do not have enoughinformation regarding the financial records of the clients for example, their income during last few years.Therefore, they cannot implement proper client selection mechanism.
Above all, provision of good staff for delivering micro finance products is proving to be a real challengefor these MFIs. As observed earlier, though majority of the clients of the MFIs are female, there are few femalestaff members in these organizations. It is harder for MFIs to find a woman who has the experience andqualifications necessary to do the job. Sometimes due to cultural norms of the community and the society atlarge, females do not prefer to work particularly in the rural areas for poor people.
Findings of the Study
Based upon the survey results of MFIs in India, the following findings emerged.
Majority of the MFIs were registered as NBFCs (40%) followed by the Society Act, 1860 (20%). Themajor funding source for the MFIs was borrowing from funding agencies and commercial banks (80%). Fourteenout of fifteen had been serving rural customers with average of 14822 centres across India. All these MFIs wereserving female members while there were 60% MFIs catering to male members. The average percentage offemale client in the rural segment was 71%. These MFIs served average 65% customers belonging to SC/STand other minority community. As far as the staff composition is concerned, the respondent MFIs had average64% male staff and 36% female staff.
All participant MFIs provided micro-credit (100%) followed by insurance (53%) while savings asmicrofinance products were neglected (20%). The average loan amount in the rural area was Rs.8355 while thesame in the urban area was Rs.9466. There was no statistically significant difference among the loan size by theMFIs in the rural and the urban area. The average interest rate and the average duration of the loan were 17%and 12 months respectively. Average default rate on loan repayment was observed to be 1.03% approximately.The main reasons for this default as described by the MFIs were sickness of the borrower or the family member,crop failure and bankruptcy in the business. While selecting the client, the MFIs considered outstanding debt,willingness to join credit group, capacity to engage in income generating activity and permanent address asimportant factors.
The major problem working with female clients as described by these MFIs was illiteracy among suchmembers. Due to this, they were not able to understand their products and failed to maintain proper records oftheir transaction. The female members neglected weekly and monthly meetings due to family commitment andhousehold obligations. In order to ensure that the loan and the income of the female members are not surrenderedto male members of the family, MFIs performed regular field checks. These females were also provided the
Performance of Microfinance Institutions (MFIs): An Empirical Study

Gavesana Journal of Management / Vol. 3. Issue 1. / January 2011 - June 2011. 35
pass book and were encouraged to enter the details of the transaction either with the help of literate person fromthe village area or the field staff. Almost all the MFIs conducted group orientation programme to increase theawareness of the clients regarding the products and gender related issues.
Regarding the economic and social impact of the microfinance programmes, MFIs believed microfinancehad major impact on recovery from the debt among others such as improvement in asset ownership, health,education and savings.
MFIs believed that they faced certain obstacles in their operations, major being the lack of funding supportfrom banks and donors. The legal environment particularly with respect to loan contract is not conducive as pertheir opinion and they opined that it was challenging to find suitable human resource, especially, female staff toserve other female clients.
Limitations of the study
The study as reported here is unavoidably limited by certain constraints. The small sample size of thestudy i.e. 15 MFIs across India put restriction on the generalizability of the findings. Many of the MFIs operatingin India out-rightly declined to participate in the survey as they believed that their policy determinants shouldnot be made public. Besides, it was not possible to declare the name of the MFIs participating in the research asthe respondents requested for not disclosing their identities for confidentiality purpose.
This study covers only the supply side of microfinance i.e. the institutions. However, the demand side ofmicrofinance i.e. the responses from the respondents availing these services could have provided better insightsand verification to the findings of this study.
The study is subject to some of the challenges related to methodological aspects. The study is based onsurvey research methodology through questionnaires and therefore is subject to the common survey errors likesocial desirability issue, respondent’s bias, measurement error etc. Other research methods like case study orthe participatory action research would have given more insightful findings and deepen the knowledge inspecific areas. Further, personal interviews with the heads of these MFIs could have been more justified insteadof mailing them the questionnaire for availing their responses. However, due to time, cost and location constraints,it was not applied.
Conclusion
The study examines the functioning of microfinance institutions in India. It has been clearly establishedthat microfinance can have a major impact on reducing poverty at national as well as local level. However,microfinance is still a major challenge in expanding its outreach in a suitable format. It has been observed that40% of the participant MFIs have been registered as NBFCs. Still, there is a vast scope for the remaining MFIsto adopt some alternative legal form such as corporate structure, which can more easily attract outside investors,encourage better governance and disclosure standards. The product portfolio of these MFIs has been heavilyfocused upon micro-credit while the savings have been largely neglected. In fact, savings play a crucial role inprotecting against the seasonality of cash flows and may help to improve the well being of the poor in generaland women in particular. In addition, building up deposits helps in building financial discipline among poor. Itcan also yield collateral and serve as a source of funding for MFIs. It has to be accepted that small loans are notalways appropriate for poor women. After all, loans become a debt and the poor are exposed to crisis if anexpected source of repayment evaporates. Hence, it is an access to a saving account that needs to be the coreservice on offer.
It has been observed in the findings that average duration for the loan is approximately 12 months. Thisshort term focus on duration might encourage the clients to participate only in trade related activities ratherthan production related activities. The biggest challenge in development is the improvement of skill levels of
Performance of Microfinance Institutions (MFIs): An Empirical Study

36. Gavesana Journal of Management / Vol. 3. Issue 1. / January 2011 - June 2011.
the borrowers. Regular training through workshops on record keeping, use of simple language in oral andwritten communication help illiterate clients understand the microfinance products properly and get advantageof the same.
Nevertheless, there are several positive impacts of microfinance programmes as noted in the literature.Empowerment of women and the inculcation of financial training and discipline amongst the poor willundoubtedly have long-term socioeconomic benefits.
References
Acharya, N 2008, ‘Micro Finance and Rural Poor in Orissa’, in Das, SK, Nanda, BP & Rath, J (eds.), MicroFinance and Rural Development, New Century Publications, New Delhi, pp 8-16.
Agarwal, V 2005, ‘Role of women in microfinance’, in Agarwal, V & Kashyap, VRP (eds.), Microfinance- anIntroduction, ICFAI University Press, Hyderabad, pp 100-113.
Anand, J 2002, Self-Help Groups in Empowering Women: Case study of selected SHGs and NHGs, DiscussionPaper No. 38, Kerala Research Programme on Local Level Development Centre for Development Studies,Thiruvananthapuram, pp 1-76, viewed 14 August 2010, http://krpcds.org/w38.pdf.
Brau, J & Woller, G 2004, ‘Microfinance: A comprehensive review of existing literature’, Journal ofEntrepreneurial Finance and Business Ventures, vol. 9, no. 1, pp. 1-26.
Das, SK 2008, ‘Micro Finance, Self-Help groups and poverty removal’, in Das, SK, Nanda, BP & Rath, J(eds.), Micro Finance and Rural Development, New Century Publications, New Delhi, pp 64-68.
Dhal, PC 2008, ‘Dynamics of micro finance and social transformation’, in Das, SK, Nanda, BP & Rath,J(eds.), Micro Finance and Rural Development, New Century Publications, New Delhi, pp 19-29.
Kashyap, VRP 2005, ‘Microfinance-An Introduction’, in Agarwal, V & Kashyap, VRP (eds.), MicrofinanceIntroduction, The ICFAI University press, Hyderabad, pp 2-9.
Kereta, B 2007, Outreach and Financial Performance Analysis of Microfinance Institutions in Ethiopia, paperpresented at African Economic Conference United Nations Conference Center (UNCC), Addis Ababa, Ethiopia15-17, November, viewed 2 August 2010, http://www.uneca.org/aec/documents/Befekadu%20B%20Kereta.pdf.
Keshava, Mehta AK and Gill HK 2010, ‘Management of Economic Activity in Women Self-Help Groups’,Indian Research Journal of Extension Education vol. 10, no.1, January, pp 58-61.
Mallick, R 2002, ‘Implementing and evaluation of microcredit in Bangladesh’, Development in Practice, vol.12, no. 2, May, pp 153-163, viewed 2 August 2010, http://academic.evergreen.edu/curricular/ATPSMPA/Mallick.pdf.
Nourse, TH 2001, ‘The missing parts of microfinance: Services for consumption and insurance’, SAIS Review,vol. 21, no. 1, Winter-Spring, pp 61-69.
Pati AP & Lyngdoh BF 2008, ‘Micro finance and empowerment of women’, in Das, SK, Nanda, BP & Rath,J (eds.), Micro Finance and Rural Development, New Century Publications, New Delhi, pp 30-39.
Pitt, M & Khandker, SR 1998, ‘The impact of group-based credit programs on poor households in Bangladesh:Does the gender of participants matter?’, The Journal of Political Economy, vol. 106, no. 5, pp 958-996.
Puhazhendi. V & Badatya, KC 2002, SHG-Bank Linkage Programme for Rural Poor – An Impact Assessment,National Bank for Agriculture and Rural Development, Paper presented at the Seminar on SHG-bank LinkageProgramme at New Delhi on 25th and 26th November, viewed 2 August 2010, www.nabard.org/pdf/publications/sudy_reports/puhazhendi.pdf.
Performance of Microfinance Institutions (MFIs): An Empirical Study
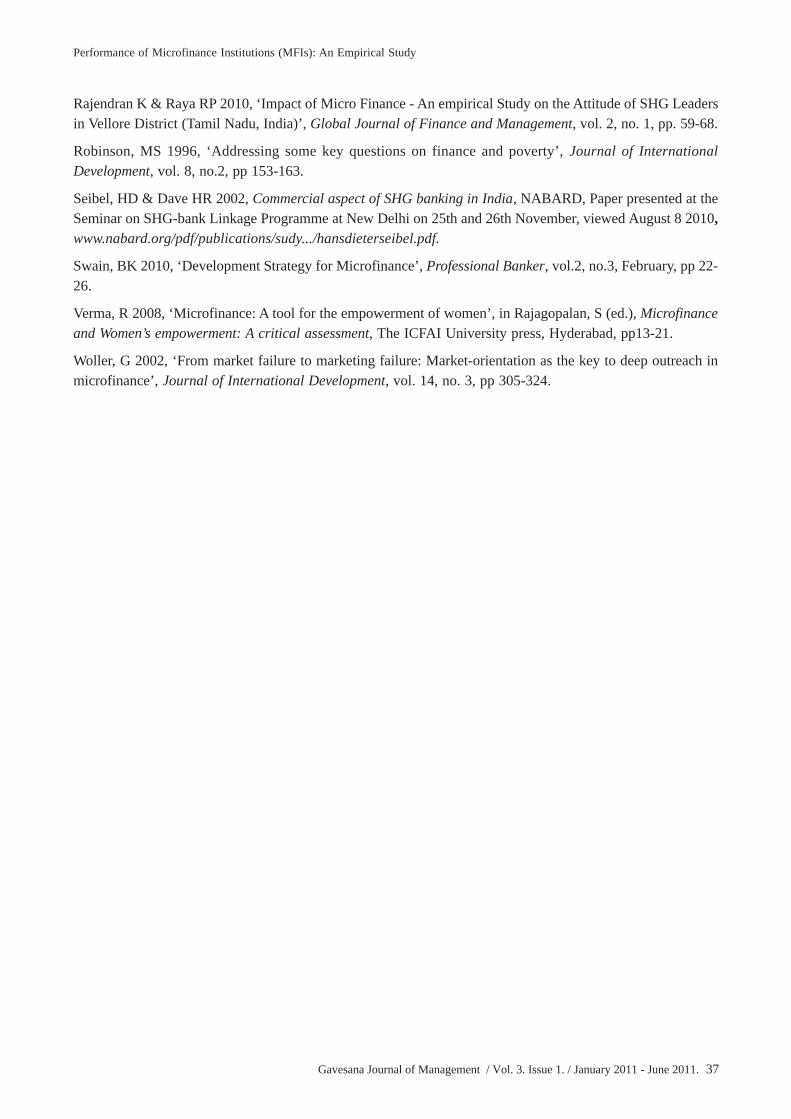
Gavesana Journal of Management / Vol. 3. Issue 1. / January 2011 - June 2011. 37
Rajendran K & Raya RP 2010, ‘Impact of Micro Finance - An empirical Study on the Attitude of SHG Leadersin Vellore District (Tamil Nadu, India)’, Global Journal of Finance and Management, vol. 2, no. 1, pp. 59-68.
Robinson, MS 1996, ‘Addressing some key questions on finance and poverty’, Journal of InternationalDevelopment, vol. 8, no.2, pp 153-163.
Seibel, HD & Dave HR 2002, Commercial aspect of SHG banking in India, NABARD, Paper presented at theSeminar on SHG-bank Linkage Programme at New Delhi on 25th and 26th November, viewed August 8 2010,www.nabard.org/pdf/publications/sudy.../hansdieterseibel.pdf.
Swain, BK 2010, ‘Development Strategy for Microfinance’, Professional Banker, vol.2, no.3, February, pp 22-26.
Verma, R 2008, ‘Microfinance: A tool for the empowerment of women’, in Rajagopalan, S (ed.), Microfinanceand Women’s empowerment: A critical assessment, The ICFAI University press, Hyderabad, pp13-21.
Woller, G 2002, ‘From market failure to marketing failure: Market-orientation as the key to deep outreach inmicrofinance’, Journal of International Development, vol. 14, no. 3, pp 305-324.
Performance of Microfinance Institutions (MFIs): An Empirical Study

38. Gavesana Journal of Management / Vol. 3. Issue 1. / January 2011 - June 2011.
Talent Management for Organizational Success:A Conceptual Framework
G. M. Archana Das*
Abstract
Talent management in organizations is considered crucial for staying on the frontier in a competitiveenvironment. Realizing this, of late organizations started critically examining some of the viable talentmanagement practices. Implementation of these practices serves to motivate employees to perform better whichin turn serves to improve profit margins of the organisation. This paper explores various initiatives of organizationsthrough case examples of talent management practices from India and abroad. In addition, several studiesrelated to talent management practices are also discussed highlighting the positive organizational outcomesassociated with it.
Keywords : TM, Recruitment, Workforce, Performance Management
Introduction
The concept of talent management has gained immense amount of attention as the outcomes associatedwith it are constructive, functional and positive in nature. There is a progressive movement to transform the HRfunction and establish a Human Capital Management or a Talent Management environment, which truly leveragesthe employees as a competitive tool. Talent management itself is defined as the process of managing thedevelopment and deployment of employees from recruitment to retirement. (Cushing 2010). Talent Managementis an eclectic and deliberate approach that aims to lure and retain talented employees. Even though there is astrong need for talent management, many organizations flounder to leverage their efforts to implement viabletalent management strategies. In fact, only 5 percent of organizations say that they have a clear talent-managementstrategy and operational programs in place today. (Anonymous, 2009). Low levels of employee morale, employeedemotivation coupled with high levels of dissatisfaction and high attrition rates are the driving forces thatencourage the immediate implementation of talent management practices. Employee development andorganizational development are the resultant outcomes of good talent management practices.
Research studies conducted over a period of time consistently indicate a positive correlation betweentalent management practices and employee performance. For example Hackett Group, a global strategic advisoryfirm, examined the performance at more than 60 companies over a three-year period and found that the talentmanagement maturity leaders significantly improved net profit margin and return on equity and assets. Theseleaders were able to create organizations that better motivate and manage their talent and had clear advantagesover typical companies in key areas such as the ability to create and sustain strong corporate cultures, retainboth overall employees and specifically top talent, and plan for changes in skills supply and demand. (TonyDiRomualdo, Stephen Joyce and Nathalie Bression, 2009).
Voluntary turnover is a major problem for companies in many Asian countries such as Hong Kong, SouthKorea, Malaysia, Singapore, and Taiwan (Barnett, 1995; Chang, 1996; Syrett, 1994). For example, in 1995 theaverage monthly resignation rates were 3.4%, 2.9%, and 2.7% in Singapore, South Korea, and Taiwan,respectively (Barnard & Rodgers, 1998). In a recent forum of the human resource professional bodies of HongKong, Malaysia, and Singapore in Malaysia, participants were unanimous in their view that job-hopping hadbecome so rampant in these countries that it had become a culture (Asia Pacific Management News, 1997).
*Assistant Professor, GITAM School of International Business, GITAM University, Visakhapatnam

Gavesana Journal of Management / Vol. 3. Issue 1. / January 2011 - June 2011. 39
The above study clearly indicates that job hopping syndrome among employees is increasing and employersshould be extremely careful and introduce good talent retention interventions. Organizations have to consideremployee career planning and factor this in their HR strategy to achieve growth and development. The mainobjective of talent management is to retain and nurture outstanding performers while regularly moving out themisfits.
The current paper emphasizes the merits associated with talent management practices and its impact onemployee retention. The paper also highlights some of the research findings that analyzed different talentmanagement practices.
Significance of Talent Management
Talent Management follows a holistic approach that integrates a number of human resources andmanagement initiatives. (Anonymous, 2009)
• Recruitment: Ensuring the usage of appropriate internal and external recruitment methods to stimulate apool of candidates to apply for a vacant position in the organization.
• Retention: Developing and implementing practices that reward and support employees.
• Employee development: Ensuring continuous informal and formal learning and development.
• Leadership and “high potential employee” development: Specific development programs for existingand future leaders.
• Performance management - Specific processes that nurture and support performance, including feedback/measurement.
• Workforce planning - Planning for business and general changes, including the older workforce andcurrent/future skills shortages.
• Culture - development of a positive, progressive and high performance “way of operating”.
Workforce Recruitment
There are teething problems evidenced by organizations in the current scenario. Firstly, organisations findit difficult to lure and stimulate a pool of talented candidates to apply for a vacant position in their organisation.Secondly, employers are unable to reduce employee exodus from the current organisation. Research studyconducted by Talent Pulse Survey 2005 of over 1,400 HR practitioners worldwide by Deloitte consultancy,reports that the most critical people management issues are attracting and retaining high-caliber workers. Theseissues are further heightened by the fact that 54% of the respondents believe that talent issues have an impacton overall productivity and that there is a clear link between talent management and business performance.(Insala, 2005).
Brand image is more important for the recruitment of locals in overseas projects. For instance, Infosysstated (Business line, 14th July 2010) that the challenges involved in hiring outside India are high, as the brandis not very strong outside and the organization needs to put some efforts. Reducing dysfunctional attrition hasalso become an uphill task in most of the companies. However companies like Wipro, TCS, Infosys followsome of the internal measures like group re-banding for people in the three- to seven-year experience band,salary hike (7-12 per cent) and a restricted stock option to managers and above levels to curb employee exits.Organizations also started revising their hiring targets to overcome the problem of attrition and man powerdeficit. . For instance TCS decided to hire 50,000 people for the whole year 2010 (as against 30,000 indicatedearlier), Infosys has changed its guidance to 40,000 from the earlier number of 36,000. While 90,000 jobs wereadded during 2009, this year (2010) the IT/ITeS sector would absorb around 200,000 people, according toNasscom estimates. (Business Line, Oct 29, 2010).On the contrary, some organizations view manpower deficit
Talent Management for Organizational Success: A Conceptual Framework
40. Gavesana Journal of Management / Vol. 3. Issue 1. / January 2011 - June 2011.
as an additional advantage and opportunity. For example, Microsoft tolerated employee shortages, insisting onemploying fewer employees than required –as per the formula “n minus 1” where “n” was the number actuallyneeded. And they asserted that the scarcity of resources would motivate the leaders not to comprise on quantitybut for quality or the cream.
Another strategy that is used by HR managers to reduce the Human Resource Accounting costs is to rehirethe employees who have quit the company. For instance, Infosys has started a new hiring initiative called“Green Channel” which aims at getting back those employees who have quit the company in the last fewmonths. Similarly HP also adopted the same initiative known as “Homecoming”.
Ready and Conger (2007) state that the vitality of a company’s talent management process is a product ofthree defining characteristics: commitment, engagement, and accountability. By following proper selectionpractices, organizations can procure diverse employees who are committed, engaged and responsible. Studiesindicate that diversity acts as a strategic lever for growth and innovation. The article reports on research fromthe Chartered Institute of Personnel and Development (CIPD) in Great Britain concluded that integrating diversityinto talent management strategy will help organizations economic recovery. So organizations can introducevery good recruitment methods to create moderately diverse workforce. In a nutshell, one can emphaticallyassert that talent management practices acts as a catalyst in amplifying organizational performance.
Performance Management
Companies with strong business performance are those with strong employee performance managementprograms. This finding was reported by the 2007 State of Performance Study conducted by WorldatWork andSibson Consulting which surveyed more than 550 HR professionals (Scottsdale, 2007).Performance Managementinvolves thinking through various facets of performance, identifying critical dimensions of performance, planning,reviewing, and developing and enhancing performance and related competencies.(Rao 2004). Managers canexpect relatively high performance if the goal setting involves both the superior as well as the subordinate.However, for the organisation to accrue success, these goals should align with the business objectives and thevision of the organisation. It is also important to design a very good appraisal method to measure the disparitybetween the expected results and the achieved results. Superiors can exude the trust and confidence of theemployees only when the appraisal method is communicated to all the employees of an organisation.
Most of the companies like TCS, Wipro, SBI, and Honeywell are using 360-degree appraisal method togauge an employee’s performance. Once the performance is gauged, the HR manager can think about variousinterventions to improve the performance. Unlike explicit and harsh practices, implicit practices like training,mentoring and counseling can be adopted to bring a sea change in an employee’s performance. Poor andmediocre performers can be given training while high performers can be given development programmes andexciting reward systems that would act as a motivator and a talent retention strategy. For example, at Intel,rewards are clearly linked to performance. About half of pay is tied to company and /or divisional performance,and more than 70% of the employees have rights to purchase stock options. The way Intel management sumsthis up is, “The reward system reinforces the company’s high expectations of its employees to grow, learn, andlead.” Leaders by following a magnanimous and objective approach can expect high employee commitmentand involvement.
Employee Training, Development and Retention
Employee Training: Training enables an individual to learn skills that are required to perform the currenttask. A few decades ago most of the employers assumed that leaders are born, not made. So this kind of rigidstereotypical notions or perceptual sets discouraged the employers to provide training to the employees. But theemployers of the current scenario gave immense amount of importance to training as it is directly related to theemployee satisfaction and organizational development. For instance, Cognizant reported that during 2009 nearly
Talent Management for Organizational Success: A Conceptual Framework

Gavesana Journal of Management / Vol. 3. Issue 1. / January 2011 - June 2011. 41
$1.4 million was spent on training activities and the average training period for an existing employee was twoweeks. According to the recent review by Harvard Business Review, there is a direct link between traininginvestment of the companies and the market capitalization (Training and Development in IT/SoftwareDevelopment Industry 2007). Those companies with higher training investment had higher market capitalization.This indicates that training improves individual performance, which in turn, facilitates the organization inachieving its business goals. Unlike training the employees’ technical skills, which have always been an essentialpart in IT industry, companies also provide managerial skills development.
Evidencing the merits of training, companies keep aside 3-5% of revenue for training programs. As anexample, some of the major players like Tata Elexi and Accenture are allocating 7% and 3% respectively of thecompany’s overall revenue for conducting training programmes.
However, merely conducting training programmes will not fulfill the purpose. Only when the trainingprogrammes are properly prioritized and aligned with the business objectives, organizations can expect highreturn on investment. The need to conduct training programmes is again dependent on the competency level ofan employee and the importance of learning a skill to organizational performance. Once the training programmesare conducted, HR managers should gauge the effectiveness of the training programme and ensure that thetransfer of learning to the real work place is high. If the transfer of learning is found to be nominal then requiredmodifications have to be made on the areas like trainer’s teaching pedagogy, learning style and so on.
Employee Development
Employee development is a multi-pronged strategy that aims at upgrading employees competencies topursue future tasks that are herculean and challenging in nature. Employee development acts as a retentionstrategy and motivates the employees to expend more efforts to reach the corporate ladder soon. Most of theorganizations are following succession planning as a part of the talent management practice. Succession Planningis a realistic program that facilitates the identification and development of internal talent, for leadership andother key positions, who will compliment and drive an organization’s future vision. However, the success ofthis practice is dependent on the proper employee identification. Organizations rely on Human ResourcesInformation System, past performance appraisal reports and competency inventories to identify talent pool. Forexample, Infosys which has given impetus for leadership talent development has set up the Infosys LeadershipInstitute (ILI) for identifying top-notch performers in the organization. These candidates would undergo rigorousdevelopmental programmes for a period of three years based on “Nine Pillar” leadership development modelthat comprises 360 degree feedback, developmental assignments; Infosys culture workshops, developmentalrelationships, leadership skill training, feedback intensive programs, system process learning, communityempathy and action learning. Companies like GE, Colgate-Palmolive, and HDFC are staunch supporters ofsuccession planning as it increases organizational performance. Empirical studies also suggest that the existenceof formal employee advancement plans is linked to business performance. Hewitt Associates in the year, 2003conducted a study of more than 100 companies and found that organizations consistently using a formal processto help workers advance, are also consistently high-performing firms, as measured by total shareholder return.(Career Development Software and Tools, 2006)
Employee Retention Practices
Attrition is a major problem in most of the companies. To thwart dysfunctional attrition, HR managers canresort to novel yet plausible and practical retention practices in companies. Retention practices involve theorganizational measures that encourage employees to remain in the organisation for a maximum period of time.Employees of current generation are completely different from employees of yesteryears. They are more likelyto have “Job Hopping Syndrome” a tendency of an employee to leave an organisation in the middle of theproject, if the organizational practices and policies are not congruent with employees’ expectations. Henceorganizations have to be extremely cautious and meticulous, when they are hiring employees. HR managers
Talent Management for Organizational Success: A Conceptual Framework

42. Gavesana Journal of Management / Vol. 3. Issue 1. / January 2011 - June 2011.
can follow a customized approach to motivate their employees and keep them glued to the organisation. However,HR has to unravel the interests, key goals of employees by conducting employee surveys and assessments.
For instance, Microsoft makes use of computerized tools that allows “adaptive questioning”. In this methoda computer presents users with a gamut of attributes to know what is important to each individual. A set ofquestions are tailored to each employee’s response and continues to adapt as the employee proceeds further.The most salient feature of this e-survey is that it would make an estimation and prediction regarding employeeattrition. Though predictions made out of e-surveys may not correlate with the actual turnover, asking aboutturnover intentions offered Microsoft a substantial input: the chance to connect investments in rewards with thecosts of turnover and thus optimize total rewards based on projected return on investment. HR managers incollaboration with the finance colleagues estimated the cost of turnover as well as the cost of each of the rewardlevels.
Organizations have also adopted some of the retention practices like providing variable compensation,promotion opportunities, condensed work weeks, flexi time, fexiplace, and sabbaticals. While designing retentionstrategies, HR managers should consider the demographics and dynamics of the employees. A survey by CareerBuilder released in October 2007 found that 87 per cent of all hiring managers and HR professionals said thatmost Gen-Y workers feel more entitled in terms of compensation, benefits and career advancement than oldergenerations. A recent study by Hudson Recruitment and Talent Management revealed differences betweenwomen and men in terms of a desire for promotion. Men indicated that they prefer the trappings of a job salary,title, and prestige while women focused on having interesting and meaningful work. (Michael Laff, 2008). Theabove studies clearly indicate that the design and success of talent management and retention practices iscontingent on age, gender, and ethnicity. As individual differences exist, it is important for HR managers toconsider the interests and accordingly strategize people policies objectively.
Research indicates that poor compensation acts as a topnotch determinant of attrition. For instance, TheReserve Bank of India Governor cautioned that if compensation provided by public sector banks is not on parwith the private sector counterparts, public sector banks run the risk of losing talent to the private sector.(Business Line, September 8th 2010). The above example clearly indicates the need to adopt retention practicesimmediately to reduce dysfunctional attrition. Though it seems to be an uphill task for the HR manager, theproblem of attrition can be tackled by adopting consistent HR policies that are employee friendly in nature. Forinstance, Bosch Ltd. evidenced relatively high phenomenal growth due to the consistent HR policies and practices,at both the blue collar and white collar levels. They enthuse the employees by providing careers that are excitingin nature, bestowing close knit attention to career planning and development. Employees of Bosch are alsorotated across functions, locations, divisions and even countries. This trains the employees, gives a goodinternational exposure and transforms them from “specialist” to “generalist”.
Conclusion
Organizations that want to excel should identify, invest and implement good talent management strategiesas the financial value associated with talent management is very high. Talent management when integratedstrategically provides significant benefits and amplifies organizational growth and development. But forcompanies to reap high economic profits it should embrace talent management system as an ongoing processbut not as a one-time event. It becomes imperative to state that careful forecasting and design of a sound talentstrategy that is connected to organisation’s overall strategic vision is required for organization’s growth andoverall development.
Talent Management for Organizational Success: A Conceptual Framework

Gavesana Journal of Management / Vol. 3. Issue 1. / January 2011 - June 2011. 43
Recommendations
Research studies indicate that organisations need to bestow their attention on the following areas and theyinclude (Shawn Fegley’s, 2006)
1) Building a deeper reservoir of successors at every level;
2) Creating a culture that makes employees want to stay with the organization;
3) Identifying gaps in current employees and candidate’s competency levels;
4) Creating policies that encourage career growth and development opportunities.
Organizations can be optimistic about their profit margins and revenues if they bestow their unrelentingcommitment and attention towards the implementation of the above best talent management practices.
References
Anonymous 2006, Career Development Software and Tools: “Technology Trends”, 7 September, viewed 20th
October 2010,
(http://www.insala.com/Articles/career development/career-development- Software-and-tools-technology-trends.asp).
Anonymous 2009, Talent Management, viewed 27 December 2010, http://www.scribd.com/doc/26150041/Talent-Management
Barnard M.E. and Rodgers, R.A. 1998. What’s in the package? Policies for the internal cultivation of humanresources and for high performance operations. Asia Academy of Management (Hong Kong), 1998.
Barnett R. 1995. Flexible benefits: Communication is the key. Benefits and Compensation International, Vol24 No 6: Pg 25-28.
Chang, H. 1996. In Singapore, the dreams are getting bigger, Business Week, 23 September P.9
Cushing, Anderson 2010, ‘Talent Management as Survival Skill’, Business Intelligence, viewed 24 February2011, <http:// clomedia.com/>.
Insala 2005, Current research in Talent Management, viewed 27 Dec 2010, http://www.icareercenter.net/Articles/talent-management/current-research-in-talent-management.asp
Michael Laff (2008, July). Management Quagmire, viewed 28 Nov 26th 2010, (http://www.astd.org/NR/rdonlyres/6FE0A856-D368-404C-A54B E311A05F0157/17368/76080714.pdf.)
Rao T.V. (2004). Performance Management and Appraisal Systems. India. Sage Publications, India.
Ready A, Conger, A. 2007, Make your company a talent factory. Harvard Business ReviewViewed.27october2010,(http://businesstalentdna.com/pdf/Make_your_company_a_talent_factory%5B1%5D.pdf)
Shawn Fegley, 2006, Talent Management , Society for Human Resource Management, United States of America,viewed December 2010, http://www.shrm.org/Research/SurveyFindings/Documents/2006%20Talent%20Management%20Survey%20Report.pdf
Syrett, M. 1994. Through thick and thin, Asian Business, Vol 30 No.12 P.26-30
Talent Management for Organizational Success: A Conceptual Framework

44. Gavesana Journal of Management / Vol. 3. Issue 1. / January 2011 - June 2011.
Financial Decisions by Small and Medium Enterprises:An Empirical Study
P. Sheela*
Abstract
Small and Medium Enterprise sector (SMEs) in India constitutes the growth engine of the economy whichcreates one million jobs every year and produces more than 8000 quality products for India as well as internationalmarkets. There is an urgent need today to empower the SEMs in order make them take their rightful place asthe growth engine not only for the Indian economy but also for the international economy. It is high time thatthese SMEs are pulled out from the stage of underdeveloped to a highly developing stage and this could only bepossible if these SMEs are financially empowered. The reasons for this stage are poor financial accessibility,lack of proper efficiency in their financing and investment decisions and their inability to convert the opportunitiesinto their strengths . In this contest this paper is an attempt to showcase the financial decisions that are currentlyfollowed by the SMEs operating in Andhra Pradesh. The study focuses on their capital structure and capitalbudgetary decisions. In total 150 SMEs in Andhra Pradesh were surveyed and the analysis was based upontheir response.
Keywords: Capital Structure, Capital Budgeting, Financial and Investment Decisions, Micro Credit, SMEs
Introduction
Small and Medium Enterprises(SMEs) are termed as a vital organ for economic growth and developmentin developing and industrialized countries. Finances to these SMEs is very essential for helping them to set upand expend their economic activity. In practice SMEs start out as an idea involving one or few people, who arewilling to invest their own money and later seek financial help from other sources. In the process of growththese SMEs need new investment avenues in order to expand or innovate their business further. Here is wherethese SMEs often face problems, as they find it much difficult to derive financial support when compared tothat of lager businesses.
A financial gap starts growing between the available sources to that of the required funds, because of therapid speed of innovation, that demands a high growth potential which needs more and more investment. IfSMEs cannot find the financing avenues , then the brilliant ideas would definitely fall by the way side and thiswould lead to a loss potential for the growing economy. So there is every need to educate the SMEs along withthe financial aspects related to the arrangement and optimum use of the funds, and they need to take care oftheir investment decisions through empowering them in using various financial tools and techniques.
The difficulties that the SMEs encounter are lack of expertise, limited scale of operations, incompleterange of financial products and services, regulatory rigidity, lack of information regarding capital availabilityand SMEs tend to vary by their nature of economic activity to show a far more volatile pattern of growth,investment and earning. Moreover their survival rate is lower than that of the larger firms. In spite of the variedbottlenecks that the SMEs are being exposed to, they are still able to achieve their objectives and contribute tothe economy’s growth. In the present world of competition, there is every need to educate and empower theseSMEs to start realizing the importance and the applicability of financial expertise and its uses which wouldfurther enhance their contribution to the developing economics.
In spite of the efforts made by the Government, there are still more efforts that the Government shouldemphasise upon to improve the awareness among these SMEs of the various ranges of financing options
*Professor and Head, Department of Finance, GITAM University, Visakhapatnam.

Gavesana Journal of Management / Vol. 3. Issue 1. / January 2011 - June 2011. 45
available to them through the government, private investors, banks, micro-credit facilities and micro financeschemes that are made available to them along with the awareness programs which would enhance theirsources of information and knowhow in order to boost their effectiveness and contributions for the bettermentof the economy.
In India, SMEs are the largest providers of employment and its contribution to exports is one third of thetotal Indian exports. SMEs with high turnover and adaptability play a Major role in removing regional andsection unbalance in the economy.
Review of Literature
Dutta Prabal (2005) in their study, emphasized on the importance of SMEs in the development of theeconomy and had saidstated in any economy the SMEs account for around 70.5% of employment, 35% exportsand a majority of earning to the nation. But still the SMEs face a lot of barriers in raising capital and havesuggested many measures to overcome such barriers.
SMEs lack of access to capital and high interest rates charges are partially the result of incomplete (or no)accounting records, and the inefficient use of accounting information. Poor record keeping and accountinginformation make it difficult for financial institutions to evaluate potential risks and returns (World Bank 1978),making them unwilling to lend to SMEs. As a result, SMEs pay high interest rates or fall back on the middlemenor moneylenders, whose loans are costly and often restrictive (Institute for Small and Medium EnterprisesDevelopment). The misuse and inaccuracy of accounting information causes SMEs to inaccurately assess theirfinancial situation, and make poor financial decisions, as well as leads them to face with the high failure rate(Byron & Friedlob 1984; DiPietro & Sawhney 1977; Fredland & Morris 1976).
Due to the lack of access to the capital markets, the allocation of capital in small firms is very important.Capital assets involve a large amount of money. It should be planned to be sure that funds are available. Theresult of capital budgeting decisions continues for many years. Unnecessarily high expense (depreciation andothers) will occur, if the firm invests too much. In contrast, uncompetitive production and loss of market sharedue to insufficient model and inadequate capacity of equipment may arise, if the firm does not invest enough.An incorrect forecast of asset requirements can have serious consequences. Effective capital budgeting canimprove asset acquisitions (Brigham, Gapenski & Ehrhardt 1999). Although capital budget is important tosmall firms, they do not use the tools that have been developed to improve these decisions (Runyon 1983).Studies show that many small firms are more likely to rely on the payback approach, even though the NPV andIRR methods are both superior to the payback (Graham & Harvey 1999 quoted in Brigham & Houston 2001;Walker, Burns & Denson 1993). Runyon (1983) showed that a small business may put itself at a seriouscompetitive position because it fails to use sophisticated discounted cash flow methods.
The use of efficient capital budgeting decision methods makes the task of successful operation of SMEseasier. Capital budget is very important to small firms in making long-term investments, yet many of them use“back-of-the-envelope” analysis instead of the tools that have been developed to improve their capital allocation(Runyon 1983). The studies of Bierman 1993, Runyon 1983, and Walker, Burns and Denson (1993) found thatunlike large firms, small firms do not use sophisticated capital budgeting methods.
They are more likely to rely on the payback approach, capital budgeting technique that ignores cash flowsthat are paid or received after the payback period, while large firms are more likely to rely on net present value(NPV), as the best single measure, and/or internal rate of return (IRR), a profitability measurement providing“safety margin” information. The different measures provide different types of information to decision makers.The more likely that discounted cash flow techniques would be used, the more is the increase in the survivalrate (Brigham, Gapenski & Ehrhardt 1999).
Financial Decisions by Small and Medium Enterprise’s: An Empirical Study

46. Gavesana Journal of Management / Vol. 3. Issue 1. / January 2011 - June 2011.
The Need and objectives of the study
From the review of the literature, it was found that a thorough research is very much required in the areaof SMEs with special emphasis on the financial and investment decisions. This paper focuses on three vitalaspects such as financial decisions, capital budgeting and future financial decisions of Small and MediumEnterprises. The study was carried through a Non-Disguised based questions. A total of 150 Small and MediumEnterprises operating in Andhra Pradesh were approached on the basis of Non-Probalistic convenience samplingmethod. From out of 150 responses to the questionnaire five questionnaires were incomplete and not taken forthe analysis. The 145 respondents were considered for the analysis purpose.
The objectives of the study is as follows:
1. To know the various sources of funds which these SMEs are employing
2. To know the state of growth of these enterprises
3. To study the capital structure of these SMEs
4. To study the capital budgeting techniques these SMEs are using
5. To analyze the association between the level of investment and capital budgeting techniques
6. To study the basis of calculation of capital budgeting techniques used by the SMEs
7. To study the basis of computations of cash flows followed by the SMEs
8. To understand the future intentions related to changes in the current capital structure, changes in thecurrent financial institutions and preference for various sources of finance.
In order to verify the required objectives the researcher has used Null Hypothesis which was framed andtested.
H01: there is not much significant association between the level of investment and the selection of capitalbudgetary technique.
H02 : there is not much significant association between the owner’s / partner’s experiences and the selectionof capital budgeting techniques.
The researcher has used the following statistical tools to analyses the collected data. Chi- square test andweight average score, Likert Scale Rating, Percentage Methods and SPSS weres used.
Analysis and Interpretation of Data
The sample collected is categorized into the type of Enterprise such as sole proprietorship or partnershipthe number of years of experience in business and the stage of growth in business.
Table 1: Type of Enterprise
Enterprise Frequency PercentageSole Proprietorship 60 41.37Partnership Firm 85 58.62
Table 1 shows that majority (58.62%) of the respondent SMEs were partnership Firms.
Financial Decisions by Small and Medium Enterprise’s: An Empirical Study

Gavesana Journal of Management / Vol. 3. Issue 1. / January 2011 - June 2011. 47
Table 2: Experience in Business
Years Frequency Percentage0-10 21 14.48Over 10-20 28 19.31Over 20-30 37 25.51Over 30-40 40 27.51Over 40-50 19 13.10
Table 2 refers to the experience of the financial head or the owner of the SMEs under study. Out of therespondents surveyed majority of them (27.59%) have put in 30 to 40 years of experience.
Table 3: Stage of Business Growth
Growth Stage Frequency PercentageInitial Stage 11 7.58Slow Growth Stage 61 42.06Fast Growth Stage 44 30.34Maturity 29 20Total 145 99.98
Table 3 refers to the stage of growth of the SMEs under the study and it shows that (42.06%)of the SMEsare in the slow growth stage.
Sources of Finance and the Capital Structure
Capital structure of a firm illustrates the various combinations of sources of financing that a firm Employ’s.Taking into account the importance of finance, the SMEs were asked to state the various sources of finance thatthey used. Table 4 states that majority of the respondents used their own funds as well as raising finance fromfinancial institutions. The study also shows that few of the respondents still preferred to source funds frommoney lenders.
Table 4: Investment Level and Sources of Funds Used
Sources of Funds Level of Investment0-20% Over 20-40% Over 40-60% Over 60-80% More Than 80% Total
Owned Funds 26 41 20 32 26 145Banks 23 34 25 19 22 123Other Sources 19 39 27 0 0 85Total 68 114 72 51 48 353
Investment Level and Sources of Funds
For any firm the sources of finance depends upon its built in assets, amount invested and business marketshare. This varies from firm to firm based upon their size, nature of activity etc. The sources of finance areclassified as long term funds such as equity, long term loans etc and short term funds in the form of credit,working capital etc. From table 4 we can relate the relationship between the level of investment and sources offinance used at various levels of investment. It also examines the various sources of funds that are available tothe SMEs. It is observed that Majority of them are using their own funds.
Financial Decisions by Small and Medium Enterprise’s: An Empirical Study
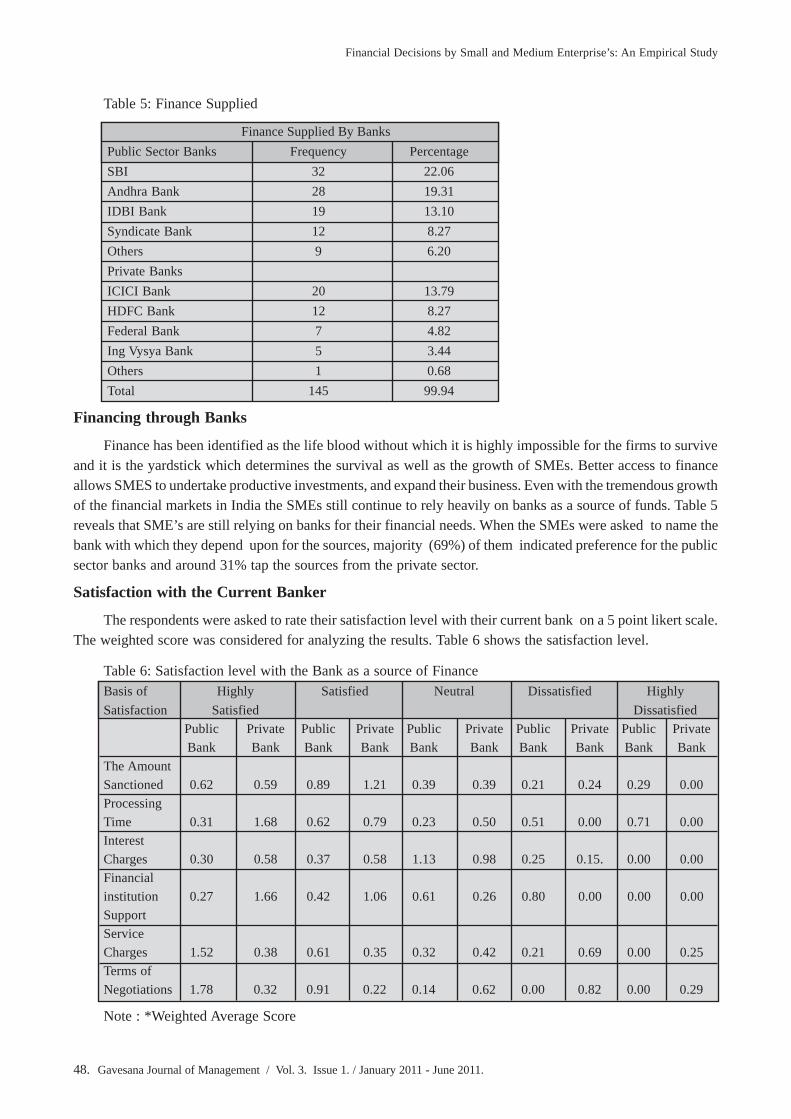
48. Gavesana Journal of Management / Vol. 3. Issue 1. / January 2011 - June 2011.
Table 5: Finance Supplied
Finance Supplied By BanksPublic Sector Banks Frequency PercentageSBI 32 22.06Andhra Bank 28 19.31IDBI Bank 19 13.10Syndicate Bank 12 8.27Others 9 6.20Private BanksICICI Bank 20 13.79HDFC Bank 12 8.27Federal Bank 7 4.82Ing Vysya Bank 5 3.44Others 1 0.68Total 145 99.94
Financing through Banks
Finance has been identified as the life blood without which it is highly impossible for the firms to surviveand it is the yardstick which determines the survival as well as the growth of SMEs. Better access to financeallows SMES to undertake productive investments, and expand their business. Even with the tremendous growthof the financial markets in India the SMEs still continue to rely heavily on banks as a source of funds. Table 5reveals that SME’s are still relying on banks for their financial needs. When the SMEs were asked to name thebank with which they depend upon for the sources, majority (69%) of them indicated preference for the publicsector banks and around 31% tap the sources from the private sector.
Satisfaction with the Current Banker
The respondents were asked to rate their satisfaction level with their current bank on a 5 point likert scale.The weighted score was considered for analyzing the results. Table 6 shows the satisfaction level.
Table 6: Satisfaction level with the Bank as a source of FinanceBasis of Highly Satisfied Neutral Dissatisfied HighlySatisfaction Satisfied Dissatisfied
Public Private Public Private Public Private Public Private Public PrivateBank Bank Bank Bank Bank Bank Bank Bank Bank Bank
The AmountSanctioned 0.62 0.59 0.89 1.21 0.39 0.39 0.21 0.24 0.29 0.00ProcessingTime 0.31 1.68 0.62 0.79 0.23 0.50 0.51 0.00 0.71 0.00InterestCharges 0.30 0.58 0.37 0.58 1.13 0.98 0.25 0.15. 0.00 0.00Financialinstitution 0.27 1.66 0.42 1.06 0.61 0.26 0.80 0.00 0.00 0.00SupportServiceCharges 1.52 0.38 0.61 0.35 0.32 0.42 0.21 0.69 0.00 0.25Terms ofNegotiations 1.78 0.32 0.91 0.22 0.14 0.62 0.00 0.82 0.00 0.29
Note : *Weighted Average Score
Financial Decisions by Small and Medium Enterprise’s: An Empirical Study

Gavesana Journal of Management / Vol. 3. Issue 1. / January 2011 - June 2011. 49
Table 6 states the Satisfaction level with the Bank as a source of Finance, the majority of the respondentsshowed more satisfaction with the private banks (1.19). The respondents have appreciated the private banksthat the processing time was quicker (WAS 1.68) than that of the public sector banks. When moving on to thenext attribute that is the interest charges both the public (WAS 1.13) as well as the private banks (WAS 0.98)were neutral, the reason for this could be because of the monetary policy of the economy and the banks do nothave a say in this regard. The study also reveals that the respondents preferred the services provided by theprivate banks (WAS1.66) when compared to the services of the public banks. When coming to the servicecharges the public banks (WAS1.52) service charges were more appreciated to that of the private banks services.Coming to the last aspect that is the terms of negotiations the public banks (WAS 1.78) were preferred.
Capital Budgeting
Capital budgeting is a planning process used to determine the firms long term investments. It is a vitaldecision making technique for investments which take time to mature and whose returns are based upon thefuture yield. It is essential to understand the present value of the future investments. This study reveals that allthe respondents were using capital budgeting techniques in one or the other aspects.
Capital budgeting decisions are crucial to a firm’s success for several reasons, like capital expendituretypically requires large outlays. Firms must ascertain the best way to raise and also repay the funds and mostimportant is that capital budgeting decisions require a long term commitment. Table 7 reveals the use of capitalbudgeting techniques that is being adapted by the SMEs at various levels of investments. In case of the SMEsunder study their level of investments is lesser when compared to that of the larger firms.
Table 7: Use of Capital Budgeting Techniques for Various Levels of Investment
Levels of Investment Frequency PercentageUp to 10 Lakhs 27 18.62Over 10 to 20 lakhs 32 22.06Over 20 to 30 lakhs 38 26.20Over 30 to 40 lakhs 48 33.10Total 145 99.98
The study states that the SMEs were using the capital budgeting techniques in one form or the other. Thestudy also found that with the increase in the level of investment the usage of the capital budgeting technique isalso increasing. From out of the respondents surveyed a majority of 33.10% were using the capital budgetingtechnique.
Capital Budgeting Technique Methods used
From among the various types of methods in capital budgeting techniques, this study is an attempt to findout the basic methods that are being used by the respondents. This study that found around 62.75% of therespondents are still relying upon the traditional method, which is seen from the Table 8. The reasons could bebecause the traditional method is easy and also since the investments used were generally low.
Table 8: Basis of Calculation of capital budgeting technique
Methods of Finance Frequency PercentageTraditional Method 91 62.75Discounted Method 54 37.24Total 145 99.99
Table 9 shows the usage of capital budgeting techniques by the SMEs under study. The most preferredtechnique is the payback period (56.55%). The reasons could be the ease in using this method. From thediscounted method the most preferred method was the NPV (22.75%).
Financial Decisions by Small and Medium Enterprise’s: An Empirical Study

50. Gavesana Journal of Management / Vol. 3. Issue 1. / January 2011 - June 2011.
Table 9: Usage 0f Capital Budgeting Technique
Techniques Always Very often Sometimes NeverPayback Period 82 (56.55%) 63(43.45%) 0(0%) 0(0%)Discounted Payback Period 0(0%) 0(0%) 0(0%) 145(100%)Average Rate of Return 0(0%) 21(14.49%) 24(16.55%) 100(68.96%)Net Present Value 12(8.27%) 33(22.75%) 32(22.06%) 68(46.89%)Internal Rate of Return 0(0%) 0(0%) 0(0%) 145(100%)Profitability Index 0(0%) 0(0%) 0(0%) 145(100%)Sensitivity Analysis 0(0%) 0(0%) 0(0%) 145(100%)
Hypothesis Results
To test the Hypothesis (Ho1) to find out the association between the level of investment and the selectionof the capital budgeting technique, Pearson chi-square test was used. The results of the test are shown inTable 10.
Table 10: Level of Investment and Capital Budgeting - Association
Methods Level of Always Very often Sometimes NeverInvestments
(in Rs. Lakhs)Payback 0-10 lakhs 15(10.34%) 9(6.20) - -Period* Over 10-20 Lakhs 28(19.31%) 11(7.58) - -
Over 20-30 Lakhs 31(21.37%) 12(8.3) - -Over 30-40 Lakhs 34(23.44%) 5(3.44) - -
Total 108(74.48%) 37(25.51%) - -Method Level of Always Very often Sometimes Never
Investments(in Rs. Lakhs)
Discounted 0-10 lakhs - - - 26(17.93%)Payback Over 10-20 Lakhs - - - 32(22.06%)Period$ Over 20-30 Lakhs - - - 40(27.58%)
Over 30-40 Lakhs - - - 47(32.41%)Total 145(100%)Method Level of Always Very often Sometimes Never
Investments(in Rs. Lakhs)
Average Rate 0-10 lakhs - 0(0%) 0(0%) 27(18.62%)of Return* Over 10-20 Lakhs - 0(0%) 0(0%) 25(17.24%)
Over 20-30 Lakhs - 0(0%) 0(0%) 45(31.03%)Over 30-40 Lakhs - 6(4.13%) 7(4.82%) 35(24.13%)
Total - 6(4.13%) 7(4.82%) 145(100%)Method Level of Always Very often Sometimes Never
Investments(in Rs. Lakhs)
Net Present 0-10 lakhs 0(0%) 0(0%) 0(0%) 11(7.58%)Value* Over 10-20 Lakhs 0(0%) 0(0%) 0(0%) 21(14.48%)
Over 20-30 Lakhs 0(0%) 0(0%) 0(0%) 34(23.44%)Over 30-40 Lakhs 8(5.51%) 24(16.55%) 32(22.06%) 15(10.34%)
Total 8(5.51%) 24(16.55%) 32(22.06%) 81(55.86%)
Financial Decisions by Small and Medium Enterprise’s: An Empirical Study

Gavesana Journal of Management / Vol. 3. Issue 1. / January 2011 - June 2011. 51
Method Level of Always Very often Sometimes NeverInvestments
(in Rs. Lakhs)Internal 0-10 lakhs - - - 26(17.93%)Rate of Return$ Over 10-20 Lakhs - - - 32(22.06%)
Over 20-30 Lakhs - - - 40(27.58%)Over 30-40 Lakhs - - - 47(32.41%)
Total - - - 145(100%)Method Level of Always Very often Sometimes Never
Investments(in Rs. Lakhs)
Profitability 0-10 lakhs - - - 26(17.93%)Index$ Over 10-20 Lakhs - - - 32(22.06%)
Over 20-30 Lakhs - - - 40(27.58%)Over 30-40 Lakhs - - - 47(32.41%)
Total - - - 145(100%)Method Level of Always Very often Sometimes Never
Investments(in Rs. Lakhs)
Sensitivity 0-10 lakhs - - - 26(17.93%)Analysis$ Over 10-20 Lakhs - - - 32(22.06%)
Over 20-30 Lakhs - - - 40(27.58%)Over 30-40 Lakhs - - - 47(32.41%)
Total - - - 145(100%)
Notes: * Significant at 5% level of significance $ No chi-square could be computed because DPB, IRR, PI &SA are constant
Table 10 indicates that there exists a strong association between the level of investments and the capitalbudgeting techniques such as payback period, ARR and NPV method. In the case of the other techniques thechi-square could not be computed because of their constant values.
Table 11: Association between owners’ /partners’ experience and capital budgeting techniques
Method Level of Always Very often Sometimes NeverInvestments
(in Rs. Lakhs)Payback 0-10 lakhs 18(12.41%) 0(0%) - -Period * Over 10-20 Lakhs 18(12.41%) 0(0%) - -
Over 20-30 Lakhs 52(35.97%) 19(13.10%) - -Over 30-40 Lakhs 9(6.20%) 29(20%) - -
Total 97(66.9%) 48(33.10%) - -Method Level of Always Very often Sometimes Never
Investments(in Rs. Lakhs)
Discounted 0-10 lakhs - - - 16(11.03%)Payback Over 10-20 Lakhs - - - 17(11.72%)Period$ Over 20-30 Lakhs - - - 67(46.20%)
Over 30-40 Lakhs - - - 45(31.03%)Total - - - 145(100%)Method Level of Always Very often Sometimes Never
Investments(in Rs. Lakhs)
Average Rate 0-10 lakhs - 0(0%) 0(0%) 16(11.03%)of Return** Over 10-20 Lakhs - 0(0%) 0(0%) 18(12.41%)
Over 20-30 Lakhs - 9((6.20%) 10(6.89%) 46(31.72%)Over 30-40 Lakhs - 11(7.58%) 6(4.13%) 29(20%)
Total - 20(13.79%) 16(11.03%) 109(75.17%)
Financial Decisions by Small and Medium Enterprise’s: An Empirical Study
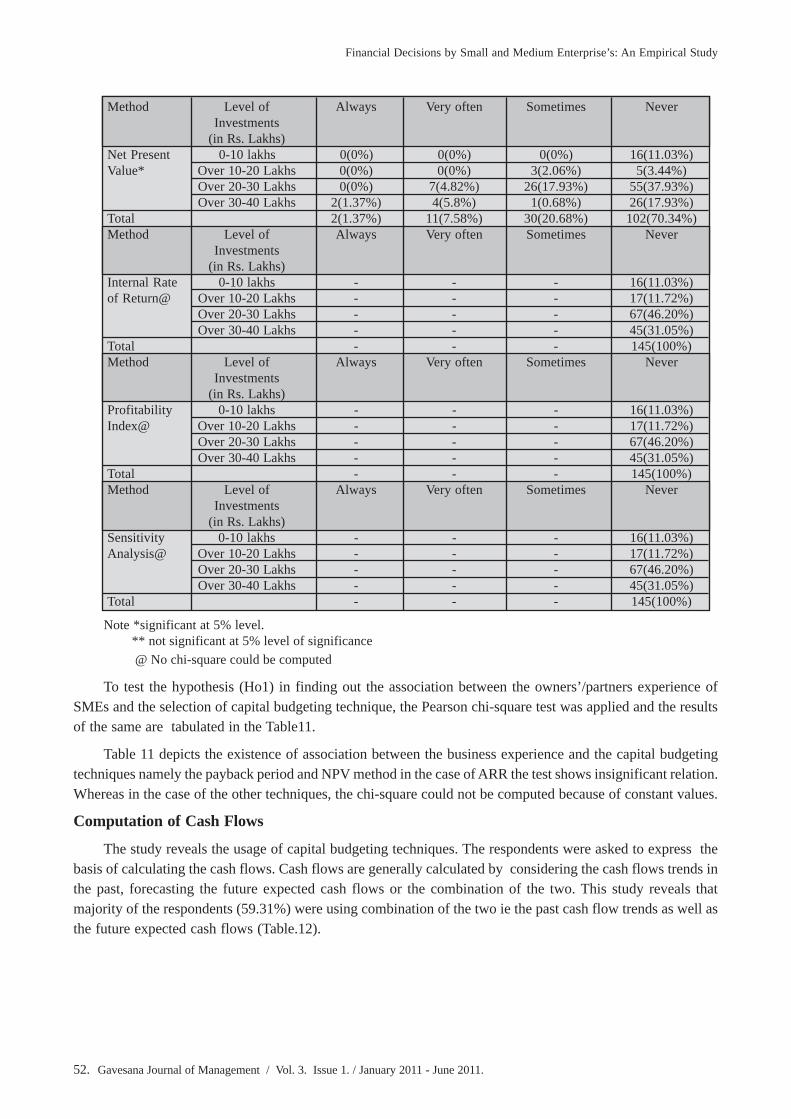
52. Gavesana Journal of Management / Vol. 3. Issue 1. / January 2011 - June 2011.
Method Level of Always Very often Sometimes NeverInvestments
(in Rs. Lakhs)Net Present 0-10 lakhs 0(0%) 0(0%) 0(0%) 16(11.03%)Value* Over 10-20 Lakhs 0(0%) 0(0%) 3(2.06%) 5(3.44%)
Over 20-30 Lakhs 0(0%) 7(4.82%) 26(17.93%) 55(37.93%)Over 30-40 Lakhs 2(1.37%) 4(5.8%) 1(0.68%) 26(17.93%)
Total 2(1.37%) 11(7.58%) 30(20.68%) 102(70.34%)Method Level of Always Very often Sometimes Never
Investments(in Rs. Lakhs)
Internal Rate 0-10 lakhs - - - 16(11.03%)of Return@ Over 10-20 Lakhs - - - 17(11.72%)
Over 20-30 Lakhs - - - 67(46.20%)Over 30-40 Lakhs - - - 45(31.05%)
Total - - - 145(100%)Method Level of Always Very often Sometimes Never
Investments(in Rs. Lakhs)
Profitability 0-10 lakhs - - - 16(11.03%)Index@ Over 10-20 Lakhs - - - 17(11.72%)
Over 20-30 Lakhs - - - 67(46.20%)Over 30-40 Lakhs - - - 45(31.05%)
Total - - - 145(100%)Method Level of Always Very often Sometimes Never
Investments(in Rs. Lakhs)
Sensitivity 0-10 lakhs - - - 16(11.03%)Analysis@ Over 10-20 Lakhs - - - 17(11.72%)
Over 20-30 Lakhs - - - 67(46.20%)Over 30-40 Lakhs - - - 45(31.05%)
Total - - - 145(100%)
Note *significant at 5% level. ** not significant at 5% level of significance @ No chi-square could be computed
To test the hypothesis (Ho1) in finding out the association between the owners’/partners experience ofSMEs and the selection of capital budgeting technique, the Pearson chi-square test was applied and the resultsof the same are tabulated in the Table11.
Table 11 depicts the existence of association between the business experience and the capital budgetingtechniques namely the payback period and NPV method in the case of ARR the test shows insignificant relation.Whereas in the case of the other techniques, the chi-square could not be computed because of constant values.
Computation of Cash Flows
The study reveals the usage of capital budgeting techniques. The respondents were asked to express thebasis of calculating the cash flows. Cash flows are generally calculated by considering the cash flows trends inthe past, forecasting the future expected cash flows or the combination of the two. This study reveals thatmajority of the respondents (59.31%) were using combination of the two ie the past cash flow trends as well asthe future expected cash flows (Table.12).
Financial Decisions by Small and Medium Enterprise’s: An Empirical Study

Gavesana Journal of Management / Vol. 3. Issue 1. / January 2011 - June 2011. 53
Table 12: Basis for computation of Cash flow
Basis Frequency PercentagePast data of Cash flows 35 24.13Forecasting 24 16.55Combination of the two 86 59.31None of the above 0 0.00Total 145 100
SMEs Future Intentions
The study was also trying to analysis the SMEs idea about their future financing policies in order to advisethe SMEs about the better opportunities that are awaiting them in the future and to better perform in the future.
Table 13: Future intentions regarding changes in the current capital structure decisions
Intending for a change Frequency PercentageYes 35 24.13No 110 75.86Total 145 100
From Table 14 it is clear that the respondents are reluctant for a change in their current usage of capitalstructure decisions. And from Table 14 around 66.20% of respondents have expressed that they have no intentionto change their current financial institutions. This shows the positive attitude of these SMEs towards thesupport derived from their current financial institutions.
Table 14: Future intentions regarding changes in the present financial institution
Intending for a change Frequency PercentageYes 49 33.79No 96 66.20Total 145 100
Future Intentions Related to their Preference for Various Types of Financing: From out of thevarious types of short term financing facilities available to the SME’s around 24.825 are still interested inworking capital facility whereas very few of the respondents preferred for the long term loans (12.41%). Thiscould be because of the size of the firm and their requirement is for their day to day operations.
Conclusion
It is clear from the Study that the SMEs in spite of their contribution to the economic progress still facingvarious constraints due to shortage of finance and shortage of the required financial skills, which is the mantrafor the better performance of their business. The study shows that in spite of the stiff competition majority ofthe SMEs still continue to rely upon their own funds. Along with the growth in competitions and financialdevelopments in the markets, these SMEs rely less upon the financial institutions because of the variousprocedures which delay procurement of funds.
In spite in the increase of the number of private banks in India, these SMEs still prefer the public sectorbanks due to their long term experience and stay in the market. There is a long way for these private banks tocreate the confidence in the minds of the SMEs about their capabilities of providing financial related servicesand there is every need for the private banks, to publicize about the various financial services that are beingprovided to the SMES. The study reveals that certain attributes of the private banks are preferred by theSMEs.
Financial Decisions by Small and Medium Enterprise’s: An Empirical Study
54. Gavesana Journal of Management / Vol. 3. Issue 1. / January 2011 - June 2011.
The study also reveals that even at this stage of economic progress and competition the SMEs are stillusing the traditional methods of capital budgeting techniques for their investment decisions. From among thetraditional methods the most preferred technique in capital budgeting is the payback period. This is because ofthe ease in calculating and also due to the size of the investment being very small. So there is every need tobring about a better awareness programmes about the significance of the capital budgeting techniques and itsrelevance from time to time.
When the basis for computation of cash flow was taken into consideration, it was found through the studythat the SMEs are still using the combination of past data of cash flows as well as the future forecast cash flowmethods. The Study also reveals that the SMEs are very rigid towards adopting changes related to the use of thecurrent capital structure and their current financial institution in their future business decision making process.
Bibliography
Arnold, J.L., Cherry, A.A., Diamond, M.A. & Walker, J.A. 1984, ‘Small business: an area ripe for practicedevelopment’, Journal of Accountancy, vol. 158, no. 2, pp. 74-79.
Bierman, H. 1993, ‘Capital budgeting in 1993: a survey’, Financial Management, autumn, pp. 24.
Byron, E.L. & Friedlob, G.T. 1984, ‘Why small businesses fail’, Management Accounting, January, pp. 16.
Drucker P.F. “Innovation and Entrepreneurship”, Harper and Row, New York,1985
Holmes, S., Hutchinson, P., Forsaith, D., Gibson, B. & McMahon, R. 2003, Small Enterprise Finance, JohnWiley & Sons Australia, Australia
Kotey, B.A. 1994, Personal values of owner/managers, business strategies and Enterprise performance, PhDthesis, The Southern Cross University.
Moore D. 2004. ”Turning Failure into Success” In: Wessner, Charles W., editor. National Research Council.The Small Business Innovation Research Program: Program Diversity and Assessment Challenges. Washington,DC: The National Academies Press; 2004
Noel Tagoe, Ernest Nyarko, Ebenezer, Anuma- Amarh. Financial Challenges Facing Urban SMEs Under FinancialSector Liberalization in Ghana. Journal of Small Business Management, Vol.43, 2005.
Prasad C.S. Small and Medium Enterprises in Global Perspective.
Speech by Shri Vepa Kamesam. Financing for Entrepreneurship and SMEs: An Indian Perspective, WinningStrategies in SME Financing
Verma, Sushma Rani, Bodla, B.S.4, Financing of Small Scale Enterprises (SSEs): A Survey of Literature.International Journal of Value Chain Management, Vol 3, Number 4, 23 feb 2010.
Yammeesri, J. 2003, The effect of ownership structure on firm performance: evidence from Thailand, paperpresented to Emerging Financial Services in Asia-pacific Conference, Sydney, May.
Financial Decisions by Small and Medium Enterprise’s: An Empirical Study
Gavesana Journal of Management / Vol. 3. Issue 1. / January 2011 - June 2011. 55
Television Advertising: A Study of Changes inBrand Preferences
Y. Madhuri Srinivas*
Abstract
A study was conducted to find out the extent of change in brand preferences of people due to one exposureto a television advertisement. The data for the study related to the twin cities of Hyderabad and Secunderabad,India. The study utilized a one-group pretest-posttest experimental design to study the changes in brandpreferences of people before and after exposure to 18 selected advertisements for FMCG products belonging tonine product categories. Findings of the study showed that some of the selected advertisements could bringabout a significant change in the brand preferences of people through just one exposure to the advertisementswhich all the more emphasizes the importance of the design of an advertisement and the cost-effective selectionof media.
Introduction
Effectiveness of advertisements is often measured in terms of their persuasive ability by testing the changein brand preferences of people post exposure to advertisements. An experiment was conducted in the twin citiesof Hyderabad and Secunderabad, India, to find out the extent of change in brand preferences of people due toone exposure to a television advertisement. The study aimed to find out the extent of change in the brandpreferences of people after one exposure to a television advertisement with the assumption that respondentsmay or may not have the carryover effect of previous exposures to the advertisement.
For the purpose of the study, eighteen advertisements for Fast Moving Consumer Goods belonging to nineproduct categories were selected. Since the advertisements that were tested were already running throughvarious channels, the brand preferences of respondents through the advertisements can be assumed to havebeen obtained in a competitive context.
Literature review
Some advertising researchers and practitioners are of the opinion that a single advertisement does notcreate any significant impact on consumers’ brand preferences. McCollum/Spielman (Rajeev Batra et al, 1996)and many advertisers argue that “emotional” advertisements be tested in a multiple-exposure copy test, becausecompared to “rational” advertisements, such advertisements “build” (gain in response) more slowly withrepetition, and a single-exposure copy test would not accurately gauge the response they would get whenfrequently exposed in the marketplace. It was found (Moorthy and Hawkins, 2005) that subjects respond moreto advertising repetition - in the sense of changing their perceived quality judgements. Results of the studysuggest that people seemed to like an advertisement more after repeated exposure to it and seemed to transferthis liking to the product being advertised, raising its quality rating. The research shows substantial support foradvertisement repetition influencing perceived quality through attitude toward the advertisement.
While acknowledging the benefits of repetitive advertising in developing an attitude toward theadvertisement and the brand being advertised, recent research has identified the significant advantages of evena single exposure to an advertisement. In a study conducted by Robin and Gross (1978) on the effects of asingle advertisement, the authors found that just one exposure to an advertisement can have lasting effects. Thepaper describes the results of a study of the effectiveness of a single advertisement in both the short and the
* Lecturer, Department of Management Studies, Bhavan’s Vivekananda College of Science, Humanities & Commerce, Secunderabad.Email: [email protected]
56. Gavesana Journal of Management / Vol. 3. Issue 1. / January 2011 - June 2011.
long run. Further, Bogart, Tolley and Orenstein (1970) have inquired into the short run impact of a singleadvertisement. They measured purchase behaviour, brand preference and recall of copy content via personalinterviews. In general, their work indicated that a single advertisement can expect a significant effect uponshort-run consumer behaviour. Erwin Ephron and Colin McDonald (2002) described the concept of ‘Adstock’as ‘the impact that advertising has over time on sales or awareness’. The concept mentions that each newexposure to an advertisement enhances awareness to a new level, which will be higher if there were exposuresin the recent period and lower if there were none. The advertising pressure (measured by response) does not endwhen the advertisement was seen, but decays over time to the base level, unless reversed by a new exposure’.
This research study is an attempt to explore the relevance of the above findings in the Indian context witha focus on brand preference change.
Methodology
The methodology adopted for the study involved as the first step the selection of 18 advertisements forFMCG products recorded from Hindi and English TV channels in India, two each from nine product categoriesnamely paints, chocolates, health drinks, detergents, pens, footwear, biscuits, toothbrushes and confectioneries.These advertisements were of the brands of Asian paints, Nerolac paints, Perk, Big bite, Boost, Bournvita, RinAdvanced, Tide, Reynolds, Cello, Action Flyfloat, Action Eva Flotter, Hide & Seek, Parle Milk Shakti, Oral B,Colgate 3600, Mentos, and Marbels.
Sample
The Judgement sampling method was utilized to select 275 respondents belonging to five groups based onage and occupation namely school students, junior college students, post-graduate students, working men &women and housewives. A basic understanding of the Hindi language was a prerequisite as all the advertisementsselected were in Hindi. The sample break-up is given in table 1.
Table 1: Demographic break-up of respondents
Type of respondent groups FrequencyHousewives 49Working men & women (WM &W) 49Post-graduate (PG) students 52Junior college students 57School students 68Total 275
Data
For the purpose of the research study, a one-group pretest-posttest experimental design was utilized. Allthe respondents were asked about their brand preferences from the nine product categories before theadvertisements were shown in the first questionnaire along with personal data following which the advertisementswere shown to the respondents. The next day, the same set of brands from the nine product categories weregiven to the respondents in another questionnaire and once again their brand preferences noted. Around four tofive options were provided against each product category from which respondents were asked to select and therespondents were also allowed to mention any other brand not mentioned in the options. Respondents wereshown the advertisements with the help of an LCD projector, a portable DVD player or a television set.
Analysis and Interpretation
For each of the 18 advertisements it was examined whether there was a significant change in brandpreferences amongst respondents on the next day after having been exposed to the advertisements on a particular
Television Advertising: A Study of Changes in Brand Preferences

Gavesana Journal of Management / Vol. 3. Issue 1. / January 2011 - June 2011. 57
day. The null hypothesis is that the advertisements were not successful in changing brand preferences. Thehypothesis is tested using the McNemar test with the test statistic χ2 = [|C _ B|_ 1]2 .
C + B
The data are given in Tables 2 to 19. Numerical figures in the cells indicate number of respondents. A, B,C and D indicate the different combinations of the joint events of the brand preference before and after watchingthe advertisements.
Product category: Paints
Table 2 : Brand preference for Asian Paints before and after exposure to the Asian Paints Ad
Before watching the After watching the Asian Paints Ad TotalAsian Paints Ad Preferred Asian Paints Preferred other brandsPreferred Asian Paints 126 (A) 25 (B) 151Preferred other brands 32 (C) 33 (D) 65Total 158 58 216
Table 3 : Brand preference for Nerolac Paints before and after exposure to the Nerolac Paints Ad
Before watching the After watching the Nerolac Paints Ad TotalNerolac Paints Ad Preferred Nerolac Paints Preferred other brandsPreferred Nerolac Paints 25 (A) 26 (B) 51Preferred other brands 26 (C) 139 (D) 165Total 51 165 216
For the Asian paints advertisement, the calculated value of χ2 is 0.6315, and the critical value of χ2 is 3.84for α =0.05 and degree of freedom equal to one. Hence, the null hypothesis is accepted. Similarly, for theNerolac paints advertisement, the calculated value of χ2 is 0.0192 which is less than the critical value, and sothe null hypothesis is accepted. This shows that the proportion of respondents changing their preference fromother brands of paints to Asian paints or Nerolac paints is the same as the proportion changing their preferencefrom either of these two brands to other brands. We therefore conclude that there was no significant change inbrand preferences amongst the respondents due to one exposure to the two paint advertisements.
Product category: Chocolates
Table 4 : Brand preference for Perk chocolate before and after exposure to the Perk chocolate Ad
Before watching the After watching the Perk chocolate Ad TotalPerk chocolate Ad Preferred Perk chocolate Preferred other brandsPreferred Perk chocolate 74 (A) 26 (B) 100Preferred other brands 15 (C) 114(D) 129Total 89 140 229
Table 5 : Brand preference for Big bite chocolate before and after exposure to the Big bite chocolate Ad
Before watching the After watching the Big bite chocolate Ad TotalBig bite chocolate Ad Preferred Big bite chocolate Preferred other brandsPreferred Big bite chocolate 0 (A) 4 (B) 4Preferred other brands 3 (C) 207 (D) 210Total 3 211 214
For the Perk chocolate advertisement, the calculated value of χ2 is 2.439 and the critical value of χ2 is3.84 for α =0.05 and degree of freedom equal to one. Hence, the null hypothesis is accepted. Similarly, thecalculated value of χ2 is 0 for the Big bite advertisement which is less than the critical value and so the null
Television Advertising: A Study of Changes in Brand Preferences

58. Gavesana Journal of Management / Vol. 3. Issue 1. / January 2011 - June 2011.
hypothesis is accepted. This shows that the proportion of respondents changing their preference from otherbrands of chocolates to Perk or Big bite chocolates is the same as the proportion changing their preference fromeither of these two brands to other brands. We therefore conclude that there was no significant change in brandpreferences amongst the respondents due to one exposure to the two chocolate advertisements.
Product category: Health drinks
Table 6 : Brand preference for Boost health drink before and after exposure to the Boost health drink Ad
Before watching the After watching the Boost health drink Ad Total Boost health drink Ad Preferred Boost health drink Preferred other brands Preferred Boost health drink 44 (A) 6 (B) 50 Preferred other brands 17 (C) 149 (D) 166 Total 61 155 216
Table 7 : Brand preference for Bournvita health drink before and after exposure to the Bournvita healthdrink Ad
Before watching the After watching the Bournvita health drink Ad Total Bournvita health drink Ad Preferred Bournvita health drink Preferred other brands Preferred Bournvita health drink 48 (A) 22 (B) 70 Preferred other brands 4 (C) 142 (D) 146 Total 52 164 216
For the Boost health drink advertisement, the calculated value of χ2 is 4.347 and the critical value of χ2 is3.84 for α =0.05 and degree of freedom equal to one. Hence, the null hypothesis is rejected. Similarly, thecalculated value of χ2 is 11.115 for the Bournvita advertisement which is greater than the critical value and sothe null hypothesis is rejected. Seventeen respondents who earlier preferred other brands switched theirpreferences to Boost and four respondents who earlier preferred other beverage brands switched over to Bournvita.Thus, in the health drink product category, the number of people who changed their preferences from otherbrands of health drinks to Boost were more than the number of people who switched over from other brands ofhealth drinks to Bournvita. The boost advertisement was thus more effective than the Bournvita advertisement.Overall it can be concluded that there was a significant change in brand preferences amongst the respondentsdue to one exposure to the two health drink advertisements.
Product category: Detergent powder
Table 8 : Brand preference for Rin Advanced detergent before and after exposure to the Rin Advanced Ad
Before watching the After watching the Rin Advanced Ad Total Rin Advanced Ad Preferred Rin Advanced Preferred other brands Preferred Rin Advanced 25 (A) 15 (B) 40 Preferred other brands 20 (C) 161 (D) 181 Total 45 176 221
Table 9 : Brand preference for Tide detergent before and after exposure to the Tide detergent Ad
Before watching the After watching the Tide detergent Ad Total Tide detergent Ad Preferred Tide detergent Preferred other brands Preferred Tide detergent 36 (A) 14 (B) 50 Preferred other brands 17 (C) 154 (D) 171 Total 53 168 221
Television Advertising: A Study of Changes in Brand Preferences

Gavesana Journal of Management / Vol. 3. Issue 1. / January 2011 - June 2011. 59
For the Rin Advanced detergent advertisement, the calculated value of χ2 is 0.4571 and the critical valueof χ2 is 3.84 for α =0.05 and degree of freedom equal to one. Hence, the null hypothesis is accepted. Similarly,the calculated value of χ2 is 0.129 for the Tide advertisement which is less than the critical value and so the nullhypothesis is accepted. This shows that the proportion of respondents changing their preference from otherdetergent brands to Rin Advanced or Tide detergent is the same as the proportion changing their preferencefrom either of these two brands to other brands. We therefore conclude that there was no significant change inbrand preferences amongst the respondents due to one exposure to the two detergent powder advertisements.
Product category: Pens
Table 10 : Brand preference for Reynolds pen before and after exposure to the Reynolds pen Ad
Before watching the After watching the Reynolds pen Ad Total Reynolds pen Ad Preferred Reynolds pen Preferred other brands Preferred Reynolds pen 62 (A) 24 (B) 86 Preferred other brands 33 (C) 101 (D) 134 Total 95 125 220
Table 11 : Brand preference for Cello pen before and after exposure to the Cello pen Ad
Before watching the After watching the Cello pen Ad Total Cello pen Ad Preferred Cello pen Preferred other brands Preferred Cello pen 37 (A) 17 (B) 54 Preferred other brands 27 (C) 139 (D) 166 Total 64 156 220
For the Reynolds pen advertisement, the calculated value of χ2 is 1.122 and the critical value of χ2 is 3.84for α =0.05 and degree of freedom equal to one. Hence, the null hypothesis is accepted. Similarly, the calculatedvalue of χ2 is 1.84 for the Cello pen advertisement which is less than the critical value, and so the null hypothesisis accepted. This shows that the proportion of respondents changing their preference from other brands of pensto Reynolds or Cello pen is the same as the proportion changing their preference from either of these twobrands to other brands. We therefore conclude that there was no significant change in brand preferences amongstthe respondents due to one exposure to the two pen advertisements.
Product category: Footwear
Table 12 : Brand preference for Flyfloat footwear before and after exposure to the Flyfloat footwear Ad
Before watching the After watching the Flyfloat footwear Ad TotalFlyfloat footwear Ad Preferred Flyfloat footwear Preferred other brandsPreferred Flyfloat footwear 10 (A) 10 (B) 20Preferred other brands 19 (C) 168 (D) 187Total 29 178 207
Table 13 : Brand preference for Eva Flotter footwear before and after exposure to the Eva Flotter footwearAd
Before watching the After watching the Eva Flotter footwear Ad TotalEva Flotter footwear Ad Preferred Eva Flotter footwear Preferred other brandsPreferred Eva Flotter footwear 5 (A) 8 (B) 13Preferred other brands 5 (C) 189 (D) 194Total 10 197 207
Television Advertising: A Study of Changes in Brand Preferences

60. Gavesana Journal of Management / Vol. 3. Issue 1. / January 2011 - June 2011.
For the Action Flyfloat advertisement, the calculated value of χ2 is 2.206 and the critical value of χ2 forα =0.05 and degree of freedom equal to one is 3.84. Hence, the null hypothesis is accepted. Similarly, thecalculated value of χ2 is 0.307 for the Action Eva Flotter advertisement which is less than the critical value, andso the null hypothesis is accepted. This shows that the proportion of respondents changing their preferencefrom other brands of footwear to Action Flyfloat or Action Eva flotter footwear is the same as the proportionchanging their preference from either of these two brands to other brands. We therefore conclude that there wasno significant change in brand preferences amongst the respondents due to one exposure to the two footwearadvertisements.
Product category: Biscuits
Table 14 : Brand preference for Hide and Seek biscuits before and after exposure to the Hide and Seekbiscuits Ad
Before watching the After watching the Hide and Seek biscuits Ad Total Hide and Seek biscuits Ad Preferred Hide and Seek biscuits Preferred other brands Preferred Hide and Seek biscuits 72 (A) 12 (B) 84 Preferred other brands 28 (C) 110 (D) 138 Total 100 122 222
Table 15 : Brand preference for Parle Milk Shakti biscuits before and after exposure to the Parle MilkShakti biscuits Ad
Before watching the After watching the Parle Milk Shakti biscuits Ad Total Parle Milk Shakti biscuits Ad Preferred Parle Milk
Shakti biscuits Preferred other brands Preferred Parle Milk Shakti biscuits 6 (A) 3 (B) 9 Preferred other brands 11(C) 202 (D) 213 Total 17 205 222
For the Hide and Seek biscuits advertisement, the calculated value of χ2 is 5.625 and the critical value ofχ2 for α =0.05 and degree of freedom equal to one is 3.84. Hence, the null hypothesis is rejected. Twenty eightpeople changed their preference from other brands to Hide and Seek biscuits after a single exposure to the Hideand Seek advertisement. We therefore conclude that there was a significant change in brand preferences amongstthe respondents due to one exposure to the Hide and Seek biscuits advertisement. However, the calculatedvalue of χ2 is 3.5 for the Parle Milk Shakti advertisement which is less than the critical value of 3.84 forα =0.05 and degree of freedom equal to one. This shows that the proportion of respondents changing theirpreference from other brands of biscuits to Parle Milk Shakti biscuits is the same as the proportion changingtheir preference from Parle Milk Shakti biscuits to other brands. We therefore conclude that there was nosignificant change in brand preferences amongst the respondents due to one exposure to the Parle Milk Shaktiadvertisement.
Product category: Toothbrushes
Table 16 : Brand preference for Oral B toothbrush before and after exposure to the Oral B toothbrush Ad
Before watching the After watching the Oral B toothbrush Ad Total Oral B toothbrush Ad Preferred Oral B toothbrush Preferred other brands Preferred Oral B toothbrush 72 (A) 14 (B) 86 Preferred other brands 26 (C) 15(D) 41 Total 98 29 127
Television Advertising: A Study of Changes in Brand Preferences
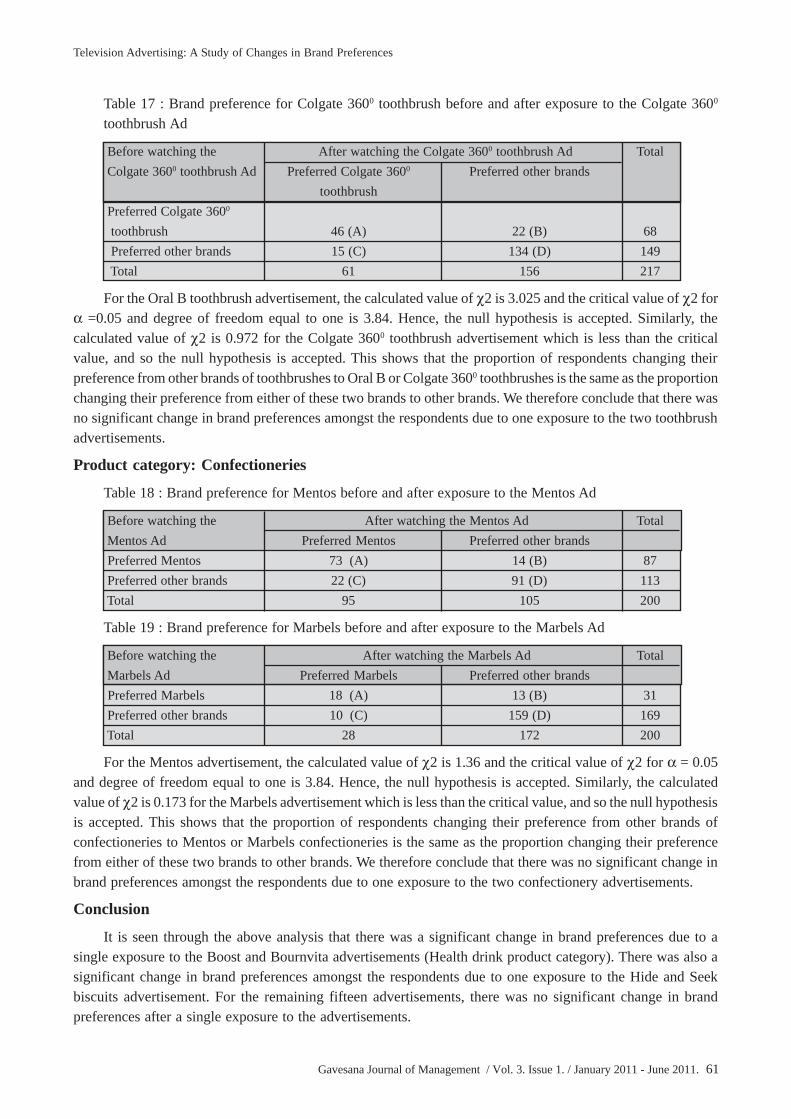
Gavesana Journal of Management / Vol. 3. Issue 1. / January 2011 - June 2011. 61
Table 17 : Brand preference for Colgate 3600 toothbrush before and after exposure to the Colgate 3600
toothbrush Ad
Before watching the After watching the Colgate 3600 toothbrush Ad Total Colgate 3600 toothbrush Ad Preferred Colgate 3600 Preferred other brands
toothbrush Preferred Colgate 3600
toothbrush 46 (A) 22 (B) 68 Preferred other brands 15 (C) 134 (D) 149 Total 61 156 217
For the Oral B toothbrush advertisement, the calculated value of χ2 is 3.025 and the critical value of χ2 forα =0.05 and degree of freedom equal to one is 3.84. Hence, the null hypothesis is accepted. Similarly, thecalculated value of χ2 is 0.972 for the Colgate 3600 toothbrush advertisement which is less than the criticalvalue, and so the null hypothesis is accepted. This shows that the proportion of respondents changing theirpreference from other brands of toothbrushes to Oral B or Colgate 3600 toothbrushes is the same as the proportionchanging their preference from either of these two brands to other brands. We therefore conclude that there wasno significant change in brand preferences amongst the respondents due to one exposure to the two toothbrushadvertisements.
Product category: Confectioneries
Table 18 : Brand preference for Mentos before and after exposure to the Mentos Ad
Before watching the After watching the Mentos Ad Total Mentos Ad Preferred Mentos Preferred other brands Preferred Mentos 73 (A) 14 (B) 87 Preferred other brands 22 (C) 91 (D) 113 Total 95 105 200
Table 19 : Brand preference for Marbels before and after exposure to the Marbels Ad
Before watching the After watching the Marbels Ad Total Marbels Ad Preferred Marbels Preferred other brands Preferred Marbels 18 (A) 13 (B) 31 Preferred other brands 10 (C) 159 (D) 169 Total 28 172 200
For the Mentos advertisement, the calculated value of χ2 is 1.36 and the critical value of χ2 for α = 0.05and degree of freedom equal to one is 3.84. Hence, the null hypothesis is accepted. Similarly, the calculatedvalue of χ2 is 0.173 for the Marbels advertisement which is less than the critical value, and so the null hypothesisis accepted. This shows that the proportion of respondents changing their preference from other brands ofconfectioneries to Mentos or Marbels confectioneries is the same as the proportion changing their preferencefrom either of these two brands to other brands. We therefore conclude that there was no significant change inbrand preferences amongst the respondents due to one exposure to the two confectionery advertisements.
Conclusion
It is seen through the above analysis that there was a significant change in brand preferences due to asingle exposure to the Boost and Bournvita advertisements (Health drink product category). There was also asignificant change in brand preferences amongst the respondents due to one exposure to the Hide and Seekbiscuits advertisement. For the remaining fifteen advertisements, there was no significant change in brandpreferences after a single exposure to the advertisements.
Television Advertising: A Study of Changes in Brand Preferences

62. Gavesana Journal of Management / Vol. 3. Issue 1. / January 2011 - June 2011.
As seen in the above analysis, even a single exposure to a well designed advertisement can have a significantimpact on the brand preferences of people. Advertisers should not overlook the effects of even a single exposureof an advertisement on the target audience as those who advertise stand to gain and those who do not, stand tolose in the clutter of television advertising.
References
Erwin Ephron and Colin McDonald,‘Media Scheduling and Carryover effects’, Journal of Advertising Research,July-August, 2002.
Moorthy K.S, and S.A.Hawkins, ‘Advertising Repetition and Quality Perceptions’, Journal of Business Research,2005, 58(3), pp. 354-360.
Rajeev Batra, John.G.Myers, David A.Aaker, 1996, ‘Advertising Management’, Prentice-Hall of India Pvt.Ltd., New Delhi.
Robin T.Peterson, Charles H.Gross, ‘What effect from a single advertisement?’ Journal of the Academy ofMarketing Science, Springer Netherlands, Vol.6, No.3/June, 1978.
Television Advertising: A Study of Changes in Brand Preferences
Gavesana Journal of Management / Vol. 3. Issue 1. / January 2011 - June 2011. 63
Purchase Decision and Brand Loyalty:A Study of Toothpaste Brands in India
Ch. S. Durga Prasad* and V. Jayashree**
Abstract
The toothpaste industry in India has been growing and the manufacturers compete intensely to increasetheir market share. The strategies include brand promotions and efforts to enhance the brand loyalty among thecustomers. The present study aims at assessing the factors that influence the purchase decision of customersand as to how the brand loyalty is built up in respect of the toothpastes brands in India. For this, primary datahave been collected and statistically analysed. The study has revealed that the customers make purchases beinginfluenced by advertisements and they show preference for brand. They exhibit brand loyalty, even thoughthere is an increase in price, or the brand is not available visited or when there is a change in the name of thebrand. The effects of demographic factors on the purchase decision and brand loyalty of customers have alsobeen analysed. Overall, branding of a product is found to be the key factor which leads to brand loyalty and thusincrease in the market share of the product.
Keywords: Brand, purchase decision, brand preference, brand loyalty, demographic factors and customersatisfaction.
Introduction
Toothpaste industry in India has been growing and manufacturers vie with each other for brand buildingand promoting brand loyalty. Its market size was about Rs. 3,200 crore for the year 2009-010 and is projectedto be Rs 3,500 crore by 2012 . The strategies adopted by the manufacturers to increase their market shareinclude multiple varieties of toothpastes at different prices to meet the needs of customers belonging to differentsegments, attractions such as free additional quantity of toothpaste, sale along with a toothbrush at a nominaladditional cost, discount coupons, among others. There are promotional campaigns, including advertisementswith celebrities.
This paper studies the factors that influence customers’ purchase decision, with focus on brand loyalty, inthe case of the brands of toothpastes in India. Towards this, a survey was conducted, using a questionnaire,covering a sample of 100, out of which the data relating to 85 respondents were considered as complete. Thesample was drawn randomly from a metropolitan city. The variables considered include demographics such asgender, income group, family size and occupation. In this paper, section 2 covers the concepts concerningpurchase decision and brand loyalty. Section 3 deals with a brief on the data. Section 4 analyses the data andgives the results. Conclusions are given in section 5.
Purchase Decision
For a product the purchase decision is influenced by the perceived level of satisfaction that a customerderives from it. Perceived satisfaction in turn depends upon the perceived performance of the product as per theexpectations of the customer. Such a satisfaction, gained over time, results in trust and loyalty (Oliver, 1997).Trust leads to commitment which develops relationship and results in loyalty (Morgan and Hunt, 1994). Trust
*Professor & Dean-Academic Planning, Vignana Jyothi Institute of Management, Bachupally, Hyderabad-500090, Andhra Pradesh.E-mail: [email protected]**Senior Assistant Professor, Vignana Jyothi Institute of Management, Bachupally, Hyderabad-500090, Andhra Pradesh.E-mail: [email protected]

64. Gavesana Journal of Management / Vol. 3. Issue 1. / January 2011 - June 2011.
is built up through the reliability generated by the supplier’s offer in complying with customer satisfaction(Raimondo, 2000).
Another view is that the buying decision depends upon personal, psychological and social factors. Thepersonal aspects are demographic in nature. Psychological factors include personality, lifestyle, motivationsand attitudes. Social factors include family, friends, role models and opinion leaders among others(www.clickz.com).
The customer satisfaction is positive when the ratio of inputs (costs-sacrifices) to outputs (benefits) isfavourable to the customer. Correspondingly, the seller also will have outputs (revenues) and inputs (costs)(Oliver and Swan 1989). It is found that even if there is no equity in a single transaction, between the output/input ratios for the customer as well as the seller, the relationship prolongs due to expected (future) reciprocity.Any inequities that occur in the short run are considered to be outweighed by the expected equity in the mediumand long run periods (Costabile, 2000). The satisfaction-trust-loyalty link results in repurchase. Customer loyalty,which is a strong inclination for the repurchase or reuse of a product or brand, surpasses situational, competitiveand switching influences (Oliver, 1999).
Thus, purchase decision is influenced by customer satisfaction which depends on the personal, psychologicaland social factors as well. Satisfaction, over time, results in trust. This in turn leads to commitment to thebrand and hence preference for the brand which is implies brand loyalty. When there is non-random repurchasebehaviour of the customer, true loyalty prevails, surpassing situational, competitive and switching influences.
Data, Analysis and Results
The study covers 85 respondents, of whom 58.8% are females and 41.2% are males. According to age,60% are aged less than 25 years, 18.8% are aged 25-40 years and the rest of 21.1% are aged above 40 years. Inincome classes, 44.7% get less than Rs.25,000 per month, 47.1% have income of Rs.25,000-75,000, and theremaining 8.2% get income exceeding Rs.75,000. The family size is mostly 2 to 5 persons i.e. 94.1%, while itis over 5 members for 3.5% of the respondents and 2 members for 2.4% of the sample. According to occupation,most of the respondents who take purchase decision (69.4%) are employees, followed by students (28.2%) andhousewives (2.4%).
Purchase Decision and Brand Loyalty: Regarding purchase decision, five attributes have been considered,i.e., (1) media effect (2) advertisement impact (3) brand influence (4) satisfaction from current brand and (5)influence of others. Brand loyalty has been assessed by considering five attributes, i.e., (1) use of current brand(2) use of the brand with a new name, i.e., readiness to use the product of the company when it is given a newname (3) switching tendency when the brand is not available in the store of purchase (4) switching when priceincreases and (5) recommending the brand to others. Data for these 10 attributes are given in Table 1.
Table 1: Purchase Decision and Brand Loyalty: Frequency Distribution of Number of Respondents
Attributes Responses(a) PurchaseDecision1 Media effect Outdoor Print media Internet Television
media 7 (8.2) 16 (18.8) 54 (63.5)8 (9.4)
2 Advertisement Theme & Punch line Model Healthappeal Situation 10 (11.8) 13 (15.3) 33 (38.8)
29 (34.1)3 Influence ofothers Yes 21 (24.7) No 64 (75.3)
Purchase Decision and Brand Loyalty: A Study of Toothpaste Brands in India

Gavesana Journal of Management / Vol. 3. Issue 1. / January 2011 - June 2011. 65
4 Brand rating Colgate Close up Pepsodent Others34 (40.4) 24 (28.2) 21 (24.7) 6 (6.7)
5. Satisfaction Moderate Highlevel 33 (38.8) 52 (61.2)(b) BrandLoyalty6 Period of use Over 3 1 to 3 Less than 1(years) 37 (43.5) 21 (24.7) 27 (31.8)7 Brand not Postpone Switch to Search inavailable in stores 3 (3.5) another other stores
brand 57 (67.1)25 (29.4)
8 Switches whenprice increases Yes20 (23.5) No65 (76.5)9 New brand Yes58 No27name (68.2) (31.8)10 Brand Yes67 No 7 Cannot sayLoyalty (78.8) (8.2) 11 (12.9)11 Recommendbrand to others To many To some Only when No
11 (12.9) 13 (15.3) asked 17 (20.0) 44 (51.8)
Note: Row totals add up to the total of 85 respondents. Figures in brackets are per cent share to total of 85respondents.
The data show that the purchase decision of respondents is influenced mainly by television (63.5%).Internet (18.8%), outdoor media (9.4%) and print media (8.2%) have much less influence. Regardingadvertisements, health factor (38.8%) and theme and situation (34.1%), have dominating appeal. Model (15.3%)and punch line (11.8%) play a nominal role. Thus, advertisement in television, with focus on health factor,theme and situation have a high influence on purchase decision. Most of the respondents (75.3%) take thepurchase decision not being influenced much by others such as dentists, family members, relatives and friends(24.7%).
As per rating of brands by the respondents, Colgate is preferred most (40.4%), with Close-up (28.2%) andPepsodent (24.7%) coming next. Other brands such as Promise, Sensodent, Babool, Neem, Anchor and so onhave very low preference (6.7%). After purchasimg a branded product, the repurchase depends upon thesatisfaction-level derived from the brand. Most of the respondents (61.2%) are well satisfied regarding thebrand bought by them.
A significant number of respondents (43.5%) are using their brand of toothpaste for over 3 years, followedby those using for less than a year (31.8%). These comprise long-term users as well as new entrants. If thebrand used is not available in the store of purchase, majority (67.1%) would visit another store to buy it, andeven then if it is not available, there would be a switch to another brand (29.4%). Non-availability of stock instores could lead to switch to another brand. Price increase for the brand does not make most of the respondents(76.5%) switch to another brand. However, if the price rises by over Rs.5, a notable chunk of respondentswould switch (23.5%). If the name of brand is changed, majority of the respondents (68.2%) are ready to try thenew brand, showing continued trust and loyalty towards the brand as also the company. However, a significantnumber (31.8%) dislike buying the new brand. Thus name change of name of the brand gives scope forswitches to other brands.
Purchase Decision and Brand Loyalty: A Study of Toothpaste Brands in India

66. Gavesana Journal of Management / Vol. 3. Issue 1. / January 2011 - June 2011.
When brand loyalty has been taken directly as an attribute, majority of the respondents are found to bebrand loyal (78.8%). A small percentage of respondents (12.9%) are brand-neutral, while the rest (8.2%) haveno brand loyalty. The data also show that out of those who are brand loyal, over one-half (51.8%) do notrecommend it to others. About one-fifth (20%) recommend when asked. The rest (28.2%) recommend it, whocould be considered as facilitating improvement in market share of the brand.
Thus, it is seen that long-term users stick to the brand, but stock-availability in the stores is critical toprevent switching. Increase in price over Rs.5 may also lead to switching, while lesser price increase is tolerated.If brand-name is changed, majority may continue to stick to the new brand. But the gains from the new brandshould be known in advance, to thwart switching. Overall, most of the brand users loyal and prone to recommendit to others as well.
Demographic Factors and Attributes: The association between the demographic variables gender, age,income, family size and occupation of the respondents, and the 10 attributes under study, are tested using chi-square test statistic, at .05 significance level (two-sided). The p-values and chi-square values are given inTable 2. When the p-value is less than .05, the association between the demographic variable and the attributeis considered as significant. Otherwise, the association is found to be not significant.
Table 2: Association between Demographics and Attributes: Chi-square Test results
Attributes Gender vs Age vs Income vs Family size OccupationAttribute Attribute in Attribute in vs Attribute vs Attribute
in column 1 column 1 column 1 in column 1 in column 1p value* p value* p value* p value* p value*
(a) PurchaseDecision1 Media effect .299 .216 .088 .803 .882
(3.670) (8.317) (11.009) (3.050) (2.379)2 Advertisement .074 .378 .735 .724 .001impact (8.539) (8.591) (5.206) (5.309) (27.296)3 Influence of .229 .464 .186 .171 .398others (1.446) (1.538) (3.366) (3.535) (1.843)4 Brand rating .911 (.187) .274 (5.132) .022 (11.485) .490 (3.421) .618 (2.651)5. Satisfaction .123 .715 .358 .358 .119level (2.380) (.670) (2.056) (2.056) (4.251)(b) BrandLoyalty10 Brand loyalty .604 (1.009) .165 (6.501) .272 (5.155) .195 (6.052) .192 (6.093)6 Period of use .439 .014 .013 .848 .659(years) (1.648) (12.421) (12.628) (1.381) (2.419)7 Brand not .001 .312 .827 .006 .240available in stores (13.705) (4.769) (1.498) (14.275) (5.550)8 Switches when .151 .290 .666 .442 .032price increases (2.063) (2.472) (.812) (1.635) (6.863)9 New brand .140 .126 .175 .621 .027name (2.178) (4.142) (3.492) (.954) (7.219)11 Recommend .191 .151 .340 .410 .003brand to others (4.756) (9.421) (6.795) (6.123) (19.646)
*Asymptotically significant (two-sided) value. Figures in brackets are chi-square values.
Purchase Decision and Brand Loyalty: A Study of Toothpaste Brands in India
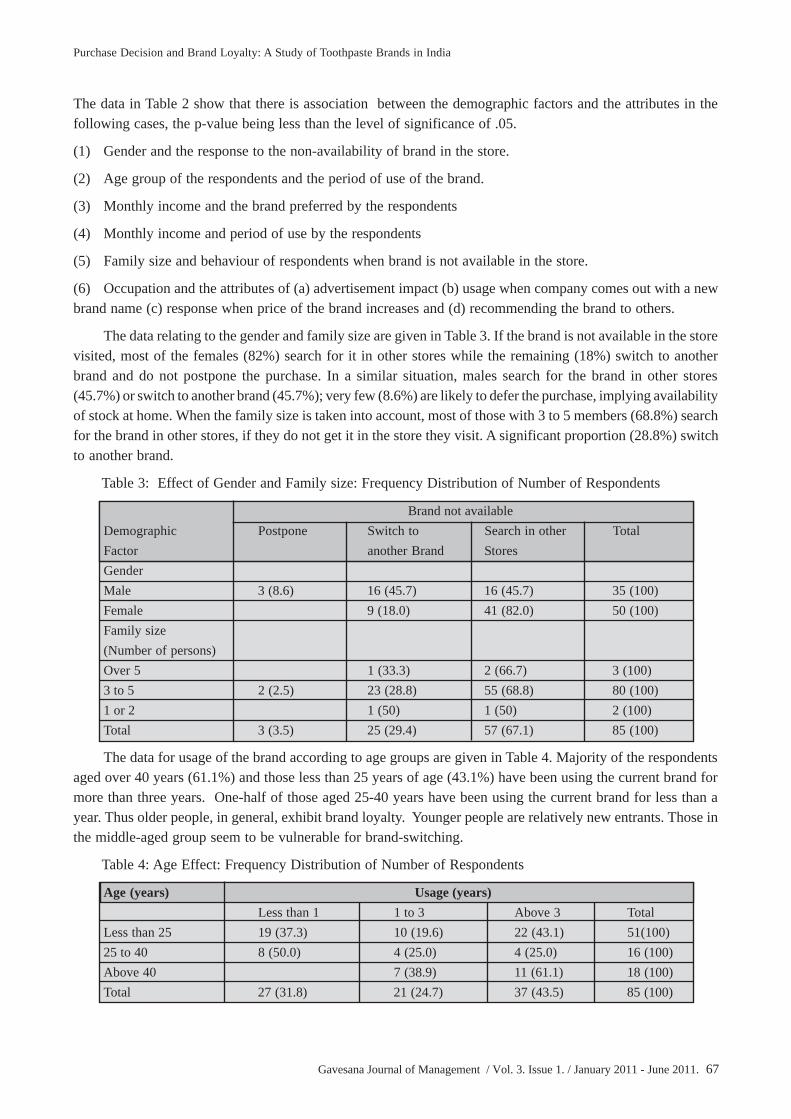
Gavesana Journal of Management / Vol. 3. Issue 1. / January 2011 - June 2011. 67
The data in Table 2 show that there is association between the demographic factors and the attributes in thefollowing cases, the p-value being less than the level of significance of .05.
(1) Gender and the response to the non-availability of brand in the store.
(2) Age group of the respondents and the period of use of the brand.
(3) Monthly income and the brand preferred by the respondents
(4) Monthly income and period of use by the respondents
(5) Family size and behaviour of respondents when brand is not available in the store.
(6) Occupation and the attributes of (a) advertisement impact (b) usage when company comes out with a newbrand name (c) response when price of the brand increases and (d) recommending the brand to others.
The data relating to the gender and family size are given in Table 3. If the brand is not available in the storevisited, most of the females (82%) search for it in other stores while the remaining (18%) switch to anotherbrand and do not postpone the purchase. In a similar situation, males search for the brand in other stores(45.7%) or switch to another brand (45.7%); very few (8.6%) are likely to defer the purchase, implying availabilityof stock at home. When the family size is taken into account, most of those with 3 to 5 members (68.8%) searchfor the brand in other stores, if they do not get it in the store they visit. A significant proportion (28.8%) switchto another brand.
Table 3: Effect of Gender and Family size: Frequency Distribution of Number of Respondents
Brand not availableDemographic Postpone Switch to Search in other TotalFactor another Brand StoresGenderMale 3 (8.6) 16 (45.7) 16 (45.7) 35 (100)Female 9 (18.0) 41 (82.0) 50 (100)Family size(Number of persons)Over 5 1 (33.3) 2 (66.7) 3 (100)3 to 5 2 (2.5) 23 (28.8) 55 (68.8) 80 (100)1 or 2 1 (50) 1 (50) 2 (100)Total 3 (3.5) 25 (29.4) 57 (67.1) 85 (100)
The data for usage of the brand according to age groups are given in Table 4. Majority of the respondentsaged over 40 years (61.1%) and those less than 25 years of age (43.1%) have been using the current brand formore than three years. One-half of those aged 25-40 years have been using the current brand for less than ayear. Thus older people, in general, exhibit brand loyalty. Younger people are relatively new entrants. Those inthe middle-aged group seem to be vulnerable for brand-switching.
Table 4: Age Effect: Frequency Distribution of Number of Respondents
Age (years) Usage (years)Less than 1 1 to 3 Above 3 Total
Less than 25 19 (37.3) 10 (19.6) 22 (43.1) 51(100)25 to 40 8 (50.0) 4 (25.0) 4 (25.0) 16 (100)Above 40 7 (38.9) 11 (61.1) 18 (100)Total 27 (31.8) 21 (24.7) 37 (43.5) 85 (100)
Purchase Decision and Brand Loyalty: A Study of Toothpaste Brands in India
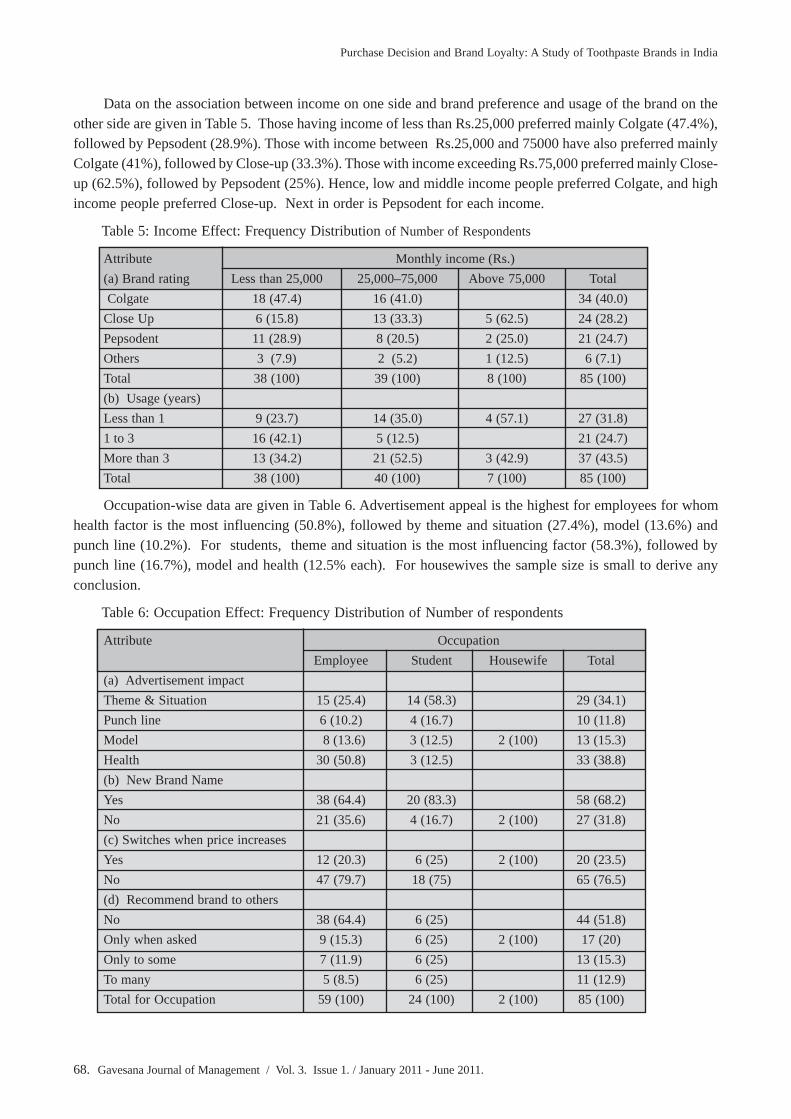
68. Gavesana Journal of Management / Vol. 3. Issue 1. / January 2011 - June 2011.
Data on the association between income on one side and brand preference and usage of the brand on theother side are given in Table 5. Those having income of less than Rs.25,000 preferred mainly Colgate (47.4%),followed by Pepsodent (28.9%). Those with income between Rs.25,000 and 75000 have also preferred mainlyColgate (41%), followed by Close-up (33.3%). Those with income exceeding Rs.75,000 preferred mainly Close-up (62.5%), followed by Pepsodent (25%). Hence, low and middle income people preferred Colgate, and highincome people preferred Close-up. Next in order is Pepsodent for each income.
Table 5: Income Effect: Frequency Distribution of Number of Respondents
Attribute Monthly income (Rs.)(a) Brand rating Less than 25,000 25,000–75,000 Above 75,000 Total Colgate 18 (47.4) 16 (41.0) 34 (40.0)Close Up 6 (15.8) 13 (33.3) 5 (62.5) 24 (28.2)Pepsodent 11 (28.9) 8 (20.5) 2 (25.0) 21 (24.7)Others 3 (7.9) 2 (5.2) 1 (12.5) 6 (7.1)Total 38 (100) 39 (100) 8 (100) 85 (100)(b) Usage (years)Less than 1 9 (23.7) 14 (35.0) 4 (57.1) 27 (31.8)1 to 3 16 (42.1) 5 (12.5) 21 (24.7)More than 3 13 (34.2) 21 (52.5) 3 (42.9) 37 (43.5)Total 38 (100) 40 (100) 7 (100) 85 (100)
Occupation-wise data are given in Table 6. Advertisement appeal is the highest for employees for whomhealth factor is the most influencing (50.8%), followed by theme and situation (27.4%), model (13.6%) andpunch line (10.2%). For students, theme and situation is the most influencing factor (58.3%), followed bypunch line (16.7%), model and health (12.5% each). For housewives the sample size is small to derive anyconclusion.
Table 6: Occupation Effect: Frequency Distribution of Number of respondents
Attribute OccupationEmployee Student Housewife Total
(a) Advertisement impactTheme & Situation 15 (25.4) 14 (58.3) 29 (34.1)Punch line 6 (10.2) 4 (16.7) 10 (11.8)Model 8 (13.6) 3 (12.5) 2 (100) 13 (15.3)Health 30 (50.8) 3 (12.5) 33 (38.8)(b) New Brand NameYes 38 (64.4) 20 (83.3) 58 (68.2)No 21 (35.6) 4 (16.7) 2 (100) 27 (31.8)(c) Switches when price increasesYes 12 (20.3) 6 (25) 2 (100) 20 (23.5)No 47 (79.7) 18 (75) 65 (76.5)(d) Recommend brand to othersNo 38 (64.4) 6 (25) 44 (51.8)Only when asked 9 (15.3) 6 (25) 2 (100) 17 (20)Only to some 7 (11.9) 6 (25) 13 (15.3)To many 5 (8.5) 6 (25) 11 (12.9)Total for Occupation 59 (100) 24 (100) 2 (100) 85 (100)
Purchase Decision and Brand Loyalty: A Study of Toothpaste Brands in India

Gavesana Journal of Management / Vol. 3. Issue 1. / January 2011 - June 2011. 69
In the case of new brand name, most of the employees (64.4%), as also the students (83.3%) buy the newbrand. When price of the brand increases, most of the employees (79.7%) as well as students (75%) stick to it.
As for recommending the brand to others, only a small portion of employees (20.4%) recommend thebrand while some recommend when asked (15.3%). Majority of them do not recommend the brand to others(64.4%). Regarding students, one-half recommend the brand, one-fourth recommend only when asked (25%)and the rest (25%) do not recommend.
It is seen that, for most of the employees and students, health factor appeals, and they buy the branddespite change in its name and even if price increases. Among employees majority do not recommend thebrand to others, while a notable number among students (50%), do recommend.
Conclusion
The study reveals that the purchase decision is influenced by advertisement appeal focusing on healthfactor, theme and situation. Satisfaction is the key factor for brand preference. Long-term users and olderpeople show brand loyalty in general. Price rise does not deter customers to stick to the brand. When brandname is changed, customers use it. Though the brand is not available in the store visited, females and familieswith 3 to 5 members search for the brand in other stores, and males may switch to another brand. It implies thatavailability of stock in the stores is necessary for brand patronage. Younger people are the new entrants for theuse of brand. Middle-aged people seem to be vulnerable for brand-switching. Majority of those who are employeesdo not recommend the brand to others, whereas students, mainly, do recommend. Overall, it is necessary to turnthe products into brands which can lead to brand loyalty and hence increase in the market share of the products.
(The authors are thankful to Ms G.V. Sujani, Ms P. Sri Lakshmi Rao, Mr K. Bhasker, and Ms E. Vakula whowere students of Vignana Jyothi Institute of Management, for collecting the data through a survey of 85respondents using questionnaire)
References
Business Standard (2008), The oral care market in India 2008, New Delhi, October 14.
Costabile, M. (2000), “A Dynamic Model of Customer Loyalty”, Competitive paper presented at the 16th
Annual IMP Conference, September 7-9, Bath (UK).
Morgan, R.M., Hunt, S.D. (1994), “The Commitment-Trust Theory of Relationship Marketing”, Journal ofMarketing, PP 58, 20-38.
Oliver, R.L. (1997), Satisfaction: A Behavioral Perspective on the Consumer, New York: McGraw-Hill.
Oliver, R.L. (1999), “Whence Consumer Loyalty”, Journal of Marketing, Special issue, PP 33- 44.
Oliver, R.L., Swan, J.E. (1989), “Consumer Perceptions of Interpersonal Equity and Satisfaction in Transactions:a Field Approach”, Journal of Marketing, April, PP 21-35.
Raimondo, M.A. (2000), “The Measurement of Trust in Marketing Studies: A Literature Review”, Competitivepaper presented at the 16th Annual IMP Conference, Bath (UK), September 7-9.
www.clickz.com, Consumers’ Purchase-Decision Criteria.
Purchase Decision and Brand Loyalty: A Study of Toothpaste Brands in India

70. Gavesana Journal of Management / Vol. 3. Issue 1. / January 2011 - June 2011.
Influence of Demographic Factors on Organization ClimateK. Suguna*
Abstract
The most crucial challenge to industrial and business organizations today is to develop innovativeprogrammes which can motivate human behaviour towards higher productivity and greater work efficiency. Inthe present situation organization climate is the most important factor for achieving the goals in different typesof organizations. This paper examines the relationship of certain selected demographic variables with theorganizational climate in a manufacturing organization. The organizational climate is examined with the helpof 183 respondent employees categorized into managerial and non-managerial staff.
Keywords: Organisational Climate, Demographics, and Work efficiency
Introduction
It has long been believed that the general climate of an organization has some bearing on efficiency.Empirical studies have attempted to analyze the organizational climate in a systematic and scientific manner.‘What, why and how’ questions related to organizational climate have concerned most personnel specialistsand other management practitioners over the years. Terms such as environment and atmosphere are used assynonyms to organizational climate (OC). In the literature, organizational climate has been defined by differentwriters. While there are some differences, there seems to be a greater degree of commonality. Consider thefollowing definitions which say what it is.
Forehand and Gilmer (1964) defined OC as “A set of characteristics that (a) describe the organization anddistinguish it from other organizations, (b) are relatively enduring over time and (c) influence the behavior ofpeople in the organization”. Tagiuri and Litwin (1968) defined OC as “Relatively enduring quality of theinternal environment that is experienced by its members, influences their behavior, and can be described interms of the values of a particular set of characteristics of the organization”. Campbell et al. (1970) defined OCas “A set of attributes specific to a particular organization that may be induced from the way the organizationdeals with its members and its environment. For the individual member within the organization, OC takes theform of a set of attributes and expectancies which describe the organization in terms of both static characteristics(such as degree of autonomy) and dynamic characteristics (such as behavior outcomes)”. Payne (1971) definesOC as “A moral concept, reflecting the content and strength of the prevalent values, norms, attitude, behaviorand feelings of the members of a social system, which can be operationally measured through the perception ofsystem members or observational and other objective means”.
From the above definitions, the following salient features can be highlighted.
• OC as characteristic of an organization that describes and distinguishes it.
• An atmosphere.
• A normative structure of attitudes and behavioral standards.
• Characterizes the personalities - a product of leadership practices, communication practices, and enduringsystematic characteristics of the working relationships among persons and division of any particularorganization.
• Result of interactions among task, technology, structure, people and power variables of the organizationwhich produce a culture and process.
*Professor and Head, Department of Management Studies,Chadalawada Ramanamma Engineering College, Renigunta Road, Tirupati-517506, Andhra Pradesh.E-mail: [email protected]
Gavesana Journal of Management / Vol. 3. Issue 1. / January 2011 - June 2011. 71
• Influences behavior of people and provides employee job satisfaction and organizational goal achievement.
• An enduring one.
Organizational Climate-Review
Earlier studies have come up with the perception of how good the climate is, what factors are importantand which factors are weak. Rao and Abraham (1986) studied 41 different organizations and found that thegeneral climate appears to be at an average level. Prasanna Sai Venkateswaran (1997) questioned 132 (20%)executives on a random basis on 30 variables and found that climate was favorable for HRD.
Sinha (1973), found the public sector to be inferior in terms of the following dimensions of OC: Chancesof promotion, efficiency, responsibility, social relationships, initiative and reward and working conditions. Roy(1974) found that public sector was perceived to be less efficient because of nepotism, arbitrariness in union-management system and interference by government and political forces.
Dwivedi (1979) studied climate in the best printing press in Asia and found that the employees enjoyedwarm social relationships as well as intrinsic satisfaction stemming from a sense of task accomplishment.
Biswas (1993) in his study made a comparison of organizational climates between two banks. The resultssuggested that out of the twenty-six organizational climate items, eleven items showed statistical significanceof difference between the two groups.
Different studies have examined influence of demographic and organization variables on climateperceptions. Sharma (1982) found that age, total work experience, experience as supervisor, monthly incomeand education are highly inter-correlated with nine climate dimensions. Agarwal and Bose (2004) found thatdemographic characteristics of members are differently influenced by the HR policies of the organizations andthereby procedural justice perceptions. Avinash Kumar Srivastav (2005) found that climate is differently perceivedacross functions within the same organization. He found that there is no difference in the perception of climatebetween lower and middle and between lower and higher age groups. Uthayasuriyan (1989) found significantdifferences among artisans, supervisors and executives in respect of 6 dimensions of OC. The study of PoojaGarg and Renu Rastogi (2006) revealed influences of age and gender on organizational citizenship behaviors inpublic and private schools. The cadre - wise, age - wise and experience - wise analysis has also validated thefinding.
Sharma (1982) found that total work experience and experience as supervisor, are highly inter correlatedwith nine climate dimensions. The organizational climate of SBI in Andhra Pradesh was examined by Chalamand Srinivas (2005). They found that experience has no influence.
Thus the present study has some comparable results with the earlier studies and shows that climate variesfrom organization to organization. Every organization may have some weak points and management has to payattention to improve them.
Different studies have examined influence of demographic and organization variables on climateperceptions. The present study has made an attempt to find the influence of variables like age, gender, education,income, experience and level of hierarchy on perceptions of respondents.
Objectives of the Study
The study mainly focuses on the following objectives.
1. To know the type of the organization climate found in the organization.
2. To identify the variations in perceptions on organizational climate among personal variables such as age,gender, education, income and experience.
Influence of Demographic Factors on Organization Climate

72. Gavesana Journal of Management / Vol. 3. Issue 1. / January 2011 - June 2011.
Hypotheses
Since demographical variables have influence on perceptions of OC, it is proposed to test the followinghypothesis.
H-1: The perceptions on the organizational climate differ influenced by demographics like age, gender, incomeand education.
H-2: Experience has significant positive influence on employee perceptions of the organization climate.
Methodology
The study is descriptive in nature and makes use of survey method. Total population comprises employeesof batteries manufacturing organization located in a famous town, in Andhra Pradesh.
A Structured questionnaire is developed based on earlier studies (Baldev R. Sharma (1987), ShailendraSingh (1988) and Uthayasuriyan, 1989) to know the organization climate. The questionnaire consists of twocategories; (i) questions on organizational climate and (ii) demographic factors of the respondents. Likert 5-point scale of agreement is employed to measure the degree of agreement with each of the statements.
An attempt is made to test the reliability of the instrument with a pilot study of 25 respondents in terms of(a) inter-item consistency of responses among the 19 dimensions and (b) whether the statements used to measureeach dimension belong to that dimension than to any other - From the inter-item correlations it is clear thatthere is adequate agreement among the responses to the set of statements under each of 19 dimensions designedto measure a given respondents climate total score; and - From item –to- total correlations each statement trulybelongs to the dimension of OC in which it has been included.
Sampling
Stratified random sampling method is used. In the first phase, the subjects were stratified into two groups:management and non-management. Management staff includes positions like Sr. Manager, Manager, Asst.Manager, Sr. Engineer/ Sr. Officer and Engineer/Officer whereas Non-Management staff include Jr. Officer,Supervisor, Assistant I & II and Technician. It is decided to include 50 % of the categories of employees basedon random sampling technique.
A sample of 183 respondents- 75 from management staff and 105 from non-management staff is obtained.Along with descriptive statistics like mean and standard deviation, Correlations, t- test for large samples, F-testand Kruskal Wallis one way ANOVA are employed for hypothesis testing.
Profile of the Respondents
The sample has more number of males and 25-35 age group employees. Experience wise, many of themare with more than 5 years experience. It is found that most of the non-management staff has lower incomescompared to the management staff whose incomes fall into middle and higher income categories.
Organizational climate
Influence of demographics on Organisational Climate
The hypothesis tested here is:
H-1: The perceptions on the organizational climate differ influenced by demographics like age, gender, incomeand education
Perceptions Across Gender: Table 1 furnishes the results of z-test on means for each dimension acrossgender. Statistically significant differences across gender have not been found for all dimensions of OC. Therefore,it can be concluded that gender has no influence on the perceptions of the climate.
Influence of Demographic Factors on Organization Climate

Gavesana Journal of Management / Vol. 3. Issue 1. / January 2011 - June 2011. 73
Table 1: Perceptions of Respondents on OC Dimensions - Across Gender (N=183)
S. Male(N=145) Female(N=38) Z- valueNo OC Dimensions Mean S.D Mean S.D.1 Job Characteristics 4.14 0.55 4.14 0.58 0.062 Relations 3.99 0.56 3.86 0.81 0.923 Welfare and Security 4.07 0.61 4.21 0.48 1.484 Training and Advancement 4.08 0.67 4.00 0.83 0.535 Grievance Handling 3.67 0.83 3.75 0.77 0.576 Autonomy and Pressure
for Performance 3.91 0.78 3.84 0.67 0.577 Standardization 3.86 0.81 3.79 0.75 0.528 Discipline 3.83 0.67 3.68 0.65 1.289 Performance and Reward 3.83 0.75 3.72 0.77 0.85
10 Recognition and Appreciation 3.94 0.63 3.96 0.54 0.1511 Power and Centralization 3.77 0.60 3.68 0.53 0.8212 Participative Management 3.70 0.89 3.71 0.92 0.0413 People Orientation 3.90 0.69 3.65 0.83 1.7214 Conflict Resolution 3.62 0.79 3.54 0.74 0.6015 Managerial Structure and Policies 3.94 0.59 3.72 0.71 1.7716 Knowledge Orientation 3.85 0.86 3.86 0.87 0.0217 Innovation Orientation 3.99 0.61 3.84 0.58 1.4418 Risk Taking 3.77 0.79 3.63 0.89 0.8919 Social values 3.94 0.68 3.88 0.83 0.4420 Over-all Climate 3.91 0.46 3.84 0.52 0.74
*Significant at 0.05 level. Scale: 5- Strongly agree 1- Strongly disagree
Perceptions Across Age: Table 2 furnishes the results of F- test for each dimension across the three agegroups viz., lower age (<25 years), middle age (25years to 35 years) and higher age (more than 35 years).Under each age group means and standard deviations are calculated for each dimension of OC and F-values areperformed to detect statistically significant differences across age groups. Statistically significant differencesacross age groups have not been found for all dimensions of OC. Therefore, age does not influence the perceptionsor the climate.
Table 2: Perceptions of Respondents on OC dimensions - Across Age (N=183)
S. Lower Middle HigherNo (N=30) (N=99) (N=54) F-values
OC Dimensions Mean S.D Mean S.D Mean S.D1 Job Characteristics 4.18 0.63 4.17 0.49 4.06 0.61 0.772 Relations 3.90 0.78 3.97 0.60 4.00 0.55 0.273 Welfare and Security 4.06 0.64 4.12 0.60 4.09 0.53 0.154 Training and Advancement 4.04 0.89 4.14 0.63 3.93 0.69 1.645 Grievance Handling 3.72 0.82 3.74 0.79 3.57 0.85 0.846 Autonomy and Pressure for
Performance 3.92 0.71 3.86 0.81 3.96 0.68 0.347 Standardization 3.83 0.78 3.80 0.84 3.94 0.71 0.598 Discipline 3.92 0.55 3.70 0.65 3.91 0.73 2.259 Performance and Reward 3.88 0.71 3.78 0.79 3.82 0.71 0.19
10 Recognition and Appreciation 4.03 0.59 3.90 0.63 3.98 0.58 0.65
Influence of Demographic Factors on Organization Climate
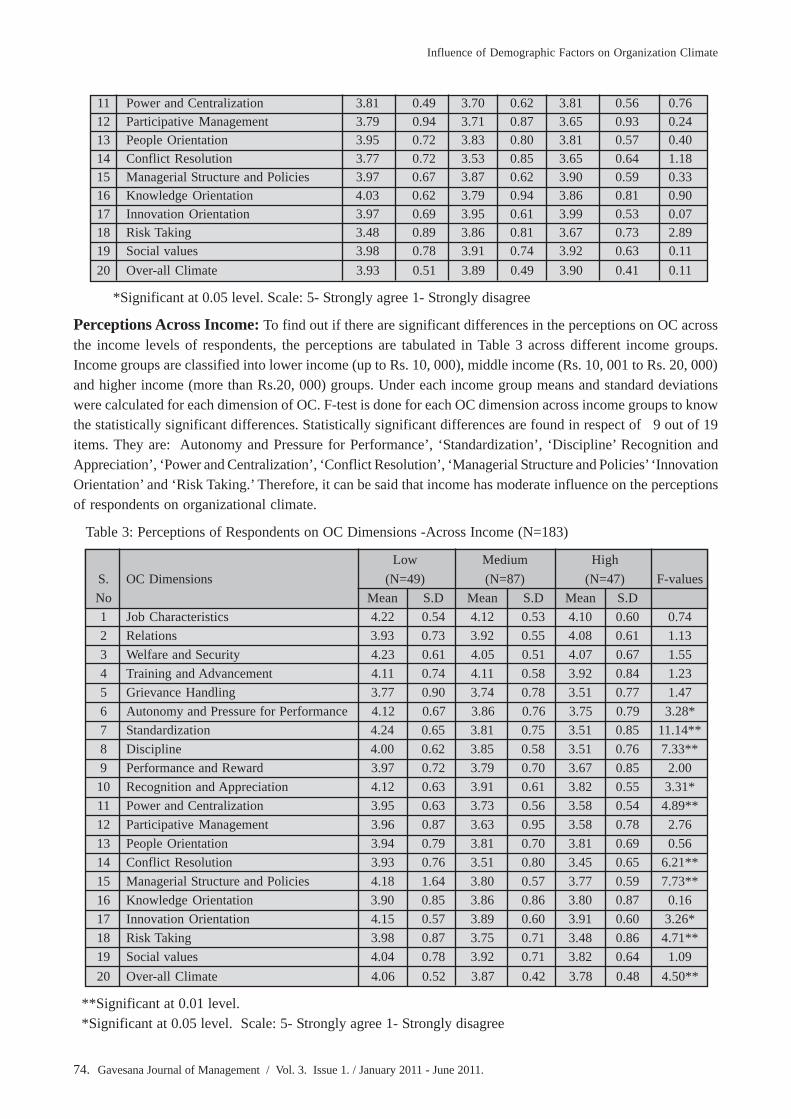
74. Gavesana Journal of Management / Vol. 3. Issue 1. / January 2011 - June 2011.
11 Power and Centralization 3.81 0.49 3.70 0.62 3.81 0.56 0.7612 Participative Management 3.79 0.94 3.71 0.87 3.65 0.93 0.2413 People Orientation 3.95 0.72 3.83 0.80 3.81 0.57 0.4014 Conflict Resolution 3.77 0.72 3.53 0.85 3.65 0.64 1.1815 Managerial Structure and Policies 3.97 0.67 3.87 0.62 3.90 0.59 0.3316 Knowledge Orientation 4.03 0.62 3.79 0.94 3.86 0.81 0.9017 Innovation Orientation 3.97 0.69 3.95 0.61 3.99 0.53 0.0718 Risk Taking 3.48 0.89 3.86 0.81 3.67 0.73 2.8919 Social values 3.98 0.78 3.91 0.74 3.92 0.63 0.1120 Over-all Climate 3.93 0.51 3.89 0.49 3.90 0.41 0.11
*Significant at 0.05 level. Scale: 5- Strongly agree 1- Strongly disagree
Perceptions Across Income: To find out if there are significant differences in the perceptions on OC acrossthe income levels of respondents, the perceptions are tabulated in Table 3 across different income groups.Income groups are classified into lower income (up to Rs. 10, 000), middle income (Rs. 10, 001 to Rs. 20, 000)and higher income (more than Rs.20, 000) groups. Under each income group means and standard deviationswere calculated for each dimension of OC. F-test is done for each OC dimension across income groups to knowthe statistically significant differences. Statistically significant differences are found in respect of 9 out of 19items. They are: Autonomy and Pressure for Performance’, ‘Standardization’, ‘Discipline’ Recognition andAppreciation’, ‘Power and Centralization’, ‘Conflict Resolution’, ‘Managerial Structure and Policies’ ‘InnovationOrientation’ and ‘Risk Taking.’ Therefore, it can be said that income has moderate influence on the perceptionsof respondents on organizational climate.
Table 3: Perceptions of Respondents on OC Dimensions -Across Income (N=183)
Low Medium HighS. OC Dimensions (N=49) (N=87) (N=47) F-valuesNo Mean S.D Mean S.D Mean S.D1 Job Characteristics 4.22 0.54 4.12 0.53 4.10 0.60 0.742 Relations 3.93 0.73 3.92 0.55 4.08 0.61 1.133 Welfare and Security 4.23 0.61 4.05 0.51 4.07 0.67 1.554 Training and Advancement 4.11 0.74 4.11 0.58 3.92 0.84 1.235 Grievance Handling 3.77 0.90 3.74 0.78 3.51 0.77 1.476 Autonomy and Pressure for Performance 4.12 0.67 3.86 0.76 3.75 0.79 3.28*7 Standardization 4.24 0.65 3.81 0.75 3.51 0.85 11.14**8 Discipline 4.00 0.62 3.85 0.58 3.51 0.76 7.33**9 Performance and Reward 3.97 0.72 3.79 0.70 3.67 0.85 2.00
10 Recognition and Appreciation 4.12 0.63 3.91 0.61 3.82 0.55 3.31*11 Power and Centralization 3.95 0.63 3.73 0.56 3.58 0.54 4.89**12 Participative Management 3.96 0.87 3.63 0.95 3.58 0.78 2.7613 People Orientation 3.94 0.79 3.81 0.70 3.81 0.69 0.5614 Conflict Resolution 3.93 0.76 3.51 0.80 3.45 0.65 6.21**15 Managerial Structure and Policies 4.18 1.64 3.80 0.57 3.77 0.59 7.73**16 Knowledge Orientation 3.90 0.85 3.86 0.86 3.80 0.87 0.1617 Innovation Orientation 4.15 0.57 3.89 0.60 3.91 0.60 3.26*18 Risk Taking 3.98 0.87 3.75 0.71 3.48 0.86 4.71**19 Social values 4.04 0.78 3.92 0.71 3.82 0.64 1.0920 Over-all Climate 4.06 0.52 3.87 0.42 3.78 0.48 4.50**
**Significant at 0.01 level. *Significant at 0.05 level. Scale: 5- Strongly agree 1- Strongly disagree
Influence of Demographic Factors on Organization Climate

Gavesana Journal of Management / Vol. 3. Issue 1. / January 2011 - June 2011. 75
Perceptions Across Education: On the basis of educational level respondents were divided into three viz.,highly educated (post graduates), moderately educated (graduates) and low educated (intermediate and other)levels Table 4. F-values show that, there are no significant differences among the three categories of educationallevel in perceiving organizational climate except in case of one dimension –Social values. The results indicatethat less educated has shown greater agreement on social values dimension.
Table 4: Perceptions of Respondents on OC Dimensions- Across Education (N=183)
IntermediatePG U G and others F-values
S. (N=45) (N=93) (N=45)No OC Dimensions Mean S.D Mean S.D Mean S.D1 Job Characteristics 4.08 0.54 4.16 0.56 4.15 0.54 0.352 Relations 3.89 0.65 3.96 0.59 4.05 0.65 0.763 Welfare and Security 4.09 0.51 4.04 0.66 4.23 0.45 1.604 Training and Advancement 3.97 0.83 4.07 0.68 4.14 0.60 0.665 Grievance Handling 3.77 0.76 3.61 0.83 3.76 0.85 0.756 Autonomy and Pressure for Performance 3.74 0.74 3.95 0.71 3.96 0.86 1.237 Standardization 3.66 0.71 3.95 0.73 3.83 0.96 2.048 Discipline 3.63 0.67 3.87 0.61 3.81 0.75 1.999 Performance and Reward 3.82 0.59 3.74 0.83 3.95 0.72 1.17
10 Recognition and Appreciation 3.90 0.53 3.91 0.60 4.04 0.69 0.8111 Power and Centralization 3.70 0.60 3.79 0.54 3.72 0.67 0.3712 Participative Management 3.52 0.93 3.69 0.96 3.92 0.68 2.2713 People Orientation 3.83 0.70 3.83 0.74 3.88 0.72 0.0614 Conflict Resolution 3.52 0.75 3.63 0.72 3.63 0.90 0.3215 Managerial Structure and Policies 3.80 0.71 3.93 0.56 3.93 0.63 0.7816 Knowledge Orientation 3.78 0.92 3.86 0.83 3.92 0.85 0.3217 Innovation Orientation 3.89 0.69 4.00 0.56 3.97 0.59 0.4818 Risk Taking 3.69 0.88 3.68 0.76 3.93 0.82 1.6319 Social values 3.75 0.84 3.90 0.69 4.17 0.56 4.12*20 Over-all Climate 3.82 0.47 3.90 0.46 3.98 0.48 1.17
*Significant at 0.05 level. Scale: 5- Strongly agree 1- Strongly disagree
Perceptions across - Experience
H-2 Experience has significant positive influence on employee perceptions of the organization climate
Table 5 examines the influence of experience on the perceptions of respondents. Based on length ofservice three groups are formed: low (up to 5 years), medium (6 years to 10 years) and high (more than 10years) groups were classified. It can be observed that significant difference among the three work experiencegroups are found in case of only two dimensions - ‘Grievance Handling’ and ‘Knowledge Orientation’. Henceit is concluded that work experience has no effect on perceptions of the respondents.
Influence of Demographic Factors on Organization Climate
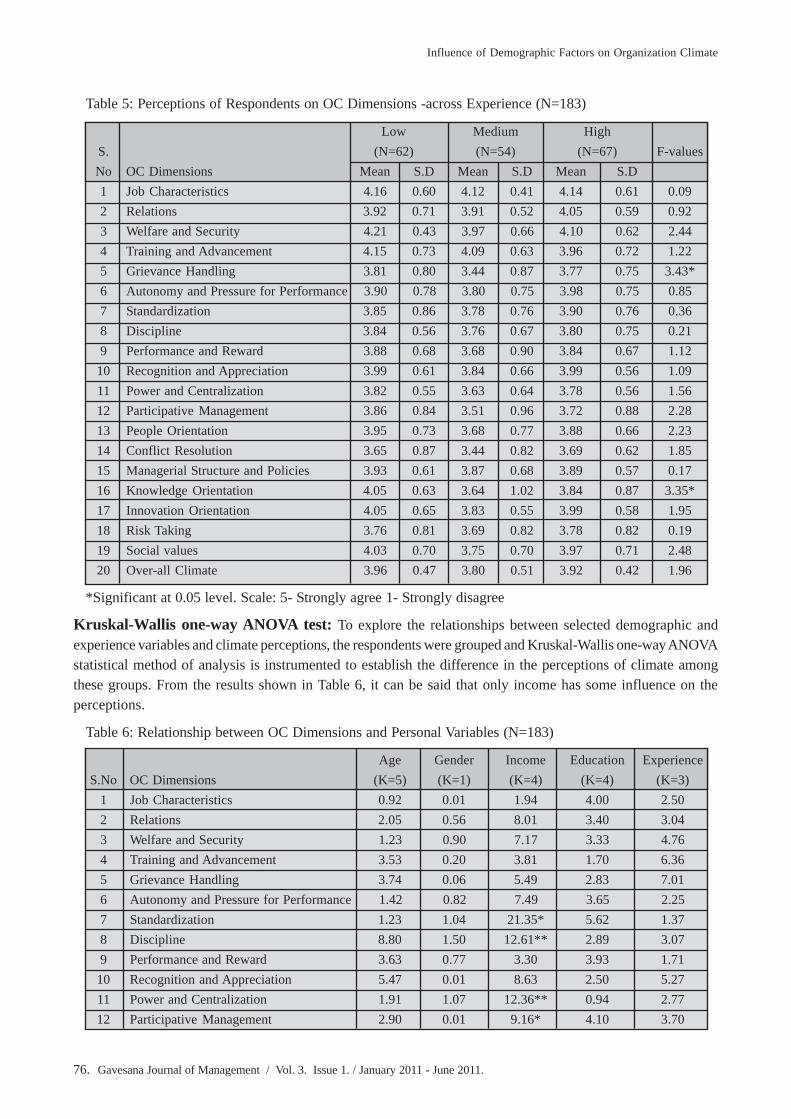
76. Gavesana Journal of Management / Vol. 3. Issue 1. / January 2011 - June 2011.
Table 5: Perceptions of Respondents on OC Dimensions -across Experience (N=183)
Low Medium HighS. (N=62) (N=54) (N=67) F-valuesNo OC Dimensions Mean S.D Mean S.D Mean S.D1 Job Characteristics 4.16 0.60 4.12 0.41 4.14 0.61 0.092 Relations 3.92 0.71 3.91 0.52 4.05 0.59 0.923 Welfare and Security 4.21 0.43 3.97 0.66 4.10 0.62 2.444 Training and Advancement 4.15 0.73 4.09 0.63 3.96 0.72 1.225 Grievance Handling 3.81 0.80 3.44 0.87 3.77 0.75 3.43*6 Autonomy and Pressure for Performance 3.90 0.78 3.80 0.75 3.98 0.75 0.857 Standardization 3.85 0.86 3.78 0.76 3.90 0.76 0.368 Discipline 3.84 0.56 3.76 0.67 3.80 0.75 0.219 Performance and Reward 3.88 0.68 3.68 0.90 3.84 0.67 1.12
10 Recognition and Appreciation 3.99 0.61 3.84 0.66 3.99 0.56 1.0911 Power and Centralization 3.82 0.55 3.63 0.64 3.78 0.56 1.5612 Participative Management 3.86 0.84 3.51 0.96 3.72 0.88 2.2813 People Orientation 3.95 0.73 3.68 0.77 3.88 0.66 2.2314 Conflict Resolution 3.65 0.87 3.44 0.82 3.69 0.62 1.8515 Managerial Structure and Policies 3.93 0.61 3.87 0.68 3.89 0.57 0.1716 Knowledge Orientation 4.05 0.63 3.64 1.02 3.84 0.87 3.35*17 Innovation Orientation 4.05 0.65 3.83 0.55 3.99 0.58 1.9518 Risk Taking 3.76 0.81 3.69 0.82 3.78 0.82 0.1919 Social values 4.03 0.70 3.75 0.70 3.97 0.71 2.4820 Over-all Climate 3.96 0.47 3.80 0.51 3.92 0.42 1.96
*Significant at 0.05 level. Scale: 5- Strongly agree 1- Strongly disagree
Kruskal-Wallis one-way ANOVA test: To explore the relationships between selected demographic andexperience variables and climate perceptions, the respondents were grouped and Kruskal-Wallis one-way ANOVAstatistical method of analysis is instrumented to establish the difference in the perceptions of climate amongthese groups. From the results shown in Table 6, it can be said that only income has some influence on theperceptions.
Table 6: Relationship between OC Dimensions and Personal Variables (N=183)
Age Gender Income Education ExperienceS.No OC Dimensions (K=5) (K=1) (K=4) (K=4) (K=3)
1 Job Characteristics 0.92 0.01 1.94 4.00 2.502 Relations 2.05 0.56 8.01 3.40 3.043 Welfare and Security 1.23 0.90 7.17 3.33 4.764 Training and Advancement 3.53 0.20 3.81 1.70 6.365 Grievance Handling 3.74 0.06 5.49 2.83 7.016 Autonomy and Pressure for Performance 1.42 0.82 7.49 3.65 2.257 Standardization 1.23 1.04 21.35* 5.62 1.378 Discipline 8.80 1.50 12.61** 2.89 3.079 Performance and Reward 3.63 0.77 3.30 3.93 1.71
10 Recognition and Appreciation 5.47 0.01 8.63 2.50 5.2711 Power and Centralization 1.91 1.07 12.36** 0.94 2.7712 Participative Management 2.90 0.01 9.16* 4.10 3.70
Influence of Demographic Factors on Organization Climate
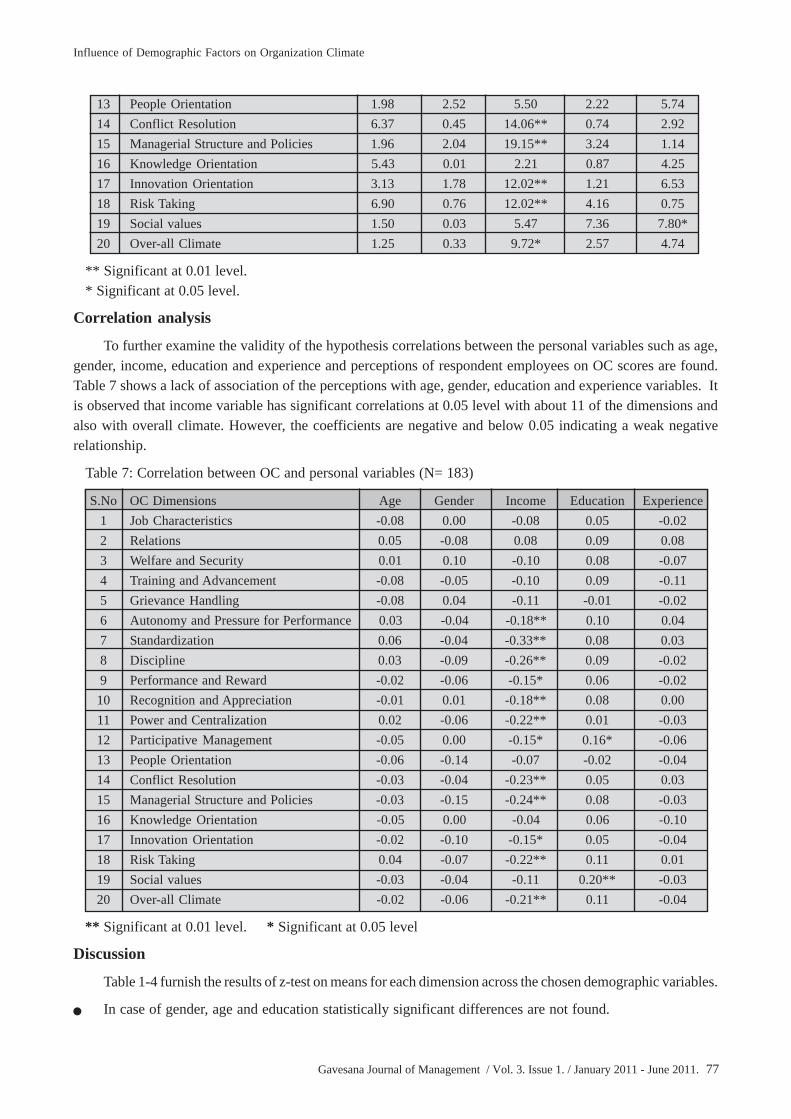
Gavesana Journal of Management / Vol. 3. Issue 1. / January 2011 - June 2011. 77
13 People Orientation 1.98 2.52 5.50 2.22 5.7414 Conflict Resolution 6.37 0.45 14.06** 0.74 2.9215 Managerial Structure and Policies 1.96 2.04 19.15** 3.24 1.1416 Knowledge Orientation 5.43 0.01 2.21 0.87 4.2517 Innovation Orientation 3.13 1.78 12.02** 1.21 6.5318 Risk Taking 6.90 0.76 12.02** 4.16 0.7519 Social values 1.50 0.03 5.47 7.36 7.80*20 Over-all Climate 1.25 0.33 9.72* 2.57 4.74
** Significant at 0.01 level. * Significant at 0.05 level.
Correlation analysis
To further examine the validity of the hypothesis correlations between the personal variables such as age,gender, income, education and experience and perceptions of respondent employees on OC scores are found.Table 7 shows a lack of association of the perceptions with age, gender, education and experience variables. Itis observed that income variable has significant correlations at 0.05 level with about 11 of the dimensions andalso with overall climate. However, the coefficients are negative and below 0.05 indicating a weak negativerelationship.
Table 7: Correlation between OC and personal variables (N= 183)
S.No OC Dimensions Age Gender Income Education Experience1 Job Characteristics -0.08 0.00 -0.08 0.05 -0.022 Relations 0.05 -0.08 0.08 0.09 0.083 Welfare and Security 0.01 0.10 -0.10 0.08 -0.074 Training and Advancement -0.08 -0.05 -0.10 0.09 -0.115 Grievance Handling -0.08 0.04 -0.11 -0.01 -0.026 Autonomy and Pressure for Performance 0.03 -0.04 -0.18** 0.10 0.047 Standardization 0.06 -0.04 -0.33** 0.08 0.038 Discipline 0.03 -0.09 -0.26** 0.09 -0.029 Performance and Reward -0.02 -0.06 -0.15* 0.06 -0.02
10 Recognition and Appreciation -0.01 0.01 -0.18** 0.08 0.0011 Power and Centralization 0.02 -0.06 -0.22** 0.01 -0.0312 Participative Management -0.05 0.00 -0.15* 0.16* -0.0613 People Orientation -0.06 -0.14 -0.07 -0.02 -0.0414 Conflict Resolution -0.03 -0.04 -0.23** 0.05 0.0315 Managerial Structure and Policies -0.03 -0.15 -0.24** 0.08 -0.0316 Knowledge Orientation -0.05 0.00 -0.04 0.06 -0.1017 Innovation Orientation -0.02 -0.10 -0.15* 0.05 -0.0418 Risk Taking 0.04 -0.07 -0.22** 0.11 0.0119 Social values -0.03 -0.04 -0.11 0.20** -0.0320 Over-all Climate -0.02 -0.06 -0.21** 0.11 -0.04
** Significant at 0.01 level. * Significant at 0.05 level
Discussion
Table 1-4 furnish the results of z-test on means for each dimension across the chosen demographic variables.
� In case of gender, age and education statistically significant differences are not found.
Influence of Demographic Factors on Organization Climate

78. Gavesana Journal of Management / Vol. 3. Issue 1. / January 2011 - June 2011.
� Income wise analysis indicates differences are significant in respect of 9 out of 19 items.
� However, the differences are in the degree of positive perceptions. Low income category employees haveslightly more favorable perceptions than their counterparts.
� What is the knowledge orientation in the organization? Given the emergence of knowledge society, thisquestion deserves attention. With the views of high experienced respondents, they are close to agreementwith the statements – ‘The specialists and the experts are highly trusted’ and ‘knowledge and expertise arerecognized and rewarded’ than their counter parts.
� The high experienced respondents moderately accepted that there is ‘sound grievances handling procedure’and ‘the management are always ready to look into the grievances and complaints of the employees’ thantheir counter parts.
Conclusion
From the study of organizational climate two conclusions emerge:
1. Employees have positively perceived the organizational climate.
2. Among the chosen variables- age, gender, education, income and experience, only income has someinfluence on the perceptions. Since incomes and the level of employees are related, the good news is non-managerial category of workers have slightly more favorable perceptions, than managerial group.
In view of the above positive results, it is suggested that management has to continue to maintain andfurther improve its good practices.
References
Agarwal, M and Sudeepa Bose 2004, ‘Organizational Climate for Perceptions of Procedural ‘Fairness’ in HumanResource Practices and Role Efficacy’, Indian Journal of Industrial Relations, vol.40, no.2, pp.176-196.
Biswas, SN 1993, ‘Perceptions of Organizational Climate and Effectiveness: A Comparative Study of DistrictCo-operative Banks and Regional Rural Banks’, Indian Journal of Industrial Relations, vol.28, no.3,pp.225-237.
Campbell, JP, Dunnette, MD, Lawler, EE and Weick KE Jr.1970, ‘Managerial Behavior, Performance andEffectiveness’, New York: Mc Graw Hill.
Chalam, GV and Srinivas, L 2005, ‘Gender wise Perceptions and Attitudes on HRD Climate in Indian BankingSector’, Indian Journal of Commerce, vol.58, no.4, pp.62-71.
Dwivedi, RS 1979, ‘Anatomy of Organizational Climate’, Journal of The All India Management Association,vol.18, no.5, May, pp. 25-28, 36.
Forehand, GA and Von H. Gilmer 1964, ‘Environmental Variations in Studies of Organizational Behavior’,Psychological Bulletin, vol.62, pp.361-382.
Garg, Pooja and Renu Rastogi. 2006, ‘Climate Profile and Organizational Citizenship Behaviors: A ComparativeAnalysis of Teachers Working in Public and Private Schools’, The ICFAI Journal of Organizational Behavior,vol .V, no.4, pp.7-17.
Payne, RL 1971, OC: The Concept and Some Research Findings, Prakseologia, NR/39/40/ROK.
Prasanna Sai Venkateswaran, K 1997, ‘A Note on HRD Climate’, Vikalpa, vol.22, no.1, pp.51-54.
Rao, TV. and Abraham, SJE. 1991, ‘HRD Climate in Organization’, in Rao, TV and Pereira, DF (eds.), RecentExperiences in Human Resources Development. New Delhi: Oxford & IBH, pp. 36-45.
Influence of Demographic Factors on Organization Climate

Gavesana Journal of Management / Vol. 3. Issue 1. / January 2011 - June 2011. 79
Roy, SK 1974, Management in India – New Perspectives, New Delhi, Meenakshi Prakashan.
Singh, Shailendra 1988, ‘Frustrations in Organizations: Relationship with Organizational Climate’, IndianJournal of Industrial Relations, vol.23, no.4, pp.446-460.
Sinha, JBP 1973, ‘OC and Problem of Management in India’. International Review of Applied Psychology, vol.2, pp. 55 – 64.
Sharma, Baldev, R 1987, Not by bread Alone: A Study of Organizational Climate and Employer-EmployeeRelations in India, New Delhi: Shri Ram Centre for Industrial Relations & Human Resources, pp. 42-50.
Srivastav, Avinash Kumar 2005, ‘Differential Climate in the Organization-An Empirical Study Across Functions’,GITAM Journal of Management, vol.3, no.1, pp.90-98.
Tagiuri, R 1968, ‘The Concept of Organizational Climate’, in R. Tagiuri and G H. Litwin (eds.), OrganizationalClimate: Explorations of a Concept, Boston: Harvard University Press, p. 11.
Uthayasuriyan, K 2005, ‘Organizational Climate in Public Sector Enterprises’, Udyog Pragati, vol. 29, no.1,January-March, pp.23-31.
Influence of Demographic Factors on Organization Climate
80. Gavesana Journal of Management / Vol. 3. Issue 1. / January 2011 - June 2011.
Step up the Stairs or Stare at the Steps?S. Panda*
Abstract
In today’s business scenario, organizations are expected to deliver best products and services to the customersfor which, the human resources are of paramount importance among other resources. The leadership styles ofyoung management professionals are creating tremendous impact on companies. In this context, the caseaddresses to the role of a young manager in bringing changes in the performance appraisal system of amanufacturing company located in Hyderabad. This anonymous case can be discussed among the practitionersand academic HR community forums which can hone new insights in different dimensions of performanceappraisal system.
About the Company
The case is based on one of the asbestos manufacturing private companies in South India namely, PanikerIndustries Private Limited. The asbestos industry is an important part of the construction business. India producesand imports hundreds of tones of asbestos every year. The wide spread reach of asbestos can be attributed to itseconomical affordability. The asbestos industry in India has an annual turnover of Rs.800 crores. It providesdirect employment to about 6000people and indirect employment to 100000 people. The asbestos fibers aremainly imported from Canada, Brazil, Zimbabwe and Russia. In India, asbestos is mostly mined in Rajasthanand Andhra Pradesh. Most of the mining is concentrated in the small scale sector while the manufacturing takesplace in the medium and large scale sectors. Asbestos cement is a major division of the asbestos industry. It isan industry in itself with an annual turnover of Rs.2000 crores. The company started manufacturing in 1985with the commissioning of its Fiber Cement division in Hyderabad. In 1990, the company changed its namefrom Panicker Asbestos Cement Products Limited to Panicker Industries Private Limited. This joint sectorcompany was promoted by Dr. K. Narayan Rao and the Andhra Pradesh Industrial Development Corporationto manufacture Fiber Cement Sheets with a capacity of 30,000 tons per annum. Currently Paniker produces650,000 tons of fiber cement sheets per year. Human resources are the greatest strength of the company. Mostof its employees have around ten years of work experience in the fiber cement industry.
The company has different units located in Vijayawada, Ongole, Lakhanpur, Hyderabad, Jabbalpur andSasaram. The company has a planning to start two new units; one in Orissa and another in Karnataka. Thepresent study is conducted for the Hyderabad plant and its manpower strength is four hundred and thirty ninefunctioning in six departments. The HR department is led by the Senior Vice-President followed by Asst. Vice-President, Senior Manager, Manager, Officer, Jr. Officer, Management Trainees and Assistants (top to bottom).
Paniker’s high-tech fiber Cement plant is a fully automated factory which has incorporated the latesttechnology and it fulfills the standard prescribed by I.S.I. The Paniker personalized customer service is gearedto ensure complete customer satisfaction. The marketing and technical teams work closely with the customers,identifying their needs, helping in roof-design installation and keeping in close contact before and after theybuy the products.
Paniker’s customer service is further supported by their stockists who have been selected by the companyfor their own business integrity and repute. They are also trained to provide technical advice to clients in theareas of estimation, installation and allied aspects.
Case Study
* Assistant Professor (HRM), Siva Sivani Institute of Management, Kompally, Secunderabad-500014.E-mail ID :[email protected]

Gavesana Journal of Management / Vol. 3. Issue 1. / January 2011 - June 2011. 81
The company is one of the leading asbestos manufacturers in India. The company puts its best efforts tocontinuously improve the satisfaction level of the customers.
Methodology
A study is conducted on a cross section of employees of the company which is a descriptive analytical one.The employees of the Hyderabad unit have been taken as the universe of the study. One hundred and fiftyemployees comprising thirty four per cent of the total man power strength of the company have been taken forthis study. The respondents belong to different categories of the aforesaid unit. The respondents include workersand supervisors of the company. They have been administered with a specified questionnaire covering differentaspects of performance appraisal system. They had responded and rated on a five point rating scale from highlydissatisfied to highly satisfied (1 to 5). Performance planning, implementation, feedback mechanism, performancecounselling, career growth opportunity and allied aspects have been covered in the questionnaire They havealso given their suggestions for improving the appraisal system. The view points of the respondents on differentfunctional and structural dimensions of performance appraisal system of the company have been tabulated,collated and analyzed. Both primary and secondary sources have been taken for collecting the data and relevantinformation on the specified field. Different journals, magazines, books have been reviewed.
Issues Covered
Performance Appraisal System is the process of assessing the performance and progress of an employeeor a group of employees on a given job and his / their potential for future development. Some key issues ofperformance appraisal like an employee’s improvement, career growth opportunities, impact of changes on hisperformance, professional relationship have been discussed in this case.
Current Scenario
Mr. Tirupati Rao is the Officer-HR of the company. He has been working in the company for the last threeyears (2004-2007) after successfully completing his training period of one year. Then he has been taken as Jr.Officer –HR for two years. He is an engineering (Mechanical) graduate from JNTU, Hyderabad. After completinghis engineering degree he pursued his PGDM from MDI, Gurgaon. He is an innovative person. He has startedhis career in this company and preferred Hyderabad as he hails from this place.
The company is doing well. Its production track record shows a positive trend. It is one of the leadingasbestos manufacturing players in the country which has given equal emphasis on customer satisfaction andprofits. But what happens to its human resources? Are they going through the tough time? Do they really feelhappy and prosperous in the company? What is the career prosperity of the employees in Paniker Company? Isit the place for the best contributors? Is it the best place to work with sincerity? Does the company recognize thetalents? All these questions have been raised by the recognized union before management. This union has beenleading the employees for the last seven years. Besides, there are four other unions functioning in the Hyderabadunit. It has been argued by some union leaders that the employees’ views had been least considered by themanagement. For the last three and half years, the eligible employees have been kept without promoting themeven though the company is doing financially well. Keeping this in view, the management agreed to the recognizedunion and promised to look into this issue seriously and to initiative some measures in this direction. The Vice-President (HR) discussed this issue with all the departmental heads. And after this, initiatives on the humanresource planning with specific response to career growth opportunities have been taken. This responsibilityhas been given to Mr. Rao, the Officer-HR as suggested by the different departmental heads. And Mr. Rao isalso looking after the performance management issues of the company for the last three years.
Mr. Rao is an enthusiastic person. After taking the new task, he started discussing on different humanresource management issues with employees informally. He thought there is some problem in the company’s
Step up the stairs or stare at the steps?

82. Gavesana Journal of Management / Vol. 3. Issue 1. / January 2011 - June 2011.
career advancement scheme. Then he conducted a study on one hundred and fifty employees belonging todifferent departments.
Table-1: Response of the employees on Performance Appraisal System of the company
Source: Data Collected and Collated from employees (excluding the managerial category)
Analysis
The Table-1 shows that majority of the employees are not satisfied with the performance appraisal systemof the company. It is clear from the above table that both the supervisors and the workers of different agegroups are dissatisfied with the appraisal system. And around seventy five percent of the respondents are highlydissatisfied with the appraisal system. It is quite interesting to observe from the data in Table-1 that no respondentis highly dissatisfied with employee appraisal system. And to be more focused, all the respondents have beencategorized into six categories on functional role and their age.
On the different aspects of performance appraisal system of the company, he also found that most of theemployees which includes supervisors and workers (around 90% of both) felt dissatisfied with the promotionpolicy of the company. And around three-fourth of the respondents (75%) have opined that they are unaware ofthe purpose and implications of the appraisal system. Around 60% of the respondents have reflected theirdissatisfaction on the workload and work norms. As per their views, they are not satisfied with the work loads,working durations and the frequency of supervision. And also their perks and remunerations are not beingequally compensated at par with the market values. Around one third of the respondents have viewed thatemployees are not consulted and discussed while setting the work standards. Again they have viewed that theirtechnical expertise and contributions are considered for appraising their performance. And the due weight onthe skill component would have given more ratings in the overall appraisal of an employee’s performance.Many behavioural parameters are considered with importance about which they are unaware. Around two thirdof the respondents opined their inability to understand the selection criteria for sending them to various trainingprogrammes. A quarter of the respondents have highlighted their dissatisfaction on the counselling programmeimplemented by the management. They have also pointed out that some of the supervisors and managers arebiased to some employees. Around one-tenth of the respondents have viewed about their planning for leaving
Step up the stairs or stare at the steps?
RespondentCategory
Supervisor(< 35 yearsof age)Supervisor(35 - 45years ofage)Supervisor(> 45 yearsof age)Workers(< 35 yearsof age)Worker(35 - 45years ofage)Worker(> 45 yearsof age)Total
Number ofRespondents
10
10
10
40
40
40
150
HighlyDissatisfied
7
8
6
31
27
33
112
Dissatisfied
2
1
2
6
4
6
21
Neutral
1
1
1
1
5
1
10
Satisfied
0
0
1
2
4
0
7
HighlySatisfied
0
0
0
0
0
0
0
TotalNo. Of
Respondents
10
10
10
40
40
40
150
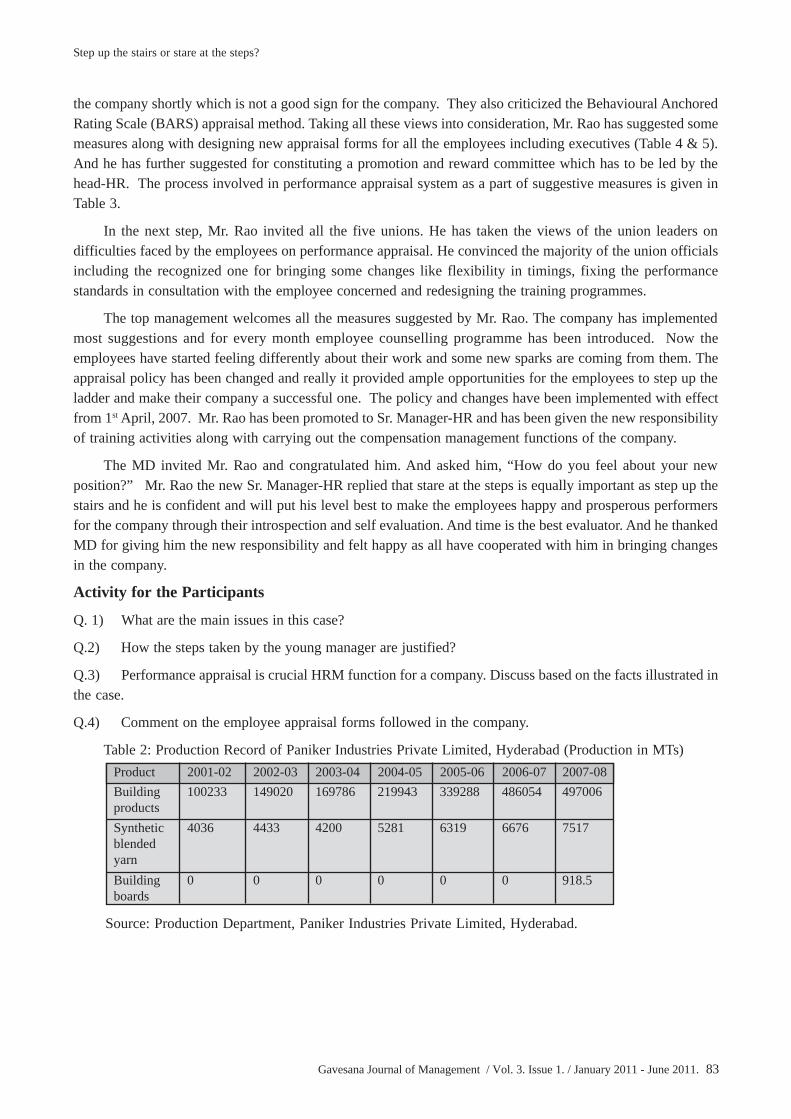
Gavesana Journal of Management / Vol. 3. Issue 1. / January 2011 - June 2011. 83
the company shortly which is not a good sign for the company. They also criticized the Behavioural AnchoredRating Scale (BARS) appraisal method. Taking all these views into consideration, Mr. Rao has suggested somemeasures along with designing new appraisal forms for all the employees including executives (Table 4 & 5).And he has further suggested for constituting a promotion and reward committee which has to be led by thehead-HR. The process involved in performance appraisal system as a part of suggestive measures is given inTable 3.
In the next step, Mr. Rao invited all the five unions. He has taken the views of the union leaders ondifficulties faced by the employees on performance appraisal. He convinced the majority of the union officialsincluding the recognized one for bringing some changes like flexibility in timings, fixing the performancestandards in consultation with the employee concerned and redesigning the training programmes.
The top management welcomes all the measures suggested by Mr. Rao. The company has implementedmost suggestions and for every month employee counselling programme has been introduced. Now theemployees have started feeling differently about their work and some new sparks are coming from them. Theappraisal policy has been changed and really it provided ample opportunities for the employees to step up theladder and make their company a successful one. The policy and changes have been implemented with effectfrom 1st April, 2007. Mr. Rao has been promoted to Sr. Manager-HR and has been given the new responsibilityof training activities along with carrying out the compensation management functions of the company.
The MD invited Mr. Rao and congratulated him. And asked him, “How do you feel about your newposition?” Mr. Rao the new Sr. Manager-HR replied that stare at the steps is equally important as step up thestairs and he is confident and will put his level best to make the employees happy and prosperous performersfor the company through their introspection and self evaluation. And time is the best evaluator. And he thankedMD for giving him the new responsibility and felt happy as all have cooperated with him in bringing changesin the company.
Activity for the Participants
Q. 1) What are the main issues in this case?
Q.2) How the steps taken by the young manager are justified?
Q.3) Performance appraisal is crucial HRM function for a company. Discuss based on the facts illustrated inthe case.
Q.4) Comment on the employee appraisal forms followed in the company.
Table 2: Production Record of Paniker Industries Private Limited, Hyderabad (Production in MTs)
Source: Production Department, Paniker Industries Private Limited, Hyderabad.
Step up the stairs or stare at the steps?
Product 2001-02 2002-03 2003-04 2004-05 2005-06 2006-07 2007-08Building 100233 149020 169786 219943 339288 486054 497006productsSynthetic 4036 4433 4200 5281 6319 6676 7517blendedyarnBuilding 0 0 0 0 0 0 918.5boards

84. Gavesana Journal of Management / Vol. 3. Issue 1. / January 2011 - June 2011.
Table 3: Performance Appraisal Process, Paniker Industries Private Ltd., Hyderabad
Step up the stairs or stare at the steps?

Gavesana Journal of Management / Vol. 3. Issue 1. / January 2011 - June 2011. 85
Source: Department of HRM, Paniker Industries Private Ltd., Hyd.
Table 4: Performance Appraisal Form For Non-Executives (w.e.f. 1st April, 2007)
PART - A
PERFORMANCE REVIEW & PERFORMANCE APPRAISAL
(Appraised by Immediate Boss & Head of the Department)
I. EMPLOYEE INFORMATION
Employee Name Employee CodeDate of Birth Date of JoiningLocation DesignationQualificationsPrevious ExperiencePaniker’s Experience Confirmation due onExperience in present position
II. FACTORS OF ASSESSMENT
Performance Ratings Point per each rating Overall ratingExcellent 10 80 & aboveGood 08 60 & aboveAverage 06 50 & abovePoor 04 Below 50
a) Job Knowledge and Learning IB HOD
1. Demonstrates a basic knowledge of all aspects of job and applies this effectively to meet objectives2. Learnt technology, methods of professional competence for the job3. Keeps abreast with new technologies4. Enhanced performances by applying knowledge
Weighted Average
Step up the stairs or stare at the steps?

86. Gavesana Journal of Management / Vol. 3. Issue 1. / January 2011 - June 2011.
b) Adaptability/Flexibility IB HOD
1. Adjusts workload with ease in the light of changing priorities2. Works around obstacles to complete the project (in terms and working hours, work planning etc.)3. Maintains effectiveness even in the stressful circumstances4. Adjust behaviour to suit new procedures, systems or responsibilities.
Weighted Average
c) Initiative: IB HOD
1. Completes assignments in the timely manner without constant supervision2. Actively seeks solutions to problems before being asked or directed3. Minimizes a potential problems by anticipating and act accordingly4. Is highly proactive, looks ahead for specific opportunities for contribution
Weighted Average
d) Communication: IB HOD
1. Effective communication skills2. Listens actively and assesses requirement accurately3. Has good oral, written and presentation skills4. Prepares reports as required5. Communicates clearly and assertively
Weighted Average
e) Organising and Resource utilization IB HOD
1. Ability of organizing the things properly and effective utilization of resources: tools and equipment, human resources and in terms money: cost effectiveness.2. Maximizing the productivity
Weighted Average
f) Decision Making IB HOD
1. Close analysis of the job and relevant facts2. Evaluate various alternatives3. A realistic plan of action
Weighted Average
g) Team Work of co-operation IB HOD
1. Spontaneous co-operation whenever required2. Contributes by sharing knowledge3. Enhances team performances through personal effectiveness4. Looks team performances through personal effectiveness5. Looks beyond the requirement of job and other suggestions for the improvement of team performance6. Leadership qualities.
Weighted Average
Step up the stairs or stare at the steps?

Gavesana Journal of Management / Vol. 3. Issue 1. / January 2011 - June 2011. 87
h) Problem Solving IB HOD
1. Solves problems logically/Manages situations2. Seeks own knowledge and experience base in trouble shooting3. Demonstrates creativity in problem solving
Weighted Average
i) Personal Effectiveness IB HOD
1. Displays emotional control and maturity by showing the ability not to personalize issues in work situation2. Seeks and reinforces positive feedback and works on shortcomings3. Applies time management skills by respecting time of others and self4. Ability to treat specific information as confidential
Weighted Average
j) Organisational commitment & conduct IB HOD
1. Upholds Paniker Image2. Gives priority to customers/suppliers above personal interests3. Provides constructive criticism and valuable suggestions.4. Attitude5. Punctuality6. Obedience / Subordination
Weighted Average
OVERALL PERFORMANCE RATING
Recommendation for promotion and specific comments as achievements and justification for promotionto be made.
Present Designation: To be Promoted As:
III. TRAINING & DEVELOPMENT NEEDS
Specify the areas where need to be trained.
1.2.3.4.5.
Signature of Immediate Boss Signature of HOD HRM Dept.Date: Date: Date:
Step up the stairs or stare at the steps?

88. Gavesana Journal of Management / Vol. 3. Issue 1. / January 2011 - June 2011.
PART - B
SELF ASSESSMENT FORM
Name : Designation:
Department:
1. Your specific achievements in the present job in the last six months.
——————————————————————————————————————————
2. To fulfill the above achievements what way your superiors/colleagues/sub-ordinates helped you?
——————————————————————————————————————————
3. What is the role you are playing in the organization to meet the organizational goals?
——————————————————————————————————————————
4. What is that gives you satisfaction in your job and what additional responsibilities do you propose toshoulder?
——————————————————————————————————————————
5. What are your suggestions on the existing working environment?
——————————————————————————————————————————
6. Write your objectives for the next one year along with the action plan.
——————————————————————————————————————————
7. Specify your strengths and weaknesses.
——————————————————————————————————————————
Strengths: Weaknesses:
a..——————————————-—— ——————————————
b. ———————————————— ——————————————
c. ———————————————— ——————————————
d. ———————————————— ——————————————
8. What type of training programme & support from the company will be helpful to you to improve youroverall performance?
Signature of the Employee.
Date:
Note: If required use separate Sheet.
Step up the stairs or stare at the steps?

Gavesana Journal of Management / Vol. 3. Issue 1. / January 2011 - June 2011. 89
Table 5: Performance Appraisal Form for Managers & above categories
Performance Plan and Goal Setting for April ——— to March ———.
Results Achieved up to 31.3.2007S.No. Agreed Key Objectives: Self assessment Appraiser’s
Assessment
The above mentioned goals and objectives have been discussed and agreed upon.
Signature of Appraisee: Signature of Appraiser:
Date: Date:
Results Achieved (to be completed in April of every year)
What factors have helped and/or hindered performance?
Any significant contribution made by the appraisee over & above his/her objectives.
Signature of Appraisee Signature of Appraiser
Date: Date:
Step up the stairs or stare at the steps?
90. Gavesana Journal of Management / Vol. 3. Issue 1. / January 2011 - June 2011.
Impact of Financial Sector Reforms onIndian Commercial Banking Sector
K. Sriharsha Reddy*
A thesis submitted to Dr B.R. Ambedkar open university for the degree of Doctor of Philosophy withspecialization in commerce in November. 2009 and awarded degree in March 2010
Introduction
The financial development was given impetus with the adoption of social control over banks with thenationalisation of 14 major scheduled banks in July 1969 and six commercial banks in April, 1980. Despitecommendable progress in nationlisation era of Indian banking, serious problems have emerged due to thereasons beyond the control of banking sector. By the beginning of 1990, the social banking goals set for thebanking industry made most of the public sector banks unprofitable. Major factors that contributed todeteriorating bank performance included (1) high cash reserve ratios and statutory liquidity requirements (2)low yields on government bonds (as compared with those on commercial advances); (3) directed andconcessional lending; (4) administered interest rates; and (5) lack of competition. The resultant ‘financialrepression’ led to the decline in productivity and efficiency and erosion of profitability of the banking sector ingeneral. It is against this background of circumstances, the development of a sound banking system wasconsidered essential for the future growth of the financial system and financial sector reforms were initiated inthe country in 1992 with a view to improving the efficiency in the process of financial intermediation, enhancingthe effectiveness in the conduct of monetary policy and creating conducive environment for the integration ofdomestic financial sector with the global system through the recommendations made by Narasimham committeereport – I (1992) and Narasimham committee report – II (1998).
Objectives of the Study
The major objective of the study is to assess the impact of reforms on the profitability , efficiency, assetquality and over all performance of banks during the period 1992 - 2006.The specific objectives of the studyare;
1. To identify the trends in the progress of performance of various bank groups (based on ownership) inselected aspects as a result of implementation of reform measures especially from 1990 onwards.
2. To make a comparative analysis of the profitability (return on investment) and efficiency (in terms of netinterest margin and operating cost ratio) of commercial banks in the post reform period from 1996 - 2006.
3. To examine the impact of reforms and factors contributing to the incidence of Non Performing Assets(NPAs) in Indian banking system after second phase of banking sector reforms from 1998 - 2006.
4. To identify the relative positions of commercial banks after implementation of first phase (1999) andsecond phase (2006) of reforms.
*Professor & Head, Department of Business Management, Matrusri Institiute of Post Graduate Studies, 16-1-486, Saidabad,Hyderabad.Email ID: [email protected]
Abstract of Ph.D Thesis

Gavesana Journal of Management / Vol. 3. Issue 1. / January 2011 - June 2011. 91
Research Methodology
In the light of sweeping changes that have taken place in banking policies and practices during the lastfifteen years of reform period, it is thought appropriate to evaluate the impact of reforms on the performance ofthe banks. The major objective of the study is to assess the impact of reforms on the profitability, efficiency,asset quality and over all performance of banks during the period 1996 - 2006. In the present study financialdata of banks is obtained from ‘Statistical Tables Relating to Banks’ (1979-2007), published by Reserve Bankof India (2008) and ‘Report on Trend and Progress of Banking in India’ (Annual) by Reserve Bank of India and‘Global financial stability report’ published by International Monetary Fund. Further, multivariate OLS regressiontechnique is employed to identify the determinants of profitability, efficiency and asset quality in Indian banking.Financial ratios and spearman rank correlation coefficients are computed to assess the relative positions ofvarious banks and to study the importance of the financial ratios.
Findings of the Study
1. The performance of public sector banks has improved during the late 1990s reflected by positive profitability(measured by return on assets), more cost efficiency (measured by operating cost divided by total expenses).Even though foreign and private sector banks have generally outperformed public sector banks in terms ofprofitability and cost efficiency in the initial stage, such differences have diminished as public sector bankshave gained ground.
2. Non interest income has a positively significant effect on Return on Assets (ROA) , confirming that non-interest income does have a positive effect on profitability. Asset size has a negative and significant effect onROA indicating that large banks will have lower profitability due to the adverse effects of economies of scale.
3. Investments in government securities had a positively insignificant effect on ROA, indicating that increasein investments in government investments increases profitability (may be due increase in returns earned onfixed income securities as a result of decline in interest rates) when other variables are controlled.
4. Priority sector advances has a negatively insignificant impact on ROA, which runs contrary to the popularbelief that priority sector lending has a dampening effect on profitability (may be due to reforms in prioritysector lending).
5. Ownership has no significant effect on the ROA of banks. This is in contrary with the view that privatizationwould improve the profitability of economic organizations.
6. Non interest income has a negatively significant effect on Net Interest Margin (NIM), indicating thathigher non interest income levels declines net interest margins as diversification (fee based activities) of bankingactivities results in lowering spreads.
7. Investments in government securities have a positive and significant indicating that increase in investmentsin government investments increases margins. Priority sector advances has a positive, insignificant effect onNIM indicating that it results in increase in margins, when other variables are controlled.
8. Public sector banks seem to be having a higher net interest margins than old private sector banks and newprivate sector banks due to access to low cost funds and high interest rates on loans given to SMEs.
9. Non interest income had a negatively significant effect on operating cost ratio (OCR), indicating thathigher non interest income levels declines operating cost ratio as diversification (fee based activities) of bankingactivities results in increasing cost efficiency. Priority sector advances has a negatively significant impact onOCR indicating that increase in Priority sector advances resulting in increase in operating efficiency (reductionin operation cost ratio).
Summary of Phd Thesis - Impact of Financial Sector Reforms on Indian Commercial Banking Sector

92. Gavesana Journal of Management / Vol. 3. Issue 1. / January 2011 - June 2011.
10. Investments in government securities has a negatively insignificant effect on OCR, indicating that increasein investments in government investments decreases operating costs (increases operating efficiency) whenother factors are controlled.
11. Public sector banks have lower cost efficiency than other categories of banks. The main reason for the lowcost efficiency of public sector banks is their huge wage bills and large branch network in unviable rural areas.
12. The impact of priority sector lending on NPA levels is negative but surprisingly insignificant, indicatingthat NPA problem in India is more due to lending to non priority sectors and sensitive sectors such as personalloans and real estate loans.
13. Larger banks exhibit better credit risk management demonstrated by lower NPAs. Adequately capitalizedbank also appear to have lower NPAs. The impact of growth in Gross National Product (GRGNP) on NPAlevels is negative and significant indicating that favorable macroeconomic conditions help to lower NPA levels
14. Nature of ownership has a significant impact on NPA levels. Specifically, new private banks have thelowest NPA levels, followed by old private banks, and public sector banks in this order. Finally, policy measuresinitiated to tackle NPA problem have been largely successful in achieving their objectives. Corporate DebtReconstruction scheme and Securitisation Act have been successful in lowering NPAS in Indian Banking.
15. It is evident that changes in the composite ranks are significantly influenced by changes in the ranks ofcapital adequacy, asset quality, management quality and earnings quality. It is observed that changes in theranks of liquidity are not influencing the changes in the composite ranks.
16. Further, it is observed that the order of importance in which factors are influencing the overall performanceof the banks is earnings quality, asset quality, management quality, capital adequacy and liquidity.
Policy Implications
However, one must be cautious when deriving a conclusion about the success of the reforms, and thefollowing points remain noteworthy.
• Due to the reforms in priority sector lending, advances to priority sectors have exerted a positive effect onearnings efficiency (measured by NIM which is the ratio of spread to assets) and cost efficiency. Though thenegative impact of priority sector lending has declined in recent years it should be exercised according tomarket principles and at the initiative of banks, for improving banks accountability and management skills.
• Investment in government securities has positive effect on profitability and cost efficiency of the wholebanking sector. But, Investment in government bonds could reduce banks incentives to improve their riskmanagement skills on lending activities.
• Indian commercial banks should further be encouraged in diversifying into non traditional banking activitiesas non interest income is significant factor influencing profitability and efficiency of the banks.
• To tackle the problem of NPAs, Reserve Bank of India should focus on smaller banks and less profitablebanks that seem to exhibit higher NPAs.
• Adequate attention should also be paid to banks with low operating efficiency and low capitalization thatappear to be important in determining NPA levels.
• Measures need to be taken to tackle the problem of NPAs for smaller banks, unprofitable banks, especiallyduring adverse macroeconomic conditions
• It is observed that public sector banks have significantly improved where as private sector banks havedrastically deteriorated in their performance. Therefore, private sector banks are suggested to improve on assetquality and earnings quality management.
Summary of Phd Thesis - Impact of Financial Sector Reforms on Indian Commercial Banking Sector

Gavesana Journal of Management / Vol. 3. Issue 1. / January 2011 - June 2011. 93
Finally, it is concluded that reforms initiated after 1991 have significant impact in improving the profitability,earnings efficiency, cost efficiency, asset quality and overall performance of commercial banks in India. But,this improvement in the performance of the banks has come at the cost of meeting social objectives such asequitable distribution of lending across various sections of population and regions. It is observed by some ofthe researchers that inequalities have increased in the distribution of lending across various sectors, sections ofpopulation and regions. Therefore, present study can be taken forward by incorporating evaluation of commercialbanks from equity as well as efficiency criteria.
Summary of Phd Thesis - Impact of Financial Sector Reforms on Indian Commercial Banking Sector

94. Gavesana Journal of Management / Vol. 3. Issue 1. / January 2011 - June 2011.

Gavesana Journal of Management / Vol. 3. Issue 1. / January 2011 - June 2011. 95

96. Gavesana Journal of Management / Vol. 3. Issue 1. / January 2011 - June 2011.

Gavesana Journal of Management / Vol. 3. Issue 1. / January 2011 - June 2011. 97
Gavesana Journal of ManagementSubscription Form
The Gavesana Journal of Management is published bi-annually. The subscription rates are as under :
RatesSingle copy 300/-
One year Subscription 600/-
Two year Subscription 1,000/-
Three year Subscription 1,500/-
Payment Details :
Demand Draft/Cheque No: ________________________ dated ___________________
in favour of “Vignana Jyothi Institute of Management” payable at Hyderabad.
Delivery Details:
Name: _________________________________________________________________
Address:________________________________________________________________
________________________________________ Pin __________________
E-mail: ______________________________________ Tel No.____________________
Send your subscription to: The EditorGavesana Journal of Management,C/o. Vignana Jyothi Institute of Management,Veljan Centre, Vignana Jyothi Nagar,Bachupally, via Kukatpally,Hyderabad-90, Andhra Pradesh, India.Telephone:. 040-23044901/02, Fax: 040-2304 4953.Email: [email protected]: www.vjim.edu.in;
Dated ______________