gaze-contingent display for retinal function …macularmapping.com/wp-content/uploads/pdfs/... ·...
TRANSCRIPT

GAZE-CONTINGENT DISPLAY FOR RETINAL FUNCTION TESTING BY SCANNING LASER OPHTHALMOSCOPE
by Manfred MacKeben and Alexander Gofen The Smith-Kettlewell Eye Research Institute
2318 Fillmore Street San Francisco, CA 94115, USA
From: J Opt Soc America A, vol. 24/5, May, pp. 1402-1410 (feature issue on “Retinal Imaging”) OCIS codes: 170.4470 Ophthalmology
170.0110 Imaging systems
330.3790 Low vision
999.9999 Scanning Laser Ophthalmoscope
MacKeben-JOSA-final 2
Abstract To overcome the inconvenience and imprecision of conventional software performing micro-perimetry with the Scanning Laser Ophthalmoscope (SLO) in clinical settings, we developed a “smart micro-perimetry” program. It takes advantage of modern computer technology, especially processing speed and high rate of data transfer. It allows continuous on-line processing of the image of the retina and instantaneous correction of stimulus placement according to involuntary eye movements. Thus, the program provides gaze-contingent display of the stimulus and senses the conditions for image tracking, so that stimulation during large eye movements, blinks and temporarily flawed image quality can be prevented. These features have greatly increased the efficiency and precision of SLO data in comparison to those obtained by older programs.
Introduction Two pieces of information are crucial in all perimetric procedures: 1. Was the stimulus detected or recognized? 2. Which part of the retina was used to mediate the response? The latter question decides the validity of the data and emphasizes the steadiness of the patient’s gaze, i.e. fixation. The introduction of the Scanning Laser Ophthalmoscope (SLO) in the 1980s has given eye care specialists a unique tool that allows the simultaneous visualization of a patient’s retina plus a stimulus that is scanned directly onto the retina [1, 2]. What makes the instrument so special is that an IR laser produces a live 480 (or 525) line TV image of the retina that the examiner sees while the patient does not. The stimulus is produced by a second laser (He-Ne, wavelength = 633 nm, orange) that is visible to the patient while the examiner simultaneously sees the image of the stimulus superimposed on the image of the patient’s retina. Thus, the patient’s use of certain parts of a damaged retina can be directly monitored without an eye position calibration, which is difficult for patients with low vision, especially those with central retinal vision loss. This feature has made the SLO an instrument of unique utility for clinical work on low vision patients. As such, it appears as if it can render the issue of steady fixation less critical. For research purposes, modern SLOs have been further developed by including adaptive optics [3, 4]. On the other hand, the last 25 years also have revealed features that either make work with the SLO at times cumbersome, or render some SLO data sets unreliable. The reasons come from two principal sources: First, susceptibility to mechanical perturbations caused by unsteady head placement by the patient, and secondly unstable gaze including large eye movements carrying the pupil out of the ideal position range that is required for continuous imaging. The latter can be partially counteracted by dilating the pupil, but this is not done routinely for the most common measurement for mapping scotomas and intact areas of the central retina, commonly termed “micro-perimetry”. The standard program performing micro-perimetry in the past, Rodenstock’s venerable “Scotometry”, has suffered from the lack of ongoing development that could keep up with the advances in electronics and computer speed. As a result, older programs performing micro-perimetry by SLO depended on the examiner’s selecting a location on the constantly moving image of the retina by mouse click just at the right time, when no significant eye movement was expected. Then the image of the moving retina froze and the examiner had to bring the
MacKeben-JOSA-final 3
stimulated location into spatial register with the retina with respect to the coordinate system of the SLO by pointing the cursor and clicking the mouse on a conspicuous landmark after each trial. Imprecisions of this procedure came from four sources: A. The goal of placing the stimulus at the intended location was often not met due to the normal motor latency of the examiner, because patients cannot prevent making eye movements during fixation [5]. B. If a saccadic eye movement occurred at the moment when the image froze, the image was likely to be smeared or distorted. To click on the landmark on such a deteriorated image relies mostly on guessing, C. Even if the frozen image appeared sharp, it could not be concluded that no saccade happened during the delivery of the stimulus. D. The mechanical precision of clicking on the same location over and over again is limited. This inaccuracy has spatial and temporal aspects, since it has been found that the “pointing time” with a mouse is, on average, 800 ms, while the spatial error rate for small targets even in healthy young subjects varied between 6 and 31 % [6]. Consequently, to obtain data from scotometry demanded near-perfect performance from the patient and the examiner alike. Our goal was to overcome the potential problems listed above. In contrast to older, off-line solutions [7, 8, 9], on-line real-time processing of the retinal image should be feasible due to the rapid rise of data acquisition speed in the past two decades. This has created new possibilities of accurately placing stimuli on the retina using gaze-contingent display. In addition, the correction for eye movements can also improve the validity of the data. Even images of partial sub-optimal quality through “shading” caused by temporary misalignment of the patient’s eye can yield interpretable data. The latter point can increase the utility of the SLO in a clinical setting, since it allows collecting data from more patients with low vision, many of whom are elderly and cannot be expected to adhere exactly to instructions regarding fixation and head stability. In addition, avoiding frequent mouse clicking also promises to benefit the procedure, both in terms of accuracy and of overall test duration. It is the goal of this paper to demonstrate how the principal weaknesses of conventional micro-perimetry by SLO for clinical purposes can be overcome by using state-of-the-art software. Stimulated by earlier developments in this direction [10,11,12], we have taken the concept a step further to create “Smart Micro-Perimetry” (SMP) software that uses up-to-date technology to compensate for fixational eye movements and to make the measurements faster and more precise.
Methods
Hardware and software We used a Rodenstock SLO (model 101) run by a primary PC controlling its basic functions. Our hardware implementation of SMP utilizes a secondary computer running in parallel to the primary one. We have run SMP on two different hardware configurations: a PC (3.4 GHz, 2Gb RAM) with a Matrox Morphis frame-grabber, and a PC (2.8 GHz, 2Gb RAM) with a Matrox Orion frame-grabber (http://www.matrox.com/imaging/products/home.cfm). Both boards also performed instantaneous image digitization. Thus, the data are acquired directly without having to store the images on video tape first, as was the standard technique in the past. Furthermore, the
MacKeben-JOSA-final 4
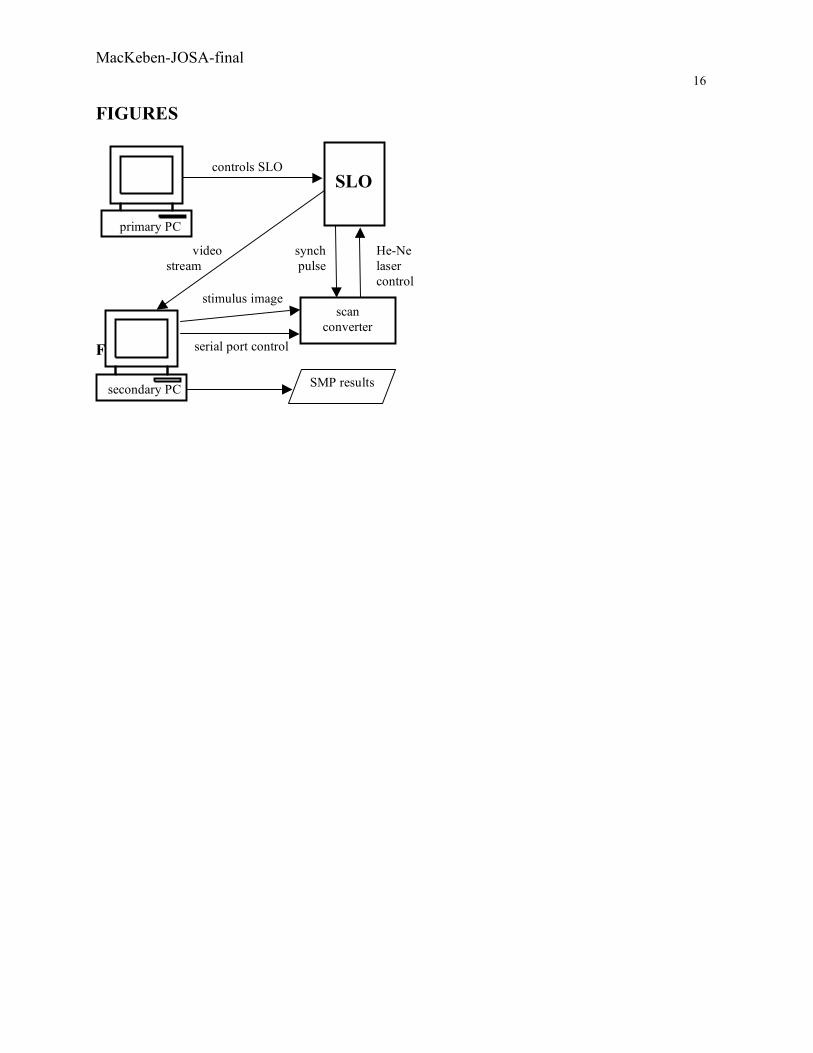
secondary PC creates images as output that need to be transmitted to the SLO’s He-Ne laser in a format that is compliant with the local video standard (NTSC or PAL). This conversion is performed by a standard scan converter (CorioScan by TV ONE, http://www.tvone.com/index.php). Consequently, any image created by the PC is instantaneously converted to video format and can be scanned onto the patient’s retina without any programming. Figure 1 is a schematic showing the connections between the devices. The high speed of the PC is essential for the real time frame tracking (see below). A large amount of RAM is important for recording relatively long “movies” of eye movements, since 60 half-frames/second require 9.2 Mb. 2Gb of RAM allow recording a movie up to 150 s.
Put Figure 1 about here The SMP software was written in Delphi-6 (Borland; http://www.borland.com/ ) and uses low-level routines supplied with the Matrox Imaging Library (MIL 8) as OCX components. MIL 8 provides two components for frame tracking. The challenge was to make sure that every single video frame is indeed tracked in real time.
Real time grabbing and tracking eye movements SMP vs. the traditional program constitutes a qualitative leap because it delivers function and convenience that did not exist before. What made this improvement possible was a real time procedure for continuous grabbing and tracking based on the implementation of the following two concepts:
1. A fast “pattern matching” procedure in MIL-8, coupled with the high speed of modern PCs;
2. Multi-pattern search and comparison of the tracking results performed for each frame in the SLO video stream.
The pattern matching procedure uses on-board optimization of the so-called “Normalized Gray Correlation” (NGC) function r and a hierarchical search algorithm [13]. The maximum of this NGC function corresponds to the x,y-shift of the pattern searched in the frame. Here, "frame tracking" means obtaining these x,y-shifts, assuming that the incoming video stream represents a plane image performing only translational movements, although geometrical properties and optics of the human eye and SLO introduce small nonlinear distortions of the translational movements of the retina image. In addition, the human eye can also perform small torsional eye movements. The MIL routines allow obtaining of x,y-translation and rotation of the model. However, if rotation is included in the search, tracking performance drops. Fortunately, our experiments show that frame tracking of eye movements via MIL's pattern matching works very accurately even with the assumption of purely translational movements (see below). Pattern matching is especially convenient, because it does not need any particular geometrical features, nor does it require human intervention to select a search pattern. The implementation of pattern matching in MIL-8 is so efficient, that it can perform real time tracking of a typical video stream from an NTSC camera without missing a frame at sub-pixel accuracy. Thus, it can track up to 60 half-frames (640×240 pixels) per second and needs only about 15 ms of the 33 ms interval between full 640×480 frames. One frame is represented as a 2D array of bytes. Proper functioning of pattern matching depends on several parameters, most importantly the relative threshold for values of the NGC function r of the search (in %). For a video stream of

MacKeben-JOSA-final 5
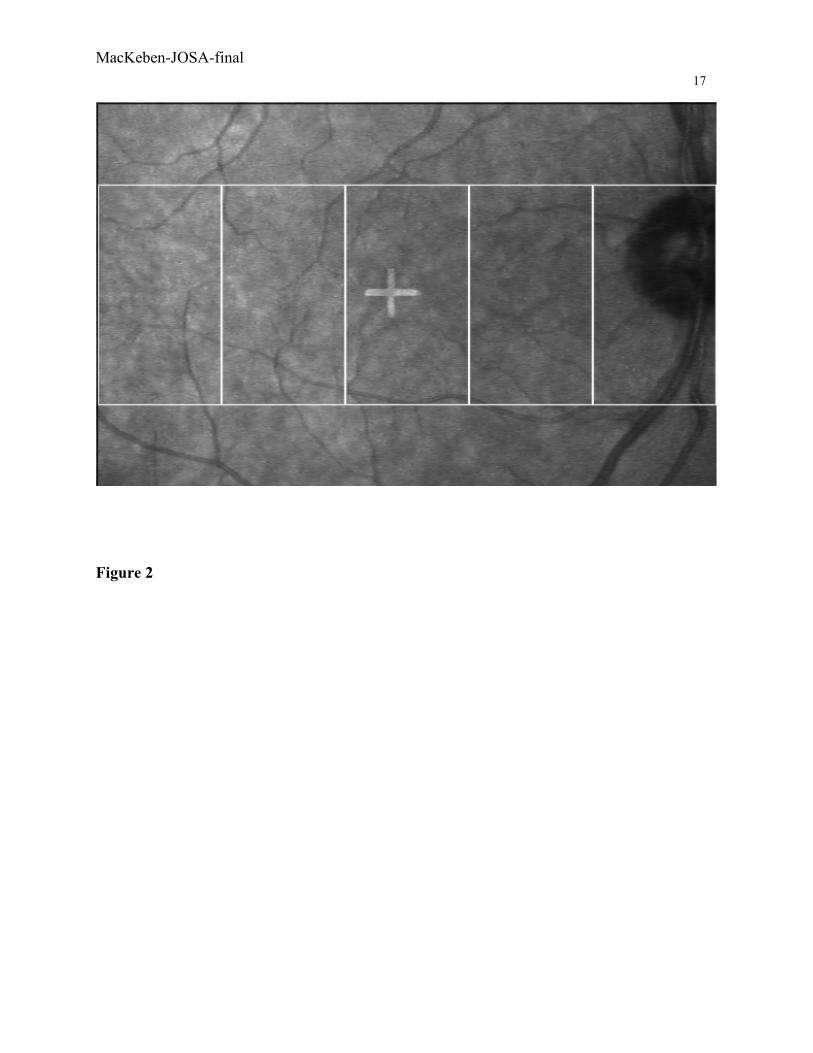
common scenes, a threshold of about 65-70% for r always works and never produces falsely tracked results (see below). However, a problem emerges for low contrast and almost featureless video streams: With the threshold set at 50% and higher to prevent false tracking, this value cannot be reached, and the procedure returns no result. On the other hand, if the threshold is set low, the procedure can deliver a false result because a similar "featureless" pattern happened to occur in some other location in the frame. Unfortunately, SLO images of the human retina are typically mostly gray and featureless. This is given quantitatively by the NGC function r of the pattern matching algorithm. A good emulation of such image sequence can be produced by an underexposed video of an empty white board with hardly detectible random texture. The function r in such simulation will be in the range below 5% - far from the desired levels of 60% guaranteeing unambiguous pattern matching. Here the second concept (see above) comes into play: multi-pattern search and comparing the results. Several patterns in one frame can be searched simultaneously with only an insignificant increase of necessary time. SMP specifies 5 rectangular patches in different fixed locations of the frame (Figure 2). If pattern matching is run with a threshold of 10% or lower, it returns up to 5 shift vectors obtained for these patches. Ideally, the 5 shifts should be equal. However, due to possible false tracking at a low threshold, the obtained vectors may differ. If all 5 are different, which is extremely improbable, frame tracking fails. Otherwise, our algorithm determines subsets of approximately equal vectors among the available 5 or less, and then applies "voting" to make a decision which of the subsets represents the actual shift. We found in experiments with SLO video of live human retinae that the requirement of consistency of only 2 patches is enough to prevent false tracking associated with low threshold settings, that are typical for "featureless" images. Consequently, we can now set the threshold for pattern matching as low as 2% and still obtain correct and verifiable tracking. This second concept increases the tolerance for the range of acceptable eye positions of the patient, or allows to process partially occluded images, as at the beginning or end of a blink. The reason is that only 2 of the 5 patches placed in a line horizontally (Figure 2) are required for successful tracking and dealing with ambiguous shift vectors.
Verification of tracking accuracy and stimulus delivery We distinguish spatial and temporal errors in delivering the stimulus by the He-Ne laser. There are at least four potential sources of spatial errors: NTSC-to-digital conversion, errors of x,y-shift obtained in MIL pattern matching, ambiguous tracking, and improper hardware/software alignment. The error of analog NTSC-to-digital conversion may be assumed to be ±1 pixel. According to the MIL documentation, x,y-shift errors are at a sub-pixel level, by which we mean a local error within a patch. The problem of ambiguous tracking is eliminated due to the multi-patch tracking and voting. To solve the problem of misalignment, we developed a calibration procedure. A source image of a small cross is transmitted to the He-Ne laser, which projects it onto a reflecting screen. The reflection then returns as an SLO image partially overlapping with the source cross on the "live image" section of the screen. The goal is to determine and set 4 values of linear correction (shift and gain) for the x- and y-transforms in order to achieve that the source and the reflection of the

MacKeben-JOSA-final 6
cross coincide for any possible position of the cross in the SLO field. This guarantees that a stimulus will always be delivered at exactly that point of the retina that is selected by the mouse click on the image of the retina. The slight trapezoid distortion of the rectangular SLO image raster perceived by subjects [14] does not matter because one-to-one mapping between retina and its image is implemented by the hardware/software arrangement. Consequently the spatial tracking error may be assumed within ±1 pixel. Temporal components of gaze contingency errors are influenced by at least two effects. The first is inevitable double buffering during frame grabbing: the program can access only those 2 half-frames that came in prior to the current frame in progress. Therefore, a stimulus with proper spatial compensation can typically only be delivered with a delay of 1.5 × the full frame period, i.e. 33+17=50 ms. However, the program compensates for this delay by a prediction mechanism, a linear extrapolation based on the current and previous shift vectors caused by eye movements. The second temporal error component is the discrete nature of He-Ne laser stimuli: during eye movements, a stimulus with the intended duration, e.g. 200 ms, can be delivered only as a stationary dot in 6 consecutive frames rather than a continuous trajectory. If a saccade starts during the first of the 6 frames, or if it ends during the last one, the linear prediction may produce an error as big as 110º/30=3.7º or 67 pixels (110º/s is a maximal saccadic speed assumed in our setting – see below). Fortunately, it is improbable that a trial falls exactly onto the start or the end of a saccade. To estimate the actual accuracy of gaze contingency, the program offers a verification mode: It stores 6-10 images (200 ms or more) of the retina with the stimulus on it shown in blue. It then displays them in a slow motion loop so that the user can examine whether the stimulus really stayed on the selected location, as judged by its relative position to a landmark in each frame. If satisfied, the trial can be accepted, otherwise it is rejected. The verification mode proved that during good fixation, the stimulus does stay on the selected location with 1 pixel accuracy, which means that the 6 images of a 200 ms stimulus are almost identical. However, tracking can work with eye movements as wide as 3/5 of the field i.e. about 22º. We conducted pilot experiments using input from a video camera compliant with NTSC standard that was intentionally moved in a jerky fashion to simulate saccadic eye movements. This also set an approximate limit for the maximal speed of eye movement for which our gaze-contingent stimulus delivery works. This limit is about 22º/200ms = 110º/s, which is within the range of the amplitude/velocity characteristic (“main sequence”) of saccadic eye movements [15]. Note that micro-perimetry requires fixation, the stability of which is not very good in many patients with low vision [16, 17]. The admissible range of velocities given above well covers the range of eye movement velocities that we can expect in this paradigm [5] since it is a function of their amplitude [15], which rarely exceeds 3º [18]. The importance of the velocity criterion is further mitigated by the fact that saccadic eye movements tend to become slower as a function of age [19].
Program Features
Micro-Perimetry – the basic procedure The basic paradigm tests whether flashing light spots can be detected in all locations in the central visual field of 40º diagonal diameter. As flash brightness can be controlled, this

MacKeben-JOSA-final 7
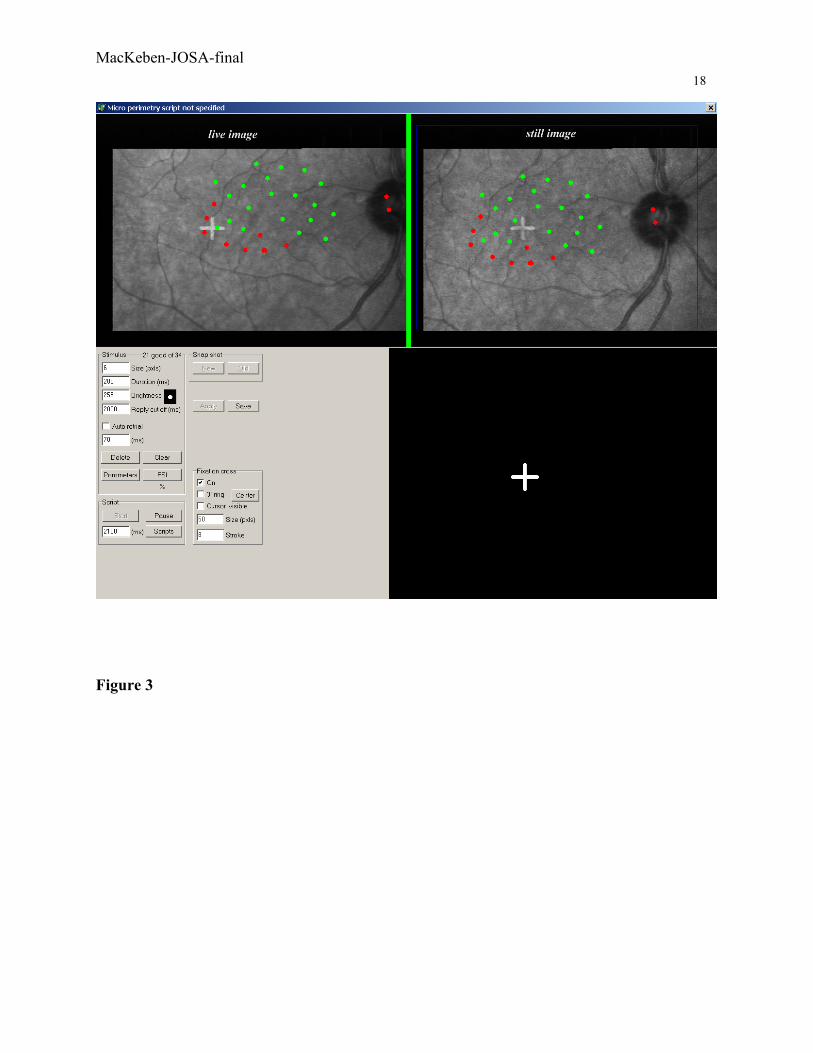
measurement can be performed at various levels of sensitivity. The patient sits comfortably with the head stabilized by chin and forehead rests. After adjustment of the absolute position of the SLO along three axes, which secures continuous imaging of the retina, the patient is asked to steadily look at a fixation mark and press a push-button when ever the flashing light spot is detected. We routinely use a stimulus duration of 200 ms to steer clear of the saccadic latency to be expected from elderly patients [20], which diminishes the chance that a patient might make an eye movement in the direction of the flashing light spot. The examiner sees the live, moving retina in the upper left quadrant of the work screen. While the patients looks straight ahead, the examiner takes a “snapshot” of the retina, which then appears as a still image in the upper right quadrant of the screen (see Figure 3). The scan converter is set to convert the lower right quadrant of the screen displaying the image of the fixation mark and the stimulus, sends it to the He-Ne laser and, ultimately, to the patients retina. The lower left quadrant shows controls for various special features and procedures.
Put Figure 3 about here
Micro-Perimetry with real time tracking of the retina The first improvement over conventional micro-perimetry is that the location of the next flashing light spot is selected on the still image of the retina (Figure 3, upper right). This selection used to be performed on the moving image of the retina, which required clicking the mouse at exactly the right time. In contrast, SMP continuously tracks the retinal image and decides two important points: First, is tracking currently successful? For instance, is there a blink or a large eye movement? Thus, stimulus delivery is inhibited when tracking fails (see below, “Auto-retrial”). Secondly, if a slow eye movement occurs during the stimulus duration, the location of delivery is corrected in a gaze-contingent way. The result is that the light spots delivered by consecutive video frames hit only one location on the retina during the intended time (e.g. 200 ms, or 6 video frames under NTSC). Good or bad conditions for tracking are indicated as a color change of an indicator strip between the two upper screen quadrants (green = good; red = not good). A further advantage of real-time tracking of the retina is that the examiner does not have to bring the image of the retina and the stimulus location into spatial register any more in order to mark that location for display and later storage. Older micro-perimetry programs achieved this by requiring the examiner to click the mouse on the same conspicuous retinal landmark in a temporarily frozen image after each trial. Thus, delivering a stimulus to the retina has gone from a two clicks per trial to a single click per trial procedure. This not only saves time, but also circumvents the variations of the examiner’s accuracy in having to click on the landmark over and over again.
Automatic re-trial Normally the program prevents the user from placing a trial when tracking fails (red indicator is ON). However, SMP has a mode called “automatic re-trial” that allows to place a target even while the indicator strip is red. It resembles the “auto-redial” mode in a fax machine, which will try calling a number later if it has been found busy. If this feature is activated in SMP, the program pauses while the conditions for tracking are undesirable due to a blink or a large eye movement, and it automatically retries the selected location when image tracking is found to be good, usually 1-3 s later. This means that each trial is now triggered as soon as tracking resumes without the examiner having to contribute to it.
MacKeben-JOSA-final 8
Determining multiple preferred retinal loci The steadiness of fixation is an important issue in any kind of perimetry. This is amplified by the fact that most patients who can benefit from SLO micro-perimetry have vision loss in the center of the retina, including the fovea. They need to develop a new gaze strategy called “eccentric viewing” [21] where the image of the object of interest is projected onto another part of the retina, the “Preferred Retinal Locus” (PRL). This fact alone causes a loss in the precision of fixational eye movements. To make matters worse, some patients show a tendency to use more than one PRL and typically make eye movements to let the image of the “fixated” object jump back and forth between them [22, 23, 24]. Such episodes are easy to detect by eye while watching the patient perform. However, they are not easy to document quantitatively. We have implemented a technique to analyze eye movements during episodes of fixation or pursuit by marking the position of the target in each frame. The result shows as a cluster of dots on the x-y image of the retina. Furthermore, we extended this by taking the cumulative time the target image spends on any location on the retina into account. This concept of “dwell time” has already been applied to similar data in previous work by Crossland et al. [25] and Møller et al. [26]: In recordings of SLO images, it is easy to determine the position of a stimulus, e.g. a fixation mark, in each video frame and count how much time this feature spent on particular areas of the retina. The recording of the fixational eye movements can be analyzed off-line and the retina can be divided into bins of variable size. Then the program counts the number of times the mark was found in any of the bins. In the case of multiple PRLs, the typical pattern is the accumulation of larger numbers, i.e. cumulatively longer times, in two or more bins. The result can be visualized by importing this pattern into MS Excel and using the standard three-dimensional graphing routine, yielding a “dwell-time histogram”. These graphs typically show more than one tall bar, or clusters of bars, at the location of a PRL (see Figure 4). This routine has previously been used to analyze fixational eye movements in patients with Stargardt’s disease [18].
Standard test grids and scripting If the configuration of test points is irregular, as for any hand-generated micro-perimetry, the chosen grid is saved and can later be used again for an individual before-and-after test using exactly the same target locations as in the original test. There are also situations where the contrary is appropriate. Fixed grids can be accommodated through the automatic placement of the stimuli described above (see 2 examples in Figure 5). This is helpful in all situations where a standard test grid needs to be applied more than once, for instance to test the efficacy of a treatment before and after the intervention, like surgery or the administration of a drug. There are standard test grids available that can be chosen from a menu, so that testing can begin after a single mouse click and without further involvement of the examiner. The program simply runs through all test points in random sequence, which makes the location of the next stimulus unpredictable for the patient.
Put Figure 5 about here Since it is possible that researchers or clinicians would like to use a test grid that is new and not yet established, this routine also provides the facility to create custom designs. These are based on a regular template of lines in a rectangular or radial formation that can be set according to the
MacKeben-JOSA-final 9
smallest distance between two test points that will be used. To activate a test point, the user can then click on or near one of the nodal points without caring about precision and repeat this as often as is necessary to determine the entire custom grid. Only the selected points will constitute the grid that will be saved and later re-used. The underlying templates make sure that all created grids are geometrically accurate, in spite of low demand on mouse-clicking accuracy. Choice of different targets An extension of the range of possible tests can be achieved by inclusion of psychophysically different modes of perception like recognition or discrimination. Here, the patient has the task not only to detect whether a stimulus was there or not, but also to specify its nature, e.g. by recognizing a letter or indicating the gap orientation in a Landolt ring. This increases the demand on the patient’s performance and, thus, is a more sensitive test for the functional state of the patient’s visual system [27, 28]. SMP can use a variety of different targets, like dots, crosses, Landolt rings, letters and single words that can be chosen from a special menu.
Recording pursuit and reading eye movements In some patients, much information can be gained from monitoring how they solve special tasks like pursuing a smoothly moving target or reading a line of text. As an adjunct to SMP, single targets can be moved across the screen (i.e. across the retina) by mouse movement or by programmed trajectories while the examiner observes the resulting pursuit eye movements that can be recorded as a digital video array. This “movie” can be stored and played back later for analysis or teaching purposes.
Digital sound recording In order to secure the accuracy of patient responses where it counts, e.g. if a discrimination task is used, the patient’s voice during the test can be recorded digitally in parallel to any test session.
Measurements Our first task was to demonstrate that every video frame is tracked in real time, as long as the quality of the image is sufficient. To document the tracking process, we had the program write every collected set of coordinates and the elapsed time (in microseconds) during stimulation into an array. Microsecond accuracy was guaranteed by reading the on-board 64-bit counter which is independent of the CPU. Later inspection showed that indeed no frame was missed and a set of consistent coordinates was produced.. We then investigated the time-saving aspect of SMP by comparing it with conventional “scotometry”, where registration has to be performed by secondarily clicking on a retinal landmark after each trial. We performed micro-perimetry (center fixation, response to appearance of light dot by button press) 12 times by either program with 50 trials in each run and measured the overall duration. Since failing to press the response button yields longer trials (by default, the program waits for 2 s before it scores the point as missed), we recorded equal numbers of positive and negative responses in each run by asking the subjects not to respond during the 2nd half of the test. This was why these measurements were performed on 2 normally sighted subjects who had a free choice to respond or to withhold a response.

MacKeben-JOSA-final 10
The result was that, on average over 600 trials with 300 positive responses, one run in scotometry took 191.5 s ± 17.51 SD, range 168 to 224s (3.83 s/trial), but only 118.8 s ± 10.54 SD, range 107 to 133s (2.38 s/trial) in SMP. This constitutes a time saving of almost 40%. As SMP using a pre-designed grid does not require the examiner’s interference, we tested its benefits for overall test duration as before. The average trial in this mode took only 1.73 s, which cuts the duration of the experiment in half compared with “scotometry”. To establish a baseline for fixational eye movements, we made measurements on two normally sighted subjects to define what can minimally be expected from a subject. To this end, we recorded SMP with 50 stimuli of 200 ms duration (6 frames). Subject 1 had mean absolute deviations from center fixation of X =1.22 and Y = 1.29 pixels, with a range of 11 and 6 pixels, respectively. Subject 2 showed mean deviations of abs(X) = 9.34 and abs(Y) = 14.44 pixels, with X- and Y-ranges of 25 and 18 pixels, respectively, where one pixel = 3.3 arcmin. Note that these deviations were all compensated for by the fundus tracking routine of SMP, which would not be the case if the old “scotometry” program had been used. In that case, X-deviations of maximally 36 arcmin (S1) and 83 arcmin (S2) would have remained uncorrected. In patients with central scotomas, the expected deviations from stable fixation are up to several degrees, as we found in an SLO study of fixation in patients with juvenile maculopathy [18], which would have remained uncorrected in conventional micro-perimetry. On the other hand, if the SMP program were used on these patients, it would either compensate for the deviations in real time or postpone stimulation through the automatic re-trial feature until image tracking is possible again. Consequently, all trials recorded in SMP would be based on secured stimulus placement through gaze-contingent stimulus display. SMP is now routinely used on patients in our Low Vision Service. To date, there were only 2 cases, where large mobile “floaters” in the vitreous temporarily made tracking hard to achieve, which approximately doubled the duration of the procedure. To overcome such situations, we developed an improved procedure with linked multiple snapshots, which allows to continue testing even when the image of the retina has changed.
Summary Put Table 1 about here
“Smart micro-perimetry” (SMP) addresses the major shortcomings of conventional micro-perimetry by SLO. It provides compensations for its flaws by software means, while making data acquisition more convenient and less error-prone. SMP also widens the range of clinical usefulness by allowing to collect interpretable data even from patients who formerly would have been considered unfit for investigation by SLO. This is relevant for current trends in low vision care, because the number of patients with topographic damage to the retina due to incurable age-related eye diseases keeps rising with the steadily growing life-expectancy.

MacKeben-JOSA-final 11
Acknowledgments The authors owe thanks to the following colleagues for their ideas, critique and encouragement: Jens Reinhard, M.D., Ronald A Schuchard, Ph.D., Laura Renninger, Ph.D., Christopher W. Tyler, Ph.D. and Donald C. Fletcher, M.D. We are grateful for the help we received from the technical staff of Matrox Electronic Systems Ltd. in making the Matrox Imaging Library accessible from Delphi, and for help with electronics from Steve Chung. The development of SMP would not have been possible without the financial support from the Beatrice Brandes Low Vision Research fund and The Smith-Kettlewell Eye Research Institute.
Corresponding author: Manfred MacKeben, email: [email protected]
MacKeben-JOSA-final 12
References [1] R.H. Webb, G.W. Hughes, & O. Pomerantzeff. Flying spot TV ophthalmoscope. Appl.Opt.
19, 2991-2997 (1980) [2] M.A. Mainster, G.T. Timberlake, R.H. Webb & G.W. Hughes. Scanning laser
ophthalmoscopy: Clinical applications. Ophthalmology 89(7), 852857 (1982) [3] Venkateswaran K, Roorda A, Romero-Borja F. Theoretical modeling and evaluation of the
axial resolution of the adaptive optics scanning laser ophthalmoscope. J Biomed Opt. 9(1):132-8 (2004)
[4] Putnam,NM, HJ. Hofer, N Doble, Chen L, Carroll J, Williams DR. The locus of fixation and the foveal cone mosaic. JoV, Vol 5, No. 7, pp. 632-639 (2005)
[5] J. Nachmias. Two-dimensional motion of the retinal image during monocular fixation. JOSA 49, No. 9, 901-908 (1959)
[6] P. Isokoski & R. Raisamo. Speed-accuracy measures in a population of six mice. In Proceedings of APCHI2002 (5th Asia Pacific Conference on Computer Human Interaction), pages 765-777 (Science Press, Beijing, China, 2002)
[6] E. Peli, R.A. Augliere & G. Timberlake. Feature-based registration of retinal images. IEEE Trans Medical Imaging. MI-6, No. 3:272-278 (1987)
[8] T. Kube, S. Schmidt, F. Toonen, B. Kirchhof, S. Wolf. Fixation stability and macular light sensitivity in patients with diabetic maculopathy: a microperimetric study with a scanning laser ophthalmoscope. Ophthalmologica. 219(1):16-20 (2005)
[9] Z. Xu, R. Schuchard, D. Ross, P. Benkeser. Tracking retinal motion with a scanning laser ophthalmoscope. J Rehabil Res Dev. 42(3):373-80 (2005)
[10] N.H. Solouma, A.B. Youssef, Y.A. Badr, Y.M. Kadah. A new real-time retinal tracking system for image-guided laser treatment. IEEE Trans Biomed Eng. 49(9): 1059-67 (2002)
[11] D.X. Hammer, R.D. Ferguson, J.C. Magill, M.A. White, A.E. Elsner, R.H. Webb. Compact scanning laser ophthalmoscope with high-speed retinal tracker. Appl Opt. 1;42(22):4621-32 (2003)
[12] J. Reinhard, , W. Inhoffen, S. Trauzettel-Klosinski. A new SLO microperimetry using gaze-contingent stimulus placement. IOVS, 45, suppl.. ARVO # 2993 (2004)
[13] Matrox Imaging (2005) ActiveMIL Version 8 User Guide (no. 10781-301-0800), (Matrox Electronic Systems, Canada , 2005), Chapter 7, pp. 191-220
[14] Timberlake GT, Sharma MK, Gobert DV, Maino JH. Distortion and size calibration of the scanning laser ophthalmoscope (SLO) laser-beam raster. Optom Vis Sci. 80(11):772-7 (2003)
[15] A.T. Bahill, A. Brockenbrough, B.T. Troost. Variability and development of a normative data base for saccadic eye movements. IOVS Vol. 21, No. 1, Part 1. 117-127 (1981)
[16] L. Culham,, F.W. Fitzke, G.T. Timberlake and J. Marshall. Assessment of fixation stability in normal subjects and patients using a scanning laser ophthalmoscope. Clin.Vis.Sci. 8 (6), p.551-561 (1993)

MacKeben-JOSA-final 13
[17] C. Bellmann C, M. Feely, M.D. Crossland, S.A. Kabanarou, G.S. Rubin. Fixation stability using central and pericentral fixation targets in patients with age-related macular degeneration. Ophthalmology. 111(12):2265-70 (2004)
[18] Reinhard J, Messias A, Dietz K, MacKeben, M, Lakmann R, Scholl HP, Apfelstedt-Sylla E, Weber BH, Seeliger , M, Zrenner E, Trauzettel-Klosinski S. Quantifying fixation in patients with Stargardt’s macular dystrophy. Invest. Ophthal. & Vis. Sci. (submitted)
[19] T. Warabi, M. Kase, T. Kato. Effect of aging on the accuracy of visually guided saccadic eye movement. Ann Neurol. 16(4):449-54 (1984)
[20] L.A. Abel, B.T. Troost, and L.F. Dell'Osso, The effects of age on normal saccadic characteristics and their variability. Vis.Res. 23, 33-37 (1983)
[21] G. von Noorden & G. Mackensen, Phenomenology of eccentric fixation. Amer.J. Ophthalmol. 53, p. 642-659 (1962)
[22] D.C. Fletcher, & R.A. Schuchard. Preferred retinal loci. Relationship to macular scotomas in a low vision population. Ophthalmology 104, No.4, 632-638 (1997)
[23] H. Lei & RA. Schuchard. Using two preferred retinal loci for different lighting conditions in patients with central scotomas. Invest Ophthalmol Vis Sci. 38(9):1812-8 (1997)
[24] M.D. Crossland, L.E. Culham, S.A. Kabanarou, G.S. Rubin. Preferred retinal locus development in patients with macular disease. Ophthalmology 112(9):1579-85 (2005)
[25] M.D. Crossland, M. Sims, R.F. Galbraith, G.S. Rubin. Evaluation of a new quantitative technique to assess the number and extent of preferred retinal loci in macular disease. Vision Res. 44(13):1537-46 (2004)
[26] F. Møller, M.L. Laursen, A.K. Sjolie. Fixation topography in normal test persons. Graefes Arch Clin Exp Ophthalmol. Sep 17; (2005)
[27] H. Strasburger, & I. Rentschler, Contrast-dependent dissociation of visual recognition and detection fields. Europ.J.of Neurosci. 8, 1787-1791 (1996)
[28] M. MacKeben, A. Colenbrander & A. Gofen Use your PC to quickly map remaining vision after foveal vision loss. Perimetry Update 1998/1999 (M.Wall & J.M.Wild, eds.), Kugler Publications, The Hague, 1999, pp. 307-316

MacKeben-JOSA-final 14
TABLES Table 1 summarizing all improvements made by SMP over conventional micro-perimetry
Conventional micro-perimetry (scotometry)
Smart micro-perimetry (with gaze contingent stimulus placement)
Hunt for the moving location Inaccuracy of placing a trial
Takes more time
Trials are placed onto moving retina
Second click to register the location. Adds
inaccuracy
Trials are placed onto still image of retina and are automatically translated onto moving retina
No compensation for eye movement during a trial Compensation for eye movement during a trial
Stimulus placement only when image is good Stimulus placement at any moment in the automatic re-trial mode
Standard grids
User designed grids No scripting
Scripting, i.e. automatic running of a pre-programmed trial sequence Re-run previous tests
as scripts
No movie recording Movie recording possible, e.g. for pursuit and reading eye movements, offline frame tracking
No graphic data analysis Graphic analysis of movie data, incl. scanpaths, saccade analysis and dwell time histograms
No fixation stability measurement Fixation stability index
No scotoma area estimation Estimation of scotoma area
MacKeben-JOSA-final 15
FIGURE CAPTIONS Figure 1 –Schematic showing the connections between the devices controlling the SLO that aid the acquisition and real-time processing of data produced by it.
Figure 2 – One of several possible configurations of five patches that can be searched by the pattern matching routine simultaneously. The x,y-coordinates of the shifts caused by an eye movements are then compared in a “voting” process. Note the image of a large fixation cross produced by the He-Ne laser in the center of the macula. Figure 3 - Work screen divided into 4 quadrants: Upper left – moving image of the retina. Colored dots show the tested locations, and the colors indicate whether a flashing light spot was detected (green) or not detected (red) in this location. Upper right – “snapshot” of the patient’s central retina that does not move with the patient’s eye movements. The colored vertical strip between the two upper quadrants indicates whether the current conditions for tracking of the image of the retina are favorable. Lower right – shows a fixation mark that is sent via the scan converter to the He-Ne laser in the SLO. The He-Ne- laser scans the image onto the patient’s retina, which is visible in the images in the upper quadrants. Lower left –controls for the various features of the smart micro-perimetry program. Figure 4 – Dwell time histogram with bin size of 1.5° : Three-dimensional graph showing the retinal x- and y-coordinates indicating where the feature (a fixation mark) was located on the retina of a normally sighted subject (left) and a patient with juvenile macular dystrophy (M. Stargardt, right). The z-axis (height of bars) shows cumulatively in how many frames the image of the fixation mark was found during 10 s long recordings. Note that in the normally sighted subject all values fit into one bin, so that the normal instability of fixation does not show here. The two clusters of bars (right) show that this patient used two preferred retinal loci (PRLs). Scatter within the bar clusters indicates lack of precision of the fixational eye movements in the patient.
Figure 5 – Two standardized grid patterns, one radial (left) and one rectangular (right). Each dot marks a location on the retina, where the stimulus will be automatically placed during micro-perimetry. The sequence of stimulated locations is randomized to prevent anticipatory eye movements. Other grids can be independently scripted by the user as necessary.
MacKeben-JOSA-final 16
FIGURES
Figure 1
primary PC
scan converter
stimulus image
serial port control
SMP results
video stream
He-Ne laser control
SLO
secondary PC
controls SLO
synch pulse
MacKeben-JOSA-final 17
Figure 2
MacKeben-JOSA-final 18
Figure 3

MacKeben-JOSA-final
19
1 3 5 7 9
11
13
S1
S6
S11
0
100
200
300
400
500
600
(Left half of Figure 4)

MacKeben-JOSA-final 20
(right half of Figure 4)

MacKeben-JOSA-final 21
Figure 5
10º
10º
10º 10º