gb4 geotechnical instrumentation
TRANSCRIPT

Ohio Department of Transportation Division of Production Management Office of Geotechnical Engineering
Geotechnical Bulletin
GB 4
GUIDELINES FOR THE USE OF GEOTECHNICAL INSTRUMENTATION
May 30, 2008
Geotechnical Bulletin GB4 was developed by the Office of Geotechnical Engineering. This document is the first edition.
This Geotechnical Bulletin is intended to provide information about the uses of the various different geotechnical instruments that are available so that designers will prescribe them whenever beneficial and so that construction personnel will utilize them properly. More specifically, this geotechnical bulletin is intended to offer guidance in terms of when exactly these instruments should be called for, which instruments should be prescribed, where to install them, how to read them and how to interpret and utilize the data. Geotechnical instruments can measure conditions in the subsurface and acquire data which can greatly aid not only the designer, but also the project engineer and the contractor. The designer benefits from this data which can help them pinpoint the problems in the subsurface and thereby design an appropriate and cost effective project. In terms of the construction of the project, although these instruments can get in the way of the heavy equipment, they provide data that is invaluable in terms of preventing a possible failure during or following construction as well as allowing the construction to proceed at the earliest possible date whenever waiting periods are necessary. Another important reason to use instrumentation is to monitor for any unsafe conditions and therefore to try to prevent an accident or injury. For example, monitoring a mine subsidence site may tell us at what point a highway facility is no longer safe and needs to be shut down. Typical situations in Ohio in which these instruments are beneficial are landslides and cases where embankments are being constructed over foundations with soft strata. In terms of landslides, ODOT has had very good success using inclinometers to define the depth and shape of the failure surface. As well, monitoring wells have proved to be durable and reliable in monitoring the groundwater level in these situations. In terms of construction projects in which embankments are being placed on top of soft foundation soils, ODOT has used piezometers in conjunction with settlement platforms extensively. The pore-water pressure and settlement data have proved to be very useful in determining when construction of the embankment should be halted for fear of a failure and when it can proceed.

GB4: Instrumentation May 30, 2008 Page 2 of 41
ODOT has recently begun using TDR cable to monitor subsidence at underground mine sites. ODOT has limited experience with other instruments and other situations in which instrumentation may be beneficial. However, we encourage greater usage of geotechnical instrumentation in that the cost of these instruments is very low relative to the savings they can generate. It may be difficult to know which instrument to select in a given situation since there are a wide variety of instruments that are available and they tend to overlap in terms of what they measure. In these instances, we recommend contacting our Office as well as the manufacturers of these instruments for guidance. It may also be a good idea to try more than one type of instrument and then compare the results. Through experimenting with new instruments and trying instruments in new applications, valuable experience will be gained that can be applied to future projects. This bulletin may be obtained from the Office of Geotechnical Engineering’s web site (http://www.dot.state.oh.us/Divisions/Engineering/Geotechnical/). This web site also contains other ODOT geotechnical documents and bulletins as well as an online copy of the Specifications for Geotechnical Explorations (SGE), which is referenced in this document. Instruments 1. Inclinometers: Inclinometers are probes that are typically used to monitor the
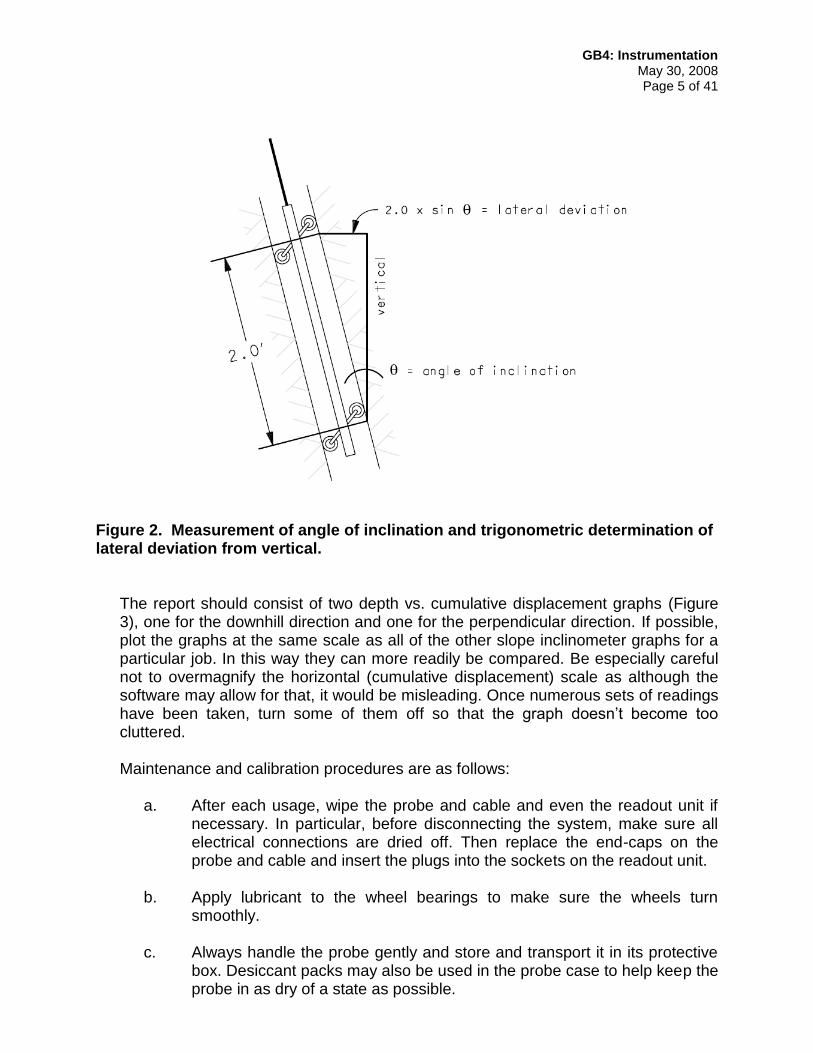
lateral ground movement that occurs during landslides. They operate by traveling up and down specialty grooved casing that is installed a minimum of 10’ into bedrock or 20’ into stable ground below the suspected failure surface. The inclinometer system (Figure 1) consists of the probe, casing, graduated electrical cable and a readout unit. A pulley assembly should also be used to obtain consistent readings. The probe houses two force-balanced servo-accelerometers which measure the angle of inclination of the casing at a given depth. Trigonometry is then used to convert the measurement into a value for lateral deviation from vertical (Figure 2). Readings are taken every 2’ from the bottom to the top of the casing and a profile of lateral earth movement is developed based on the casing being deformed as earth movements take place above the fixed bottom portion of the casing. The first set of readings is used as a baseline. Readings are then taken periodically and compared with the first set to observe the movement over time. The goal of utilizing inclinometers is to determine the depth of the failure surface, magnitude of movement, rate of movement and direction of movement.
Another use of inclinometers is to monitor potential earth movements at construction
sites. Specifically, in cases where embankments are being placed over soft soils and shear failure is possible, inclinometers can be placed at the toes of the slopes. They should be read frequently and fill operations should be halted if any sudden increase in the rate of movement is observed. Other uses of inclinometers include: 1) installing one or more in drilled shafts that are being used for landslide stabilization to monitor the drilled shafts for deflection or rotation and to verify the accuracy of the design, 2) using them to monitor for any movement that may occur during the construction of retaining walls, and 3) installing them to protect ourselves legally

GB4: Instrumentation May 30, 2008 Page 3 of 41
from any potential damage claims by verifying that the construction of a particular project did not lead to any slope instability that could be blamed for damage to any of the adjacent properties.
Inclinometer casing should be installed in borings that are drilled as near to vertical
as possible. For further instructions on how to install inclinometer casing, see SGE Section 504.
Figure 1. Inclinometer system consisting of probe, electrical cable that is marked at regular intervals, a readout unit and grooved casing. Inclinometers are read as follows: a. First of all, very clear notes should be taken during the first (baseline) set
of readings so that the probe can always be read starting and finishing at the same depths. The baseline set should not be taken for about a week after installation to give the bentonite/cement grout time to set up. Notes should also be taken and the casing should be marked so that the correct set of grooves is always selected for insertion of the probe. Note: always use the same probe and cable for each particular installation.
b. If the hole is at least 100’ deep, if the readings show movement in an
unexpected direction or if there were difficulties during the casing installation in which the casing may have become twisted, then check the

GB4: Instrumentation May 30, 2008 Page 4 of 41
casing for groove misalignment using a spiral sensor. This operation need only be performed once. The results will then be used to adjust all future sets of readings.
c. Attach the pulley assembly to the top of the casing. d. Hook up the inclinometer system. Be careful not to overtighten the nut
connecting the probe to the cable as this could damage the O-ring. Next turn the readout unit on to energize the accelerometers, making them less susceptible to shock (or in other words being jarred). Note: as a precaution against shock, leave the readout unit on when hand carrying the assembled inclinometer system to a nearby hole.
e. Lower the probe to the appropriate depth with the upper wheel from each
pair of wheels being inserted into the groove that is facing in the downhill direction. Make sure that both sets of wheels are inserted in the grooves. The probe is very sensitive. Always lower the probe slowly so that it 1) doesn’t impact on the bottom of the hole, throwing it out of calibration and 2) doesn’t crash through a kink in the casing such that it cannot be retrieved to the surface.
f. Wait 5 to 10 minutes for the probe to adjust to the borehole temperature. g. Once the numbers on the readout unit stabilize, take a reading and raise
the probe 2 feet. Wait again for the numbers to stabilize, take another reading and raise the probe another 2 feet. Repeat this process until the final set of readings is taken with the upper pair of wheels just below ground surface.
h. Remove the wheel from the pulley assembly, carefully take the probe out,
rotate it 180 degrees and reinsert it in the casing. Then perform steps f and g a second time.
i. Validate the data set by examining the checksums and by comparing their
standard deviation to a typical standard deviation for that installation. j. Save or store the data set. k. Disassemble the inclinometer system and take care of the probe as per
the maintenance instructions given below. (Note: turn the readout unit off prior to disconnecting the cable.)
l. Lock the protector cover.
GB4: Instrumentation May 30, 2008 Page 5 of 41
Figure 2. Measurement of angle of inclination and trigonometric determination of lateral deviation from vertical.
The report should consist of two depth vs. cumulative displacement graphs (Figure 3), one for the downhill direction and one for the perpendicular direction. If possible, plot the graphs at the same scale as all of the other slope inclinometer graphs for a particular job. In this way they can more readily be compared. Be especially careful not to overmagnify the horizontal (cumulative displacement) scale as although the software may allow for that, it would be misleading. Once numerous sets of readings have been taken, turn some of them off so that the graph doesn’t become too cluttered.
Maintenance and calibration procedures are as follows: a. After each usage, wipe the probe and cable and even the readout unit if
necessary. In particular, before disconnecting the system, make sure all electrical connections are dried off. Then replace the end-caps on the probe and cable and insert the plugs into the sockets on the readout unit.
b. Apply lubricant to the wheel bearings to make sure the wheels turn
smoothly. c. Always handle the probe gently and store and transport it in its protective
box. Desiccant packs may also be used in the probe case to help keep the probe in as dry of a state as possible.

GB4: Instrumentation May 30, 2008 Page 6 of 41
d. Recharge the readout unit batteries according to the manufacturer’s
instructions. e. Recalibrate the probe if it is dropped or bumped and/or the results begin to
look unusual.
Figure 3. Slope inclinometer curves showing nearly 2” of cumulative movement taking place in the A (downhill) direction with a little movement also taking place in the B (perpendicular) direction. The failure plane appears to be at about 23’ deep at this location.

GB4: Instrumentation May 30, 2008 Page 7 of 41
2. TDR Cable: Time Domain Reflectometry is a method that utilizes coaxial cable
to detect the location of a shearing plane underground. The cable can be installed vertically in a borehole to detect the failure surface of a landslide or horizontally in a trench or horizontal borehole to detect settlement points caused by either mine subsidence or karst. The TDR system (Figure 4) consists of coaxial cable, a watertight end-cap, a stainless steel sinker, a BNC connector, a section of 50 ohm connector cable and a cable tester which is powered by a 12 volt battery and connects to a laptop. The system operates by sending an electric pulse down the cable which is reflected back from any deformation in the cable. So if a shearing plane causes damage to the cable, part of the electric pulse will reflect back to the source and the location of the shearing plane can be determined based on the pulse travel time. The location of the shearing plane will appear as a spike on the TDR trace. Crimping the cable at regular intervals will create a scale from which any points of damage can be correlated to determine their locations. The first set of readings is taken as a baseline and readings are then taken periodically in the future and compared with the first set to see if the cable has undergone any damage.
An advantage of TDR cable installations is that they lend themselves well to remote
monitoring in which the cable or a number of cables are monitored continuously and an alarm is sent if movement is detected. A disadvantage of using TDR cable is that although the locations of points or planes of movement can be determined, the amount of movement at these locations cannot be measured.
For specific instruction on how to install TDR cable in vertical boreholes, see SGE
Section 505. When installing in horizontal/inclined boreholes (which are drilled utilizing the
technique of directional drilling), the annulus between the cable and hole wall should be grouted in with a bentonite/cement grout. (The grout mixture should be designed as per the guidelines found in SGE Section 504.1.4.) To perform this process, once the drill bit emerges from the ground, connect the cable (which is to be encased in a tremie line) to the drilling tooling and pull it back through the borehole. Then, connect the tremie line to a grout pump at the ending point of the boring, secure the cable at the beginning point so that it remains in place and grout through the tremie line while withdrawing it back to the ending point. For monitoring programs underneath the roadway, set up the drill rig off the road, drill diagonally toward the road while drilling down, then drill longitudinally underneath the roadway up to eight hundred feet and finally drill diagonally over to the side of the road as well as vertically back up to the surface. For even longer sites, a series of such installations can be made with the cables spliced together. A bentonite slurry should be used while drilling to help keep the hole wall stable. The borehole must be at least five feet deep in order to miss all the subsurface drains as well as any other utilities. Alternatively, it may be desirable to extend the boring all the way down to the top of rock to try to get the earliest possible notice of any subsidence. (Note: other instruments that may be useful in terms of monitoring settlement sites include: 1) slope inclinometers to provide “side-draw” data for the ground adjacent to points of settlement, 2) piezometers to provide groundwater data for a particular aquifer, 3) monitoring wells to provide data on the combined static groundwater head and 4) surface geodetic points to provide

GB4: Instrumentation May 30, 2008 Page 8 of 41
information similar to TDR traces. For more information on instrumenting mine subsidence sites, see AUMIRA chapters 5 and 7 and appendix E.)
When installing in trenches, dig a trench 1’ wide by 3’ deep, lay the cable in the
trench, cover with 6” of cementitious backfill designed to match the strength of the surrounding soil and then backfill with soil. Note: trench installations should not be made in the roadway as settling may occur in the pavement which could potentially be dangerous to motorcycles as well as other types of vehicles. Trenches may however be valuable off to the side of the road to monitor areas in which subsidence related surface features are present.
In terms of protector covers for horizontal installations, they should be installed as
per the guidelines given in SGE Section 506. The protector cover should be located outside of the guardrail, in which case it can be of the above ground variety. If the protector cover is located in the berm, it must be a flush-mounted protector cover. Needless to say, if the TDR cable is to be read remotely, other pieces of equipment including a power source will need to be installed and housed in a protective enclosure on the site as well.
TDR cable installations are read as follows: a. First of all, during installation, consideration should be given to running
extra cable laterally underground so that the reading site is in a more convenient and safe location.
b. Also during installation, crimp the cable at regular intervals, for example
every 10’ for installations over 150’ in length or more frequently for shorter installations.
c. The first (baseline) set of readings should not be taken for about a week
after installation to give the bentonite/cement grout a chance to set up. d. Hook up the system by 1) attaching the connector cable to the BNC
connector on one end and the cable tester on the other end, 2) connecting the laptop to the cable tester and 3) connecting the 12 volt battery to the cable tester.
e. Use the software to take readings and produce graphs. f. Disassemble the system and lock the protector cover.

GB4: Instrumentation May 30, 2008 Page 9 of 41
Figure 4. Typical vertical TDR cable installation.
The report should consist of a graph of the reflection coefficient (which is unitless) vs. depth (Figure 5). Numerous succeeding sets of readings can be displayed on the same graph. As mentioned earlier, shearing of the cable will manifest itself in a spike on the graph (or “trace”). Over time, as the shearing increases, the spike will increase in magnitude. Once the cable fails in shear, the graph will level off at that point. If the cable experiences deformity due to tension, it will appear on the graph in a more subtle trough-like fashion. This trough will increase in length as deformation of the cable increases over time. Once the cable fails in tension, the graph will level off at this point as well. Another feature of these traces is that once water intrudes the cable, either through a damaged point in the cable or through the BNC connector at the top becoming submerged, a stair stepping pattern will appear in the successive traces due to progressive damage to the cable.
The only maintenance item for the TDR system is just a caution to avoid touching the inner part of the BNC connector on the cable tester as the cable tester is sensitive to electrostatic discharge. Also, taking steps to protect the BNC connector at the top of the hole from moisture is recommended.

GB4: Instrumentation May 30, 2008 Page 10 of 41
Time Domain Reflectometry
MEG-338-B-1
0
2
4
6
8
10
12
14
16
Reflection
Dep
th (
m)
10-0
2-0
2
10-1
6-0
2
10-2
8-0
2
11-0
7-0
2
12-0
6-0
2
01-0
7-0
3
02-0
6-0
3
03-0
7-0
3
04-0
8-0
3
05-0
6-0
3
06-0
5-0
3
Depth: ~ 16 feet
07-0
8-0
3
08-0
6-0
3
Depth: ~ 38 feet
09-0
4-0
3
10-0
7-0
3
11-1
4-0
3
Figure 5. TDR traces showing cable deformation at 16 and 38 feet deep. The deformation at 38 feet deep allowed water intrusion which resulted in progressive damage to the bottom of the cable. 3. Monitoring Wells: Monitoring wells are used for long-term monitoring of the
elevation of the water table or potentiometric surface. They are also useful for collecting water samples and for performing tests to determine the hydrogeologic properties of the aquifer such as the conductivity and the storage coefficient as well as any boundary conditions that may exist. (Note: the term aquifer, as used in this bulletin, refers to any porous medium capable of storing and transmitting water. Aquifers range from low permeability clays and shales up to high conductivity sands and gravels.) Monitoring wells have diameters of two inches or more and screen intervals that are between 1 foot and 10 feet (or even longer in certain cases) in length.

GB4: Instrumentation May 30, 2008 Page 11 of 41
Monitoring wells are installed in landslides to ascertain the pore-water pressure to
better understand the forces that are driving the shear failure. In fact, often they will be installed side by side with slope inclinometer installations so that slope movement can be correlated with groundwater data. Ideally they should be installed in borings drilled at the top, mid-slope and toe of the slope in order to define the phreatic surface which is necessary for running analysis programs for landslide characterization and remediation. Note: while drilling, careful attention must be paid to sample moisture, instances of seepage and the water level in the borehole so that the well screen can be placed at the proper depth. Often the wettest zone will coincide with the failure surface and in some instances, it may be right on top of bedrock. Typically, the well screen will be placed directly above the bedrock/soil interface. Although, if the depth of the failure plane can be ascertained during drilling, it may be a good idea to install the well screen there in order to measure the groundwater pressure at this depth as well as to see how it fluctuates seasonally. In situations where the soil is heterogeneous in nature and the groundwater conditions are unclear, including potentially multiple thin seepage zones being present, then a long (perhaps 10 feet or even longer) section of well screen should be installed to try to define the groundwater surface. If, however, separate aquifers can be identified in a vertical sequence, then the well screen should be placed such that it does not intercept both of them.
In underground mine situations, water samples can be used to determine the acidity
or the iron content of the mine water which respectively can adversely affect substructure units or drainage systems.
Other possible uses for monitoring wells include: 1) to define the groundwater
regime of a proposed cut section or a landslide site, 2) to monitor drawdown following installation of a dewatering system, 3) to discover the uplift pressure that will affect the design of an underground facility, 4) to monitor the groundwater levels in mines in cases of mine subsidence, et. al..
Aquifer tests are available if it is necessary to define the groundwater regime or
determine the hydrogeologic properties of a site. The specific type of aquifer test to be employed should be based on estimates for parameters such as hydraulic conductivity, transmissivity, the storage coefficient and the heterogeneity and areal extent of the aquifer. These estimates can be derived from the boring data along with tables found in textbooks. Fairly high hydraulic conductivity aquifers can be characterized by performing a pump test provided that the well has an inside diameter large enough to accommodate the pump. For low hydraulic conductivity aquifers, slug tests or injection tests are typically performed to determine the hydraulic properties.
The slug test is a single well test whereas the pump test is generally a multiwell test.
The pump test consists of a pump installed in a minimum 5” inside diameter pipe and a number of other wells in the surrounding area. As the pump operates, the drawdown in the surrounding wells (and in the pumped well too) is measured and the hydraulic conductivity of the soil (as well as other hydrogeologic properties and conditions like for example the location and capacity of a recharge system, the yield

GB4: Instrumentation May 30, 2008 Page 12 of 41
of an aquifer, et. al.) can be ascertained. These results can be useful in running analysis programs for landslide remediation designs or in designing the drainage component of a project with an excavation that will penetrate the groundwater system. The slug test can be run in a smaller (down to 2”) diameter well and measures the hydraulic conductivity of the soil in the immediate vicinity of the test hole. The test is run by lowering a closed pipe or solid cylinder of known volume into the well, allowing the water level to stabilize and then removing it and taking readings to monitor the water level over time until it comes back up. Alternatively, the test can be run by taking an initial water level reading, lowering the cylinder down into the well and taking readings to monitor the water level over time until it recedes to its normal level. The injection test is similar to the slug test only the mechanism for altering the in situ water level is by adding a known volume of water. Then, as with the slug test, the water level is to be observed until it returns to its normal level. The rate of water level change is related to the horizontal conductivity of the surrounding formation. (Hydraulic conductivity is a coefficient which describes the ability of water to flow through a permeable medium. It is equivalent to the volume of water that will flow through a unit cross sectional area under a given hydraulic gradient. It is expressed in units of length per time.) In cases of low conductivity, a water level indicator (called an electrical dipmeter) may be used to take the water level measurements, but in cases of high conductivity when readings need to be taken rapidly, a continuous recording instrument such as a silicon strain gauge pressure transducer should be used.
The local flow direction of an aquifer can be determined by comparing the head
readings from three (or ideally more) wells placed nonlinearly. The readings from such a configuration will define the 3 dimensional phreatic surface from which the flow direction and hydraulic gradient can be mathematically determined because groundwater flows in the direction of decreasing head. This method is appropriate for small areas in which the subsurface hydrogeolgic conditions are such that hydraulic conductivity is equal in all directions and there aren’t any localized points of recharge or drainage. Also, this method only works if the wells are all reading the potentiometric surface of the same aquifer. When multiple monitoring wells are installed over a large study area, the head measurements can be used to construct a potentiometric surface map. From this map, groundwater flow nets can be developed which can be used to define the various different flow directions and gradients. Flow nets consist of equipotential lines that connect points of equal head and flow lines which are idealized flow directions. Flow lines assume flow is perpendicular to equipotential lines and thus flow occurs in the direction of the hydraulic gradient. If multiple aquifers are present with no vertical connection between them, monitoring wells should be set up such that discrete head readings can be taken for each aquifer and thus the flow direction of each aquifer can be determined.
Another tool that is available to help define the ground water system is the use of
tracers. Tracers are often used to see if surface water is penetrating an aquifer that supplies drinking water or to see just how rapidly it is getting into the ground water system in a karstic situation in which the conductivity is extremely high. (Note: both of these cases have to do primarily with contaminant flow and environmental

GB4: Instrumentation May 30, 2008 Page 13 of 41
concerns.) The test is conducted by introducing dye into a well (or directly into a sinkhole in a karst area) and then periodically taking water samples from the surrounding monitoring wells to check for the dye. The results will tell the direction of flow, and as well, values for flow rate and flow velocity can be calculated. Another usage of this test is to check to see if any water is migrating between two distinct confined aquifers that are separated vertically. A drawback to this test is speed in that depending on the hydraulic conductivity of the soil, it could take a number of months before the dye is detected in a monitoring well.
These tests, and in particular the pump test, can be conducted in a number of
different ways as well as have their results analyzed in a number of different ways. It is beyond the scope of this bulletin to discuss all of the different alternatives and variables associated with these tests, and should this testing be needed, further assistance should be obtained in order to select the appropriate test setup.
For specific instruction on how to install and develop water monitoring wells, see SGE Section 502.
Monitoring wells are read as follows: a. Readings should not be taken until equilibrium is achieved following well
development, and depending on the soil type, it can take several days for that to happen. Then the first reading can be taken. From that point forward readings should be taken at regular intervals as well as perhaps at peak points of rainfall, snowmelt or drought to try to capture the water levels associated with those events. It should be noted that these instruments do have a very slow response time relative to other types of pore-water pressure measuring instruments, especially in fine-grained soils. Therefore, it is a good idea to not just take a reading in the midst of a rainfall event, but to also take numerous readings following the event over a period of days or even weeks. Continuous recording instruments such as silicon strain gauge pressure transducers (which can be installed inside the monitoring well) are preferable for taking long term measurements in low hydraulic conductivity materials. In this way, correlation between precipitation and groundwater elevation can be established. Note: see item d of the section below on other instruments for more details on silicon strain gauge pressure transducers.
b. Once on site, turn the dipmeter on. Note: the probe should be cleaned if
necessary between readings. c. Lower the probe down the pipe slowly until it contacts the water surface.
Upon contact with water, a circuit will be completed at the tip of the probe and a buzzer will sound, a light will come on or an ammeter will register. When that happens, read the scale on the attached cable to the nearest tenth of a foot. Retest to achieve a high degree of accuracy. Note: at the time of the first reading, mark a point on the top of the pipe and from then on, the cable should always be read next to that point.

GB4: Instrumentation May 30, 2008 Page 14 of 41
d. If the top of the pipe is higher than the ground, subtract the height above
the ground from the reading and record this value. Thus, the value will be the depth below ground surface, or it can be converted further still to the elevation above mean sea level.
e. Turn off the dipmeter, replace the cap on the pipe and close and lock the
protector cover. (Note: the pipe cap should be vented so that the well doesn’t become pressurized and groundwater is free to enter through the well screen, but it should be vented in such a way so that rainwater or surface water cannot get into the pipe.)
In terms of reports, all water level readings should be presented in tabular form
along with their corresponding dates and times, boring numbers, stations and ground elevations and any pertinent comments. If a continuous recoding instrument is used, then a graph should also be prepared showing the groundwater elevation on the y axis vs. time on the x axis. If there are environmental concerns, or if the samples were obtained from a mine, then the results of any chemical tests should be presented. If a pump test is to be conducted, then readings should be taken over a long period of time, spanning from well before the test to well after the post test recovery. These values along with any pertinent observations regarding external events are needed in order to correctly interpret the results of the pump test. (Note: this data may be presented on a set of hydrographs in which water level elevation vs. time is plotted for each well.) Pumping rates should also be recorded in the water level reading table. Drawdown vs. time graphs should be prepared in which drawdown is presented in feet on an arithmetic or logarithmic scale on the y axis and time is presented in minutes on a logarithmic scale on the x axis (Figure 6). Separate graphs can be plotted for each well, or multiple wells can be plotted on the same graph. Also, semilogarithmic graphs should be prepared for drawdown vs. distance from the pumping well and pumping rate vs. time. If a slug test is conducted, then a graph should be prepared in which change of head in feet is plotted on an arithmetic or logarithmic scale on the y axis and time in seconds is plotted on a logarithmic scale on the x axis (Figure 7). Prior to conducting a slug test, readings should be taken in the well to make sure the water level is stable. In addition to the graph, the following information should be recorded: any recent or relevant hydrogeologic events and the test parameters, such as the dimensions and weight of the slug. If a test is made using tracer dye, then not only should the type and quantity of dye, location and date and time be noted, but also a narrative should be prepared describing any and all relevant hydrogeologic information, the goal of the test and how the injection process went. Furthermore, any subsequent observations of the dye in the surrounding wells should be noted in the comments section of the water level reading table.
In terms of maintenance, should the well begin to behave oddly or exhibit signs of
silting up, it may need to be redeveloped. Also, should continuous recording instruments or pumps be used, then follow all relevant maintenance items prescribed by the manufacturer.

GB4: Instrumentation May 30, 2008 Page 15 of 41
Figure 6. Pump test results of data collected from an observation well.
Figure 7. Slug test results from a test in which a solid cylinder was submerged and readings were taken immediately thereafter.

GB4: Instrumentation May 30, 2008 Page 16 of 41
4. Open Standpipe Piezometers: Open Standpipe Piezometers are a type of
monitoring well. Specifically, they are a type of nonpumping well that usually has a short (one foot or less in length) screen at the base. Open standpipe piezometers are used to provide hydraulic head measurements at discrete elevations within an aquifer allowing for determination of not only horizontal but also vertical hydraulic gradients and flow directions within the aquifer. (Note: it is possible for aquifers to be interconnected and a pump test can be set up utilizing open standpipe piezometers as observation wells to assess the vertical component of flow and the interconnection between the aquifers.) Open standpipe piezometers are installed in widely differing numbers and at different depths depending on their purpose and the complexity of the hydrogeology of the site. In cases where multiple aquifers or depths need to be monitored, it is preferable to drill multiple borings and put one installation in each hole as opposed to trying to put multiple installations in the same hole. In cases such as these, the data can be used to derive vertical flow nets which can be useful in the design of landslide remediation projects in which drainage is a key feature.
Open standpipe piezometers consist of small diameter (2 inch or less) PVC pipe with
a perforated section of pipe that is placed at a given vertical location within the aquifer where the hydraulic head is to be measured. Granular backfill is placed around the well screen with an impervious seal placed above (and below as well if the well screen is not installed on the bottom of the borehole) in order to prevent piping or infiltration of water into the well from another depth or a different water-bearing formation. In addition, these impervious seals prevent fine material from entering the well screen. For more details on open standpipe piezometer installation and development, see SGE Section 503.
Applications for which open standpipe piezometers should be used are similar to
those for which monitoring wells are prescribed. The only differences are that monitoring wells are necessary for instances in which samples need to be collected and monitoring wells are better for defining the groundwater surface when the soil is heterogeneous in nature and the groundwater conditions are unclear. Open standpipe piezometers are a good choice when there is some understanding of the groundwater conditions and information about the hydraulic head is needed at a specific depth.
Open standpipe piezometers are read the same way as monitoring wells. The report should consist of a table comprised of the readings along with their dates,
boring numbers, stations and ground elevations. In addition, any comments (like for example if there had been a lot of rain lately) should be noted. If a continuous recoding instrument is used, then a graph should also be prepared showing the ground water elevation on the y axis vs. time on the x axis.
In terms of maintenance, as with monitoring wells, an open standpipe piezometer
may need to be redeveloped should it begin to behave oddly or exhibit signs of silting up.

GB4: Instrumentation May 30, 2008 Page 17 of 41
5. Pneumatic Piezometers: Pneumatic Piezometers measure pore-water pressure
at a given depth. They have a significantly faster response time than open standpipe piezometers and are therefore a better choice for measuring pore-water pressure in fine-grained soils with low hydraulic conductivity as they can detect changes in pore-water pressure much more rapidly. Thus they may be the better choice in landslide situations when the soil is fine-grained. Typically, pneumatic piezometers are used on construction projects in which an embankment is being placed over soft foundation soils. They can be installed in boreholes or directly in ground on top of which an embankment will be placed. When placed in soft soils underneath embankments, they are used to control the rate of fill placement by checking the pore-water pressure to make sure that critical levels aren’t reached. For if critical levels are reached, then the shear strength may no longer be adequate and a failure could occur. Critical pore-water pressures are to be established during design and should they be reached, construction must be suspended until the pore-water pressure dissipates and drops below the critical level. When pneumatic piezometers are used for this purpose, the readings should be taken daily during construction and weekly during waiting periods. Further readings can be taken less frequently once the fill is completed.
The pneumatic piezometer system (Figure 8) consists of a transducer, tubing and a
portable pneumatic indicator. The transducer body has a 50 to 60 micron filter which allows pore-water to enter a chamber and press upon a flexible diaphragm. The tubing (which consists of two tubes) extends up to the surface or through a trench off to the side. The pneumatic indicator is hooked up to the input tube and compressed nitrogen gas is introduced to the tube side of the diaphragm (Figure 9). Once the gas pressure exceeds the pore-water pressure, the diaphragm is pushed back into the chamber and the gas can pass through the opening that is created and escape through the vent tube back to the surface. At this point the operator detects the return flow, shuts off the gas, waits for the pressure gauge to stabilize and then takes a reading. Advantages of pneumatic piezometers include: they can be read remotely, the pneumatic indicator can be calibrated at any time, once in the ground they can’t be damaged by freezing, the system components are not affected by electrical transients and they have a fast response time. Disadvantages include: they are difficult and expensive to automate and the pneumatic indicator and the tubing can become adversely affected if they are not frequently charged with dry nitrogen gas.
Other possible uses for pneumatic piezometers include: 1) to monitor the pore-water
pressure behind a retaining wall to be able to calculate the lateral earth pressure acting on the wall, 2) to monitor the dissipation of any excess pore-water pressure caused by pile driving so that the pile can be loaded once the excess pressure has dissipated, and 3) to monitor the effects of a pumping system put in place to dewater an excavation.

GB4: Instrumentation May 30, 2008 Page 18 of 41
Figure 8. Pneumatic piezometer system consisting of a pneumatic pressure transducer (1” dia. x 3” long), tubing (an upper vent tube and a lower input tube) and a potable pneumatic indicator. Installation procedures are generally the same as those given in the SGE for open
standpipe piezometers. Additional steps include: a. Saturate the filter and chamber as per the manufacturer’s instructions.
Perform this operation on site if at all possible to prevent freezing that could take place during transit in the winter.
b. Handle the tubing carefully. Don’t overly bend or kink it. Provide adequate
lengths of tubing and connect them to the transducer with compression fittings. On the opposite end of the input tube (the black tube when black is one of the colors) install a quick-connect. Keep the tubing ends dry and clean during the installation process.

GB4: Instrumentation May 30, 2008 Page 19 of 41
c. Mark the tubing using tape for the sake of identification. Also mark the
point on the tubing that will coincide with the ground once the instrument is installed at the proper depth.
d. Lower the piezometer down the hole. You may need to attach a weight to
it to get it to sink if the hole is full of water. Note: sometimes piezometers are placed in sand-filled canvas bags (which help to center the piezometer in the borehole and act as a sand filter) around which additional sand must be tremied.
e. Keep the borehole filled with water while the bentonite seal is setting up in
order to properly hydrate the bentonite. This process will typically take 2 to 3 hours, although depending on the bentonite source, this time may vary. Note: the boring is to be backfilled similar to the way it would if an open standpipe piezometer were being installed. In terms of the intake zone, sand should be used and it should extend from 6” below the piezometer to 6” above it.
f. Trench over from the borehole to where the terminal box will be installed.
The trench should be at least 6 inches deep. Encase the tubing in pipe that begins a couple feet down the borehole, runs vertically up to the surface, attaches to an elbow and then runs horizontally through the trench all the way to the terminal box. Backfill the trench with soil or grout.
g. Place the terminal box such that it will as much as possible be out of the
way of construction equipment and take measures to protect it from being hit. Make sure there is enough tubing still left in the terminal box to be able to connect to the pneumatic indicator. Ensure that the ends of the tubing will remain clean and dry in the terminal box including making sure the cap is kept on the vent tube if it is supplied with one.
h. If the soft stratum is over 10 feet thick, then more than one piezometer
should be installed to cover the span. However, no more than two piezometers should be installed in the same borehole. In this case, a bentonite seal needs to be placed above the sand intake zone of the lower piezometer all the way up to 6” below the upper piezometer. (Note: the elevations given for the piezometers in the plans are only estimates. Once the hole for the instruments is drilled and the subsurface conditions at that location are observed, then the exact elevations for the piezometers should be determined.)
i. Install the piezometers as early as possible. In this way baseline readings
of the pore-water pressure can be taken and perhaps even seasonal variations can be observed. (Note: readings should be taken daily once the piezometer is installed until they become stable over a period of a few days in order to determine the initial pore-water pressure.) Also, it may be a good idea to install a reference piezometer some distance away from the proposed embankment in order to observe the effects of rainfall or

GB4: Instrumentation May 30, 2008 Page 20 of 41
other causal phenomena on the groundwater regime.
j. In addition, follow any other specific installation guidelines that may be
given in the plans or provided by the manufacturer. k. When installing directly in the ground beneath a proposed embankment,
proceed as follows: 1) excavate a lateral trench (deeper than 6”) to run the tubing over to the terminal box, 2) saturate the piezometer, 3) at the instrument end of the trench, dig a hole for the piezometer and place it vertically upright so that the tip points up (note: if using a sand-filled canvas bag, compact the sand in the bag by running water through it), 4) note: be careful not to overbend the tubing, 5) hand compact the sand around the piezometer or sand-filled canvas bag and so fill up the hole, 6) place a bentonite seal to isolate the piezometer from the lateral trench, 7) place a layer of stone-free fill material along the base of the trench and hand compact it, lay the tubing on it and cover with layers of the same material which need to be hand compacted (note: do not stretch the tubing tight), 8) place bentonite plugs at regular intervals to prevent migration of water along the lateral trench, 9) above the instrument and trench, use lightweight power tamping or rubber-tired equipment, and do not use heavy vibratory rollers or sheepsfoot rollers until at least 18” of fill has been placed above the piezometer and tubing, 10) terminate the tubing in a terminal box as described above in step g. Note: more than one piezometer may be installed along the same trench so long as they are each placed in their own hole and their tubes are marked for proper identification. Although, be sure to place some stone-free fill material between the lengths of tubing to prevent any potential for damage. It may be a good idea to install multiple piezometers at a given station (placed at different offsets) for the sake of the data and in case one of them fails.
Pneumatic piezometers are read as follows: a. Prior to departing for a site visit, check the indicator to make sure it has
enough gas (at least 500 psi). b. At the site, vent the transducer input valve on the portable pneumatic
indicator and zero the pressure gauge. Then turn the valve off. c. Remove the dust cap from the vent tube and wipe off all dirt and moisture
from the tubes and connectors. d. Connect the input tube quick-connect to the indicator socket and the vent
tube to the return flow indicator. If there isn’t a return flow indicator, the vent tube can be inserted into a water-filled bottle which will indicate the return of gas as bubbles emerge from the tube and then the decline and end of the return gas flow as the bubbles diminish completely or almost completely. Note: use jumper tubing when connectors are hard to reach.

GB4: Instrumentation May 30, 2008 Page 21 of 41
e. Turn the tank control valve on and adjust the regulator knob until pressure
on the regulator gauge equals the pressure on the tank pressure gauge. f. Turn the transducer input valve on and adjust the flow rate knob so that
the pressure increases gradually by about 1 psi per second. Note: transducers with substantially long tubing will take longer to activate. However, do not try to remedy this situation by applying a high gas pressure. This will not speed up the process, but may actually slow it down as it may take longer for the return flow to dissipate.
g. Once return flow is detected, turn the transducer input valve off. h. Wait until the return flow ceases and the pressure stabilizes, lightly tap the
pressure gauge and record the pressure. This is the pore-water pressure (Figure 9).
i. Vent the transducer input valve briefly to lower the pressure, then turn the
valve on until return flow takes place and repeat steps g and h to verify the first reading.
j. Disconnect the tubing from the indicator and replace the dust cap. If this is
the last piezometer to be read for the day, turn the tank control valve off, turn the transducer input valve to vent and turn the regulator knob counterclockwise to release the pressure.
Note: there is an alternative reading procedure for indicators that come equipped with a flowmeter. In this case, the flow of gas is not shut off but rather adjusted to a particular rate.
The report should consist of a graph that features time in days or weeks on the x axis and the piezometric head elevation in feet on the y axis (Figure 10). (Note: pressure in feet of head can be obtained by converting the reading in psi into feet by dividing by the psi created by 1 foot of head which is 0.4335 psi (62.43 pcf divided by 144 sq. in.). This value can then be added to the elevation of the transducer to establish the piezometric head elevation.) More than one transducer can be plotted on the same graph which should correspond to a particular station. Fill elevation should also be plotted on the graph. In addition, another graph of settlement in feet or inches (as measured by a settlement platform) vs. time should be shown on the same sheet of paper directly beneath the first graph. Pertinent information such as the critical pore-water pressure, the maximum allowable fill height or elevation for a given stage and any other information concerning the prescribed waiting period should be displayed on the graph. In addition, a table of values with their corresponding dates should be included with the report. And also, rainfall or other conditions that may influence the pore-water pressure should be displayed or noted somehow.

GB4: Instrumentation May 30, 2008 Page 22 of 41
Alternatively, the upper graph can display the height of fill in feet and the pore-water pressure in psi. In this case, the scale on the left side of the graph will be in feet and the scale on the right side will be in psi. The choice of how the graph will be displayed depends on how the critical value for the pore-water pressure is given in the plans. If the project is a landslide remediation with a dewatering system, then it may be a good idea to measure the drainage rates at the outlets. The report in this case should include a graph based on the piezometer data of head level vs. time and a table of the discharge rates in gal./day of each of the drains. In terms of the graph, rainfall and any other conditions that may influence the pore-water pressure should be displayed or noted somehow. In terms of the table, not only do the discharge rates need to be given, but the dates when they were measured need to be given as well. Discharge rate vs. time graphs (with time being plotted on the x axis) can also be presented for each drain if so desired. (Note: see item c of the section below on other instruments for information on instruments which can be used to measure flow rates or in other words discharge rates.)
Figure 9. Pneumatic piezometer method of measuring pore-water pressure. (Read pressure gauge connected to input tube once step c is achieved.)

GB4: Instrumentation May 30, 2008 Page 23 of 41
Figure 10. Two graphs in which the upper graph displays embankment height and piezometric level vs. time and the lower graph displays settlement vs. time. Notice that the predetermined stage 2 maximum piezometric level was reached and therefore construction of the embankment was suspended 2’ shy of the design height of 20’ until the pore-water pressure comes back down below the critical level.
In terms of maintenance, there are a number of things that can go wrong with pneumatic piezometer systems. Following are some remedies that may solve the problem. (Also, check the instructions from the manufacturer for other possible maintenance items and troubleshooting suggestions.) a. As already mentioned, keep the tube ends and connectors clean and free
from moisture. b. If the indicator has a digital gauge instead of an analog one, replace the
battery as needed. c. If the supply pressure fluctuates, disconnect from the transducer and test
to see if the problem is with the indicator or with the rest of the system. Do

GB4: Instrumentation May 30, 2008 Page 24 of 41
this by setting the regulated pressure at 100 psi, turning the transducer input valve to on and adjusting the flow rate knob to 100 psi. If the pressure drops, there is a problem with the indicator, but If the pressure stays steady, then the problem is somewhere in the rest of the system including possibly somewhere in the connection between the input tube and the indicator.
d. If the pressure reading is low, the connection may be loose. So replace
the o-ring in the socket and take off the quick-connect from the tube, clean it and reconnect it. Also check any tube splicings that are accessible for leaks and redo as necessary.
e. If the pressure reading is high, then check the accessible portions of the
tubing for blockages or pinching and repair as needed. Also check the quick-connect for blockage. Remove it, clean it and reconnect it.
f. If the pressure readings are erratic, check the accessible portions of the
tubing for damage and replace as needed. Also purge the tubing in order to improve the system by getting rid of moisture and dirt that may be present in the tubing. Purging consists of pressurizing the piezometer at a pressure of between 50 to 100 psi, exposing the vent tube to the atmosphere and maintaining the pressure for between 10 to 30 minutes depending on the length of the tubing. If the readings continue to be erratic, repeat the purging operation.
6. Vibrating Wire Piezometers: Vibrating Wire Piezometers are very similar to
pneumatic piezometers in terms of their purpose and even installation procedures. The difference lies in the type of transducer that is employed or in other words in the way in which pore-water pressure is measured. The vibrating wire piezometer system (Figure 11) consists of a transducer, signal cable and a readout device such as a VW data recorder. Similar to a pneumatic piezometer, pore-water enters the transducer through a 50 to 60 micron filter and presses upon a diaphragm which separates the pore-water from the measuring system. On the other side of the diaphragm is a wire that connects to the diaphragm and is in tension. As the pore-water pressure changes, the diaphragm deflects and the tension of the wire changes. During reading, an electrical coil is used to magnetically pluck the wire and cause it to vibrate. The frequency (which corresponds to the tension in the wire produced by the pore-water pressure acting upon the diaphragm (Figure 12)) is then measured. The readout device will either display the frequency or convert it and give a value in “Digits”. Advantages of vibrating wire piezometers include: they can be read remotely, they have a very fast response time and they can be automated easily such that they are read automatically and the results are transmitted in real-time. One disadvantage is that the calibrated components are buried. Another disadvantage is that these instruments (as well as their cables and data loggers (if used)) are susceptible to voltage gradients caused by nearby lightening strikes. Although, protective measures can be taken against voltage gradients. If such protection is desired, then contact the manufacturer to learn the recommended procedures and buy any additional pieces of equipment that are needed.

GB4: Instrumentation May 30, 2008 Page 25 of 41
Vibrating wire piezometers also come in push-in type models which can be used in
soft cohesive materials. In addition, multi-level VW piezometers are available in which pore-water pressure can be measured at a number of different depths within the same borehole. Also available are vented VW pressure transducers which can be installed in a monitoring well or an open standpipe piezometer with an ID of 2”. The advantage of using a vented VW pressure transducer in such a well is that it can be automated and read without anyone having to make a site visit. Although, the response time will still be slow based upon the time it takes for the water level to adjust in the well.
Installation procedures are very similar to those given above for pneumatic
piezometers with the exception of installing a quick-connect which doesn’t apply here. Additional steps include:
a. Handle gently. b. VW piezometers come already attached to the signal cable. If additional
cable needs to be attached, follow the manufacturer’s splicing instructions. c. Prior to installation, perform an acceptance test. There are two types of
tests, and the goal of both is not to verify a high degree of accuracy, but simply to check that the VW piezometer is functioning properly. One is to place the instrument in a room with a constant temperature, allow it to reach thermal equilibrium (about 1 hour) and take a reading to see if it is essentially the same as the atmospheric pressure at that elevation. The other check can be performed if the borehole is full of water. In this check, take readings at two different known depths to see if the difference between the two VW piezometer pressure readings (converted to feet of head) corresponds to the difference in feet between the two reading depths. For this test, the tip should be removed, filled with clean water, replaced and held upright until the piezometer is lowered into the hole. The piezometer should be given 30 minutes to adjust to the new temperatures at each depth. It may be necessary to take into account the increased head on the lower reading caused by the cord taking up volume in the borehole and thus raising the water level in the hole. Another factor that can affect this check is if the water is muddy and the density is different than that of clean water (1 gm/cc) as this circumstance would alter the pressure readings.
d. If it is suspected the water table may fluctuate and the VW piezometer
may be above it at some point, then install the piezometer with the tip up. This practice makes it easier for water to re-enter the instrument. Do this by bending the signal cable gradually upwards and tying the instrument to the cable.
e. At the readout end, strip off about 3” of the outer cable so that the 5 inner
wires are exposed and can be connected to the data recorder.

GB4: Instrumentation May 30, 2008 Page 26 of 41
f. A newer installation method (that is being recommended by the
manufacturer and should be tried) involves using grout within the entire borehole. So in this method there will be no sand intake zone or bentonite seal, but rather grout is exclusively used to backfill the hole. In such an installation, the tip should be tied up and the grout should be a bentonite/cement grout. The grout should have a consistency of heavy cream. It should not be too thin, or else the solids and water may separate, and nor should it be too thick, or else it may not be pumpable. Some tips include: start with clean water and gradually add the cement in. Next, add the bentonite in slowly (to avoid clumps) until the consistency is oily or slimy. Allow the batch to sit and thicken for 5 to 10 minutes and then add more bentonite until the right consistency is achieved. Note: this method of installation allows multiple piezometers to be installed in the same borehole.
g. When installing directly in the ground beneath a proposed embankment,
don’t make tight bends in the VW piezometer cable or stretch it tight in the trench. Also do not use a sand-filled canvas bag and backfill around the VW piezometer with sand, but rather grout around the piezometer in the upright position using a bentonite/cement grout as described above in step f. Note: if available, use heavy duty VW piezometers and heavy duty cable if conditions are such that the installation may be subject to disturbance and potential damage
VW piezometers are read as follows: a. Connect the 5 color-coated wires to their associated posts on the data
recorder. Note: use a jumper cable when the end of the signal cable is hard to reach.
b. Switch the data recorder on. c. Choose the appropriate frequency and temperature settings. d. Choose the appropriate sweep frequency based on the lowest and highest
frequencies given on the calibration sheet. e. Observe the display once the data recorder begins activating the
instrument and displaying readings. It will do this every few seconds and display both the frequency and temperature of the instrument.
f. Save or store the data noting whether or not the frequency readings are
stable and valid or fluctuating and questionable.
g. Switch off the recorder when done.
h. Record any environmental factors that may have affected the reading, such as rainfall, high river levels (and other weather conditions), blasting,

GB4: Instrumentation May 30, 2008 Page 27 of 41
nearby construction activities, etc.
Figure 11. Vibrating wire piezometer system consisting of a transducer (.75” dia. x 5.25” – 7.75” long), signal cable and a VW data recorder.
Figure 12. Inner workings of vibrating wire piezometer.

GB4: Instrumentation May 30, 2008 Page 28 of 41
The report should consist of the exact same graphs that are used to display the data
from pneumatic piezometers (Figure 10). Any information recorded as per item h in the instrument reading section above should be noted somewhere on the graph or perhaps mentioned in the transmittal letter. In terms of data reduction, follow the manufacturer’s calculation procedures.
One manufacturer (Geokon) prescribes that prior to installation, initial zero readings
be taken to augment the manufacturer’s calibration factors. This process is accomplished by lowering the instrument down the borehole such that it is 5 to 10 feet below water, allowing it to adjust to the temperature and then taking a temperature reading. Then, pull the piezometer clear of the water and read it right away to get the “initial reading”. Thus, values are obtained for the initial temperature (which can be used in both of the equations) and the initial reading. The initial reading can either be used directly in the linear equation, or it can be used to derive the coefficient C which can be used in the second order polynomial equation. (C is derived by plugging the initial reading into the second order polynomial equation, utilizing the factory derived polynomial gage factors A and B, disregarding the temperature and barometric corrections and setting the pressure equal to zero.) From then on, as piezometer readings and temperature readings are taken, they are plugged into one or the other equation (with the second order polynomial equation being the more accurate one) to determine the pressure. The pressure (in psi) can then be converted to head in feet (by multiplying by 2.307) and added to the elevation of the instrument to give the elevation of the water table. Note: we do not take readings for barometric pressure or make the correction for it in either equation due to our instruments being sealed in boreholes and therefore not directly impacted by changes in barometric pressure. Note also that Geokon calls for an acceptance test in which the initial readings taken on the jobsite are compared with values taken in the factory to make sure they are within a given tolerance. To perform this check, use the linear equation and plug in the field values for the current values and the factory values for the initial values. Then calculate the pressure and divide it by the linear gage factor to get a value which must be less than or equal to 20. (Note: for the purpose of this check, the barometric correction will need to be applied. Thus, an accurate barometer will be needed to obtain the barometric pressure which will serve as the current value in the equation. Values for barometric pressure from nearby weather stations (which can be gotten off the internet) are not acceptable.)
Another manufacturer (Slope Indicator) prescribes using solely the calibration factors
they determined in the factory in order to calculate pressure. They prescribe using either the polynomial equation or another equation that utilizes TI (temperature integrated) factors. The TI equation is more accurate as it takes into account the difference in temperature between the soil surrounding the instrument and the factory where the calibration was performed. For this equation, the temperature will need to be obtained from the VW piezometer’s built-in temperature sensor. As with the Geokon data reduction procedures, it is not necessary to correct for barometric pressure in the applications in which we use these instruments. Slope Indicator does however prescribe a correction based on the elevation above sea level of the instrument that should be used. Thus, once the elevation of the installed VW piezometer is determined, an elevation correction is calculated which is then applied

GB4: Instrumentation May 30, 2008 Page 29 of 41
to the pressure value determined by either of the two Slope Indicator equations. The corrected pressure value is then converted into feet of head to determine the elevation of the water table.
Maintenance items include: a. Keep the end of the cable dry and maintain it in waterproof conditions
inside the terminal box. b. Replace the battery in the data recorder as needed, or recharge the
battery if it is rechargeable. c. Once the data recorder becomes full, make sure all the data is preserved
on the computer and then reset the recorder. d. Should a frequency reading be questionable for any reason, try changing
the sweep frequency setting on the data recorder. Always be sure to note any irregularities such as if the reading was fluctuating and unstable.
e. If the readings are unstable, try isolating the data recorder from the ground
by placing it on a piece of wood or other object that is nonconductive. f. If the temperature readings are questionable, check all the connections,
terminals and plugs and look for and repair any cuts in the cable. g. Follow the maintenance and diagnostic procedures given in the instruction
manual from the manufacturer. 7. Settlement Platforms: Settlement Platforms are simple instruments that are
used to measure settlement beneath embankments. These instruments consist of a flat 3.0’ x 3.0’ wood or metal plate that rests on the existing ground attached to a section of riser pipe that extends up into the air (Figure 13). As the embankment is placed on top of the plate, any settlement of the foundation soils can be measured by periodically surveying the elevation of the top of the pipe. If need be, new sections of pipe can be added to the top of the riser pipe in order to keep it above the fill. The purpose of using settlement platforms is to monitor consolidation in order to allow construction to move forward once the consolidation has essentially stopped. Thus, waiting periods can be shortened (or extended) based on the leveling off of the consolidation data. Another purpose of utilizing settlement platforms is to provide geometric data that is needed in order to calculate the total embankment construction quantities.
Often settlement platforms are installed in tandem with piezometers, in which case
they should be read at the same time. When installed on their own, settlement platforms are typically read weekly during both times of construction and waiting periods. The reading frequency may be increased once the consolidation curve begins to level off and the time to restart construction draws near.

GB4: Instrumentation May 30, 2008 Page 30 of 41
Figure 13. Settlement platform specifications. Installation procedures are as follows: a. The platform and riser pipe shall conform with the material specifications
and details given in the plans. b. Settlement platforms are to be set on a level surface at the locations
specified in the plans. If need be, a thin layer of sand can be added to produce a level and even surface. The platforms shall be anchored by stakes driven at each corner. Typically, they are installed every 100’ along
GB4: Instrumentation May 30, 2008 Page 31 of 41
the roadway alignment, although effort should be made to place them at the points where maximum settlement is anticipated.
c. The riser pipe shall be firmly attached to the plate and maintained in a
plumb position during the placement of the embankment. It shall be marked at intervals to facilitate measurement of the height of fill and settlement. If needed, new sections of pipe shall be added to the top of the pipe as the embankment height rises. In this case, the increase in the length of the riser pipe shall be determined and recorded as well as the date in which this operation was performed.
d. The riser pipe shall have guard stakes or be marked with high-visibility
flags or ribbons in order to protect it from construction equipment. Settlement platforms may be placed beyond the edge of pavement but inside the break of the slope in order to be out of the way as much as possible. If the platform or pipe is disturbed or damaged, work shall be stopped in that location until the Contractor restores the settlement platform and riser pipe to their proper condition.
e. Prior to paving, the riser pipe shall be cut off 2 feet below the top of the
finished surface of the subgrade or the finished ground surface, whichever is applicable.
In terms of reading settlement platforms, it is simply a matter of surveying the top of the pipe. The platform elevation must first be determined and recorded prior to the construction of the embankment. Future readings will then consist of determining the elevation of the top of the pipe and the fill at that location as well as recording the date and the total pipe length from which the settlement can be ascertained. The reference benchmark must be stable, and therefore it must be remote from any vertical movement. It may be a good idea to use multiple benchmarks and to survey between them as a check.
The report consists of the bottom graph in figure 10 which is plotted beneath the graph displaying embankment height vs. time. The x (time) axis will be the same, but the y axis will increase downward corresponding to the increasing settlement values. The scale along the y axis for the bottom graph will also be different than the upper graph. For example, whereas the upper graph may have major divisions in 10 feet increments, the settlement graph may have major divisions in 1 foot increments or even smaller (perhaps even in inches). The settlement graph can be extrapolated to determine the flattening point of the curve. A table of values with their corresponding dates should also be included with the report. In terms of maintenance, all relevant items have already been covered in the installation procedures above.
8. Other Instruments: Other instruments are available on the market to measure
change in a variety of different material properties or change in length of various different geometric dimensions as the elements of a project are affected by

GB4: Instrumentation May 30, 2008 Page 32 of 41
geotechnical factors. These instruments are not typically used by ODOT, but could be used if warranted. They include: a. Rain Gauge: Rain gauges are used to measure precipitation levels over
time. They can provide useful information in situations where rainfall may influence a landslide or other hydrogeologically related project.
b. Titanium Pressure Transducer: This instrument is a piezometer that is
made out of titanium and is resistant to corrosion which may be caused by nearby landfills, leach fields, nuclear waste repositories or mine tailings sites.
c. Bucket and Stopwatch, Weir, Parshall Flume or Stream Gauge Station:
These are all instruments that can be used to measure flow rates for flows emanating from landslide drainage systems, abandoned mines or earth dams (in the form of seepage occurring under, around or through the embankment). Other instruments are needed to be used in conjunction with these instruments including instruments that measure pool elevation (see items d-f) and water velocity (see item g). Selection of the flow rate measuring instrument is dependent upon the anticipated discharge rate, kind of flow (either open channel or closed conduit), stream velocity and duration and frequency of measuring. The bucket and stopwatch method is the simplest one in which you use a stopwatch to time how long it takes to fill up a calibrated bucket or container. This method is accurate, but it is limited to flows that are no greater than 250 gallons per minute. It is also limited in that measurements cannot be taken continuously but only at the time of a site visit. For applications that go beyond these limitations, further assistance should be obtained in order to select the appropriate instrument as all of the other instruments are quite a bit more complex.
d. Pressure Transducer (VW) and Pressure Transducer (Silicon Strain
Gauge): These instruments are essentially piezometers that utilize either VW or silicon strain gauge technology to measure pressure. They can be installed in open standpipe piezometers that have a large enough diameter, monitoring wells, weir stilling basins, creeks, rivers or other bodies of water and even pipes in which there is closed conduit flow. They are used to measure pool elevations over time. Their data can be useful in analyzing landslides or other hydrogeologically related projects. Note: silicon strain gauge pressure transducers lend themselves well to being automated.
e. Stream Gauge, Bubbler and Sonic or Ultrasonic Sensor: These
instruments are used to measure pool elevations in weir stilling basins, creeks, rivers and other bodies of water. (Sonic or ultrasonic sensors can also be used to measure the water elevation in open standpipe piezometers with a large enough diameter and monitoring wells.) Stream gauges look very much like survey rods and are read visually. Bubblers work by measuring the pressure required to expel air bubbles through a

GB4: Instrumentation May 30, 2008 Page 33 of 41
tube which is mounted at a fixed depth or elevation beneath the water surface. Sonic or ultrasonic sensors are mounted above the water and determine the pool elevation by measuring the time required for a sound wave to travel to the water surface and reflect back to the sensor. Like the data from VW and silicon strain gauge pressure transducers, the data that these instruments provide is used to analyze landslides and other hydrogeologically related projects.
f. Weir Monitor and Shaft Encoder: Like the instruments in items d and e,
these instruments also measure pool elevation. They are limited however to situations such as weir stilling basins or stilling wells installed in other bodies of water. These two instruments function somewhat similarly to each other. In weir monitors there is a partially submerged weight which is affected by the changing buoyancy force created by the changing water level. The weight is connected to a VW force transducer which can detect the change in buoyancy force and thus the water level can be determined. In shaft encoders there is a float which rises or falls with the changing water level. As the float position changes, the cable it is connected to causes a shaft to turn. The encoder converts the rotation of the shaft into electronic signals which are used to calculate the pool elevation.
g. Velocity Meter: Velocity meters (also called flowmeters or current meters)
can be used to measure water velocity in cases of both open channel and closed conduit flow. This data, in conjunction with other data pertaining to the cross-sectional area of the channel, can be used to calculate the discharge rate. Velocity meters come in a variety of different types. Some of the more common types include ones that sense velocity by using a propeller, ones that use a wheel comprised of conical cups rotating about a vertical axis and ones that use an electromagnetic field. Besides using velocity meters, there are other less expensive methods that can be used to measure water velocity. These other methods, however, are not as accurate or as easy to use. They include the floating object method and using dye or other tracers.
h. Temperature Sensor: Temperature sensors are either VW or thermistor
type probes that are inserted into boreholes to measure temperature at a certain depth. They can be useful in situations where ground water flow or seepage is being monitored.
i. Vibration and Overpressure Monitor: These instruments monitor ground
vibration which can be caused by blasting, pile driving, construction equipment or traffic. Excessive vibration can cause damage to nearby structures, sensitive pieces of equipment and nature. This equipment can monitor and record peak particle velocities, principle frequencies, peak sound pressure levels and waveforms which are then compared to pre-established vibration-limiting criteria.

GB4: Instrumentation May 30, 2008 Page 34 of 41
j. Surface Geodetic Point: There is no actual instrument here other than
standard surveying equipment. The idea is to survey points on structures, buildings or the ground that may be experiencing displacement in order to monitor the rate and magnitude of the movement.
k. Long Range Displacement Meter: Long range displacement meters are a
kind of crackmeter (see items r and w). They are used to measure large scale surface displacements in landslide situations. Another way to accomplish the same task would be to set pins on both sides of a discontinuity and then survey the distance between them periodically. This operation can be accomplished with a steel tape, a steel rule or even calipers depending on the size of the discontinuity and the distance between the pins.
l. In-Place Inclinometer: These configurations consist of a series of
inclinometers that remain in place in a borehole and can be automated to read in real-time. Therefore, it is not necessary for a site visit to be made to collect the data.
m. Shear Plane Indicator: These instruments are essentially crude,
homemade inclinometers consisting of either thin-walled PVC or copper pipe. Once installed in a borehole, they are read by inserting a rod down the tubing until its advance is impeded by a bend in the tubing. The lower extent of the shear zone can be read by leaving a relatively small piece of rod at the bottom with an attached graduated nylon line which is then pulled up on until the rod is impeded by the lower point of bending in the tubing. Another reading method which can be used on shallow installations entails carefully exhuming the pipe and examining the deformation. The advantages of shear plane indicators are that they are inexpensive, can be installed in great numbers to more precisely define the failure surface, and can be installed with a hand auger (either manual or mechanical) in locations where it is difficult to get to with a drill rig.
n. Horizontal Inclinometer: Horizontal inclinometers are special
inclinometers that are run through casing installed in trenches or horizontal boreholes. The casing either is open on both ends, in which case the inclinometer is pulled through from one end to the other, or there is a pulley system mounted in the closed end which enables the probe to be able to traverse back and forth through the casing. Horizontal inclinometers are another tool that can be used to measure settlement underneath an embankment or subsidence overtop a deteriorating mine complex. They can also be used to measure deflection in situations where heave is anticipated.
o. Extensometer: Extensometers are instruments that measure deformation
in the longitudinal direction of a borehole as opposed to perpendicular to it. There are a variety of different types that employ a variety of different mechanisms to detect and measure the movement. The different types of

GB4: Instrumentation May 30, 2008 Page 35 of 41
extensometers include: settlement, borros anchor, rod, multiple point rod, sondex, magnetic, increx mobile and retrievable. Settlement, borros anchor, and rod extensometers are all single point measurement tools that measure the settlement of the interval between the top and the bottom of the installation. The other types of extensometers measure the displacement between multiple intervals up and down the entire length of the installation. Thus, settlement, borros anchor and rod extensometers are similar to settlement platforms. The difference is that settlement platforms are installed on the ground surface prior to the embankment being placed, whereas extensometers are installed in boreholes either after the fact or at some point prior to completion of the fill. Extensometers are used to monitor the settlement below or within embankments or alongside excavations. They can also be used to measure the heave that takes place at the base of an excavation or as a result of grouting. Another use of rod extensometers is to measure the settlement that takes place at the toe of a driven pile or a drilled shaft during a load test. Multiple extensometers can be implanted in concrete structural members to measure strain. When they are used for these purposes, extensometers are sometimes referred to as telltales.
p. Settlement Hook: Settlement hooks are instruments that ride along the
grooves in an inclinometer installation and detect the couplings. Thus, settlement hooks act in the same way as extensometers. Note: this instrument only works with telescoping casing and not with the casing that has flush interior joints.
q. Soil Strainmeter: Soil strainmeters are a type of extensometer that are
installed laterally either in trenches or horizontal boreholes. Their purpose is to monitor horizontal deformation in dams and embankments. Note: it is also possible to install rod extensometers horizontally.
r. Tape Extensometer: Tape extensometers are different from the
aforementioned extensometers. They are essentially tape measures that are used to measure any change in the distance between two stainless steel reference points. The reference points (or eyebolts) can be installed in tunnel walls, on retaining walls or other structural elements that may be subject to deformation and even on unstable slopes. The purpose of this instrument is to monitor convergence of tunnel walls, displacement of retaining walls, bridge supports or other structural elements or even movement of unstable slopes.
s. Settlement Cell or Sensor: Settlement cells are another version of the
settlement platform. The difference is in the method of measurement. Instead of surveying the top of the pipe extending out of the ground, a liquid filled tube extends upward from a piezometer which is attached to the platform. The top of the tube connects to a reservoir in which the elevation of the water surface is known and which is located on stable ground somewhere off to the side. As the platform settles, there is an

GB4: Instrumentation May 30, 2008 Page 36 of 41
increase in height of the column of liquid above the piezometer. The piezometer measures the increase in pressure and thus the amount of settlement can be determined. These instruments can also be used to monitor subsidence due to tunneling or subsurface mining, consolidation under storage tanks or settlement due to dewatering. A variation of this instrument consists of drilling a borehole into bedrock or stable ground and placing the platform on top of the boring at ground surface. In this case the piezometer is anchored at the bottom of the hole and the reservoir is mounted to the bottom of the platform inside the borehole. Here the head level in the reservoir is not maintained at a fixed elevation, and settlement is determined by the decrease in pressure acting on the piezometer as the ground settles and the reservoir draws nearer to it. An advantage that settlement cells have over settlement platforms is that there is no pipe extending up through the fill to get in the way of the construction equipment.
t. Settlement Profiler: Settlement profilers are based on the same concept
as settlement cells in which a piezometer is connected by a liquid filled tube to a reservoir in order to measure changes in pressure and ultimately elevation. In this application the piezometer is attached to a cord and pulled through a lateral pipe beneath an embankment to get a series of readings. The results are similar to those from a soil strainmeter.
u. Liquid Level System: Liquid level systems are also based on the same
concept as settlement cells. Here a series of settlement gauges are connected by tubing. One of the gauges is the reference gauge. It is installed at a stable location with the other gauges being affixed to the structure in question at approximately the same elevation. The liquid is maintained at a fixed elevation throughout the series, and as the other gauges settle (or heave upward), the change in elevation relative to the stable liquid elevation is measured by a sensor in each gauge. These gauges measure very small changes in elevation and therefore this setup is appropriate in situations requiring a high degree of precision or accuracy, for example: structures that may be affected by nearby construction activity or that are receiving a compensation grouting treatment, bridges and bridge piers that may deflect, and building columns and slabs that may undergo settling.
v. Convergence Meter or Bassett Convergence System: These instruments
measure convergence in tunnels in order to make sure the tunnel is not deforming as a result of nearby construction activity. They connect to fixed points along the tunnel wall and employ different mechanisms (depending on the manufacturer) to monitor the cross sectional geometry of the tunnel.
w. Crackmeter: Crackmeters monitor the widening in surface cracks or joints
in either concrete structures or rock cut slopes. The way they work is by attaching on opposite sides of the crack and measuring the distance in

GB4: Instrumentation May 30, 2008 Page 37 of 41
between. Another way to accomplish the same task would be to set pins and periodically measure the distance between them with a steel rule or calipers as described above in the Long Range Displacement Meter section. Crackmeters can be installed in a 3-dimensional fashion, or in other words, three of them can be installed so as to measure movement along 3 axes at a crack. These instruments are used in situations where joints or cracks in structures may be affected by nearby construction activity, where performance problems have been detected, or where seismic activity has acted upon a structure. Other situations in which these instruments may be used include rockfall sites with loose blocks and bridges that may be undergoing differential settlement.
x. Embedment Jointmeter: Embedment jointmeters are similar to
crackmeters except they are embedded in the concrete during pouring. The two parts are installed during two successive pours, thus straddling a joint. VW technology is then employed to measure any movement in the joint.
y. Load Cell: Load cells are used for proof testing of tiebacks, rockbolts and
other anchor systems as well as for postconstruction monitoring of loads. They are also used in pile load tests. The idea is to place the load cell between two bearing plates where the tieback emerges from the wall and secure the assembly with a nut. Then, as forces act on the wall, the load being carried by the anchor is measured by the load cell.
z. Instrumented Rockbolt: Instrumented rockbolt assemblies measure strain
in rockbolts by implanting VW strain gages inside special sections of rockbolt or rebar. The strain values are then converted to equivalent loads by using calibration coefficients.
aa. Strandmeter: Strandmeters attach to cables and measure strain in bridge
tendons, cable stays, ground anchors, tiebacks et. al. bb. Tiltmeter: Tiltmeters measure changes in inclination that may occur along
the faces of structures. Tilt can be caused by landslides, construction activities such as excavation or dewatering, the impoundment of water behind a dam or the loading of a bridge deck due to wind or traffic. Therefore, tiltmeters are typically placed on bridge decks and abutments, retaining walls, buildings adjacent to excavations, slurry walls, structures in landslide areas and dams. Tiltmeters can also be used to monitor the effects of stabilization measures such as pressure grouting. Tiltmeters can be permanently mounted to either vertical or horizontal structure faces, or they can be portable, in which case they are carried to the site and then hooked up to a tilt plate that is permanently attached to the surface. There are different varieties of tiltmeters depending on the type of mechanism being used to measure inclination and the intended purpose. A specialized application consists of mounting them on railroad tracks when the tracks may be in danger due to nearby construction activity or slope instability.

GB4: Instrumentation May 30, 2008 Page 38 of 41
cc. Strain Gauge: Strain gauges can be used to measure strain in either steel
or concrete by utilizing VW technology. They come in a variety of different shapes and sizes and have different methods of attachment depending on the specific application. They can affix to flat surfaces or rebar or be embedded inside concrete. In steel, strain gauges are typically used to measure strain (and thereby stress as well based on Young’s Modulus) in structural members of buildings, bridges, tunnels (including tunnel linings) and excavation bracing systems. Other applications include monitoring the performance of wall anchors and observing the distribution of load in pile load tests. Monitoring of strain gauges that are being used for steel can be done both during and after construction. In concrete, typical applications include measuring strain in foundations, drilled shafts, bridges, dams and tunnel supports and linings. Strain gauges are also used in concrete applications to monitor for changes in load.
dd. Concrete Stress Cell: Concrete stress cells measure stresses within
shotcrete tunnel linings as well as along the interface with the surrounding excavated ground using pressure cell technology (see item ff). This instrument offers a different way to measure stress in concrete as opposed to using strain gauges and calculating it from strain.
ee. VW Concrete Stressmeter: VW concrete stressmeters measure stresses
in concrete elements using VW technology. As with concrete stress cells, VW concrete stressmeters offer a different way to measure stress in concrete as opposed to calculating it based on the strain.
ff. Pressure Cell: Pressure cells typically consist of two round metal plates
welded together and filled between with de-aired oil. As pressure is applied to the plates, it is picked up by the oil and measured by a VW piezometer. Therefore, these instruments measure total pressure consisting of the effective stress and the pore-water pressure. Pressure cells are either installed in fills or mounted on structures with the sensitive side facing the soil to see how much pressure is acting on the structural unit. In fills, numerous pressure cells are placed in all different directions to monitor not only the magnitude and distribution of the stresses that are present, but also the orientation of those stresses. In terms of dams, pressure cells are often placed in the clay core and on the foundation beneath the dam. They are also employed beneath building slabs or on the top or bottom of the piles supporting a building. Ultimately, their purpose is to verify design assumptions as well as to monitor for any stresses that may exceed the loads a structure is designed to support.
gg. VW Stress Station: VW stress stations are pressure cells that are
designed to be installed in boreholes to monitor the stress in either soil or soft rock.
hh. Hydraulic Borehole Pressure Cell, VW Borehole Stressmeter, VW Soft
Inclusion Stress Cell or VW Biaxial Stressmeter: These instruments are

GB4: Instrumentation May 30, 2008 Page 39 of 41
installed in boreholes to measure rock stress changes. They are different from one another in terms of how they are installed in boreholes and in terms of the mechanisms they use to measure rock stress changes. Typical applications include monitoring changes in stress in the bedrock surrounding underground mines, storage chambers, caves and tunnels. These instruments can also be inserted in holes drilled in concrete dams or other concrete structures.
References Aller, L., et al., 1989, Handbook of Suggested Practices for the Design and Installation
of Ground-Water Monitoring Wells: U.S, Environmental Protection Agency Cooperative Agreement Number CR-812350-01, EPA Number 600489034, NTIS #PB90-159807, Environmental Monitoring Systems Laboratory, Office of Research and Development, Las Vegas, Nevada.
Beam, Rich, P. G., Flow Measurement Methods: presented at the AMD/AMR
Conference, State College, Pennsylvania, August 25, 2006. DGSI,1995, DigiPro 50309999: Slope Indicator Company, Mukilteo Washington. Dunnicliff, John, 1993, Geotechnical Instrumentation for Monitoring Field Performance:
John Wiley & Sons, Inc., New York, New York. Dunnicliff, John, 1998, Geotechnical Instrumentation Reference Manual (Draft): FHWA
NHI-98-034, National Highway Institute, Washington, D. C. FDOT, 2000, Soils and Foundation Handbook: Florida Department of Transportation,
State Materials Office, Gainesville, Florida, ch. 7. Fetter, C. W., 1994, Applied Hydrogeology (3rd ed): Prentice-Hall, Inc., Upper Saddle
River, New Jersey. Geokon, 2005, Instruction Manual Model 4500 Vibrating Wire Piezometer: Geokon, Inc.,
Lebanon, New Hampshire. Grant, Douglas M., 1992, Isco Open Channel Flow Measurement Handbook: Isco, Inc.,
Lincoln, Nebraska. Mikkelsen, P. E., Advances in Inclinometer Data Analysis: presented at the Symposium
on Field Measurements in Geomechanics, FMGM 2003, Oslo, Norway, September, 2003.
Nielsen, David, 1991, Practical Handbook of Ground-Water Monitoring: Lewis
Publishers, Chelsea, Michigan. O’Connor, K. and Dowding, C., 1999, GeoMeasurements by Pulsing TDR Cables and
Probes: CRC Press, Boca Raton, Florida.

GB4: Instrumentation May 30, 2008 Page 40 of 41
O’Connor, K., Ruegsegger, L. R. and Beach, K. D., Real Time Monitoring of Subsidence
Along I-77, Summit County, Ohio: presented at the Interstate Technical Group on Abandoned Underground Mines Fourth Biennial Abandoned Underground Mine Workshop, Davenport, Iowa, May 1-3, 2002.
ODOT, 1998, Abandoned Underground Mine Inventory and Risk Assessment: Ohio
Department of Transportation, Office of Geotechnical Engineering, Columbus, Ohio.
ODOT, 2006, Construction Inspection Manual of Procedures: Ohio Department of
Transportation, Office of Geotechnical Engineering, Columbus, Ohio. ODOT, 2007, Specifications for Geotechnical Explorations: Ohio Department of
Transportation, Office of Geotechnical Engineering, Columbus, Ohio. Ohio EPA, 1995, Technical Guidance Manual for Hydrogeologic Investigations and
Ground Water Monitoring: Ohio Environmental Protection Agency, Division of Drinking and Ground Waters, Columbus, Ohio, chs. 3 (2006), 4 (2006), 5 (1995) and 8 (2004).
Sargand, S. M., Sargent, L. and Farrington, S. P., 2004, Inclinometer – Time Domain
Reflectometry Comparative Study: Ohio University, Ohio Research Institute for Transportation and the Environment, Athens, Ohio.
Turner, A. K. and Schuster, R. L. eds., 1996, Landslides Investigation and Mitigation
Special Report 247: Transportation Research Board, National Academy of Sciences, Washington, D. C.
USACE, 1995, Engineering and Design – Instrumentation of Embankment Dams and
Levees: U. S. Army Corps of Engineers, Washington, D. C. USDOI, 2001, Water Measurement Manual: U. S. Department of the Interior, Bureau of
Reclamation - in cooperation with the U. S. Dept. of Agriculture, Washington, D. C.
www.benmeadows.com www.campbellsci.com/index.cfm www.forestry-suppliers.com/ www.geokon.com/ www.in-situ.com/
www.nexsens.com/systems/stream_gauge_station.htm www.rickly.com

GB4: Instrumentation May 30, 2008 Page 41 of 41
www.roctest.com/index.php?module=CMS&func=view&id=107 www.slopeindicator.com/ www.stanley.army.mil/index.htm