gcc gross domestic product (gdp) for the first quarter of
TRANSCRIPT
GCC Gross Domestic Product (GDP) for the first Quarter of the year 2020
Quarterly Report
September 2020
GCC Gross Domestic Product (GDP) for the first Quarter of the year 2020
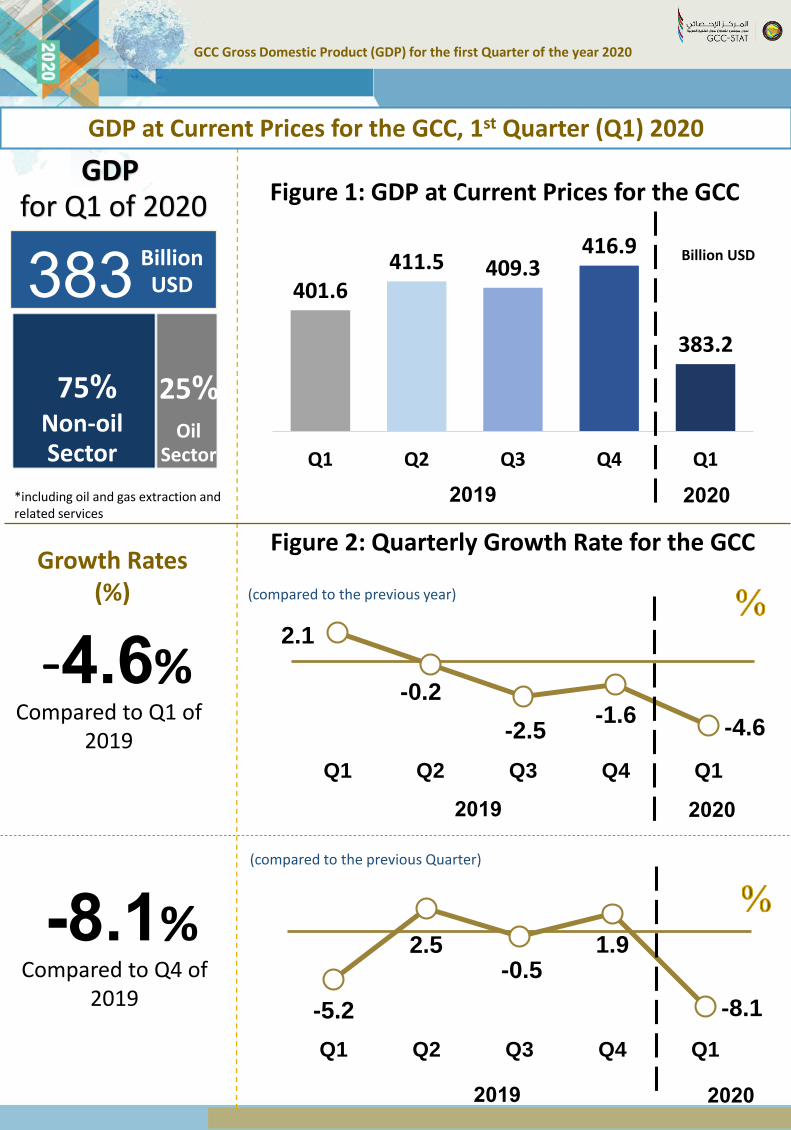
GDP at Current Prices for the GCC, 1st Quarter (Q1) 2020
Compared to Q1 of 2019
%4.6-
Growth Rates (%)
%75
401.6411.5 409.3
416.9
383.2
Q1 Q2 Q3 Q4 Q1
Figure 1: GDP at Current Prices for the GCC
20202019
Billion USD
2.1
-0.2
-2.5-1.6
-4.6
Q1 Q2 Q3 Q4 Q1
Figure 2: Quarterly Growth Rate for the GCC
(compared to the previous year)
20202019
-5.2
2.5-0.5
1.9
-8.1
Q1 Q2 Q3 Q4 Q1
(compared to the previous Quarter)
20202019
%8.1-Compared to Q4 of
2019
GDP for Q1 of 2020
*
383
*including oil and gas extraction and related services
%75 %25
Billion USD
Non-oil Sector
Oil Sector

9.017.6
30.242.2
98.8
185.5
5%
48% 26%
11%
8%
2%Bahrain
-3.2-5.3 -5.5
-9.3
-3.9-4.9
السعودية الإمارات قطر الكويت عمان 0البحرين
-9.6
-5.1 -3.7
-12.3 -10.9
-5.4
22% 22% 34% 40% 36%12%
78% 78% 66% 60% 64%88%
Billion USD
KSA UAE Qatar Kuwait Oman Bahrain
KSA UAE Qatar Kuwait Oman Bahrain
KSA UAE Qatar Kuwait Oman Bahrain
Oil Sector Non-oil Sector
GCC Gross Domestic Product (GDP) for the first Quarter of the year 2020
GDP at Current Prices for the GCC Countries , 1st Quarter (Q1) 2020
Figure 3: 1st
Quarter GDP at Current Prices
for the GCC Countries, 2020
Figure 5: Contribution of Oil and Non-oil Sectors to the
1st Quarter GDP of 2020 (%)
A: Compared to Q1 of 2019 (%)
B: Compared to Q4 of 2019 (%)
%
Figure 4: Quarterly Growth Rate for the GCC Countries
GCC Gross Domestic Product (GDP) for the first Quarter of the year 2020
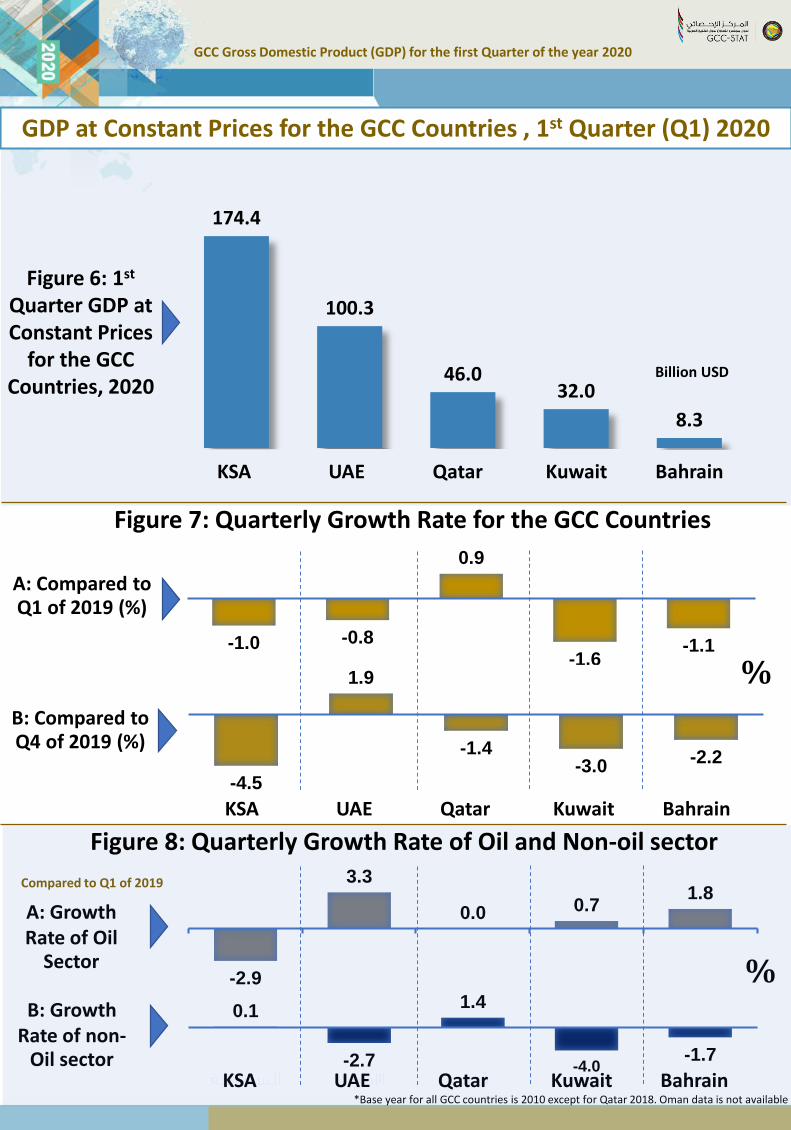
GDP at Constant Prices for the GCC Countries , 1st Quarter (Q1) 2020
Figure 6: 1st
Quarter GDP at Constant Prices
for the GCC Countries, 2020
A: Growth Rate of Oil
Sector
Compared to Q1 of 2019
B: Growth Rate of non-
Oil sector
8.3
32.046.0
100.3
174.4
-1.0 -0.8
0.9
-1.6-1.1
السعودية الإمارات قطر الكويت 0البحرين %
KSA UAE Qatar Kuwait Bahrain
Billion USD
-4.5
1.9
-1.4-3.0
-2.2
KSA UAE Qatar Kuwait Bahrain
Figure 7: Quarterly Growth Rate for the GCC Countries
A: Compared to Q1 of 2019 (%)
*Base year for all GCC countries is 2010 except for Qatar 2018. Oman data is not available
-2.9
3.3
0.0 0.71.8
0.1
-2.7
1.4
-4.0-1.7
B: Compared to Q4 of 2019 (%)
KSA UAE Qatar Kuwait Bahrain
%
Figure 8: Quarterly Growth Rate of Oil and Non-oil sector
