gcep research symposium 2008 friday, october 3, 2008 ... · 3. ccs. in ocean. in deep aquifer. in...
TRANSCRIPT

1
Yuichi FujiokaYuichi FujiokaRITERITE (R(Research Institute of esearch Institute of IInnovativennovative TTechnology for the echnology for the EEartharth))
Development of Innovative gas separation membranes through sub-nanoscale materials
control
Development of Innovative gas separation membranes through sub-nanoscale materials
control
GCEP Research Symposium 2008GCEP Research Symposium 2008Friday, October 3, 2008Friday, October 3, 2008Carbon Capture and Storage Carbon Capture and Storage

2
OutlineOutlineOutline
1. Background
2. Our previous researches
3. Researches in this year
Carbon membrane
PAMAM dendrimer / mesoporous silica membrane

3
CCSin Ocean
in Deep aquifer
in depleting oil and gas reservoirs
Technological Options for 550 ppmv Stabilization
Technological Options for 550 ppmv Technological Options for 550 ppmv StabilizationStabilization
「再生ケース」におけるCO2正味排出量
0
5
10
15
20
25
2000 2010 2020 2030 2040 2045 2050 2060 2070 2080 2090 2100
Energy Saving
Fuel Switching
BiomassSolar CellsWind PowerHydro. and GeothermalNuclear power
Reforestation
2000 2010 2020 2030 2040 2045 2050 2060 2070 2080 2090 2100(Year)
25
[Gt-C/y] [Gt-CO2]92
73
37
6.8
Car
bon
emis
sion
s an
d re
duct
ions
Without CO2 Mitigation Policy
The CO2 Emission Level is Requested to Stabilized CO2 550ppmv
CO2 reduction by Various technologies
RITE (1997)

4
Carbon Capture and Storage (CCS)Carbon Capture and Storage (CCS)
TransportCO2 Capture Injection
Offshore aquifer
Large scale emission source
CO2
Pipeline / Ship

5
Estimation of CO2 capture energyEstimation of CO2 capture energy
CO2 capture using chemical absorption
Pulverizing coalpower plant A chemical absorption
consumes 80% of total energy in CCS system.
CC
S a
t Pul
veriz
edco
al p
ower
sta
tion

6
Application membrane for CO2 separation
Application membrane for CO2 separation
Target: Less than 1 GJ / ton-CO2Separation factor > 100
Less than 20$ / ton-CO2CO2 Permeance > 1 x 10⁻⁸
CO2 capture using membrane
Pulverizing coalpower plant
Definition of Permeance & Separation factorCO2 permeance(QCO2): Ft·yCO2 / (p1·xCO2 - p2·yCO2) / AN2 permeance(QN2): Ft·yN2 / (p1·xN2 - p2·yN2) / ACO2/N2 separation factor(αCO2/N2) : (yCO2/yN2)/(xCO2/xN2) ≈ QCO2/QN2
x (-): molar fraction in feedy (-): molar fraction in permeatep1 (Pa): total pressure in feedp2 (Pa): total pressure in permeateFt (m3 s-1): total gas flow of permeateA (m2): membrane area
p1, xCO2, xN2
p2, yCO2, yN2
Feed
Permeate
Retentate
Membrane

7
H2 rich gas
>95%
Application of membrane for pressurized gases
Application of membrane for pressurized gases
CoalBiomass
H2 O
Natural gas
Heat exchanger
Composition: CO2 40 vol%/ H2 balanceTemperature: <150 °C for carbon membrane, 200 °C> for zeolite membranePressure: < 4 MPa
CO2 rich gas
>97%
GasifierorReformer
Water-Gasshift Reactor
CO2 separation membrane

8
1
10
100
1000
0.001 0.01 0.1 1 10 100
Zeolite T(Kita et al., 2004)
Na-Y(Kusakabe et al., 1997)
K-Y(Kusakabe et al., 1999)
Sapo-34(Falconer et al., 2000)
Silicalite(Ando et al., 1998)
Na,B,K-ZSM-5(Santamaria et al., 2004)
Cs/Na-Y(Kusakabe et al., 2002)
SiO2/ZrO2(JFCC, 2000)
Carbon(Kusakabe et al., 1998)
Anodic Al2O3(JFCC, 2000)
Cardo-polyimide(RITE)
APS/MS/Ai2O3(RITE)
Na-Y(RITE)
PAMAM/PSF(RITE)
CO2 Permeance x 10-9 [ m3 m-2 s-1 Pa-1 ]
Membrane performances in previous works
Membrane performances in previous works
Target
CO
2/
N2
9
2. Our previous researches including GCEP

10
Concept of “Molecular Gate” membraneConcept of Concept of ““Molecular GateMolecular Gate”” membranemembrane
: CO2:Other gas
AB
ABA
A
B
:CO2 affinity material
AA
, such as alkali metal carbonate, amine containing organic material and etc.

11
CO2 /H2 Separation by PAMAM dendrimerCO2 /H2 Separation by PAMAM dendrimer
Hydrophilic porous substrate
47mm
After supporting PAMAM dendrimer in Hydrophilic porous substrate
Cross section diagram of Membrane
Photo of Membrane
* A. S. Kovvali, H. Chen, and K. K. Sirkar, J. Am. Chem. Soc. 2000, 122, 7594-7595
N
ONH
NH2
ONH
NH2
N
OHN
H2N
ONH
H2N
PAMAM Dendrimer*
1) Selective LayerPAMAM Dendrimer
+ Hydrophilic porous substrate
2) Hydrophobic porous substrate
CO2 + H2 (Feed)
He (Permeate)

12
CO2 /H2 Separation by PAMAM dendrimerCO2 /H2 Separation by PAMAM dendrimer
QH2
QCO2
10 -14
10 -13
10 -12
10 -11
10 -10
10 -9
0 20 40 60 80 100Per
mea
nce
[ m3 (
STP
) m-2
s-1P
a-1]
Relative humidity in Feed Gas [ % ]
Feed: 100 kPa, CO2 / H2 = 5% / 95%, 298 K (25 °C) Permeate: 1 kPa
RH increaseCO2 permeance increaseH2 permeance increase
Duan, S., et al, J. Membr. Sci., 283, 2 (2006)

13
Suggestive mechanism of CO2 and N2 separation with PAMAM dendrimer membrane
Suggestive mechanism of CO2 and N2 separation with PAMAM dendrimer membrane
Before humidification After humidification
+
PAMAM H2 O Hydrate PAMAM
H2
RH > 60 %
RH increaseCO2 permeance increaseH2 permeance increase
CO2 H2 CO2
swelling
Gaps
Attractive forceRepulsive force
Swelling and Hydrophilic force makes agglomeration Hydrate PAMAM

14
Fixation PAMAM dendrimer on inside hollow fiber Fixation PAMAM dendrimer on inside hollow fiber
Hollow Fiber
Coating Solution
GlueSolution
Pump
Reduced Pressure
Membrane Module
Hollow Fiber
SupportingSubstrate
Chitosan
ReducedPressure
• Procedure for separating CO2 in difference pressures between feed side and penetrate side

15
Performances of PAMAM dendrimer / Chitosan composite membrane
Performances of PAMAM dendrimer / Chitosan composite membrane
MembraneQCO2
[ m3(STP)m-2 s-1 Pa-1 ]αCO2/N2
PSF-substrate(a) 2.3 x 10⁻⁷ 1
Chi-substrate(b) 1.8 x 10⁻⁸ 1
PAMAM dendrimer /
polymer composite4.6 x 10-10 230
(a): PSF hollow fiber membrane as dried (b): PSF-substrate with chitosan gutter layer
Feed : water saturated, CO2 /N2 = 5% / 95% of at 101 kPaPermeate: evacuated at 4 kPa.Temperature: 313 K
600 nm
Chitosan PolysulfonePAMAM dendrimer This PAMAM fixation method can apply
PAMAM membrane to gas separation at large pressure difference, such as between 100 kPa and 1 kPa.
Kouketsu, T., et al, J. Membr. Sci., 287, 51 (2007)

16
PAMAM Dendrimer density and Performances
PAMAM Dendrimer density and Performances
Taniguchi, I., et al, J. Membr. Sci., 322, 277-288 (2008)
N N
NH
NH
NH2
HN
HNO
O O
O
NH2H2N
H2Nn n
PAMAM dendrimer65432110nGeneration
OO
O
O
PEGDMA PAMAM dendrimer
Dendrimer in PEGDMA network
+UV
14
Cross-linked PEGDMA

17
1x10-17
1x10-16
1x10-15
1x10-14
1x10-13
0
100
200
300
400
500
600
0 10 20 30 40 50 60
PAMAM content [ wt%]
QCO2
QH2
α
PAMAM dendrimer effectsPAMAM dendrimer effects
PAMAM content
[%]
Permeance [m3(STP) sec-1 m-2 Pa-1]
CO2 H2
0 1.63x10⁻¹⁴ 2.39x10⁻¹⁵
50 2.74x10⁻¹⁴ 2.22x10⁻¹⁷
1.7 1/100
298 K 80% RH, Feed gas CO2 /H2 5/95 PAMAM enhanced CO2 permeation rate

18
Suggestive mechanism of CO2 and H2 separation with PAMAM / PEGDMA membrane
Suggestive mechanism of CO2 and H2 separation with PAMAM / PEGDMA membrane
H2 CO2
PAMAM dendrimerCross-linked PEGDMA
Content of PAMAM dendrimer: 0 20 50
H2 permeation rate : 1 1/10 1/100
CO2 permeation rate : 1 1 1.7
H2 CO2 H2 CO2

19
2.2 nm
Amino-modified mesoporous silica membrane
Amino-modified mesoporous silica membrane
0.8 nm
APS / MCM - 48MCM-48 (2.2 nm pore) is promisingCO2 = 0.33 nm
APS = 0.7 nm
MCM - 48
• Structure of membrane
APS: H2 N Si(OCH2 CH3 )3
3-aminopropyltrietoxysilane
Mesoporous silica layer Alumina substrate
Sakamoto, Y., et al, Microporous and Mesoporous Materials, 101, 303-311 (2007)

20
Result of amino-modified mesoporous silica membrane
Result of amino-modified mesoporous silica membrane
• High CO2 /N2 separation factor without H2 O• Amino-modified mesoporous silica membrane
10-15
10-14
10-13
10-12
10-11
1
10
100
1000
104
105
300 320 340 360 380 400 420 440
Temperature (K)

21
Attractive force by amino-function and CO2 separation
Attractive force by amino-function and CO2 separation
• Increasing temperature made CO2 and N2 permeance. CO2 permeance increased 100 times larger from 313 K to 353K.
It is supposes that decreasing CO2 attractive force by amino-function enhances CO2movement inside pores.CO2 molecules near amino function block out N2 molecules.

22
3. This year researches
Carbon membrane
PAMAM dendrimer / mesoporous silica membrane

23
CO2 /N2 Separation performance of carbon membrane
CO2 /N2 Separation performance of carbon membrane
CO2 /N2 : Separation factor: 7 - 101 1)
1) S. M. Saufi, A.F. Ismail, Carbon, 42 (2004) 241-259.
CO2 /N2 separation factors are in a wide range
Definition of Permeance & Separation factorCO2 permeance(QCO2): Ft·yCO2 / (p1·xCO2 - p2·yCO2) / AN2 permeance(QN2): Ft·yN2 / (p1·xN2 - p2·yN2) / ACO2/N2 separation factor(αCO2/N2) : (yCO2/yN2)/(xCO2/xN2) ≈ QCO2/QN2
x (-): molar fraction in feedy (-): molar fraction in permeatep1 (Pa): total pressure in feedp2 (Pa): total pressure in permeateFt (m3 s-1): total gas flow of permeateA (m2): membrane area
p1, xCO2, xN2
p2, yCO2, yN2
Feed
Permeate
Retentate
Membrane

24
Our approach to carbon membraneOur approach to carbon membrane
Incorporate CO2 affinity materials in the pores
→Enhanced CO2 permeation using adsorbed CO2 in the pores
Pore size: 0.5-5 nmCarbon
CO2 affinity materials
CO2
CO2
Mild connection
Concept• Building adequate bond between CO2 and CO2 affinity
material for CO2 separation
25
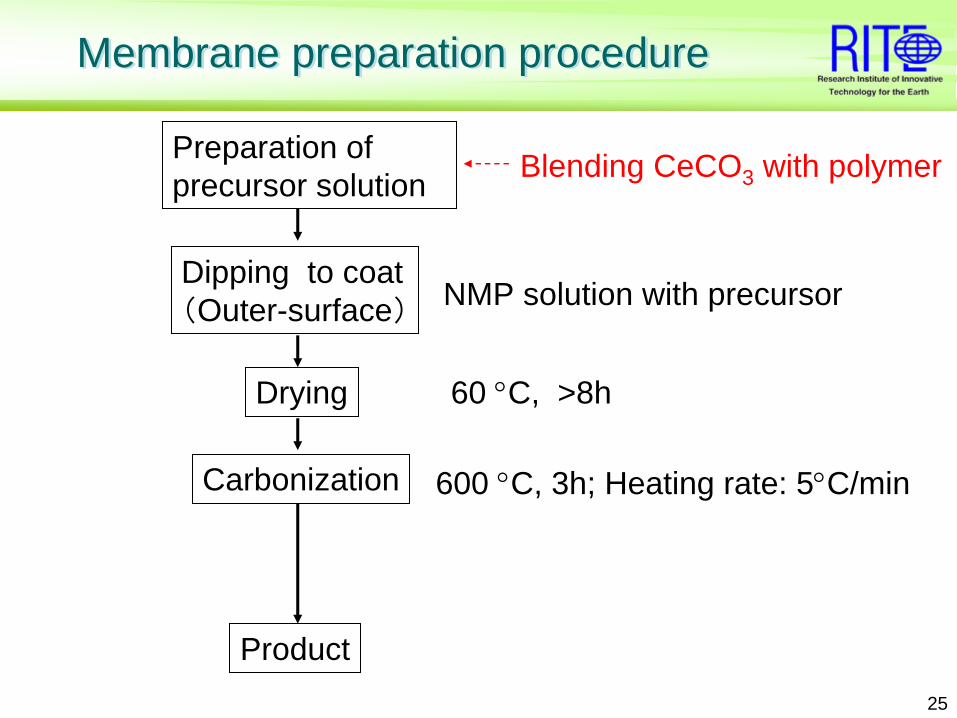
Membrane preparation procedureMembrane preparation procedure
Dipping to coat(Outer-surface)
Drying
Carbonization
Product
600 °C, 3h; Heating rate: 5°C/min
NMP solution with precursor
60 °C, >8h
Preparation of precursor solution Blending CeCO3 with polymer
26
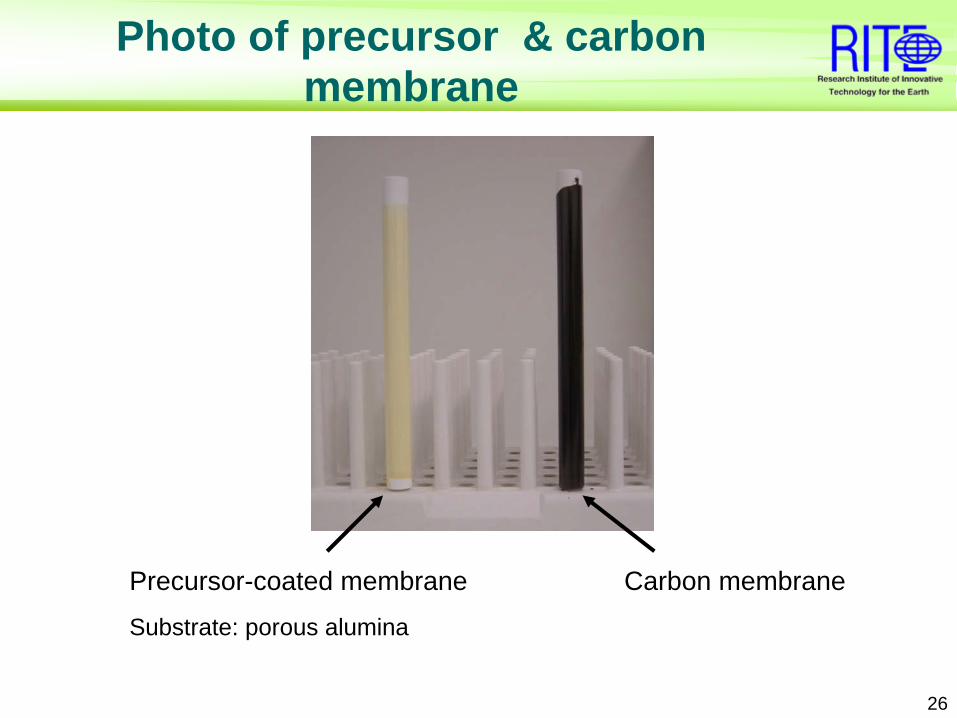
Precursor-coated membrane Carbon membrane
Substrate: porous alumina
Photo of precursor & carbon membrane

27
CO2 /N2 gas separation measurementCO2 /N2 gas separation measurement
GC
Mass flow meter
Feed gas
He
Oven (Constant temp.) Pressure gauge
Pressurecontrolvalve
Permeate
Retentate
Membrane
Humidifier
Conditions Feed gas: Temperature: 40 °C, CO2 /N2 5 - 80%/ N2 balance, Humidity in feed gas: 0-100RH%Pressure of feed:
0.1 MPa
Pressure of permeate: 0.1 MPa (He sweep)
Feed

28
10-12
10-11
10-10
10-9
10-8
0 50 1000
10
20
30
40
50
0 50 100
Cs2 CO3 (0.71)
10-12
10-11
10-10
10-9
10-8
0 50 100
Cs2 CO3 (4.1)
0
10
20
30
40
50
0 50 10010-12
10-11
10-10
10-9
10-8
0 50 100
Q [m
3 (STP
) m-2
s-1
Pa-1
]
Relative humidity in feed [%]
0
10
20
30
40
50
0 50 100
αC
O2/
N2 [-
]
Relative humidity in feed [%]
Gas separation conditions: Temp.: 40 °C, Feed gas: CO2 /N2 gas mixture (5/95 vol/vol), Feed pressure:
0.1 MPa, Permeate pressure: 0.1 MPa (He sweep method).
(a) QCO2 , QN2 (b) αCO2/N2
Separation performance as a function of relative humidity in feed gas
Cs2 CO3 (0)
• Higher separation performance under the humidified conditions.• Higher separation performance than the original carbon
membranes at high relative humidity.
QCO2
QN2
●, ○:
▼, ▽:
▲, △:

29• RH differently effected on CO2 permeance at Cs(0 %). • CO2 permeance at Cs(4.1%), RH(0) is small. Excess Cs reduced CO2 permeance.
CO2
PermeanceCs2 CO3 content [ % ] in carbon membrane
0 0.71 4.1RH = 0 % 22.5 24.3 1.8 RH = 80 % 5.8 40.5 27.0
• RH only decreased N2 permeance at Cs(0 %). • N2 permeance at Cs(4.1%) is large. Cs enlarges the pore diameter.
N2
PermeanceCs2CO3 content [ % ] in carbon membrane
0 0.71 4.1RH = 0 % 1.0 0.7 1.7
RH = 80 % 0.5 0.9 1.8
Relative permeance in carbon membrane
Relative permeance in carbon membrane
Relative N2 Permeance ( as a basis of N2 permeance at RH = 0 % )
Relative CO2 Permeance ( as a basis of N2 permeance at RH = 0 % )

30
0
10
20
30
40
50
0 50 100
αC
O2/
N2 [-
]
CO2 conc. in feed [%]
10-12
10-11
10-10
10-9
10-8
0 50 100
Cs2CO
3 (0.71)
Cs2CO
3 (1.4)
Cs2CO
3 (4.1)
Q [m
3 (STP
) m-2
s-1
Pa-1
]
CO2 conc. in feed [%]
CO2
N2
Gas separation conditions: Temp.: 40 °C, Humidity in feed gas: 100RH% Feed pressure:
0.1 MPa, Permeate pressure: 0.1 MPa (He sweep method).
Separation performance as a function of CO2 concentration in feed gas
Separation performance as a function of CO2 concentration in feed gas
(a) QCO2 , QN2 (b) α
Constant separation performance at CO2 /N2 =5/95-80/20 %

31
Analysis method for Characterization
Electron probe microanalysis (EPMA)- Cs distribution in the cross-section of carbon free-standing films
Thermogravimetric analysis (TGA) - Thermal decomposition behavior of precursor.
Atomic absorption spectrometry (AAS) - Cs concentration in carbon free-standing films
Inductively coupled plasma mass spectrometry (ICP-MS) - Cs concentration in carbon layer of carbon-coated membranes
X-ray Photoelectron Spectroscopy (XPS) depth profile- Cs distribution in the cross-section of carbon membrane
Nano-Permporometer: -Pore size distribution of carbon-coated membranes by He

32
Distribution of Cs in the cross-section of carbon free-standing films
Distribution of Cs in the cross-section of carbon free-standing films
Cro
ss-s
ectio
nsu
rface
35
10 μm
Intensity
surfa
ce
Carbon free-standing film
Cross-section
EPMA line-mapping

33
(1) Uniform Cs distribution over the cross-section(2) Cs conc. increased as Cs2 CO3 conc. in precursor increased.
Distribution of Cs in the cross-section of carbon free-standing films (EPMA line-mapping)
Distribution of Cs in the cross-section of carbon free-standing films (EPMA line-mapping)
(1) Cs2CO3 (0.71) (2) Cs2CO3 (1.4) (3) Cs2CO3 (4.1)
Cro
ss-s
ectio
nsu
rface
35 60 180
10 μm 10 μm 10 μm
Intensity
surfa
ce
Intensity Intensity

34
0.50.60.70.80.9
11.1
Cs2CO
3 (0.71)
0.50.60.70.80.9
11.1
Cs2CO
3 (0)
0.50.60.70.80.9
11.1
Cs2CO
3 (1.4)
0.50.60.70.80.9
11.1
0 500 1000
Cs2CO
3 (4.1)
Rel
ativ
e w
eigh
t cha
nge
[-]
Temperature [°C]
TGA curve of polyimide precursors with/without Cs2 CO3
TGA curve of polyimide precursors with/without Cs2 CO3
Additional weight loss at 400- 500 °C for Cs2 CO3 -containig precursors

35
Relative permeance in carbon membrane
Relative permeance in carbon membrane
CO2
PermeanceCs2 CO3 content [ % ] in carbon membrane
0 0.71 4.1RH = 0 % 22.5 24.3 1.8 RH = 80 % 5.8 40.5 27.0
N2
PermeanceCs2CO3 content [ % ] in carbon membrane
0 0.71 4.1RH = 0 % 1.0 0.7 1.7 RH = 80 % 0.5 0.9 1.8
Relative N2 Permeance ( as a basis of N2 permeance at RH = 0 % )
Relative CO2 Permeance ( as a basis of N2 permeance at RH = 0 % )
• RH only decreased N2 permeance at Cs(0 %).
• RH differently affected CO2 permeance.
Down
Up

37
Relative permeance in carbon membrane
Relative permeance in carbon membrane
CO2
PermeanceCs2 CO3 content [ % ] in carbon membrane
0 0.71 4.1RH = 0 % 22.5 24.3 1.8 RH = 80 % 5.8 40.5 27.0 Increment -16.7 16.2 25.2
Relative CO2 Permeance ( as a basis of N2 permeance at RH = 0 % )
• There are two pathways of CO2 permeation.1) Dry carbon on surface without H2 O2) Cs + water on surface
• RH differently affected CO2 permeance depending on Cs content.
(a) Decrease value; -16.7 Disappearance of dry carbon(b) Increase value; 25.2 Appearance of Cs + Water(c) Increase value 16.2 Appearance of Cs + water - Disappearance of dry carbon
-16.7 + 25.2 = 8.6
Observed value 16.2 and estimated value 8.6 OK or no?

38
Summary of carbon membrane mechanism
Summary of carbon membrane mechanism
CO2 and N2 permeance is low, because diameters of pores are small.
Low RH
High RH
Surface has CO2 both attractive forces by carbon and Cs +water.
Surface has CO2 attractive force by carbon.
Water on pore surface block out N2 and CO2 .
It is too large attractive force for CO2 to move inside pores.
Pore diameter, both CO2 attractive force by carbon and Cs + water on pore surface effect on CO2 and N2 permeance.
Surface has CO2 attractive force by carbon and Cs +water.

39
PAMAM / Mesoporous silica / Al2 O3 membrane
PAMAM / Mesoporous silica / Al2 O3 membrane
• Conceptual figure of PAMAM / MS / Al2 O3 membrane
Al2 O3
MS : Mesoporous silica crystal + PAMAM
Amorphous silica or crystal defect + PAMAMand
Axes of crystals are random
CO2
CO2
N2 , H2
N2 , H2
Selectivelayer

40
Performances of PAMAM / MS / Al2 O3 MembranePerformancePerformances of PAMAM / MS / Als of PAMAM / MS / Al22 OO3 3 MembraneMembrane
• Separation factor is more than 1000.
• But, CO2 permeance is small.
• Now, studying on structure of selective layer.
10-16
10-15
10-14
10-13
10-12
10-11
10-10
10-9
0.0001
0.001
0.01
0.1
1
10
100
103
104
40 50 60 70 80 90
Perm
eanc
e [m
3 m-2
s-1
Pa-1
]
Sep
arat
ion
Fact
or [-
]
R.H. [%]CO2 / N2 =50% / 50%, Temperature: 313 K

41
Effect of PAMAM on permeanceEffect of PAMAM on permeance
Temp( K )
R.H.(%)
Permeance [m3(STP) sec-1 m2 Pa-1 ]
CO2 /N2
Separation factorCO2 N2
Al2 O3 substrate 298 - 2.5×10⁻⁸ 2.5×10⁻⁸ 1.01) Non selective
MS / Al2 O3 298 - 7.6×10⁻¹⁰ 8.4×10⁻¹⁰ 0.81) Knudsen diffusion
PAMAM / MS / Al2 O3 313 50 2.4×10⁻¹² 1.2×10⁻¹³ 21 CO2 selective
PAMAM / MS / Al2 O3 313 80 3.1×10⁻¹² 1.9×10⁻¹⁵ 1581
Down
c.a. 1 / 300 c.a. 1 / 7000
Slightly up c.a. 1 / 60

42
Suggestive mechanism of CO2 and N2 separation with PAMAM / MS / Al2 O3
Suggestive mechanism of CO2 and N2 separation with PAMAM / MS / Al2 O3Before humidification After humidification
+
PAMAM H2 O Hydrate PAMAM
CO2 permeate rate decrease1/300
Other gases enormously decrease
1/7000
Surface of mesoporous silica has enough hydrophilic property to adhere hydrate PAMAM at RH = 80 %, so PAMAM can interrupt N2 movement.
N2 CO2
RH = 80 %
Swelling and agglomerated Hydrate PAMAM

43
ConclusionsConclusions
• CO2 attractive force on pore inner-surface and distribution of pore diameter affect membrane performances.
• Carbon membrane needs ten times larger CO2
permeance and twice larger separation factor than those of our result.
• PAMAM / MS / Al2 O3 membrane has very high separation factor, but it needs thousand times larger CO2 permeance.
44
Future WorkFuture Work
• It is possible that PAMAM dendrimer with rigid support and with hydrophilic material, such as mesoporous silica, highly block gases without CO2 .
• It is not precisely unknown how to enhance PAMAM dendrimer CO2 permeation rate.
• We are focusing on the interruptions between PAMAM dendrimer, pore figure and function of pore surface to increase CO2 permeation rate,
temperature effect, and
thickness of selective layer of a membrane.
45
Acknowledgement
SponsorSponsorThe Global Climate and Energy Project at Stanford University
RITE CoRITE Co--ResearchersResearchers Dr. Shingo Kazama, Dr. Katsunori Yogo, Shingo Kazama, Dr. Katsunori Yogo, Dr.TeruhikoDr.Teruhiko Kai, Kai,
Dr. Manabu Miyamoto, Dr. Dr. Manabu Miyamoto, Dr. ShuhongShuhong Duan, Dr. Duan, Dr. KousukeKousuke UoeUoe,,
Dr. Dr. YuzuruYuzuru Sakamoto, Dr. Takayuki Sakamoto, Dr. Takayuki KouketsuKouketsu, Dr. Naoki Yamamoto, Dr. Naoki Yamamoto
Thank you for your attention!