gcse mathematics unit 1:...
TRANSCRIPT
Candidate Name Centre Number Candidate Number
0
GCSE
MATHEMATICS UNIT 1: NON-CALCULATOR HIGHER TIER
2nd SPECIMEN PAPER SUMMER 2017
1 HOUR 45 MINUTES
ADDITIONAL MATERIALS The use of a calculator is not permitted in this examination. A ruler, protractor and a pair of compasses may be required.
INSTRUCTIONS TO CANDIDATES Write your name, centre number and candidate number in the spaces at the top of this page.
Answer all the questions in the spaces provided in this booklet.
Take π as 3∙14.
INFORMATION FOR CANDIDATES
You should give details of your method of solution when appropriate.
Unless stated, diagrams are not drawn to scale.
Scale drawing solutions will not be acceptable where you are asked to calculate.
The number of marks is given in brackets at the end of each question or part-question.
The assessment will take into account the quality of your linguistic and mathematical organisation, communication and accuracy in writing in question 4.
For Examiner’s use only
Question Maximum
Mark Mark
Awarded
1. 6
2. 7
3. 3
4. 8
5. 3
6. 4
7. 6
8. 6
9. 3
10. 4
11. 4
12. 2
13. 7
14. 3
15. 5
16. 6
17. 3
TOTAL 80
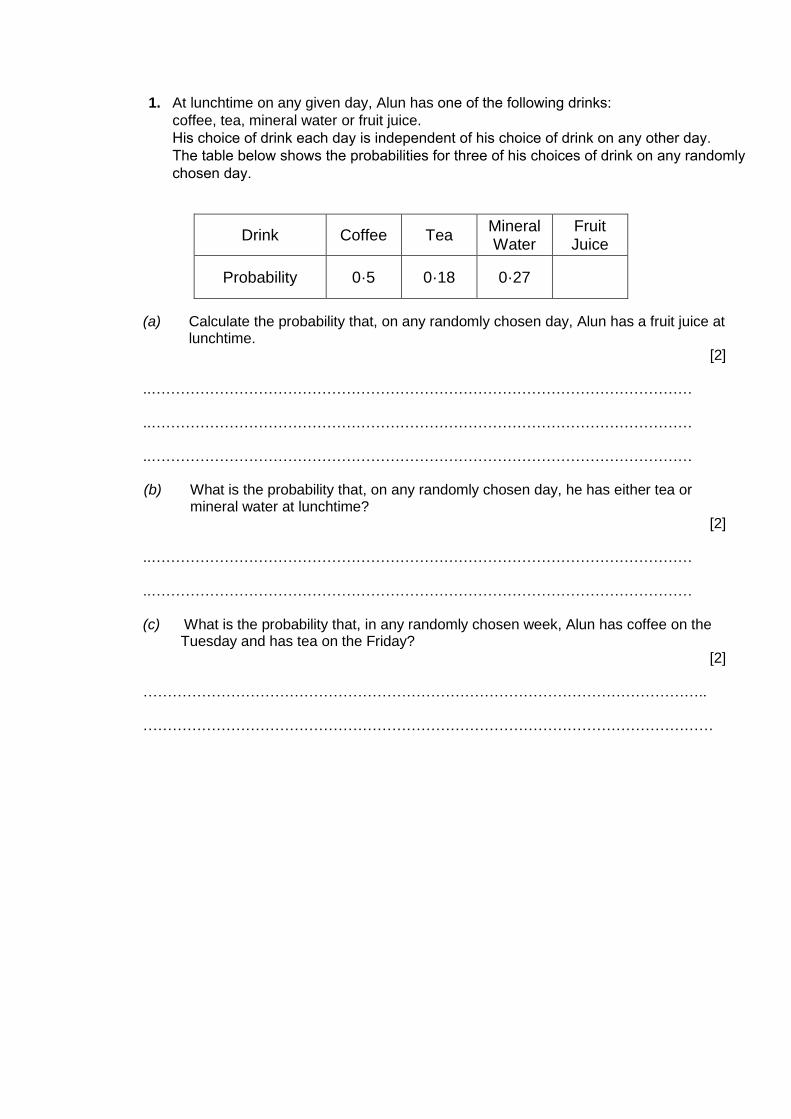
1. At lunchtime on any given day, Alun has one of the following drinks:coffee, tea, mineral water or fruit juice.
His choice of drink each day is independent of his choice of drink on any other day.The table below shows the probabilities for three of his choices of drink on any randomlychosen day.
(a) Calculate the probability that, on any randomly chosen day, Alun has a fruit juice at lunchtime.
[2]
..…………………………………………………………………………………………………
..…………………………………………………………………………………………………
..…………………………………………………………………………………………………
(b) What is the probability that, on any randomly chosen day, he has either tea or mineral water at lunchtime?
[2]
..…………………………………………………………………………………………………
..…………………………………………………………………………………………………
(c) What is the probability that, in any randomly chosen week, Alun has coffee on the Tuesday and has tea on the Friday?
[2]
……………………………………………………………………………………………………..
………………………………………………………………………………………………………
Drink Coffee Tea Mineral Water
Fruit Juice
Probability 0·5 0·18 0·27
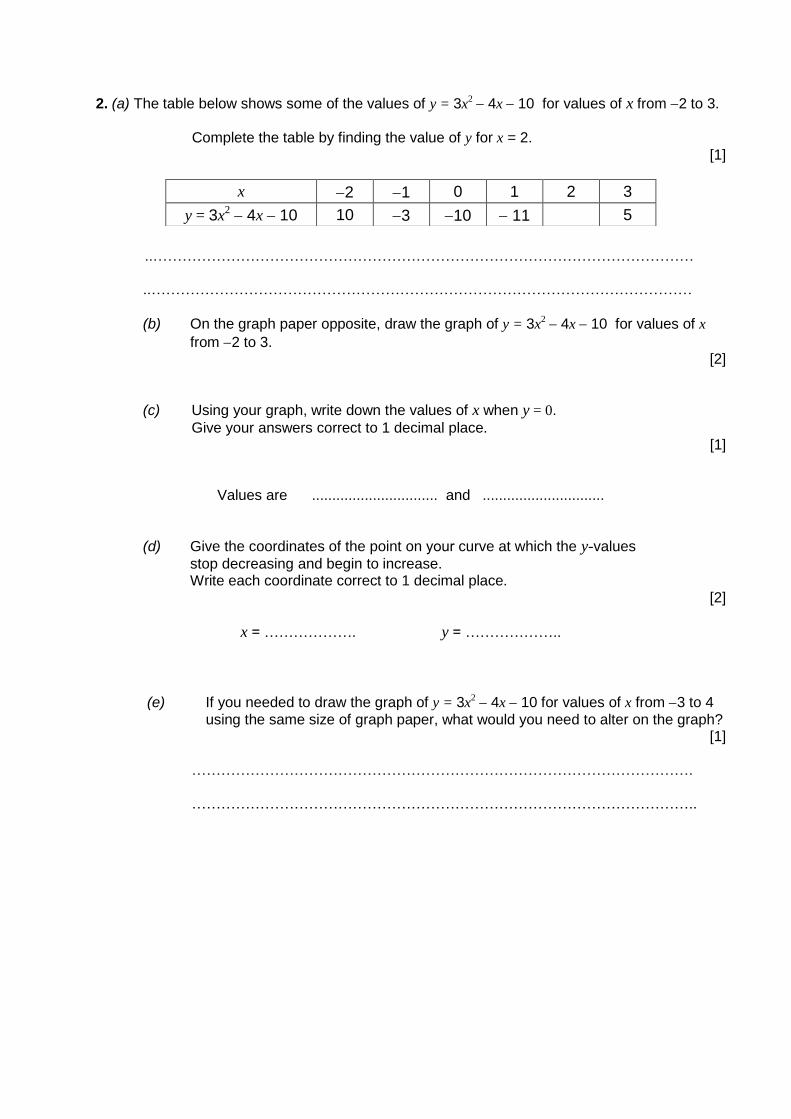
2. (a) The table below shows some of the values of y = 3x2 4x 10 for values of x from 2 to 3.
Complete the table by finding the value of y for x = 2.
[1]
..…………………………………………………………………………………………………
..…………………………………………………………………………………………………
(b) On the graph paper opposite, draw the graph of y = 3x2 4x 10 for values of x
from 2 to 3. [2]
(c) Using your graph, write down the values of x when y = 0.
Give your answers correct to 1 decimal place. [1]
Values are ............................... and ..............................
(d) Give the coordinates of the point on your curve at which the y-values
stop decreasing and begin to increase. Write each coordinate correct to 1 decimal place.
[2]
x = ………………. y = ………………..
(e) If you needed to draw the graph of y = 3x2 4x 10 for values of x from 3 to 4
using the same size of graph paper, what would you need to alter on the graph? [1]
………………………………………………………………………………………….
…………………………………………………………………………………………..
x 2 1 0 1 2 3
y = 3x2 4x 10 10 3 10 11 5
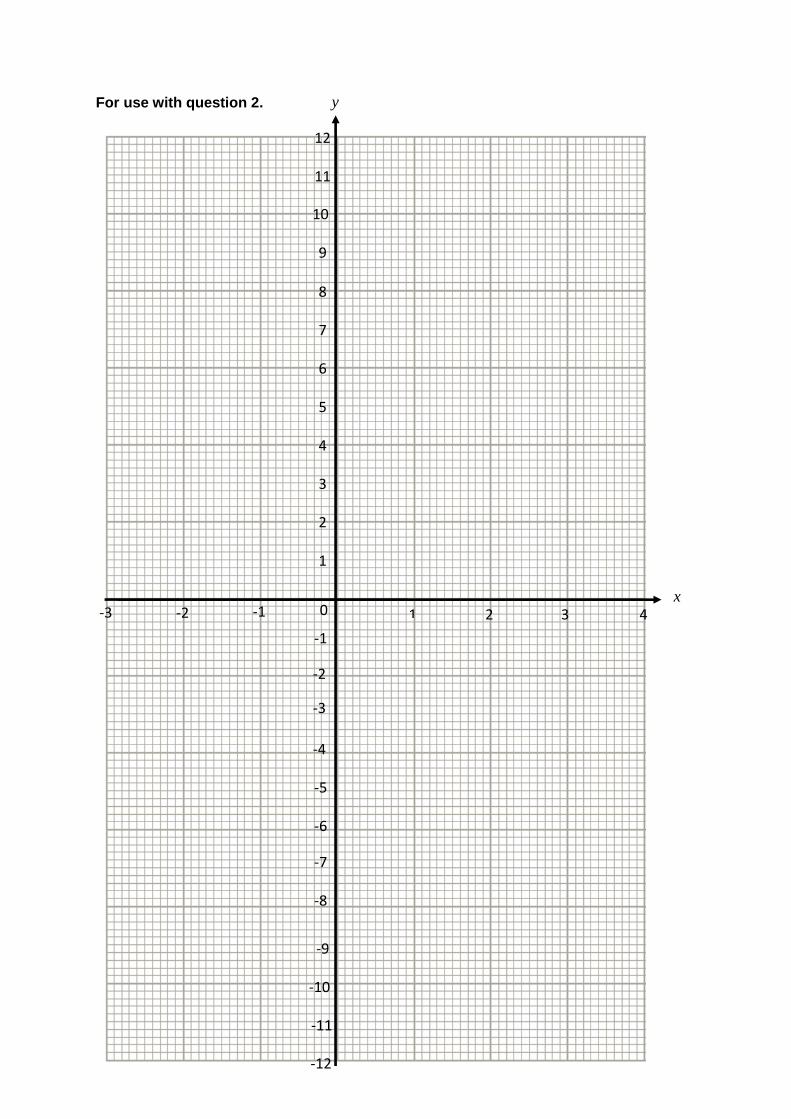
For use with question 2.
-2
-3
-4
-5
-6
-7
-8
1 2 3 4
12
11
10
9
x
-1
y
8
7
6
5
4
3
2
1
-9
-10
-12
-11
-3 -2 -1 0
3. Are the following statements true or false? Circle the correct answer. You must give a full explanation of your decision in each case.
(a)
a2 + b2 is always an even number when a and b are whole numbers.
[1]
true / false
……………………………………………………………………………………………………….
……………………………………………………………………………………………………….
……………………………………………………………………………………………………….
……………………………………………………………………………………………………….
(b)
a2b2 is always an odd number when a and b are odd numbers. [2]
true / false
……………………………………………………………………………………………………….
……………………………………………………………………………………………………….
……………………………………………………………………………………………………….
……………………………………………………………………………………………………….
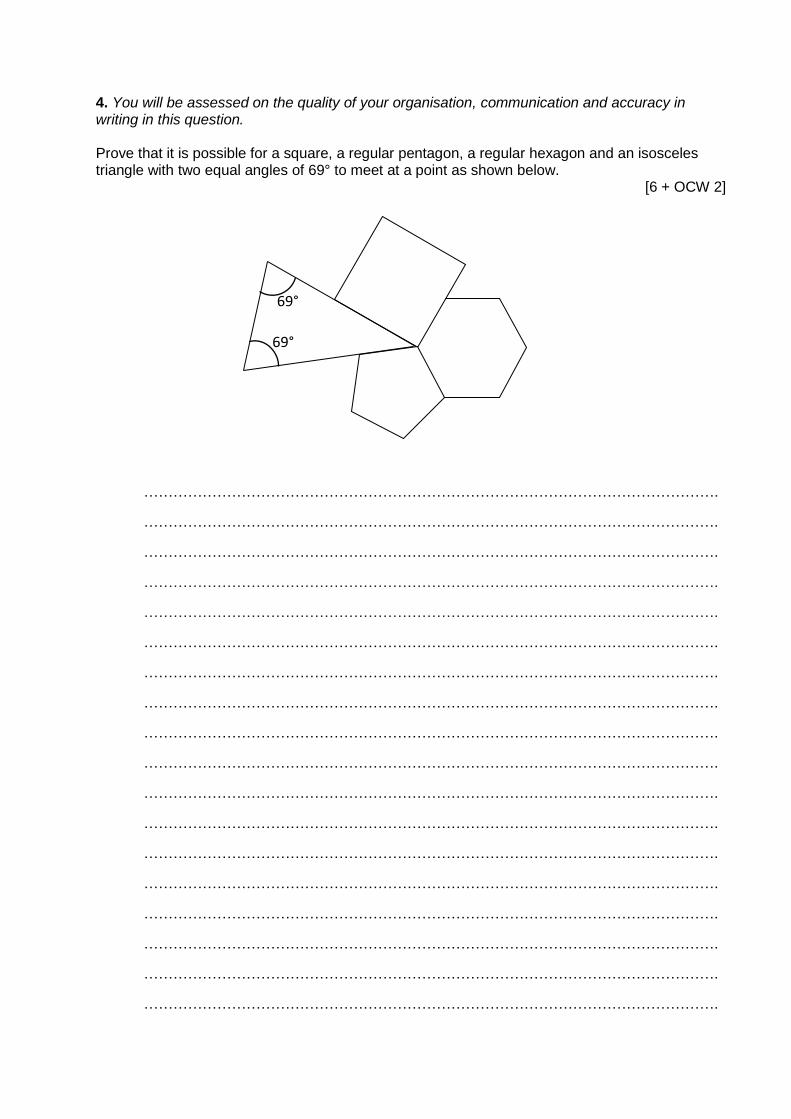
4. You will be assessed on the quality of your organisation, communication and accuracy inwriting in this question.
Prove that it is possible for a square, a regular pentagon, a regular hexagon and an isosceles triangle with two equal angles of 69° to meet at a point as shown below.
[6 + OCW 2]
……………………………………………………………………………………………………….
……………………………………………………………………………………………………….
……………………………………………………………………………………………………….
……………………………………………………………………………………………………….
……………………………………………………………………………………………………….
……………………………………………………………………………………………………….
……………………………………………………………………………………………………….
……………………………………………………………………………………………………….
……………………………………………………………………………………………………….
……………………………………………………………………………………………………….
……………………………………………………………………………………………………….
……………………………………………………………………………………………………….
……………………………………………………………………………………………………….
……………………………………………………………………………………………………….
……………………………………………………………………………………………………….
……………………………………………………………………………………………………….
……………………………………………………………………………………………………….
……………………………………………………………………………………………………….
69°
69°
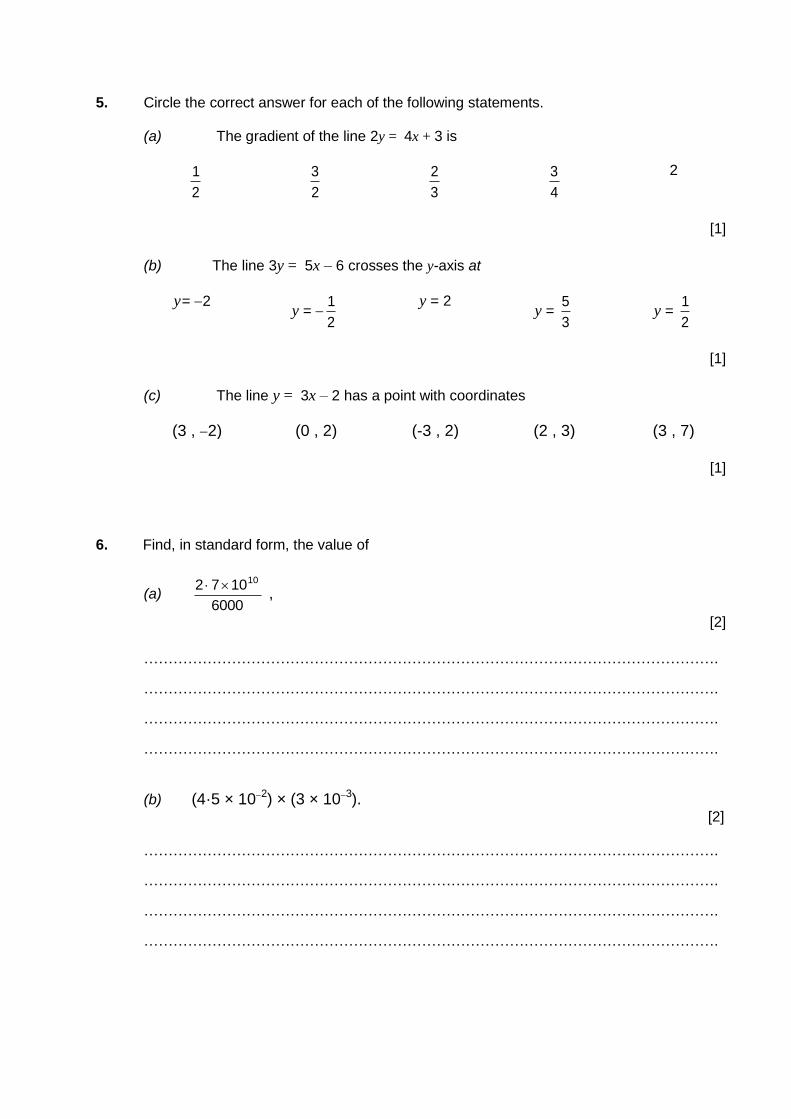
5. Circle the correct answer for each of the following statements.
(a) The gradient of the line 2y = 4x + 3 is
2
1
2
3
3
2
4
3 2
[1]
(b) The line 3y = 5x – 6 crosses the y-axis at
y = 2 y =
2
1 y = 2 y =
3
5y =
2
1
[1]
(c) The line y = 3x – 2 has a point with coordinates
(3 , 2) (0 , 2) (-3 , 2) (2 , 3) (3 , 7)
[1]
6. Find, in standard form, the value of
(a) 6000
1072 10 ,
[2]
……………………………………………………………………………………………………….
……………………………………………………………………………………………………….
……………………………………………………………………………………………………….
……………………………………………………………………………………………………….
(b) (4·5 × 102) × (3 × 103). [2]
……………………………………………………………………………………………………….
……………………………………………………………………………………………………….
……………………………………………………………………………………………………….
……………………………………………………………………………………………………….
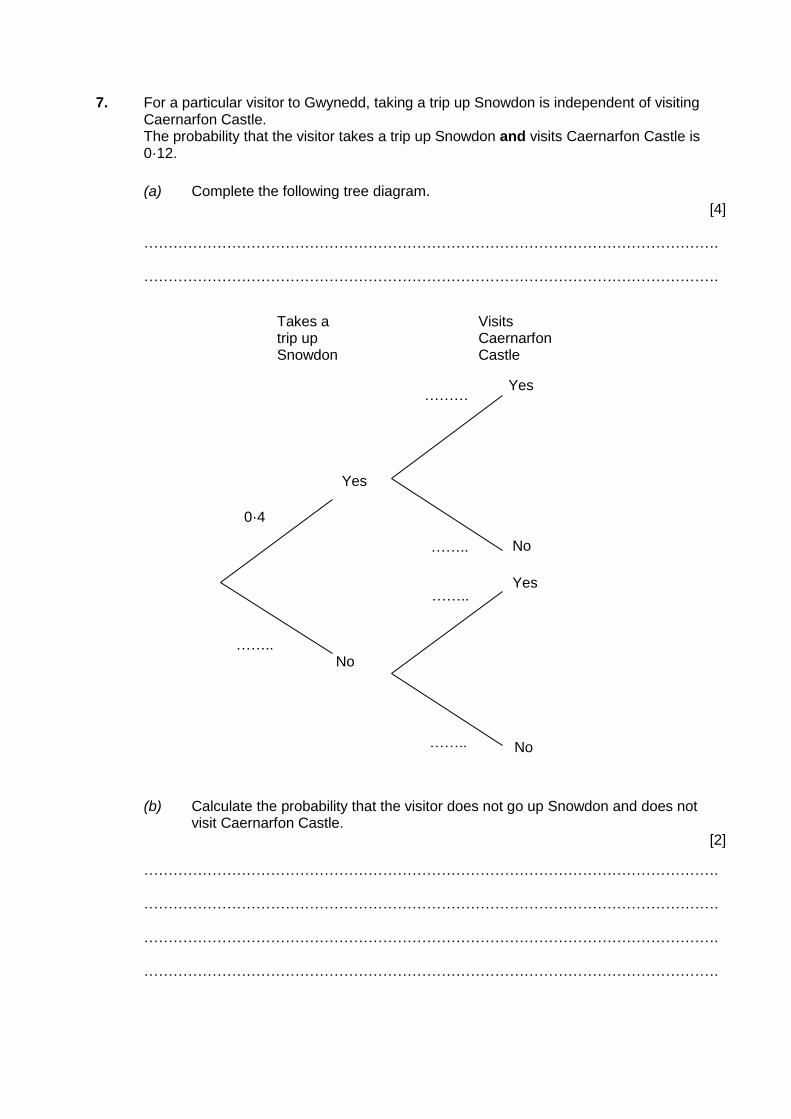
7. For a particular visitor to Gwynedd, taking a trip up Snowdon is independent of visitingCaernarfon Castle.The probability that the visitor takes a trip up Snowdon and visits Caernarfon Castle is0·12.
(a) Complete the following tree diagram. [4]
……………………………………………………………………………………………………….
……………………………………………………………………………………………………….
(b) Calculate the probability that the visitor does not go up Snowdon and does not visit Caernarfon Castle.
[2]
……………………………………………………………………………………………………….
……………………………………………………………………………………………………….
……………………………………………………………………………………………………….
……………………………………………………………………………………………………….
……..
Takes a trip up Snowdon
Visits Caernarfon Castle
Yes
Yes
Yes
No
No
……..
……..
………
0·4
No ……..
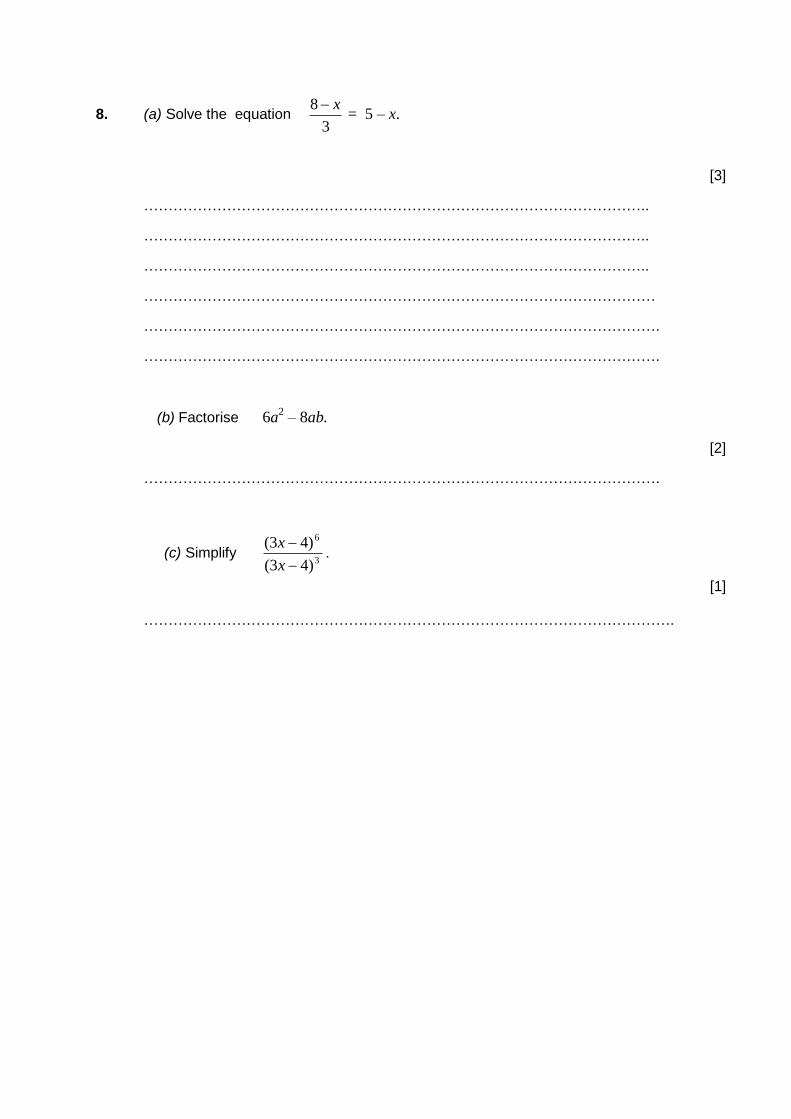
8. (a) Solve the equation3
8 x = 5 – x.
[3]
…………………………………………………………………………………………..
…………………………………………………………………………………………..
…………………………………………………………………………………………..
……………………………………………………………………………………………
…………………………………………………………………………………………….
…………………………………………………………………………………………….
(b) Factorise 6a2 – 8ab.
[2]
…………………………………………………………………………………………….
(c) Simplify 3
6
)43(
)43(
x
x.
[1]
……………………………………………………………………………………………….
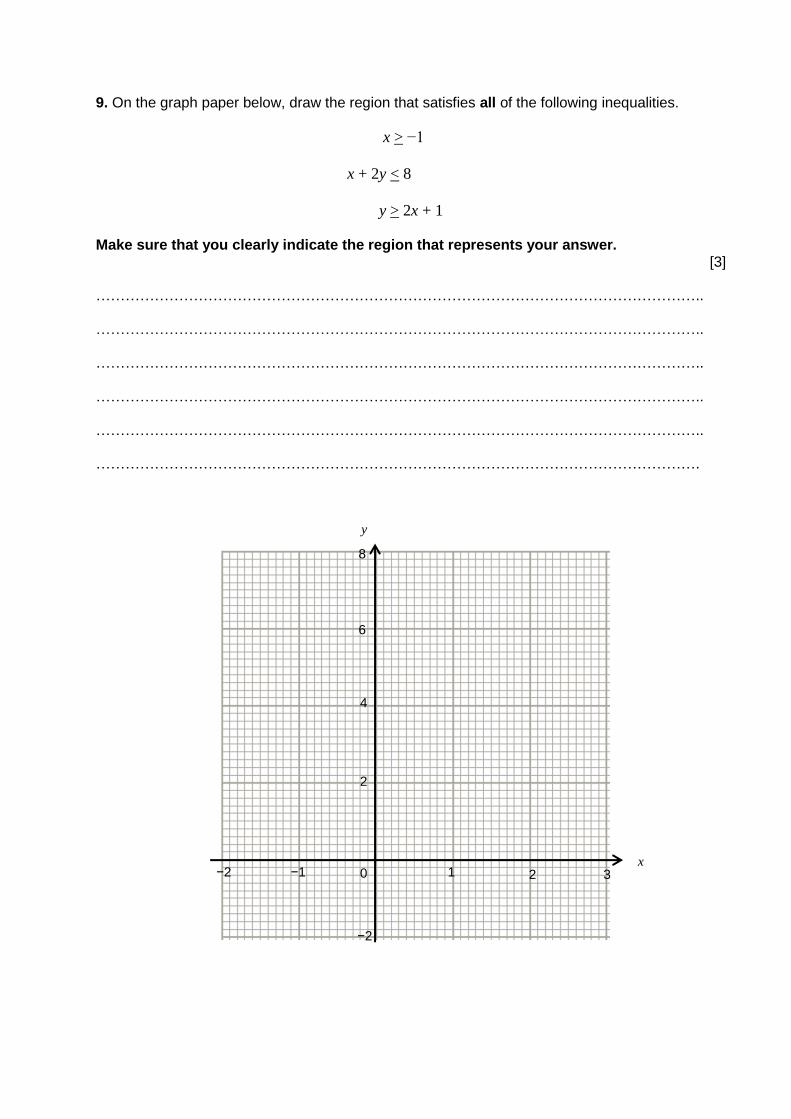
9. On the graph paper below, draw the region that satisfies all of the following inequalities.
x > −1
x + 2y < 8
y > 2x + 1
Make sure that you clearly indicate the region that represents your answer. [3]
……………………………………………………………………………………………………………..
……………………………………………………………………………………………………………..
……………………………………………………………………………………………………………..
……………………………………………………………………………………………………………..
……………………………………………………………………………………………………………..
…………………………………………………………………………………………………………….
2
y
x 0 1 2 3 −1 −2
−2
4
6
8

10.
Diagram not drawn to scale
The diagram shows a sector of a circle of radius 4·5 cm. The perimeter of the sector is 34 cm.
Write an expression for angle θ, in terms of π.
Give your answer, in degrees, in its simplest form. [4]
……………………………………………………………………………………………………………..
……………………………………………………………………………………………………………..
……………………………………………………………………………………………………………..
……………………………………………………………………………………………………………..
……………………………………………………………………………………………………………..
……………………………………………………………………………………………………………..
……………………………………………………………………………………………………………..
……………………………………………………………………………………………………………..
……………………………………………………………………………………………………………..
……………………………………………………………………………………………………………..
4∙5 cm
θ

11. A metal bar can be melted down to form 875 solid ornaments of height 6∙3 cm.How many similar ornaments of height 31∙5 cm could have been formed from the same metal bar?
[4]
……………………………………………………………………………………………………………..
……………………………………………………………………………………………………………..
……………………………………………………………………………………………………………..
……………………………………………………………………………………………………………..
……………………………………………………………………………………………………………..
……………………………………………………………………………………………………………..
……………………………………………………………………………………………………………..
……………………………………………………………………………………………………………..
……………………………………………………………………………………………………………..
12. (a) Which one of the following numbers is rational? Circle your answer.
[1]
π √2 √163
√125
8
3√204
(b) Which one of the following numbers is irrational? Circle your answer. [1]
(3
8)
2
√144 √643
0 ∙ 7̇9125̇ π2
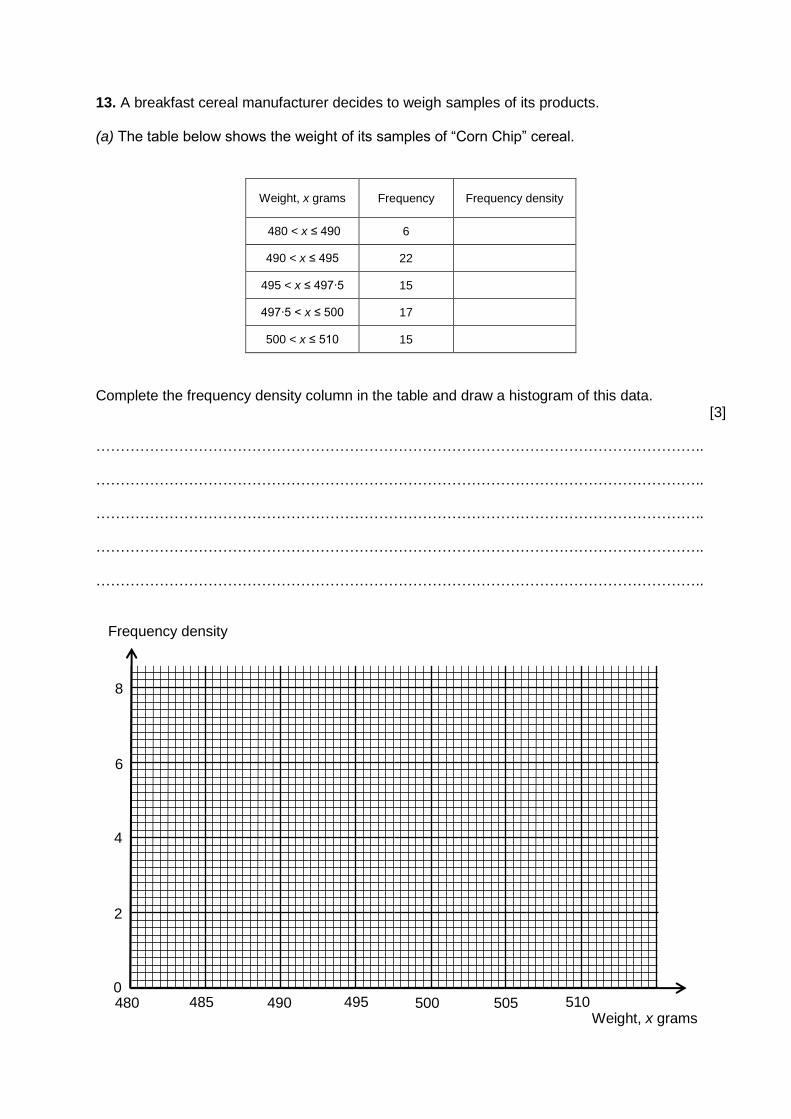
13. A breakfast cereal manufacturer decides to weigh samples of its products.
(a) The table below shows the weight of its samples of “Corn Chip” cereal.
Weight, x grams Frequency Frequency density
480 < x ≤ 490 6
490 < x ≤ 495 22
495 < x ≤ 497∙5 15
497∙5 < x ≤ 500 17
500 < x ≤ 510 15
Complete the frequency density column in the table and draw a histogram of this data. [3]
……………………………………………………………………………………………………………..
……………………………………………………………………………………………………………..
……………………………………………………………………………………………………………..
……………………………………………………………………………………………………………..
……………………………………………………………………………………………………………..
480 485 490 495 500 505 510 Weight, x grams
0
2
4
6
8
Frequency density
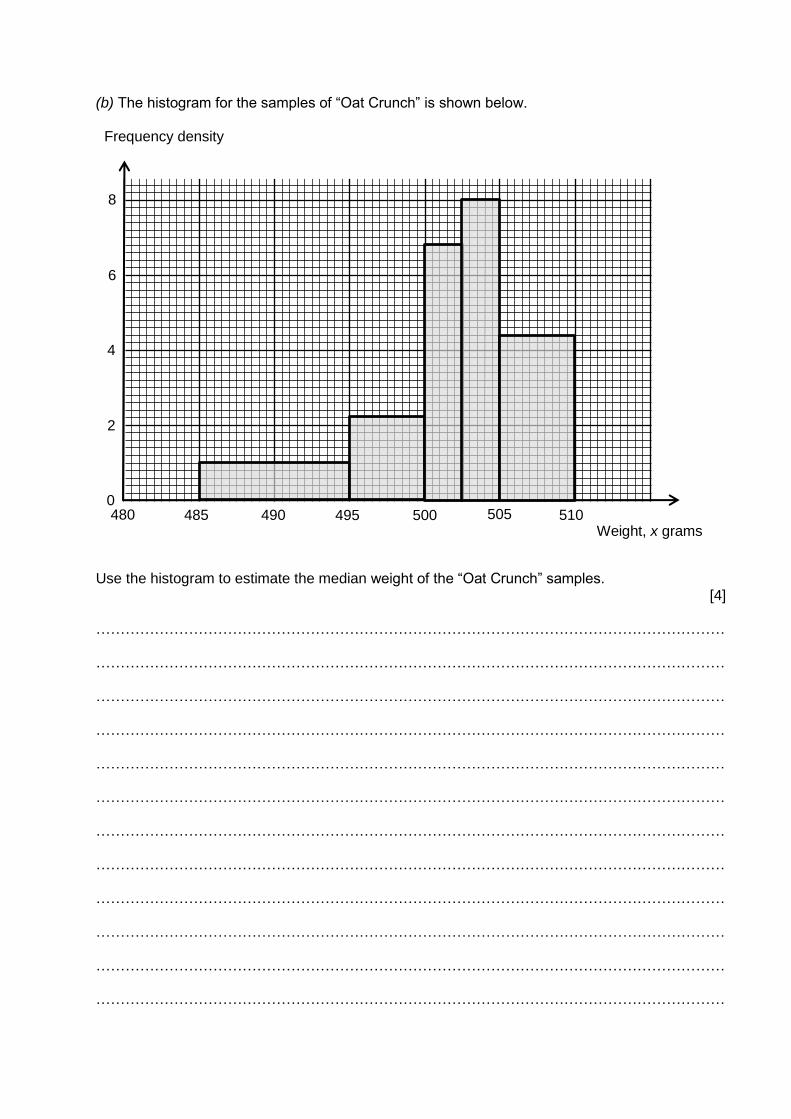
(b) The histogram for the samples of “Oat Crunch” is shown below.
Use the histogram to estimate the median weight of the “Oat Crunch” samples. [4]
…………………………………………………………………………………………………………………
…………………………………………………………………………………………………………………
…………………………………………………………………………………………………………………
…………………………………………………………………………………………………………………
…………………………………………………………………………………………………………………
…………………………………………………………………………………………………………………
…………………………………………………………………………………………………………………
…………………………………………………………………………………………………………………
…………………………………………………………………………………………………………………
…………………………………………………………………………………………………………………
…………………………………………………………………………………………………………………
…………………………………………………………………………………………………………………
480 485 490 495 500 505 510 Weight, x grams
0
2
4
6
Frequency density
8

14. The graph of 𝑦 = 𝑥2 + 𝑥 − 1 is shown below for values of x from −2 to 3.
By drawing an appropriate straight line, use the graph to solve the equation 𝑥2 + 0 ∙ 5𝑥 − 2 = 0. [3]
…………………………………………………………………………………………………………………
…………………………………………………………………………………………………………………
…………………………………………………………………………………………………………………
…………………………………………………………………………………………………………………
…………………………………………………………………………………………………………………
…………………………………………………………………………………………………………………
y
0 1 2 −1
2
4
6
8
−2 3
−4
−2
10
x
×
× ×
×
×
×
15. Simplify2𝑥2 + 13𝑥 + 21
4𝑥2 − 49.
[5]
…………………………………………………………………………………………………………………
…………………………………………………………………………………………………………………
…………………………………………………………………………………………………………………
…………………………………………………………………………………………………………………
…………………………………………………………………………………………………………………
…………………………………………………………………………………………………………………
…………………………………………………………………………………………………………………
…………………………………………………………………………………………………………………
…………………………………………………………………………………………………………………
…………………………………………………………………………………………………………………
16. In a box of chocolates, there are 10 milk chocolates, 6 dark chocolates and 4 whitechocolates. Two chocolates are chosen at random from the box, without replacement.
(a) Calculate the probability that the chocolates chosen are both white chocolates. [2]
…………………………………………………………………………………………………………………
…………………………………………………………………………………………………………………
…………………………………………………………………………………………………………………
…………………………………………………………………………………………………………………
(b) Calculate the probability that the chocolates chosen are of different types. [4]
…………………………………………………………………………………………………………………
…………………………………………………………………………………………………………………
…………………………………………………………………………………………………………………
…………………………………………………………………………………………………………………
…………………………………………………………………………………………………………………
…………………………………………………………………………………………………………………
…………………………………………………………………………………………………………………
…………………………………………………………………………………………………………………
…………………………………………………………………………………………………………………
…………………………………………………………………………………………………………………
…………………………………………………………………………………………………………………
…………………………………………………………………………………………………………………

17. The diagram shows a sketch of 𝑦 = 𝑓(𝑥).
On the same diagram, sketch the curves 𝑦 = 𝑓(𝑥 + 3) and 𝑦 = −𝑓(𝑥 + 3). Clearly label each curve with its function, and indicate the coordinate of any point where a curve crosses an axis.
[3]
END OF PAPER
y
x 0 2