gcse - schudio
TRANSCRIPT

FREQUENCY TABLES[ESTIMATED TIME: 60 minutes] GCSE
(+ IGCSE) EXAM QUESTION PRACTICE
3
*P42070A0320* Turn over
Answer ALL TWENTY TWO questions.
Write your answers in the spaces provided.
You must write down all stages in your working.
1 The table shows information about the mark scored on an examination question by each of 40 students.
Mark Number of students
0 13
1 2
2 3
3 8
4 14
Work out the mean mark.
. . . . . . . . . . . . . . . . . . . . . . . . . . . . . . . . . . . . . . . . . . .
(Total for Question 1 is 3 marks)
1. [3 marks]
Note that these questions are sorted in date order (most recent questions first).
May 2013, 3H Q1: 3 Marks
Questions compiled by:@Maths4Everyone
Contains questions which have been reproduced with the kindpermission of Pearson Education Limited UK

3
*P44614A0320* Turn over
Answer ALL TWENTY FOUR questions.
Write your answers in the spaces provided.
You must write down all the stages in your working.
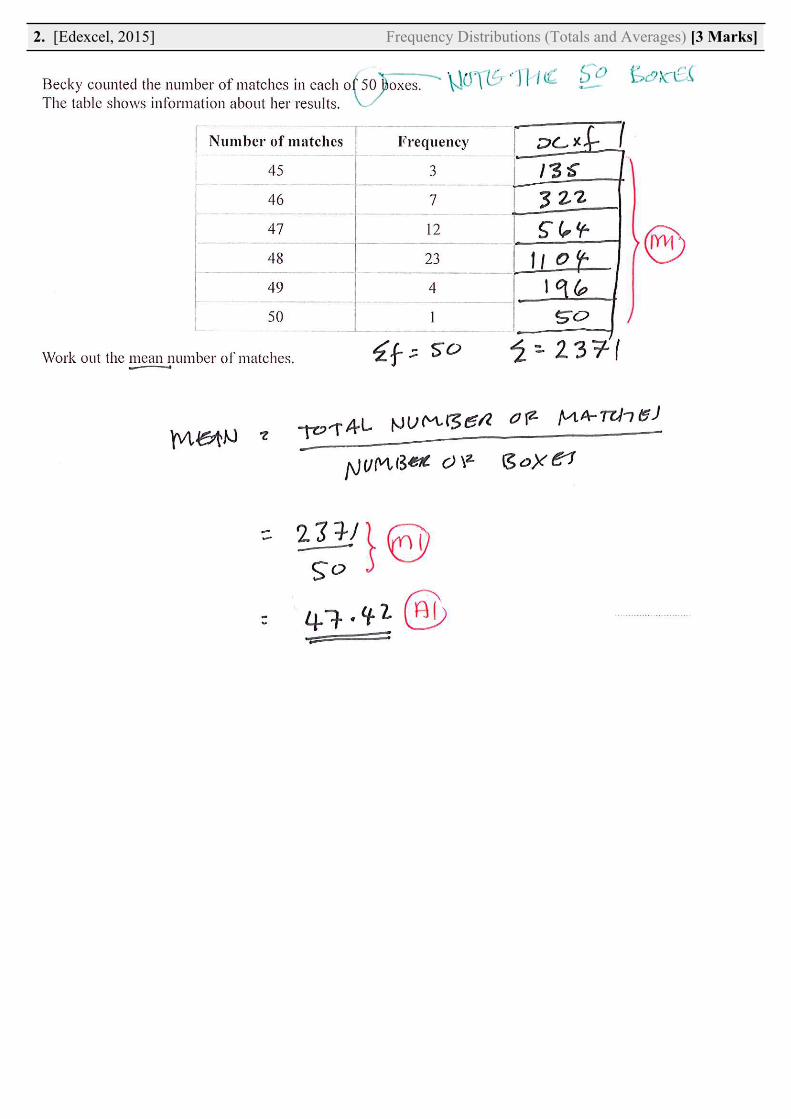
1 Becky counted the number of matches in each of 50 boxes. The table shows information about her results.
Number of matches Frequency
45 3
46 7
47 12
48 23
49 4
50 1
Work out the mean number of matches.
.. . . . . . . . . . . . . . . . . . . . . . . . . . .
(Total for Question 1 is 3 marks)
Do NOT write in this space.
2. [3 marks]
Note that these questions are sorted in date order (most recent questions first).
January 2015, 4H Q1: 3 Marks
4
*P44619A0420*
3 The table shows information about the numbers of goals scored by some football teams last week.
Number of goals Number of teams
0 5
1 8
2 2
3 3
4 2
Work out the total number of goals scored by these football teams last week.
.. . . . . . . . . . . . . . . . . . . . . . . . . . . . . . . . . . . . . . . . . . . . . . . . . . . . . .
(Total for Question 3 is 2 marks)
4 (a) Factorise 6w + 15
.. . . . . . . . . . . . . . . . . . . . . . . . . . . . . . . . . . . . . . . .
(1)
(b) Expand and simplify (x + 4)(x + 7)
.. . . . . . . . . . . . . . . . . . . . . . . . . . . . . . . . . . . . . . . . . . . . . . . . . . . . . .
(2)
(c) Solve 3(x í 5) 7x + 12 Show clear algebraic working.
x . . . . . . . . . . . . . . . . . . . . . . . . . . . . . . . . . . . . . . . . . .
(3)
(Total for Question 4 is 6 marks)
3. [2 marks]
Note that these questions are sorted in date order (most recent questions first).
January 2015, 3HR Q3: 2 Marks

5
*P44389A0524* Turn over
4 Becky has a biased 6-sided spinner. She spins the spinner 25 times. She records the score for each spin. The table shows information about her scores.
Score Frequency1 92 63 34 25 16 4
(a) Find her median score.
.. . . . . . . . . . . . . . . . . . . . . . . . . . . . . . . . . . . . . . . . . . . . . . . . . . . . .
(2)
(b) Work out her mean score.
.. . . . . . . . . . . . . . . . . . . . . . . . . . . . . . . . . . . . . . . . . . . . . . . . . . . . .
(3)
(Total for Question 4 is 5 marks)
1
6
54
3
2
4. [5 marks]
Note that these questions are sorted in date order (most recent questions first).
June 2015, 4H Q4: 5 Marks

1'#O'+
N.#&Q
A
!"#$%&#'%$&%!
PE+ T-(Q+-,5+5K'+O#.,'+-?+++++++++++++++PK'&+"+^+]+#&2+#+^+IH+
+ + +;;;;;;;;;;;;;;;;;;;;;;;;;;;;;;;;;;;;
!E+ 0K'+5#N.'+8%O'*+%&?-($#5%-&+#N-,5+5K'+*K-'+*%_'*+-?+]\+='-=.';
3K-'+*%_' ] \ X H DG
:,$N'(+-?+='-=.' FG DH G+ F] F
+ `%&2+5K'+$'2%#&+*K-'+*%_';
+ + +;;;;;;;;;;;;;;;;;;;;;;;;;;;;;;;;;;;;
16a(b + 1)
OP
H;&/,<)P)-,:M0J
O!
H;&/,<)I)-,:M0J
5. [2 marks]
Note that these questions are sorted in date order (most recent questions first).
June 2009, 4H Q4: 2 Marks
6. [3 marks]
Note that these questions are sorted in date order (most recent questions first).
May 2013, 4H Q12: 3 Marks

7
*P41038A0720* Turn over
6 A school has 60 teachers.
The table shows information about the distances, in km, the teachers travel to school each day.
Distance (d km) Frequency
0 < d ! 5 12
5 < d ! 10 6
10 < d ! 15 4
15 < d ! 20 6
20 < d ! 25 14
25 < d ! 30 18
(a) Write down the modal class.
. . . . . . . . . . . . . . . . . . . . . . . . . . . . . . . . . . . . . . . . . . . . . . . . . . . . . . . . . . . . . .
(1)
(b) Work out an estimate for the total distance travelled to school by the 60 teachers each day.
. . . . . . . . . . . . . . . . . . . . . . . . . . . . . . . . . . . . . . . . . . . . . . . . . . . . . . . . . . . . . . km(3)
(Total for Question 6 is 4 marks)
7 (i) Solve the inequalities –2 < x + 2 ! 5
. . . . . . . . . . . . . . . . . . . . . . . . . . . . . . . . . . . . . . . . . . . . . . . . . . . . . . . . . . . . . .
(ii) On the number line, represent the solution to part (i).
(Total for Question 7 is 4 marks)
–1 –2 –3 –4 –5 51 0 2 3 4
7. [4 marks]
Note that these questions are sorted in date order (most recent questions first).
January 2013, 3H Q6: 4 Marks

8
*P46917A0824*
D
O N
OT W
RITE IN TH
IS AREA
D
O N
OT W
RITE IN TH
IS AREA
D
O N
OT W
RITE IN TH
IS AREA
7 Mr Rowland has a class of 30 students. He gave them 24 words to spell. The table shows information about the number of correct spellings for each student.
Number of correct spellings Frequency
0 – 4 1
5 – 9 5
10 – 14 6
15 – 19 10
20 – 24 8
(a) Write down the modal class.
.. . . . . . . . . . . . . . . . . . . . . . . . . . . . . . . . . . . . . . . . . . . . . . . . . . . . (1)
(b) Work out an estimate for the mean number of correct spellings. Give your answer to 1 decimal place.
.. . . . . . . . . . . . . . . . . . . . . . . . . . . . . . . . . . . . . . . . . . . . . . . . . . . . (4)
(Total for Question 7 is 5 marks)
8. [5 marks]
Note that these questions are sorted in date order (most recent questions first).
January 2016, 4HR Q7: 5 Marks

6
*P46910A0624*
D
O N
OT W
RITE IN TH
IS AREA
D
O N
OT W
RITE IN TH
IS AREA
D
O N
OT W
RITE IN TH
IS AREA
5 Kim asked 40 people how many text messages they each sent on Monday. The table shows her results.
Number of text messages sent Frequency
0 to 4 6
5 to 9 3
10 to 14 5
15 to 19 12
20 to 24 14
(a) Write down the modal class.
.. . . . . . . . . . . . . . . . . . . . . . . . . . . . . . . . . . . . . . . . . . . . . . . . . . . . . .
(1)
(b) Calculate an estimate for the mean number of text messages sent.
.. . . . . . . . . . . . . . . . . . . . . . . . . . . . . . . . . . . . . . . . . . . . . . . . . . . . .
(4)
(c) What percentage of these 40 people sent 20 or more text messages?
.. . . . . . . . . . . . . . . . . . . . . . . . . . . . . . . . . . . . . . . .%(2)
(Total for Question 5 is 7 marks)
9. [7 marks]
Note that these questions are sorted in date order (most recent questions first).
January 2016, 3H Q5: 7 Marks

8
*P40612A0820*
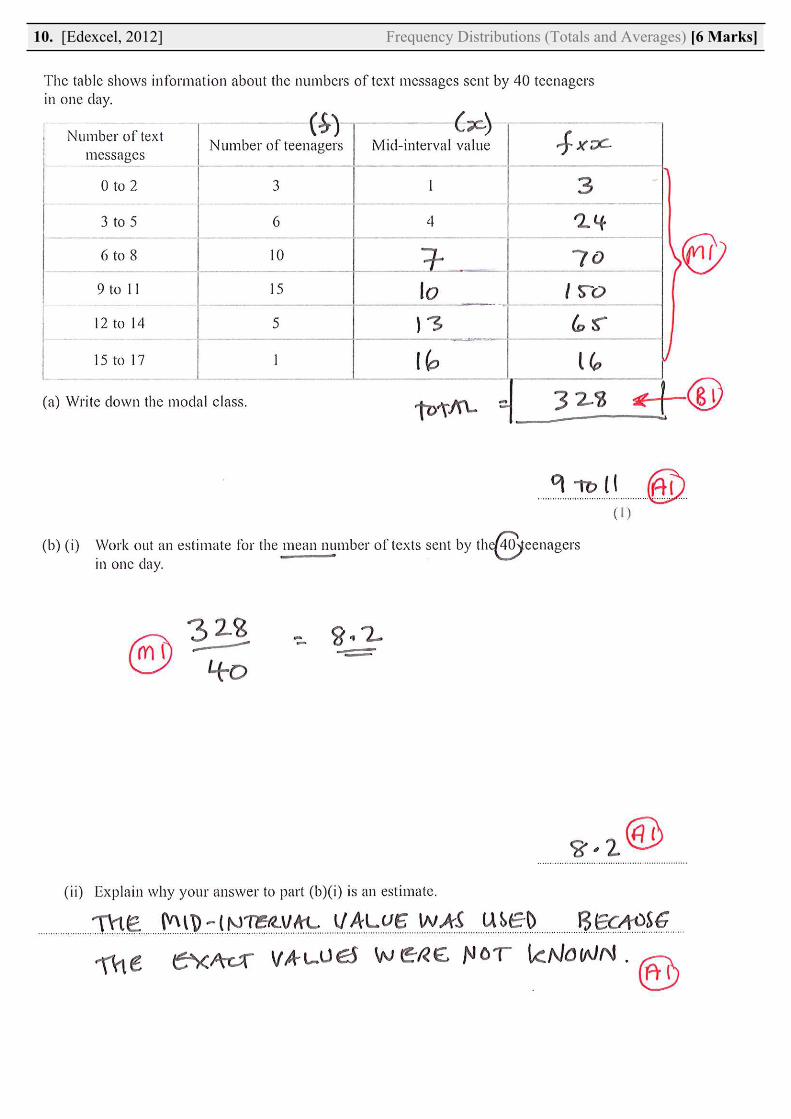
7 The table shows information about the numbers of text messages sent by 40 teenagers in one day.
Number of text messages Number of teenagers Mid-interval value
0 to 2 3 1
3 to 5 6 4
6 to 8 10
9 to 11 15
12 to 14 5
15 to 17 1
(a) Write down the modal class.
. . . . . . . . . . . . . . . . . . . . . . . . . . . . . . . . . . . . . . . . . . . . . . . . . . . . . . . . . . . . . .
(1)
(b) (i) Work out an estimate for the mean number of texts sent by the 40 teenagers in one day.
. . . . . . . . . . . . . . . . . . . . . . . . . . . . . . . . . . . . . . . . . . . . . . . . . . . . . . . . . . . . . .
(ii) Explain why your answer to part (b)(i) is an estimate.
. . . . . . . . . . . . . . . . . . . . . . . . . . . . . . . . . . . . . . . . . . . . . . . . . . . . . . . . . . . . . . . . . . . . . . . . . . . . . . . . . . . . . . . . . . . . . . . . . . . . . . . . . . . . . . . . . . . . . . . . . . . . . . . . . . . . . . . . . . . . . . . . . . . . . . . . . . . . . . . . . . . . . . . . . . . . . . . . . . . . . . . . . . . . . . . . . . . . . . . . . . . . . . . . . . . . . . . . . . . . . . . . . . . . . . . . . . . . . . . . . . . . . . . . . . . . . . . . . . . . . . . . . . . . . . . . .
. . . . . . . . . . . . . . . . . . . . . . . . . . . . . . . . . . . . . . . . . . . . . . . . . . . . . . . . . . . . . . . . . . . . . . . . . . . . . . . . . . . . . . . . . . . . . . . . . . . . . . . . . . . . . . . . . . . . . . . . . . . . . . . . . . . . . . . . . . . . . . . . . . . . . . . . . . . . . . . . . . . . . . . . . . . . . . . . . . . . . . . . . . . . . . . . . . . . . . . . . . . . . . . . . . . . . . . . . . . . . . . . . . . . . . . . . . . . . . . . . . . . . . . . . . . . . . . . . . . . . . . . . . . . . . . . .
(5)
(Total for Question 7 is 6 marks)
10. [6 marks]
Note that these questions are sorted in date order (most recent questions first).
January 2012, 3H Q7: 6 Marks
4
*P42933A0420*
2 Wendy travelled on the Eurostar train from St Pancras station to the Gare du Nord station. The Eurostar train travelled a distance of 495 km. The journey time was 2 hours 15 minutes.
Work out the average speed of the Eurostar train in kilometres per hour.
.. . . . . . . . . . . . . . . . . . . . . . . . . . . . . . . . . . . . . . . . . . . . . . . . . . . . . km/h
(Total for Question 2 is 3 marks)
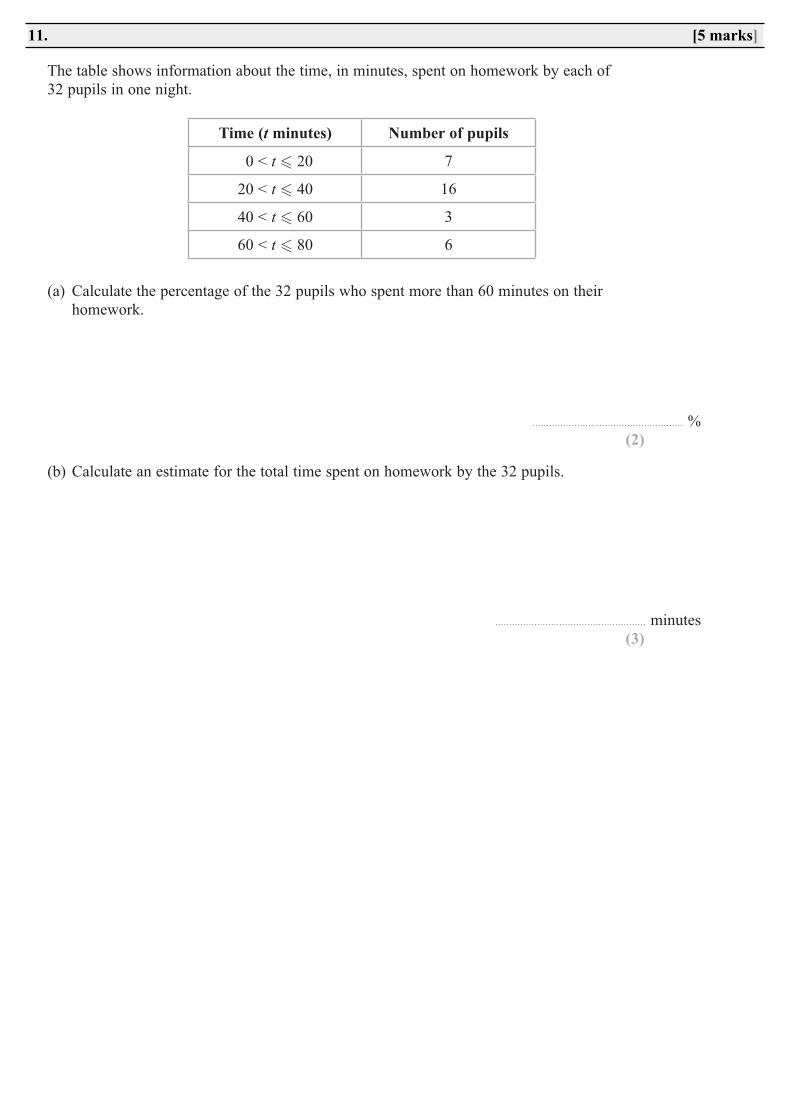
3 The table shows information about the time, in minutes, spent on homework by each of 32 pupils in one night.
Time (t minutes) Number of pupils
0 < t ! 20 7
20 < t ! 40 16
40 < t ! 60 3
60 < t ! 80 6
(a) Calculate the percentage of the 32 pupils who spent more than 60 minutes on their homework.
.. . . . . . . . . . . . . . . . . . . . . . . . . . . . . . . . . . . . . . . . . . . . . . . . . . . . . %(2)
(b) Calculate an estimate for the total time spent on homework by the 32 pupils.
.. . . . . . . . . . . . . . . . . . . . . . . . . . . . . . . . . . . . . . . . . . . . . . . . . . . . . minutes(3)
(Total for Question 3 is 5 marks)
11. [5 marks]
Note that these questions are sorted in date order (most recent questions first).
May 2013, 3HR Q3: 5 Marks

Leaveblank
6
4. The table shows information about the number of bananas the students in class 1B ate inone week.
(a) Find the mean number of bananas.
..........................(3)
There are 575 students in the school.The numbers of bananas eaten by students in class 1B are typical of the numbers eaten bystudents in the whole school.
(b) Work out an estimate for the number of students in the whole school who will eatexactly one banana next week.
..........................(3) Q4
(Total 6 marks)
*N23068A0624*
Number ofbananas Frequency
0 11 62 53 24 75 4
12. [6 marks]
Note that these questions are sorted in date order (most recent questions first).
November 2005, 3H Q4: 6 Marks

Leaveblank
10N18957A
8. The table shows information about the ages of 24 students.
(a) (i) Write down the mode of these ages.
..................... years
(ii) Find the median of these ages.
..................... years(iii) Calculate the mean of these ages.
..................... years(6)
Another student, aged 18, joins the group.
(b) (i) Without calculating the new mean, state whether the mean will increase ordecrease or stay the same.
..................................................
(ii) Give a reason for your answer to (i).
................................................................................................................................
................................................................................................................................
................................................................................................................................(2) Q8
(Total 8 marks)
Age (years)
16
17
18
19
Number of students
9
3
8
4
13. [8 marks]
Note that these questions are sorted in date order (most recent questions first).
November 2004, 3H Q8: 8 Marks

71+O1!
()+.V
X
!"#$%&'(&,#&!
UE! "#121!+21!K-'2!82+31%!-K!1889
! "#1!,+()1!%#-4%!#-4!/+.0!188%!-K!1+*#!82+31!4121!)+$3!(0!+!#1.!)+%,!01+29
2:,(7 C>-V7:)&?)7990
56,2+!)+281 FF
7+281 IE
a13$'/ JF
Z/+)) B;
! L+M! T.!,#1!K$2%,!K-'2!/-.,#%!-K!,#$%!01+2R!,#1!#1.!)+$3!X<!188%9
! ! D-2V!-',!+.!1%,$/+,1!K-2! ,#1!.'/(12!-K!56,2+! )+281!188%!,#1!#1.!)+$3!$.! ,#1%1!K-'2!
/-.,#%9
! !99999999999999999999999999
)HPJ
! L(M! "#1!,+()1!(1)-4!%#-4%!#-4!,#1!82+31!-K!+.!188!$%!21)+,13!,-!$,%!41$8#,9
2:,(7 L7.96/)H))9:,-0J
56,2+!)+281 -! =J
7+281 XJ"- d =J
a13$'/ FJ"- d XJ
Z/+)) - d FJ
! ! D-2V!-',!+.!1%,$/+,1!K-2!,#1!,-,+)!41$8#,!-K!IE!7+281!188%!+.3!JF!a13$'/!188%9
! !99999999999999999999999 !8
HPJ
! L*M! e-30!4+.,%!,-!'%1!,#1!$.K-2/+,$-.!$.!,#1!,+()1!,-!4-2V!-',!+.!1%,$/+,1!K-2!,#1!,-,+)!
41$8#,!-K!+))!,#1!188%!)+$3!(0!,#1!#1.!)+%,!01+29
! ! 56&)+$.!4#0!$,!$%!3$KK$*'),!,-!3-!,#$%9
! ! !999999999999999999999999999999999999999999999999999999999999999999999999999999999999999999999999999999999999999999999999999999999999999
HOJ QU
H;&/,<)U)-,:N0J
14. [7 marks]
Note that these questions are sorted in date order (most recent questions first).
November 2007, 4H Q7: 7 Marks

SOLUTIONSFREQUENCY TABLES
IGCSE EXAM QUESTION PRACTICEGCSE (+ IGCSE) EXAM QUESTION PRACTICE
DATE OF SOLUTIONS: 15/05/2018
MAXIMUM MARK: 66
1. [Edexcel, 2013] Frequency Distributions (Totals and Averages) [3 Marks]
2. [Edexcel, 2015] Frequency Distributions (Totals and Averages) [3 Marks]

3. [Edexcel, 2015] Frequency Distributions (Totals and Averages) [2 Marks]

4. [Edexcel, 2015] Frequency Distributions (Totals and Averages) [5 Marks]

5. [Edexcel, 2009] Frequency Distributions (Totals and Averages) [2 Marks]
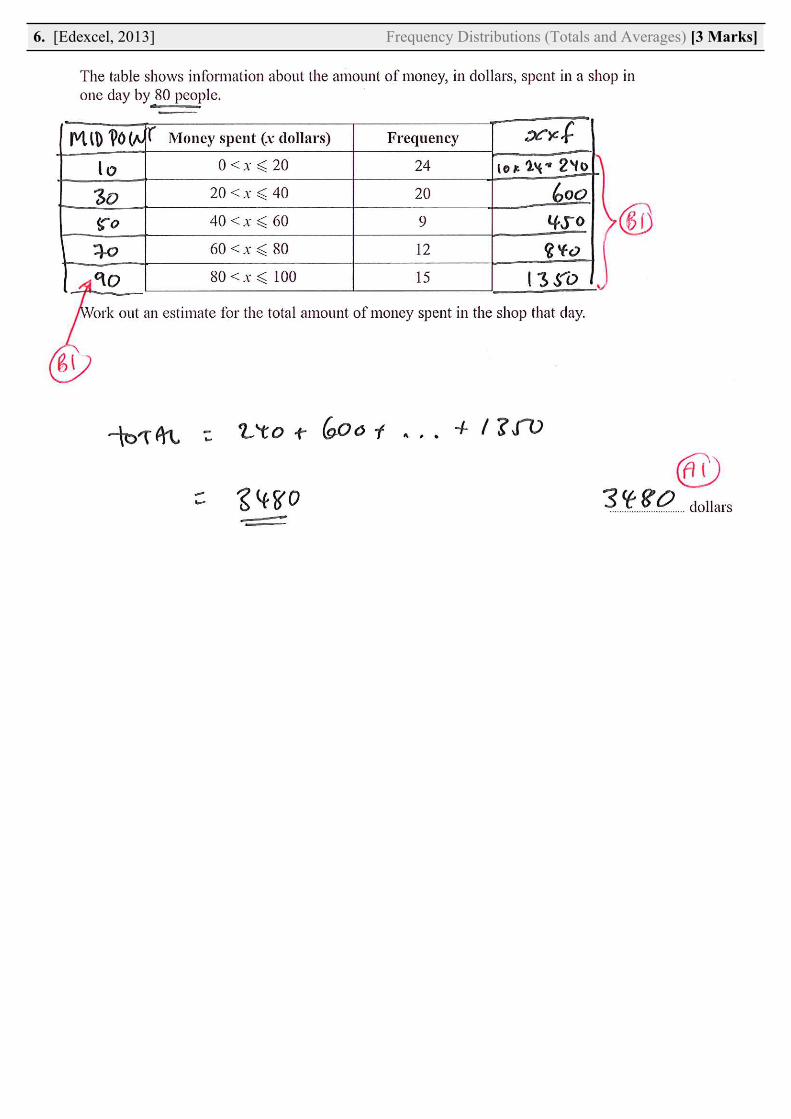
6. [Edexcel, 2013] Frequency Distributions (Totals and Averages) [3 Marks]

7. [Edexcel, 2013] Frequency Distributions (Totals and Averages) [4 Marks]

8. [Edexcel, 2016] Frequency Distributions (Totals and Averages) [5 Marks]

9. [Edexcel, 2016] Frequency Distributions (Totals and Averages) [7 Marks]
10. [Edexcel, 2012] Frequency Distributions (Totals and Averages) [6 Marks]

11. [Edexcel, 2013] Frequency Distributions (Totals and Averages) [5 Marks]

12. [Edexcel, 2005] Frequency Distributions (Totals and Averages) [6 Marks]

13. [Edexcel, 2004] Frequency Distributions (Totals and Averages) ਼͊ [8 Marks]

14. [Edexcel, 2007] Frequency Distributions (Totals and Averages) [7 Marks]
While reasonable endeavours have been used to verify the accuracy of these solutions, these
solutions are provided on an “as is” basis and no warranties are made of any kind, whether
express or implied, in relation to these solutions.
There is no warranty that these solutions will meet Your requirements or provide the results
which You want, or that they are complete, or that they are error-free. If You find anything
confusing within these solutions then it is Your responsibility to seek clarification from Your
teacher, tutor or mentor.
Please report any errors or omissions that You find*. These solutions will be updated to correct
errors that are discovered. It is recommended that You always check that You have the most up-
to-date version of these solutions.
The methods used in these solutions, where relevant, are methods which have been successfully
used with students. The method shown for a particular question is not always the only method
and there is no claim that the method that is used is necessarily the most efficient or ‘best’
method. From time to time, a solution to a question might be updated to show a different
method if it is judged that it is a good idea to do so.
Sometimes a method used in these solutions might be unfamiliar to You. If You are able to use a
different method to obtain the correct answer then You should consider to keep using your
existing method and not change to the method that is used here. However, the choice of method
is always up to You and it is often useful if You know more than one method to solve a particular
type of problem.
Within these solutions there is an indication of where marks might be awarded for each
question. B marks, M marks and A marks have been used in a similar, but not identical, way that
an exam board uses these marks within their mark schemes. This slight difference in the use of
these marking symbols has been done for simplicity and convenience. Sometimes B marks, M
marks and A marks have been interchanged, when compared to an examiners’ mark scheme and
sometimes the marks have been awarded for different aspects of a solution when compared to
an examiners’ mark scheme.
B1 – This is an unconditional accuracy mark (the specific number, word or phrase must be seen.
This type of mark cannot be given as a result of ‘follow through’).
M1 – This is a method mark. Method marks have been shown in places where they might be
awarded for the method that is shown. If You use a different method to get a correct answer,
then the same number of method marks would be awarded but it is not practical to show all
possible methods, and the way in which marks might be awarded for their use, within these
particular solutions. When appropriate, You should seek clarity and download the relevant
examiner mark scheme from the exam board’s web site.
A1 – These are accuracy marks. Accuracy marks are typically awarded after method marks. If the
correct answer is obtained, then You should normally (but not always) expect to be awarded all
of the method marks (provided that You have shown a method) and all of the accuracy marks.
Note that some questions contain the words ‘show that’, ‘show your working out’, or similar.
These questions require working out to be shown. Failure to show sufficient working out is likely
to result in no marks being awarded, even if the final answer is correct.
* The best way to inform of errors or omissions is a direct Twitter message to @Maths4Everyone
Note: “You/Your” means the person who is using these solutions.
Disclaimer