gdae1087mar-asia-pacific solar pv market outlook … · will witness a stable growth until 2020...
TRANSCRIPT

REFERENCE CODE GDAE1087MAR I PUBLICAT ION DATE FEBRUARY 2014
ASIA-PACIFIC SOLAR PHOTOVOLTAIC MARKET OUTLOOK TO 2030 – INSTALLED CAPACITY,
MARKET SIZE, RISK ANALYSIS, MARKET SATURATION AND COMPANY PROFILES

Asia-Pacific Solar Photovoltaic Market Outlook to 2030 – Installed Capacity, Market Size, Risk Analysis, Market Saturation and Company Profiles 2 © GlobalData. This report is a licensed product and is not to be copied, reproduced, shared or resold in any form.
ASIA-PACIFIC SOLAR PHOTOVOLTAIC MARKET OUTLOOK TO 2030 – INSTALLED CAPACITY, MARKET SIZE, RISK ANALYSIS,
MARKET SATURATION AND COMPANY PROFILES
Executive Summary
Global Solar Photovoltaic Installed Capacity will Witness a Stable Growth until 2020
Solar module installations witnessed immense
growth during the 2006–2013 period, with a Year-
on-Year (Y-o-Y) growth rate in cumulative capacity
of more than XX% each year from 2008 to 2013.
The annual installations increased from XX GW
(Gigawatts) in 2006 to an estimated XX GW in
2013, due to increasing economies of scale,
emerging technologies, and policy-based
governmental and institutional support for the
industry. The annual installations in 2012 were
marginally lower compared to the annual
installations in the preceding year, as the industry
started to adjust away from the initial spur of
growth, and also due to the reduction and/or
elimination of support from a few governments of
key geographies for the industry. In 2013, there
were increases in global annual installations driven
by China and Japan. Annual installations of a total
XX GW took place in 2013, which is around XX%
of the annual installations in 2012. For the 2013–
2025 period, annual installations are set to stabilize
within the range of XX GW and XX GW.
The following figure shows the annual and
cumulative capacity of the solar modules installed
globally for the 2006–2013 period, and the forecast
installations for the 2013–2025 period.
Solar Photovoltaic Module Market, Global, Installed Capacity (GW), 2006–2025
2006
2007
2008
2009
2010
2011
2012
2013
2014
2015
2016
2017
2018
2019
2020
2021
2022
2023
2024
2025
Y-o-
Y g
row
th ra
te (%
)
Inst
alle
d ca
paci
ty (G
W)
Annual installed capacity Cumulative installed capacity Y-o-Y growth rate Source: GlobalData; Alternative Energy eTrack [Accessed on December 31, 2013]
Asia-Pacific Region is the Hub for Global Solar Photovoltaic Market
Asia-Pacific is home to many developing countries,
including China and India, where there is
considerable growth in solar Photovoltaic (PV)
installations. Japan and Australia are other major
solar PV installations markets in the region. The
region is also the global center for the manufacture
of solar energy system, with Japan, China and
Taiwan being the major manufacturers and home
to some of the top global solar PV supplier
companies.
Asia-Pacific Solar Photovoltaic Market Outlook to 2030 – Installed Capacity, Market Size, Risk Analysis, Market Saturation and Company Profiles 4 © GlobalData. This report is a licensed product and is not to be copied, reproduced, shared or resold in any form.
ASIA-PACIFIC SOLAR PHOTOVOLTAIC MARKET OUTLOOK TO 2030 – INSTALLED CAPACITY, MARKET SIZE, RISK ANALYSIS,
MARKET SATURATION AND COMPANY PROFILES
Table of Contents
1 Table of Contents
1 Table of Contents ....................................................................................................................... 4
1.1 List of Tables ..................................................................................................................... 13
1.2 List of Figures .................................................................................................................... 18
2 Introduction ............................................................................................................................... 21
2.1 Solar Photovoltaic Technology .......................................................................................... 21
2.2 Types of Solar Modules ..................................................................................................... 21
2.2.1 Crystalline Silicon Modules ............................................................................................. 21
2.2.2 Thin-Film Technology ..................................................................................................... 22
2.2.3 New Emerging Solar Photovoltaic Technology ............................................................... 23
2.3 Report Guidance ............................................................................................................... 24
3 Solar Photovoltaic Market Outlook, Global ................................................................................ 25
3.1 Solar Photovoltaic Market, Global, Overview ..................................................................... 25
3.2 Solar Photovoltaic Market, Global, Installed Capacity, 2010–2030 .................................... 26
3.2.1 Solar Photovoltaic Market, Global, Share of Major Countries, 2013–2025 ...................... 28
3.2.2 Solar Photovoltaic Market, Global, End-User Segmentation, 2012–2017 ........................ 30
3.2.3 Solar Photovoltaic Market, Global, Segmentation by Grid Connection, 2012–2017 ........ 31
3.3 Solar Photovoltaic Market, Global, Power Generation, 2010–2030 .................................... 32
3.4 Solar Photovoltaic Market, Global, Average Installation Price, 2010–2015 ........................ 36
3.5 Solar Photovoltaic Module Market, Global, Module Price, 2010–2015 ............................... 37
3.6 Solar Photovoltaic Module Market, Global, Module Market Size, 2010–2015 .................... 39
3.7 Solar Photovoltaic Module Market, Global, Production Share of Major Module
Manufacturers, 2012 and 2013 .......................................................................................... 40
Asia-Pacific Solar Photovoltaic Market Outlook to 2030 – Installed Capacity, Market Size, Risk Analysis, Market Saturation and Company Profiles 5 © GlobalData. This report is a licensed product and is not to be copied, reproduced, shared or resold in any form.
ASIA-PACIFIC SOLAR PHOTOVOLTAIC MARKET OUTLOOK TO 2030 – INSTALLED CAPACITY, MARKET SIZE, RISK ANALYSIS,
MARKET SATURATION AND COMPANY PROFILES
Table of Contents
3.8 Solar Photovoltaic Module Market, Upcoming Technologies.............................................. 45
3.8.1 Rise of Hybrid Offerings in Solar Industry ....................................................................... 45
3.8.2 Hybrid Benefits – Reliability and Efficiency at Least Cost................................................ 46
3.8.3 Concentrated Photovoltaic Technology – A Strong Competitor of Solar Photovoltaic ..... 46
3.8.4 Energy Storage Systems ................................................................................................ 50
4 Solar Photovoltaic Market Outlook, Asia-Pacific, 2010–2030 .................................................... 54
4.1 Solar Photovoltaic Market, Asia-Pacific, Overview ............................................................. 54
4.2 Solar Photovoltaic Market, Asia-Pacific, Installed Capacity, 2010–2030 ............................ 54
4.2.1 Solar Photovoltaic Market, Asia-Pacific, Share of Major Countries, 2013–2025 .............. 57
4.2.2 Solar Photovoltaic Market, Asia-Pacific, End-user Segmentation, 2012–2017 ................ 58
4.2.3 Solar Photovoltaic Market, Asia-Pacific, Segmentation by Grid Connection, 2012–2017 60
4.3 Solar Photovoltaic Market, Asia-Pacific, Power Generation, 2010–2030............................ 62
4.4 Solar Photovoltaic Market, Asia-Pacific, Average Installation Price, 2010–2015 ................ 64
4.5 Solar Photovoltaic Module Market, Asia-Pacific, Module Price, 2010–2015 ....................... 66
4.6 Solar Photovoltaic Module Market, Asia-Pacific, Module Market Size, 2010–2015 ............ 68
4.7 Solar Photovoltaic Market, Asia-Pacific, Regulation and Policies Impacting the Market,
2013 .................................................................................................................................. 69
5 Solar Photovoltaic Market Outlook, China, 2010–2030 ............................................................. 75
5.1 Solar Photovoltaic Market, China, Overview ...................................................................... 75
5.2 Solar Photovoltaic Market, China, Installed Capacity, 2010–2030 ..................................... 76
5.2.1 Solar Photovoltaic Market Outlook, China, Outlook of Major Provinces, 2011 ................. 78
5.2.2 Solar Photovoltaic Market, China, End-user Segmentation, 2012–2017 ......................... 83
5.2.3 Solar Photovoltaic Market, China, Segmentation by Grid Connection, 2012–2017 ......... 84
Asia-Pacific Solar Photovoltaic Market Outlook to 2030 – Installed Capacity, Market Size, Risk Analysis, Market Saturation and Company Profiles 6 © GlobalData. This report is a licensed product and is not to be copied, reproduced, shared or resold in any form.
ASIA-PACIFIC SOLAR PHOTOVOLTAIC MARKET OUTLOOK TO 2030 – INSTALLED CAPACITY, MARKET SIZE, RISK ANALYSIS,
MARKET SATURATION AND COMPANY PROFILES
Table of Contents
5.3 Solar Photovoltaic Market, China, Power Generation, 2010–2030 ..................................... 86
5.4 Solar Photovoltaic Market, China, Average Installation Price, 2010–2015 ......................... 88
5.5 Solar Photovoltaic Module Market, China, Module Price, 2010–2015 ................................ 90
5.6 Solar Photovoltaic Module Market, China, Module Market Size, 2010–2015 ..................... 91
5.7 Solar Photovoltaic Module Market, China, Production Share of Major Module
Manufacturers, 2012 and 2013 .......................................................................................... 93
5.8 Solar Photovoltaic Market, China, Regulation and Policies Impacting the Market, 2013 .... 97
5.8.1 Policies Exceeding Chinese Solar Industry Expectations ................................................ 98
5.8.2 Renewable Energy Law ................................................................................................ 100
5.8.3 International Science and Technology Cooperation Program for New and Renewable
Energy......................................................................................................................... 104
5.8.4 Medium and Long-term Development Plan for Renewable Energy ............................... 105
5.8.5 The 12th Five-year Plan ................................................................................................. 105
5.8.6 New Carbon Intensity Target ........................................................................................ 106
5.8.7 Golden Sun Program .................................................................................................... 106
5.8.8 The Building-Integrated Photovoltaic Subsidy Program ................................................ 107
5.8.9 Feed-in Tariff for Solar Projects .................................................................................... 108
5.8.10 Solar Photovoltaic Bidding Program.............................................................................. 108
5.8.11 Subsidies for Solar Photovoltaic in Rural Areas ............................................................ 108
5.8.12 R&D Support for Solar Photovoltaic .............................................................................. 109
5.8.13 Shandong Province Energy Fund ................................................................................. 110
5.8.14 Shandong Provinces Sunshine Plan ............................................................................. 110
6 Solar Photovoltaic Market Outlook, Japan, 2010–2030 ........................................................... 111

Asia-Pacific Solar Photovoltaic Market Outlook to 2030 – Installed Capacity, Market Size, Risk Analysis, Market Saturation and Company Profiles 7 © GlobalData. This report is a licensed product and is not to be copied, reproduced, shared or resold in any form.
ASIA-PACIFIC SOLAR PHOTOVOLTAIC MARKET OUTLOOK TO 2030 – INSTALLED CAPACITY, MARKET SIZE, RISK ANALYSIS,
MARKET SATURATION AND COMPANY PROFILES
Table of Contents
6.1 Solar Photovoltaic Market, Japan, Overview .................................................................... 111
6.2 Solar Photovoltaic Market, Japan, Installed Capacity, 2010–2030 ................................... 112
6.2.1 Solar Photovoltaic Market, Japan, End-user Segmentation, 2012–2017 ....................... 114
6.2.2 Solar Photovoltaic Market, Japan, Segmentation by Grid Connection, 2012–2017 ....... 115
6.3 Solar Photovoltaic Market, Japan, Power Generation, 2010–2030 .................................. 117
6.4 Solar Photovoltaic Market, Japan, Average Installation Price, 2010–2015 ....................... 119
6.5 Solar Photovoltaic Module Market, Japan, Module Price, 2010–2015 .............................. 121
6.6 Solar Photovoltaic Module Market, Japan, Module Market Size, 2010–2015 ................... 122
6.7 Solar Photovoltaic Module Market, Japan, Production Share of Major Module
Manufacturers, 2012 and 2013 ........................................................................................ 123
6.8 Solar Photovoltaic Market, Japan, Regulation and Policies Impacting the Market, 2013 .. 126
6.8.1 Renewables Portfolio Standard System ........................................................................ 126
6.8.2 Feed-in Tariffs for Renewable Energy........................................................................... 128
6.8.3 Support for Deployment of New and Renewable Energy .............................................. 129
6.8.4 New Renewable Energy Target .................................................................................... 130
6.8.5 New 2010 Renewable Energy Targets .......................................................................... 130
6.8.6 Solar Power in Government Office Buildings ................................................................ 130
6.8.7 Subsidy for Residential Photovoltaic Systems .............................................................. 131
6.8.8 New Purchase System for Solar Power Generated Electricity....................................... 131
6.8.9 Fiscal and Tax Incentives for Solar Photovoltaic Generation ........................................ 131
6.8.10 Local Government Initiatives ......................................................................................... 132
7 Solar Photovoltaic Market Outlook, South Korea, 2010–2030 ................................................. 133
7.1 Solar Photovoltaic Market, South Korea, Overview .......................................................... 133

Asia-Pacific Solar Photovoltaic Market Outlook to 2030 – Installed Capacity, Market Size, Risk Analysis, Market Saturation and Company Profiles 8 © GlobalData. This report is a licensed product and is not to be copied, reproduced, shared or resold in any form.
ASIA-PACIFIC SOLAR PHOTOVOLTAIC MARKET OUTLOOK TO 2030 – INSTALLED CAPACITY, MARKET SIZE, RISK ANALYSIS,
MARKET SATURATION AND COMPANY PROFILES
Table of Contents
7.2 Solar Photovoltaic Market, South Korea, Installed Capacity, 2010–2030 ......................... 134
7.2.1 Solar Photovoltaic Market, South Korea, End-user Market Shares, 2012–2017 ............ 135
7.2.2 Solar Photovoltaic Market, South Korea, Segmentation by Grid Connection, 2012–2017
.................................................................................................................................... 137
7.3 Solar Photovoltaic Market, South Korea, Power Generation, 2010–2030 ........................ 139
7.4 Solar Photovoltaic Market, South Korea, Average Installation Price, 2010–2015 ............. 141
7.5 Solar Photovoltaic Module Market, South Korea, Module Price, 2010–2015 .................... 143
7.6 Solar Photovoltaic Module Market, South Korea, Module Market Size, 2010–2015 ......... 144
7.7 Solar Photovoltaic Module Market, South Korea, Production Share of Major Module
Manufacturers, 2012 and 2013 ........................................................................................ 146
7.8 Solar Photovoltaic Market, South Korea, Regulation and Policies Impacting the Market,
2013 ................................................................................................................................ 148
7.8.1 National Energy Plan 2008–2030 ................................................................................. 148
7.8.2 One Million Green Homes Program .............................................................................. 148
7.8.3 Feed-in Tariff Program .................................................................................................. 148
7.8.4 Renewable Portfolio Standards..................................................................................... 150
8 Competitiveness of Solar Photovoltaic against Other Power Sources ..................................... 151
8.1 Renewable Power Market, Global, LCOE Comparison of Power-Generating Sources, 2013 .
..................................................................................................................................... 151
8.2 Solar Photovoltaic vs. Emerging Fuel Sources ................................................................ 153
8.2.1 Shale Gas in the US ..................................................................................................... 153
8.2.2 Shale Gas in China ....................................................................................................... 156
8.3 Global Solar Photovoltaic Market and Effect of Oil Price .................................................. 157
8.4 Nuclear Zero and Possible Solar Growth ......................................................................... 158

Asia-Pacific Solar Photovoltaic Market Outlook to 2030 – Installed Capacity, Market Size, Risk Analysis, Market Saturation and Company Profiles 9 © GlobalData. This report is a licensed product and is not to be copied, reproduced, shared or resold in any form.
ASIA-PACIFIC SOLAR PHOTOVOLTAIC MARKET OUTLOOK TO 2030 – INSTALLED CAPACITY, MARKET SIZE, RISK ANALYSIS,
MARKET SATURATION AND COMPANY PROFILES
Table of Contents
8.4.1 US Market..................................................................................................................... 159
8.4.2 France, No Nuclear Zero .............................................................................................. 160
8.4.3 Germany ....................................................................................................................... 160
8.4.4 Government Subsidies ................................................................................................. 163
8.5 Cost Competition, c-Si Panel Dumping ............................................................................ 164
8.6 Solar Photovoltaic Market, US, Dumping and Anti-dumping ............................................ 166
8.7 Europe, Dumping and Anti-dumping ................................................................................ 168
8.8 Other Countries, Dumping and Anti-dumping .................................................................. 170
9 Solar Photovoltaic – Risk Analysis .......................................................................................... 171
9.1 Solar Photovoltaic Module Performance – 20-Year Warranty .......................................... 171
9.2 Solar Photovoltaic Module Performance Directly Impacts Project Cash Flow .................. 171
9.3 Key Players Offering Limited Warranties to Create Demand and Gain Creditability ......... 171
9.4 Thin-Film has a Higher Performance Risk ....................................................................... 172
9.5 Solar Photovoltaic Module Performance has a Historically Proven Record ...................... 172
9.6 Established Players and Developed Markets have Lower Performance Risk ................... 173
9.7 Fine Print is Important Even if the Product is under Warranty .......................................... 173
10 Solar Photovoltaic Market Saturation ...................................................................................... 174
10.1 Saturation for Solar Sub-technology ................................................................................ 174
10.1.1 Solar Module Price Saturation ...................................................................................... 174
10.1.2 Solar Module Efficiency Saturation ............................................................................... 176
10.1.3 Solar Module Efficiency-to-Price Ratio .......................................................................... 176
10.2 Saturation in Key Solar Photovoltaic Market .................................................................... 177
10.2.1 Europe .......................................................................................................................... 177
Asia-Pacific Solar Photovoltaic Market Outlook to 2030 – Installed Capacity, Market Size, Risk Analysis, Market Saturation and Company Profiles 10 © GlobalData. This report is a licensed product and is not to be copied, reproduced, shared or resold in any form.
ASIA-PACIFIC SOLAR PHOTOVOLTAIC MARKET OUTLOOK TO 2030 – INSTALLED CAPACITY, MARKET SIZE, RISK ANALYSIS,
MARKET SATURATION AND COMPANY PROFILES
Table of Contents
10.2.2 Americas ...................................................................................................................... 177
10.2.3 Asia-Pacific ................................................................................................................... 178
10.2.4 Middle East and Africa .................................................................................................. 178
10.3 Is the Photovoltaic Market Sustainable? .......................................................................... 180
10.3.1 Commercial and Eco-sustainability of Solar Photovoltaic Market .................................. 180
11 Solar Photovoltaic Market Outlook, Company Profiles ............................................................ 182
11.1 Hanergy Holding Group Ltd, Company Review................................................................ 182
11.1.1 Company Overview ...................................................................................................... 182
11.1.2 Hanergy Holding Group Ltd, Solar Business ................................................................. 182
11.1.3 Hanergy Holding Group Ltd, Business Strategy ............................................................ 184
11.2 Yingli Green Energy Holding Company Limited ............................................................... 185
11.2.1 Company Overview ...................................................................................................... 185
11.2.2 Yingli Green Energy Holding Company Limited, Business Description ......................... 185
11.2.3 Yingli Green Energy Holding Company Limited – Corporate Strategy........................... 187
11.3 Solar Frontier KK, Company Profile ................................................................................. 188
11.3.1 Company Overview ...................................................................................................... 188
11.3.2 Solar Frontier KK, Business Description ....................................................................... 188
11.3.3 Solar Frontier KK, Corporate Strategy .......................................................................... 190
11.4 TSMC Solar Ltd, Company Review ................................................................................. 190
11.4.1 Company Overview ...................................................................................................... 190
11.4.2 TSMC Solar Ltd, Corporate Strategy ............................................................................ 191
11.5 Hanwha Q Cells GmbH, Company Review ...................................................................... 191
11.5.1 Company Overview ...................................................................................................... 191
Asia-Pacific Solar Photovoltaic Market Outlook to 2030 – Installed Capacity, Market Size, Risk Analysis, Market Saturation and Company Profiles 11 © GlobalData. This report is a licensed product and is not to be copied, reproduced, shared or resold in any form.
ASIA-PACIFIC SOLAR PHOTOVOLTAIC MARKET OUTLOOK TO 2030 – INSTALLED CAPACITY, MARKET SIZE, RISK ANALYSIS,
MARKET SATURATION AND COMPANY PROFILES
Table of Contents
11.5.2 Hanwha Q Cells GmbH, Solar Business ....................................................................... 191
11.5.3 Hanwha Q Cells GmbH, Business Strategy .................................................................. 193
11.6 Avancis GmbH & Co. KG, Company Profile ..................................................................... 193
11.6.1 Company Overview ...................................................................................................... 193
11.6.2 Avancis GmbH & Co. KG, Solar Business .................................................................... 194
11.6.3 Avancis GmbH & Co. KG, Business Strategy ............................................................... 195
11.7 Ascent Solar Technologies Inc., Company Review .......................................................... 196
11.7.1 Company Overview ...................................................................................................... 196
11.7.2 Ascent Solar Technologies Inc., Solar Business ........................................................... 196
11.7.3 Ascent Solar Technologies Inc., Business Strategy ...................................................... 197
11.8 First Solar Inc., Company Review .................................................................................... 197
11.8.1 Company Overview ...................................................................................................... 197
11.8.2 First Solar Inc., Solar Business ..................................................................................... 197
11.8.3 First Solar Inc., Business Strategy ................................................................................ 200
11.9 Sharp Corporation, Company Review .............................................................................. 202
11.9.1 Company Overview ...................................................................................................... 202
11.9.2 Sharp Corporation – Solar Business ............................................................................. 202
11.9.3 Sharp Corporation, Business Strategy .......................................................................... 203
12 Appendix................................................................................................................................. 204
12.1 Abbreviations ................................................................................................................... 204
12.2 Bibliography ..................................................................................................................... 206
12.3 Market Definitions ............................................................................................................ 208
12.4 Methodology .................................................................................................................... 208
Asia-Pacific Solar Photovoltaic Market Outlook to 2030 – Installed Capacity, Market Size, Risk Analysis, Market Saturation and Company Profiles 12 © GlobalData. This report is a licensed product and is not to be copied, reproduced, shared or resold in any form.
ASIA-PACIFIC SOLAR PHOTOVOLTAIC MARKET OUTLOOK TO 2030 – INSTALLED CAPACITY, MARKET SIZE, RISK ANALYSIS,
MARKET SATURATION AND COMPANY PROFILES
Table of Contents
12.4.1 Coverage ...................................................................................................................... 209
12.4.2 Secondary Research .................................................................................................... 209
12.4.3 Primary Research ......................................................................................................... 210
12.4.4 Assumptions ................................................................................................................. 210
12.5 Disclaimer........................................................................................................................ 211

Asia-Pacific Solar Photovoltaic Market Outlook to 2030 – Installed Capacity, Market Size, Risk Analysis, Market Saturation and Company Profiles 13 © GlobalData. This report is a licensed product and is not to be copied, reproduced, shared or resold in any form.
ASIA-PACIFIC SOLAR PHOTOVOLTAIC MARKET OUTLOOK TO 2030 – INSTALLED CAPACITY, MARKET SIZE, RISK ANALYSIS,
MARKET SATURATION AND COMPANY PROFILES
Table of Contents
1.1 List of Tables
Table 1: Solar Photovoltaic Market, Global, Installed Capacity, 2010–2030 .................................................. 28
Table 2: Solar Photovoltaic Market, Global, Share of Major Countries (%), 2013–2025 ................................ 29
Table 3: Solar Photovoltaic Market, Global, End-User Segmentation (%), 2012–2017 .................................. 30
Table 4: Solar Photovoltaic Market, Global, End-User Segmentation (GW), 2012–2017 ............................... 31
Table 5: Solar Photovoltaic Market, Global, Segmentation by Grid Connection (%), 2012–2017 ................... 32
Table 6: Solar Photovoltaic Market, Global, Power Generation (TWh), 2010–2030....................................... 34
Table 7: Solar Photovoltaic Market, Global, Share and Growth Rate of Power Generation, 2010–2025 ........ 35
Table 8: Solar Photovoltaic Market, Global, Average Installation Price ($/W), 2010–2015 ............................ 37
Table 9: Solar Photovoltaic Market, Global, Average Module Price ($/W), 2010–2015.................................. 38
Table 10: Solar Photovoltaic Market, Global, Module Market Size, 2010–2015 ............................................... 40
Table 11: Solar Photovoltaic Module Market, Global, Production Share of Major Crystalline Module
Manufacturers (%), 2012 and 2013 ................................................................................................ 42
Table 12: Solar Photovoltaic Module Market, Global, Production Share of Major Thin-Film Module
Manufacturers (%), 2012 and 2013 ................................................................................................ 44
Table 13: Solar Photovoltaic Module Market, Global, Production of Major Solar Photovoltaic Module
Manufacturers (GW), 2012 ............................................................................................................. 44
Table 14: Solar Photovoltaic Module Market, Hybrid Offerings, 1998–2007 .................................................... 45
Table 15: High Concentrated Photovoltaic, Global, Efficiency (%), 2006–2020 ............................................... 50
Table 16: Energy Storage Technologies, Power Subsystem Cost and Efficiency (%), 2013 ............................ 52
Table 17: Subsystem Cost, Power Vs. Energy Storage, 2013 ........................................................................ 53
Table 18: Solar Photovoltaic Market, Asia-Pacific, Installed Capacity, 2010–2030 .......................................... 56
Table 19: Solar Photovoltaic Market, Asia-Pacific, Shares of Major Countries (%), 2013–2025 ...................... 58
Table 20: Solar Photovoltaic Market, Asia-Pacific, End-user Share (%), 2012–2017 ...................................... 59
Table 21: Solar Photovoltaic Market, Asia-Pacific, End-user Share (GW), 2012–2017 ................................... 60

Asia-Pacific Solar Photovoltaic Market Outlook to 2030 – Installed Capacity, Market Size, Risk Analysis, Market Saturation and Company Profiles 14 © GlobalData. This report is a licensed product and is not to be copied, reproduced, shared or resold in any form.
ASIA-PACIFIC SOLAR PHOTOVOLTAIC MARKET OUTLOOK TO 2030 – INSTALLED CAPACITY, MARKET SIZE, RISK ANALYSIS,
MARKET SATURATION AND COMPANY PROFILES
Table of Contents
Table 22: Solar Photovoltaic Market, Asia-Pacific, Share by Grid Connection (%), 2012–2017 ....................... 61
Table 23: Solar Photovoltaic Market, Asia-Pacific, Power Generation (TWh), 2010–2030 .............................. 63
Table 24: Solar Photovoltaic Market, Asia-Pacific, Share and Growth Rate of Power Generation, 2010–2025 64
Table 25: Solar Photovoltaic Market, Asia-Pacific, Average Installation Price by Country ($/W), 2010–2015 .. 65
Table 26: Solar Photovoltaic Market, Asia-Pacific, Average Installation Price ($/W), 2010–2015 .................... 66
Table 27: Solar Photovoltaic Market, Asia-Pacific, Average Module Price ($/W), 2010–2015 ......................... 67
Table 28: Solar Photovoltaic Market, Asia-Pacific, Module Market Size by Country ($bn), 2010–2015............ 69
Table 29: Solar Photovoltaic Market, Asia-Pacific, Module Market Size, 2010–2015 ...................................... 69
Table 30: Renewable Energy Policy Framework, Asia-Pacific, Renewable Energy Policy Instruments by
Country .......................................................................................................................................... 70
Table 31: Renewable Energy Policy Framework, Asia-Pacific, Feed-in Tariff for Promoting Renewable Energy
Sources by Country ....................................................................................................................... 72
Table 32: Renewable Energy Policy Framework, Asia-Pacific, Targets for Addition of Various Renewable
Energy Technology by Country ...................................................................................................... 73
Table 33: Solar Photovoltaic Market, China, Installed Capacity, 2010–2030 ................................................... 78
Table 34: SolarPhotovoltaic Market, China, Annual Capacity of Utility-scale Projects (MW), 2011 .................. 79
Table 35: Solar Photovoltaic Market, Expected Capacity Addition (MW), 2013 ............................................... 81
Table 36: Solar Photovoltaic Market, Annual Targets by Province (MW), 2014 ............................................... 82
Table 37: Solar Photovoltaic Market, China, End-user Share (%), 2012–2017 ............................................... 84
Table 38: Solar Photovoltaic Market, China, End-user Share (MW), 2012–2017 ............................................ 84
Table 39: Solar Photovoltaic Market, China, Segmentation by Grid Connection (%), 2012–2017.................... 85
Table 40: Solar Photovoltaic Market, China, Power Generation (TWh), 2010–2030 ....................................... 87
Table 41: Solar Photovoltaic Market, China, Share and Growth Rate of Power Generation, 2010–2025 ......... 88
Table 42: Solar Photovoltaic Market, China, Average Installation Price ($/W), 2010–2015 ............................. 89
Table 43: Solar Photovoltaic Market, China, Average Module Price ($/W), 2010–2015 .................................. 91
Asia-Pacific Solar Photovoltaic Market Outlook to 2030 – Installed Capacity, Market Size, Risk Analysis, Market Saturation and Company Profiles 15 © GlobalData. This report is a licensed product and is not to be copied, reproduced, shared or resold in any form.
ASIA-PACIFIC SOLAR PHOTOVOLTAIC MARKET OUTLOOK TO 2030 – INSTALLED CAPACITY, MARKET SIZE, RISK ANALYSIS,
MARKET SATURATION AND COMPANY PROFILES
Table of Contents
Table 44: Solar Photovoltaic Market, China, Module Market Size ($bn), 2010–2015 ...................................... 92
Table 45: Solar Photovoltaic Module Market, China, Production Share of Major Crystalline Module
Manufacturers (%), 2012 and 2013 ................................................................................................ 95
Table 46: Solar Photovoltaic Module Market, China, Production Share of Major Thin-film Module
Manufacturers (%), 2012 and 2013 ................................................................................................ 96
Table 47: Solar Photovoltaic Module Market, China, Production of Major Solar Photovoltaic Module
Manufacturer (MW), 2012 .............................................................................................................. 97
Table 48: Solar Photovoltaic Project Subsidies ($/kWh) ................................................................................. 99
Table 49: Renewable Energy Law, China, Major Regulations....................................................................... 101
Table 50: Renewable Energy Targets, China, 2015 and 2020 ...................................................................... 102
Table 51: Solar Photovoltaic Market, Japan, Installed Capacity, 2010–2030 ................................................ 113
Table 52: Solar Photovoltaic Market, Japan, End-user Segmentation (%), 2012–2017 ................................. 115
Table 53: Solar Photovoltaic Market, Japan, End-user Segmentation (MW), 2012–2017 .............................. 115
Table 54: Solar Photovoltaic Market, Japan, Segmentation by Grid Connection (%), 2012–2017 ................. 116
Table 55: Solar Photovoltaic Market, Japan, Power Generation (TWh), 2010–2030 ..................................... 118
Table 56: Solar Photovoltaic Market, Japan, Share and Growth Rate of Power Generation, 2010–2025 ...... 119
Table 57: Solar Photovoltaic Market, Japan, Average Installation Price ($/W), 2010–2015 ........................... 120
Table 58: Solar Photovoltaic Market, Japan, Average Module Price ($/W), 2010–2015 ................................ 122
Table 59: Solar Photovoltaic Market, Japan, Module Market Size ($bn), 2010–2015 .................................... 123
Table 60: Solar Photovoltaic Module Market, Japan, Production Share of Major Crystalline Module
Manufacturers (%), 2012 and 2013 .............................................................................................. 124
Table 61: Solar Photovoltaic Module Market, Japan, Production Share of Major Thin-film Module
Manufacturers (%), 2012 and 2013 .............................................................................................. 125
Table 62: Solar Photovoltaic Module Market, Japan, Production of Major Solar Photovoltaic Module
Manufacturers (MW), 2012 ........................................................................................................... 126
Table 63: Utilization Targets for New Energy, Japan, Target Capacity (TWh), 2003–2014............................ 127

Asia-Pacific Solar Photovoltaic Market Outlook to 2030 – Installed Capacity, Market Size, Risk Analysis, Market Saturation and Company Profiles 16 © GlobalData. This report is a licensed product and is not to be copied, reproduced, shared or resold in any form.
ASIA-PACIFIC SOLAR PHOTOVOLTAIC MARKET OUTLOOK TO 2030 – INSTALLED CAPACITY, MARKET SIZE, RISK ANALYSIS,
MARKET SATURATION AND COMPANY PROFILES
Table of Contents
Table 64: Solar Photovoltaic Market, South Korea, Installed Capacity (GW), 2010–2030 ............................. 135
Table 65: Solar Photovoltaic Market, South Korea, End-user Market Shares, 2012–2017 ............................ 136
Table 66: Solar Photovoltaic Market, South Korea, End-user Production (MW), 2012–2017 ......................... 137
Table 67: Solar Photovoltaic Market, Republic of Korea, Share by Grid Connection (%), 2012–2017 ........... 138
Table 68: Solar Photovoltaic Market, South Korea, Power Generation (TWh), 2010–2030 ........................... 140
Table 69: Solar Photovoltaic Market, South Korea, Share and Growth Rate of Power Generation, 2010–2025
.................................................................................................................................................... 141
Table 70: Solar Photovoltaic Market, South Korea, Average Installation Price ($/W), 2010–2015 ................. 142
Table 71: Solar Photovoltaic Market, South Korea, Average Module Price ($/W), 2010–2015 ...................... 144
Table 72: Solar Photovoltaic Market, Republic of Korea, Module Market Size ($m), 2010–2015 ................... 145
Table 73: Solar Photovoltaic Module Market, South Korea, Production Share of Major Crystalline Module
Manufacturers (%), 2012 and 2013 .............................................................................................. 147
Table 74: Solar Photovoltaic Module Market, South Korea, Production of Major Solar Photovoltaic Module
Manufacturer (MW), 2012 ............................................................................................................ 147
Table 75: Solar Photovoltaic Feed-in Tariff, South Korea, KRW/kWh, 2010–2011 ........................................ 149
Table 76: Renewable Portfolio Standards, South Korea, Targets (%), 2012–2022 ....................................... 150
Table 77: Renewable Power Market, Global, Levelized Cost of Energy of Power-Generating Sources, 2013 151
Table 78: Renewable Power Market, Global, Levelized Cost of Energy of Power-Generating Sources ($/kWh),
2013 ............................................................................................................................................ 153
Table 79: Nuclear Power Market, Germany, Plants Scheduled to Shut Down (GW), 2015–2022 .................. 162
Table 80: Solar Photovoltaic Market, US, Bankrupt and Acquired Solar Photovoltaic Companies, 2009–2012
.................................................................................................................................................... 167
Table 81: Solar Photovoltaic Market, Europe, Bankrupt and Acquired Solar Photovoltaic Companies, 2009–
2012 ............................................................................................................................................ 169
Table 82: Solar Photovoltaic Market, Price Saturation by Sub-technology ($/W), 2013–2018 ....................... 175
Table 83: Solar Photovoltaic Market, Market Share by Technology (%), 2013–2030 ..................................... 177

Asia-Pacific Solar Photovoltaic Market Outlook to 2030 – Installed Capacity, Market Size, Risk Analysis, Market Saturation and Company Profiles 17 © GlobalData. This report is a licensed product and is not to be copied, reproduced, shared or resold in any form.
ASIA-PACIFIC SOLAR PHOTOVOLTAIC MARKET OUTLOOK TO 2030 – INSTALLED CAPACITY, MARKET SIZE, RISK ANALYSIS,
MARKET SATURATION AND COMPANY PROFILES
Table of Contents
Table 84: Solar Photovoltaic Market, Market Saturation by Region (MW), 2010–2030 .................................. 179
Table 85: Hanergy Holding Group Ltd, Business Strategy ............................................................................ 184
Table 86: Yingli Green Energy Holding Company Limited, Corporate Strategy ............................................. 187
Table 87: Solar Frontier KK, Corporate Strategy .......................................................................................... 190
Table 88: TSMC Solar Ltd, Corporate Strategy ............................................................................................ 191
Table 89: Hanwha Q Cells GmbH, Business Strategy .................................................................................. 193
Table 90: Avancis GmbH & Co. KG, Business Strategy ............................................................................... 195
Table 91: Ascent Solar Technologies Inc., Business Strategy ...................................................................... 197
Table 92: First Solar Inc., Business Strategy ................................................................................................ 200
Table 93: Sharp Corporation, Business Strategy .......................................................................................... 203
Table 94: Abbreviations ............................................................................................................................... 204

Asia-Pacific Solar Photovoltaic Market Outlook to 2030 – Installed Capacity, Market Size, Risk Analysis, Market Saturation and Company Profiles 18 © GlobalData. This report is a licensed product and is not to be copied, reproduced, shared or resold in any form.
ASIA-PACIFIC SOLAR PHOTOVOLTAIC MARKET OUTLOOK TO 2030 – INSTALLED CAPACITY, MARKET SIZE, RISK ANALYSIS,
MARKET SATURATION AND COMPANY PROFILES
Table of Contents
1.2 List of Figures
Figure 1: Solar Photovoltaic Market, Global, Installed Capacity and Year-on-Year Growth, 2010–2030 ....... 27
Figure 2: Solar Photovoltaic Market, Global, Share of Major Countries (%), 2013–2025 ............................... 29
Figure 3: Solar Photovoltaic Market, Global, End-User Segmentation (%), 2012–2017 ................................ 30
Figure 4: Solar Photovoltaic Market, Global, Segmentation by Grid Connection (%), 2012–2017 ................. 31
Figure 5: Solar Photovoltaic Market, Global, Power Generation (TWh), 2010–2030 ..................................... 33
Figure 6: Solar Photovoltaic Market, Global, Average Installation Price ($/W), 2010–2015 ........................... 36
Figure 7: Solar Photovoltaic Market, Global, Module Price ($/W), 2010–2015 .............................................. 38
Figure 8: Solar Photovoltaic Market, Global, Module Market Size ($bn), 2010–2015 .................................... 39
Figure 9: Solar Photovoltaic Module Market, Global, Production Share of Major Crystalline Module
Manufacturers (%), 2012 and 2013 ............................................................................................... 41
Figure 10: Solar Photovoltaic Module Market, Global, Production Share of Major Thin-Film Module
Manufacturers (%), 2012 and 2013 ............................................................................................... 43
Figure 11: High Concentrated Photovoltaic, Global, System Efficiency (%), 2006–2020 ................................. 49
Figure 12: Energy Storage Technologies, Power Subsystem Cost and Efficiency (%), 2013........................... 51
Figure 13: Solar Photovoltaic Market, Asia-Pacific, Installed Capacity, 2010–2030 ......................................... 55
Figure 14: Solar Photovoltaic Market, Asia-Pacific, Share of Major Countries (%), 2013–2025 ....................... 57
Figure 15: Solar Photovoltaic Market, Asia-Pacific, End-user Share (%), 2012–2017 ..................................... 59
Figure 16: Solar Photovoltaic Market, Asia-Pacific, Share by Grid Connection (%), 2012–2017 ...................... 61
Figure 17: Solar Photovoltaic Market, Asia-Pacific, Power Generation (TWh), 2010–2030 ............................. 62
Figure 18: Solar Photovoltaic Market, Asia-Pacific, Average Installation Price ($/W), 2010–2015 ................... 65
Figure 19: Solar Photovoltaic Market, Asia-Pacific, Average Module Price ($/W), 2010–2015......................... 67
Figure 20: Solar Photovoltaic Market, Asia-Pacific, Module Market Size ($bn), 2010–2015 ............................ 68
Figure 21: Solar Photovoltaic Market, China, Installed Capacity (GW), 2010–2030 ........................................ 77
Figure 22: SolarPhotovoltaic Market, China, Annual Capacity of Utility-scale Projects (MW), 2011 ................. 79
Asia-Pacific Solar Photovoltaic Market Outlook to 2030 – Installed Capacity, Market Size, Risk Analysis, Market Saturation and Company Profiles 19 © GlobalData. This report is a licensed product and is not to be copied, reproduced, shared or resold in any form.
ASIA-PACIFIC SOLAR PHOTOVOLTAIC MARKET OUTLOOK TO 2030 – INSTALLED CAPACITY, MARKET SIZE, RISK ANALYSIS,
MARKET SATURATION AND COMPANY PROFILES
Table of Contents
Figure 23: Solar Photovoltaic Market, China, Expected Capacity Addition (MW), 2013 ................................... 80
Figure 24: Solar Photovoltaic Market, China, Annual Target by Province (MW), 2014 .................................... 82
Figure 25: Solar Photovoltaic Market, China, End-user Share (%), 2012–2017 .............................................. 83
Figure 26: Solar Photovoltaic Market, China, Segmentation by Grid Connection (%), 2012–2017 ................... 85
Figure 27: Solar Photovoltaic Market, China, Power Generation (TWh), 2010–2030 ....................................... 86
Figure 28: Solar Photovoltaic Market, China, Average Installation Price ($/W), 2010–2015 ............................ 89
Figure 29: Solar Photovoltaic Market, China, Average Module Price ($/W), 2010–2015.................................. 90
Figure 30: Solar Photovoltaic Market, China, Module Market Size ($bn), 2010–2015 ..................................... 92
Figure 31: Solar Photovoltaic Module Market, China, Production Share of Major Crystalline Module
Manufacturers (%), 2012 and 2013 ............................................................................................... 94
Figure 32: Solar Photovoltaic Module Market, China, Production Share of Major Thin-film Module
Manufacturers (%), 2012 and 2013 ............................................................................................... 96
Figure 33: Solar Photovoltaic Market, Japan, Installed Capacity (GW), 2010–2030 ...................................... 112
Figure 34: Solar Photovoltaic Market, Japan, End-user Segmentation (%), 2012–2017 ................................ 114
Figure 35: Solar Photovoltaic Market, Japan, Segmentation by Grid Connection (%), 2012–2017 ................ 116
Figure 36: Solar Photovoltaic Market, Japan, Power Generation (TWh), 2010–2030 .................................... 117
Figure 37: Solar Photovoltaic Market, Japan, Average Installation Price ($/W), 2010–2015 .......................... 120
Figure 38: Solar Photovoltaic Market, Japan, Average Module Price ($/W), 2010–2015 ............................... 121
Figure 39: Solar Photovoltaic Market, Japan, Module Market Size ($bn), 2010–2015 ................................... 122
Figure 40: Solar Photovoltaic Module Market, Japan, Production Share of Major Crystalline Module
Manufacturers (%), 2012 and 2013 ............................................................................................. 124
Figure 41: Solar Photovoltaic Module Market, Japan, Production Share of Major Thin-film Module
Manufacturers (%), 2012 and 2013 ............................................................................................. 125
Figure 42: Utilization Targets for New Energy, Japan, Target Capacity (TWh), 2003–2014 .......................... 127
Figure 43: Solar Photovoltaic Market, South Korea, Installed Capacity (GW), 2010–2030 ............................ 134
Asia-Pacific Solar Photovoltaic Market Outlook to 2030 – Installed Capacity, Market Size, Risk Analysis, Market Saturation and Company Profiles 20 © GlobalData. This report is a licensed product and is not to be copied, reproduced, shared or resold in any form.
ASIA-PACIFIC SOLAR PHOTOVOLTAIC MARKET OUTLOOK TO 2030 – INSTALLED CAPACITY, MARKET SIZE, RISK ANALYSIS,
MARKET SATURATION AND COMPANY PROFILES
Table of Contents
Figure 44: Solar Photovoltaic Market, South Korea, End-user Market Share (%), 2012–2017 ....................... 136
Figure 45: Solar Photovoltaic Market, South Korea, Share by Grid Connection (%), 2012–2017 ................... 138
Figure 46: Solar Photovoltaic Market, South Korea, Power Generation (TWh), 2010–2030 .......................... 139
Figure 47: Solar Photovoltaic Market, South Korea, Average Installation Price ($/W), 2010–2015 ................ 142
Figure 48: Solar Photovoltaic Market, South Korea, Average Module Price ($/W), 2010–2015 ..................... 143
Figure 49: Solar Photovoltaic Market, South Korea, Module Market Size ($m), 2010–2015 .......................... 145
Figure 50: Solar Photovoltaic Module Market, South Korea, Production Share of Major Crystalline Module
Manufacturers (%), 2012 and 2013 ............................................................................................. 146
Figure 51: Renewable Power Market, Global, Levelized Cost of Energy of Power-Generating Sources ($/kWh),
2013 ........................................................................................................................................... 152
Figure 52: Shale Gas Market, US, Shale Gas Price ($/mmBtu), 2010–2030 ................................................. 154
Figure 53: Power Generation Market, US, Capacity Addition (GW), 1930–2012 ........................................... 155
Figure 54: Oil Market, Global, Price Projection ($/bbl), 2012–2030 ............................................................... 158
Figure 55: Nuclear Power Market, Germany, Nuclear Decommissioning Rate (GW), 2011–2022 ................. 162
Figure 56: Annual Solar Photovoltaic Market, Global, Government Policy Support’s Impact on Capacity
Addition (GW), 2005–2017 ......................................................................................................... 164
Figure 57: Solar Photovoltaic Market, Module Prices ($/W), 2009–2013 ....................................................... 165
Figure 58: Solar Photovoltaic Market, Price Saturation by Sub-technology ($/W), 2013–2018 ...................... 176
Asia-Pacific Solar Photovoltaic Market Outlook to 2030 – Installed Capacity, Market Size, Risk Analysis, Market Saturation and Company Profiles 21 © GlobalData. This report is a licensed product and is not to be copied, reproduced, shared or resold in any form.
ASIA-PACIFIC SOLAR PHOTOVOLTAIC MARKET OUTLOOK TO 2030 – INSTALLED CAPACITY, MARKET SIZE, RISK ANALYSIS,
MARKET SATURATION AND COMPANY PROFILES
Introduction
2 Introduction
2.1 Solar Photovoltaic Technology
Solar Photovoltaic (PV) technologies convert the energy that is stored in sunlight into electrical
energy. The electrical energy is then supplied either to the electric grid or to the consumer directly.
The conversion is done by photosensitive semiconducting material, which is assembled in the form
of modules, usually referred to as solar PV modules or just solar modules. Since a single module
will produce only a few hundred Watts (W) of electricity, multiple PV modules are usually
connected to form a PV array that can produce greater output. Direct Current (DC) produced from
PV arrays can be used to power equipment and recharge batteries. In order to be grid-connected,
DC needs to be converted into Alternating Current (AC), using specifically designed inverters. A PV
array can be installed on the roof of a building, on the ground, as a building facade, or integrated
into the building itself.
2.2 Types of Solar Modules
2.2.1 Crystalline Silicon Modules
The crystalline Silicon (c-Si) cell was the first generation of PV technology, made from a single
crystal or a poly-crystalline wafer of silicon. c-Si cells are combined to form a c-Si solar module.
Mono-crystalline silicon cells have a uniform structure and an average wafer thickness of about XX
inches (in) (300 millimeters (mm)). These cells are made from a single silicon crystal and are
therefore uniform in color, ranging from dark blue to black. Mono-crystalline cells are the most
efficient solar PV cells, with a high-energy conversion efficiency varying from XX% to XX%.
Poly-crystalline PV cells are of an average wafer thickness of XX–XXin (XX–XXmm) and contain
small crystals arranged in various directions. This type of solar cell is blue in color and lighter than
mono-crystalline cells. Poly-crystalline PV cells have an efficiency level varying from XX% to XX%.
Despite the high efficiency level of this first-generation PV technology, there remains room for
improvement in the following areas:
Lowering costs
Improving the quality of polysilicon
Reducing metallic impurities, grain boundaries and dislocations
Asia-Pacific Solar Photovoltaic Market Outlook to 2030 – Installed Capacity, Market Size, Risk Analysis, Market Saturation and Company Profiles 24 © GlobalData. This report is a licensed product and is not to be copied, reproduced, shared or resold in any form.
ASIA-PACIFIC SOLAR PHOTOVOLTAIC MARKET OUTLOOK TO 2030 – INSTALLED CAPACITY, MARKET SIZE, RISK ANALYSIS,
MARKET SATURATION AND COMPANY PROFILES
Introduction
2.3 Report Guidance
The report begins with an executive summary that gives a snapshot of the key indicators in
Asia-Pacific solar PV market.
The “Introduction” section provides a brief overview of solar PV module technology and
different types of solar PV modules.
The “Global Solar PV Market Outlook” section discusses an overview of the global market for
solar PV and examines several parameters of the global solar PV market, such as installations,
generation, the average global price of a solar PV module, average installation prices, market
size over the years, global production of C-Si and thin-film modules, major manufacturers and
covers information on upcoming technologies.
Global Solar PV section is followed by Asia-Pacific region section and countries section on
China, Japan and South Korea. Each of these sections covers information on installations,
generation, the average module price, average installation prices, market size over the years,
global production of C-Si and thin-film modules and regulations related to solar PV industry.
Sections on Asia-Pacific region and countries are followed by section on “Competitiveness of
solar PV technology” which compares competitiveness between renewable sources of energy
in terms of levelized cost of energy and module cost in various regions.
“Risk Analysis” section which follows “Competitiveness of solar PV technology” section
evaluates risks of solar PV system over its life span
Section on “Solar Photovoltaic Market Saturation” which follows examines saturation levels and
sustainability of solar PV technology in the future.
The last section is on “Company Profiles” which covers company profiles of some of the major
players in solar PV industry.
Asia-Pacific Solar Photovoltaic Market Outlook to 2030 – Installed Capacity, Market Size, Risk Analysis, Market Saturation and Company Profiles 57 © GlobalData. This report is a licensed product and is not to be copied, reproduced, shared or resold in any form.
ASIA-PACIFIC SOLAR PHOTOVOLTAIC MARKET OUTLOOK TO 2030 – INSTALLED CAPACITY, MARKET SIZE, RISK ANALYSIS,
MARKET SATURATION AND COMPANY PROFILES
Solar PV Market Outlook, Asia-Pacific, 2010–2030
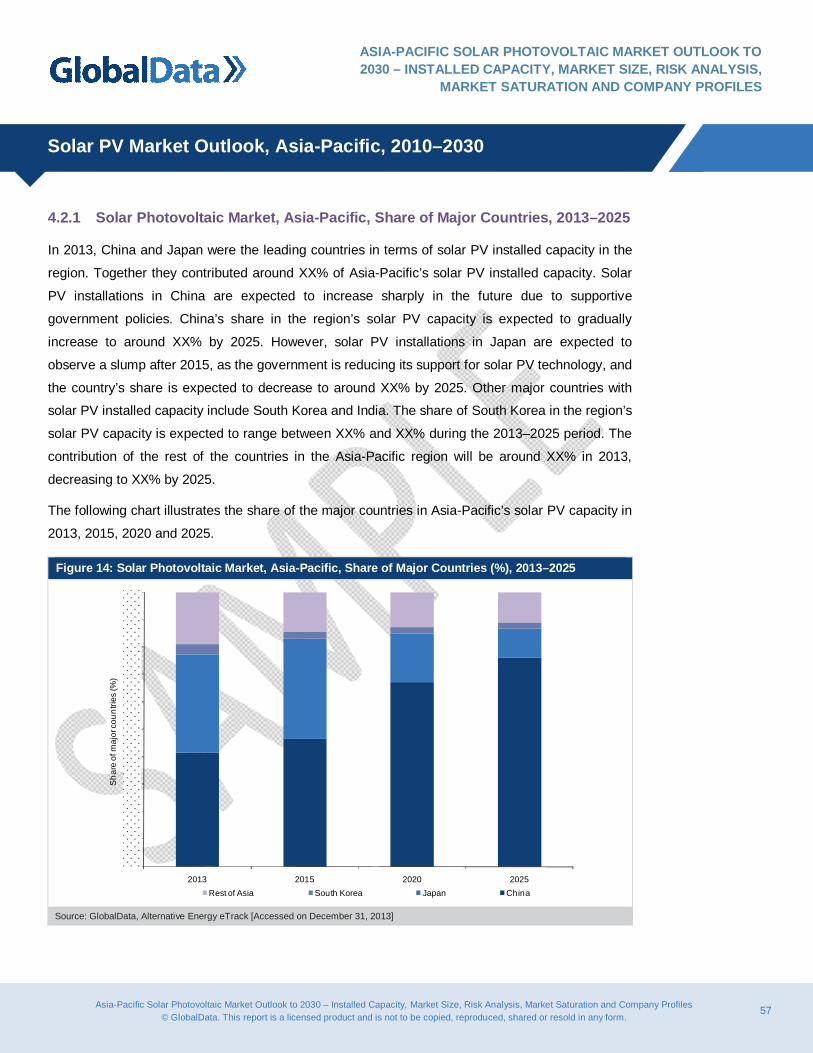
4.2.1 Solar Photovoltaic Market, Asia-Pacific, Share of Major Countries, 2013–2025
In 2013, China and Japan were the leading countries in terms of solar PV installed capacity in the
region. Together they contributed around XX% of Asia-Pacific’s solar PV installed capacity. Solar
PV installations in China are expected to increase sharply in the future due to supportive
government policies. China’s share in the region’s solar PV capacity is expected to gradually
increase to around XX% by 2025. However, solar PV installations in Japan are expected to
observe a slump after 2015, as the government is reducing its support for solar PV technology, and
the country’s share is expected to decrease to around XX% by 2025. Other major countries with
solar PV installed capacity include South Korea and India. The share of South Korea in the region’s
solar PV capacity is expected to range between XX% and XX% during the 2013–2025 period. The
contribution of the rest of the countries in the Asia-Pacific region will be around XX% in 2013,
decreasing to XX% by 2025.
The following chart illustrates the share of the major countries in Asia-Pacific’s solar PV capacity in
2013, 2015, 2020 and 2025.
Figure 14: Solar Photovoltaic Market, Asia-Pacific, Share of Major Countries (%), 2013–2025
2013 2015 2020 2025
Sha
re o
f maj
or c
ount
ries
(%)
Rest of Asia South Korea Japan China
Source: GlobalData, Alternative Energy eTrack [Accessed on December 31, 2013]

Asia-Pacific Solar Photovoltaic Market Outlook to 2030 – Installed Capacity, Market Size, Risk Analysis, Market Saturation and Company Profiles 80 © GlobalData. This report is a licensed product and is not to be copied, reproduced, shared or resold in any form.
ASIA-PACIFIC SOLAR PHOTOVOLTAIC MARKET OUTLOOK TO 2030 – INSTALLED CAPACITY, MARKET SIZE, RISK ANALYSIS,
MARKET SATURATION AND COMPANY PROFILES
Solar PV Market Outlook, China, 2010–2030
5.2.1.2 Solar Photovoltaic Market, China, Expected Capacity Addition, 2013
In 2013, China is expected to install XX GW of solar PV capacity. Gansu Province in the north-
western part of the country has around XX GW of projects, which are either commissioned or in the
advanced stages of development. These consist of: Jinchang Jintai Solar PV Park, with a capacity
of XX MW; Yongchang Chint Solar PV Park; and Jinchang CLP Holding Solar PV Park, with a
capacity of XX MW each. Other major provinces with solar PV development in 2013 are Xinjiang,
Shaanxi, Shanxi, Jiangsu and Hainan.
Figure 23: Solar Photovoltaic Market, China, Expected Capacity Addition (MW), 2013
Gan
su
Xin
jiang
Sha
anxi
Sha
nxi
Jian
gsu
Hai
nan
Zhej
iang
Nin
gxia
Bei
jing
Sha
ndon
g
Qin
ghai
Heb
ei
Inne
r-M
ongo
lia
Exp
ecte
d ca
paci
ty a
dditi
on (M
W)
Source: GlobalData, Alternative Energy eTrack [Accessed on Novermber 18, 2013]

Asia-Pacific Solar Photovoltaic Market Outlook to 2030 – Installed Capacity, Market Size, Risk Analysis, Market Saturation and Company Profiles 143 © GlobalData. This report is a licensed product and is not to be copied, reproduced, shared or resold in any form.
ASIA-PACIFIC SOLAR PHOTOVOLTAIC MARKET OUTLOOK TO 2030 – INSTALLED CAPACITY, MARKET SIZE, RISK ANALYSIS,
MARKET SATURATION AND COMPANY PROFILES
Solar PV Market Outlook, South Korea, 2010–2030
7.5 Solar Photovoltaic Module Market, South Korea, Module Price, 2010–2015
The average price for solar PV modules has been decreasing in South Korea, due to the growing
numbers of installations and improvements in solar PV technologies. In 2010, the average cost of a
crystalline module was $XX/W, this reduced to $XX/W in 2013 and is expected to increase to
$XX/W by 2015. The following figure illustrates the average price of crystalline and thin-film solar
PV modules between 2010 and 2015.
Figure 48: Solar Photovoltaic Market, South Korea, Average Module Price ($/W), 2010–2015
2010 2011 2012 2013 2014 2015
Ave
rage
mod
ule
pric
e ($
/W)
Crystalline Thin-film Source: GlobalData, Alternative Energy eTrack [Accessed on December 31, 2013]
Asia-Pacific Solar Photovoltaic Market Outlook to 2030 – Installed Capacity, Market Size, Risk Analysis, Market Saturation and Company Profiles 204 © GlobalData. This report is a licensed product and is not to be copied, reproduced, shared or resold in any form.
ASIA-PACIFIC SOLAR PHOTOVOLTAIC MARKET OUTLOOK TO 2030 – INSTALLED CAPACITY, MARKET SIZE, RISK ANALYSIS,
MARKET SATURATION AND COMPANY PROFILES
Appendix
12 Appendix
12.1 Abbreviations
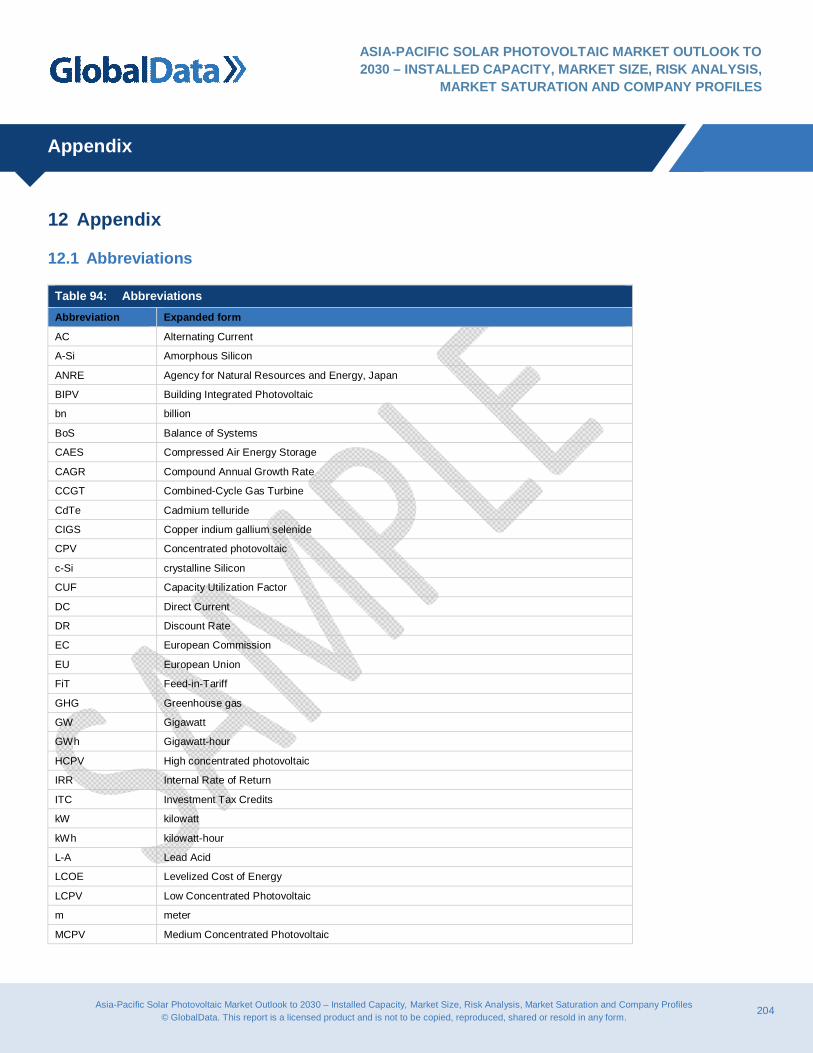
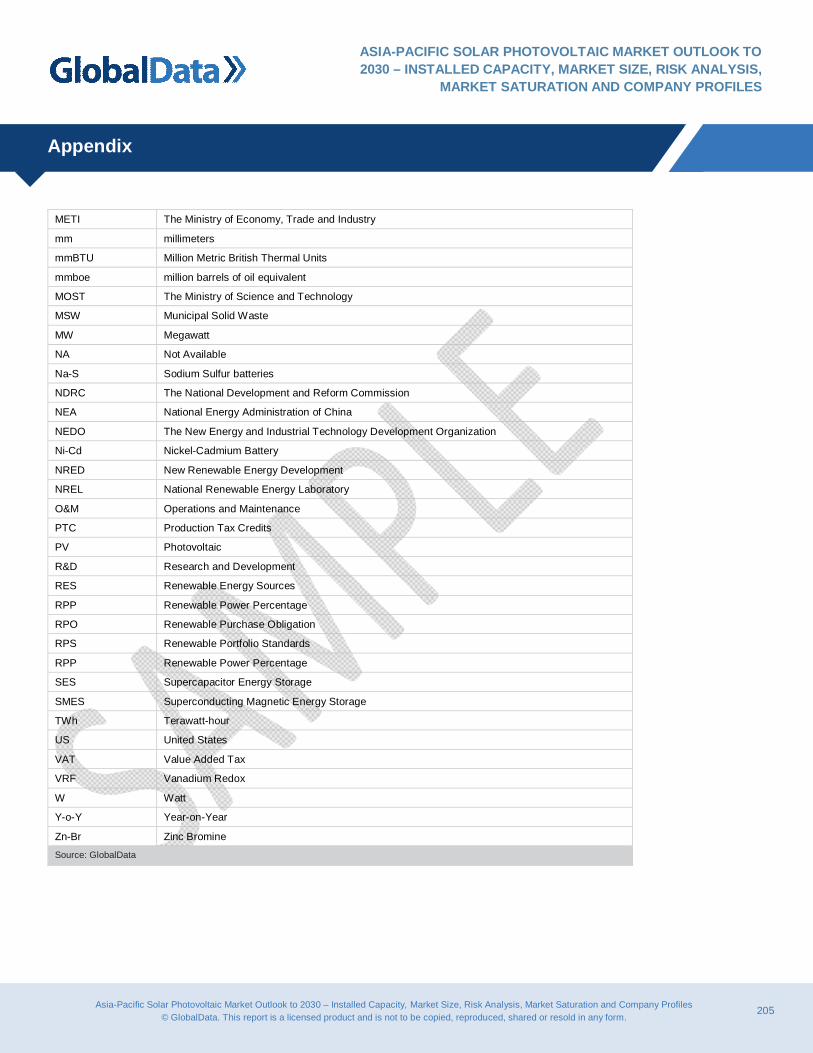
Table 94: Abbreviations Abbreviation Expanded form
AC Alternating Current
A-Si Amorphous Silicon
ANRE Agency for Natural Resources and Energy, Japan
BIPV Building Integrated Photovoltaic
bn billion
BoS Balance of Systems
CAES Compressed Air Energy Storage
CAGR Compound Annual Growth Rate
CCGT Combined-Cycle Gas Turbine
CdTe Cadmium telluride
CIGS Copper indium gallium selenide
CPV Concentrated photovoltaic
c-Si crystalline Silicon
CUF Capacity Utilization Factor
DC Direct Current
DR Discount Rate
EC European Commission
EU European Union
FiT Feed-in-Tariff
GHG Greenhouse gas
GW Gigawatt
GWh Gigawatt-hour
HCPV High concentrated photovoltaic
IRR Internal Rate of Return
ITC Investment Tax Credits
kW kilowatt
kWh kilowatt-hour
L-A Lead Acid
LCOE Levelized Cost of Energy
LCPV Low Concentrated Photovoltaic
m meter
MCPV Medium Concentrated Photovoltaic
Asia-Pacific Solar Photovoltaic Market Outlook to 2030 – Installed Capacity, Market Size, Risk Analysis, Market Saturation and Company Profiles 205 © GlobalData. This report is a licensed product and is not to be copied, reproduced, shared or resold in any form.
ASIA-PACIFIC SOLAR PHOTOVOLTAIC MARKET OUTLOOK TO 2030 – INSTALLED CAPACITY, MARKET SIZE, RISK ANALYSIS,
MARKET SATURATION AND COMPANY PROFILES
Appendix
METI The Ministry of Economy, Trade and Industry
mm millimeters
mmBTU Million Metric British Thermal Units
mmboe million barrels of oil equivalent
MOST The Ministry of Science and Technology
MSW Municipal Solid Waste
MW Megawatt
NA Not Available
Na-S Sodium Sulfur batteries
NDRC The National Development and Reform Commission
NEA National Energy Administration of China
NEDO The New Energy and Industrial Technology Development Organization
Ni-Cd Nickel-Cadmium Battery
NRED New Renewable Energy Development
NREL National Renewable Energy Laboratory
O&M Operations and Maintenance
PTC Production Tax Credits
PV Photovoltaic
R&D Research and Development
RES Renewable Energy Sources
RPP Renewable Power Percentage
RPO Renewable Purchase Obligation
RPS Renewable Portfolio Standards
RPP Renewable Power Percentage
SES Supercapacitor Energy Storage
SMES Superconducting Magnetic Energy Storage
TWh Terawatt-hour
US United States
VAT Value Added Tax
VRF Vanadium Redox
W Watt
Y-o-Y Year-on-Year
Zn-Br Zinc Bromine
Source: GlobalData
Asia-Pacific Solar Photovoltaic Market Outlook to 2030 – Installed Capacity, Market Size, Risk Analysis, Market Saturation and Company Profiles 206 © GlobalData. This report is a licensed product and is not to be copied, reproduced, shared or resold in any form.
ASIA-PACIFIC SOLAR PHOTOVOLTAIC MARKET OUTLOOK TO 2030 – INSTALLED CAPACITY, MARKET SIZE, RISK ANALYSIS,
MARKET SATURATION AND COMPANY PROFILES
Appendix
12.2 Bibliography
Bright Star Solar (2013). Life Expectancy of Solar Photovoltaic Panels. Bright Star Solar.
Available from: http://www.brightstarsolar.net/2010/06/life-expectancy-of-solar-photovoltaic-
panels/. [Accessed on November 8, 2013]
CAT (2013). How long do solar electric PV panels last? Centre for Alternative Energy
Technology. Available from: http://info.cat.org.uk/questions/pv/life-expectancy-solar-PV-panels.
[Accessed on November 6, 2013]
Channell et al. (2013). Shale & renewables: a symbiotic relationship. Citi Research. Available
from:
https://ir.citi.com/586mD+JRxPXd2OOZC6jt0ZhijqcxXiPTw4Ha0Q9dAjUW0gFnCIUTTA==
[Accessed on November 11, 2013]
EIA (2013a). Annual Energy Outlook 2013. Energy Information Administration. Available from:
http://www.eia.gov/forecasts/aeo/IF_all.cfm#uscrude [Accessed on November 11, 2013]
EIA (2013b). How old are U.S. power plants? Energy Information Administration. Available
from: http://www.eia.gov/energy_in_brief/article/age_of_elec_gen.cfm [Accessed on November
11, 2013]
EIA (2013c). AEO2013 Early Release Overview. Energy Information Administration. Available
from: http://www.eia.gov/forecasts/aeo/er/early_prices.cfm [Accessed on November 11, 2013]
Energy Policy (2012). China's Energy Policy 2012. Chinese Government's Official Web Portal.
Available from: http://www.gov.cn/english/official/2012-10/24/content_2250497.htm [Accessed
on November 14, 2013]
IEA-PVPS (2011). National Survey Report of PV Power Applications in Korea 2011.
International Energy Agency Photovoltaic Power System Programme. Available from:
http://iea-
pvps.org/index.php?id=9&tx_damfrontend_pi1=&tx_damfrontend_pi1[catPlus]=&tx_damfronten
d_pi1[catEquals]=&tx_damfrontend_pi1[catMinus]=&tx_damfrontend_pi1[catPlus_Rec]=64&tx_
damfrontend_pi1[catMinus_Rec]=&tx_damfrontend_pi1[treeID]=60&tx_damfrontend_pi1[id]=9
[Accessed on June 3, 2013]

Asia-Pacific Solar Photovoltaic Market Outlook to 2030 – Installed Capacity, Market Size, Risk Analysis, Market Saturation and Company Profiles 208 © GlobalData. This report is a licensed product and is not to be copied, reproduced, shared or resold in any form.
ASIA-PACIFIC SOLAR PHOTOVOLTAIC MARKET OUTLOOK TO 2030 – INSTALLED CAPACITY, MARKET SIZE, RISK ANALYSIS,
MARKET SATURATION AND COMPANY PROFILES
Appendix
WISE (2012). Comparative Assessment of Crystalline and Thin-Film PV Technologies in India
— A Guide for Policy & Business Decisions. World Institute of Sustainable Energy. Available
from: http://cse.wisein.org/solar-energy-projects.htm. [Accessed on November 11, 2013]
WNA (2013). Nuclear Power in Germany. World Nuclear Association. Available from:
http://www.world-nuclear.org/info/Country-Profiles/Countries-G-N/Germany/ [Accessed on
November 14, 2013]
12.3 Market Definitions
Historic Period: Before 2013
Base Year: 2013
Forecast Period: After 2013
Global: This refers to all countries included in the GlobalData capacity and generations database.
These countries constitute more than 99% of wind-power capacity in the world.
Others: This category includes countries other than the US, China, India, Germany, Spain and the
UK.
12.4 Methodology
GlobalData’s dedicated research and analysis teams consists of experienced professionals with a
pedigree in marketing, market research, consulting background in the energy industry and
advanced statistical expertise.
GlobalData adheres to the codes of practice of the Market Research Society (www.mrs.org.uk) and
the Strategic and Competitive Intelligence Professionals (www.scip.org).
All GlobalData databases are continuously updated and revised. The following research
methodology is followed for all databases and reports.
Asia-Pacific Solar Photovoltaic Market Outlook to 2030 – Installed Capacity, Market Size, Risk Analysis, Market Saturation and Company Profiles 209 © GlobalData. This report is a licensed product and is not to be copied, reproduced, shared or resold in any form.
ASIA-PACIFIC SOLAR PHOTOVOLTAIC MARKET OUTLOOK TO 2030 – INSTALLED CAPACITY, MARKET SIZE, RISK ANALYSIS,
MARKET SATURATION AND COMPANY PROFILES
Appendix
12.4.1 Coverage
The objective of updating GlobalData coverage is to ensure that it represents the most up to date
vision of the industry possible.
Changes to the industry taxonomy are built on the basis of extensive research of company,
association and competitor sources.
Company coverage is based on three key factors: market capitalization, revenues and media
attention/innovation/ market potential.
The estimated revenues of all major companies, including private and governmental, are gathered
and used to prioritize coverage.
Companies which are making the news, or which are of particular interest due to their innovative
approach are prioritized.
GlobalData aims to cover all major news events and deals in the alternative energy industry,
updated on a daily basis.
12.4.2 Secondary Research
The research process begins with exhaustive secondary research on internal and external sources
being carried out to source qualitative and quantitative information relating to each market.
The secondary research sources that are typically referred to include, but are not limited to:
Company websites, annual reports, financial reports, broker reports and investor presentations
Industry trade journals and other literature
Internal and external proprietary databases
National government documents, statistical databases and market reports
News articles, press releases and web-casts specific to the companies operating in the market
Asia-Pacific Solar Photovoltaic Market Outlook to 2030 – Installed Capacity, Market Size, Risk Analysis, Market Saturation and Company Profiles 210 © GlobalData. This report is a licensed product and is not to be copied, reproduced, shared or resold in any form.
ASIA-PACIFIC SOLAR PHOTOVOLTAIC MARKET OUTLOOK TO 2030 – INSTALLED CAPACITY, MARKET SIZE, RISK ANALYSIS,
MARKET SATURATION AND COMPANY PROFILES
Appendix
12.4.3 Primary Research
GlobalData conducts extensive primary interviews with industry participants and commentators in
order to validate its data and analysis. A typical research interview fulfills the following functions:
It provides first-hand information on the market size, market trends, growth trends, competitive
landscape and future outlook of the relevant market.
It helps in validating and strengthening the secondary research findings.
It further develops the analysis team’s expertise and market understanding.
Primary research involves e-mail interactions, telephonic interviews as well as face-to-face
interviews for each market, category, segment and sub-segment across geographies.
The participants who typically take part in such a process include, but are not limited to:
Industry participants: CEOs, VPs, business development managers, market intelligence
managers and national sales managers
Outside experts: Investment bankers, valuation experts, research analysts and key opinion
leaders specializing in alternative energy industry
12.4.4 Assumptions
The following are the data points that are estimated or sourced through primary and secondary
research.
Installed Capacity and Power Generation
The installed capacity and power generation values have been extracted from GlobalData’s
proprietary database, which is continuously updated. These updates are made through extensive
primary and secondary research and by contacting several industry associations and government
energy agencies.
Average Module Price and Market Size
Global and country wise average module prices up to mid 2013 were determined through primary
and secondary research. The future module price forecasts till 2020 are made based on the
estimates of silicon prices and the market size globally and in each key country is calculated by
multiplying the module price and the estimated annual additions of each year.
Asia-Pacific Solar Photovoltaic Market Outlook to 2030 – Installed Capacity, Market Size, Risk Analysis, Market Saturation and Company Profiles 211 © GlobalData. This report is a licensed product and is not to be copied, reproduced, shared or resold in any form.
ASIA-PACIFIC SOLAR PHOTOVOLTAIC MARKET OUTLOOK TO 2030 – INSTALLED CAPACITY, MARKET SIZE, RISK ANALYSIS,
MARKET SATURATION AND COMPANY PROFILES
Appendix
12.5 Disclaimer
All Rights Reserved.
No part of this publication may be reproduced, stored in a retrieval system or transmitted in any
form by any means, electronic, mechanical, photocopying, recording or otherwise without the prior
permission of the publisher, GlobalData.