gdl whim drainage - national environment & planning …nepa.gov.jm/eias/stcatherine/new...
TRANSCRIPT
AF ENGINEERING 14 WORTHINGTON TERRACE, KINGSTON 5, JAMAICA TEL: 876 920 7144, Mobile: 954 655 0282
GDL WHIM HOUSING DEVELOPMENT
DRAINAGE DESIGNS
CLIENT: GORE DEVELOPMENTS LIMITED 2C BRAEMAR AVENUE
KINGSTON 10
VERSION 1.0 June 25, 2009

2
Overview Gore Developments Limited proposes to develop lands west of the Old Harbour Bay Road and South of Highway 2000 known as The Whim as a Housing Estate. The location of the proposed development is shown in Figure 1.
Figure 1 Location plan for the proposed GDL Whim Housing Development
The project lands are part of a flood plain where the Bower’s Gully is the major drainage feature in that area. A Hydrology Consultant prepared a hydrologic model of the nearby Bowers Gully where the surface runoff from most of the proposed development will flow. AF Engineering was
Project Boundary
3
assigned by Gore Developments Limited to prepare the drainage designs and this report. Parts of this report are taken from a similar report prepared by this author while working for Foreman Chung & Sykes Consultants Limited for a previous version of the Master Plan. This report describes the methods used to develop the drainage designs and the main drainage features that define the drainage scheme. The effect of the storm water runoff from the proposed subdivision on the Bowers is included in the Hydrology Consultant’s report prepared for a slightly different layout, where the confluence of the main drain was approximately 400m south of the current central main drain alignment.
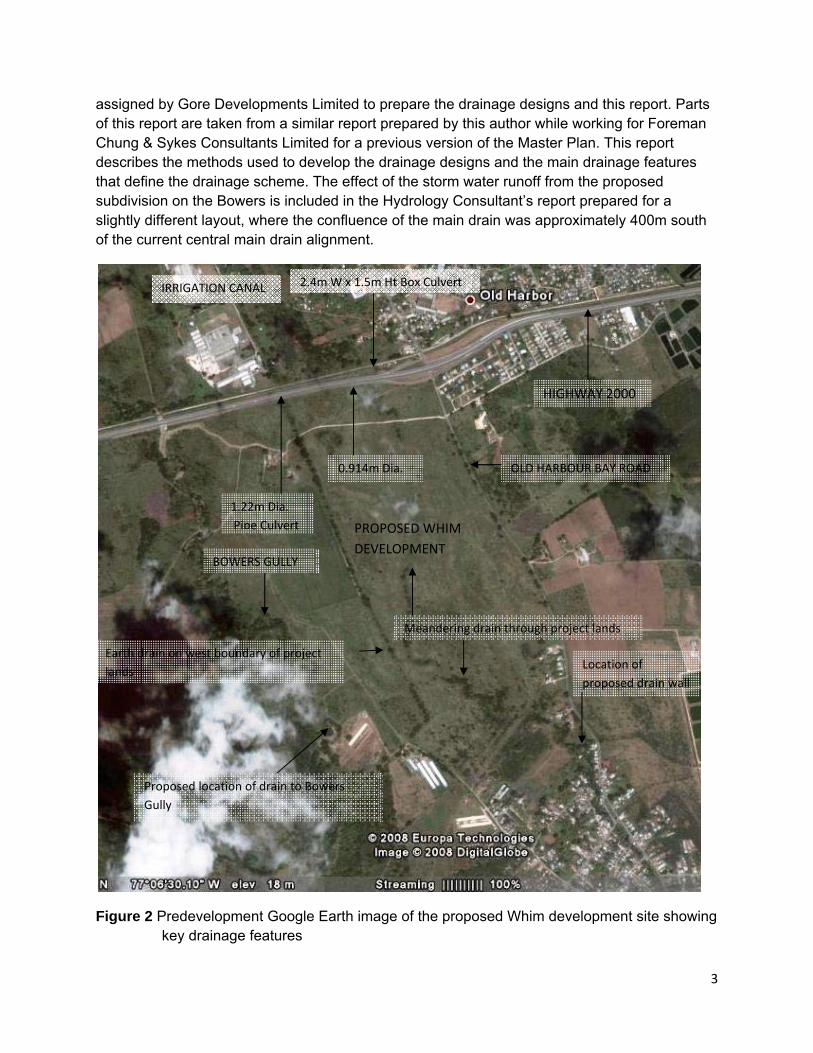
Figure 2 Predevelopment Google Earth image of the proposed Whim development site showing key drainage features
2.4m W x 1.5m Ht Box Culvert
0.914m Dia.
1.22m Dia. Pipe Culvert
BOWERS GULLY
OLD HARBOUR BAY ROAD
Proposed location of drain to Bowers Gully
HIGHWAY 2000
Meandering drain through project lands
Earth drain on west boundary of project lands
PROPOSED WHIM DEVELOPMENT
Location of proposed drain wall
IRRIGATION CANAL

4
Pre Development Drainage
The proposed development lands are part of a flood plain that slopes from north to south. Along the northern boundary of the proposed development is part of the Portmore to Sandy Bay Highway 2000 alignment. The Highway is raised above the natural ground and flows originating north of the highway flow through culverts in the highway embankment to the south. The main flow paths where large flows can cross the highway are the Bowers Gully and the Old Harbour Bay road underpass. Other drainage crossings include box and pipe culverts that discharge storm water onto the proposed development lands. Figure 2 is a Google Earth image of the area with the main predevelopment drainage features described.
South of the highway the main watercourses are the Old Harbour Bay Road paved drain, the meandering natural drain that is generally centrally located on the proposed development lands and an earth drain on the western boundary of the proposed development. All those drains join the meandering central drain at various points. That drain referred to as the Whim drain currently splits into two watercourses just south of the development lands see Figure 1. Those watercourses fall towards Old Harbour Bay to the south and to the southern areas of the Brampton Farm lands to the east.
Post Development Drainage Scheme
The storm water that crosses the Highway 2000 alignment onto the proposed development lands will be collected into a central channel that will also receives storm flows from the proposed development lands and the western boundary drain and those combined flows will be directed toward the Bowers Gully. The western earth drain will be extended to discharge into the Central main drain. The storm water flows originating on the development lands as well as the flows crossing the highway has been redirected from flowing toward the existing community of Old Harbour Bay due to recent drainage upgrading works done in the area. With the proposed change of land use the increased surface flows will mostly be redirected into the Bowers Gully thereby removing the likelihood of flooding the newly built channel. This approach is consistent with the work done to reduce the frequency of flooding in the Old Harbour Bay community.
The most southern part of the proposed development identified as Block A in Figure 4 is the only part of the proposed development that will continue to discharge storm water flows into the existing watercourse to the south. The flow will be significantly reduced as this is a relatively small catchment compared to the predevelopment condition. The Old Harbour Bay Road drain

5
will not be altered and the existing drain to the south will only receive that flow and the flow from Block A. The drain to the south is now directed to the east across Old Harbour Bay main road onto the southern section of the Brampton Lands.
The design criteria used for this development is guided by the Local requirements for permitting and international standards with regards to similar developments.
Drainage criteria and methods of determining runoff
DESIGN STORM EVENT
The Government of Jamaica (GOJ) Development and Investment Manual, Volume 3 Section 1, Chapter 12, article 12.1, part (ix) set out the design storm return frequency as follows:
• Minor Drainage systems designed to accommodate 1 in 5 year flood event. • Major Drainage system to be designed to accommodate 1 in 25 year flood event. • Bridges designed for 1 in 50 year flood event.
The Jamaica Institution of Engineers recommended “Guidelines for the design and Construction of Housing Infrastructure” Vol 1: 1984 Storm Water Drainage recommends that the design storm frequency of storm sewers be 2 years and for culverts, bridges and flood control projects a minimum of 10 years.
In the Standard Handbook for Civil Engineers by Merritt, Loftin and Ricketts article 14.9 states “Flooding problems and surface drainage as concerns of community and regional planning studies, differ primarily in degree of severity. The principal concern with flooding is the desire to avoid injury and loss of life and reduce property damages caused by major floods (those having a recurrence interval of 25 to 100 years).
Surface-drainage systems on the other hand are primarily concerned with convenience and providing access to property in relatively minor storms (those having a recurrence interval of 2 to 10 years)”.
Investigations will be conducted for the 1 in 25 year event for the main drainage channels and 1 in 10 year event for the subdivision drains. The surface drainage and inlet sizing is designed as local streets and the design event is the 1 in 5 year frequency.

6
The FHWA HEC 22 recommendation is shown in Table 4-1 below and will be used for the designs.
Road Classification Design Frequency Design Spread < 70 km/hr (45 mph) 10-year Shoulder + 1 m (3 ft) > 70 km/hr (45 mph) 10-year Shoulder Sag Point 50-year Shoulder + 1 m (3 ft)
< 70 km/hr (45 mph) 10-year 1/2 Driving Lane > 70 km/hr (45 mph) 10-year Shoulder Sag Point 10-year 1/2 Driving Lane
Low ADT 5-year 1/2 Driving Lane High ADT 10-year 1/2 Driving Lane Sag Point 10-year 1/2 Driving Lane
FHWA HEC-22
Table 4-1. Suggested Minimum Design Frequency and Spread.
High Volume or Divided or Bi-Directional
Collector
Local Streets
METHOD OF DETERMINING DESIGN PEAK FLOWS
1. For drainage areas less than 200 acres, the design engineer shall use the Rational Method (Q=CIA) procedure for determining runoff flow. For drainage areas between 200 and 2,000 acres, the design engineer shall use the most recent NRCS Method, for determining runoff rates. For drainage areas greater than 2,000 acres, or (800 hectares) the design engineer shall use the most recent WRA Regression methods or HEC HMS to estimate runoff rates.
2. Drains to be sized to United States Federal Highway Administration (FHWA) Hydraulic Engineering Circular No 22 – Urban Drainage Design HEC – 22.
3. Culverts to be sized and conform to FHWA-NHI-01-020-HDS 5 (Hydraulic Design
Series No 5 )– Hydraulic design of highway culverts – Second Edition.
The calculation for peak runoff using the rational method is set out below:
Q = C i A x 1/Ku
Where: Q = Flow, m3/s (ft3/s)
C = coefficient of runoff (dimensionless)
i = rain intensity mm/hr (in/hr)
A = drainage area, hectares, ha (acres)
Ku = units conversion factor 360 (1 in English units))

7
Rain data is taken from the National Meteorological Service’s estimates of maximum 24 hour rainfall for selected return periods. This is converted to rainfall intensity by the following equation.
i = 4.73 x R
(12.25+D) 0.65
Where R = 24-hour rainfall.
D = Duration of the design rainfall event equal to the time of concentration
The runoff coefficients are taken from the FHWA HEC 22 Table 3.1.
The proposed development is located between the Old Harbour town and Old Harbour Bay however the rain data used is for Old Harbour town (see Table 1) as this is slightly higher than the other stations and part of the local water shed extends to the Old Harbour town.
Table 1 Rainfall Data
Old Harbour rainfall Data
24 hr Return mm/day
1 in 2 yr 105
1 in 5 yr 164
1 in 10 yr 203
1 in 25 yr 252
1 in 50 yr 288
1 in 100yr 324
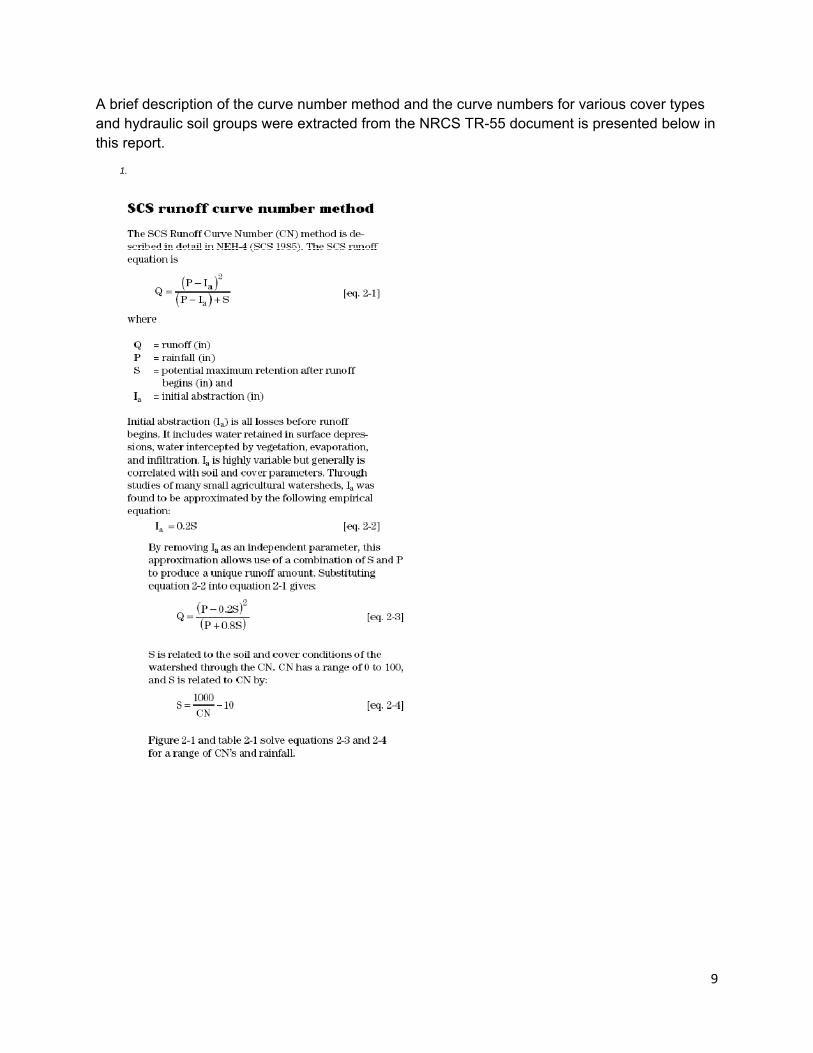
NRCS TR-55 METHOD OF DETERMINING SURFACE RUNOFF PEAK FLOWS
The proposed development was superimposed on the Jamaica Survey Department 1:12,500 topographic map series for the area and the catchments that direct surface runoff toward the proposed development were delineated. Given the data available, catchment sizes and the

8
times of concentration the USDA NRCS Urban Hydrology for Small Watersheds Technical Release 55 most commonly called the TR-55 method of determining the peak surface runoff flow was used to determine the peak 1:10 year and 1:25year flows.
This method requires the following inputs
1. Catchment area 2. Time of concentration and time of travel 3. Land use and soil type to determine the curve number CN 4. 24 Hour precipitation for the watershed considered.
1.Technical Release 55 (TR-55) presents simplified procedures to calculate storm runoff volume, peak rate of discharge, hydrographs, and storage volumes required for floodwater reservoirs. These procedures are applicable in small watersheds, especially urbanizing watersheds, in the United States.
1.The model described in TR-55 assumes a rainfall amount uniformly imposed on the watershed over a specified time distribution. Mass rainfall is converted to mass runoff by using a runoff curve number (CN). CN is based on soils, plant cover, amount of impervious areas, interception, and surface storage. Runoff is then transformed into a hydrograph by using unit hydrograph theory and routing procedures that depend on runoff travel time through segments of the watershed. First issued by the Soil Conservation Service (SCS) in January 1975, TR-55 incorporates current SCS procedures.
1. Extract from the NRCS TR-55 Document available at http://www.wsi.nrcs.usda.gov/products/W2Q/H&H/Tools_Models/WinTR55.html
9
A brief description of the curve number method and the curve numbers for various cover types and hydraulic soil groups were extracted from the NRCS TR-55 document is presented below in this report.
1.

10
1. Extract from the NRCS TR-55 Document available at http://www.wsi.nrcs.usda.gov/products/W2Q/H&H/Tools_Models/WinTR55.html

11
Extract from the NRCS TR-55 Document available at http://www.wsi.nrcs.usda.gov/products/W2Q/H&H/Tools_Models/WinTR55.html
1.The intensity of rainfall varies considerably during a storm as well as geographic regions. To represent various regions of the United States, NRCS developed four synthetic 24-hour rainfall distributions (I, IA, II, and III) from available National Weather Service (NWS) duration-frequency data (Hershfield 1061; Frederick et al., 1977) or local storm data. Type IA is the least intense and type II the most intense short duration rainfall.
The NRCS recommends the Type III distribution for parts of Florida where intense rainfall is mostly due to tropical storms a similar situation for the south coast of Jamaica. That distribution has been used for this hydrologic evaluation as high intensity rainfall due to tropical weather is a feature of local conditions. The type III hyetograph is shown in Figure B1 taken from the TR55 publication.

12
The time of travel and time of concentration are parameters used to distribute the runoff into a hydrograph. The method is based on velocities of flow through segments of the watershed. Two major parameters are time of concentration (Tc) and travel time of flow through the segments (Tt). These and the other parameters used are the same as those used in accepted hydraulic analyses of open channels.
Travel time ( Tt ) is the time it takes water to travel from one location to another in a watershed. Tt is a component of time of concentration ( Tc ), which is the time for runoff to travel from the hydraulically most distant point of the watershed to a point of interest within the watershed. Tc is computed by summing all the travel times for consecutive components of the drainage conveyance system. The times are computed by the product of velocity of flow and the length of the reach of the watercourse considered. The Time of concentration is made up of the sheet flow near the watershed divide, the shallow concentrated flow assumed to occur in this assignment at 15m from the watershed divide and the flow in the drainage channel. Manning’s equation is used to estimate the velocity of flow in the drainage path.
The equation below is taken from the appendix of the TR 55 that is used to estimate the stream velocity for shallow concentrated flow in a watershed. Equations are also presented in the TR 55 document to estimate the velocity of the sheet flow that occurs at the watershed divide of the catchments. The Manning’s equation shown in the design section of this document is used to estimate the flows in the channel.

13
The Tabular Hydrograph methods was used to estimate the peak flow for the various catchments along this part of the alignment.
1.The Tabular method can develop partial composite flood hydrographs at any point in a watershed by dividing the watershed into homogeneous subareas. In this manner, the method can estimate runoff from non-homogeneous watersheds.
1.An assumption in development of the tabular hydrographs is that all discharges for a stream reach flow at the same velocity. By this assumption, the subarea flood hydrographs may be routed separately and added at the reference point. The tabular hydrographs are pre-routed hydrographs.
To develop a tabular hydrograph discharge summary; the effect of individual subarea hydrographs are routed to the watershed point of interest. Use ∑ Tt for each subarea as the total reach travel time from that subarea through the watershed to the point of interest. Compute the hydrograph coordinates for selected ∑ Tt’s using the appropriate tabular hydrograph unit discharges for type II rainfall distribution. The flow at any time is:
A computer model of each method was used that operates with SI units.
1. Extract from the NRCS TR-55 Document available at http://www.wsi.nrcs.usda.gov/products/W2Q/H&H/Tools_Models/WinTR55.html

14
ROADWAY DRAINAGE
Caltrans recommends in index 831.4 that concentrations of sheet flow across roadways are to be avoided. As a general rule, no more than 0.003m3/s should be allowed to concentrate and flow across a roadway.
STORM SEWERS
The storm sewer system being the buried drainage conveyance system below the roadway pavement will be designed to convey a 1:10 year storm without surcharging.
The discharge of the storm sewers is mostly to paved drains and positive drainage will be maintained in the design. Minimum cover will be to the manufacturers’ specifications.
Open Drains
The open drains will be used where possible and erosion protection using both rigid and flexible linings will be used in the design. CALTRANS Highway Design Manual chapter 860 Open Channels will be used to guide the designs. The maximum velocity for unlined channels in table 862.2 is used to guide the designs.
Type of Material in Excavation Section Intermittent Flow Sustained FlowFine Sand (Noncolloidal) 0.8 0.8Sandy Loam (Noncolloidal) 0.8 0.8Silt Loam (Noncolloidal) 0.9 0.9Fine Loam 1.1 1.1Volcanic Ash 1.2 1.1Fine Gravel 1.2 1.1Stiff Clay (Colloidal) 1.5 1.2Graded Material (Noncolloidal) Loam to Gravel 2 1.5Silt to Gravel 2.1 1.7Gravel 2.3 1.8Coarse Gravel 2.4 2.0Gravel to Cobbles (Under 150 mm) 2.7 2.1Gravel and Cobbles (Over 200 mm) 3 2.4
Table 862.2
Recommended Permissible Velocities for Unlined Channels
Permissible Velocity (m/s)

15
The manning’s roughness coefficients to be used in the evaluation of the design depth of flow is guided by table 863.3a shown below.
Type of Channel n valueUnlined Channels: Clay Loam 0.023 Sand 0.02 Gravel 0.03 Rock 0.04Lined Channels: Portland Cement Concrete 0.014 Air Blown Mortar (troweled) 0.012 Air Blown Mortar (untroweled) 0.016 Air Blown Mortar (roughened) 0.025 Asphalt Concrete 0.018 Sacked Concrete 0.025Pavement and Gutters: Portland Cement Concrete 0.015 Asphalt Concrete 0.016Depressed Medians: Earth (without growth) 0.04 Earth (with growth) 0.05 Gravel 0.055
Average Values for Manning's Roughness Coefficient (n)Table 864.3A
Freeboard in the open drains will be guided by table 866.2 of the CALTRANS Highway Design Manual.
Table 866.2
Shape of Channel Subcritical Flow SupercriticalFlow
Rectangular 0.1 He 0.20 d
Trapezoidal 0.2 He 0.25 d
Where He = Energy head, in meters d = Depth of flow, in meters for a straight alignment
Guide to Freeboard Height
For rigid pavements the FHWA HDS 4 guidance will be used and for flexible linings FHWA HEC-15 will be used along with the CALTRANS guidelines.

16
The GOJ Development Manual, Volume3, Section 1, Chapter 10, article 10.1.7 parts ii) and iii) recommend minimum easement and freeboard in drains as shown below:
(ii) A minimum easement of 1.22m from each side of the design water way is recommended.
(iii) Bridges and open channels should be designed with a freeboard not less than 25% of the design flow depth.
As recommended in the GOJ Development document all drains will be designed with a minimum 25% of the design depth as freeboard.
EROSION CONTROL
CALTRANS Highway Design Manual chapter CHAPTER 870 CHANNEL AND SHORE PROTECTION - erosion control and FHWA HEC 14 hydraulic design of energy dissipators for Culverts and Channels will be used to design the erosion control features.
Table 873.3D is an example of the limiting of channel velocity based on lining type.
Mean Velocity (m/s)
Minimum Reinforcement
Sides Bottom
< 3 75 -90 90 - 100
152x152-MW19.4 x MW19.4 welded wire Fabric
3 - 4.5 100 -125 125 -150 #15 Bars at300 mm and 450 mm centers
4.5 or more 150 - 200 175 - 200
#10 Bars at300 mm centers both ways
Portland Cement Concrete or Air Blown Mortar
Thickness of Lining (mm)
Table 873.3DChannel Linings

17
DRAINAGE DESIGN
Pre development condition
The predevelopment land use condition of the proposed development lands is deemed to be brush with mixed grass and weed in fair condition. Figure 2 a recent satellite image shows the existing land use.
The development lands are bounded by a raised highway to the north with box and pipe culverts allowing storm water to cross the alignment, collector roadway (Old Harbour Bay Road) to the east with parallel paved drain, urbanizing lands to the south and an existing unlined earth drain on the western boundary of the proposed development property.
The proposed drainage scheme for the development is to collect the storm flows coming through the highway drainage culverts that impact the site, into a drain centrally aligned through the proposed development that will also receive flows from the various proposed housing blocks and ultimately discharge the flows into the Bowers Gully west of the proposed development.
There are three culverts that cross the highway that directly impact the proposed development, a 2.44m wide by 1.5m ht RC box culvert and 0.914m diameter concrete pipe culvert that cross the highway and discharge flows into a meandering earth drain on the project lands and a 1.22m diameter concrete pipe culvert that crosses the highway and discharges into a straight earth drain on the western boundary of the project lands. The Bowers gully is approximately 500m west of the project lands and seems not to affect the project lands. The location of the existing drainage features are shown in Figure 2.

18
Photos 1 to 4 show the three culverts of concern crossing the Highway and the downstream drain on the western boundary of the proposed development.
The Proposed Developed Condition
For the detailed drainage design the culverts constructed across the Highway were taken into account and the likely peak discharge assessed.
An estimate of the upper limit of flow that the culverts that cross the Highway 2000 embankment was estimated by assuming that inlet control will be the limiting factor and that the inlets to the culverts are submerged by 2m.This is to assume that the top water level above the invert of the inlet to the 1.5m height box culvert is 3.5m. That being the approximate height the water level will possibly rise to overtop the ridge of the watershed draining to the culvert and flow into the
Photo 4 - Existing drain downstream of the 1.22m Dia. culvert
Photo 1- 2.4mWide x 1.5mHt RC Box Culvert below H2k
Photo 2 - 0.914m Dia. RC pipe culvert below H2k
Photo 3 - 1.22m Dia. RC pipe below H2k

19
adjoining Bowers gully watershed to the west or the Old Harbour Bay road watershed to the East neither of which convey flow onto the site. The flow crossing the highway was determined in the TR-55 model by modeling the crossings as a weir.
The western boundary drain is proposed to remain in its preconstruction state with a boundary wall or earth berm incorporated in the western access road reserve located along the western boundary of the proposed development. That western drain will be connected with the main drain and those flows included with the flows from the subdivision and beyond directed into the Bowers Gully.
The estimated maximum storm flows that will cross the Highway are shown below in table 2.
Table 2
Estimate of maximum storm flow through culverts crossing the H2k roadItem Description Headwater
(m)Estimated max
flow (m3/s)1 2.4m W x 1.5m Ht Box Culvert 3.75 17.452 0.9m Diameter RC Culvert 3.75 3.283 1.2m Diameter RC Culvert 3.45 5.725

20
Figure 3 shows Main drainage sub areas and routed downstream flows if area is fully urbanised and taking into account the effect of the Highway 2000 culverts.
21
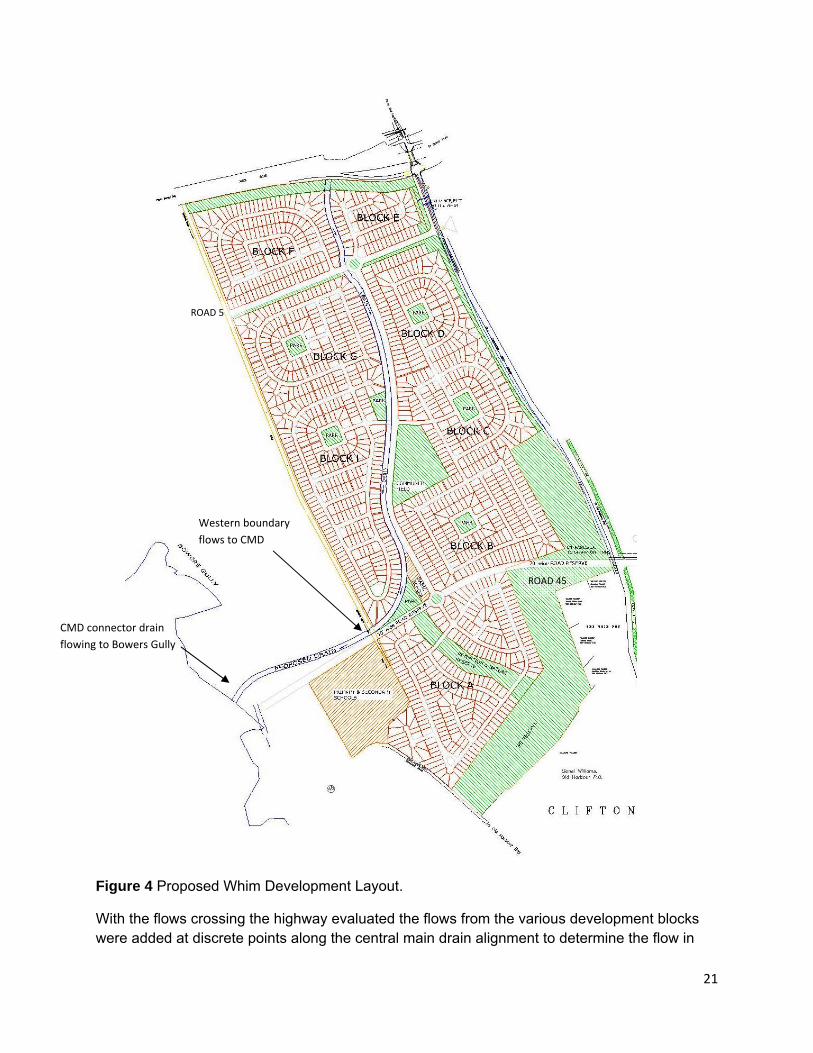
Figure 4 Proposed Whim Development Layout.
With the flows crossing the highway evaluated the flows from the various development blocks were added at discrete points along the central main drain alignment to determine the flow in
ROAD 5
ROAD 45
CMD connector drain flowing to Bowers Gully
Western boundary flows to CMD

22
the main drain. This method was used to estimate the flows in the main drain at various points along the drain alignment or reaches of the drain. The size of the reaches was determined using the Manning’s method of determining the velocity of flow in a channel. The block layout is shown in Figure 4 and the estimates of flows from the various blocks are shown in Table 6.
The developed scenario was modeled in TR-55 and where the catchments were divided into seven sub areas as shown in figure 3. Sub areas 1,2,3,4 and 5 are all connected and the flows from there are directed into to Bowers Gully. The details of the sub areas hydrologic condition is shown in Table 3.
Table 3
AF ENG
Region: OLD HARBOUR Locale: SAINT CATHERINE
Sub-Area Land Use Condition Hydrologic Sub-Area CurveIdentifier Soil Area Number
Group (ha)SA1 Open space; grass cover < 50% (poor) C 6.6 86
Residential districts (1/8 acre) C 26.4 90Total Area / Weighted Curve Number 33 89
SA2 Open space; grass cover < 50% (poor) C 43.28 86Residential districts (1/4 acre) C 64.92 83Total Area / Weighted Curve Number 108.2 84
SA3 Residential districts (1/8 acre) C 31.2 90
SA4 Open space; grass cover < 50% (poor) C 2.3 86Residential districts (1/8 acre) C 68 90Total Area / Weighted Curve Number 70.3 90
SA5 Open space; grass cover < 50% (poor) C 1.5 86Residential districts (1/8 acre) C 1.8 90Total Area / Weighted Curve Number 3.3 88
SA6 Residential districts (1/8 acre) C 12.2 90
SA7 Open space; grass cover < 50% (poor) C 18 86Residential districts (1/8 acre) C 21.9 90Total Area / Weighted Curve Number 39.9 88
GDL WHIM DEVELOPED SCENARIOType III rain distribution
Sub-Area Land Use and Curve Number Details

23
The runoff from subarea 2 is controlled by the box culvert and that feature is added to the model by including a weir structure at the downstream end of the subarea and is identified as weir NE in table 5. The anticipated flows in the main drainage features from the subdivision are shown in Table 4
TABLE 4
AF ENG GDL WHIM DEVELOPED SCENARIO
Region: OLD HARBOUR Locale: SAINT CATHERINE
Hydrograph Peak/Peak Time TablePeak Flow and Peak Time (hr) by Rainfall Return Period
Sub-Area 10-Yr 25-Yror Reach (cms) (cms)Identifier (hr) (hr)SA1 12.58 7.26 12.58 9.2SA2 12.72 20.6 12.69 26.61SA3 12.32 9.48 12.31 11.97SA4 12.36 19.97 12.37 25.26SA5 12.16 1.27 12.17 1.61
South DrainageSA6 12.21 4.34 12.21 5.48SA7 12.48 9.8 12.46 12.45
REACHES 10-Yr 25-Yr(hr) (cms) (hr) (cms)
R3 12.41 15.39 12.41 19.49Down 12.54 15.23 12.53 19.29R4 12.51 28.76 12.51 37.38Down 12.54 28.74 12.55 37.37R5 12.54 44.4 12.53 57.23Down 12.55 44.28 12.54 57.08R2 12.72 20.6 12.69 26.61Down 12.99 17.29 12.96 23.07
44.28 57.08
REACHES SOUTHR1 12.21 4.34 12.21 5.48Down 12.44 2.84 12.5 3.06R2 12.48 12.63 12.48 15.5Down 12.98 6.29 13.1 7R3 12.98 6.29 13.1 7Down 13.02 6.29 13.14 7
6.29 7OUTLET to Brampton Drain
Type III rain distribution
OUTLET to Bowers Gully
Reach PoolIdendifier Stage Storage
(m) (ha m) Length (2.4m)WEIR NE 0 0 0
0.15 0.15 0.2210.3 0.3 0.624
0.61 0.61 1.7661.52 1.52 6.983.05 3.05 19.7426.1 6.1 55.84
Reach PoolIdendifier Stage Storage
(m) (ha m) 900mmPIPE 1 0 0 0
0.38 0.11 2.6250.75 0.22 2.8211.5 0.45 3.176
3.75 1.13 4.067.5 2.25 5.2115 4.5 6.961
Reach PoolIdendifier Stage Storage
(m) (ha m) 1220mmPIPE 2 0 0 0
0.46 0.37 4.7460.91 0.73 5.1871.83 1.46 5.9734.57 3.66 7.8749.14 7.31 10.288
18.28 14.62 13.913
Flows(cms) @ Weir Length
Flows (cms) @ Pipe Diameter
Flows (cms) @ Pipe Diameter
It is proposed to include detention features in the southern drainage areas of the site that discharge onto the Brampton lands. A detention feature is proposed in Block A and a second within the JPS reserve. The ponds are created by converting deep ravines from the existing Whim drain by constructing embankments with pipes that cross the embankments to control the downstream peak discharge. Table 5 shows the stage and flows that are expected to flow through the culverts from the detention features given the size of detention feature. The down
TABLE 5

24
stream flows are shown in Table 4. The inclusion of these features reduces the downstream flow and increases the infiltration potential thereby enhancing the possibility of aquifer recharge.
Table 6 GDL WHIM ‐ CENTRAL MAIN DRAIN SIZES
No. REACH Description Bottom Width Height depth Q m3/s slopem m of flow
1 0+000 ‐ 0+620 Rectangular Reinforced Concrete
6.00 1.50 1.03 32 0.64%
2 0+620 ‐ 1+320 Rectangular Reinforced Concrete
6.00 1.85 1.47 37 0.30%
3 1+320 ‐ 1+420 Rectangular Reinforced Concrete
9.00 1.80 1.43 57 0.30%
4 1+420 ‐ Bowers Gully Trapezoidal Gravel lined 9.00 2.50 1.95 57 0.20%
N.B. All dimensions are internal dimensions
The central collector drain flows and drain sizes are shown in Table 6. The drain sizes were determined using the Manning’s method of determining channel velocity and the method is outlined in the following section of the report. The Housing Block drainage is presented in the subdivision drawings. The micro catchments were delineated and the flows estimated using the rational method. The pipe culverts and open drains presented in the drawings submitted were sized to meet the criteria set out in this document.
Manning’s Open Channel drain design method
The Manning’s method of determining velocity of channel flow is used to size the drain cross sections. An outline of the method is shown below.

25
Variables [] indicates dimensions
A = Flow cross-sectional area, determined normal (perpendicular) to the bottom surface [L2]
b = Channel bottom width [L].
F = Froude number. F is a non-dimensional parameter indicating the relative effect of inertial effects to gravity effects.
Flows with F<1 are low velocity flows called subcritical. F>1 are high velocity flows called supercritical. Subcritical flows are controlled by downstream obstructions while supercritical flows are affected by upstream controls. F=1 flows are called critical. g = acceleration due to gravity = 32.174 ft/s2 = 9.8066 m/s2. g is used in the equation for Froude number. k = unit conversion factor = 1.49 if English units = 1.0 if metric units.
n = Manning coefficient
P = Wetted perimeter [L]. P is the contact length between the water and the channel bottom and sides.
Q = Discharge or flowrate [L3/T].
R = Hydraulic radius of the flow cross-section [L].
S = Slope of channel bottom or water surface [L/L]. Vertical distance divided by horizontal distance.
T = Top width of the flowing water [L].
V = Average velocity of the water [L/T]. y = Water depth measured normal (perpendicular) to the bottom of the channel [L
z1, z2 = Side slopes of each bank of the channel.

26
The manning friction coefficients used are shown in the table below.
Material Manning n Material Manning n
Natural Streams Excavated Earth Channels
Clean and Straight 0.030 Clean 0.022
Major Rivers 0.035 Gravelly 0.025
Sluggish with Deep Pools
0.040 Weedy 0.030
Stony, Cobbles 0.035
Metals Floodplains
Brass 0.011 Pasture, Farmland 0.035
Cast Iron 0.013 Light Brush 0.050
Smooth Steel 0.012 Heavy Brush 0.075
Corrugated Metal 0.022 Trees 0.15
Non-Metals
Glass 0.010 Finished Concrete 0.012
Clay Tile 0.014 Unfinished Concrete 0.014
Brickwork 0.015 Gravel 0.029
Asphalt 0.016 Earth 0.025
Masonry 0.025 Planed Wood 0.012
Unplaned Wood 0.013
Corrugated Polyethylene (PE) with smooth inner walls 0.009-0.015
Corrugated Polyethylene (PE) with corrugated inner walls
0.018-0.025
Polyvinyl Chloride (PVC) with smooth inner walls 0.009-0.011

27
Conclusion
The primary drainage feature for this development is the Central Main Drain. That central drain collects storm water flows originating upstream of the proposed development and the flows from the development blocks and convey them to the Bowers Gully.
The development blocks will be graded to fall toward storm sewers or minor paved drains that will fall toward the central drainage system. If the drainage system for the development sub areas called blocks is obstructed by debris the finished ground is to be graded to allow for storm water to overtop the drainage infrastructure and to flow toward the Central Main Drain and out to the Bowers Gully. This feature will limit the extent of flooding during storm events that exceed the design runoff event.
The main drainage feature in the area is the Bowers Gully and with its fairly large estuary will naturally improve storm water quality before discharge into the Sea.
A separate hydrologic evaluation has been prepared for the effects the flows from the gully may have on the proposed development and the effect of the flow from the development on the Gully.
The data presented and the designs forwarded in this report ought to provide an adequate description of the drainage features required for the successful development of this property as a housing estate.
Prepared by:
Ivan Andrew Foreman P.E.
AF ENGINEERING
DATE: June 25, 2009