ge 1q 2016 earnings · ge 1q 2016 earnings april 22, 2016 ge earnings press release 1q16 043125...
TRANSCRIPT
GE 1Q 2016 EARNINGS APRIL 22, 2016
GE Earnings Press Release 1Q16 043125 GE_PR15_1Q16_v25 04/22/16 page 1
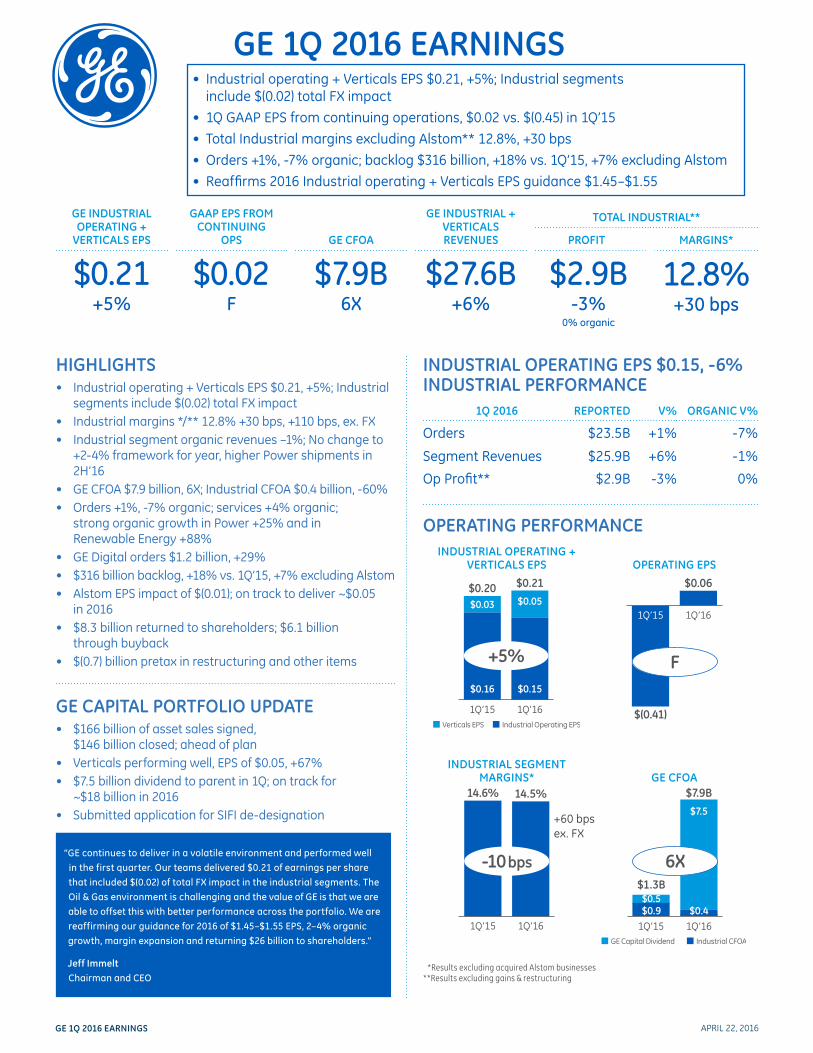
“GE continues to deliver in a volatile environment and performed well
in the first quarter. Our teams delivered $0.21 of earnings per share
that included $(0.02) of total FX impact in the industrial segments. The
Oil & Gas environment is challenging and the value of GE is that we are
able to offset this with better performance across the portfolio. We are
reaffirming our guidance for 2016 of $1.45–$1.55 EPS, 2–4% organic
growth, margin expansion and returning $26 billion to shareholders.”
Jeff Immelt
Chairman and CEO
GE INDUSTRIAL OPERATING +
VERTICALS EPS
GAAP EPS FROM CONTINUING
OPS GE CFOA
GE INDUSTRIAL + VERTICALS REVENUES
TOTAL INDUSTRIAL**
PROFIT MARGINS*
$0.21+5%
$0.02F
$7.9B6X
$27.6B+6%
$2.9B-3%
0% organic
12.8%+30 bps
GE 1Q 2016 EARNINGS
HIGHLIGHTS• Industrial operating + Verticals EPS $0.21, +5%; Industrial
segments include $(0.02) total FX impact• Industrial margins */** 12.8% +30 bps, +110 bps, ex. FX• Industrial segment organic revenues –1%; No change to
+2-4% framework for year, higher Power shipments in 2H’16
• GE CFOA $7.9 billion, 6X; Industrial CFOA $0.4 billion, -60%• Orders +1%, -7% organic; services +4% organic;
strong organic growth in Power +25% and in Renewable Energy +88%
• GE Digital orders $1.2 billion, +29%• $316 billion backlog, +18% vs. 1Q’15, +7% excluding Alstom• Alstom EPS impact of $(0.01); on track to deliver ~$0.05
in 2016• $8.3 billion returned to shareholders; $6.1 billion
through buyback• $(0.7) billion pretax in restructuring and other items
GE CAPITAL PORTFOLIO UPDATE• $166 billion of asset sales signed,
$146 billion closed; ahead of plan • Verticals performing well, EPS of $0.05, +67%• $7.5 billion dividend to parent in 1Q; on track for
~$18 billion in 2016• Submitted application for SIFI de-designation
INDUSTRIAL OPERATING EPS $0.15, -6% INDUSTRIAL PERFORMANCE
1Q 2016 REPORTED V% ORGANIC V%
Orders $23.5B +1% -7%
Segment Revenues $25.9B +6% -1%
Op Profit** $2.9B -3% 0%
OPERATING PERFORMANCEINDUSTRIAL OPERATING +
VERTICALS EPS
OPERATING EPS
1Q’161Q’15
$0.21
$0.05
$0.16 $0.15
$0.03
$0.20
+5%
Verticals EPS Industrial Operating EPS
1Q’161Q’15
$0.06
$(0.41)
F
INDUSTRIAL SEGMENT MARGINS*
GE CFOA
1Q’161Q’15
14.5%14.6%
-10 bps
1Q’161Q’15
$7.9B
$7.5
$0.9 $0.4$0.5
$1.3B
6X
GE Capital Dividend Industrial CFOA
• Industrial operating + Verticals EPS $0.21, +5%; Industrial segments include $(0.02) total FX impact
• 1Q GAAP EPS from continuing operations, $0.02 vs. $(0.45) in 1Q’15
• Total Industrial margins excluding Alstom** 12.8%, +30 bps
• Orders +1%, -7% organic; backlog $316 billion, +18% vs. 1Q’15, +7% excluding Alstom
• Reaffirms 2016 Industrial operating + Verticals EPS guidance $1.45–$1.55
*Results excluding acquired Alstom businesses**Results excluding gains & restructuring
+60 bps ex. FX

GE 1Q 2016 EARNINGS APRIL 22, 2016
GE Earnings Press Release 1Q16 043125 GE_PR15_1Q16_v25 04/22/16 page 2
2
INDUSTRIAL DEAL HIGHLIGHTS
Power: 6 HA turbine orders in the U.S., 4 HA turbines shipped; backlog at 35
Oil & Gas: Signed industry’s first performance-based blow out preventer agreement with Diamond Offshore Drilling
Renewable Energy: Over 1,550 MW of orders received for onshore wind; new 2.X and 3.X NPIs
Current, powered by GE: World’s largest single-order LED installation with JPMorgan Chase & Co.
Healthcare: U.S. equipment orders +8%; China orders +11%; Bioprocess +7% ex. FX
Aviation: GE9X began testing; currently 612 engines on order
Energy Connections: 4 major global deals for GE solar inverters totaling $215 million
GE STORE HIGHLIGHTS
GE Digital: Opened Predix for general availability; 7,500+ developers have registered for the platform
GE Digital: Transportation signed deal to implement 1st Predix-based Smart Intermodal Terminal system for a major Class 1 customer
GE Digital: Signed partnership with Oracle to develop complementary solutions for industrial apps
GE + Alstom: 5 heat recovery steam generator orders; solution utilizes both GE and Alstom technology
Access GE: GE Capital Verticals enabled $1.2 billion in Industrial orders
GRC: Opened flagship additive manufacturing facility in Pittsburgh for services across the company
Metem acquisition: Precision machining provider helps improve supply chain efficiency and reduce costs for Power’s gas turbine production
INDUSTRIAL OPERATING PERFORMANCE
BACKLOG
ORDERS
1Q’161Q’15
$316B
$88
$198 $228
$70
$268B
+18%
Equipment Services
1Q’161Q’15
$23.5B
$11.0
$11.1 $12.4
$12.0
$23.1B
+1%
Equipment Services
TOTAL INDUSTRIAL PROFIT** SEGMENT GROSS MARGINS*
1Q’161Q’15
$2.9B$3.0B
-3%
1Q’161Q’15
26.2%26.2%
0 bps
1Q’16 GE CAPITAL HIGHLIGHTS
GE CAPITAL EARNINGS WALK 1Q’16
Verticals $496MMOther Continuing $(1,389)MM
Capital $(893)MMDiscontinued operations $(308)MM
GE Capital $(1,201)MM
ENI (EX. LIQUIDITY) INCL. DISC. OPS.
DIVIDEND TO PARENT
$7.5B
GE CAPITAL TIER 1 COMMON RATIO²
14.5%
“A transformed GE is well positioned to deliver for shareholders. Today our portfolio is simpler and stronger. We are ahead of the GE Capital exit plan with $166B in deals signed. We are already seeing valuable synergies from the Alstom acquisition. Our investments in GE Digital have positioned us as the leader in the Industrial Internet. We opened Predix in the first quarter and have more than 7,500 developers registered. GE is executing well and is on track to meet its investor goals for 2016.”
Jeff Immelt Chairman and CEO
¹ Capital continuing ENI (ex. liq.) of $303 billion in 1Q’15 (as originally reported) and $81 billion in 1Q’16²Basel 3 Tier 1 Common ratio estimated based on U.S. standardized transitional basis
*Results excluding acquired Alstom businesses**Results excluding gains and restructuring
1Q’161Q’15
$127B¹
$331B¹
-62%+80 bps ex. FX
GE 1Q 2016 EARNINGS APRIL 22, 2016
GE Earnings Press Release 1Q16 043125 GE_PR15_1Q16_v25 04/22/16 page 3
3
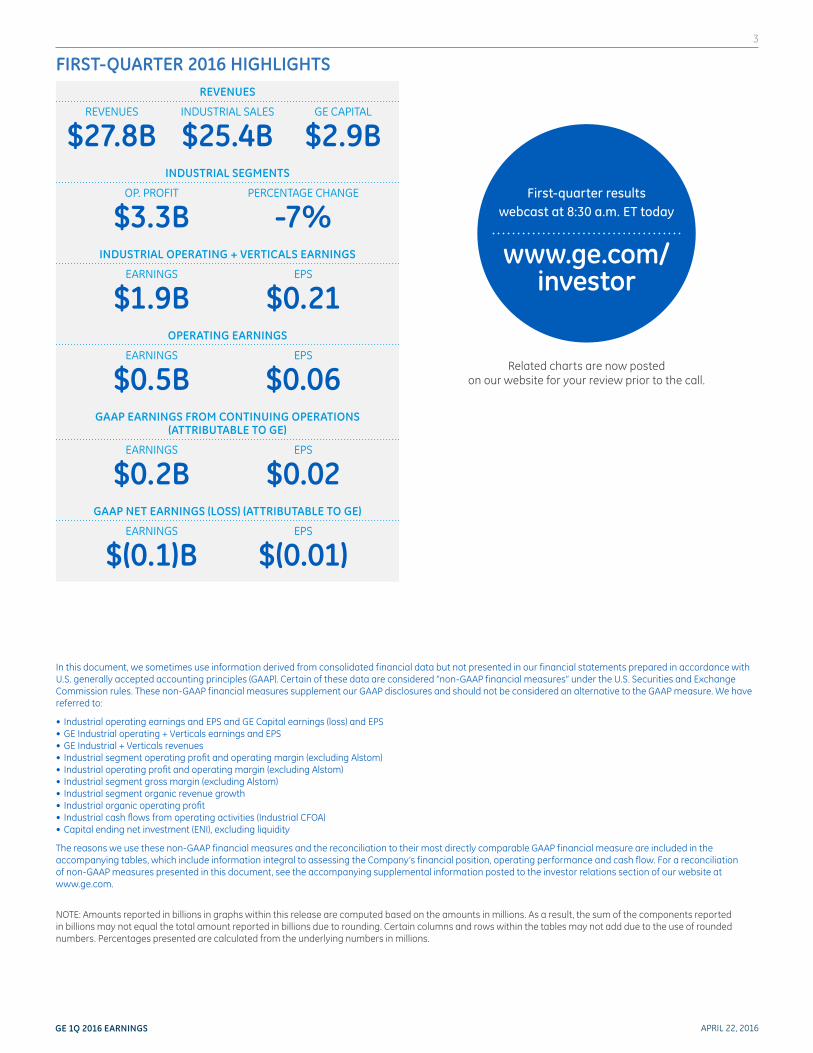
Related charts are now posted on our website for your review prior to the call.
www.ge.com/investor
First-quarter results webcast at 8:30 a.m. ET today
In this document, we sometimes use information derived from consolidated financial data but not presented in our financial statements prepared in accordance with U.S. generally accepted accounting principles (GAAP). Certain of these data are considered “non-GAAP financial measures” under the U.S. Securities and Exchange Commission rules. These non-GAAP financial measures supplement our GAAP disclosures and should not be considered an alternative to the GAAP measure. We have referred to:
• Industrial operating earnings and EPS and GE Capital earnings (loss) and EPS• GE Industrial operating + Verticals earnings and EPS• GE Industrial + Verticals revenues• Industrial segment operating profit and operating margin (excluding Alstom)• Industrial operating profit and operating margin (excluding Alstom)• Industrial segment gross margin (excluding Alstom)• Industrial segment organic revenue growth• Industrial organic operating profit• Industrial cash flows from operating activities (Industrial CFOA)• Capital ending net investment (ENI), excluding liquidity
The reasons we use these non-GAAP financial measures and the reconciliation to their most directly comparable GAAP financial measure are included in the accompanying tables, which include information integral to assessing the Company’s financial position, operating performance and cash flow. For a reconciliation of non-GAAP measures presented in this document, see the accompanying supplemental information posted to the investor relations section of our website at www.ge.com.
NOTE: Amounts reported in billions in graphs within this release are computed based on the amounts in millions. As a result, the sum of the components reported in billions may not equal the total amount reported in billions due to rounding. Certain columns and rows within the tables may not add due to the use of rounded numbers. Percentages presented are calculated from the underlying numbers in millions.
FIRST-QUARTER 2016 HIGHLIGHTSREVENUES
REVENUES INDUSTRIAL SALES GE CAPITAL
$27.8B $25.4B $2.9BINDUSTRIAL SEGMENTS
OP. PROFIT PERCENTAGE CHANGE
$3.3B -7%INDUSTRIAL OPERATING + VERTICALS EARNINGS
EARNINGS EPS
$1.9B $0.21OPERATING EARNINGS
EARNINGS EPS
$0.5B $0.06GAAP EARNINGS FROM CONTINUING OPERATIONS
(ATTRIBUTABLE TO GE)
EARNINGS EPS
$0.2B $0.02GAAP NET EARNINGS (LOSS) (ATTRIBUTABLE TO GE)
EARNINGS EPS
$(0.1)B $(0.01)
GE 1Q 2016 EARNINGS APRIL 22, 2016
GE Earnings Press Release 1Q16 043125 GE_PR15_1Q16_v25 04/22/16 page 4
4
Caution Concerning Forward-Looking Statements:This document contains “forward-looking statements” — that is, statements related to future events that by their nature address matters that are, to different degrees, uncertain. For details on the uncertainties that may cause our actual future results to be materially different than those expressed in our forward-looking statements, visit http://www.ge.com/investor-relations/disclaimer-caution-concerning-forward-looking-statements as well as our annual reports on Form 10-K and quarterly reports on Form 10-Q. We do not undertake to update our forward-looking statements. This document also includes certain forward-looking projected financial information that is based on current estimates and forecasts. Actual results could differ materially.
General Electric Capital Corporation (GECC) was merged into GE in 2015 and our financial services business is now operated by GE Capital Global Holdings LLC (GECGH). In this document, we refer to GECC and GECGH as “GE Capital”. We refer to the industrial businesses of the Company including GE Capital on an equity basis as “GE”. “GE (ex-GE Capital)” and /or “Industrial” refer to GE excluding GE Capital.
Investor Contact: Matt Cribbins, 203.373.2424 [email protected]
Media Contact: Jennifer Erickson, 646.682.5620 [email protected]
GE’s Investor Relations website at www.ge.com/investor and our corporate blog at www.gereports.com, as well as GE’s Facebook page and Twitter accounts, including @GE_Reports, contain a significant amount of information about GE, including financial and other information for investors. GE encourages investors to visit these websites from time to time, as information is updated and new information is posted.
GE 1Q 2016 EARNINGS APRIL 22, 2016
GE Earnings Press Release 1Q16 043125 GE_PR15_1Q16_v25 04/22/16 page 5
5
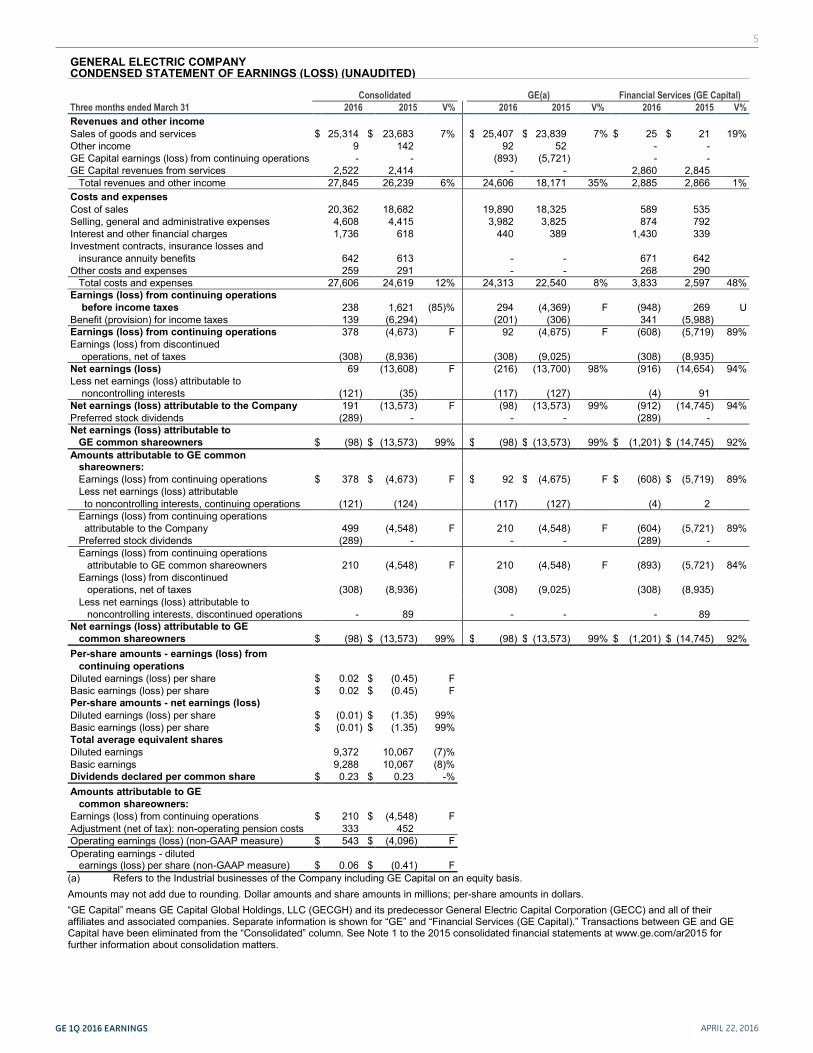
GENERAL ELECTRIC COMPANY CONDENSED STATEMENT OF EARNINGS (LOSS) (UNAUDITED) Consolidated GE(a) Financial Services (GE Capital) Three months ended March 31 2016 2015 V% 2016 2015 V% 2016 2015 V% Revenues and other income Sales of goods and services $ 25,314 $ 23,683 7% $ 25,407 $ 23,839 7% $ 25 $ 21 19% Other income 9 142 92 52 - - GE Capital earnings (loss) from continuing operations - - (893) (5,721) - - GE Capital revenues from services 2,522 2,414 - - 2,860 2,845 Total revenues and other income 27,845 26,239 6% 24,606 18,171 35% 2,885 2,866 1% Costs and expenses Cost of sales 20,362 18,682 19,890 18,325 589 535 Selling, general and administrative expenses 4,608 4,415 3,982 3,825 874 792 Interest and other financial charges 1,736 618 440 389 1,430 339 Investment contracts, insurance losses and insurance annuity benefits 642 613 - - 671 642 Other costs and expenses 259 291 - - 268 290 Total costs and expenses 27,606 24,619 12% 24,313 22,540 8% 3,833 2,597 48% Earnings (loss) from continuing operations before income taxes 238 1,621 (85)% 294 (4,369) F (948) 269 U Benefit (provision) for income taxes 139 (6,294) (201) (306) 341 (5,988) Earnings (loss) from continuing operations 378 (4,673) F 92 (4,675) F (608) (5,719) 89% Earnings (loss) from discontinued operations, net of taxes (308) (8,936) (308) (9,025) (308) (8,935) Net earnings (loss) 69 (13,608) F (216) (13,700) 98% (916) (14,654) 94% Less net earnings (loss) attributable to noncontrolling interests (121) (35) (117) (127) (4) 91 Net earnings (loss) attributable to the Company 191 (13,573) F (98) (13,573) 99% (912) (14,745) 94% Preferred stock dividends (289) - - - (289) - Net earnings (loss) attributable to GE common shareowners $ (98) $ (13,573) 99% $ (98) $ (13,573) 99% $ (1,201) $ (14,745) 92% Amounts attributable to GE common shareowners: Earnings (loss) from continuing operations $ 378 $ (4,673) F $ 92 $ (4,675) F $ (608) $ (5,719) 89% Less net earnings (loss) attributable to noncontrolling interests, continuing operations (121) (124) (117) (127) (4) 2 Earnings (loss) from continuing operations attributable to the Company 499 (4,548) F 210 (4,548) F (604) (5,721) 89% Preferred stock dividends (289) - - - (289) - Earnings (loss) from continuing operations attributable to GE common shareowners 210 (4,548) F 210 (4,548) F (893) (5,721) 84% Earnings (loss) from discontinued operations, net of taxes (308) (8,936) (308) (9,025) (308) (8,935) Less net earnings (loss) attributable to noncontrolling interests, discontinued operations - 89 - - - 89 Net earnings (loss) attributable to GE common shareowners $ (98) $ (13,573) 99% $ (98) $ (13,573) 99% $ (1,201) $ (14,745) 92% Per-share amounts - earnings (loss) from continuing operations Diluted earnings (loss) per share $ 0.02 $ (0.45) F Basic earnings (loss) per share $ 0.02 $ (0.45) F Per-share amounts - net earnings (loss) Diluted earnings (loss) per share $ (0.01) $ (1.35) 99% Basic earnings (loss) per share $ (0.01) $ (1.35) 99% Total average equivalent shares Diluted earnings 9,372 10,067 (7)% Basic earnings 9,288 10,067 (8)% Dividends declared per common share $ 0.23 $ 0.23 -% Amounts attributable to GE common shareowners: Earnings (loss) from continuing operations $ 210 $ (4,548) F Adjustment (net of tax): non-operating pension costs 333 452 Operating earnings (loss) (non-GAAP measure) $ 543 $ (4,096) F Operating earnings - diluted earnings (loss) per share (non-GAAP measure) $ 0.06 $ (0.41) F (a) Refers to the Industrial businesses of the Company including GE Capital on an equity basis.
Amounts may not add due to rounding. Dollar amounts and share amounts in millions; per-share amounts in dollars.
“GE Capital” means GE Capital Global Holdings, LLC (GECGH) and its predecessor General Electric Capital Corporation (GECC) and all of their affiliates and associated companies. Separate information is shown for “GE” and “Financial Services (GE Capital).” Transactions between GE and GE Capital have been eliminated from the “Consolidated” column. See Note 1 to the 2015 consolidated financial statements at www.ge.com/ar2015 for further information about consolidation matters.
GE 1Q 2016 EARNINGS APRIL 22, 2016
GE Earnings Press Release 1Q16 043125 GE_PR15_1Q16_v25 04/22/16 page 6
6
GENERAL ELECTRIC COMPANY SUMMARY OF OPERATING SEGMENTS (UNAUDITED)
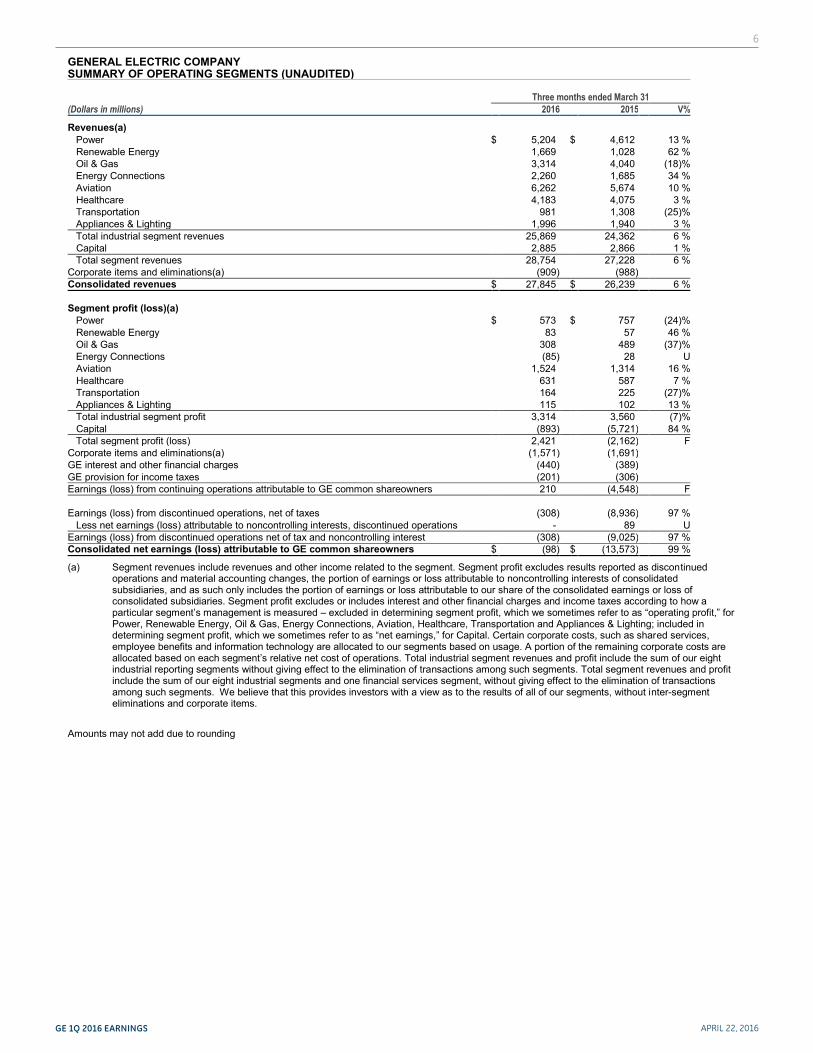
Three months ended March 31 (Dollars in millions) 2016 2015 V% Revenues(a) Power $ 5,204 $ 4,612 13 % Renewable Energy 1,669 1,028 62 % Oil & Gas 3,314 4,040 (18)% Energy Connections 2,260 1,685 34 % Aviation 6,262 5,674 10 % Healthcare 4,183 4,075 3 % Transportation 981 1,308 (25)% Appliances & Lighting 1,996 1,940 3 % Total industrial segment revenues 25,869 24,362 6 % Capital 2,885 2,866 1 % Total segment revenues 28,754 27,228 6 % Corporate items and eliminations(a) (909) (988) Consolidated revenues $ 27,845 $ 26,239 6 % Segment profit (loss)(a) Power $ 573 $ 757 (24)% Renewable Energy 83 57 46 % Oil & Gas 308 489 (37)% Energy Connections (85) 28 U Aviation 1,524 1,314 16 % Healthcare 631 587 7 % Transportation 164 225 (27)% Appliances & Lighting 115 102 13 % Total industrial segment profit 3,314 3,560 (7)% Capital (893) (5,721) 84 % Total segment profit (loss) 2,421 (2,162) F Corporate items and eliminations(a) (1,571) (1,691) GE interest and other financial charges (440) (389) GE provision for income taxes (201) (306) Earnings (loss) from continuing operations attributable to GE common shareowners 210 (4,548) F Earnings (loss) from discontinued operations, net of taxes (308) (8,936) 97 % Less net earnings (loss) attributable to noncontrolling interests, discontinued operations - 89 U Earnings (loss) from discontinued operations net of tax and noncontrolling interest (308) (9,025) 97 % Consolidated net earnings (loss) attributable to GE common shareowners $ (98) $ (13,573) 99 % (a) Segment revenues include revenues and other income related to the segment. Segment profit excludes results reported as discontinued
operations and material accounting changes, the portion of earnings or loss attributable to noncontrolling interests of consolidated subsidiaries, and as such only includes the portion of earnings or loss attributable to our share of the consolidated earnings or loss of consolidated subsidiaries. Segment profit excludes or includes interest and other financial charges and income taxes according to how a particular segment’s management is measured – excluded in determining segment profit, which we sometimes refer to as “operating profit,” for Power, Renewable Energy, Oil & Gas, Energy Connections, Aviation, Healthcare, Transportation and Appliances & Lighting; included in determining segment profit, which we sometimes refer to as “net earnings,” for Capital. Certain corporate costs, such as shared services, employee benefits and information technology are allocated to our segments based on usage. A portion of the remaining corporate costs are allocated based on each segment’s relative net cost of operations. Total industrial segment revenues and profit include the sum of our eight industrial reporting segments without giving effect to the elimination of transactions among such segments. Total segment revenues and profit include the sum of our eight industrial segments and one financial services segment, without giving effect to the elimination of transactions among such segments. We believe that this provides investors with a view as to the results of all of our segments, without inter-segment eliminations and corporate items.
Amounts may not add due to rounding
GE 1Q 2016 EARNINGS APRIL 22, 2016
GE Earnings Press Release 1Q16 043125 GE_PR15_1Q16_v25 04/22/16 page 7
7
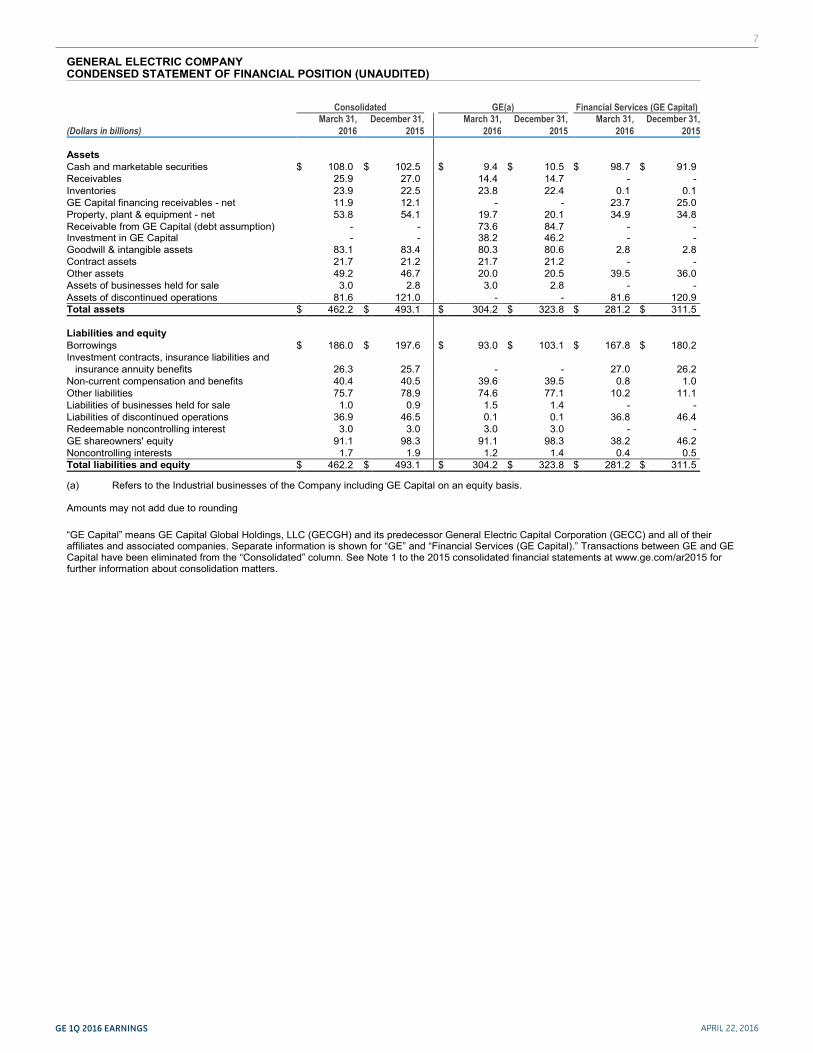
GENERAL ELECTRIC COMPANY CONDENSED STATEMENT OF FINANCIAL POSITION (UNAUDITED)
Consolidated GE(a) Financial Services (GE Capital) March 31, December 31, March 31, December 31, March 31, December 31,
(Dollars in billions) 2016 2015 2016 2015 2016 2015 Assets Cash and marketable securities $ 108.0 $ 102.5 $ 9.4 $ 10.5 $ 98.7 $ 91.9 Receivables 25.9 27.0 14.4 14.7 - - Inventories 23.9 22.5 23.8 22.4 0.1 0.1 GE Capital financing receivables - net 11.9 12.1 - - 23.7 25.0 Property, plant & equipment - net 53.8 54.1 19.7 20.1 34.9 34.8 Receivable from GE Capital (debt assumption) - - 73.6 84.7 - - Investment in GE Capital - - 38.2 46.2 - - Goodwill & intangible assets 83.1 83.4 80.3 80.6 2.8 2.8 Contract assets 21.7 21.2 21.7 21.2 - - Other assets 49.2 46.7 20.0 20.5 39.5 36.0 Assets of businesses held for sale 3.0 2.8 3.0 2.8 - - Assets of discontinued operations 81.6 121.0 - - 81.6 120.9 Total assets $ 462.2 $ 493.1 $ 304.2 $ 323.8 $ 281.2 $ 311.5 Liabilities and equity Borrowings $ 186.0 $ 197.6 $ 93.0 $ 103.1 $ 167.8 $ 180.2 Investment contracts, insurance liabilities and insurance annuity benefits 26.3 25.7 - - 27.0 26.2 Non-current compensation and benefits 40.4 40.5 39.6 39.5 0.8 1.0 Other liabilities 75.7 78.9 74.6 77.1 10.2 11.1 Liabilities of businesses held for sale 1.0 0.9 1.5 1.4 - - Liabilities of discontinued operations 36.9 46.5 0.1 0.1 36.8 46.4 Redeemable noncontrolling interest 3.0 3.0 3.0 3.0 - - GE shareowners' equity 91.1 98.3 91.1 98.3 38.2 46.2 Noncontrolling interests 1.7 1.9 1.2 1.4 0.4 0.5 Total liabilities and equity $ 462.2 $ 493.1 $ 304.2 $ 323.8 $ 281.2 $ 311.5 (a) Refers to the Industrial businesses of the Company including GE Capital on an equity basis. Amounts may not add due to rounding
“GE Capital” means GE Capital Global Holdings, LLC (GECGH) and its predecessor General Electric Capital Corporation (GECC) and all of their affiliates and associated companies. Separate information is shown for “GE” and “Financial Services (GE Capital).” Transactions between GE and GE Capital have been eliminated from the “Consolidated” column. See Note 1 to the 2015 consolidated financial statements at www.ge.com/ar2015 for further information about consolidation matters.
GE 1Q 2016 EARNINGS APRIL 22, 2016
GE Earnings Press Release 1Q16 043125 GE_PR15_1Q16_v25 04/22/16 page 8
8
GENERAL ELECTRIC COMPANY Financial Measures That Supplement GAAP
We sometimes use financial measures derived from consolidated financial information but not presented in our financial statements prepared in accordance with U.S. generally accepted accounting principles (GAAP). Certain of these are considered “non-GAAP financial measures” under the U.S. Securities and Exchange Commission rules. The following non-GAAP financial measures supplement our GAAP disclosures and should not be considered an alternative to the GAAP measure. Industrial and GE Capital operating earnings (loss) and EPS
GE Industrial operating + Verticals Earnings and EPS
GE Industrial + Verticals revenues
Industrial segment operating profit and operating profit margin (excluding Alstom)
Industrial operating profit and operating profit margin (excluding Alstom)
Industrial organic operating profit
Industrial segment gross margins (excluding Alstom)
Industrial segment organic revenue growth
Industrial cash flows from operating activities (Industrial CFOA)
Capital ending net investment (ENI), excluding liquidity
The reasons we use these non-GAAP financial measures and the reconciliations to their most directly comparable GAAP financial measures follow. Certain columns, rows or percentages within these reconciliations may not add or recalculate due to the use of rounded numbers. Totals and percentages presented are calculated from the underlying numbers in millions.
GE 1Q 2016 EARNINGS APRIL 22, 2016
GE Earnings Press Release 1Q16 043125 GE_PR15_1Q16_v25 04/22/16 page 9
9
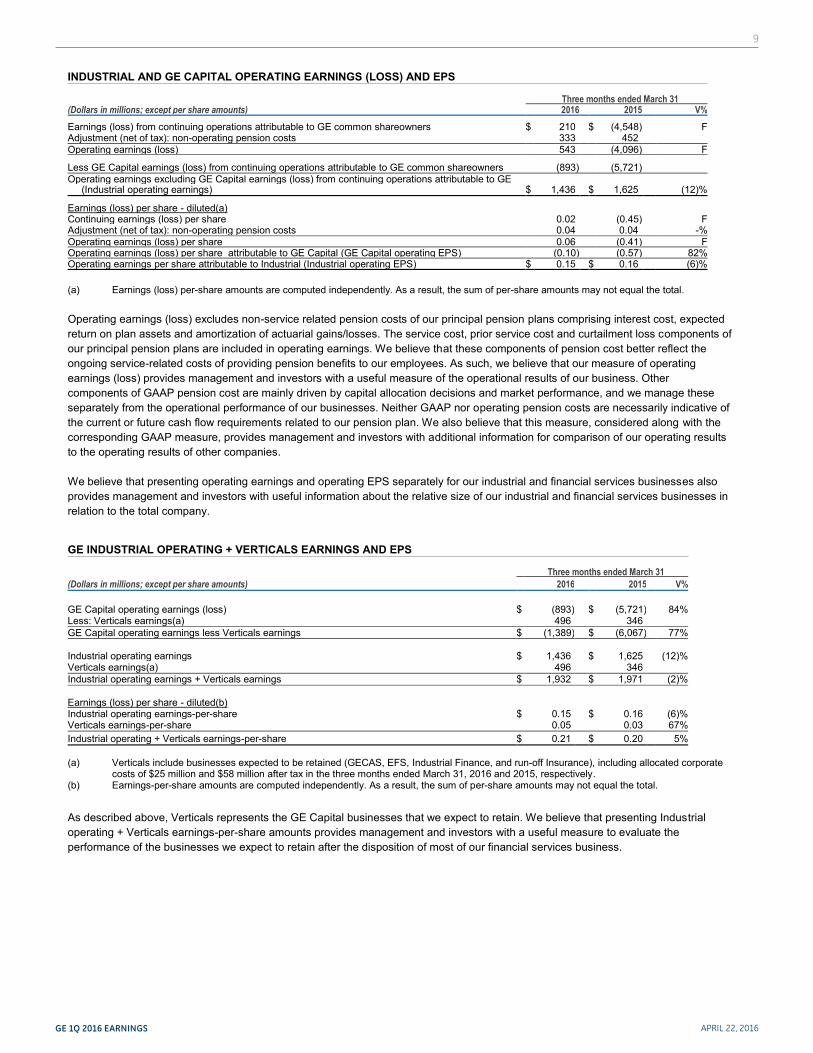
INDUSTRIAL AND GE CAPITAL OPERATING EARNINGS (LOSS) AND EPS Three months ended March 31 (Dollars in millions; except per share amounts) 2016 2015 V% Earnings (loss) from continuing operations attributable to GE common shareowners $ 210 $ (4,548) F Adjustment (net of tax): non-operating pension costs 333 452 Operating earnings (loss) 543 (4,096) F Less GE Capital earnings (loss) from continuing operations attributable to GE common shareowners (893) (5,721) Operating earnings excluding GE Capital earnings (loss) from continuing operations attributable to GE (Industrial operating earnings) $ 1,436 $ 1,625 (12)% Earnings (loss) per share - diluted(a) Continuing earnings (loss) per share 0.02 (0.45) F Adjustment (net of tax): non-operating pension costs 0.04 0.04 -% Operating earnings (loss) per share 0.06 (0.41) F Operating earnings (loss) per share attributable to GE Capital (GE Capital operating EPS) (0.10) (0.57) 82% Operating earnings per share attributable to Industrial (Industrial operating EPS) $ 0.15 $ 0.16 (6)% (a) Earnings (loss) per-share amounts are computed independently. As a result, the sum of per-share amounts may not equal the total. Operating earnings (loss) excludes non-service related pension costs of our principal pension plans comprising interest cost, expected return on plan assets and amortization of actuarial gains/losses. The service cost, prior service cost and curtailment loss components of our principal pension plans are included in operating earnings. We believe that these components of pension cost better reflect the ongoing service-related costs of providing pension benefits to our employees. As such, we believe that our measure of operating earnings (loss) provides management and investors with a useful measure of the operational results of our business. Other components of GAAP pension cost are mainly driven by capital allocation decisions and market performance, and we manage these separately from the operational performance of our businesses. Neither GAAP nor operating pension costs are necessarily indicative of the current or future cash flow requirements related to our pension plan. We also believe that this measure, considered along with the corresponding GAAP measure, provides management and investors with additional information for comparison of our operating results to the operating results of other companies. We believe that presenting operating earnings and operating EPS separately for our industrial and financial services businesses also provides management and investors with useful information about the relative size of our industrial and financial services businesses in relation to the total company. GE INDUSTRIAL OPERATING + VERTICALS EARNINGS AND EPS Three months ended March 31 (Dollars in millions; except per share amounts) 2016 2015 V% GE Capital operating earnings (loss) $ (893) $ (5,721) 84% Less: Verticals earnings(a) 496 346 GE Capital operating earnings less Verticals earnings $ (1,389) $ (6,067) 77% Industrial operating earnings $ 1,436 $ 1,625 (12)% Verticals earnings(a) 496 346 Industrial operating earnings + Verticals earnings $ 1,932 $ 1,971 (2)% Earnings (loss) per share - diluted(b) Industrial operating earnings-per-share $ 0.15 $ 0.16 (6)% Verticals earnings-per-share 0.05 0.03 67% Industrial operating + Verticals earnings-per-share $ 0.21 $ 0.20 5% (a) Verticals include businesses expected to be retained (GECAS, EFS, Industrial Finance, and run-off Insurance), including allocated corporate
costs of $25 million and $58 million after tax in the three months ended March 31, 2016 and 2015, respectively. (b) Earnings-per-share amounts are computed independently. As a result, the sum of per-share amounts may not equal the total.
As described above, Verticals represents the GE Capital businesses that we expect to retain. We believe that presenting Industrial operating + Verticals earnings-per-share amounts provides management and investors with a useful measure to evaluate the performance of the businesses we expect to retain after the disposition of most of our financial services business.
GE 1Q 2016 EARNINGS APRIL 22, 2016
GE Earnings Press Release 1Q16 043125 GE_PR15_1Q16_v25 04/22/16 page 10
10
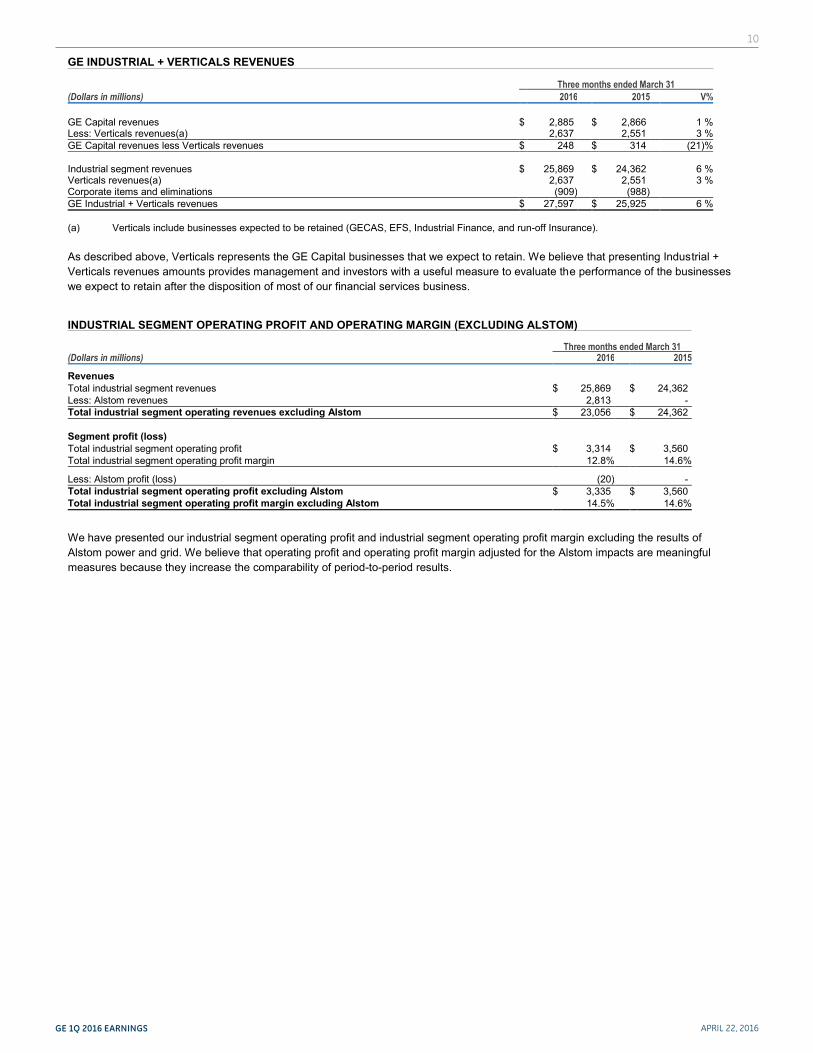
GE INDUSTRIAL + VERTICALS REVENUES Three months ended March 31 (Dollars in millions) 2016 2015 V% GE Capital revenues $ 2,885 $ 2,866 1 % Less: Verticals revenues(a) 2,637 2,551 3 % GE Capital revenues less Verticals revenues $ 248 $ 314 (21)% Industrial segment revenues $ 25,869 $ 24,362 6 % Verticals revenues(a) 2,637 2,551 3 % Corporate items and eliminations (909) (988) GE Industrial + Verticals revenues $ 27,597 $ 25,925 6 % (a) Verticals include businesses expected to be retained (GECAS, EFS, Industrial Finance, and run-off Insurance).
As described above, Verticals represents the GE Capital businesses that we expect to retain. We believe that presenting Industrial + Verticals revenues amounts provides management and investors with a useful measure to evaluate the performance of the businesses we expect to retain after the disposition of most of our financial services business. INDUSTRIAL SEGMENT OPERATING PROFIT AND OPERATING MARGIN (EXCLUDING ALSTOM)
Three months ended March 31 (Dollars in millions) 2016 2015 Revenues Total industrial segment revenues $ 25,869 $ 24,362 Less: Alstom revenues 2,813 - Total industrial segment operating revenues excluding Alstom $ 23,056 $ 24,362 Segment profit (loss) Total industrial segment operating profit $ 3,314 $ 3,560 Total industrial segment operating profit margin 12.8% 14.6% Less: Alstom profit (loss) (20) - Total industrial segment operating profit excluding Alstom $ 3,335 $ 3,560 Total industrial segment operating profit margin excluding Alstom 14.5% 14.6% We have presented our industrial segment operating profit and industrial segment operating profit margin excluding the results of Alstom power and grid. We believe that operating profit and operating profit margin adjusted for the Alstom impacts are meaningful measures because they increase the comparability of period-to-period results.
GE 1Q 2016 EARNINGS APRIL 22, 2016
GE Earnings Press Release 1Q16 043125 GE_PR15_1Q16_v25 04/22/16 page 11
11
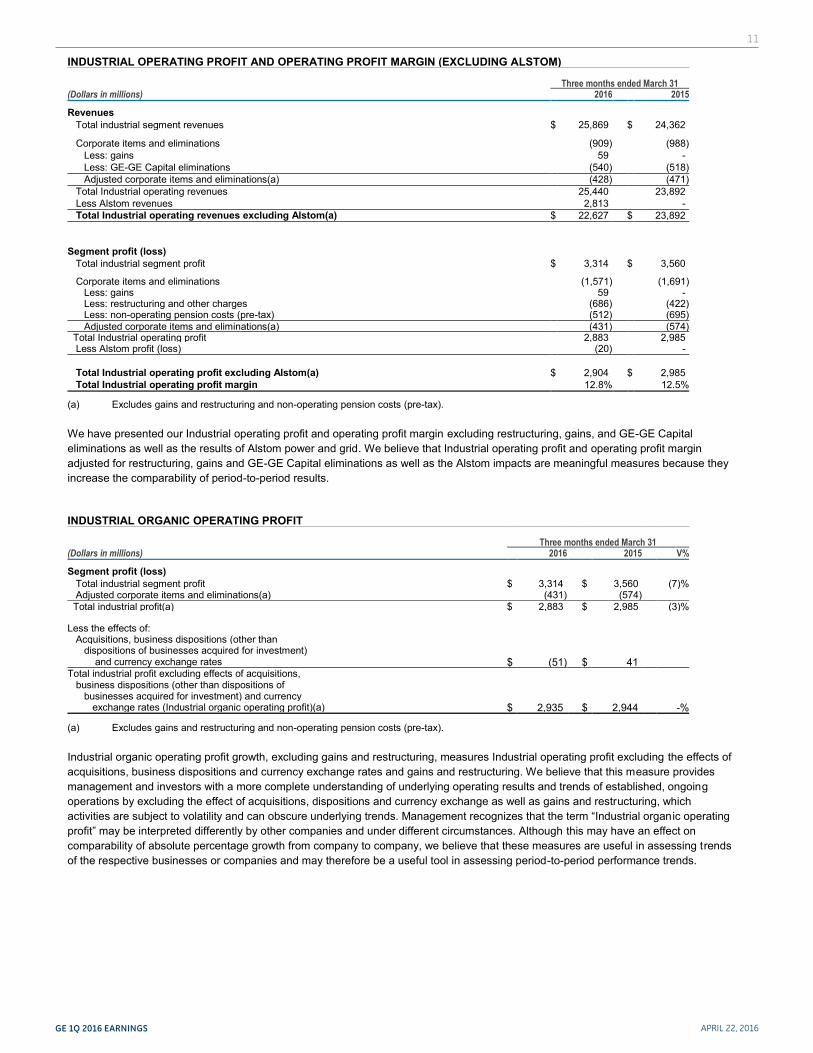
INDUSTRIAL OPERATING PROFIT AND OPERATING PROFIT MARGIN (EXCLUDING ALSTOM) Three months ended March 31 (Dollars in millions) 2016 2015 Revenues Total industrial segment revenues $ 25,869 $ 24,362 Corporate items and eliminations (909) (988) Less: gains 59 - Less: GE-GE Capital eliminations (540) (518) Adjusted corporate items and eliminations(a) (428) (471) Total Industrial operating revenues 25,440 23,892 Less Alstom revenues 2,813 - Total Industrial operating revenues excluding Alstom(a) $ 22,627 $ 23,892 Segment profit (loss) Total industrial segment profit $ 3,314 $ 3,560 Corporate items and eliminations (1,571) (1,691) Less: gains 59 - Less: restructuring and other charges (686) (422) Less: non-operating pension costs (pre-tax) (512) (695) Adjusted corporate items and eliminations(a) (431) (574) Total Industrial operating profit 2,883 2,985 Less Alstom profit (loss) (20) - Total Industrial operating profit excluding Alstom(a) $ 2,904 $ 2,985 Total Industrial operating profit margin 12.8% 12.5% (a) Excludes gains and restructuring and non-operating pension costs (pre-tax). We have presented our Industrial operating profit and operating profit margin excluding restructuring, gains, and GE-GE Capital eliminations as well as the results of Alstom power and grid. We believe that Industrial operating profit and operating profit margin adjusted for restructuring, gains and GE-GE Capital eliminations as well as the Alstom impacts are meaningful measures because they increase the comparability of period-to-period results. INDUSTRIAL ORGANIC OPERATING PROFIT
Three months ended March 31 (Dollars in millions) 2016 2015 V% Segment profit (loss) Total industrial segment profit $ 3,314 $ 3,560 (7)% Adjusted corporate items and eliminations(a) (431) (574) Total industrial profit(a) $ 2,883 $ 2,985 (3)% Less the effects of: Acquisitions, business dispositions (other than dispositions of businesses acquired for investment) and currency exchange rates $ (51) $ 41 Total industrial profit excluding effects of acquisitions, business dispositions (other than dispositions of businesses acquired for investment) and currency exchange rates (Industrial organic operating profit)(a) $ 2,935 $ 2,944 -% (a) Excludes gains and restructuring and non-operating pension costs (pre-tax). Industrial organic operating profit growth, excluding gains and restructuring, measures Industrial operating profit excluding the effects of acquisitions, business dispositions and currency exchange rates and gains and restructuring. We believe that this measure provides management and investors with a more complete understanding of underlying operating results and trends of established, ongoing operations by excluding the effect of acquisitions, dispositions and currency exchange as well as gains and restructuring, which activities are subject to volatility and can obscure underlying trends. Management recognizes that the term “Industrial organ ic operating profit” may be interpreted differently by other companies and under different circumstances. Although this may have an effect on comparability of absolute percentage growth from company to company, we believe that these measures are useful in assessing trends of the respective businesses or companies and may therefore be a useful tool in assessing period-to-period performance trends.
GE 1Q 2016 EARNINGS APRIL 22, 2016
GE Earnings Press Release 1Q16 043125 GE_PR15_1Q16_v25 04/22/16 page 12
12
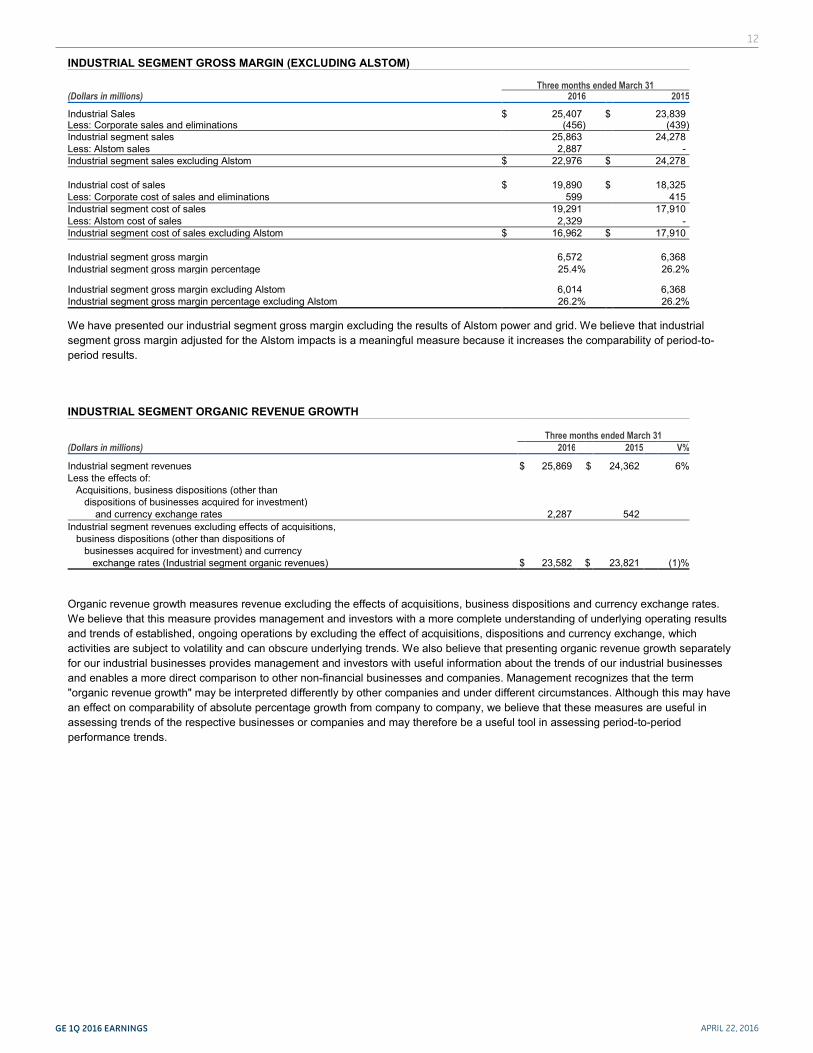
INDUSTRIAL SEGMENT GROSS MARGIN (EXCLUDING ALSTOM) Three months ended March 31 (Dollars in millions) 2016 2015 Industrial Sales $ 25,407 $ 23,839 Less: Corporate sales and eliminations (456) (439) Industrial segment sales 25,863 24,278 Less: Alstom sales 2,887 - Industrial segment sales excluding Alstom $ 22,976 $ 24,278 Industrial cost of sales $ 19,890 $ 18,325 Less: Corporate cost of sales and eliminations 599 415 Industrial segment cost of sales 19,291 17,910 Less: Alstom cost of sales 2,329 - Industrial segment cost of sales excluding Alstom $ 16,962 $ 17,910 Industrial segment gross margin 6,572 6,368 Industrial segment gross margin percentage 25.4% 26.2% Industrial segment gross margin excluding Alstom 6,014 6,368 Industrial segment gross margin percentage excluding Alstom 26.2% 26.2% We have presented our industrial segment gross margin excluding the results of Alstom power and grid. We believe that industrial segment gross margin adjusted for the Alstom impacts is a meaningful measure because it increases the comparability of period-to-period results. INDUSTRIAL SEGMENT ORGANIC REVENUE GROWTH Three months ended March 31 (Dollars in millions) 2016 2015 V% Industrial segment revenues $ 25,869 $ 24,362 6% Less the effects of: Acquisitions, business dispositions (other than dispositions of businesses acquired for investment) and currency exchange rates 2,287 542 Industrial segment revenues excluding effects of acquisitions, business dispositions (other than dispositions of businesses acquired for investment) and currency exchange rates (Industrial segment organic revenues) $ 23,582 $ 23,821 (1)% Organic revenue growth measures revenue excluding the effects of acquisitions, business dispositions and currency exchange rates. We believe that this measure provides management and investors with a more complete understanding of underlying operating results and trends of established, ongoing operations by excluding the effect of acquisitions, dispositions and currency exchange, which activities are subject to volatility and can obscure underlying trends. We also believe that presenting organic revenue growth separately for our industrial businesses provides management and investors with useful information about the trends of our industrial businesses and enables a more direct comparison to other non-financial businesses and companies. Management recognizes that the term "organic revenue growth" may be interpreted differently by other companies and under different circumstances. Although this may have an effect on comparability of absolute percentage growth from company to company, we believe that these measures are useful in assessing trends of the respective businesses or companies and may therefore be a useful tool in assessing period-to-period performance trends.
GE 1Q 2016 EARNINGS APRIL 22, 2016
GE Earnings Press Release 1Q16 043125 GE_PR15_1Q16_v25 04/22/16 page 13
13
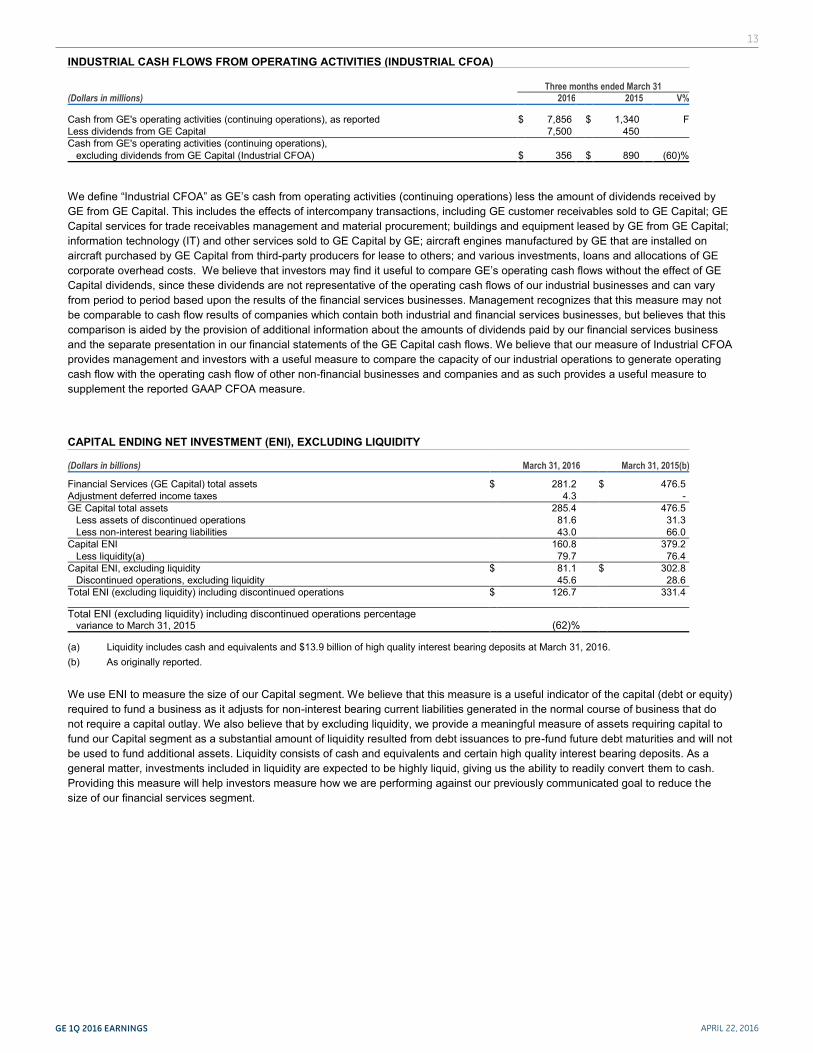
INDUSTRIAL CASH FLOWS FROM OPERATING ACTIVITIES (INDUSTRIAL CFOA) Three months ended March 31 (Dollars in millions) 2016 2015 V% Cash from GE's operating activities (continuing operations), as reported $ 7,856 $ 1,340 F Less dividends from GE Capital 7,500 450 Cash from GE's operating activities (continuing operations), excluding dividends from GE Capital (Industrial CFOA) $ 356 $ 890 (60)% We define “Industrial CFOA” as GE’s cash from operating activities (continuing operations) less the amount of dividends received by GE from GE Capital. This includes the effects of intercompany transactions, including GE customer receivables sold to GE Capital; GE Capital services for trade receivables management and material procurement; buildings and equipment leased by GE from GE Capital; information technology (IT) and other services sold to GE Capital by GE; aircraft engines manufactured by GE that are installed on aircraft purchased by GE Capital from third-party producers for lease to others; and various investments, loans and allocations of GE corporate overhead costs. We believe that investors may find it useful to compare GE’s operating cash flows without the effect of GE Capital dividends, since these dividends are not representative of the operating cash flows of our industrial businesses and can vary from period to period based upon the results of the financial services businesses. Management recognizes that this measure may not be comparable to cash flow results of companies which contain both industrial and financial services businesses, but believes that this comparison is aided by the provision of additional information about the amounts of dividends paid by our financial services business and the separate presentation in our financial statements of the GE Capital cash flows. We believe that our measure of Industrial CFOA provides management and investors with a useful measure to compare the capacity of our industrial operations to generate operating cash flow with the operating cash flow of other non-financial businesses and companies and as such provides a useful measure to supplement the reported GAAP CFOA measure.
CAPITAL ENDING NET INVESTMENT (ENI), EXCLUDING LIQUIDITY
(Dollars in billions) March 31, 2016 March 31, 2015(b) Financial Services (GE Capital) total assets $ 281.2 $ 476.5 Adjustment deferred income taxes 4.3 - GE Capital total assets 285.4 476.5 Less assets of discontinued operations 81.6 31.3 Less non-interest bearing liabilities 43.0 66.0 Capital ENI 160.8 379.2 Less liquidity(a) 79.7 76.4 Capital ENI, excluding liquidity $ 81.1 $ 302.8 Discontinued operations, excluding liquidity 45.6 28.6 Total ENI (excluding liquidity) including discontinued operations $ 126.7 331.4 Total ENI (excluding liquidity) including discontinued operations percentage variance to March 31, 2015 (62)% (a) Liquidity includes cash and equivalents and $13.9 billion of high quality interest bearing deposits at March 31, 2016. (b) As originally reported.
We use ENI to measure the size of our Capital segment. We believe that this measure is a useful indicator of the capital (debt or equity) required to fund a business as it adjusts for non-interest bearing current liabilities generated in the normal course of business that do not require a capital outlay. We also believe that by excluding liquidity, we provide a meaningful measure of assets requiring capital to fund our Capital segment as a substantial amount of liquidity resulted from debt issuances to pre-fund future debt maturities and will not be used to fund additional assets. Liquidity consists of cash and equivalents and certain high quality interest bearing deposits. As a general matter, investments included in liquidity are expected to be highly liquid, giving us the ability to readily convert them to cash. Providing this measure will help investors measure how we are performing against our previously communicated goal to reduce the size of our financial services segment.