gea%20group%20q4 presentation%20fy%202011 neu tcm11 25551
DESCRIPTION
http://www.gea.com/global/en/binaries/GEA%20Group%20Q4-Presentation%20FY%202011_neu_tcm11-25551.pdfTRANSCRIPT
GEA Group
Düsseldorf, March 12, 2012
Q4 2011 Presentation Results FY 2011
engineering for a better world
Disclaimer
Q4 Presentation Results FY 2011 - March 12, 2012
Forward-looking statements are based on our current assumptions and forecasts. These statements naturally entail risks and uncertainties, which may cause the actual results of operations, financial position or performance to diverge significantly from the estimates given here. Factors that could cause such a divergence include changes in the economic and business environment, fluctuations in exchange rates and interest rates, launches of competing products, poor acceptance of new products or services, and changes in business strategy. We are under no obligation to update forward-looking statements.
Due to rounding, the sum of percentages of order intake and sales by region as well as by customer industry may vary from 100%.
Since Q1 2012, the segment, GEA Convenience-Food Technologies (GEA CT), is renamed as GEA Food Solutions (GEA FS).
2
engineering for a better world
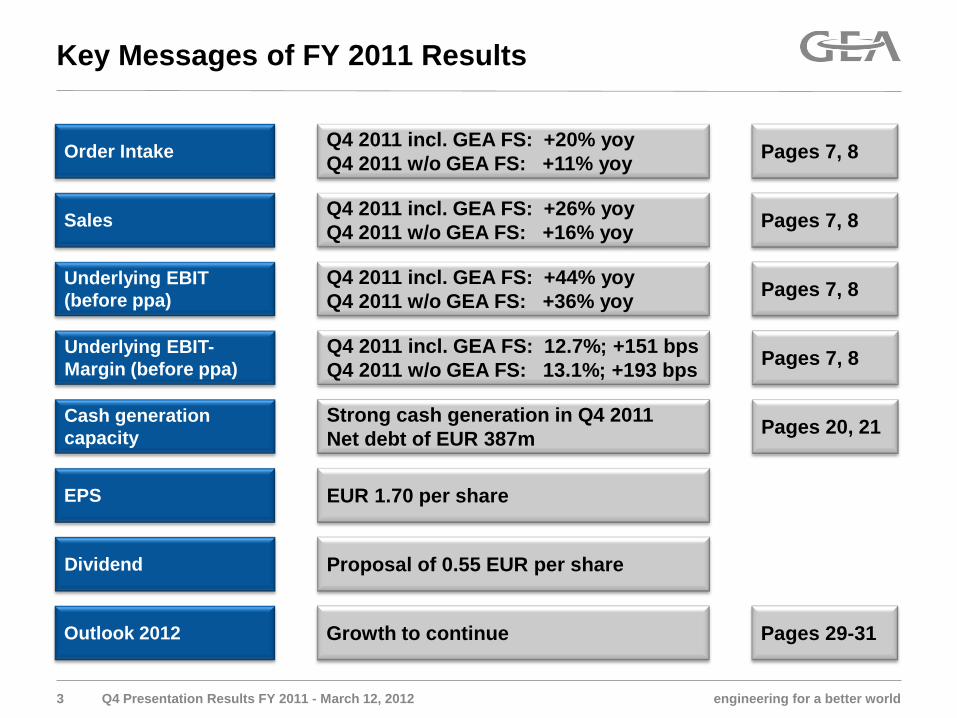
Order Intake Pages 7, 8 Q4 2011 incl. GEA FS: +20% yoy Q4 2011 w/o GEA FS: +11% yoy
Sales Pages 7, 8 Q4 2011 incl. GEA FS: +26% yoy Q4 2011 w/o GEA FS: +16% yoy
Dividend Proposal of 0.55 EUR per share
Underlying EBIT (before ppa) Pages 7, 8 Q4 2011 incl. GEA FS: +44% yoy
Q4 2011 w/o GEA FS: +36% yoy
Cash generation capacity Pages 20, 21 Strong cash generation in Q4 2011
Net debt of EUR 387m
Outlook 2012 Pages 29-31 Growth to continue
Key Messages of FY 2011 Results
EPS EUR 1.70 per share
Underlying EBIT-Margin (before ppa) Pages 7, 8 Q4 2011 incl. GEA FS: 12.7%; +151 bps
Q4 2011 w/o GEA FS: 13.1%; +193 bps
3 Q4 Presentation Results FY 2011 - March 12, 2012
engineering for a better world
Agenda
4
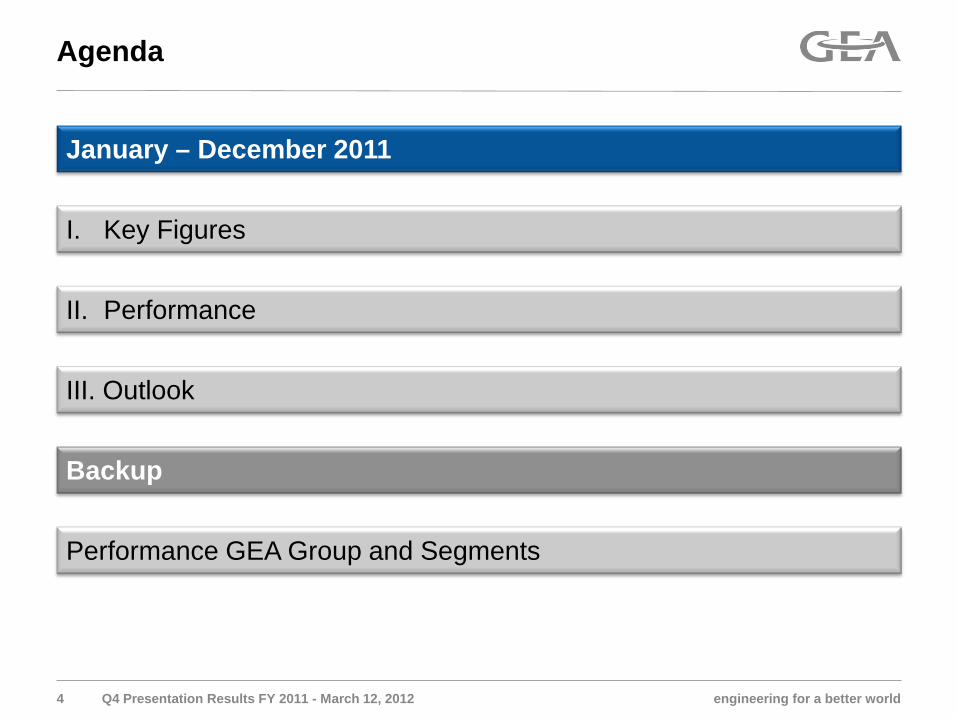
January – December 2011
I. Key Figures
II. Performance
Backup
Performance GEA Group and Segments
Q4 Presentation Results FY 2011 - March 12, 2012
III. Outlook
engineering for a better world
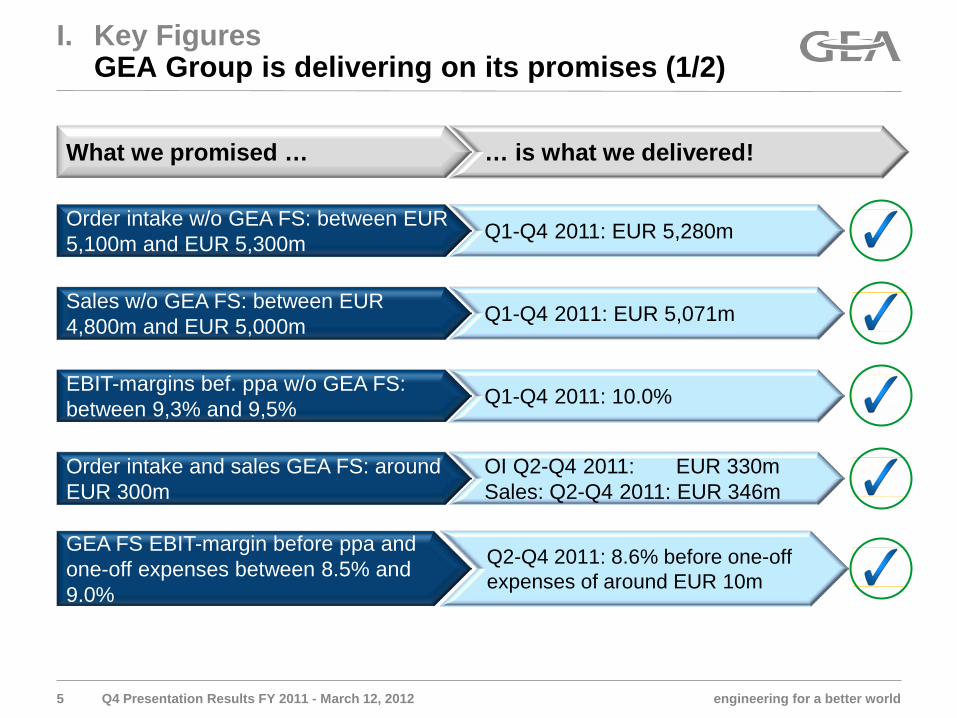
What we promised … … is what we delivered!
I. Key Figures GEA Group is delivering on its promises (1/2)
Order intake w/o GEA FS: between EUR 5,100m and EUR 5,300m Q1-Q4 2011: EUR 5,280m
Sales w/o GEA FS: between EUR 4,800m and EUR 5,000m Q1-Q4 2011: EUR 5,071m
EBIT-margins bef. ppa w/o GEA FS: between 9,3% and 9,5% Q1-Q4 2011: 10.0%
Order intake and sales GEA FS: around EUR 300m
OI Q2-Q4 2011: EUR 330m Sales: Q2-Q4 2011: EUR 346m
GEA FS EBIT-margin before ppa and one-off expenses between 8.5% and 9.0%
Q2-Q4 2011: 8.6% before one-off expenses of around EUR 10m
5 Q4 Presentation Results FY 2011 - March 12, 2012

engineering for a better world
What we promised … … is what we delivered!
I. Key Figures GEA Group is delivering on its promises (2/2)
Ongoing acquisitions mainly in food applications CFS, Bock, NuCon, San Joaquin
Sufficient provisions for discontinued operations
No impact on the Group result in 2011
Strong focus on working capital management
WC/Sales EOP: 10.7% WC/Sales LTM: 12.6%
Reduction of Net Debt position down to around EUR 500m Net Debt: EUR 387m
Cash out guidance DOP: EUR 80m Q1-Q4 2011: EUR 38m
6 Q4 Presentation Results FY 2011 - March 12, 2012
engineering for a better world
54 69 74 109 95
139 144
207
2010³ 2011
Q4
Q3
Q2
Q178 92 98 135 118
166 169
237
2010³ 2011
Q4
Q3
Q2
Q1
938 1,038
1,065 1,349
1,125 1,397
1,290
1,632
2010 2011
Q4
Q3
Q2
Q1
7
1,010 1,242
1,167 1,463
1,153 1,403
1,248
1,502
2010 2011
Q4
Q3
Q2
Q1
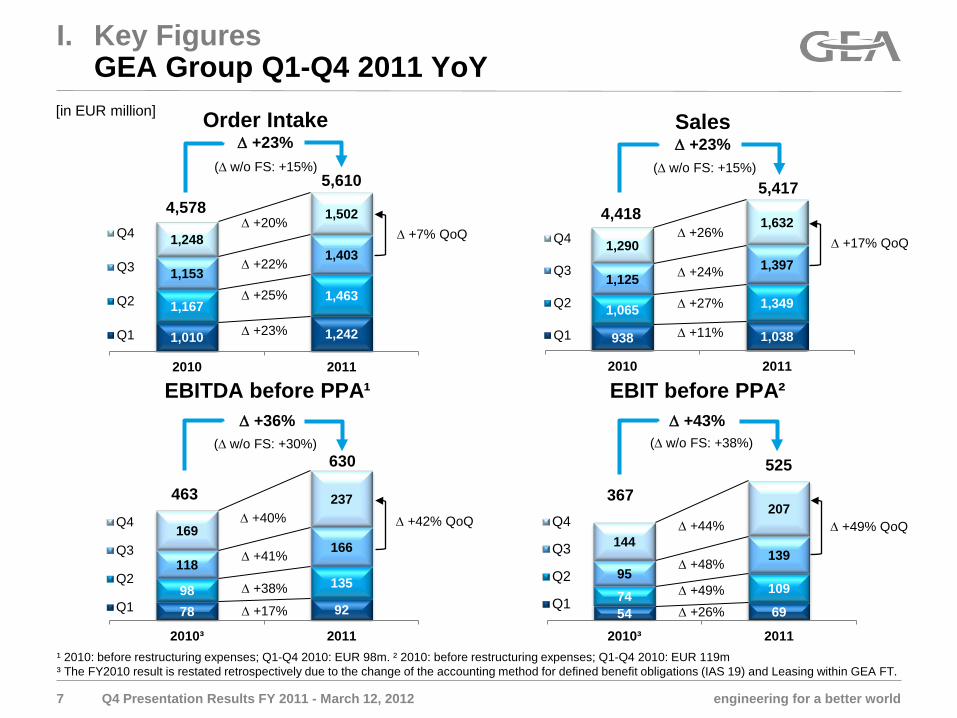
Order Intake ∆ +23%
5,610 4,578
Sales ∆ +23%
5,417 4,418
EBIT before PPA² ∆ +43%
525
367
EBITDA before PPA¹ ∆ +36%
630
463
I. Key Figures GEA Group Q1-Q4 2011 YoY
∆ +7% QoQ
∆ +23%
∆ +25%
∆ +17%
∆ +38%
∆ +26% ∆ +49%
∆ +11%
∆ +27%
[in EUR million]
¹ 2010: before restructuring expenses; Q1-Q4 2010: EUR 98m. ² 2010: before restructuring expenses; Q1-Q4 2010: EUR 119m ³ The FY2010 result is restated retrospectively due to the change of the accounting method for defined benefit obligations (IAS 19) and Leasing within GEA FT.
Q4 Presentation Results FY 2011 - March 12, 2012
∆ +22%
∆ +26%
∆ +41% ∆ +48%
∆ +17% QoQ
∆ +42% QoQ ∆ +49% QoQ
(∆ w/o FS: +15%) (∆ w/o FS: +15%)
(∆ w/o FS: +30%) (∆ w/o FS: +38%)
∆ +20%
∆ +24%
∆ +44% ∆ +40%
engineering for a better world
171 182
402 497
202 240
410 464
135 154 131
Q4 2010 Q4 2011
GEA FS
GEA FT
GEA HX
GEA ME
GEA PE
GEA RT
14 20 45
70 40
54 40
37 13
15 10
Q4 2010² Q4 2011
GEA FS
GEA FT
GEA HX
GEA ME
GEA PE
GEA RT
8
153 170
420 449
182 204
399 462
116 132 120
Q4 2010 Q4 2011
GEA FS
GEA FT
GEA HX
GEA ME
GEA PE
GEA RT
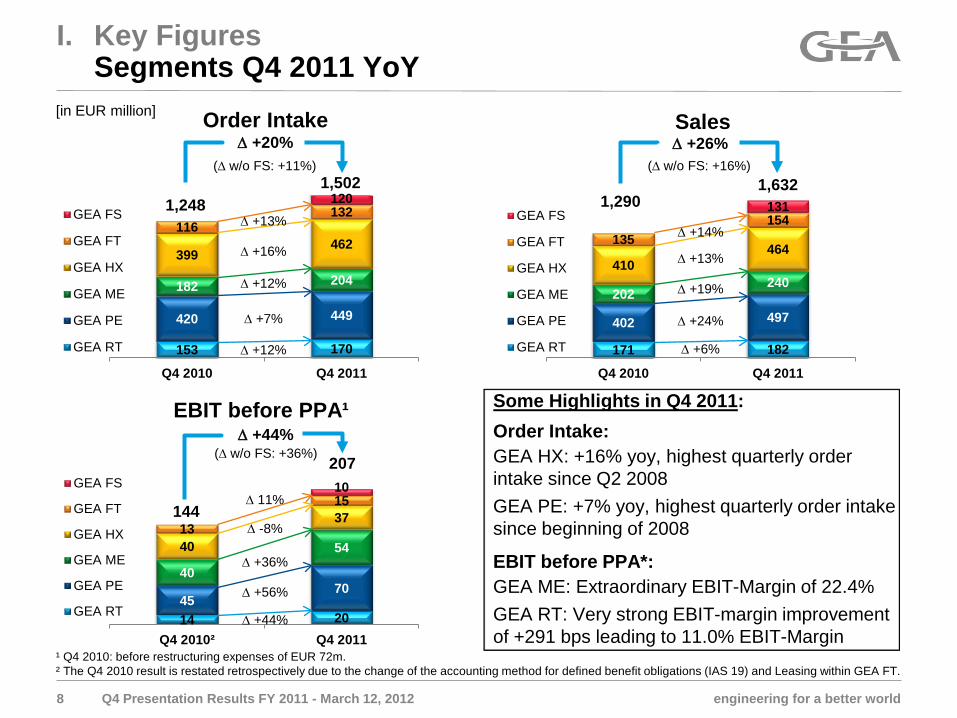
Order Intake ∆ +20%
1,502 1,248
∆ +26%
1,632 1,290
EBIT before PPA¹ ∆ +44%
207
144
I. Key Figures Segments Q4 2011 YoY
∆ +12%
∆ +16%
∆ +7%
∆ +12%
∆ +19%
∆ +13%
∆ +24%
∆ +6%
∆ +36%
∆ 11%
∆ -8%
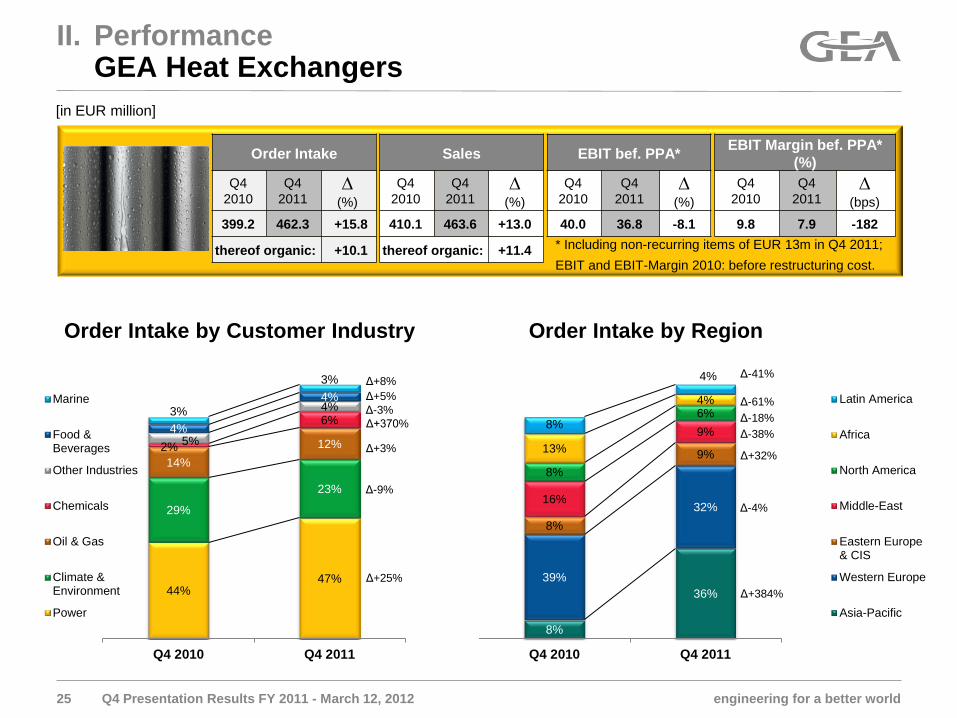
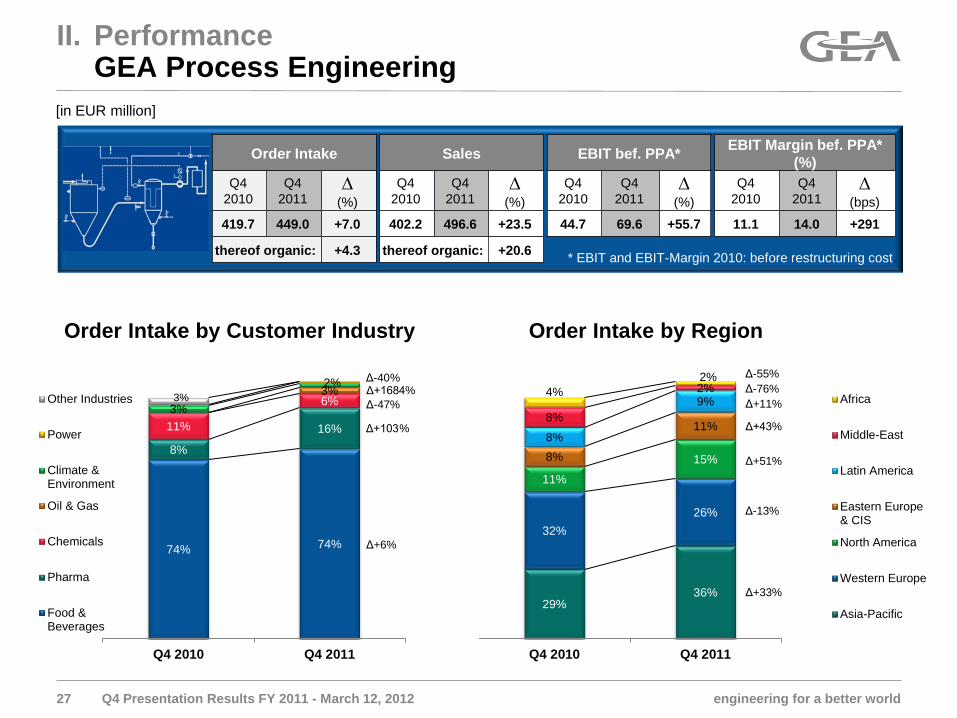
Some Highlights in Q4 2011: Order Intake: GEA HX: +16% yoy, highest quarterly order intake since Q2 2008 GEA PE: +7% yoy, highest quarterly order intake since beginning of 2008
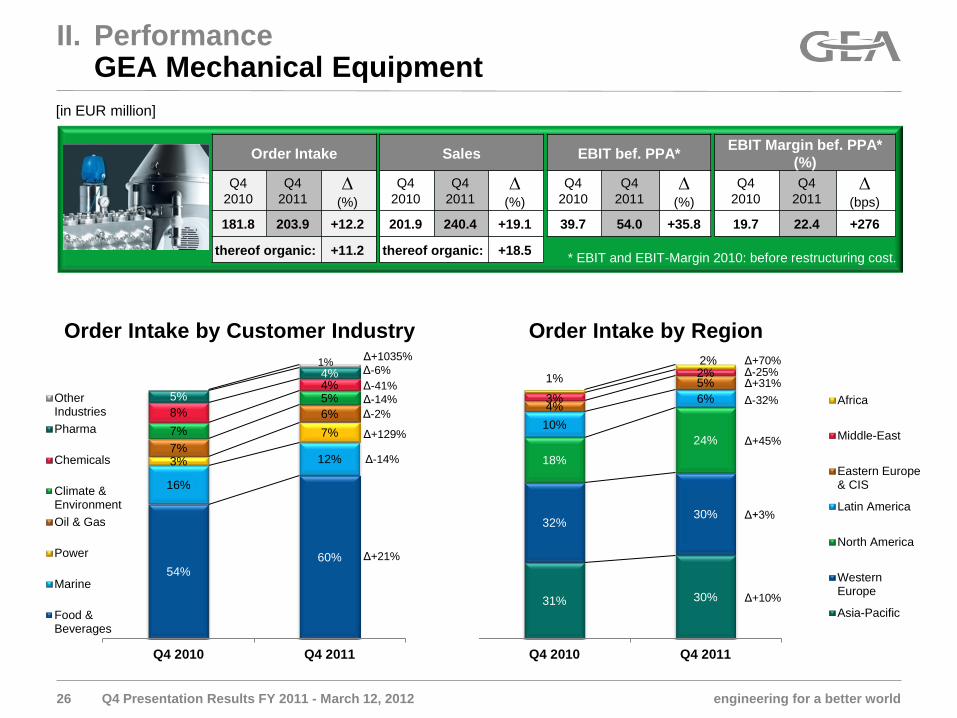
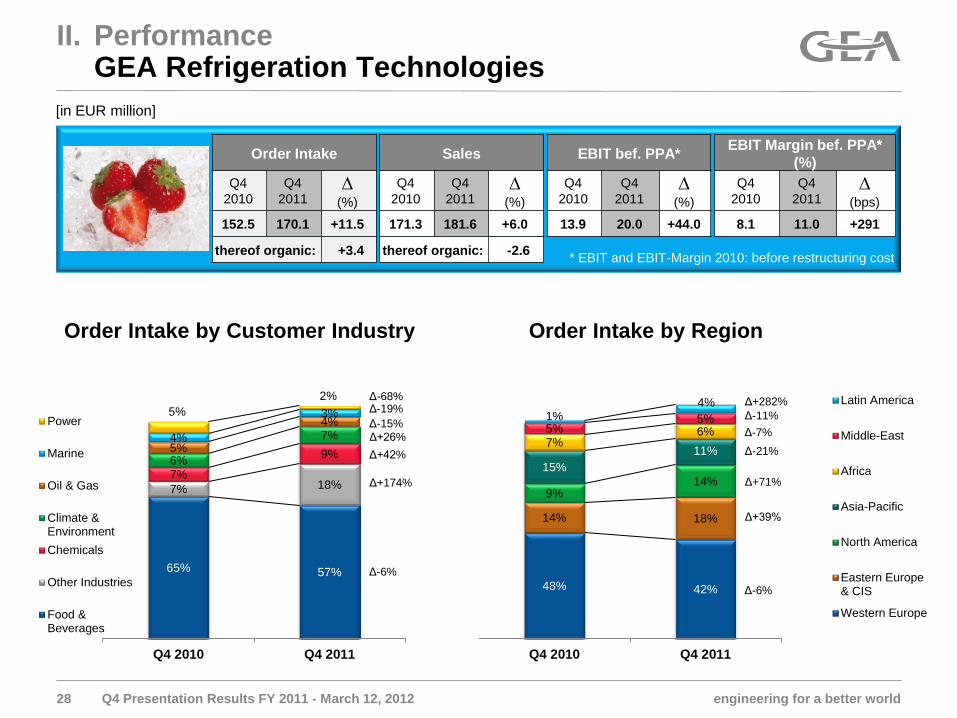
EBIT before PPA*: GEA ME: Extraordinary EBIT-Margin of 22.4% GEA RT: Very strong EBIT-margin improvement of +291 bps leading to 11.0% EBIT-Margin
[in EUR million]
¹ Q4 2010: before restructuring expenses of EUR 72m. ² The Q4 2010 result is restated retrospectively due to the change of the accounting method for defined benefit obligations (IAS 19) and Leasing within GEA FT.
∆ +13% ∆ +14%
∆ +56%
∆ +44%
Q4 Presentation Results FY 2011 - March 12, 2012
(∆ w/o FS: +11%) (∆ w/o FS: +16%)
(∆ w/o FS: +36%)
Sales
engineering for a better world
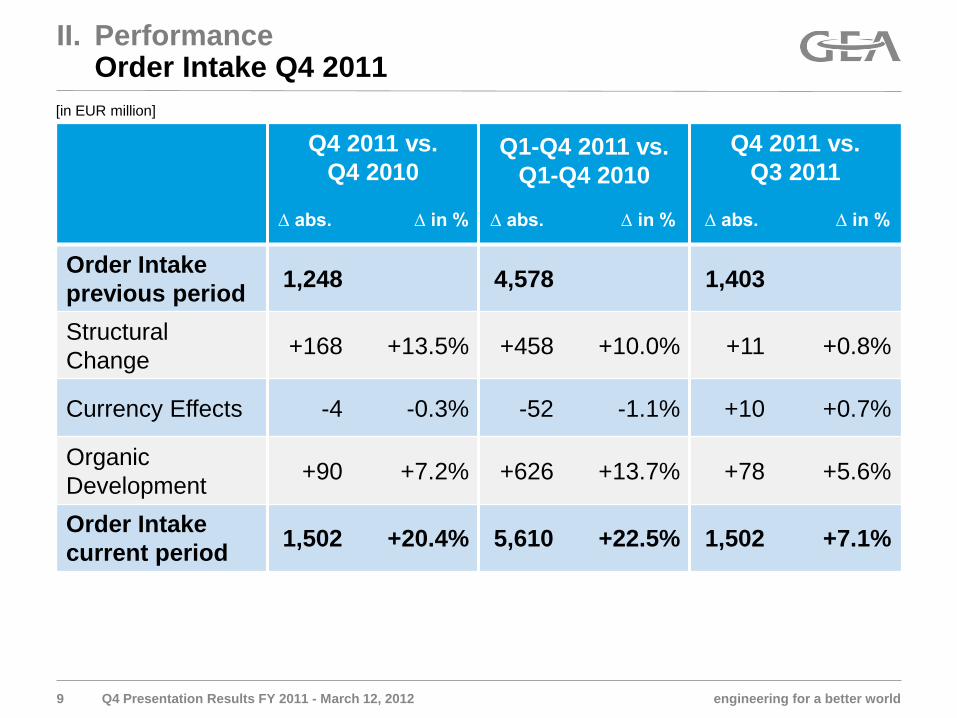
II. Performance Order Intake Q4 2011
9
∆ abs. ∆ in %
∆ abs. ∆ in %
Q4 2011 vs. Q4 2010
Q1-Q4 2011 vs. Q1-Q4 2010
Q4 2011 vs. Q3 2011
Order Intake previous period 1,248 4,578 1,403
Structural Change +168 +13.5% +458 +10.0% +11 +0.8%
Currency Effects -4 -0.3% -52 -1.1% +10 +0.7%
Organic Development +90 +7.2% +626 +13.7% +78 +5.6%
Order Intake current period 1,502 +20.4% 5,610 +22.5% 1,502 +7.1%
∆ abs. ∆ in %
∆ abs. ∆ in %
∆ abs. ∆ in %
[in EUR million]
Q4 Presentation Results FY 2011 - March 12, 2012
engineering for a better world
0 100 200 300 400 500
Q4 2010
Q1 2011
Q2 2011
Q3 2011
Q4 2011
10
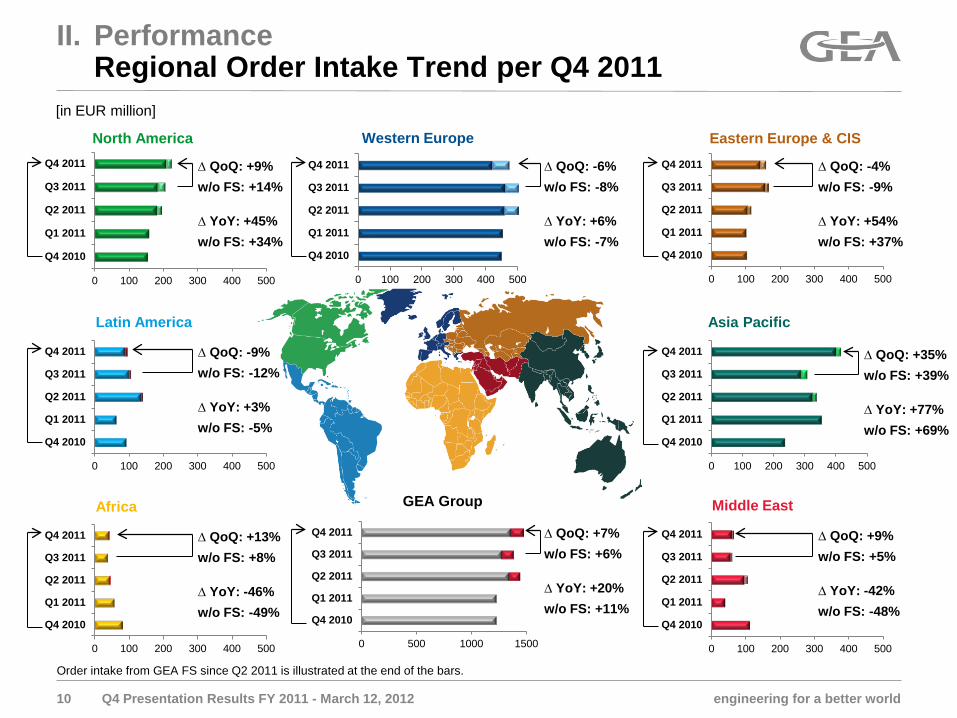
II. Performance Regional Order Intake Trend per Q4 2011
0 500 1000 1500
Q4 2010
Q1 2011
Q2 2011
Q3 2011
Q4 2011
GEA Group
0 100 200 300 400 500
Q4 2010
Q1 2011
Q2 2011
Q3 2011
Q4 2011
0 100 200 300 400 500
Q4 2010
Q1 2011
Q2 2011
Q3 2011
Q4 2011
0 100 200 300 400 500
Q4 2010
Q1 2011
Q2 2011
Q3 2011
Q4 2011
0 100 200 300 400 500
Q4 2010
Q1 2011
Q2 2011
Q3 2011
Q4 2011
0 100 200 300 400 500
Q4 2010
Q1 2011
Q2 2011
Q3 2011
Q4 2011
0 100 200 300 400 500
Q4 2010
Q1 2011
Q2 2011
Q3 2011
Q4 2011
[in EUR million]
Q4 Presentation Results FY 2011 - March 12, 2012
Eastern Europe & CIS
Latin America Asia Pacific
Western Europe North America
Middle East
Order intake from GEA FS since Q2 2011 is illustrated at the end of the bars.
Africa
∆ QoQ: +9% w/o FS: +14%
∆ YoY: +45% w/o FS: +34%
∆ QoQ: -9% w/o FS: -12%
∆ YoY: +3% w/o FS: -5%
∆ QoQ: +13% w/o FS: +8%
∆ YoY: -46% w/o FS: -49%
∆ QoQ: -4% w/o FS: -9%
∆ YoY: +54% w/o FS: +37%
∆ QoQ: +35% w/o FS: +39%
∆ YoY: +77% w/o FS: +69%
∆ QoQ: +9% w/o FS: +5%
∆ YoY: -42% w/o FS: -48%
∆ QoQ: -6% w/o FS: -8%
∆ YoY: +6% w/o FS: -7%
∆ QoQ: +7% w/o FS: +6%
∆ YoY: +20% w/o FS: +11%
engineering for a better world
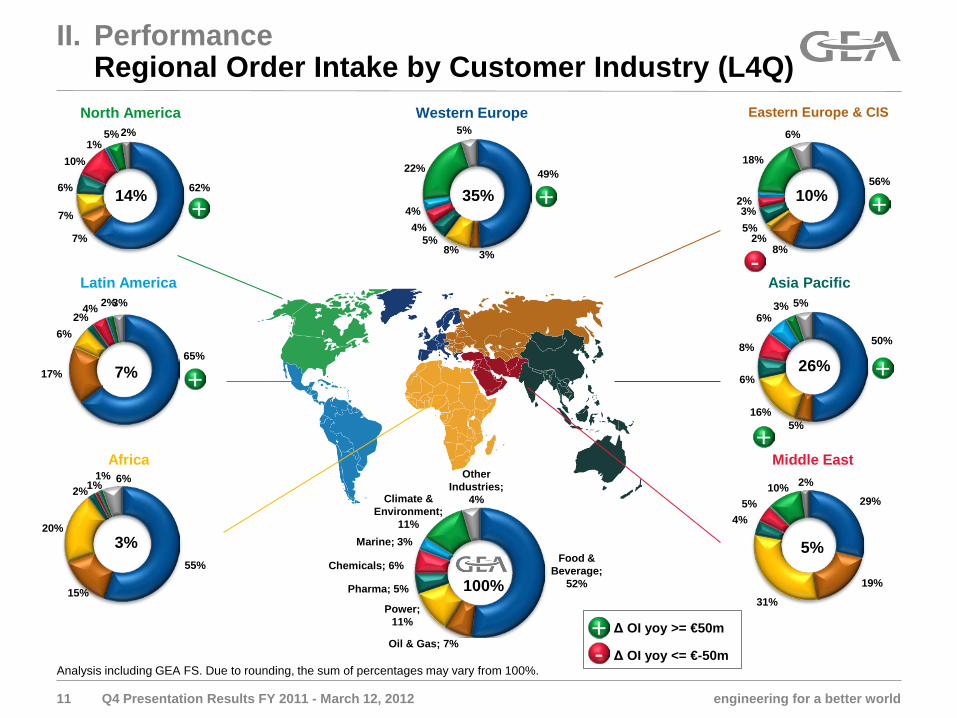
Climate & Environment;
11%
Other Industries;
4%
Chemicals; 6%
Pharma; 5%
Power; 11%
Oil & Gas; 7%
Food & Beverage;
52%
Marine; 3%
55%
15%
20%
2% 1% 1% 6%
Africa
29%
19%
31%
4% 5%
10% 2%
Middle East
65% 17%
6% 2%
4% 2% 3%
Latin America
50%
5% 16%
6%
8%
6% 3% 5%
Asia Pacific
56%
8% 2%
5% 3%
2%
18%
6%
Eastern Europe & CIS
49%
3% 8% 5%
4% 4%
22%
5% Western Europe
11
II. Performance Regional Order Intake by Customer Industry (L4Q)
62%
7%
7%
6%
10% 1%
5% 2% North America
14% 10% 35%
7% 26%
3% 5%
Analysis including GEA FS. Due to rounding, the sum of percentages may vary from 100%.
Q4 Presentation Results FY 2011 - March 12, 2012
100%
+ Δ OI yoy >= €50m
- Δ OI yoy <= €-50m
-
+ +
+
+
+ +
engineering for a better world
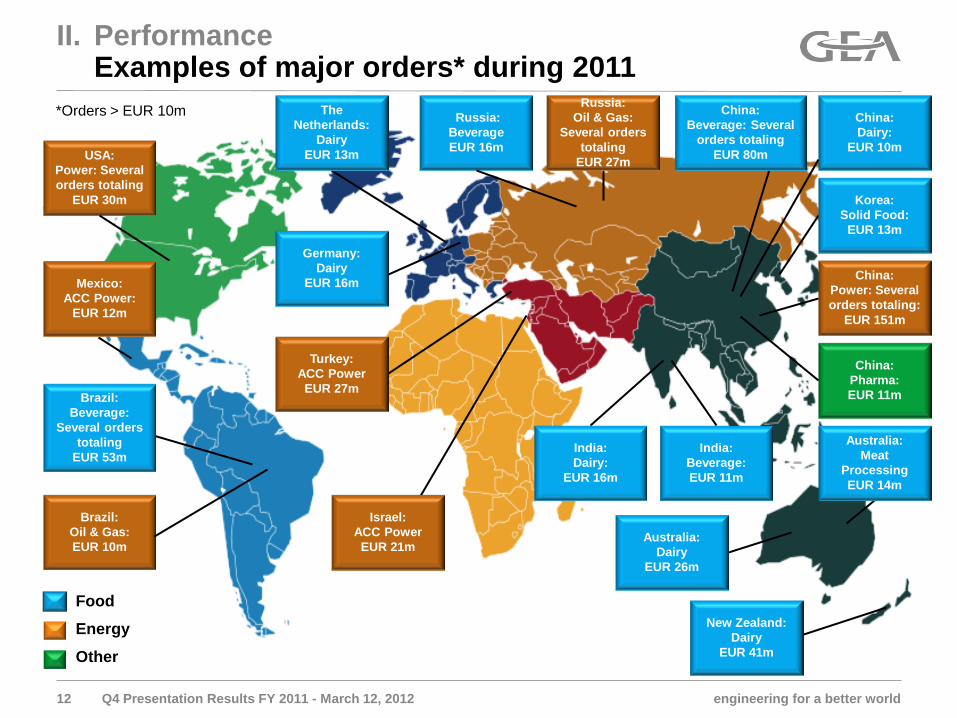
China: Beverage: Several
orders totaling EUR 80m
*Orders > EUR 10m
Brazil: Beverage:
Several orders totaling
EUR 53m
II. Performance Examples of major orders* during 2011
The Netherlands:
Dairy EUR 13m
India: Beverage: EUR 11m
Turkey: ACC Power EUR 27m
Germany: Dairy
EUR 16m
Food
Energy
Other
New Zealand: Dairy
EUR 41m
Australia: Dairy
EUR 26m
Australia: Meat
Processing EUR 14m
Mexico: ACC Power:
EUR 12m
Brazil: Oil & Gas: EUR 10m
USA: Power: Several orders totaling
EUR 30m
China: Pharma: EUR 11m
India: Dairy:
EUR 16m
Israel: ACC Power EUR 21m
Korea: Solid Food:
EUR 13m
China: Dairy:
EUR 10m
China: Power: Several orders totaling:
EUR 151m
Russia: Oil & Gas:
Several orders totaling
EUR 27m
Russia: Beverage EUR 16m
12 Q4 Presentation Results FY 2011 - March 12, 2012

engineering for a better world
869 748 738 704 662 673 739 777 767 812 877 905
991 954 916
177
140 165 123
140 156
203 210 185
220 211 214
231 228 241
141
134 110 128
59 105
52 88 95
69 82
178
178 161 183 37
91 60 80
101 76
16
93 106 146 72
63
63 60
162
0
200
400
600
800
1.000
1.200
1.400
1.600
Q3 08 Q4 08 Q1 09 Q2 09 Q3 09 Q4 09 Q1 10 Q2 10 Q3 10 Q4 10 Q1 11 Q2 11(w/o FS)
Q2 11(incl.FS)
Q3 11 Q4 11
OI < EUR 1m OI >= EUR 1m < EUR 5m OI >= EUR 5m < EUR 15m OI >= EUR 15m
II. Performance Large Order Development since Q3 2008
13
[in EUR million]
Q4 Presentation Results FY 2011 - March 12, 2012
1,600
1,400
1,200
1,000
engineering for a better world
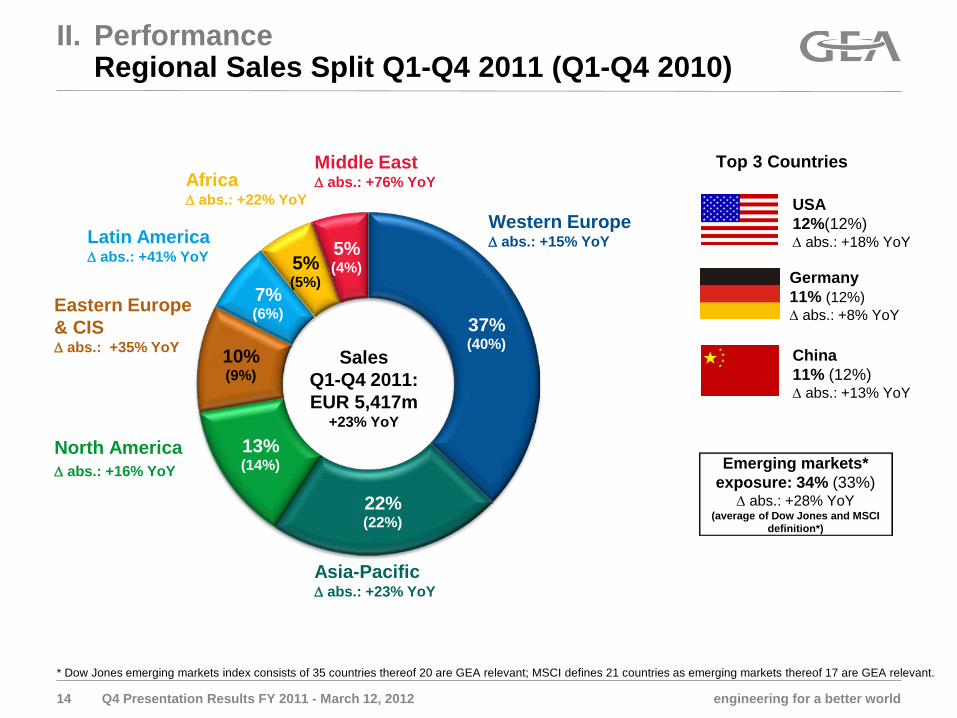
37% (40%)
22% (22%)
13% (14%)
10% (9%)
7% (6%)
5% (5%)
5% (4%)
Emerging markets* exposure: 34% (33%)
∆ abs.: +28% YoY (average of Dow Jones and MSCI
definition*)
Sales Q1-Q4 2011: EUR 5,417m
+23% YoY
II. Performance Regional Sales Split Q1-Q4 2011 (Q1-Q4 2010)
14
Germany 11% (12%) ∆ abs.: +8% YoY
USA 12%(12%) ∆ abs.: +18% YoY
China 11% (12%) ∆ abs.: +13% YoY
Top 3 Countries
Western Europe ∆ abs.: +15% YoY
Asia-Pacific ∆ abs.: +23% YoY
North America ∆ abs.: +16% YoY
Latin America ∆ abs.: +41% YoY
Eastern Europe & CIS ∆ abs.: +35% YoY
Middle East ∆ abs.: +76% YoY Africa
∆ abs.: +22% YoY
Q4 Presentation Results FY 2011 - March 12, 2012
* Dow Jones emerging markets index consists of 35 countries thereof 20 are GEA relevant; MSCI defines 21 countries as emerging markets thereof 17 are GEA relevant.

engineering for a better world
27% 26%
10% 8% 13%
20% 6%
6% 15%
15% 4%
5%
6%
5%
4%
3%
12%
9%
3%
3%
Q4 2010 Q4 2011
Other Industries
Climate &EnvironmentMarine
Chemicals
Pharma
Power
Oil & Gas
Food - Solid
Food - Beverages
Food - Dairy
15
II. Performance Order Intake by Customer Industry since Q4 2009*
* Average last four quarters: Q1 – Q4 2009 = Index 100
Δ+13%
Δ-13%
Δ+91%
Δ+15%
Δ+25%
Δ+82% Δ-1% Δ-8% Δ-10% Δ+17%
∆ +20%
1,248
1,502
60%
100%
140%
180%
220%
260%
Q4 09 Q1 10 Q2 10 Q3 10 Q4 10 Q1 11 Q2 11 Q3 11 Q4 11
Food - Dairy Food - BeveragesFood - Solid incl. GEA FS Food - Solid w/o GEA FSGEA Group w/o GEA FS
60%
80%
100%
120%
140%
160%
Q4 09 Q1 10 Q2 10 Q3 10 Q4 10 Q1 11 Q2 11 Q3 11 Q4 11
Pharma ChemicalsMarine GEA Group w/o GEA FS
60%
80%
100%
120%
140%
160%
Q4 09 Q1 10 Q2 10 Q3 10 Q4 10 Q1 11 Q2 11 Q3 11 Q4 11
Oil & Gas PowerClimate & Environment GEA Group w/o GEA FS
Q4 Presentation Results FY 2011 - March 12, 2012
(∆ w/o FS: +11%)
engineering for a better world
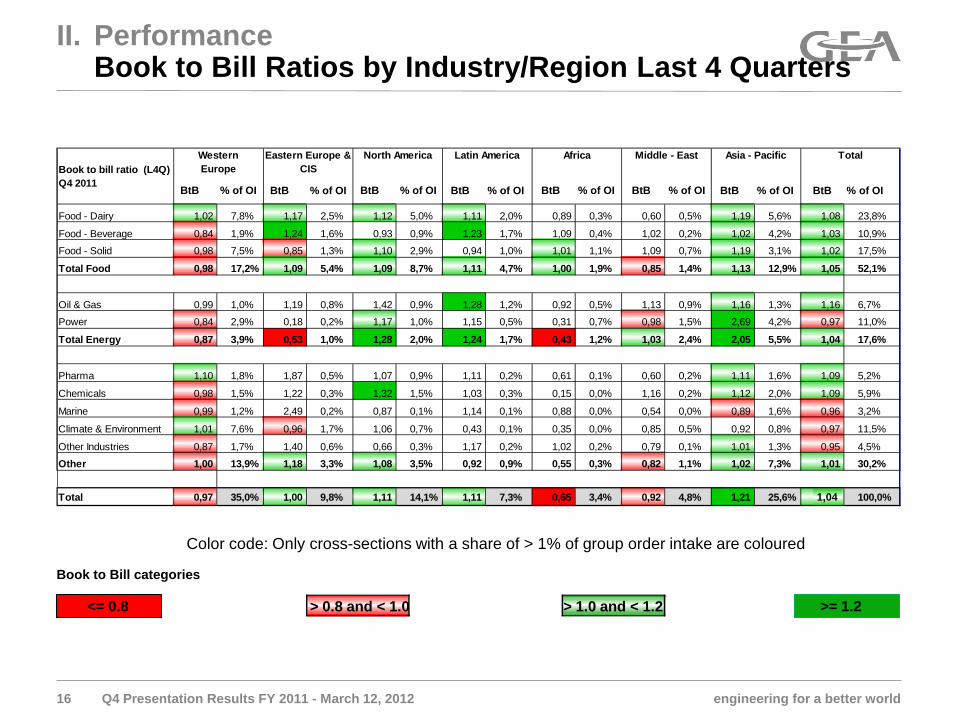
Book to bill ratio (L4Q) Q4 2011
Food - Dairy 1,02 7,8% 1,17 2,5% 1,12 5,0% 1,11 2,0% 0,89 0,3% 0,60 0,5% 1,19 5,6% 1,08 23,8%
Food - Beverage 0,84 1,9% 1,24 1,6% 0,93 0,9% 1,23 1,7% 1,09 0,4% 1,02 0,2% 1,02 4,2% 1,03 10,9%
Food - Solid 0,98 7,5% 0,85 1,3% 1,10 2,9% 0,94 1,0% 1,01 1,1% 1,09 0,7% 1,19 3,1% 1,02 17,5%
Total Food 0,98 17,2% 1,09 5,4% 1,09 8,7% 1,11 4,7% 1,00 1,9% 0,85 1,4% 1,13 12,9% 1,05 52,1%
Oil & Gas 0,99 1,0% 1,19 0,8% 1,42 0,9% 1,28 1,2% 0,92 0,5% 1,13 0,9% 1,16 1,3% 1,16 6,7%
Power 0,84 2,9% 0,18 0,2% 1,17 1,0% 1,15 0,5% 0,31 0,7% 0,98 1,5% 2,69 4,2% 0,97 11,0%
Total Energy 0,87 3,9% 0,53 1,0% 1,28 2,0% 1,24 1,7% 0,43 1,2% 1,03 2,4% 2,05 5,5% 1,04 17,6%
Pharma 1,10 1,8% 1,87 0,5% 1,07 0,9% 1,11 0,2% 0,61 0,1% 0,60 0,2% 1,11 1,6% 1,09 5,2%
Chemicals 0,98 1,5% 1,22 0,3% 1,32 1,5% 1,03 0,3% 0,15 0,0% 1,16 0,2% 1,12 2,0% 1,09 5,9%
Marine 0,99 1,2% 2,49 0,2% 0,87 0,1% 1,14 0,1% 0,88 0,0% 0,54 0,0% 0,89 1,6% 0,96 3,2%
Climate & Environment 1,01 7,6% 0,96 1,7% 1,06 0,7% 0,43 0,1% 0,35 0,0% 0,85 0,5% 0,92 0,8% 0,97 11,5%
Other Industries 0,87 1,7% 1,40 0,6% 0,66 0,3% 1,17 0,2% 1,02 0,2% 0,79 0,1% 1,01 1,3% 0,95 4,5%
Other 1,00 13,9% 1,18 3,3% 1,08 3,5% 0,92 0,9% 0,55 0,3% 0,82 1,1% 1,02 7,3% 1,01 30,2%
Total 0,97 35,0% 1,00 9,8% 1,11 14,1% 1,11 7,3% 0,65 3,4% 0,92 4,8% 1,21 25,6% 1,03 100,0%
Asia - Pacific TotalWesternEurope
Eastern Europe & CIS
North America Latin America Africa Middle - East
II. Performance Book to Bill Ratios by Industry/Region Last 4 Quarters
<= 0.8 > 0.8 and < 1.0 >= 1.2 > 1.0 and < 1.2
BtB % of OI BtB % of OI BtB % of OI BtB % of OI BtB % of OI BtB % of OI BtB % of OI BtB % of OI
Color code: Only cross-sections with a share of > 1% of group order intake are coloured
Book to Bill categories
1,04
16 Q4 Presentation Results FY 2011 - March 12, 2012
engineering for a better world
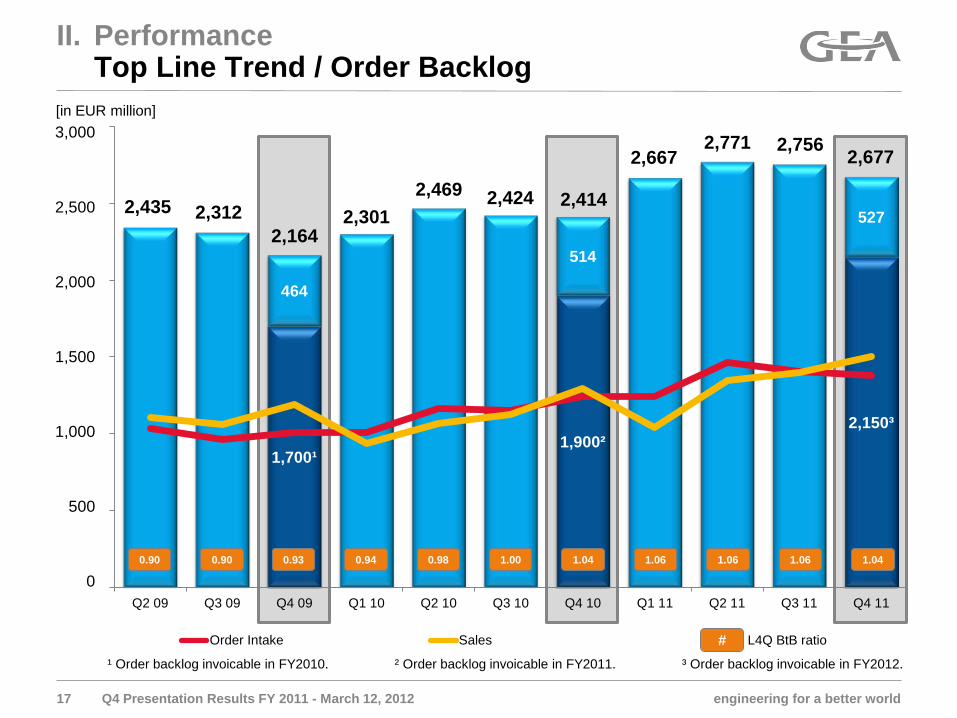
1,700¹ 1,900²
2,150³
464
514
527
-
500
1.000
1.500
2.000
2.500
3.000
Q2 09 Q3 09 Q4 09 Q1 10 Q2 10 Q3 10 Q4 10 Q1 11 Q2 11 Q3 11 Q4 11
Order Intake Sales
3,000
2,500
2,000
1,500
1,000
500
0
17
II. Performance Top Line Trend / Order Backlog
2,164 2,301
2,469 2,424 2,414
2,667 2,771
2,677
[in EUR million]
Q4 Presentation Results FY 2011 - March 12, 2012
2,312 2,435
2,756
0.90 0.90 0.93 0.94 0.98 1.00 1.04 1.06 1.06 1.06 1.04
L4Q BtB ratio # ¹ Order backlog invoicable in FY2010. ² Order backlog invoicable in FY2011. ³ Order backlog invoicable in FY2012.
engineering for a better world 18
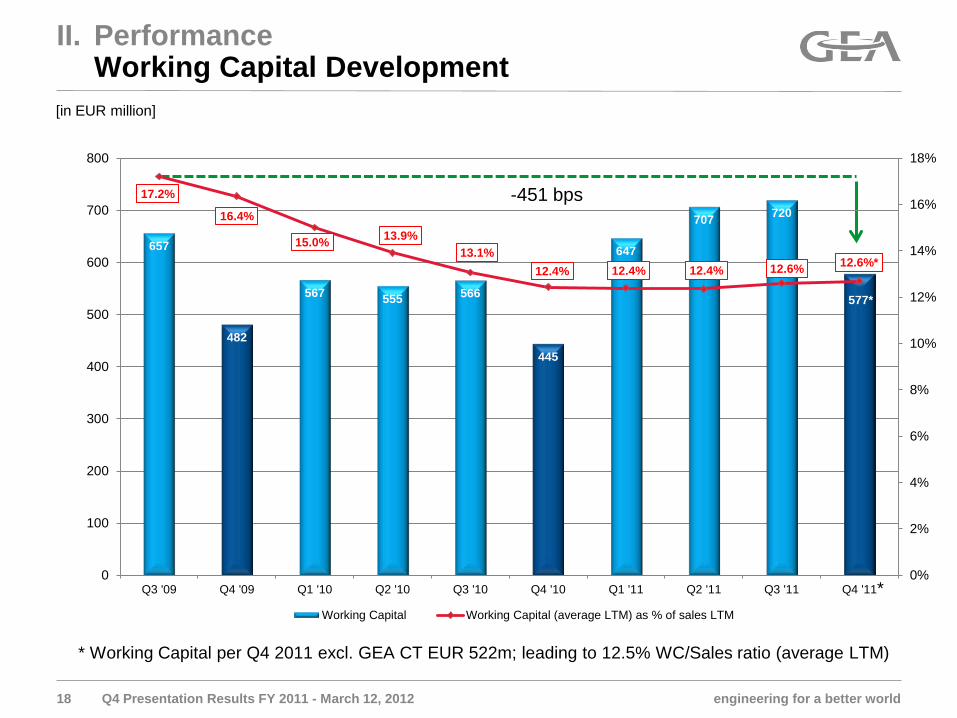
II. Performance Working Capital Development
-451 bps
[in EUR million]
Q4 Presentation Results FY 2011 - March 12, 2012
657
482
567 555 566
445
647
707 720
577*
17.2%
16.4%
15.0% 13.9% 13.1%
12.4% 12.4% 12.4% 12.6% 12.6%*
0%
2%
4%
6%
8%
10%
12%
14%
16%
18%
0
100
200
300
400
500
600
700
800
Q3 '09 Q4 '09 Q1 '10 Q2 '10 Q3 '10 Q4 '10 Q1 '11 Q2 '11 Q3 '11 Q4 '11
Working Capital Working Capital (average LTM) as % of sales LTM
* Working Capital per Q4 2011 excl. GEA CT EUR 522m; leading to 12.5% WC/Sales ratio (average LTM)
*
engineering for a better world
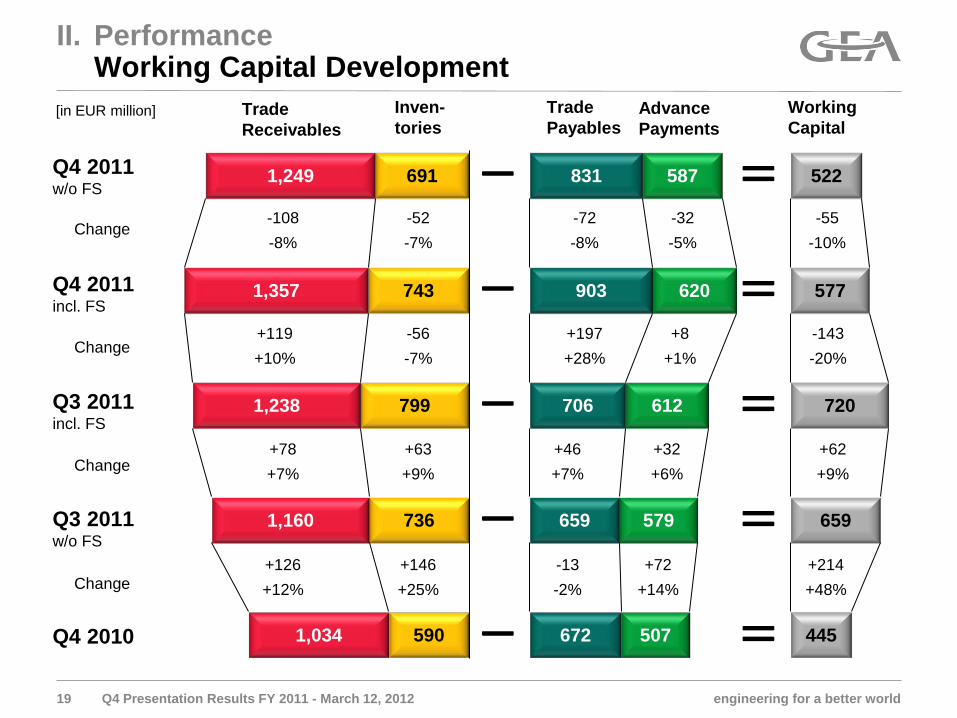
590
736
799
743
691
1,034
1,160
1,238
1,357
1,249
672
659
706
903
831
507
579
612
620
587
445
659
720
577
522
Q3 2011 w/o FS
19
Q4 2011 incl. FS
Q4 2010
−
=
Trade Receivables
Inven- tories
Trade Payables
Advance Payments
Working Capital
Q3 2011 incl. FS −
−
−
=
=
=
Change
Change
+126 +12%
+146 +25%
-13 -2%
+72 +14%
+214 +48%
+119 +10%
-56 -7%
+197 +28%
+8 +1%
-143 -20%
[in EUR million]
Change +78 +7%
+63 +9%
+46 +7%
+32 +6%
+62 +9%
−
=
Q4 2011 w/o FS
Change -108 -8%
-52 -7%
-72 -8%
-32 -5%
-55 -10%
Q4 Presentation Results FY 2011 - March 12, 2012
II. Performance Working Capital Development
engineering for a better world
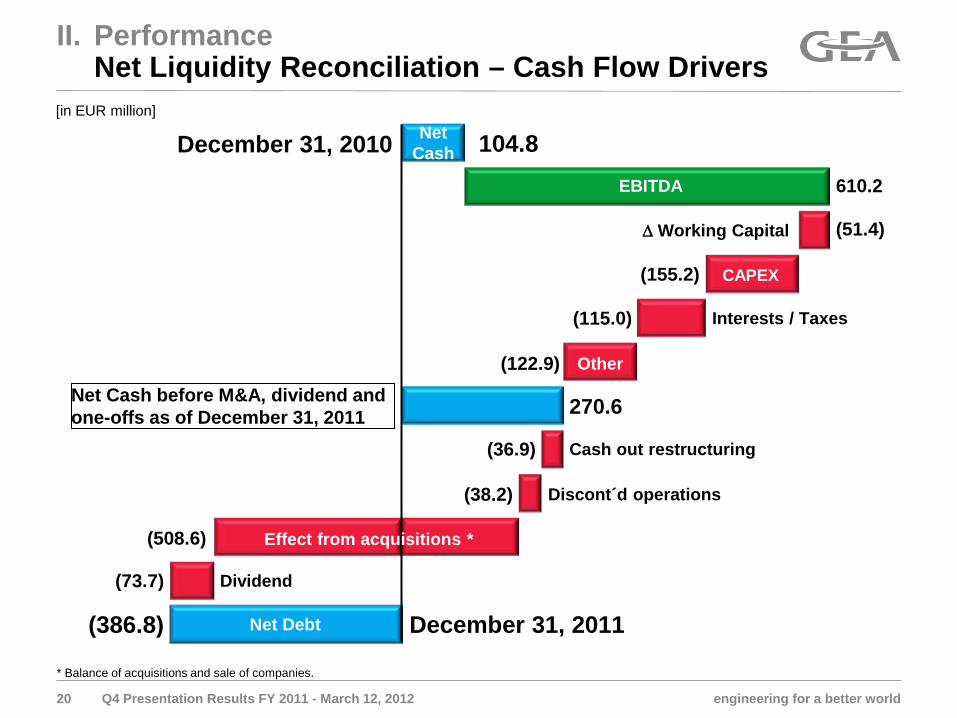
II. Performance Net Liquidity Reconciliation – Cash Flow Drivers
20 Q4 Presentation Results FY 2011 - March 12, 2012
Net Cash 104.8 December 31, 2010
EBITDA
∆ Working Capital
CAPEX
Net Debt
Discont´d operations
Interests / Taxes
Cash out restructuring
December 31, 2011
(73.7)
(386.8)
(51.4)
(155.2)
(115.0)
(36.9)
610.2
(122.9)
(38.2)
Other
(508.6)
Net Cash before M&A, dividend and one-offs as of December 31, 2011 270.6
Dividend
Effect from acquisitions *
* Balance of acquisitions and sale of companies.
[in EUR million]

engineering for a better world
II. Performance Financial Leeway
Q4 Presentation Results FY 2011 - March 12, 2012
[in EUR million] 12/31/2011 12/31/2010 Change
Cash & Equivalents 432 564 -132
Securities 0 0 0
Loans 819 459 +360
Net cash -387 105 -492
Equity 2,164 1,868
Gearing +17.9% -5.6%
GEA credit lines [in EUR million]
Due date 12/31/2011 granted
12/31/2011 utilized
12/31/2011 unutilized
Total cash credit lines 1,703 819 884
of which:
Borrowers note loan 08/2013 128 128 0
Syndicated credit line 06/2015 650 0 650
Bond 04/2016 400 400 0
KfW I Amortization Loan KfW II Amortization Loan
05/2016 12/2016
90 56
90 0
0 56
European Investment Bank 07/2017 150 150 0
21
engineering for a better world
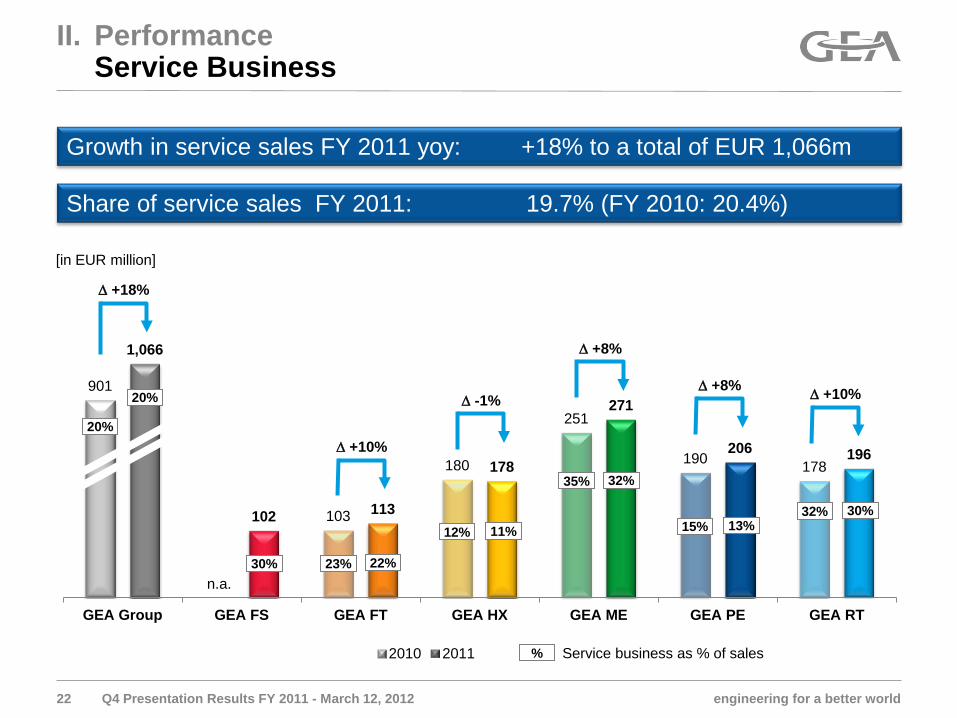
901
n.a.
103
180
251
190 178
1,066
102 113
178
271
206 196
GEA Group GEA FS GEA FT GEA HX GEA ME GEA PE GEA RT
2010 2011 Service business as % of sales
22
II. Performance Service Business
Growth in service sales FY 2011 yoy: +18% to a total of EUR 1,066m
Share of service sales FY 2011: 19.7% (FY 2010: 20.4%)
23%
∆ +18%
∆ +10%
∆ -1%
∆ +8%
∆ +8% ∆ +10%
Q4 Presentation Results FY 2011 - March 12, 2012
%
22%
20%
20%
30%
12% 11%
35% 32%
15% 13% 32% 30%
[in EUR million]
engineering for a better world 23
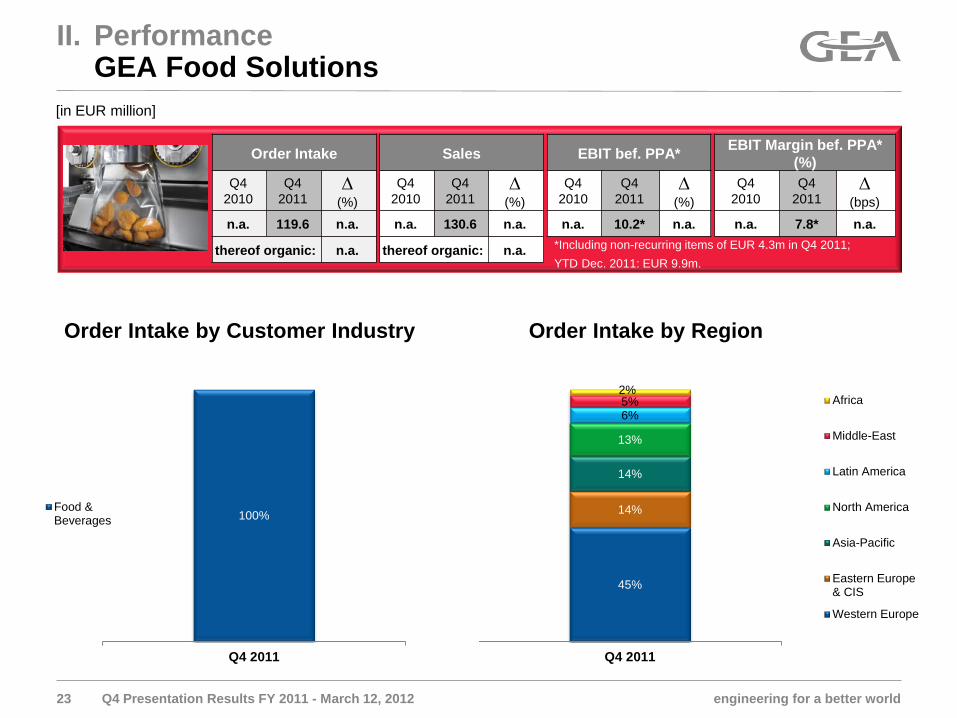
II. Performance GEA Food Solutions
Order Intake
Q4 2010
Q4 2011
∆ (%)
n.a. 119.6 n.a.
thereof organic: n.a.
Sales
Q4 2010
Q4 2011
∆ (%)
n.a. 130.6 n.a.
thereof organic: n.a.
EBIT bef. PPA*
Q4 2010
Q4 2011
∆ (%)
n.a. 10.2* n.a.
EBIT Margin bef. PPA* (%)
Q4 2010
Q4 2011
∆ (bps)
n.a. 7.8* n.a. *Including non-recurring items of EUR 4.3m in Q4 2011; YTD Dec. 2011: EUR 9.9m.
[in EUR million]
Order Intake by Customer Industry Order Intake by Region
100%
Q4 2011
Food &Beverages
45%
14%
14%
13%
6% 5% 2%
Q4 2011
Africa
Middle-East
Latin America
North America
Asia-Pacific
Eastern Europe& CIS
Western Europe
Q4 Presentation Results FY 2011 - March 12, 2012
engineering for a better world 24
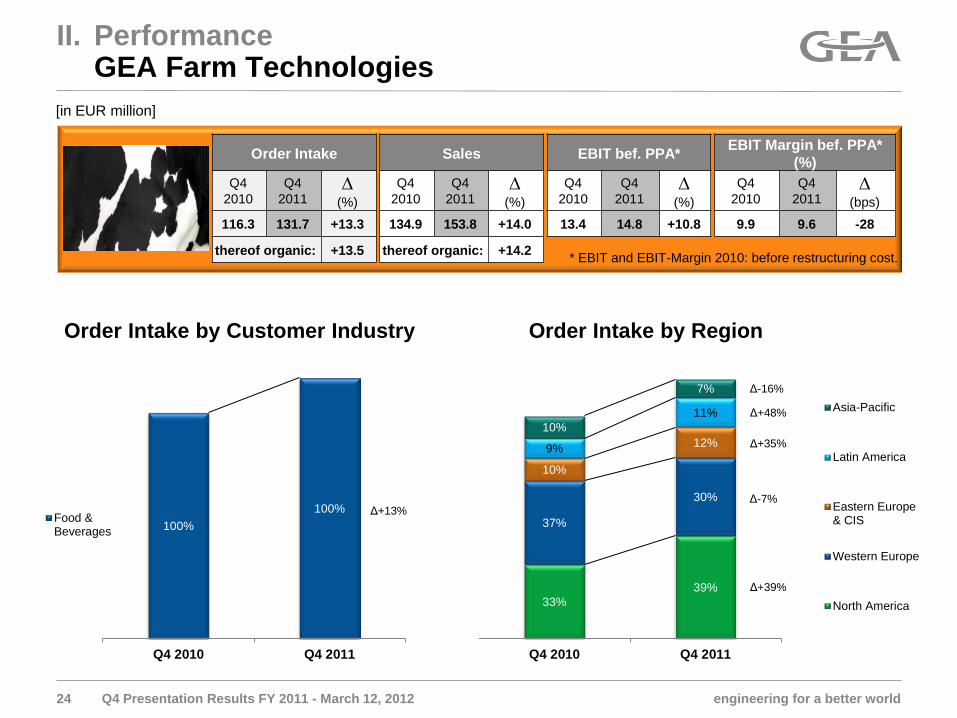
II. Performance GEA Farm Technologies
Order Intake
Q4 2010
Q4 2011
∆ (%)
116.3 131.7 +13.3
thereof organic: +13.5
Sales
Q4 2010
Q4 2011
∆ (%)
134.9 153.8 +14.0
thereof organic: +14.2
EBIT bef. PPA*
Q4 2010
Q4 2011
∆ (%)
13.4 14.8 +10.8
EBIT Margin bef. PPA* (%)
Q4 2010
Q4 2011
∆ (bps)
9.9 9.6 -28
* EBIT and EBIT-Margin 2010: before restructuring cost.
[in EUR million]
100% 100%
Q4 2010 Q4 2011
Food &Beverages
33% 39%
37%
30%
10%
12% 9%
11% 10%
7%
Q4 2010 Q4 2011
Asia-Pacific
Latin America
Eastern Europe& CIS
Western Europe
North America
Order Intake by Customer Industry Order Intake by Region
Δ+13%
Δ+39%
Δ-7%
Δ-16%
Δ+48%
Δ+35%
Q4 Presentation Results FY 2011 - March 12, 2012
engineering for a better world
8%
36% 39%
32% 8%
9%
16%
9%
8%
6%
13%
4%
8%
4%
Q4 2010 Q4 2011
Latin America
Africa
North America
Middle-East
Eastern Europe& CIS
Western Europe
Asia-Pacific
44% 47%
29%
23%
14% 12% 2%
6%
5%
4%
4%
4% 3%
3%
Q4 2010 Q4 2011
Marine
Food &Beverages
Other Industries
Chemicals
Oil & Gas
Climate &Environment
Power
25
II. Performance GEA Heat Exchangers
Order Intake
Q4 2010
Q4 2011
∆ (%)
399.2 462.3 +15.8
thereof organic: +10.1
Sales
Q4 2010
Q4 2011
∆ (%)
410.1 463.6 +13.0
thereof organic: +11.4
EBIT bef. PPA*
Q4 2010
Q4 2011
∆ (%)
40.0 36.8 -8.1
EBIT Margin bef. PPA* (%)
Q4 2010
Q4 2011
∆ (bps)
9.8 7.9 -182 * Including non-recurring items of EUR 13m in Q4 2011; EBIT and EBIT-Margin 2010: before restructuring cost.
[in EUR million]
Order Intake by Customer Industry Order Intake by Region
Δ+25%
Δ-9%
Δ+3%
Δ+370% Δ-3% Δ+5% Δ+8%
Δ+384%
Δ-4%
Δ+32%
Δ-38%
Δ-41%
Δ-61% Δ-18%
Q4 Presentation Results FY 2011 - March 12, 2012
engineering for a better world
II. Performance GEA Mechanical Equipment
Order Intake
Q4 2010
Q4 2011
∆ (%)
181.8 203.9 +12.2
thereof organic: +11.2
Sales
Q4 2010
Q4 2011
∆ (%)
201.9 240.4 +19.1
thereof organic: +18.5
EBIT bef. PPA*
Q4 2010
Q4 2011
∆ (%)
39.7 54.0 +35.8
EBIT Margin bef. PPA* (%)
Q4 2010
Q4 2011
∆ (bps)
19.7 22.4 +276
* EBIT and EBIT-Margin 2010: before restructuring cost.
[in EUR million]
54% 60%
16%
12% 3%
7% 7%
6% 7%
5% 8%
4% 5%
4% 1%
Q4 2010 Q4 2011
OtherIndustriesPharma
Chemicals
Climate &EnvironmentOil & Gas
Power
Marine
Food &Beverages
Order Intake by Customer Industry Order Intake by Region
31% 30%
32% 30%
18% 24%
10%
6% 4%
5% 3%
2% 1% 2%
Q4 2010 Q4 2011
Africa
Middle-East
Eastern Europe& CIS
Latin America
North America
WesternEurope
Asia-Pacific
Δ+21%
Δ-14%
Δ+129%
Δ-14% Δ-41% Δ-6%
Δ-2%
Δ+10%
Δ+3%
Δ+45%
Δ-32% Δ+31% Δ-25% Δ+70%
Q4 Presentation Results FY 2011 - March 12, 2012 26
Δ+1035%
engineering for a better world 27
II. Performance GEA Process Engineering
Order Intake
Q4 2010
Q4 2011
∆ (%)
419.7 449.0 +7.0
thereof organic: +4.3
Sales
Q4 2010
Q4 2011
∆ (%)
402.2 496.6 +23.5
thereof organic: +20.6
EBIT bef. PPA*
Q4 2010
Q4 2011
∆ (%)
44.7 69.6 +55.7
EBIT Margin bef. PPA* (%)
Q4 2010
Q4 2011
∆ (bps)
11.1 14.0 +291
* EBIT and EBIT-Margin 2010: before restructuring cost.
[in EUR million]
74% 74%
8%
16% 11%
6% 3%
3%
2% 3%
Q4 2010 Q4 2011
Other Industries
Power
Climate &Environment
Oil & Gas
Chemicals
Pharma
Food &Beverages
29% 36%
32% 26%
11%
15% 8%
11% 8%
9% 8%
2% 4% 2%
Q4 2010 Q4 2011
Africa
Middle-East
Latin America
Eastern Europe& CIS
North America
Western Europe
Asia-Pacific
Order Intake by Customer Industry Order Intake by Region
Δ+6%
Δ+103 %
Δ-47% Δ+1684% Δ-40 %
Δ+33%
Δ-13%
Δ+51%
Δ+43%
Δ+11% Δ-76% Δ-55%
Q4 Presentation Results FY 2011 - March 12, 2012
engineering for a better world 28
II. Performance GEA Refrigeration Technologies
Order Intake
Q4 2010
Q4 2011
∆ (%)
152.5 170.1 +11.5
thereof organic: +3.4
Sales
Q4 2010
Q4 2011
∆ (%)
171.3 181.6 +6.0
thereof organic: -2.6
EBIT bef. PPA*
Q4 2010
Q4 2011
∆ (%)
13.9 20.0 +44.0
EBIT Margin bef. PPA* (%)
Q4 2010
Q4 2011
∆ (bps)
8.1 11.0 +291
* EBIT and EBIT-Margin 2010: before restructuring cost.
[in EUR million]
65% 57%
7% 18% 7%
9% 6%
7% 5%
4% 4%
3% 5% 2%
Q4 2010 Q4 2011
Power
Marine
Oil & Gas
Climate &EnvironmentChemicals
Other Industries
Food &Beverages
48% 42%
14% 18%
9% 14%
15% 11%
7% 6% 5% 5% 1%
4%
Q4 2010 Q4 2011
Latin America
Middle-East
Africa
Asia-Pacific
North America
Eastern Europe& CIS
Western Europe
Δ-6%
Δ+174%
Δ+26% Δ-15% Δ-19% Δ-68%
Δ+42%
Δ-6%
Δ+39%
Δ+71%
Δ-21% Δ-7% Δ-11% Δ+282%
Order Intake by Customer Industry Order Intake by Region
Q4 Presentation Results FY 2011 - March 12, 2012

engineering for a better world
III. Outlook Key Figures FY 2012
29
an order intake growth: up to +5%
a sales growth: at least +5%
EBIT-margin bef. ppa. incl GEA FS: at least on FY 2011 level of 9.7%
For FY 2012 we aim at
Q4 Presentation Results FY 2011 - March 12, 2012
engineering for a better world
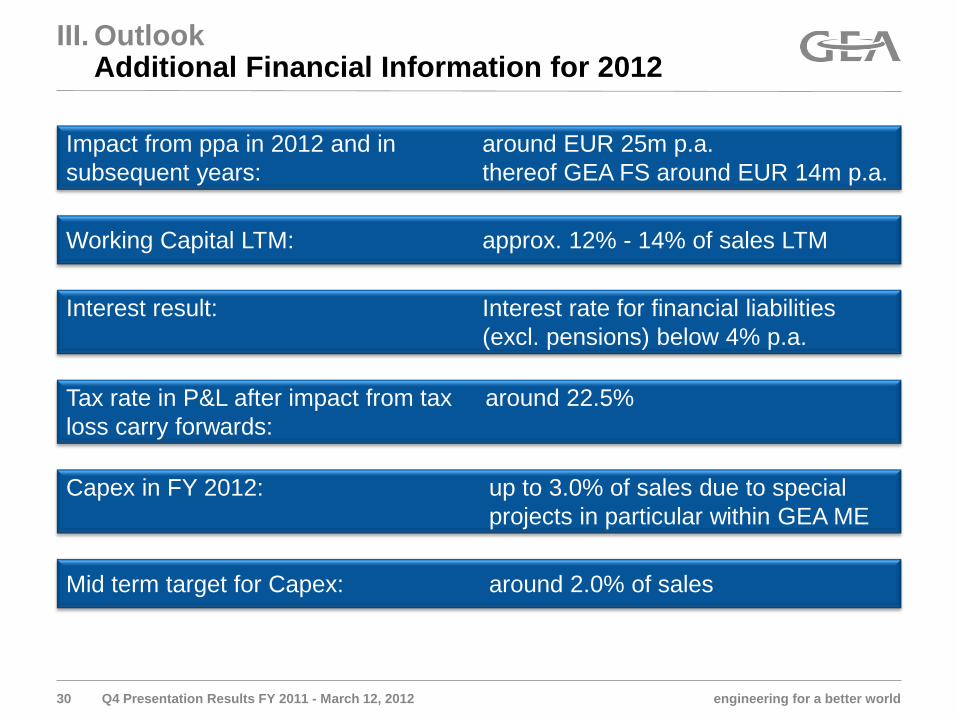
III. Outlook Additional Financial Information for 2012
30
Tax rate in P&L after impact from tax around 22.5% loss carry forwards:
Impact from ppa in 2012 and in around EUR 25m p.a. subsequent years: thereof GEA FS around EUR 14m p.a.
Mid term target for Capex: around 2.0% of sales
Q4 Presentation Results FY 2011 - March 12, 2012
Capex in FY 2012: up to 3.0% of sales due to special projects in particular within GEA ME
Working Capital LTM: approx. 12% - 14% of sales LTM
Interest result: Interest rate for financial liabilities (excl. pensions) below 4% p.a.

engineering for a better world
III. Outlook Long term – Over the Cycle
31
EBIT margin before ppa-impact: Target of 12% after recovery to pre-crisis market conditions
Acquisitions to continue
Dividend payout ratio: 1/3 of net income
Long term growth of GEA end markets: 3% – 6% p.a., clearly > GDP growth
Q4 Presentation Results FY 2011 - March 12, 2012
engineering for a better world
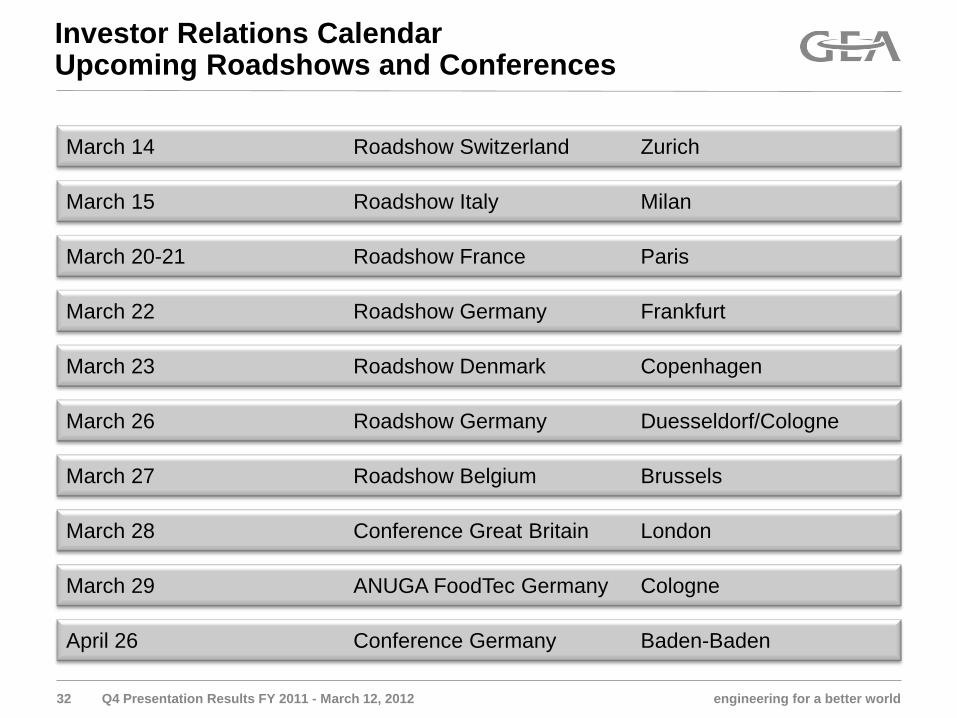
Investor Relations Calendar Upcoming Roadshows and Conferences
32 Q4 Presentation Results FY 2011 - March 12, 2012
March 14 Roadshow Switzerland Zurich
March 15 Roadshow Italy Milan
March 20-21 Roadshow France Paris
March 22 Roadshow Germany Frankfurt
March 23 Roadshow Denmark Copenhagen
March 26 Roadshow Germany Duesseldorf/Cologne
March 27 Roadshow Belgium Brussels
April 26 Conference Germany Baden-Baden
March 28 Conference Great Britain London
March 29 ANUGA FoodTec Germany Cologne
engineering for a better world
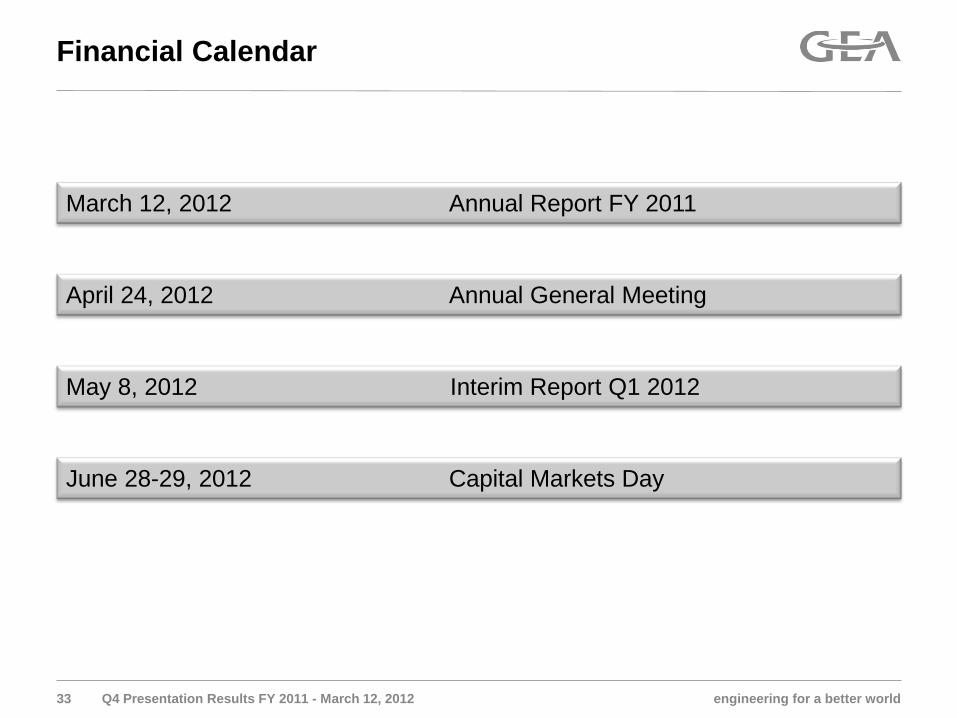
Financial Calendar
33
March 12, 2012 Annual Report FY 2011
April 24, 2012 Annual General Meeting
May 8, 2012 Interim Report Q1 2012
Q4 Presentation Results FY 2011 - March 12, 2012
June 28-29, 2012 Capital Markets Day


engineering for a better world
Agenda
35 Q4 Presentation Results FY 2011 - March 12, 2012
January – December 2011
I. Key Figures
II. Performance
Backup
Performance GEA Group and Segments
III. Outlook
engineering for a better world 36
∆ abs. ∆ in %
∆ abs. ∆ in %
∆ abs. ∆ in %
∆ abs. ∆ in %
∆ abs. ∆ in %
[in EUR million]
Q4 Presentation Results FY 2011 - March 12, 2012
Q4 2011 vs. Q4 2010
Q1-Q4 2011 vs. Q1-Q4 2010
Q4 2011 vs. Q3 2011
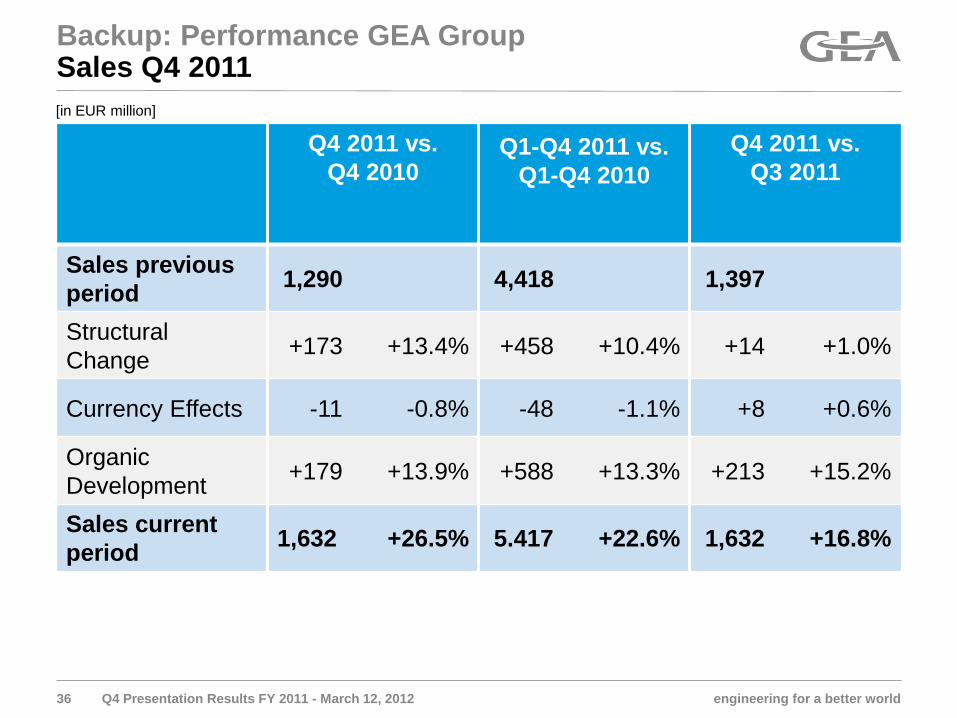
Sales previous period 1,290 4,418 1,397
Structural Change +173 +13.4% +458 +10.4% +14 +1.0%
Currency Effects -11 -0.8% -48 -1.1% +8 +0.6%
Organic Development +179 +13.9% +588 +13.3% +213 +15.2%
Sales current period 1,632 +26.5% 5.417 +22.6% 1,632 +16.8%
Backup: Performance GEA Group Sales Q4 2011
engineering for a better world
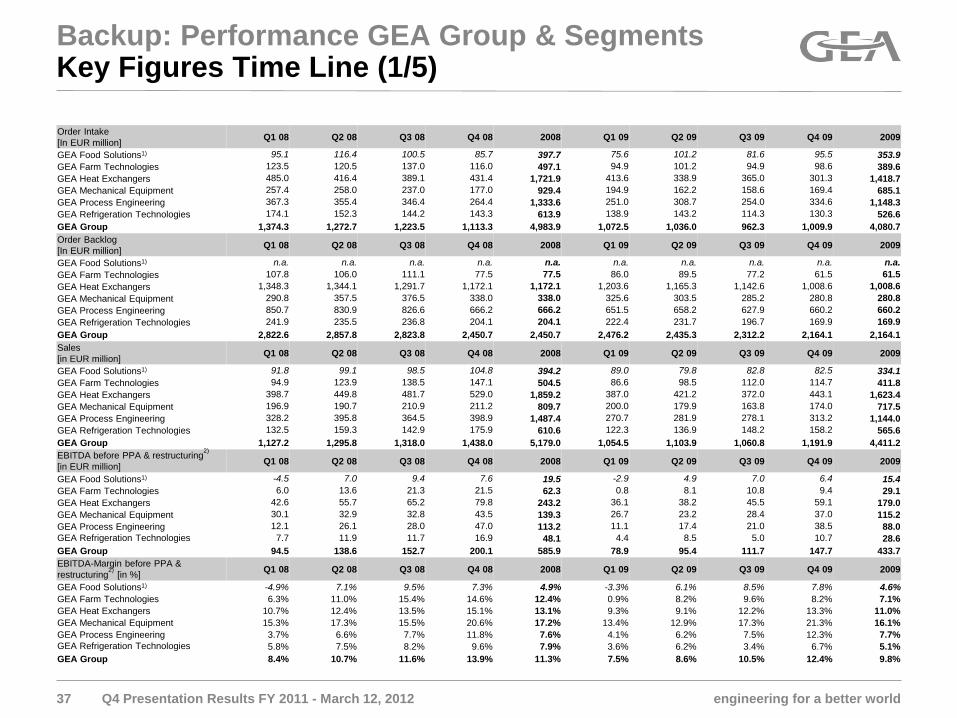
Backup: Performance GEA Group & Segments Key Figures Time Line (1/5)
Q4 Presentation Results FY 2011 - March 12, 2012 37
Order Intake [In EUR million] Q1 08 Q2 08 Q3 08 Q4 08 2008 Q1 09 Q2 09 Q3 09 Q4 09 2009
GEA Food Solutions1) 95.1 116.4 100.5 85.7 397.7 75.6 101.2 81.6 95.5 353.9 GEA Farm Technologies 123.5 120.5 137.0 116.0 497.1 94.9 101.2 94.9 98.6 389.6 GEA Heat Exchangers 485.0 416.4 389.1 431.4 1,721.9 413.6 338.9 365.0 301.3 1,418.7 GEA Mechanical Equipment 257.4 258.0 237.0 177.0 929.4 194.9 162.2 158.6 169.4 685.1 GEA Process Engineering 367.3 355.4 346.4 264.4 1,333.6 251.0 308.7 254.0 334.6 1,148.3 GEA Refrigeration Technologies 174.1 152.3 144.2 143.3 613.9 138.9 143.2 114.3 130.3 526.6 GEA Group 1,374.3 1,272.7 1,223.5 1,113.3 4,983.9 1,072.5 1,036.0 962.3 1,009.9 4,080.7 Order Backlog [In EUR million] Q1 08 Q2 08 Q3 08 Q4 08 2008 Q1 09 Q2 09 Q3 09 Q4 09 2009
GEA Food Solutions1) n.a. n.a. n.a. n.a. n.a. n.a. n.a. n.a. n.a. n.a. GEA Farm Technologies 107.8 106.0 111.1 77.5 77.5 86.0 89.5 77.2 61.5 61.5 GEA Heat Exchangers 1,348.3 1,344.1 1,291.7 1,172.1 1,172.1 1,203.6 1,165.3 1,142.6 1,008.6 1,008.6 GEA Mechanical Equipment 290.8 357.5 376.5 338.0 338.0 325.6 303.5 285.2 280.8 280.8 GEA Process Engineering 850.7 830.9 826.6 666.2 666.2 651.5 658.2 627.9 660.2 660.2 GEA Refrigeration Technologies 241.9 235.5 236.8 204.1 204.1 222.4 231.7 196.7 169.9 169.9 GEA Group 2,822.6 2,857.8 2,823.8 2,450.7 2,450.7 2,476.2 2,435.3 2,312.2 2,164.1 2,164.1 Sales [in EUR million] Q1 08 Q2 08 Q3 08 Q4 08 2008 Q1 09 Q2 09 Q3 09 Q4 09 2009
GEA Food Solutions1) 91.8 99.1 98.5 104.8 394.2 89.0 79.8 82.8 82.5 334.1 GEA Farm Technologies 94.9 123.9 138.5 147.1 504.5 86.6 98.5 112.0 114.7 411.8 GEA Heat Exchangers 398.7 449.8 481.7 529.0 1,859.2 387.0 421.2 372.0 443.1 1,623.4 GEA Mechanical Equipment 196.9 190.7 210.9 211.2 809.7 200.0 179.9 163.8 174.0 717.5 GEA Process Engineering 328.2 395.8 364.5 398.9 1,487.4 270.7 281.9 278.1 313.2 1,144.0 GEA Refrigeration Technologies 132.5 159.3 142.9 175.9 610.6 122.3 136.9 148.2 158.2 565.6 GEA Group 1,127.2 1,295.8 1,318.0 1,438.0 5,179.0 1,054.5 1,103.9 1,060.8 1,191.9 4,411.2 EBITDA before PPA & restructuring2) [in EUR million] Q1 08 Q2 08 Q3 08 Q4 08 2008 Q1 09 Q2 09 Q3 09 Q4 09 2009
GEA Food Solutions1) -4.5 7.0 9.4 7.6 19.5 -2.9 4.9 7.0 6.4 15.4 GEA Farm Technologies 6.0 13.6 21.3 21.5 62.3 0.8 8.1 10.8 9.4 29.1 GEA Heat Exchangers 42.6 55.7 65.2 79.8 243.2 36.1 38.2 45.5 59.1 179.0 GEA Mechanical Equipment 30.1 32.9 32.8 43.5 139.3 26.7 23.2 28.4 37.0 115.2 GEA Process Engineering 12.1 26.1 28.0 47.0 113.2 11.1 17.4 21.0 38.5 88.0 GEA Refrigeration Technologies 7.7 11.9 11.7 16.9 48.1 4.4 8.5 5.0 10.7 28.6 GEA Group 94.5 138.6 152.7 200.1 585.9 78.9 95.4 111.7 147.7 433.7 EBITDA-Margin before PPA & restructuring2) [in %] Q1 08 Q2 08 Q3 08 Q4 08 2008 Q1 09 Q2 09 Q3 09 Q4 09 2009
GEA Food Solutions1) -4.9% 7.1% 9.5% 7.3% 4.9% -3.3% 6.1% 8.5% 7.8% 4.6% GEA Farm Technologies 6.3% 11.0% 15.4% 14.6% 12.4% 0.9% 8.2% 9.6% 8.2% 7.1% GEA Heat Exchangers 10.7% 12.4% 13.5% 15.1% 13.1% 9.3% 9.1% 12.2% 13.3% 11.0% GEA Mechanical Equipment 15.3% 17.3% 15.5% 20.6% 17.2% 13.4% 12.9% 17.3% 21.3% 16.1% GEA Process Engineering 3.7% 6.6% 7.7% 11.8% 7.6% 4.1% 6.2% 7.5% 12.3% 7.7% GEA Refrigeration Technologies 5.8% 7.5% 8.2% 9.6% 7.9% 3.6% 6.2% 3.4% 6.7% 5.1% GEA Group 8.4% 10.7% 11.6% 13.9% 11.3% 7.5% 8.6% 10.5% 12.4% 9.8%
engineering for a better world
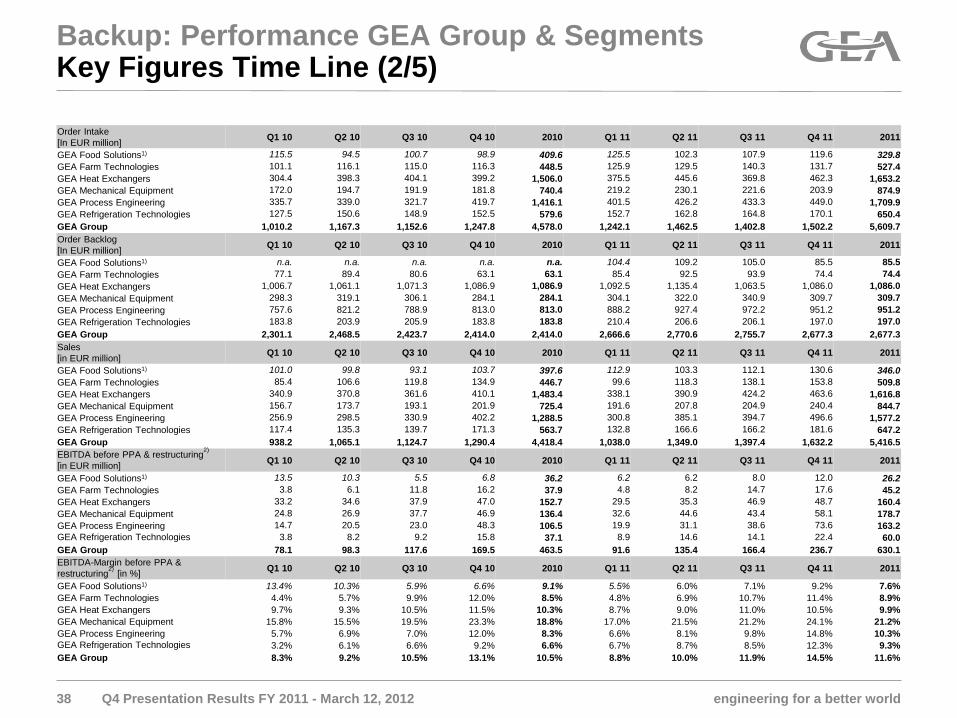
Backup: Performance GEA Group & Segments Key Figures Time Line (2/5)
Q4 Presentation Results FY 2011 - March 12, 2012 38
Order Intake [In EUR million] Q1 10 Q2 10 Q3 10 Q4 10 2010 Q1 11 Q2 11 Q3 11 Q4 11 2011
GEA Food Solutions1) 115.5 94.5 100.7 98.9 409.6 125.5 102.3 107.9 119.6 329.8 GEA Farm Technologies 101.1 116.1 115.0 116.3 448.5 125.9 129.5 140.3 131.7 527.4 GEA Heat Exchangers 304.4 398.3 404.1 399.2 1,506.0 375.5 445.6 369.8 462.3 1,653.2 GEA Mechanical Equipment 172.0 194.7 191.9 181.8 740.4 219.2 230.1 221.6 203.9 874.9 GEA Process Engineering 335.7 339.0 321.7 419.7 1,416.1 401.5 426.2 433.3 449.0 1,709.9 GEA Refrigeration Technologies 127.5 150.6 148.9 152.5 579.6 152.7 162.8 164.8 170.1 650.4 GEA Group 1,010.2 1,167.3 1,152.6 1,247.8 4,578.0 1,242.1 1,462.5 1,402.8 1,502.2 5,609.7 Order Backlog [In EUR million] Q1 10 Q2 10 Q3 10 Q4 10 2010 Q1 11 Q2 11 Q3 11 Q4 11 2011
GEA Food Solutions1) n.a. n.a. n.a. n.a. n.a. 104.4 109.2 105.0 85.5 85.5 GEA Farm Technologies 77.1 89.4 80.6 63.1 63.1 85.4 92.5 93.9 74.4 74.4 GEA Heat Exchangers 1,006.7 1,061.1 1,071.3 1,086.9 1,086.9 1,092.5 1,135.4 1,063.5 1,086.0 1,086.0 GEA Mechanical Equipment 298.3 319.1 306.1 284.1 284.1 304.1 322.0 340.9 309.7 309.7 GEA Process Engineering 757.6 821.2 788.9 813.0 813.0 888.2 927.4 972.2 951.2 951.2 GEA Refrigeration Technologies 183.8 203.9 205.9 183.8 183.8 210.4 206.6 206.1 197.0 197.0 GEA Group 2,301.1 2,468.5 2,423.7 2,414.0 2,414.0 2,666.6 2,770.6 2,755.7 2,677.3 2,677.3 Sales [in EUR million] Q1 10 Q2 10 Q3 10 Q4 10 2010 Q1 11 Q2 11 Q3 11 Q4 11 2011
GEA Food Solutions1) 101.0 99.8 93.1 103.7 397.6 112.9 103.3 112.1 130.6 346.0 GEA Farm Technologies 85.4 106.6 119.8 134.9 446.7 99.6 118.3 138.1 153.8 509.8 GEA Heat Exchangers 340.9 370.8 361.6 410.1 1,483.4 338.1 390.9 424.2 463.6 1,616.8 GEA Mechanical Equipment 156.7 173.7 193.1 201.9 725.4 191.6 207.8 204.9 240.4 844.7 GEA Process Engineering 256.9 298.5 330.9 402.2 1,288.5 300.8 385.1 394.7 496.6 1,577.2 GEA Refrigeration Technologies 117.4 135.3 139.7 171.3 563.7 132.8 166.6 166.2 181.6 647.2 GEA Group 938.2 1,065.1 1,124.7 1,290.4 4,418.4 1,038.0 1,349.0 1,397.4 1,632.2 5,416.5 EBITDA before PPA & restructuring2) [in EUR million] Q1 10 Q2 10 Q3 10 Q4 10 2010 Q1 11 Q2 11 Q3 11 Q4 11 2011
GEA Food Solutions1) 13.5 10.3 5.5 6.8 36.2 6.2 6.2 8.0 12.0 26.2 GEA Farm Technologies 3.8 6.1 11.8 16.2 37.9 4.8 8.2 14.7 17.6 45.2 GEA Heat Exchangers 33.2 34.6 37.9 47.0 152.7 29.5 35.3 46.9 48.7 160.4 GEA Mechanical Equipment 24.8 26.9 37.7 46.9 136.4 32.6 44.6 43.4 58.1 178.7 GEA Process Engineering 14.7 20.5 23.0 48.3 106.5 19.9 31.1 38.6 73.6 163.2 GEA Refrigeration Technologies 3.8 8.2 9.2 15.8 37.1 8.9 14.6 14.1 22.4 60.0 GEA Group 78.1 98.3 117.6 169.5 463.5 91.6 135.4 166.4 236.7 630.1 EBITDA-Margin before PPA & restructuring2) [in %] Q1 10 Q2 10 Q3 10 Q4 10 2010 Q1 11 Q2 11 Q3 11 Q4 11 2011
GEA Food Solutions1) 13.4% 10.3% 5.9% 6.6% 9.1% 5.5% 6.0% 7.1% 9.2% 7.6% GEA Farm Technologies 4.4% 5.7% 9.9% 12.0% 8.5% 4.8% 6.9% 10.7% 11.4% 8.9% GEA Heat Exchangers 9.7% 9.3% 10.5% 11.5% 10.3% 8.7% 9.0% 11.0% 10.5% 9.9% GEA Mechanical Equipment 15.8% 15.5% 19.5% 23.3% 18.8% 17.0% 21.5% 21.2% 24.1% 21.2% GEA Process Engineering 5.7% 6.9% 7.0% 12.0% 8.3% 6.6% 8.1% 9.8% 14.8% 10.3% GEA Refrigeration Technologies 3.2% 6.1% 6.6% 9.2% 6.6% 6.7% 8.7% 8.5% 12.3% 9.3% GEA Group 8.3% 9.2% 10.5% 13.1% 10.5% 8.8% 10.0% 11.9% 14.5% 11.6%
engineering for a better world 39
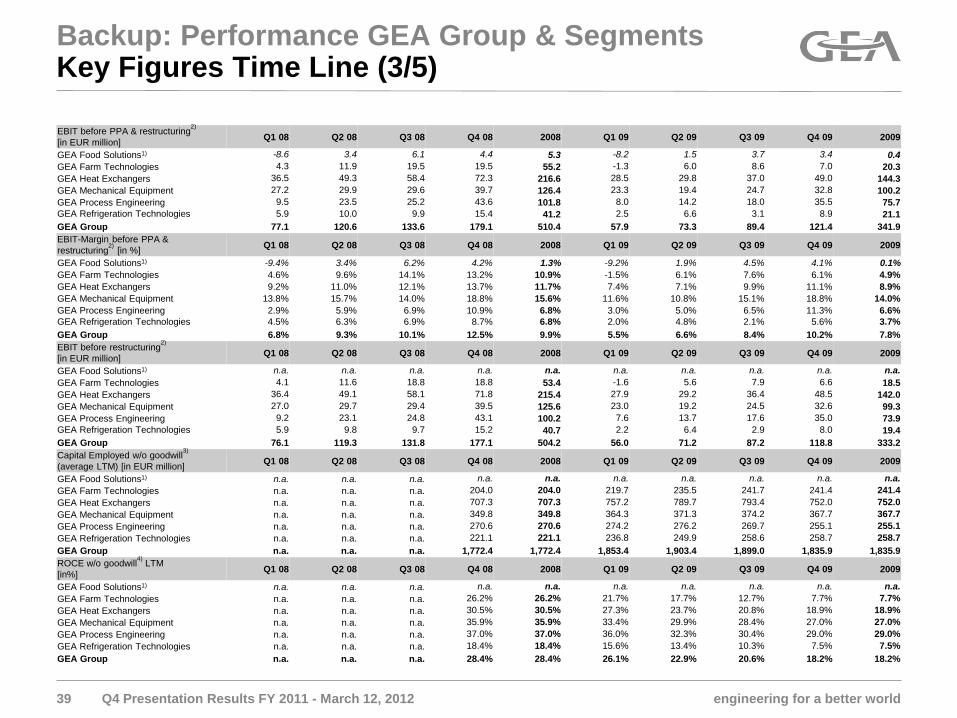
Backup: Performance GEA Group & Segments Key Figures Time Line (3/5)
Q4 Presentation Results FY 2011 - March 12, 2012
EBIT before PPA & restructuring2) [in EUR million] Q1 08 Q2 08 Q3 08 Q4 08 2008 Q1 09 Q2 09 Q3 09 Q4 09 2009
GEA Food Solutions1) -8.6 3.4 6.1 4.4 5.3 -8.2 1.5 3.7 3.4 0.4 GEA Farm Technologies 4.3 11.9 19.5 19.5 55.2 -1.3 6.0 8.6 7.0 20.3 GEA Heat Exchangers 36.5 49.3 58.4 72.3 216.6 28.5 29.8 37.0 49.0 144.3 GEA Mechanical Equipment 27.2 29.9 29.6 39.7 126.4 23.3 19.4 24.7 32.8 100.2 GEA Process Engineering 9.5 23.5 25.2 43.6 101.8 8.0 14.2 18.0 35.5 75.7 GEA Refrigeration Technologies 5.9 10.0 9.9 15.4 41.2 2.5 6.6 3.1 8.9 21.1 GEA Group 77.1 120.6 133.6 179.1 510.4 57.9 73.3 89.4 121.4 341.9 EBIT-Margin before PPA & restructuring2) [in %] Q1 08 Q2 08 Q3 08 Q4 08 2008 Q1 09 Q2 09 Q3 09 Q4 09 2009
GEA Food Solutions1) -9.4% 3.4% 6.2% 4.2% 1.3% -9.2% 1.9% 4.5% 4.1% 0.1% GEA Farm Technologies 4.6% 9.6% 14.1% 13.2% 10.9% -1.5% 6.1% 7.6% 6.1% 4.9% GEA Heat Exchangers 9.2% 11.0% 12.1% 13.7% 11.7% 7.4% 7.1% 9.9% 11.1% 8.9% GEA Mechanical Equipment 13.8% 15.7% 14.0% 18.8% 15.6% 11.6% 10.8% 15.1% 18.8% 14.0% GEA Process Engineering 2.9% 5.9% 6.9% 10.9% 6.8% 3.0% 5.0% 6.5% 11.3% 6.6% GEA Refrigeration Technologies 4.5% 6.3% 6.9% 8.7% 6.8% 2.0% 4.8% 2.1% 5.6% 3.7% GEA Group 6.8% 9.3% 10.1% 12.5% 9.9% 5.5% 6.6% 8.4% 10.2% 7.8% EBIT before restructuring2) [in EUR million] Q1 08 Q2 08 Q3 08 Q4 08 2008 Q1 09 Q2 09 Q3 09 Q4 09 2009
GEA Food Solutions1) n.a. n.a. n.a. n.a. n.a. n.a. n.a. n.a. n.a. n.a. GEA Farm Technologies 4.1 11.6 18.8 18.8 53.4 -1.6 5.6 7.9 6.6 18.5 GEA Heat Exchangers 36.4 49.1 58.1 71.8 215.4 27.9 29.2 36.4 48.5 142.0 GEA Mechanical Equipment 27.0 29.7 29.4 39.5 125.6 23.0 19.2 24.5 32.6 99.3 GEA Process Engineering 9.2 23.1 24.8 43.1 100.2 7.6 13.7 17.6 35.0 73.9 GEA Refrigeration Technologies 5.9 9.8 9.7 15.2 40.7 2.2 6.4 2.9 8.0 19.4 GEA Group 76.1 119.3 131.8 177.1 504.2 56.0 71.2 87.2 118.8 333.2 Capital Employed w/o goodwill3) (average LTM) [in EUR million] Q1 08 Q2 08 Q3 08 Q4 08 2008 Q1 09 Q2 09 Q3 09 Q4 09 2009
GEA Food Solutions1) n.a. n.a. n.a. n.a. n.a. n.a. n.a. n.a. n.a. n.a. GEA Farm Technologies n.a. n.a. n.a. 204.0 204.0 219.7 235.5 241.7 241.4 241.4 GEA Heat Exchangers n.a. n.a. n.a. 707.3 707.3 757.2 789.7 793.4 752.0 752.0 GEA Mechanical Equipment n.a. n.a. n.a. 349.8 349.8 364.3 371.3 374.2 367.7 367.7 GEA Process Engineering n.a. n.a. n.a. 270.6 270.6 274.2 276.2 269.7 255.1 255.1 GEA Refrigeration Technologies n.a. n.a. n.a. 221.1 221.1 236.8 249.9 258.6 258.7 258.7 GEA Group n.a. n.a. n.a. 1,772.4 1,772.4 1,853.4 1,903.4 1,899.0 1,835.9 1,835.9 ROCE w/o goodwill4) LTM [in%] Q1 08 Q2 08 Q3 08 Q4 08 2008 Q1 09 Q2 09 Q3 09 Q4 09 2009
GEA Food Solutions1) n.a. n.a. n.a. n.a. n.a. n.a. n.a. n.a. n.a. n.a. GEA Farm Technologies n.a. n.a. n.a. 26.2% 26.2% 21.7% 17.7% 12.7% 7.7% 7.7% GEA Heat Exchangers n.a. n.a. n.a. 30.5% 30.5% 27.3% 23.7% 20.8% 18.9% 18.9% GEA Mechanical Equipment n.a. n.a. n.a. 35.9% 35.9% 33.4% 29.9% 28.4% 27.0% 27.0% GEA Process Engineering n.a. n.a. n.a. 37.0% 37.0% 36.0% 32.3% 30.4% 29.0% 29.0% GEA Refrigeration Technologies n.a. n.a. n.a. 18.4% 18.4% 15.6% 13.4% 10.3% 7.5% 7.5% GEA Group n.a. n.a. n.a. 28.4% 28.4% 26.1% 22.9% 20.6% 18.2% 18.2%
engineering for a better world 40
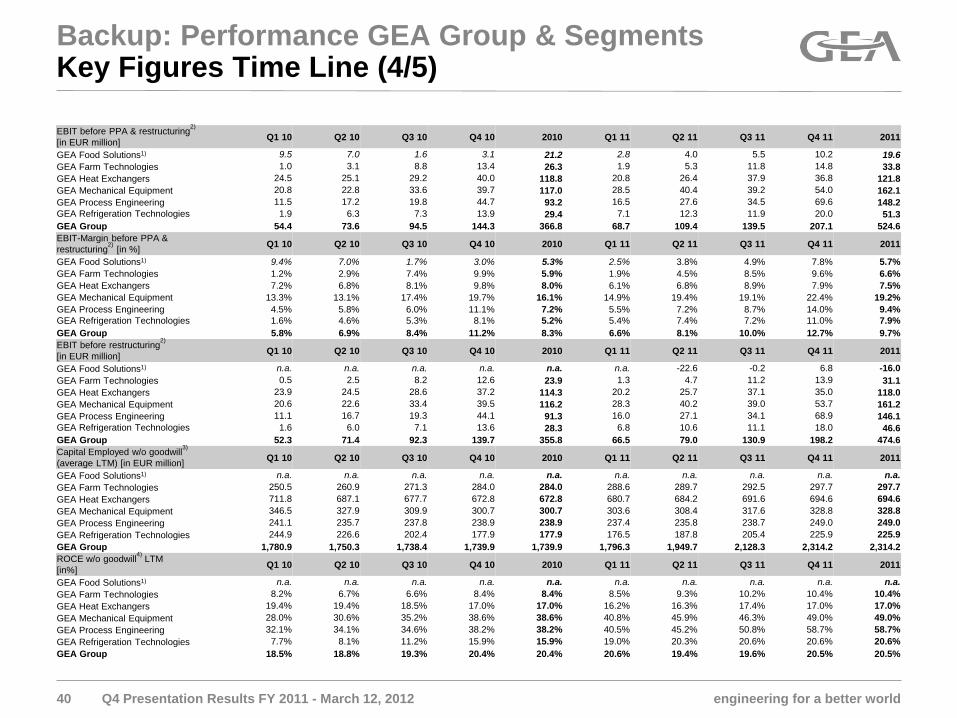
Backup: Performance GEA Group & Segments Key Figures Time Line (4/5)
Q4 Presentation Results FY 2011 - March 12, 2012
EBIT before PPA & restructuring2) [in EUR million] Q1 10 Q2 10 Q3 10 Q4 10 2010 Q1 11 Q2 11 Q3 11 Q4 11 2011
GEA Food Solutions1) 9.5 7.0 1.6 3.1 21.2 2.8 4.0 5.5 10.2 19.6 GEA Farm Technologies 1.0 3.1 8.8 13.4 26.3 1.9 5.3 11.8 14.8 33.8 GEA Heat Exchangers 24.5 25.1 29.2 40.0 118.8 20.8 26.4 37.9 36.8 121.8 GEA Mechanical Equipment 20.8 22.8 33.6 39.7 117.0 28.5 40.4 39.2 54.0 162.1 GEA Process Engineering 11.5 17.2 19.8 44.7 93.2 16.5 27.6 34.5 69.6 148.2 GEA Refrigeration Technologies 1.9 6.3 7.3 13.9 29.4 7.1 12.3 11.9 20.0 51.3 GEA Group 54.4 73.6 94.5 144.3 366.8 68.7 109.4 139.5 207.1 524.6 EBIT-Margin before PPA & restructuring2) [in %] Q1 10 Q2 10 Q3 10 Q4 10 2010 Q1 11 Q2 11 Q3 11 Q4 11 2011
GEA Food Solutions1) 9.4% 7.0% 1.7% 3.0% 5.3% 2.5% 3.8% 4.9% 7.8% 5.7% GEA Farm Technologies 1.2% 2.9% 7.4% 9.9% 5.9% 1.9% 4.5% 8.5% 9.6% 6.6% GEA Heat Exchangers 7.2% 6.8% 8.1% 9.8% 8.0% 6.1% 6.8% 8.9% 7.9% 7.5% GEA Mechanical Equipment 13.3% 13.1% 17.4% 19.7% 16.1% 14.9% 19.4% 19.1% 22.4% 19.2% GEA Process Engineering 4.5% 5.8% 6.0% 11.1% 7.2% 5.5% 7.2% 8.7% 14.0% 9.4% GEA Refrigeration Technologies 1.6% 4.6% 5.3% 8.1% 5.2% 5.4% 7.4% 7.2% 11.0% 7.9% GEA Group 5.8% 6.9% 8.4% 11.2% 8.3% 6.6% 8.1% 10.0% 12.7% 9.7% EBIT before restructuring2) [in EUR million] Q1 10 Q2 10 Q3 10 Q4 10 2010 Q1 11 Q2 11 Q3 11 Q4 11 2011
GEA Food Solutions1) n.a. n.a. n.a. n.a. n.a. n.a. -22.6 -0.2 6.8 -16.0 GEA Farm Technologies 0.5 2.5 8.2 12.6 23.9 1.3 4.7 11.2 13.9 31.1 GEA Heat Exchangers 23.9 24.5 28.6 37.2 114.3 20.2 25.7 37.1 35.0 118.0 GEA Mechanical Equipment 20.6 22.6 33.4 39.5 116.2 28.3 40.2 39.0 53.7 161.2 GEA Process Engineering 11.1 16.7 19.3 44.1 91.3 16.0 27.1 34.1 68.9 146.1 GEA Refrigeration Technologies 1.6 6.0 7.1 13.6 28.3 6.8 10.6 11.1 18.0 46.6 GEA Group 52.3 71.4 92.3 139.7 355.8 66.5 79.0 130.9 198.2 474.6 Capital Employed w/o goodwill3) (average LTM) [in EUR million] Q1 10 Q2 10 Q3 10 Q4 10 2010 Q1 11 Q2 11 Q3 11 Q4 11 2011
GEA Food Solutions1) n.a. n.a. n.a. n.a. n.a. n.a. n.a. n.a. n.a. n.a. GEA Farm Technologies 250.5 260.9 271.3 284.0 284.0 288.6 289.7 292.5 297.7 297.7 GEA Heat Exchangers 711.8 687.1 677.7 672.8 672.8 680.7 684.2 691.6 694.6 694.6 GEA Mechanical Equipment 346.5 327.9 309.9 300.7 300.7 303.6 308.4 317.6 328.8 328.8 GEA Process Engineering 241.1 235.7 237.8 238.9 238.9 237.4 235.8 238.7 249.0 249.0 GEA Refrigeration Technologies 244.9 226.6 202.4 177.9 177.9 176.5 187.8 205.4 225.9 225.9 GEA Group 1,780.9 1,750.3 1,738.4 1,739.9 1,739.9 1,796.3 1,949.7 2,128.3 2,314.2 2,314.2 ROCE w/o goodwill4) LTM [in%] Q1 10 Q2 10 Q3 10 Q4 10 2010 Q1 11 Q2 11 Q3 11 Q4 11 2011
GEA Food Solutions1) n.a. n.a. n.a. n.a. n.a. n.a. n.a. n.a. n.a. n.a. GEA Farm Technologies 8.2% 6.7% 6.6% 8.4% 8.4% 8.5% 9.3% 10.2% 10.4% 10.4% GEA Heat Exchangers 19.4% 19.4% 18.5% 17.0% 17.0% 16.2% 16.3% 17.4% 17.0% 17.0% GEA Mechanical Equipment 28.0% 30.6% 35.2% 38.6% 38.6% 40.8% 45.9% 46.3% 49.0% 49.0% GEA Process Engineering 32.1% 34.1% 34.6% 38.2% 38.2% 40.5% 45.2% 50.8% 58.7% 58.7% GEA Refrigeration Technologies 7.7% 8.1% 11.2% 15.9% 15.9% 19.0% 20.3% 20.6% 20.6% 20.6% GEA Group 18.5% 18.8% 19.3% 20.4% 20.4% 20.6% 19.4% 19.6% 20.5% 20.5%
engineering for a better world 41
Backup: Performance GEA Group & Segments Key Figures Time Line (5/5): Remarks
Q4 Presentation Results FY 2011 - March 12, 2012
1) All historical figures for GEA FS before Q2 2011 are pro-forma figures only and haven't been audited due to the fact that GEA FS's Financial Year was ending end of February. The listed historical figures before Q2 2011 are not included in the Group-numbers of the corresponding period.
2) Restructuring only in FY 2009 and FY 2010.
3) Capital emplyed excluding goodwill from the acquisition of the former GEA AG by the former Metallgesellschaft AG in 1999.
4) ROCE (LTM) = EBIT before restructuring (LTM) / Capital employed (average LTM) excluding goodwill from the acquisition of the former GEA AG by the former Metallgesellschaft AG in 1999.