gearing for growth: future drivers of corporate productivity
TRANSCRIPT

Sponsored by RICOH

© The Economist Intelligence Unit Limited 2011 1
Gearing for growthFuture drivers of corporate productivity
Contents
About the research 2
Executive summary 3
Introduction 6
Human-capital management and productivity 8
Case study: DuPont visualises operational productivity 12
Green employee engagement: A missed opportunity? 15
Technology and productivity 16
Case study: Cemex connects the workforce 21
Corporate strategy and productivity 22
Conclusion 26
Appendix 1: Productivity—the macroeconomic view 28
Appendix 2: Survey results 33

© The Economist Intelligence Unit Limited 20112
Gearing for growthFuture drivers of corporate productivity
Gearing for growth: Future drivers of corporate productivity is an Economist Intelligence Unit report, sponsored by Ricoh. It seeks to examine what approaches firms from all sectors are taking to
improve productivity within their businesses, especially in the current challenging economic climate. The research is based on the following elements:
• A wide-ranging survey of businesses around the world, encompassing all major industries. In all, 379 respondents took part. Nearly half (45%) represented firms with US$500m or less in revenue and 42% came from firms with at least US$1bn in revenue. The respondents were very senior: all held management positions, with 38% from the C-suite or board level.
• In-depth interviews with senior executives, productivity experts and academics, complemented with extensive background research on the subject.
• Macroeconomic measurements of productivity in select developed and developing economies, with analysis of variations between high- and low-productivity markets (in the first appendix).
IntervieweesListed alphabetically by organisation:
• Ron Webb, executive director of APQC (the American Productivity and Quality Center)
• Udo Jung, a Frankfurt-based senior partner and managing director and an expert on asset productivity at The Boston Consulting Group
• Gilberto Garcia, director of innovation at Cemex
• Don Wirth, vice-president of global operations and corporate supply chains at DuPont
• Robert Sherman, vice-president of public affairs at HSBC North America
• Denis Brousseau, vice-president and global leader of organisation and people at IBM’s Global Business Services
• Jennifer Okimoto, associate partner of strategy and transformation at IBM’s Global Business Services
• John Van Reenen, director of the Centre for Economic Performance and professor at the London School of Economics
• Sinan Aral, assistant professor of information, operations and management sciences at the Stern School of Business at New York University
• Lynnette McIntire, communications manager at UPS
About the research

© The Economist Intelligence Unit Limited 2011 3
Gearing for growthFuture drivers of corporate productivity
Executive summary
Increased productivity is a crucial source of economic growth. As economist and Nobel Laureate Paul Krugman famously described it: “Productivity isn’t everything, but in the long run it is almost
everything.”In both good times and bad, successful companies focus on finding ways to increase productivity.
But during tough economic periods, all companies will find it essential to concentrate even more on this challenge. This report examines the various levers that businesses around the world are using to increase the total output that they are able to generate from their inputs, whether in terms of people, technology or other assets. It also considers where executives are focusing their attention as growth returns to the agenda. In an appendix, the report analyses variations in macroeconomic measurements of productivity between select fast-growing developing economies and slower-growing developed ones.
Some of its key findings include:
• Companies are generally optimistic that they can further increase productivity. Two thirds (67%) of companies polled for this report expect to see productivity increases in the next 12 months, either in terms of greater output or more or improved products and services. Executives see two functional areas— operations (58%) and sales (33%)—as likely to see the greatest productivity increases in the next year. North American companies are more pessimistic about seeing productivity gains in terms of improved products or services in the coming year: 59% cite this as likely, compared to 72% in both Asia-Pacific and Europe.
• Managing human capital is seen as by far the most important means of improving productivity. Some 85% of companies believe this is either “crucial” or “important” to their business effectiveness. But managing human capital presents challenges. Respondents, especially those in Europe, cite a lack of engagement and motivation as the biggest obstacle to human-capital productivity, followed by poor performance management. North American companies feel more overstretched and lacking in investment in staffing, making this one of their top obstacles to improved productivity from employees.

© The Economist Intelligence Unit Limited 20114
Gearing for growthFuture drivers of corporate productivity
• Functional training is seen as a key tool for improving productivity. Training ranks highly as an efficient tool for improving productivity, particularly training for particular functions. While 67% of those that have introduced management training programmes see these as effective tools, this rises to 79% when respondents are asked about functional training. Functional training also rises to the top of the list of human-capital initiatives that executives will introduce in the next 12 months that are expected to have the biggest impact on productivity.
• Companies have yet to fully capitalise on the productivity potential of technology. Using the best available technology is only the third-most important factor in productivity, after human capital and good strategic decisions, with 69% ranking this as either crucial or important. Meanwhile, nearly half (49%) of respondents believe they are not getting the most out of technology. This is especially so for European firms (58%, vs 41% in North America). Lack of investment in new technology also emerges as a concern, with 36% overall believing this is hampering productivity. Companies also appear to be missing the productivity potential of social networking technologies, especially in terms of connecting with clients. More than half (54%) of those using social media for clients say it has improved business effectiveness, but relatively few companies have yet deployed this technology.
• There is scepticism about the productivity impact of green practices. While leading companies say they find engaging employees on sustainability initiatives is a powerful motivating tool, the survey respondents appear less certain. Only 32% of those that have introduced green practices say they have had a positive effect on productivity, while half say these practices have no impact on productivity and 17% say they have a negative impact.
• Corporate strategy is seen as key to productivity gains but companies worry about making the best decisions. Making the right strategic choices ranked second (77%) behind managing human-capital more effectively in terms of the primary levers for productivity improvements. But there is concern that common strategies are not always beneficial for productivity. For instance, in the past 12 months 76% of respondents have engaged in cost cutting and labour force reduction. Yet focusing too closely on cost cutting and not making the most of existing resources is also cited most commonly among the top three strategic problems negatively affecting productivity (by 36% of respondents). Respondents’ second most commonly cited strategic problem is an over-emphasis on top-line growth, cited by 30% (rising to 43% among Asian companies).
• China might be the world’s fastest-growing economy, but it continues to lag in terms of overall productivity. In 2001-10 China was comfortably the fastest growing economy of those in this study, enjoying annual average increases in GDP per head (measured in PPP terms) of 12.5%. China also experienced the fastest level of productivity growth of all the major economies. But macroecomomic analysis shows that China still lags way behind the world’s most developed economies in terms of overall productivity levels, suggesting that productivity growth in the country will continue to outstrip that of the developed world.

© The Economist Intelligence Unit Limited 2011 5
Gearing for growthFuture drivers of corporate productivity
• On a macroeconomic scale, spending on education and IT are among the surest ways to boost productivity. One of the best ways for a country to boost productivity levels is by spending more on education—particularly female education, which is often neglected in poorer (and less productive) countries. There is also a close correlation between IT spending and productivity growth: faster growth in IT spending in the developing world largely reflects the extra catch-up potential of these markets and the potential productivity gains that such investment can yield.
© The Economist Intelligence Unit Limited 20116
Gearing for growthFuture drivers of corporate productivity
Introduction
The pressure to enhance productivity—the simple aim of generating more output from each unit of input—has rarely been as intense as it is today. As global firms emerge from the deepest recession in
decades, the emphasis for many is on squeezing more from existing resources. Even if business growth is picking up in some developed markets, widespread hiring has yet to follow as corporate caution continues to constrain budgets.
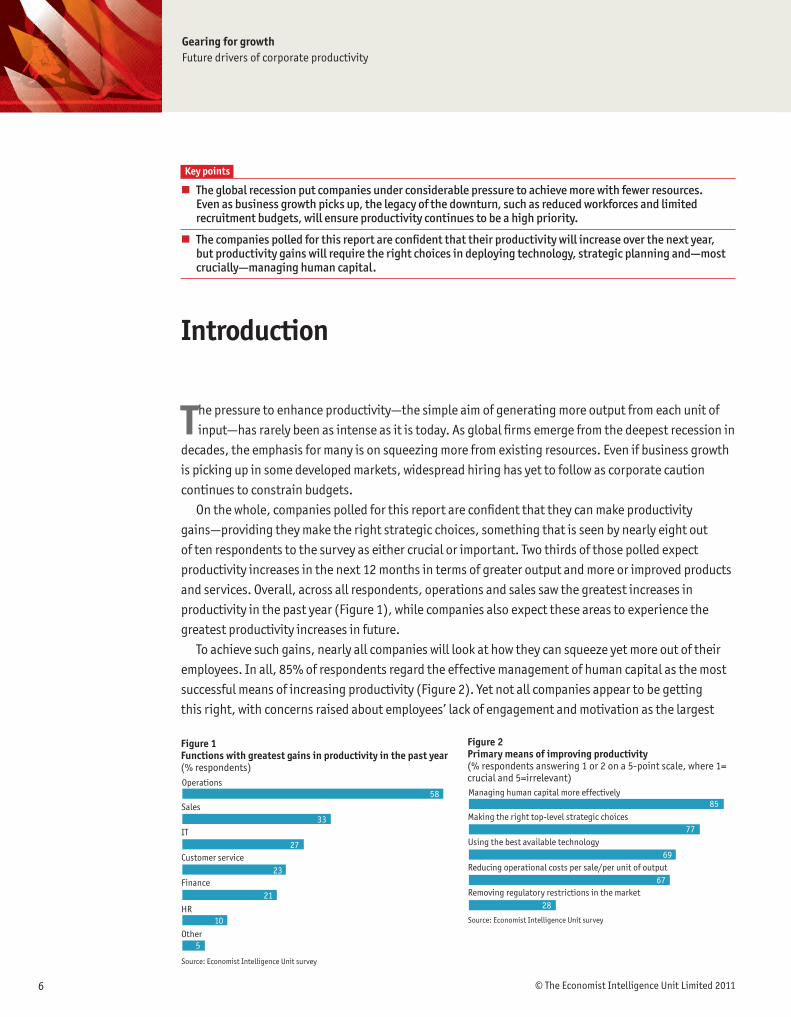
On the whole, companies polled for this report are confident that they can make productivity gains—providing they make the right strategic choices, something that is seen by nearly eight out of ten respondents to the survey as either crucial or important. Two thirds of those polled expect productivity increases in the next 12 months in terms of greater output and more or improved products and services. Overall, across all respondents, operations and sales saw the greatest increases in productivity in the past year (Figure 1), while companies also expect these areas to experience the greatest productivity increases in future.
To achieve such gains, nearly all companies will look at how they can squeeze yet more out of their employees. In all, 85% of respondents regard the effective management of human capital as the most successful means of increasing productivity (Figure 2). Yet not all companies appear to be getting this right, with concerns raised about employees’ lack of engagement and motivation as the largest
Figure 1Functions with greatest gains in productivity in the past year(% respondents)Operations
Sales
IT
58
33
27Customer service
23Finance
21
HR10
Other5
Source: Economist Intelligence Unit survey
Figure 2Primary means of improving productivity(% respondents answering 1 or 2 on a 5-point scale, where 1=crucial and 5=irrelevant)Managing human capital more effectively
Making the right top-level strategic choices
Using the best available technology
85
77
69Reducing operational costs per sale/per unit of output
67Removing regulatory restrictions in the market
Source: Economist Intelligence Unit survey
28
Key points
n The global recession put companies under considerable pressure to achieve more with fewer resources. Even as business growth picks up, the legacy of the downturn, such as reduced workforces and limited recruitment budgets, will ensure productivity continues to be a high priority.
n Thecompaniespolledforthisreportareconfidentthattheirproductivitywillincreaseoverthenextyear,but productivity gains will require the right choices in deploying technology, strategic planning and—most crucially—managing human capital.

© The Economist Intelligence Unit Limited 2011 7
Gearing for growthFuture drivers of corporate productivity
obstacles to productivity gains. This is hardly surprising, given how much weight has already been put onto workers’ shoulders during this recession. But employee dissatisfaction clearly needs to be resolved to enable productivity improvements.
In the absence of increased recruitment budgets, management teams are thinking hard about how to achieve more with less. Executives are looking at a range of tools, from performance management techniques to both functional and management training programmes. Motivating employees through performance management and recognition and reward are also seen as key strategies: many firms have introduced performance-related pay, for example.
With jobs growth likely to accelerate only slowly in 2011, the emphasis on making the most of existing human capital is likely to continue. The annual survey of CareerBuilder, a US online jobs company, found that most companies expect to make no changes to staffing levels in the coming year, with 57% saying that they have adjusted to handling their operations with a smaller headcount.
Accordingly, further investment in better equipment or new technologies, aimed at helping to boost workers’ productivity, is likely to be crucial. Of course, some firms are turning to technology more readily than others. More knowledge-based and service companies highlight technology as a primary means of improving productivity, especially when compared with those in the manufacturing, construction and retail sectors.
Overall, this report assesses what approaches firms today are taking to get more out of their existing resources—whether human capital or financial and physical assets. It examines productivity and management at the firm level, and seeks to find out how companies measure productivity, where productivity gaps are most urgent, and what aspects of human-capital management, technology and strategy are driving business effectiveness.

© The Economist Intelligence Unit Limited 20118
Gearing for growthFuture drivers of corporate productivity
Human-capital management and productivity
In simple terms, increased productivity means producing a higher amount of output for the inputs used. When those inputs are machinery and equipment, increasing productivity is often a matter of
financial investment. However, when the inputs being considered are human, the solutions to greater effectiveness become more complex. A wide range of factors, from remuneration to recognition, motivates human beings to work more effectively.
For companies wanting to maximise their human capital, the challenge is finding the right levers for the right workers. Conversely, failing to manage this is seen as undermining productivity. In the survey, a lack of employee motivation and engagement was most often cited as among the biggest problems affecting human-capital productivity, by 44% of respondents (Figure 3).
Figure 3Biggest problems affecting human capital productivity(% respondents picking response in their top 3; select answers)
Asia-Pacific North AmericaOverstretch/lack of investment in sufficient human resource levels
Poor performance tracking/management
4733
38
34
3951
44
43
3146
38
42
3522
30
26
Lack of employee motivation/engagement
Poor compensation/reward scheme
Source: Economist Intelligence Unit survey
Europe Total
Key points
n A large majority of companies say managing human capital is a major focus when it comes to raising productivity,andtheyaredeployingavarietyoftechniques—hiringsandfirings,promotions,andincreasing basic compensation—to achieve productivity gains.
n Incorporating performance-related pay is a key strategy to motivate employees, but companies are also pursuing programmes that reward employees in non-monetary ways, such as through public recognition of their achievements.
n Employee training is also viewed as important to increasing productivity, especially as employees are increasingly forced to take on greater numbers of responsibilities.
n Companies cite employee overstretch, lack of engagement or motivation, and restrictive labour laws that limithiringandfiringasthetopobstaclestoimprovingemployeeproductivity.

© The Economist Intelligence Unit Limited 2011 9
Gearing for growthFuture drivers of corporate productivity
However, concerns vary across different regions. In North America, the concern is that employees are overstretched, with almost half (47%) of respondents from this region citing lack of investment in staffing levels as the biggest human-capital challenge in their firm. This overstretching is borne out in national data on productivity—contrary to the experience elsewhere, productivity levels actually increased sharply in the US during the economic downturn of 2009, largely as a result of more extensive labour retrenchment. Meanwhile, in Europe motivation and engagement is seen by more than half (51%) of respondents as the factor that most undermines employee productivity, possibly a result of the tendency to keep excess labour during the downturn. (See also Appendix 1.)
Despite the challenges of human-capital management, the survey finds that this is a major focus for companies when it comes to raising productivity. Some 85% of respondents say that this is their primary means of doing so—with many saying it is their number-one priority.
Companies are deploying a variety of management techniques to shore up their productivity gains, from training staff to introducing flexible working practices and finding innovative ways of recognising individual executives or workers. “It’s a broad range of things,” says John Van Reenen, director of the Centre for Economic Performance and a professor at the London School of Economics (LSE): “Hiring and firing, promotions, setting appropriate targets, performance management, collection of data and continuous improvement.”
Companies that can get the mixture of these tools and incentives right are more likely to experience a healthy bottom line, says Professor Van Reenen, who has identified a close connection between better management quality and higher productivity. Working with McKinsey and Stanford University, Professor Van Reenen developed a scorecard as a means of comparing performance on management. When using this scorecard in a survey of thousands of companies in Europe, the US and Asia, it emerged that high management-practice scores correlated well with financial performance metrics. The research found that a single point improvement in management practice score was associated with the same increase in output as a 25% increase in the labour force or a 65% increase in invested capital.
Given this correlation, is hardly surprising that so many respondents in the EIU survey identify human-capital management as the most important factor in increasing productivity.
Motivational carrots and sticksIf maximising the productivity of human capital requires a delicate balance of a range of incentives and rewards, there is nevertheless one reliable tool that can be used to encourage higher performance: money. It is clear from the survey that the way companies distribute compensation among employees is key to their success in motivating the workforce to be more productive.
While simply increasing basic levels of pay is one way of promoting business effectiveness, it is far from the most effective strategy: 57% of those that have introduced this see it as effective, putting it seventh of the 10 human-capital initiatives considered in the survey (Figure 4). Motivating employees through performance-related pay is a better strategy. Some eight in ten respondents have introduced this, and the majority of those report that this has had a positive impact on employee productivity. Nearly one in three firms (29%) plan to introduce performance-linked compensation in the next 12 months.

© The Economist Intelligence Unit Limited 201110
Gearing for growthFuture drivers of corporate productivity
Figure 4Human capital initiatives and their impact on productivity(% respondents, excluding “not applicable” answers)Functional training courses
Positive impact No or negative impact
Linking compensation/pay to performance
Remote working (eg, teleworking)
Management training courses
2179
74 26
74 26
72 28
Improving working environment (eg, bigger office space)
Increasing basic compensation/pay
Introducing green practices (eg, recycling)
Broadening age/gender diversity of workforce
Flex-time working
Rewarding process innovation
Source: Economist Intelligence Unit survey
67 33
64 36
57 43
54 46
50 50
33 67
Rewarding employees for working smarter, as well as harder, is a powerful strategy. While fewer companies have introduced rewards for process innovation, the vast majority of those who have (72%) believe it has had a positive impact on business effectiveness. One in four firms say they will be introducing this in the next 12 months.
Poorly designed compensation and reward schemes are seen by nearly a third of respondents as the biggest barrier to the productivity of human capital, while 38% cite poor performance tracking and measurement as hampering progress in this area.
“When you think about paying people, tying some of their pay to their efforts and ability is better than making pay flat wherever you are in the company,” says Professor Van Reenen. “That’s not to say that everything should be performance-related, but having components of your pay linked to effort and ability is important.”
How that performance is linked to pay varies according to the type of company in question. For UPS, the global logistics firm and a highly operations-oriented company, productivity is measured on a micro-level, with every operation assigned various metrics, key performance indicators and balanced scorecard elements. Managers typically are promoted from within and, since they know the job from the ground up, the focus for their training is on performance. To drive this, all employees have scorecards with annual goals and objectives.
However, when it comes to bonuses, the entire enterprise is treated as a team, with bonuses given on a company-wide basis—and when targets are hit, everyone is rewarded, even if those targets do not relate to their own jobs. “We all see ourselves as part of a big team and if everyone doesn’t perform, we can’t deliver—literally,” says Lynnette McIntire, communications manager at UPS. “So it builds a camaraderie and a feeling that we’re all in this together.”

© The Economist Intelligence Unit Limited 2011 11
Gearing for growthFuture drivers of corporate productivity
Some companies are realising that payment in money is not the only incentive that can fire up workers. A growing number of organisations are finding ways of recognising or showcasing individual employees, particularly in the US, which has a strong cultural acceptance of reward and acknowledgement.
In a recent television advertising campaign run by Intel, for example, employees are referred to as “rock stars” with one ad featuring Alay Bhatt, co-inventor of the Universal Serial Bus (USB), a computer interface, signing autographs as colleagues crowd round him in admiration.
“What you want is to have success stories that people can leverage,” says Don Wirth, vice-president of global operations and corporate supply chains at DuPont, the US chemicals group. “So now internal communication is as much about personal recognition as information.”
At DuPont, recognition at all levels has become a priority. The company issues regular newsletters that highlight success stories—many of them contributed by operators and engineers. “We’re continually looking for examples and publishing it across the organisation,” says Mr Wirth. “Recognition is a wonderful thing.”
However, when it comes to non-financial rewards, a more personalised approach is often needed. “What one person gets excited about may be very different from another based on where they are in life,” says Jennifer Okimoto, associate partner of strategy and transformation at IBM’s Global Business Services. “It’s common to reward with trips, for example. But if you’re someone who travels all the time, that may not be much of a reward.”
Tracking training’s footprintWhen trying to get the most out of human capital, companies have long recognised that training and professional development is a powerful tool. However, in a recession, the focus of this investment may change. With fewer employees forced to take on greater numbers of responsibilities, companies need to beef up the skills of their workforce in new areas.
“The role that training has to play in a downturn is in addressing a risk issue, because you’re going to have people doing more things in roles they’re not used to,” says Ron Webb, executive director of APQC (the American Productivity and Quality Center). “So most of the focus is on functional training—it’s about survival; it’s about how to get product out the door.”
This is reflected in the survey, in which training ranks highly as an efficient productivity tool. While 67% of those that have introduced management training programmes see these as effective tools (confirming Professor Van Reenen’s research), this rises to 79% when respondents are asked about functional training. Functional training also rises to the top of the list when respondents talk about human-capital initiatives their organisation will introduce in the next 12 months that are likely to have the biggest impact on productivity (Figure 5).
Of course, like any human-capital initiative, measuring the impact of training and development on productivity in isolation from other measures is tough. However, companies are starting to look more closely at this.
At IBM, analytics is providing a clearer window into the impact of training. While traditional measurement of training focused on hours of delivery and approval ratings by participants for courses

© The Economist Intelligence Unit Limited 201112
Gearing for growthFuture drivers of corporate productivity
case study DuPont visualises operational productivity
DuPont, the US chemicals group, spent six years driving Six Sigma, the management excellence techniques, through the company. Then, in 2006, it launched its own productivity initiative—the DuPont Production System (DPS). The system uses process tools and techniques for changing mindsets and behaviours to implement comprehensive production improvements throughout its operations.
The focus of the system was to improve productivity at every level of the employee base—including engineers and operators. “We realised we needed to engage the larger community,” says Don Wirth, vice-president of global operations and corporate supply chains at DuPont, and the individual responsible for much of the implementation of DPS.
At the heart of the strategy is a visual form of performance management. At every facility, visual boards provide a meeting place and a means of reviewing performance, prompting action, building teamwork and accelerating problem solving. “It gives operators a place where they can communicate with each other across shifts, and receive updates on different areas such as the production cycle
and the performance of the unit,” says Mr Wirth. Daily meetings in front of the visual boards allow supervisors and
operators to review performance and address inefficiencies that could be as simple as changing a task that requires an unnecessarily long walk. “It’s looking at the design of the work,” says Mr Wirth. “And getting supervisors to be more engaged with their workers.”
Supervisors are coached in the different types of dialogue they might have with operators, from an appreciative conversation to more difficult discussions in which participants have to dig deeper to find out why a system or process is not working as well as it could be. This approach also changes what Mr Wirth calls “the master-victim relationship” and turns it into one focused on collaboration, coaching and teamwork. “You work on the premise that the person is not the problem,” he says. “So it’s shifting the dialogue to a different place—one in which operators can take ownership of continuous improvement.”
In this spirit, each site takes charge of its own DPS implementation. “DPS is giving more control to everyone in the organisation,” says Mr Wirth. “It’s less about rules and more about principles and boundaries.”
Figure 5Human-capital initiatives being introduced in the next 12 months that are expected to have the biggest impact on productivity(% respondents)Functional training courses
Linking compensation/pay to performance
Management training courses
34
29
25
Rewarding process innovation25
Increasing basic compensation/pay18
Improving working environment (eg, bigger office space)15
Broadening age/gender diversity of workforce
Flex-time working
Introducing green practices (eg, recycling)
Other
My company is currently not planning to introduce any of these initiatives over the next 12 months
Source: Economist Intelligence Unit survey
14
13
6
5
16

© The Economist Intelligence Unit Limited 2011 13
Gearing for growthFuture drivers of corporate productivity
or instructors, collaborative e-learning makes it possible, though tracking clicks and seeing how learners are interacting with each other, to gain a deeper understanding of what makes a difference in professional development.
“It’s very much our strategy to use analytics to measure the impact of learning but also to guide us in terms of better approaches for developing our resources,” says Denis Brousseau, vice-president and global leader of organisation and people at IBM’s Global Business Services. “This is an evolving practice where we’re going beyond [tracking] the number of hours of training delivery to measuring how we’re effectively increasingly the level of skills within our practice centres.”
Working environments, inside and out Flexible working has long been talked about as a means of motivating employees by giving them a better work-life balance. The trend towards flexible and remote working accelerated in the run-up to the financial crisis as tight labour markets prompted companies to offer increasingly attractive remuneration and benefits packages to job candidates. However, this may be slowing, with only 13% of respondents saying they will be introducing this in the next 12 months.
And the spread of flexible working practices varies across different geographic regions. Asia is slower to adopt flex-time working, with 30% of respondents saying their organisation has not introduced this practice, while in North America only 24% have not done so. For those that have introduced flexible working, it emerges as an effective productivity-boosting measure, with 74% of those that deploying it saying it has had a positive impact (Figure 4).
Even so, remote and flexible working is not always a motivator of productivity. In the survey, 30% of respondents say their organisation has not introduced remote working, while 29% have yet to introduce flex-time working. This may be because, for some, distance from the office can have a negative effect on productivity, with individuals often feeling that if they work from home for part of the time, they may not be taken as seriously when it comes to promotion and rewards.
When Cisco Systems embarked on a teleworking project in Amsterdam, for example, it discovered that workers who had been moved to a remote location near the city to reduce commuting times had not been successful, in part because employees wanted to work in a highly social environment. Cisco then developed a hybrid option—Smart Work Centres in city suburbs connected to the central office via communications technology, but also where numerous executives can work in a shared space with facilities such as catering, banking facilities, lounge areas and crèches.
While the presence of collegial company might be a strong motivator of productivity, quality of workspace ranks low on the respondents’ list of human-capital initiatives. Some 33% say they have not focused on improvements in the working environment such as larger office space. Moreover, of those that have, only just over half say it has had a positive impact on productivity, putting it eighth on the list of 10 initiatives.
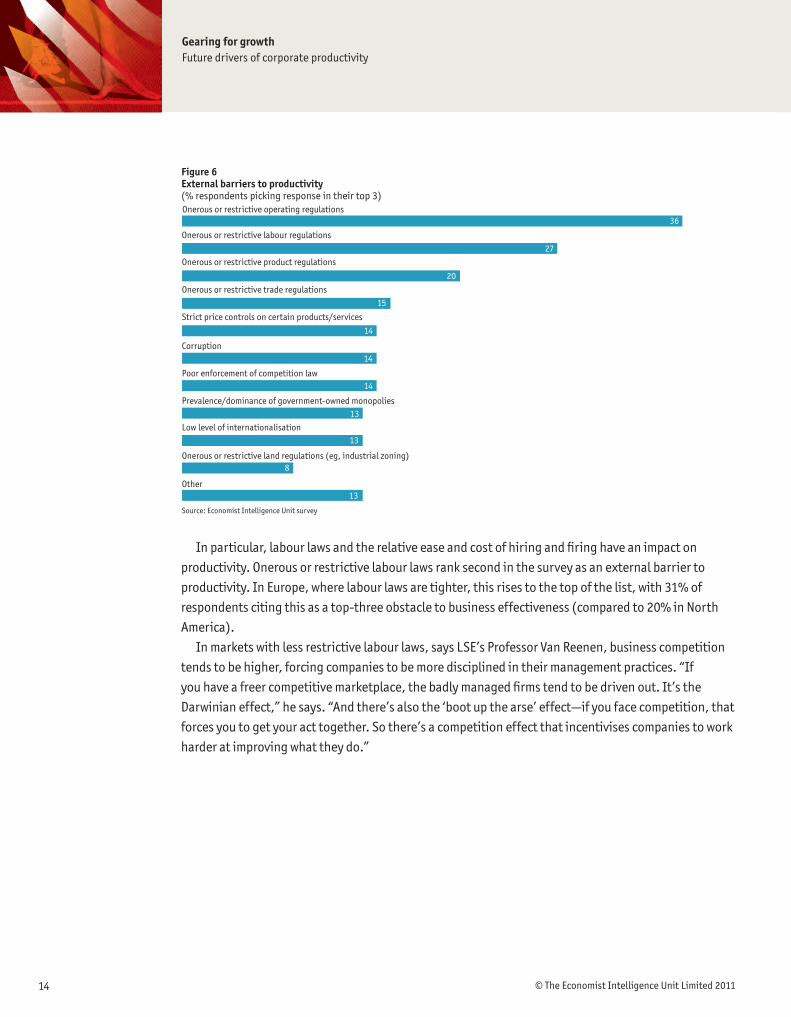
But if the internal working environment is seen as having less of an impact on productivity than other factors, the external forces shaping working environments do have an impact—notably the regulatory regime, with onerous operating restrictions most often cited as among the top three external barriers inhibiting productivity (Figure 6).
© The Economist Intelligence Unit Limited 201114
Gearing for growthFuture drivers of corporate productivity
In particular, labour laws and the relative ease and cost of hiring and firing have an impact on productivity. Onerous or restrictive labour laws rank second in the survey as an external barrier to productivity. In Europe, where labour laws are tighter, this rises to the top of the list, with 31% of respondents citing this as a top-three obstacle to business effectiveness (compared to 20% in North America).
In markets with less restrictive labour laws, says LSE’s Professor Van Reenen, business competition tends to be higher, forcing companies to be more disciplined in their management practices. “If you have a freer competitive marketplace, the badly managed firms tend to be driven out. It’s the Darwinian effect,” he says. “And there’s also the ‘boot up the arse’ effect—if you face competition, that forces you to get your act together. So there’s a competition effect that incentivises companies to work harder at improving what they do.”
Figure 6External barriers to productivity(% respondents picking response in their top 3)Onerous or restrictive operating regulations
Onerous or restrictive labour regulations
Onerous or restrictive product regulations
36
27
20
Onerous or restrictive trade regulations15
Strict price controls on certain products/services
14
Corruption14
Poor enforcement of competition law
Onerous or restrictive land regulations (eg, industrial zoning)
Low level of internationalisation
Prevalence/dominance of government-owned monopolies
Other
Source: Economist Intelligence Unit survey
14
13
13
8
13

© The Economist Intelligence Unit Limited 2011 15
Gearing for growthFuture drivers of corporate productivity
Green employee engagement: A missed opportunity?
As companies start to correlate carbon reduction with cost savings and community investment with the development of new products and markets, social and environmental sustainability is being seen by some as part of mainstream corporate strategy. However, such initiatives have an added business benefit—they provide powerful motivation for employees.
Starbucks, for example, has established a partnership through which employees can volunteer. In a joint venture with the Earthwatch Institute, an organisation that engages volunteers in scientific field research, the coffee company sends employees to farms from which the company sources its beans to work on projects such as mapping water resources and biodiversity indicators.
Accenture, a global consultancy, says that its global citizenship programme—Accenture Development Partnerships—is a powerful form of employee motivation. The programme allows employees to work on non-profit consulting projects in developing countries, fostering company loyalty and employee engagement, and boosting morale.
At HSBC, more than 100,000 employees have taken part in the
Climate Partnership, a programme run collaboratively with The Climate Group, the Earthwatch Institute, the Smithsonian Tropical Research Institute and WWF that combines charitable donations with employee volunteering. “In the area of sustainability and volunteering, we’ve found that employees who are involved in our community engagement programmes are more engaged across the board,” says Robert Sherman, vice-president of public affairs at HSBC North America.
“Engagement supports motivation,” he adds. “And greater motivation can lead to a number of competitive advantages such as improved customer satisfaction, increased productivity, and reduced employee turnover and absenteeism—all of which contribute to improved overall business performance.”
However, either these benefits are over-hyped or most of the respondents to the survey have yet to recognise them. Although three-quarters of respondent companies have introduced green practices, only 32% of this group says they have had a positive effect on productivity, while half say they have no impact and 17% say they have a negative impact.
Nonetheless, if the experiences of companies such as HSBC and Accenture are anything to go by, companies not tapping into this source of employee engagement could be missing an opportunity to raise engagement and morale—and ultimately productivity—without raising headcount.
© The Economist Intelligence Unit Limited 201116
Gearing for growthFuture drivers of corporate productivity
Technology and productivity
Since the industrial revolution, technology has been revolutionising productivity. However, while in the past, automation of industrial manufacturing functions brought big productivity wins, most of
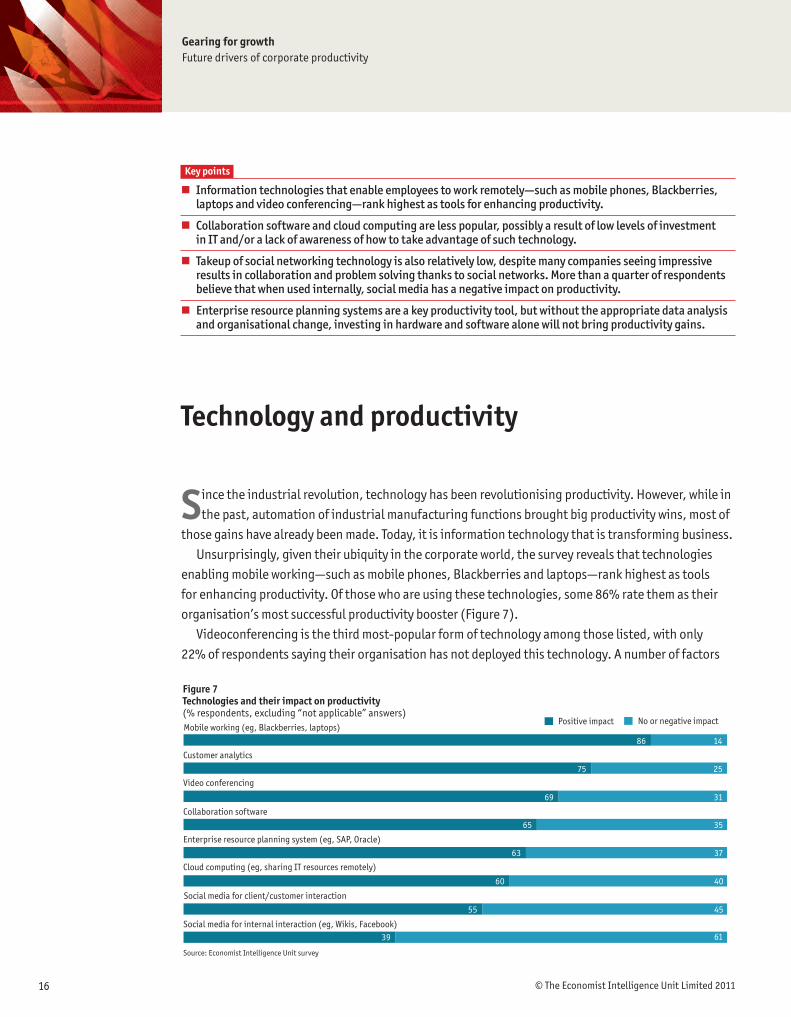
those gains have already been made. Today, it is information technology that is transforming business.Unsurprisingly, given their ubiquity in the corporate world, the survey reveals that technologies
enabling mobile working—such as mobile phones, Blackberries and laptops—rank highest as tools for enhancing productivity. Of those who are using these technologies, some 86% rate them as their organisation’s most successful productivity booster (Figure 7).
Videoconferencing is the third most-popular form of technology among those listed, with only 22% of respondents saying their organisation has not deployed this technology. A number of factors
Figure 7Technologies and their impact on productivity(% respondents, excluding “not applicable” answers)Mobile working (eg, Blackberries, laptops)
Positive impact No or negative impact
Video conferencing
Cloud computing (eg, sharing IT resources remotely)
Enterprise resource planning system (eg, SAP, Oracle)
1486
75 25
69 31
65 35
Social media for internal interaction (eg, Wikis, Facebook)
Social media for client/customer interaction
Customer analytics
Collaboration software
Source: Economist Intelligence Unit survey
63 37
60 40
55 45
39 61
Key points
n Information technologies that enable employees to work remotely—such as mobile phones, Blackberries, laptops and video conferencing—rank highest as tools for enhancing productivity.
n Collaboration software and cloud computing are less popular, possibly a result of low levels of investment in IT and/or a lack of awareness of how to take advantage of such technology.
n Takeup of social networking technology is also relatively low, despite many companies seeing impressive results in collaboration and problem solving thanks to social networks. More than a quarter of respondents believe that when used internally, social media has a negative impact on productivity.
n Enterprise resource planning systems are a key productivity tool, but without the appropriate data analysis and organisational change, investing in hardware and software alone will not bring productivity gains.

© The Economist Intelligence Unit Limited 2011 17
Gearing for growthFuture drivers of corporate productivity
are behind the rise of videoconferencing. First, the technology itself has improved radically since the days when users had to endure delayed delivery of images and poor sound quality. Today telepresence systems such as that of Cisco Systems allow for seamless conversation and the ability to see gestures and facial expressions clearly.
Younger, more tech-savvy employees entering the workforce are also more familiar with video, many using it for personal communications. Moreover, in an era where concerns to cut travel costs are mounting, videoconferencing offers a solution that also saves company time. BT, the telecoms company, which sells videoconferencing equipment, says that four employees travelling for an average of two hours to a weekly meeting would cost a company £18,600 (US$30,300) a year.
However, while some might take it for granted that video, mobile phones and laptops are becoming essential for any business, not all tools are being adopted with unquestioning enthusiasm. In particular, companies have not yet cottoned on to collaborative communications technologies. Some 41% of respondents have not deployed collaboration software, and social media remains unused by 46% of respondents as a means of communication with customers and by 43% for internal interactions.
And for all the talk about its promise, cloud computing (or sharing software and other IT resources remotely via the web) has a low uptake. While 60% of those who are using it say the technology has had a positive effect, almost half (49%) of respondents say their organisation has not deployed cloud computing, making it the least adopted technology in the survey—and potentially some of the lowest-hanging fruit for productivity gains still unpicked.
The failure of many companies to turn to these newer technologies for productivity gains is reflected in IT investment levels, where many organisations appear to be falling behind. Using outdated or slow-performing systems is the second most-commonly cited technology-related problem that most hampers productivity, picked by 36%, while 32% put this down to lack of awareness about the best technologies by the decision makers in their organisations (Figure 8). More companies in the manufacturing, construction and retail sectors (37%) are worried about senior management short-
Figure 8Biggest tech-related barriers to productivity improvements (% respondents picking response in their top 3)Not getting the most out of technology in which we have already invested (eg, under-utilisation of capacity)
Using outdated/slow technology/lack of investment in new technology
Lack of sufficient training in new technologies
49
36
35
Lack of awareness at decision-making levels about best technologies32
Employees’ inadequate technology skills27
Insufficient support from IT department24
Complexity of new technologies
Employee use of personal applications (eg, social media) and devices at work
Other
Source: Economist Intelligence Unit survey
21
18
2

© The Economist Intelligence Unit Limited 201118
Gearing for growthFuture drivers of corporate productivity
sightedness about the best technology, compared with 29% of those in the knowledge and services sector, where it ranks fifth as a concern.
Moreover, if some companies are not realising productivity gains from their IT investments, neither do they invest heavily in monitoring and measuring the impact of technology on their organisation’s business effectiveness. A large proportion (39%) say they estimate this but do not use hard metrics to do so, while 23% do not track this at all.
Unsurprisingly, given respondents’ answers on investing in technology and on measuring its impact, top of the list of technology-related barriers to productivity gains for companies is an inability to get the most out the technology in which they have already invested, with some 49% highlighting this problem—and a third citing insufficient training.
Technological bang for the buckWhile communications technologies such as mobile phones, Blackberries and videoconferencing are well-adopted productivity tools, technology can do far more for a business than simply allow employees, suppliers and customers to talk to one another. Enterprise resource planning (ERP) systems, which allow for the flow of management information across an organisation, and business analytics tools, which provide a view into past business performance that can inform planning, are helping companies gain new insights into their productivity.
Some of these systems are highly valued by the survey respondents. Some 66% are deploying ERP systems. In particular, usage is more widespread (76%) among those in the manufacturing, construction and retail sectors—where complex supply chains and logistics exist—than among of those in knowledge-based and services industries (61%). However, merely acquiring new technology
Figure 9Technologies being introduced in next 12 months that are expected to have the biggest impact on productivity(% respondents)Customer analytics
My company is currently not planning to introduce any new technology initiatives over the next 12 months
Source: Economist Intelligence Unit survey
Social media for client/customer interaction
23
23
21
Cloud computing (eg, sharing IT resources remotely)18
Video conferencing16
Social media for internal interaction (eg, Wikis, Facebook)15
Collaboration software
Enterprise resource planning system (eg, SAP, Oracle)
Mobile working (eg, Blackberries, laptops)
15
15
13
My company currently uses all of these technologies
6Other
4

© The Economist Intelligence Unit Limited 2011 19
Gearing for growthFuture drivers of corporate productivity
does not enhance productivity. “The key thing is not how much you spend but how you spend it,” says Professor Van Reenen. “To make good use of technology projects, you have to change the way you organise the firm and do business. It’s not enough to throw computers at the business.”
APQC’s Mr Webb agrees. “It’s not as simple as installing software,” he says. “You need to understand how you serve your customers, what they value most and how the processes work. Then you can enable technology to support that. If you automate a bad process, it’s the same bad process, simply handled by computers.”
One way companies are starting to improve understanding of their processes is through business analytics. “It’s a brand new industry that’s starting to expand,” says Mr Webb. “It’s about understanding your processes, how you deliver value to customers and what the essential pieces are for that to happen.”
The ability to analyse customer data is highly rated in the survey. Of those organisations using customer analysis technology, 75% say it is a powerful tool in raising business effectiveness. And the largest group of respondents say they are going to introduce this technology in the next 12 months (see Figure 9).
While data collection and data warehouses are nothing new, what is new is how companies are using the data. “You don’t beat your competitors by collecting data better than they do,” says Mr Webb. “You beat your competitors by analysing data and reallocating your resources [accordingly].”
Another factor in companies’ success in achieving productivity gains is whether or not they allocate IT assets (software and hardware, as well as the human-capital and business processes associated with that technology) in ways that support the organisation’s business strategy.
Sinan Aral, assistant professor of information, operations and management sciences at New York University’s Stern School of Business, who has studied IT asset allocation, says that IT portfolio management is a critical skill when it comes managing improvements in productivity. “The key is to allocate investment according to business strategy, whether that’s innovation or a cost-focused strategy.”
A cost-focused firm, he explains, might invest more in transactional systems that automate processes or increase the volume of business per unit cost. An innovation-focused organisation might allocate more IT dollars to strategic investment that repositions the company by supporting entry into a new market or the development of new business processes.
Professor Aral cites the example of 7-Eleven Japan, the franchise-based convenience store chain. Part of the company’s success, he says, has been the firm’s strategic use of IT. “They focused on information-driven decisions and created what they call a ‘total information system’ connecting all their 70,000 computers at stores, headquarters and supplier sites,” he explains.
Having digitised all transactions, the data pushed out to franchisees is extremely current and can be analysed in a sophisticated way, supporting a decentralised franchise model in which each store manager controls what items to order. In addition, weather-tracking technology inside stores helped managers, for example, order more cold food on hot days. “By making these highly informed data-based decisions made possible by the IT investment, this enabled them to turn over inventory more quickly,” says Professor Aral.

© The Economist Intelligence Unit Limited 201120
Gearing for growthFuture drivers of corporate productivity
Harnessing the social dimensionIn explaining the productivity improvements to be gained by strategic deployment of technology, experts stress the human element and the need to invest not only in systems and software to maximise the gains from that technology, but also in skills and management techniques.
Companies have recognised this, ranking third a lack of sufficient training as the biggest obstacle to making productivity gains from technology. And effective management of human capital (which 48% say is crucial to improving productivity) ranks far higher than using the best technology available (which only 26% say is crucial).
Nowhere does the human dimension relate more closely to information technology than in the evolving area of internal social networking. However, while 39% of those respondents who have implemented this technology give it high marks for enhancing productivity, 27% believe it has had a negative impact—evidently reflecting concern over the latitude such technologies gives employees to spend time on non-business communication.
Executives are rather more positive about using social media for client interaction: 54% of those using this say it has improved business effectiveness, and only a small minority raise concerns over it. Nevertheless, this technology remains unused by many: 46% are not yet deploying this technology for client use, and 43% for internal use.
Looking forward, though, social media is seen in a more positive light, particularly when it comes to communicating with clients, with 21% saying their organisation will be introducing this technology in the next 12 months (most commonly among respondents in North America). This may reflect awareness of the impressive productivity results being achieved by a number of companies that are already deploying internal social networking, particularly as a means of speeding up problem-solving and research and development by connecting experts throughout an enterprise.
These include IBM with its Beehive system—which helps employees make connections across the enterprise that assist them with projects and professional development—and Cemex, a Mexican cement producer, with its Shift platform, which allows employees to share information and experience through tools such as wikis, blogs and discussion boards (see case study below).
“Twenty years ago, if an oil worker had an issue on an oil platform in the North Atlantic, they’d find the expert and throw him on an airplane,” says APQC’s Mr Webb. “Now companies are finding new ways to link up with that expert and find the solution.”
In studying internal social networks, Professor Aral of NYU’s Stern School of Business found that workers who were open to social networking across their organisation and could tap into many different sources of information were substantially more economically productive than those who connected with others only within their department or business unit. “The social network of a firm is the infrastructure through which the information flows between employees while they’re trying to solve problems,” says Professor Aral. “And now a lot of these are electronically enabled.”
Because it makes it possible to track employees’ collaborative interactions online, internal social technology can also be used to track their contributions to business effectiveness and innovation. This is something IBM is working to understand. “Right now, people only track hours or the volume of
© The Economist Intelligence Unit Limited 2011 21
Gearing for growthFuture drivers of corporate productivity
contribution, such as how many blogs they’ve posted,” explains IBM’s Ms Okimoto. “But we’re doing a lot of work to understand impact and return on contribution. Sometimes that’s an immediate return, but sometimes someone can contribute to something and six months later someone will pick that up and it will enhance performance in a completely different part of the organisation.”
Professor Aral sees this kind of thing as just the start of a big change in how internal networks affect business effectiveness. “The next phase is how to design and use information systems to make this process more effective,” he says. “We’re on the cusp of really new ways of harnessing digital information and managing it better to improve productivity.”
case study Cemex connects the workforce
Cemex recognises the core challenge for a Mexican cement maker that has expanded rapidly across the globe through acquisitions: meshing an international network of organisations with different cultures and different areas of expertise. However, the company, which adopted e-mail as a mode of internal communication in the early 1990s, long before many other companies, is not afraid of using new technologies to enhance collaboration and raise productivity.
In 2010, Cemex turned to the latest form of collective communication—social networking technology. Its collaboration platform, named Shift, is designed to address a global workforce that is also mobile and facing increasingly complex industrial challenges—from deploying more environmentally sustainable production methods to developing ready-mix products.
The idea behind Shift—which uses tools similar to public sites such as Facebook, Twitter and Wikipedia—is to bring together employees with similar challenges and objectives, wherever they are located geographically across the company, so that they can identify sources of knowledge and share expertise with an immediacy that was previously difficult to achieve.
In doing so, Cemex is radically altering the way it gets its employees to collaborate. Employees now collaborate where and when they need to, using the power of a global network to find immediate solutions to business problems. “The social element is important,” says Gilberto Garcia, director of innovation at
Cemex. “Rather than introducing knowledge management in a very structured way, the social element removes the barrier to collaboration. It’s now a network that promotes social learning, and it’s a real change in the way we collaborate.”
Social networking technology has also provided a solution to knowledge management across an increasingly globally dispersed manufacturing enterprise. “The challenge has been radically changing from being a series of isolated locations to becoming a fully integrated company,” says Mr Garcia. “In the past, employees wanted to collaborate—there was just not a practical way to do it.”
As employees have discovered the benefits and ease of sharing knowledge across the network, Shift’s adoption rates have risen sharply, from about 1,000 unique visitors in the first month to more than 10,000 by June, a compounded monthly growth rate of nearly 80%. However, perhaps the most gratifying area of growth for the company has been in productivity. When solving technical problems employees receive instant, visually rich solutions from colleagues around the world. “In the past, when you raised a question about something technical, maybe in a week or month you might have received an answer,” says Mr Garcia. “Now you get dozens of answers in minutes.”
And the time taken to launch new products has come down from years to months. In its ready-mix line, for example, the global collaboration Shift facilitates made possible the launch of a new concrete product called Promptis in a record-breaking four months.

© The Economist Intelligence Unit Limited 201122
Gearing for growthFuture drivers of corporate productivity
Corporate strategy and productivity
When companies look at maximising productivity, they are not only looking at human resources or information technology. Strategic decisions also need to be made. These might be whether
to introduce new products and services or enter new markets, whether to invest heavily in machinery, equipment and buildings or rather to outsource some functions to lighten the asset load, or whether to collaborate with a strategic partner with complementary know-how or acquire a competitor. Each of these strategic decisions has implications for productivity.
Figure 10Stratgic initiatives and their impact on productivity(% respondents, excluding “not applicable” answers)
Outsourcing non-core business practices
Positive impact No or negative impact
Selling a non-core part of the business
Selling fixed assets (property, plant or equipment)
Acquiring a competitor
2080
75 25
75 25
74 26
Acquiring a strategic partner with complementary know-how/ technology
Cost-cutting/labour force consolidation
Entering a new market
Introducing new products/services
Collaborating with a strategic partner
Investing in operational R&D
Source: Economist Intelligence Unit survey
74 26
71 29
64 36
64 36
62 38
52 48
Key points
n In addition to the management of human resources and IT, strategic decisions about product or serviceinnovation,capitalinvestments,andmergersandacquisitionscanhaveasignificantimpactonproductivity.
n Companies have seen success with outsourcing, joint ventures, and even M&A, although the latter must be handled with care to ensure that the integration of companies is managed in such a way to preserve employee morale.
n Respondentsexpressconcernthattoomuchattentionispaidtoreducingcostsandnotenoughtomaximisingtheuseofexistingresources.

© The Economist Intelligence Unit Limited 2011 23
Gearing for growthFuture drivers of corporate productivity
Outsourcing remains popular, with 65% of companies in the survey having handed over non-core business practices to third-party suppliers in the past year. However, North American companies are far less likely to have done so, with 47% saying their organisations have not undertaken outsourcing, compared to 28% in Asia Pacific and 31% in Europe. Overall, a large majority of those who have outsourced non-core business practices (71%) say this has enhanced business effectiveness (Figure 10).
Rather less common is the direct offloading of either non-core parts of the business, or selling off fixed assets. For those that have followed such strategies, though, the results are generally positive, with 52% of respondents whose firm had sold fixed assets saying there has been a positive productivity impact. (Only 17% of respondents complain that their company owning too many unproductive fixed assets is a major strategic barrier to productivity gains, however; the least-commonly cited problem).
Udo Jung, a Frankfurt-based senior partner, managing director and expert on asset productivity at The Boston Consulting Group, says companies need to focus on the type of assets they are holding to asses whether or not to offload them. “The more competitive advantage you have in a business and the more unique your technology, the more you should invest and have those assets on your own balance sheet,” says Mr Jung, who is also European leader of BCG’s operations practice. “But if your technology is standard, then you should keep an eye on fixed-cost intensity and you may be better off pursuing the ‘asset-light’ model by outsourcing or leasing.”
Another model, for companies whose assets have become standard or commoditised and no longer give the organisation competitive edge, is the joint venture. Those that have undertaken it see this as a positive strategy, with 74% saying collaborating with a strategic partner has had productivity benefits and just 23% of respondents concerned that their company is not sufficiently open to collaborating on strategic projects.
Top among respondents’ strategy concerns is that their company is paying too much attention to reducing costs and not enough to maximising use of existing resources (Figure 11). This concern is
Figure 11Strategic problems for productivity(% respondents picking response in their top 3)The strategic focus is too much on reducing costs and not enough on maximising the efficient use of existing resources
The strategic focus is too much on top-line growth and not enough on maximising the efficient use of existing resources
My company is not open enough to collaborate with partners on strategic projects
36
30
23
My company is not specialised enough and wastes too much on non-core products/services that it would be more productive to outsource20
My company is focused on markets that do not offer the best potential return on investment20
My company is too small to enjoy economies of scale19
My company is too specialised and lacks competence in crucial areas that it would be more productive to do ourselves
My company owns too many unproductive fixed assets
Other
18
17
8
Source: Economist Intelligence Unit survey

© The Economist Intelligence Unit Limited 201124
Gearing for growthFuture drivers of corporate productivity
even higher, at 40%, for European respondents. The second highest concern is that corporate strategy is focused too heavily on top-line growth rather than maximising use of existing resources.
Both strategies holds risks for companies, says Mr Jung, once their product has become commoditised. “Once a technology is available around the corner, there are crucial decisions to be made,” he says. “Some companies invest more to have a larger scale and push costs down. But then they incur huge utilisation risk. It might save them money in the next year but ultimately they might have created substantial exit hurdles.”
But if being stuck with unproductive equipment and facilities is a risk, so is the inability to recognise the link between hard assets and the softer assets—people. “Companies sometimes treat so-called soft assets as in a very difference universe from hard assets and this is nonsense and dangerous,” says Mr Jung. “Both things obviously go together—it’s the employees that operate the assets.”
He advises applying measurement and accounting metrics to human capital. “Companies need to make the very important drivers of engagement and motivation more quantifiable,” he says. In other words, productivity measurement should not be limited to hard assets—it applies to people, too. And on this, with human-capital management at the top of their list of productivity measures, the survey respondents would concur.
M&A: The productivity killer?When looking to cut costs and do more with less, companies may opt for merging with another enterprise or taking over a rival. Some 74% of respondents who said they had acquired a strategic partner with complementary know-how or technology in the past year reported positive results, while 64% who said they had acquired a competitor said they had seen productivity gains as a result.
However, when it comes to another commonly cited reason for a merger or takeover—acquisition of an innovative new workforce or research and development capabilities—results can be less positive. And all too often, if the integration is not handled efficiently, intellectual capital is in fact lost and productivity takes a dive. In the absence of successful integration strategies, business performance suffers and companies may fail to achieve the rise in productivity that was often the reason for the merger or acquisition in the first place.
Adding to the distractions that can hamper performance is a change in working practices, particularly in cross-border deals where staff from two different countries find themselves on the same teams. “Purchasing innovation can work, but it’s hard to mesh two cultures,” says APQC’s Mr Webb.
Moreover, the anxiety felt by employees during a merger or acquisition can lead to a loss of focus as workers, uncertain about their future, become unable or unwilling to focus on the strategy of the new enterprise, thus leading to a fall in business performance.
In acquired companies where research and development is a key strategy, this capability may suffer as anyone who suspects that they might be laid off in the integration process is tempted to shelve their most innovative projects in case they need them as carrots to offer future potential employers. Others may have to abandon a favoured research project or product development since it does not fit the strategy of the merged enterprise.
Meanwhile, for those that remain in the new enterprise, the departure of colleagues can be

© The Economist Intelligence Unit Limited 2011 25
Gearing for growthFuture drivers of corporate productivity
distracting, and “survivor syndrome” may leave them feeling either jealous of those who have been handsomely paid off to leave or guilty that they kept a job while others lost theirs.
While experts stress the importance of managers in bolstering communication and employee engagement during a merger, some suggest companies are not doing enough to harness the capabilities of managers during the integration phase of a merger or takeover.
A study of more than 700 managers by Towers Watson, a human resources professional services firm, found that during an integration process, only 17% of respondents were part of an integration team and only 25% said that they had a formal communication role with their teams. Moreover, three-quarters of those polled said that employee engagement was not measured during the integration process.
And while evidence from the survey suggests productivity results from mergers and acquisitions are generally more positive than negative, the majority of firms polled have not in fact acquired a competitor or, albeit to a lesser extent, a strategic partner, indicating that the most executives do not see this as a strategic tool in raising productivity.
© The Economist Intelligence Unit Limited 201126
Gearing for growthFuture drivers of corporate productivity
Conclusion
If boosting productivity is a universal goal for companies—particularly in tough economic times—the ways they approach this task vary. Many levers are available to companies when it
comes to enhancing business effectiveness, from increasing technology investments to performance-management techniques. However, this survey shows that while companies are deploying some of these levers, they may also be missing key opportunities.
Human-capital management remains the primary productivity mechanism for the overwhelming majority of companies represented in this survey, while new products and services are also seen as major drivers of productivity. Yet some are failing to make the connection between hard assets and soft assets: technology investments and the human-capital necessary to make the most of those investments.
New levers for employee engagement are emerging, particularly as companies move forward on the environmental agenda—something to which employees are keen to contribute. Yet while a number of firms report that green initiatives have had a powerful effect on employee engagement, companies in the survey remain sceptical about the benefits of this or have simply not used this as a method of motivating staff.
An even bigger opportunity yet to be capitalised on is the productivity promise of internal social networking. Leading companies are finding new ways of using web-based informal networks to connect people across their businesses globally and to make striking productivity gains by creating virtual networks of experts across their firms. However, few of those surveyed here have yet taken up this powerful new form of internal collaboration as a means of enhancing productivity, and many executives remain doubtful of its benefits.
These companies could be missing an opportunity. The working world is becoming more fluid and flexible. Companies in this survey are already embracing tools such as mobile working technologies and flex-time working. However, they need to go further. New technologies promise to enable the
Key points
n While companies are pursing varied approaches to enhance business effectiveness, from increasing technology investments to performance-management techniques, they may also be missing key opportunities,forexamplesocialnetworking,whichhasdeliveredstrikingproductivitygainstoanumberof leading global companies.
n Such technologies hold the promise of creating new, agile enterprise models, driven less by hierarchy and more by instant collaboration between global networks of employees, bringing substantial gains in productivity.
n Aslongasworkforcesgrowmoreslowlythanprofits,managerswillneedtogetmorefromtheemployeesthey have. They will be relying on their human capital more than ever and will need to new ways of engaging their staff and taking advantage of technology to succeed.

© The Economist Intelligence Unit Limited 2011 27
Gearing for growthFuture drivers of corporate productivity
development of an entirely new kind of enterprise: one driven less by hierarchy and more by instant collaboration and globally connected networks of employees.
In this world, the need for innovative forms of performance management will intensify, as companies find they can no longer measure the productivity impact of their employees through the traditional annual performance review alone. Again, technology will be the driver here, with the ability to analyse the pattern of clicks on an internal wiki, for example, or via a Facebook-type application that provides a new seam of data relating to employees’ contributions in different areas.
As happens after many recessions, growth in headcount is materialising more slowly than the return to healthy profit margins. This means managers still need to get more from existing people and technologies, even as the good times return. Meanwhile, as the corporate world becomes more globalised and more interconnected—and productivity gains rely ever more heavily on people—companies will need to look to radical new ways of both engaging them and connecting them with each other.

© The Economist Intelligence Unit Limited 201128
Gearing for growthFuture drivers of corporate productivity
Appendix 1: Productivity—the macroeconomic view
A country’s ability to raise living standards over time depends almost entirely on its ability to raise productivity. Or as Paul Krugman, the Nobel prize-winning economist, put it, “productivity isn’t
everything, but in the long-run it is almost everything.” Productivity growth is typically fastest in lower-income countries, which have the greatest catch-
up potential. Productivity growth is also very cyclical. It tends to climb (though not always) during economic booms, and can fall during a recession. Not only is productivity growth the main driver of living standards within a country, it can also strongly influence a number of other economic variables. It is the major determinant of a country’s competitiveness—over the long run, a country with strong productivity growth can expect to increase its share of world export markets. Productivity also has an impact on inflation—a country experiencing strong productivity growth should expect to be able to grow at a faster rate before feeling inflationary pressures.
Over the past decade, the performance of different economies can be largely explained by achievements in raising productivity. This appendix compares growth and productivity in key emerging economies (Brazil, Russia, India and China, the so-called BRIC grouping), and developed economies (Germany, Japan, Singapore, the UK and the US). In 2001-10 China was comfortably the fastest-growing economy of those in this study, enjoying annual average increases in GDP per head (measured in PPP terms) of 12.5%. China also experienced the fastest level of productivity growth of all the major economies. But China still lags way behind the world’s most developed economies in terms of overall
Source: Economist Intelligence Unit
0
3
6
9
12
15
UKUSJapanGermanySingaporeRussiaBrazilIndiaChina
Productivity comparedCAGR (%)—GDP per head (US$ ppp)
CAGR 2006-10CAGR 2001-05

© The Economist Intelligence Unit Limited 2011 29
Gearing for growthFuture drivers of corporate productivity
productivity levels, suggesting that productivity growth in the country will continue to outstrip that of the developed world.
• China. China’s economic performance over the past decade has been phenomenal. In 2001-10 annual labour productivity growth in China averaged 9.5%. This compares with growth of 5.3% in India and 1.5% in the US. Two main factors are behind China’s impressive productivity record. The first is the massive relocation of people from the countryside to booming coastal cities, where they have found more productive jobs in foreign-invested factories. The second factor is the strong rate of investment growth that China has been able to sustain over the decade. This has helped to lift the country’s capital stock, increasing, say, the number of machines and computers available to each Chinese worker, thus boosting their productivity.
• India. After China, India has achieved the fastest productivity growth. However, while China saw strong productivity growth throughout the period, productivity in India only started to grow rapidly in the second half of the decade. Indian total factor productivity growth (the portion of output that is not directly explained by the inputs used) averaged only 2.8% per annum in 2001-05, before picking up to 3.8% per annum in 2006-10. Figures for labour productivity show a similar picture, with annual growth accelerating from an average of 4.5% in 2001-05 to 6.2% in 2006-10. The main reason for this has been the big increase in investment growth in 2006-10, which has helped lift the country’s overall maximum potential rate of growth to just over 9% in 2010.
Labour productivity growth(%)
-9
-6
-3
0
3
6
9
12
15
1009080706050403022001
Source: Economist Intelligence Unit
Brazil Germany IndiaSingapore UKRussia
JapanUS
China
Growth of real capital stock(%)
-3
0
3
6
9
12
15
1009080706050403022001
Brazil Germany IndiaSingapore UKRussia
JapanUS
China
Total factor productivity growth(%)
-6
-4
-2
02
4
6
8
10
12
1009080706050403022001
Brazil Germany IndiaSingapore UKRussia
JapanUS
China
Growth of real potential output(%)
-6
-3
0
3
6
9
12
15
1009080706050403022001
Brazil Germany IndiaSingapore UKRussia
JapanUS
China

© The Economist Intelligence Unit Limited 201130
Gearing for growthFuture drivers of corporate productivity
• Brazil. Brazil has not managed to boost productivity as quickly as the other BRIC economies. Although Brazil’s performance improved in 2006-10, total factor productivity grew by an average of just 0.5% per annum in 2001-10, ahead of only the UK, Japan and Germany. Figures for labour productivity paint a similar picture, with Brazil averaging growth of just 0.5% per annum in 2001-10, putting it in last place. The main reason for Brazil’s poor performance is a low investment rate in the early part of the period, based in part on high interest rates (prevalent throughout the period), but also on the country’s weak fiscal position, which has curtailed the government’s ability to boost investment through increased spending on infrastructure.
• Russia. Over the past decade Russia has recorded strong productivity growth, though below that achieved in both India and China. Labour productivity growth in Russia grew by an average of 3.9% per annum in 2001-10, while total factor productivity grew by an average of 2.4% per annum. Two factors are responsible for this performance. The first is the country’s oil and gas-led economic boom, which has attracted domestic and foreign investment into the resource sector. The second factor is the country’s recovery following the collapse of the former Soviet Union. The collapse was followed by a period of sharp economic decline for Russia, which saw investment plummet. As confidence and political stability returned to the country, businesses started to invest to improve Russia’s neglected industrial base.
• Singapore. Despite having one of the highest levels of income per head in the world, Singapore has managed to achieve impressive levels of productivity growth over the past decade. Total factor productivity growth averaged 2.1% per annum in 2001-10, significantly higher than the 0.3% average achieved by the four developed countries studied. Its performance in terms of boosting labour productivity was not quite as impressive. However, Singapore still managed to comfortably outperform the other developed countries in the study. Two main factors account for Singapore’s stellar performance: a high rate of private investment growth and an active government, which has been prepared to invest heavily in infrastructure and education in order to support growth.
• Developed countries. Overall, the productivity performance of the four developed countries in the study was slower than that of the BRIC economies, with the exception of Brazil. On a per head basis the BRIC economies are comparatively poor and underdeveloped. As a result, they all benefit from huge catch-up potential compared with the rich world. To enjoy strong productivity growth, they needed, in theory, only to import the latest technology from abroad.
By contrast, in the US or the rest of the developed world, productivity growth could be achieved only by inventing new technologies. Of the four developed countries in the study, the US had the best productivity performance. Total factor productivity growth in the US in 2001-10 averaged 1.2% per annum, compared with 0.3% in Germany, 0.1% in Japan and -0.2% in the UK. The US also experienced the fastest growth in terms of labour productivity, enjoying annual average growth of 1.5%, compared with 1.1% in Japan, 0.9% in the UK and 0.6% in Germany.
One reason why the US has been more successful in boosting productivity is the impact of the IT revolution—the widespread adoption of computers and the Internet helped to lift the country’s productivity for a number of years in the early part of the decade. Another reason behind the US’s

© The Economist Intelligence Unit Limited 2011 31
Gearing for growthFuture drivers of corporate productivity
better performance is its strong productivity performance during the 2008-09 recession. Whereas in most other countries productivity growth turned negative or fell sharply in 2009, productivity levels actually increased sharply in the US. The main reason for this is that the American labour markets are more flexible. During the downturn, companies in the US laid off workers faster than output fell, thus raising the productivity of the remaining workers. Companies in some European countries, by contrast, were inclined to hoard labour during the downturn (thus allowing their productivity levels to fall). In Germany, for instance, the government actually subsidised companies to keep workers, despite the fact that many of these workers were idle for large periods of 2009.
Productivity growth in Japan was hit especially hard during the downturn. In large part this is a reflection of the severity of Japan’s recession, and the damage that was done to the country’s manufacturing sector. One reason why labour productivity growth in the UK was so disappointing throughout this period is the UK’s lack of investment in education and training. Germany’s productivity growth was constrained by a conscious decision to put emphasis on boosting employment over the past decade, which often meant bringing lower-skilled workers (previously unemployed) into the work force, even if this ultimately lowered overall productivity growth.
Source: UNDP Human Development Reports, The Gender Inequality Index (GII)
0
20
40
60
80
100
IndiaBrazilChinaSingaporeUKJapanRussiaGermanyUS
Population with at least secondary education(% ages 25 and older) 2010
MaleFemale
Education and gender inequalityOne of the best ways for a country to boost productivity levels is by spending more on education. Education levels and levels of gender inequality vary considerably for the nine countries included in the study. The US performs best in terms of overall educational performance, with 95.3% of females and 94.5% of males aged over 25 obtaining at least a secondary education. Overall, there is a strong correlation between wealth and educational attainment, with the three poorest countries in the study (China, India and Brazil) also performing the worst in terms of educational performance (see chart above).
One reason for this poor performance is systematic discrimination against women in terms of access to education. The situation is most severe in India, where roughly double the number of men over the age of 25 have received a secondary education compared with women. The reasons for the high degree of discrimination against women are mostly cultural. Although the situation is changing slowly, many traditional communities in China and India do not value women as much as men, and hence invest less,

32 © The Economist Intelligence Unit Limited 2011
Gearing for growthFuture drivers of corporate productivity
if at all, in their education. This is related to the fact that in many of these places, a woman’s primary role is often perceived to be as a mother and homemaker for her husband’s family, not as a contributor to her own family. Hence parents have little incentive to invest in their daughters’ education.
Spending on ITAs well as increased spending on education, countries can boost their productivity levels by spending more on IT. Not surprisingly, spending on IT is generally higher in more developed countries—US$1,700 per head in the US in 2010, compared with just US$20 for every Indian, and US$187 for every Brazilian. Of the four developed countries in the study, spending on IT grew much quicker in the first half of the period in both the UK and Germany (6.9% and 6.3% respectively). In Japan and the US, by contrast, spending accelerated sharply from an average of around 1% a year in 2001-05, to 4.9% in Japan and 2.4% in the US in 2006-10. One reason why IT spending grew so much slower in the first half of the last decade is the dot-com bubble and subsequent crash. Before the crash many companies spent heavily on new IT equipment, which did not then need replacing for several years.
Despite lagging well behind the developed countries in terms of overall IT spending, growth in spending has been much higher in the developing world. Spending on IT actually grew fastest in Russia (average of 14.1% per annum in 2001-10), followed by China (where growth was 12.5%), and India (12.1%). Faster growth in IT spending in the developing world largely reflects the extra catch-up potential of these markets: for instance, for every 1,000 people, there are more than 93 personal computers in the US, but fewer than 6 in India. However, as with other fast-growing economies, rapid income growth and an expanding middle class are likely to see India’s ratio rise rapidly over the next few years.
Source: Economist Intelligence Unit
-5
0
5
10
15
20
25
UKGermanyUSRussiaJapanSingaporeIndiaBrazilChina
IT spending per million populationCAGR (%)—(US$m)
CAGR 2006-10CAGR 2001-05

33© The Economist Intelligence Unit Limited 2011
AppendixSurvey results
Gearing for growthFuture drivers of corporate productivity
Appendix 2: Survey results
1. In your opinion, what is the primary means of improving productivity? Please rate each issue below on a scale of 1 to 5, where 1=crucial and 5=irrelevant. (% respondents)
Reducing operational costs per sale/per unit of outputCrucial 1 2 3 4
Managing human capital more effectively
Making the right top-level strategic choices
Using the best available technology
243631 6 2
3748 1312
141 61636
244326 17
Removing regulatory restrictions in the market38217 1024
Irrelevant 5
2. Over the next 12 months, how likely are the following improvements in productivity (that is, not as a result of greater investment/hours worked, etc) in your company? (% respondents)
Greater output per unit of input (increased sales/deeper penetration of markets)
Likely Not likely Don’t know
More and/or improved product/service features
Reduced costs per sale/unit of output
No productivity improvements
72667
2767 6
52 840
107416
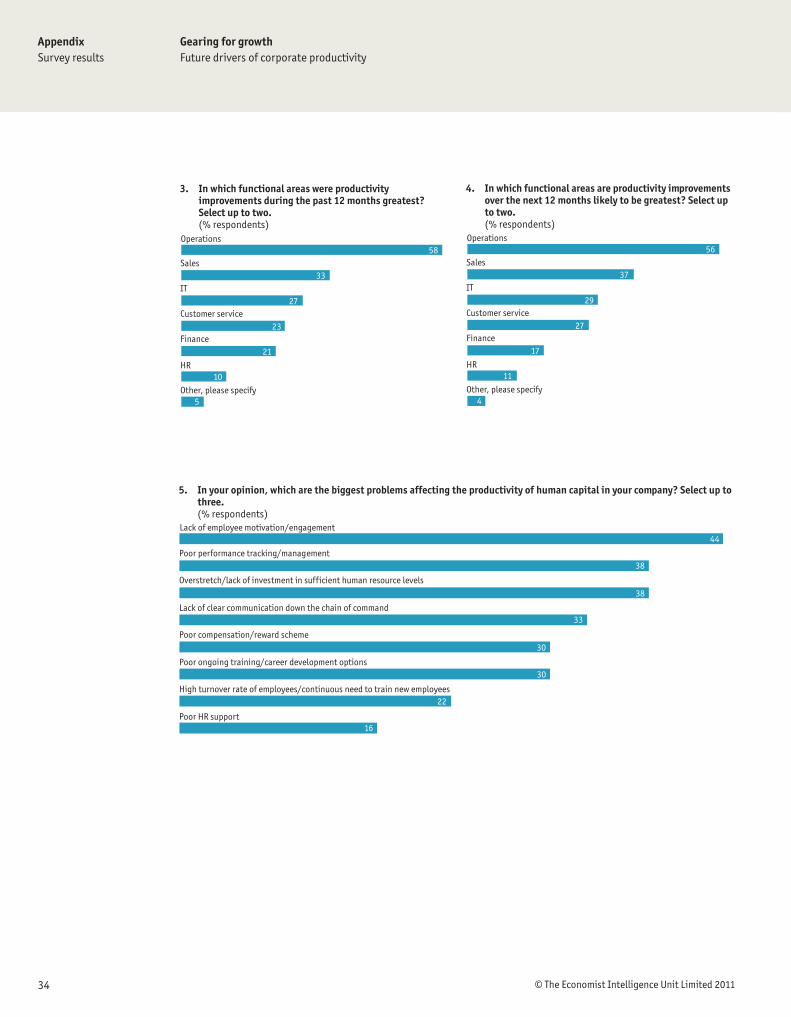
34 © The Economist Intelligence Unit Limited 2011
AppendixSurvey results
Gearing for growthFuture drivers of corporate productivity
3. In which functional areas were productivity improvements during the past 12 months greatest? Select up to two. (% respondents)Operations
Sales
IT
58
33
27Customer service
23Finance
21
HR10
Other, please specify5
4. In which functional areas are productivity improvements over the next 12 months likely to be greatest? Select up to two. (% respondents)Operations
Sales
IT
56
37
29Customer service
27Finance
17
HR11
Other, please specify4
5. In your opinion, which are the biggest problems affecting the productivity of human capital in your company? Select up to three. (% respondents)Lack of employee motivation/engagement
Poor performance tracking/management
Overstretch/lack of investment in sufficient human resource levels
44
38
38
Lack of clear communication down the chain of command33
Poor compensation/reward scheme30
Poor ongoing training/career development options30
High turnover rate of employees/continuous need to train new employees
Poor HR support
22
16

35© The Economist Intelligence Unit Limited 2011
AppendixSurvey results
Gearing for growthFuture drivers of corporate productivity
6. For each of the following human-capital management initiatives that your company has already introduced, please estimate the impact it has had on employee productivity. Rate on a scale of 1 to 5. (% respondents)
Flex-time workingPositive impact 1 2 No impact 3 4
Broadening age/gender diversity of workforce
Functional training courses
Management training courses
122924 3 3 29
2614 204 234
18 15131449
23 33618 191
Increasing basic compensation/pay4262814 261
Linking compensation/pay to performance163723 193 2
Rewarding process innovation173415 331 0
Improving working environment (eg, bigger office space)
Introducing green practices (eg, recycling)
Remote working (eg, teleworking)
262610 33
25
30
4
5
9
5
37
15
18
28
6
17
3 1
Negative impact 5 Not yet introduced
Flex-time working
Excluding “not yet introduced”Positive impact 1 2 No impact 3 4
Broadening age/gender diversity of workforce
Functional training courses
Management training courses
4034 17 5 5
3317 2542
21 131758
284522 14
Increasing basic compensation/pay6363819 1
Linking compensation/pay to performance204628 24
Rewarding process innovation255022 2
Improving working environment (eg, bigger office space)
Introducing green practices (eg, recycling)
Remote working (eg, teleworking)
393915 2
5
7
12
722
5024
40
8
24
4
Negative impact 5
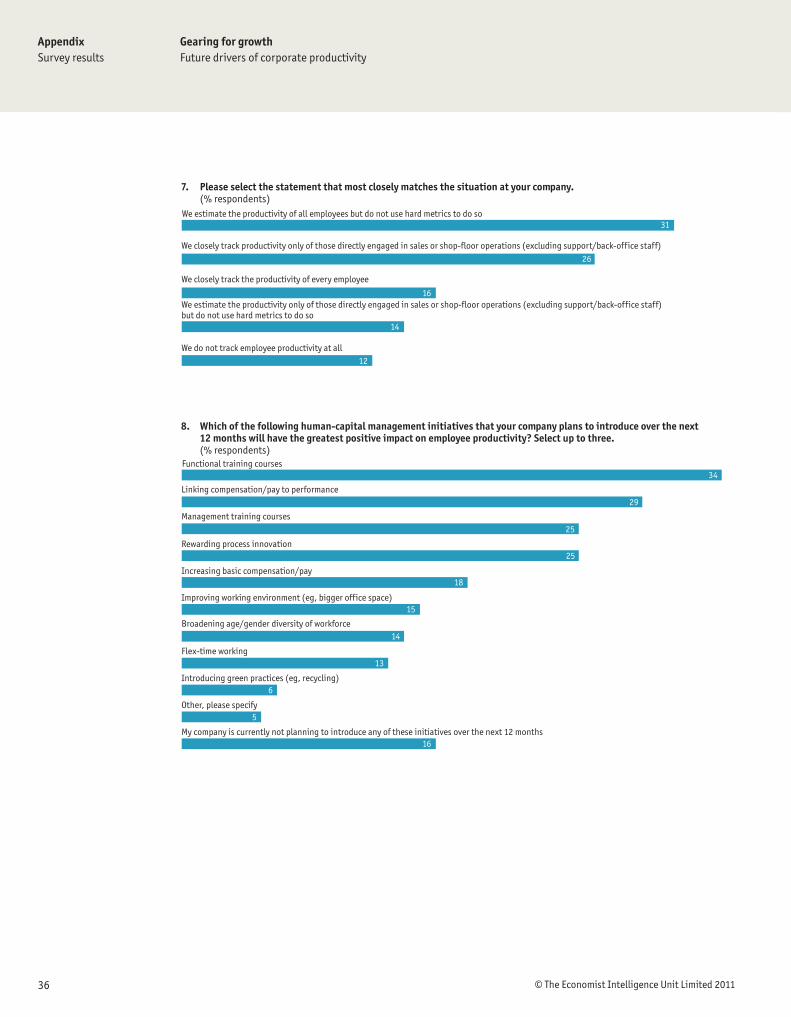
36 © The Economist Intelligence Unit Limited 2011
AppendixSurvey results
Gearing for growthFuture drivers of corporate productivity
7. Please select the statement that most closely matches the situation at your company. (% respondents)We estimate the productivity of all employees but do not use hard metrics to do so
We closely track productivity only of those directly engaged in sales or shop-floor operations (excluding support/back-office staff)
We closely track the productivity of every employee
31
26
16We estimate the productivity only of those directly engaged in sales or shop-floor operations (excluding support/back-office staff) but do not use hard metrics to do so
14
We do not track employee productivity at all12
8. Which of the following human-capital management initiatives that your company plans to introduce over the next 12 months will have the greatest positive impact on employee productivity? Select up to three. (% respondents)Functional training courses
Linking compensation/pay to performance
Management training courses
34
29
25
Rewarding process innovation25
Increasing basic compensation/pay18
Improving working environment (eg, bigger office space)15
Broadening age/gender diversity of workforce
Flex-time working
Introducing green practices (eg, recycling)
Other, please specify
My company is currently not planning to introduce any of these initiatives over the next 12 months
14
13
6
5
16

37© The Economist Intelligence Unit Limited 2011
AppendixSurvey results
Gearing for growthFuture drivers of corporate productivity
9. In your opinion, which are the biggest technology-related problems affecting the productivity of employees in your company? Select up to three. (% respondents)Not getting the most out of technology in which we have already invested (eg, under-utilisation of capacity)
Using outdated/slow technology/lack of investment in new technology
Lack of sufficient training in new technologies
49
36
35
Lack of awareness at decision-making levels about best technologies32
Employees’ inadequate technology skills27
Insufficient support from IT department24
Complexity of new technologies
Employee use of personal applications (eg, social media) and devices at work
Other, please specify
21
18
2
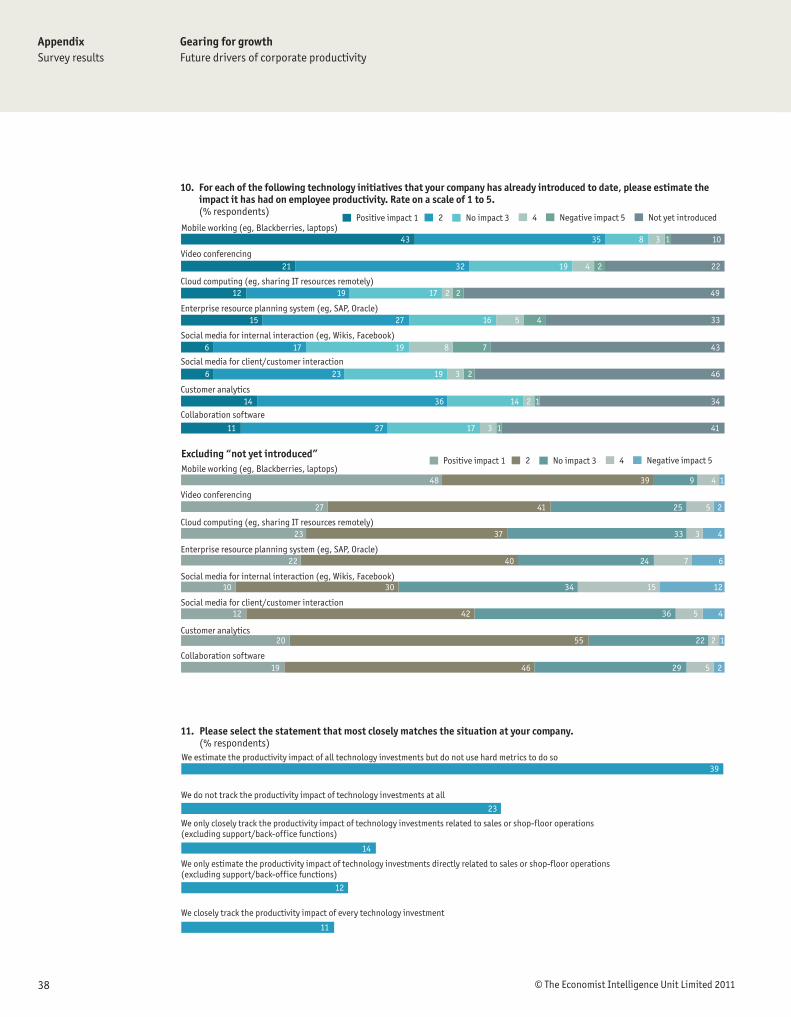
38 © The Economist Intelligence Unit Limited 2011
AppendixSurvey results
Gearing for growthFuture drivers of corporate productivity
10. For each of the following technology initiatives that your company has already introduced to date, please estimate the impact it has had on employee productivity. Rate on a scale of 1 to 5. (% respondents)
Mobile working (eg, Blackberries, laptops)Positive impact 1 2 No impact 3 4
Video conferencing
Cloud computing (eg, sharing IT resources remotely)
Enterprise resource planning system (eg, SAP, Oracle)
83543 3 1 10
3221 224 219
12 49221719
16 52715 334
Social media for internal interaction (eg, Wikis, Facebook)819176 437
Social media for client/customer interaction19236 463 2
Customer analytics21414 36 341
Collaboration software
172711 413 1
Negative impact 5 Not yet introduced
Mobile working (eg, Blackberries, laptops)
Excluding “not yet introduced”Positive impact 1 2 No impact 3 4
Video conferencing
Cloud computing (eg, sharing IT resources remotely)
Enterprise resource planning system (eg, SAP, Oracle)
3948 9 4 1
4127 2525
23 433337
244022 67
Social media for internal interaction (eg, Wikis, Facebook)15343010 12
Social media for client/customer interaction364212 45
Customer analytics2225520 1
Collaboration software294619 25
Negative impact 5
11. Please select the statement that most closely matches the situation at your company. (% respondents)We estimate the productivity impact of all technology investments but do not use hard metrics to do so
We do not track the productivity impact of technology investments at all
We only closely track the productivity impact of technology investments related to sales or shop-floor operations (excluding support/back-office functions)
39
23
14
We only estimate the productivity impact of technology investments directly related to sales or shop-floor operations (excluding support/back-office functions)
12
We closely track the productivity impact of every technology investment
11

39© The Economist Intelligence Unit Limited 2011
AppendixSurvey results
Gearing for growthFuture drivers of corporate productivity
12. Which of the following technologies that your company plans to introduce over the next 12 months will have the greatest positive impact on employee productivity? Select up to three. (% respondents)Customer analytics
My company is currently not planning to introduce any new technology initiatives over the next 12 months
Social media for client/customer interaction
23
23
21
Cloud computing (eg, sharing IT resources remotely)18
Video conferencing16
Social media for internal interaction (eg, Wikis, Facebook)15
Collaboration software
Enterprise resource planning system (eg, SAP, Oracle)
Mobile working (eg, Blackberries, laptops)
15
15
13
My company currently uses all of these technologies6
Other, please specify4
13. In your opinion, which are the biggest strategy-related problems affecting productivity in your company? Select up to three. (% respondents)The strategic focus is too much on reducing costs and not enough on maximising the efficient use of existing resources
The strategic focus is too much on top-line growth and not enough on maximising the efficient use of existing resources
My company is not open enough to collaborate with partners on strategic projects
36
30
23
My company is not specialised enough and wastes too much on non-core products/services that it would be more productive to outsource20
My company is focused on markets that do not offer the best potential return on investment20
My company is too small to enjoy economies of scale19
My company is too specialised and lacks competence in crucial areas that it would be more productive to do ourselves
My company owns too many unproductive fixed assets
Other, please specify
18
17
8

40 © The Economist Intelligence Unit Limited 2011
AppendixSurvey results
Gearing for growthFuture drivers of corporate productivity
14. For each of the following strategic initiatives that your company has undertaken in the past 12 months, please estimate its impact on productivity. Rate on a scale of 1 to 5. (% respondents)
Outsourcing non-core business practicesPositive impact 1 2 No impact 3 4
Selling a non-core part of the business
Selling fixed assets (property, plant or equipment)
Acquiring a competitor
103115 4 4 35
157 653 19
5 63221414
8 41310 651
Acquiring a strategic partner with complementary know-how/technology472112 561
Cost-cutting/labour force consolidation143710 249 6
Entering a new market103418 307 1
Introducing new products/services
Collaborating with a strategic partner
Investing in operational R&D
103926 19
37
38
22
2 0
13
13
32
32
14
15
5 1
Negative impact 5 Not yet introduced
Outsourcing non-core business practices
Excluding “not yet introduced”Positive impact 1 2 No impact 3 4
Selling a non-core part of the business
Selling fixed assets (property, plant or equipment)
Acquiring a competitor
4823 16 7 6
4420 4825
14 653738
223627 312
Acquiring a strategic partner with complementary know-how/technology9164727 1
Cost-cutting/labour force consolidation184813 912
Entering a new market14 94926 2
Introducing new products/services
Collaborating with a strategic partner
Investing in operational R&D
124832 2
3
3 0
3
21
2051
51
23
24
6
Negative impact 5

41© The Economist Intelligence Unit Limited 2011
AppendixSurvey results
Gearing for growthFuture drivers of corporate productivity
15. Please select the statement that most closely matches the situation at your company. (% respondents)
Productivity is the sole consideration in our strategic thinking
Productivity is a major consideration in our strategic thinking
Productivity is a minor consideration in our strategic thinking
62
30
5Productivity is not a consideration in our strategic thinking
3
16. Which of the following strategic initiatives that your company plans to undertake over the next 12 months will have the greatest positive impact on productivity? Select up to three. (% respondents)Introducing new products/services
Entering a new market
Cost-cutting/labour force consolidation
41
30
24
Collaborating with a strategic partner21
Outsourcing non-core business practices
20
Acquiring a strategic partner with complementary know-how/technology19
Acquiring a competitor
Selling a non-core part of the business
Selling fixed assets (property, plant or equipment)
Investing in operational R&D
Other, please specify
My company is currently not planning to undertake any of these strategic initiatives
16
15
11
10
1
10

42 © The Economist Intelligence Unit Limited 2011
AppendixSurvey results
Gearing for growthFuture drivers of corporate productivity
17. In your opinion, which are the biggest barriers to maximising productivity in your company’s principle markets? Select up to three. (% respondents)Onerous or restrictive operating regulations
Onerous or restrictive labour regulations
Onerous or restrictive product regulations
36
27
20
Onerous or restrictive trade regulations15
Strict price controls on certain products/services
14
Corruption14
Poor enforcement of competition law
Onerous or restrictive land regulations (eg, industrial zoning)
Low level of internationalisation
Prevalence/dominance of government-owned monopolies
Other, please specify
14
13
13
8
13
18. For each of the following indicators, please estimate your company’s position relative to its competitors over the past 12 months. Rate on a scale of 1 to 5, where 1=very good and 5=very poor. (% respondents)Revenue growth
Very good 1 2 3 4
Return on equity
Cash flow
Debt-to-equity
253423 7 4 6
2915 1110 530
20 93112333
26 82521 164
Total factor productivity (growth not accounted for by increases in factors of production, such as hours worked or capital invested)8342710 192
Very poor 5 Don’t know
19. For each of the following indicators, please estimate your company’s position relative to its competitors over the past 12 months. Rate on a scale of 1 to 5, where 1=very good and 5=very poor. (% respondents)Process innovation
Very good 1 2 3 4
Product/service innovation
Entering new markets
Bringing new products/services to market
313117 11 5 6
3416 614 327
14 85162830
28 153113 75
Very poor 5 Don’t know
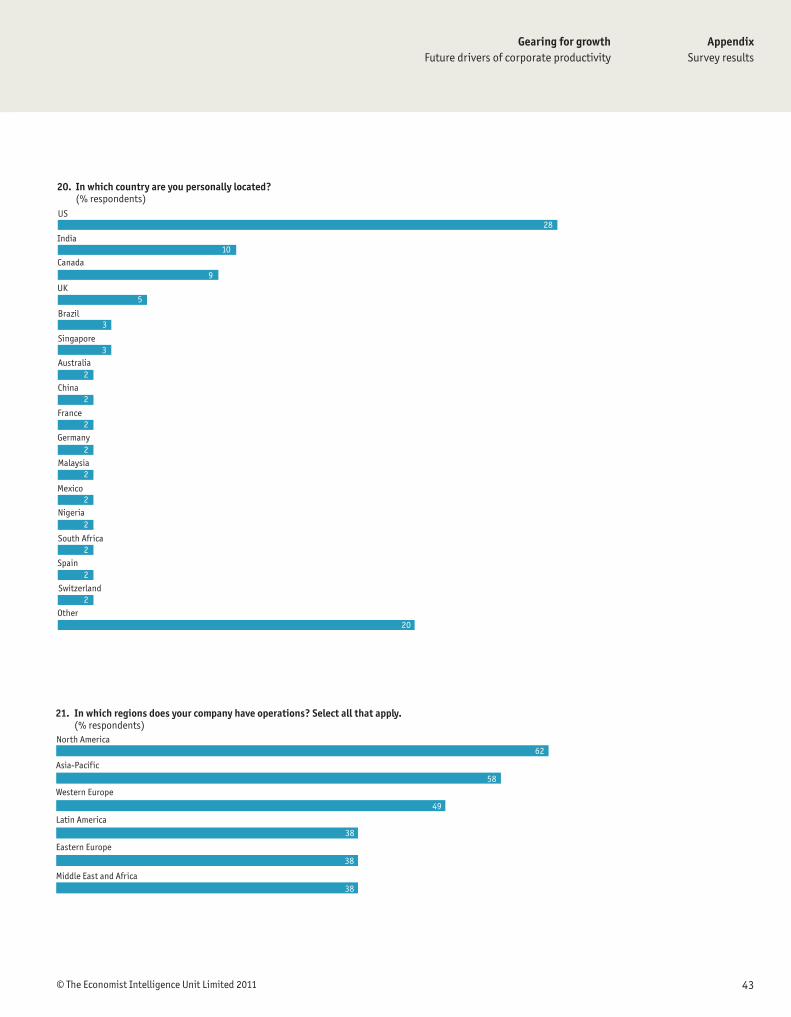
43© The Economist Intelligence Unit Limited 2011
AppendixSurvey results
Gearing for growthFuture drivers of corporate productivity
20. In which country are you personally located? (% respondents)US
India
Canada
UK
Brazil
South Africa
Singapore
Germany
Malaysia
Australia
Nigeria
Switzerland
China
France
Mexico
Spain
Other
28
10
9
5
3
3
2
2
2
2
2
2
2
2
2
2
20
21. In which regions does your company have operations? Select all that apply. (% respondents)North America
Asia-Pacific
Western Europe
62
58
49
Latin America38
Eastern Europe
38
Middle East and Africa38

44 © The Economist Intelligence Unit Limited 2011
AppendixSurvey results
Gearing for growthFuture drivers of corporate productivity
22. What is your primary industry? (% respondents)Financial services
Manufacturing
Professional services
14
11
9
IT and technology8
Government/Public sector
Healthcare, pharmaceuticals and biotechnology
Telecommunications
Energy and natural resources
Entertainment, media and publishing
Logistics and distribution
Retailing
Consumer goods
Agriculture and agribusiness
Chemicals
Construction and real estate
Automotive
Transportation, travel and tourism
Aerospace/Defence
7Education
7
6
5
5
4
4
4
3
3
3
2
2
2
1

45© The Economist Intelligence Unit Limited 2011
AppendixSurvey results
Gearing for growthFuture drivers of corporate productivity
23. What are your organisation’s annual global revenues in US dollars? (% respondents)$500m or less
$500m to $1bn
$1bn to $5bn
45
14
15
$5bn to $10bn9
$10bn or more
18
24. Which of the following best describes your title? (% respondents)
Board member
CEO/President/Managing director
CFO/Treasurer/Comptroller
4
20
4
CIO/Technology director4
Other C-level executive
4
Head of business unit
7
Head of department
10
Manager21
Other
10
SVP/VP/Director
16
25. What are your main functional roles? Choose up to three. (% respondents)General management
Strategy and business development
Finance
38
34
22
Operations and production20
Marketing and sales19
IT13
10
8
8
8
R&D
Information and research
Human resources
4Supply-chain management
4Procurement
3Legal
5Other
Risk
Customer service15
26. In which region are you personally based? (% respondents)North America
Asia-Pacific
Western Europe
37
24
20
Middle East and Africa8
8Latin America
3Eastern Europe
18

Whilst every effort has been taken to verify the accuracy of this information, neither The Economist Intelligence Unit Ltd. nor the sponsor of this report can accept any responsibility or liability for reliance by any person on this report or any of the information, opinions or conclusions set out herein.
Cover image - Wai Lam

LONDON26 Red Lion SquareLondonWC1R 4HQUnited KingdomTel: (44.20) 7576 8000Fax: (44.20) 7576 8500E-mail: [email protected]
NEW YORK750 Third Avenue5th FloorNew York, NY 10017, USTel: (1.212) 554 0600Fax: (1.212) 586 0248E-mail: [email protected]
HONG KONG6001, Central Plaza18 Harbour RoadWanchaiHong KongTel: (852) 2585 3888Fax: (852) 2802 7638E-mail: [email protected]
GENEVABoulevard des Tranchées 161206 GenevaSwitzerlandTel: (41) 22 566 2470Fax: (41) 22 346 9347E-mail: [email protected]