ged mathematical reasoning high impact indicators · ged® mathematical reasoning high impact...
TRANSCRIPT
0
GED
® Mathematical Reasoning
High Impact Indicators
Tools for the Classroom
Bonnie Goonen – [email protected] Susan Pittman – [email protected]
Webinar Guide November 18, 2015 Institute for the Professional Development of Adult Educators
T O O L S F O R T H E C L A S S R O O M
GED® Mathematical Reasoning High
Impact Indicators
Institute for the Professional Development of Adult Educators 3209 Virginia Avenue - Fort Pierce, FL 34981
Phone 772-462-7409 • E-mail [email protected]
The IPDAE project is supported with funds provided through the Florida Department of Education and Division of Career Adult Education.
Rod Duckworth, Chancellor Career and Adult Education, Department of Education
Zelda Rogers, Senior Educational Program Director
Adult Education, Career and Adult Education
Ila Waite-Burns, Program Specialist Adult Education, Career and Adult Education
June Rall, Director of IPDAE
Tamara Serrano, Project Support Specialist for IPDAE
Resources Developed and Designed By
Bonnie Goonen Susan Pittman

Table of Contents
High Impact Indicators ......................................................................................... 3
Time to Explore and Reflect................................................................................. 4
Lesson Title: Using Nets for Finding Surface Area ............................................... 5
GED Testing Service® HIIs................................................................................. 25
3
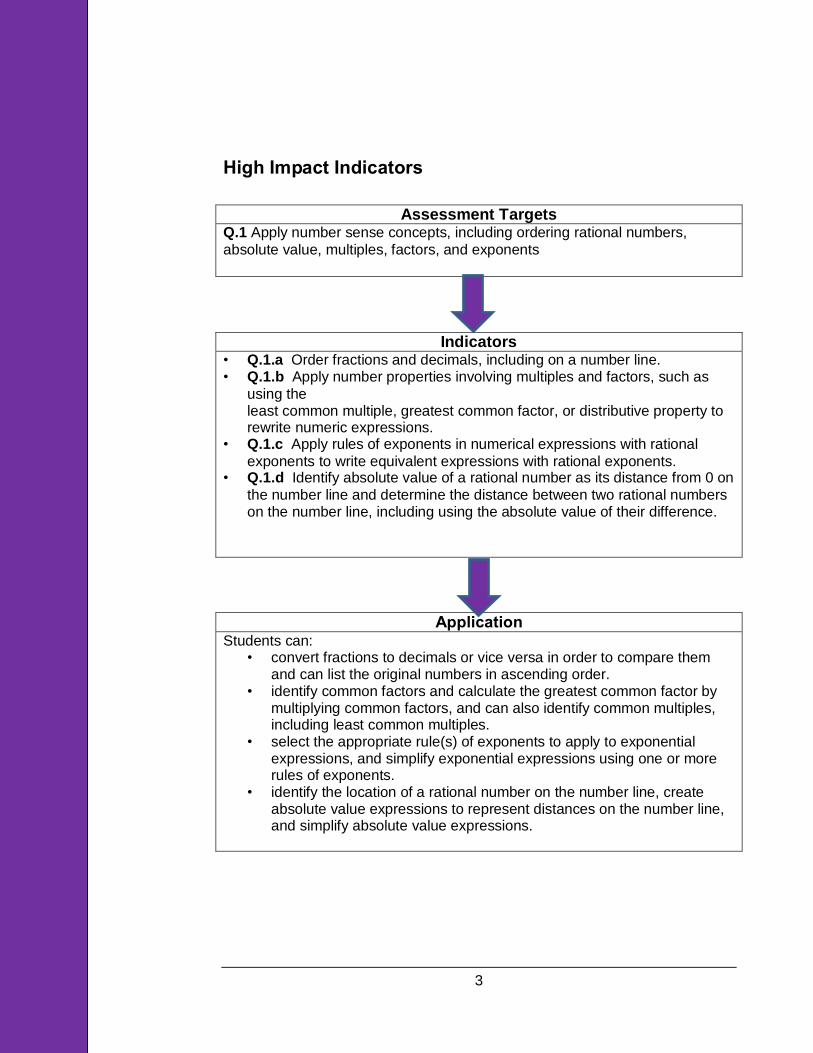
High Impact Indicators
Assessment Targets Q.1 Apply number sense concepts, including ordering rational numbers,
absolute value, multiples, factors, and exponents
Indicators • Q.1.a Order fractions and decimals, including on a number line. • Q.1.b Apply number properties involving multiples and factors, such as
using the least common multiple, greatest common factor, or distributive property to rewrite numeric expressions.
• Q.1.c Apply rules of exponents in numerical expressions with rational
exponents to write equivalent expressions with rational exponents. • Q.1.d Identify absolute value of a rational number as its distance from 0 on
the number line and determine the distance between two rational numbers on the number line, including using the absolute value of their difference.
Application Students can:
• convert fractions to decimals or vice versa in order to compare them and can list the original numbers in ascending order.
• identify common factors and calculate the greatest common factor by multiplying common factors, and can also identify common multiples, including least common multiples.
• select the appropriate rule(s) of exponents to apply to exponential expressions, and simplify exponential expressions using one or more rules of exponents.
• identify the location of a rational number on the number line, create absolute value expressions to represent distances on the number line, and simplify absolute value expressions.
4
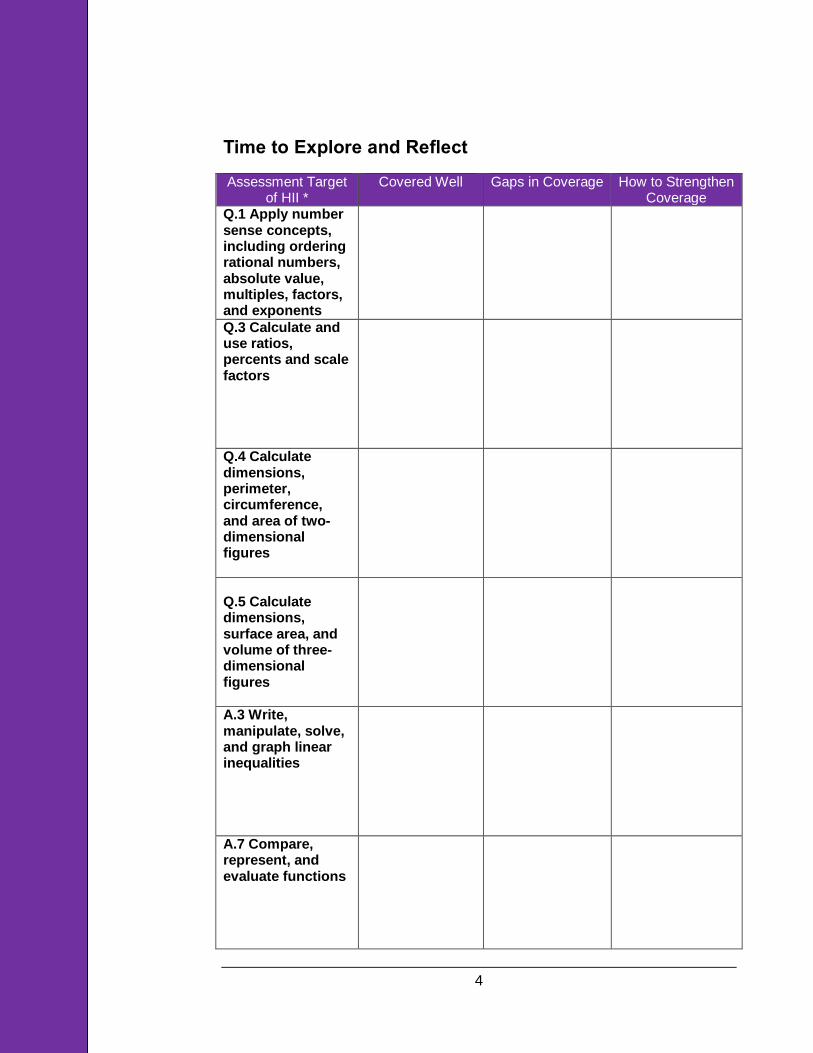
Time to Explore and Reflect
Assessment Target of HII *
Covered Well Gaps in Coverage How to Strengthen Coverage
Q.1 Apply number sense concepts, including ordering rational numbers, absolute value, multiples, factors, and exponents
Q.3 Calculate and use ratios, percents and scale factors
Q.4 Calculate dimensions, perimeter, circumference, and area of two-dimensional figures
Q.5 Calculate dimensions, surface area, and volume of three-dimensional figures
A.3 Write, manipulate, solve, and graph linear inequalities
A.7 Compare, represent, and evaluate functions
5
Module: Mathematical Reasoning
Lesson Title: Using Nets for Finding Surface Area
Objectives and Standards
Students will:
Draw and construct nets for 3-D objects.
Determine the surface area of rectangular prisms, triangular prisms, and right cylinders to solve problems
Prerequisite Skills Common Core State Standards
Mathematical Reasoning 2014 GED®
Assessment Targets
Mathematical Practices Common Core State
Standards
Classify two-dimensional figures in a hierarchy based on properties. (CCSS.Math.Content.5.G.B.4 ) Relate area to the operations of multiplication and addition. (CCSS.Math.Content.3.MD.7)
Compute the area and perimeter of triangles and rectangles. Determine side lengths of triangles and rectangles (Q.4.a) Compute the area and circumference of circles. Determine the radius or diameter when given area or circumference. (Q.4.b) Compute volume and surface area of right prisms and pyramids, cylinders, spheres, cones, and composite figures. (Q.5.a, Q.5.b, Q.5.c)
Make sense of problems and persevere in solving them. (CCSS.Math.Practice.MP1) Model with mathematics. (CCSS.Math.Practice.MP4) Use appropriate tools strategically. (CCSS.Math.Practice.MP5) Look for and make use of structure. (CCSS.Math.Practice.MP7)
Materials
Cereal boxes
Measurement tools (rulers)
Paper towel cardboard rolls
Set of plastic nets or templates for various geometric nets
Scissors
Handout 1: Sample 3D Nets
Handout 2: Creating a Net Handout 3: Using Nets to Find Surface Area – Step-by-Step Handout 4: Calculating Surface Area Using Nets Handout 5: Graph Paper
6
Handout 6: Creating a Net Answer Key Handout 7: Calculating Surface Area Using Nets Answer Key Copies of the Formula Page for the GED® test – located at:
http://www.gedtestingservice.com/uploads/files/15a951dfbdd875be5a7a73aa7912e2a0.pdf
Instructional Plan Overview This lesson is designed to teach students how to recognize the nets of various three-dimensional figures and how to use nets to calculate surface area. This is one strategy for teaching surface area. Process Begin the lesson by sharing with students that there are two ways to determine surface area – by using an area for three-dimensional shapes or by calculating the area of each surface and adding them up. Share with students that today they will “catch” some new skills by using nets to calculate surface area. Ask student if they recall how to find the area of a two-dimensional shape, such as a rectangle. For example:
Area is the number of square units needed to cover a surface. The area of a rectangle is length x width (A = lw).
Share with students that in today’s lesson they will learn how they can represent a three-dimensional figure as a two-dimensional figure. Show students a cereal box and ask them how much cardboard the company would need to create the cereal box (this will involve some overlapping to get the sides glued together). Students should take the box apart and measure the cardboard. Then, ask how much of the box must be covered by graphics (this will better represent the surface area of the final figure with no need for overlapping of sides). Have the students only measure the six faces of the box. Discuss the difference between the two measurements. Explain that this idea of flattening out a box is called a net, and all three-dimensional figures have nets. Illustrate the net for a cylinder by taking apart a paper towel or toilette-paper roll (the cardboard section). Cut it down one side and unroll it to show the rectangle, and use the open parts on either end to show the two circle bases. Review with students the terms two-dimensional and three-dimensional. Model for students how to visualize a two-dimensional shape by unfolding a three-dimensional shape. Sample templates are included on Handout 1: Sample 3D Nets. You may also wish to access the activity from Math Interactives to assist students in visualizing how to unfold a three-dimensional shape into a two-dimensional shape. Math Interactives at: http://www.learnalberta.ca/content/mejhm/index.html?l=0&ID1=AB.MATH.JR.SHAP&ID2=AB.MATH.JR.SHAP.SURF&lesson=html/object_interactives/surfaceArea/use_it.html Provide each student with Handout 2: Creating a Net. Have students complete the worksheet by identifying each three-dimensional shape and drawing the net.
7
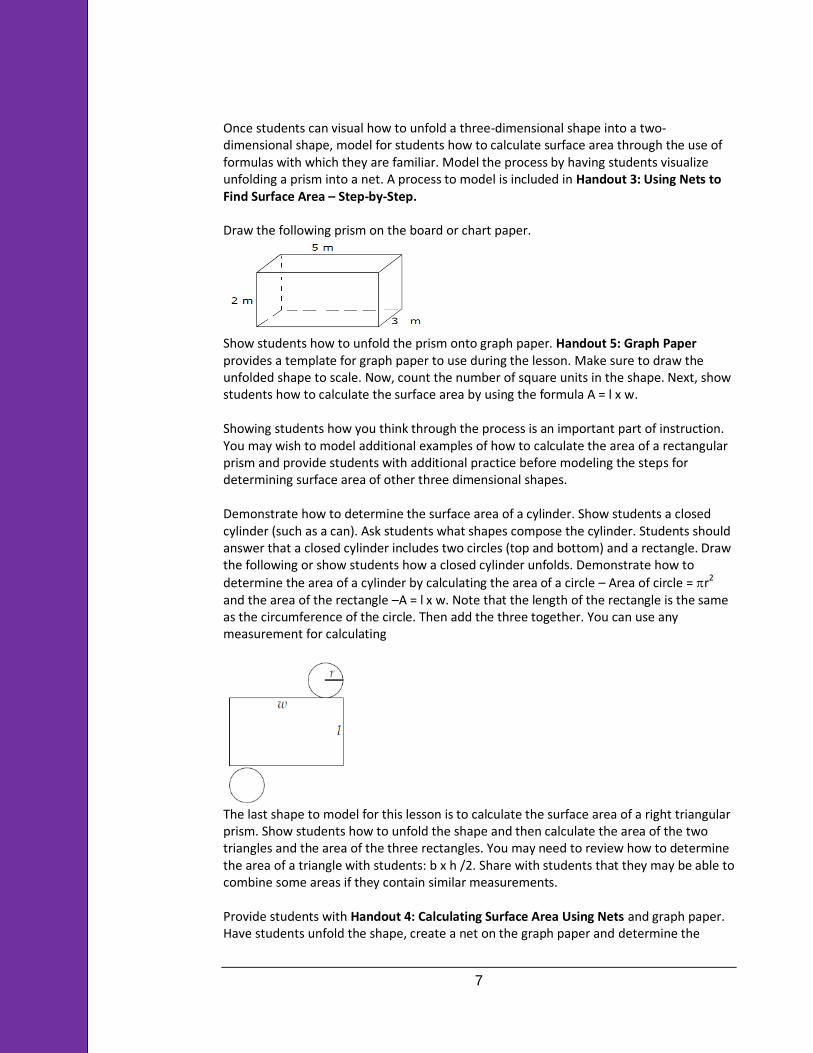
Once students can visual how to unfold a three-dimensional shape into a two-dimensional shape, model for students how to calculate surface area through the use of formulas with which they are familiar. Model the process by having students visualize unfolding a prism into a net. A process to model is included in Handout 3: Using Nets to Find Surface Area – Step-by-Step. Draw the following prism on the board or chart paper.
Show students how to unfold the prism onto graph paper. Handout 5: Graph Paper provides a template for graph paper to use during the lesson. Make sure to draw the unfolded shape to scale. Now, count the number of square units in the shape. Next, show students how to calculate the surface area by using the formula A = l x w. Showing students how you think through the process is an important part of instruction. You may wish to model additional examples of how to calculate the area of a rectangular prism and provide students with additional practice before modeling the steps for determining surface area of other three dimensional shapes. Demonstrate how to determine the surface area of a cylinder. Show students a closed cylinder (such as a can). Ask students what shapes compose the cylinder. Students should answer that a closed cylinder includes two circles (top and bottom) and a rectangle. Draw the following or show students how a closed cylinder unfolds. Demonstrate how to
determine the area of a cylinder by calculating the area of a circle – Area of circle = r2
and the area of the rectangle –A = l x w. Note that the length of the rectangle is the same as the circumference of the circle. Then add the three together. You can use any measurement for calculating
The last shape to model for this lesson is to calculate the surface area of a right triangular prism. Show students how to unfold the shape and then calculate the area of the two triangles and the area of the three rectangles. You may need to review how to determine the area of a triangle with students: b x h /2. Share with students that they may be able to combine some areas if they contain similar measurements. Provide students with Handout 4: Calculating Surface Area Using Nets and graph paper. Have students unfold the shape, create a net on the graph paper and determine the
8
surface area of each shape. Share with students that they may wish to cut out the shapes to ensure that they have created the correct net for each shape. Remember that circles may not draw accurately on graph paper, but students should attempt to draw the circles so that they are proportionate to the rectangle. Have students share their results with the class. Discuss any problems that they encountered. Sample Debriefing Questions
What was the easiest shape to unfold? The most difficult? Why?
How can unfolding shapes assist you in calculating the area of composite shapes,
which is another skill assessed on the GED® test?
Where is surface area used in real-world situations? Provide an example?
Assessments/Extensions
1. Provide students with additional shapes to unfold and calculate surface area, such as:
pyramids, spheres, and open cylinders.
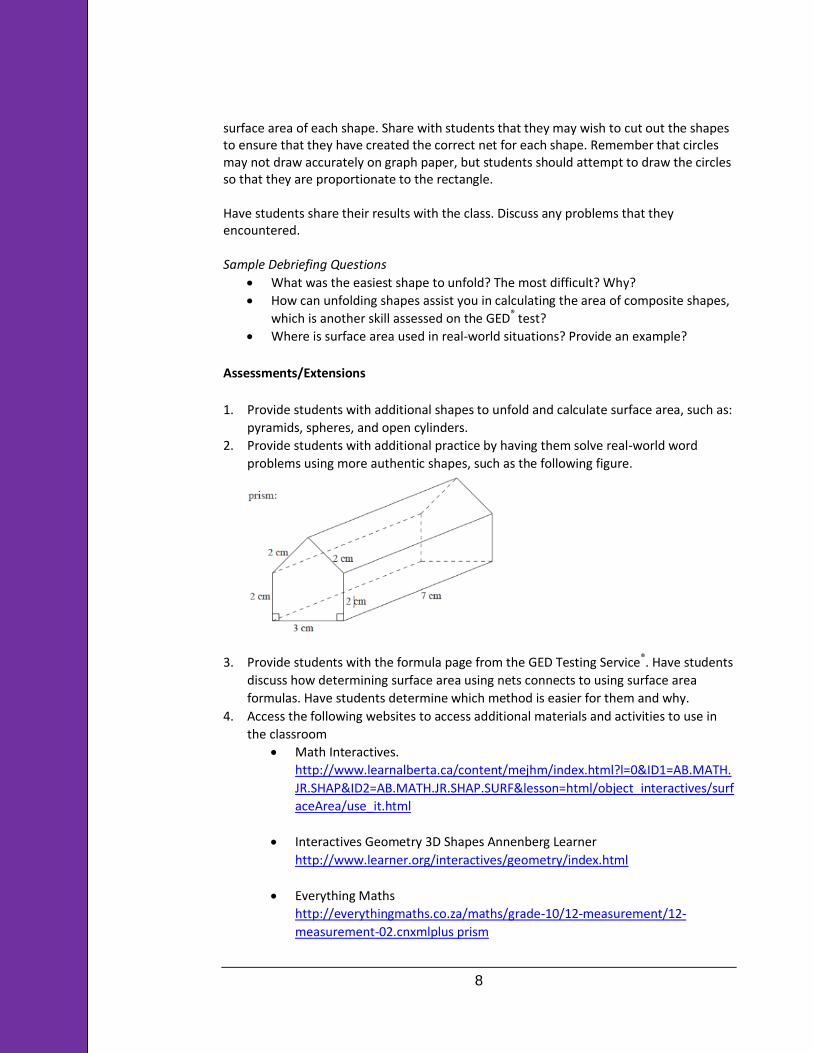
2. Provide students with additional practice by having them solve real-world word
problems using more authentic shapes, such as the following figure.
3. Provide students with the formula page from the GED Testing Service®. Have students
discuss how determining surface area using nets connects to using surface area
formulas. Have students determine which method is easier for them and why.
4. Access the following websites to access additional materials and activities to use in
the classroom
Math Interactives.
http://www.learnalberta.ca/content/mejhm/index.html?l=0&ID1=AB.MATH.
JR.SHAP&ID2=AB.MATH.JR.SHAP.SURF&lesson=html/object_interactives/surf
aceArea/use_it.html
Interactives Geometry 3D Shapes Annenberg Learner
http://www.learner.org/interactives/geometry/index.html
Everything Maths
http://everythingmaths.co.za/maths/grade-10/12-measurement/12-
measurement-02.cnxmlplus prism
9
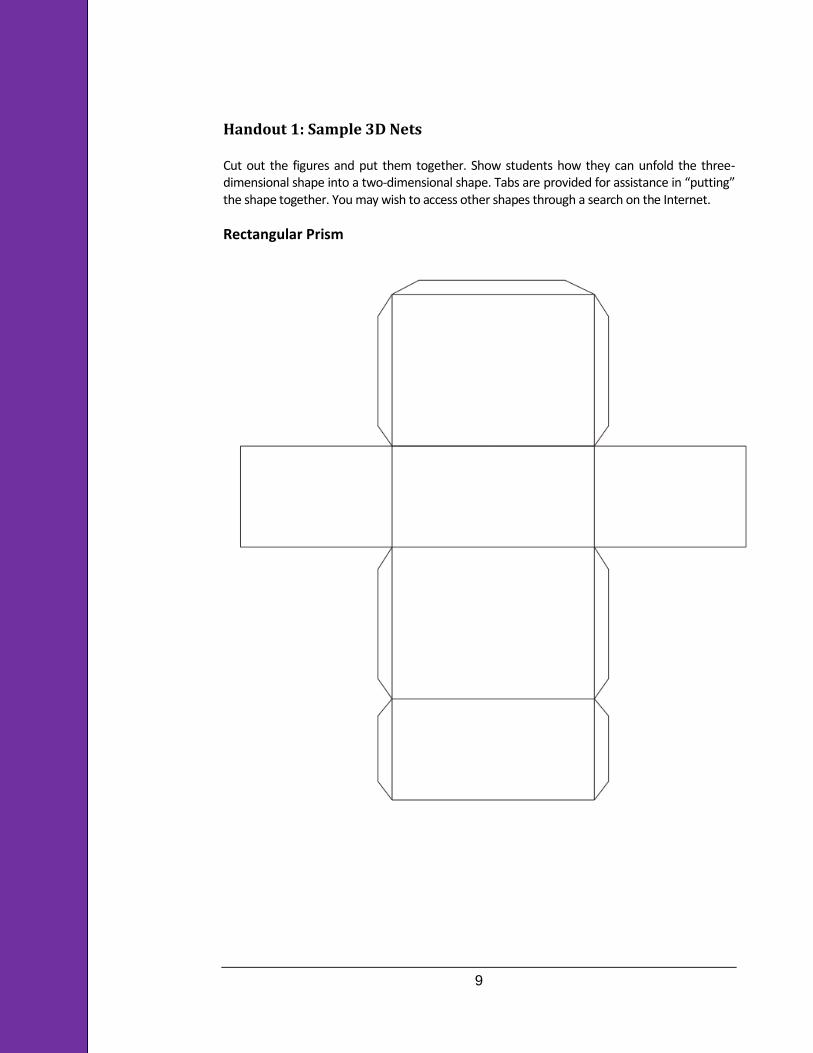
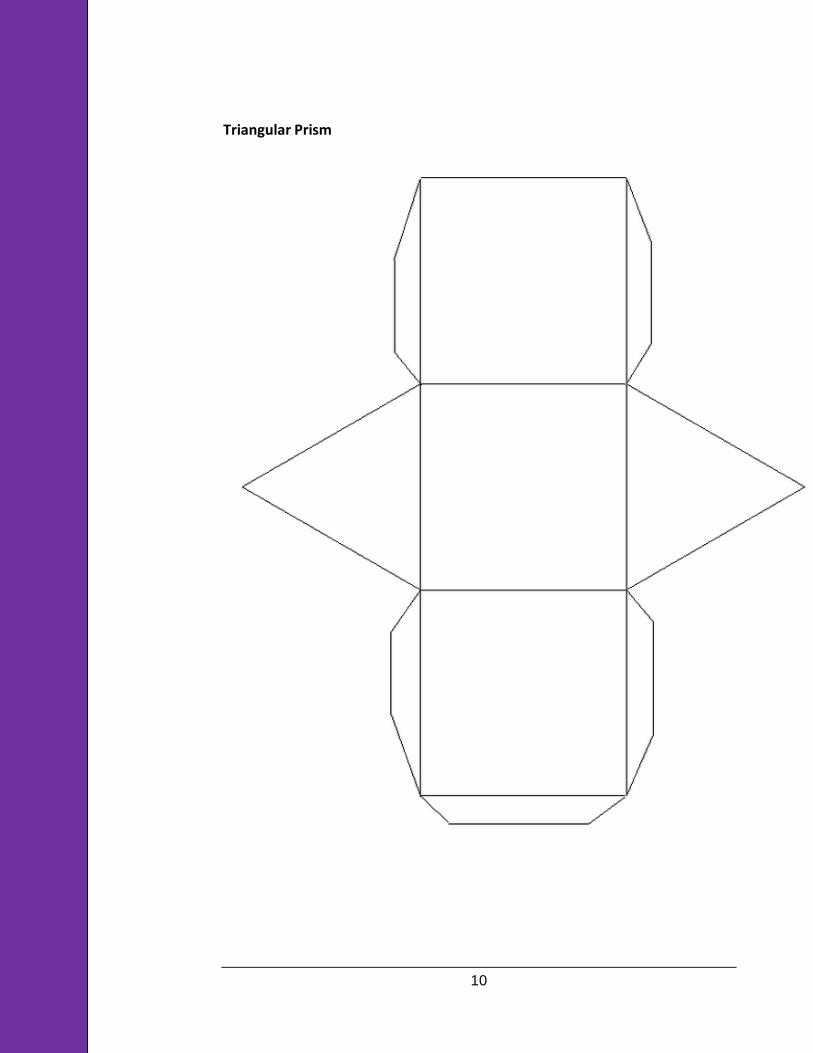
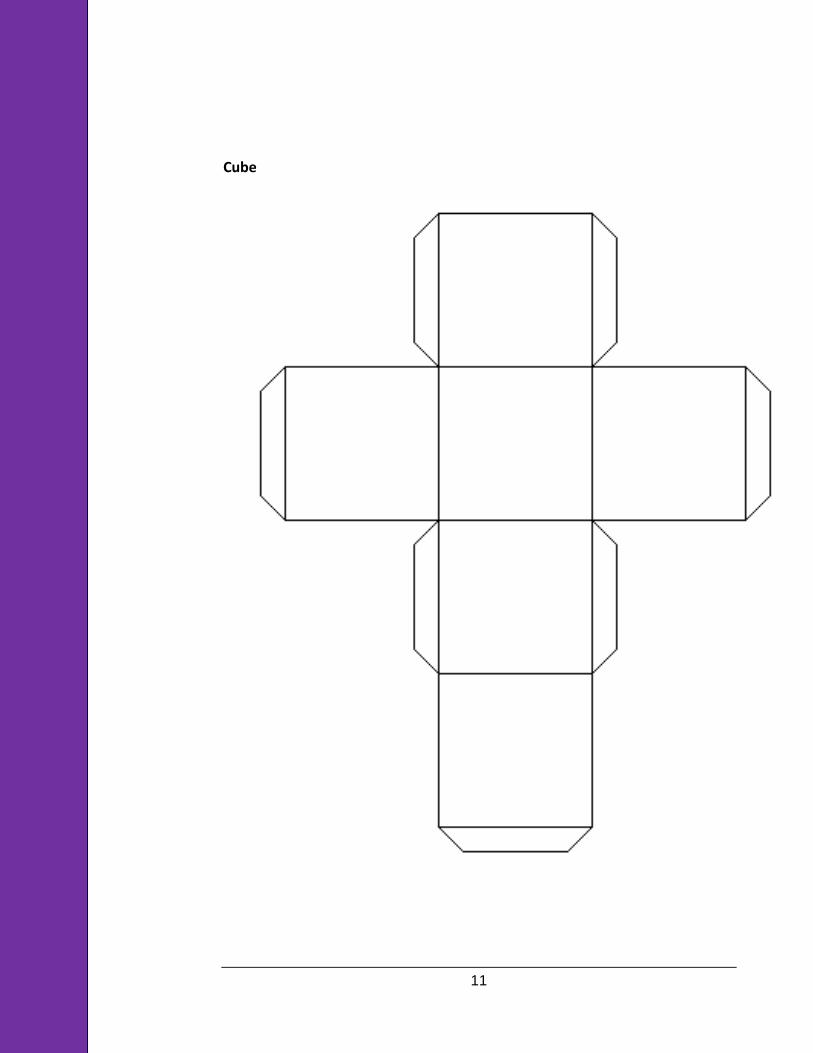
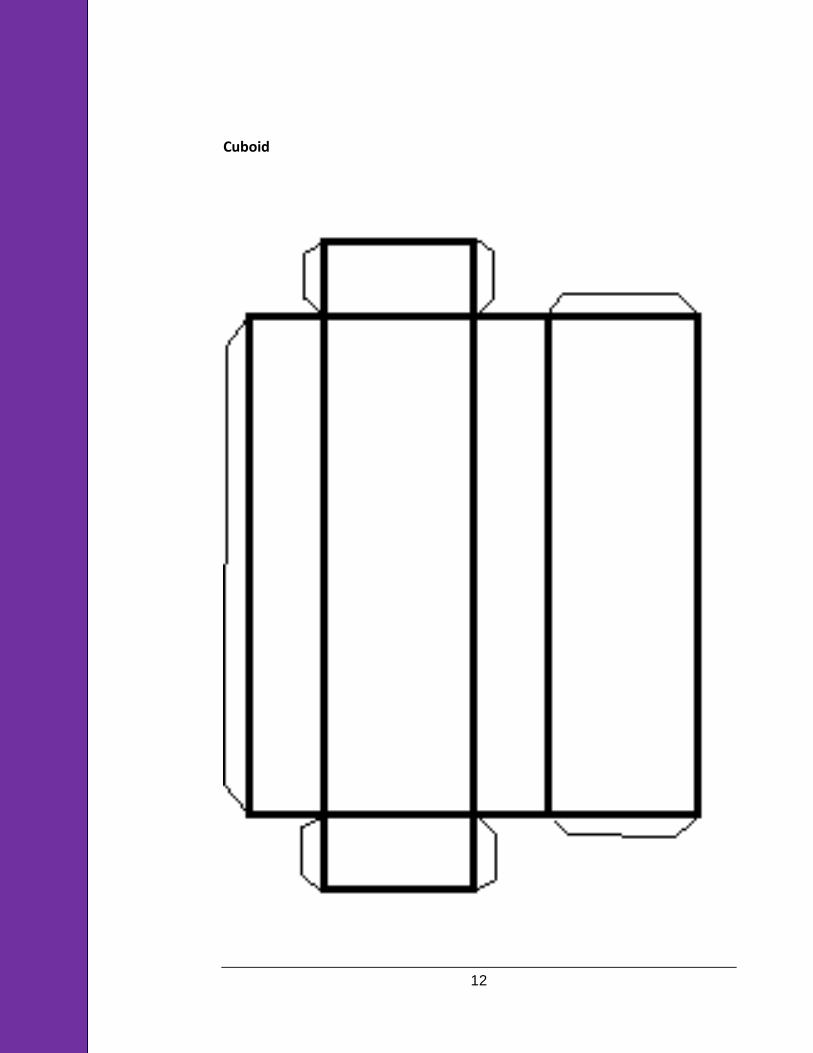
Handout 1: Sample 3D Nets
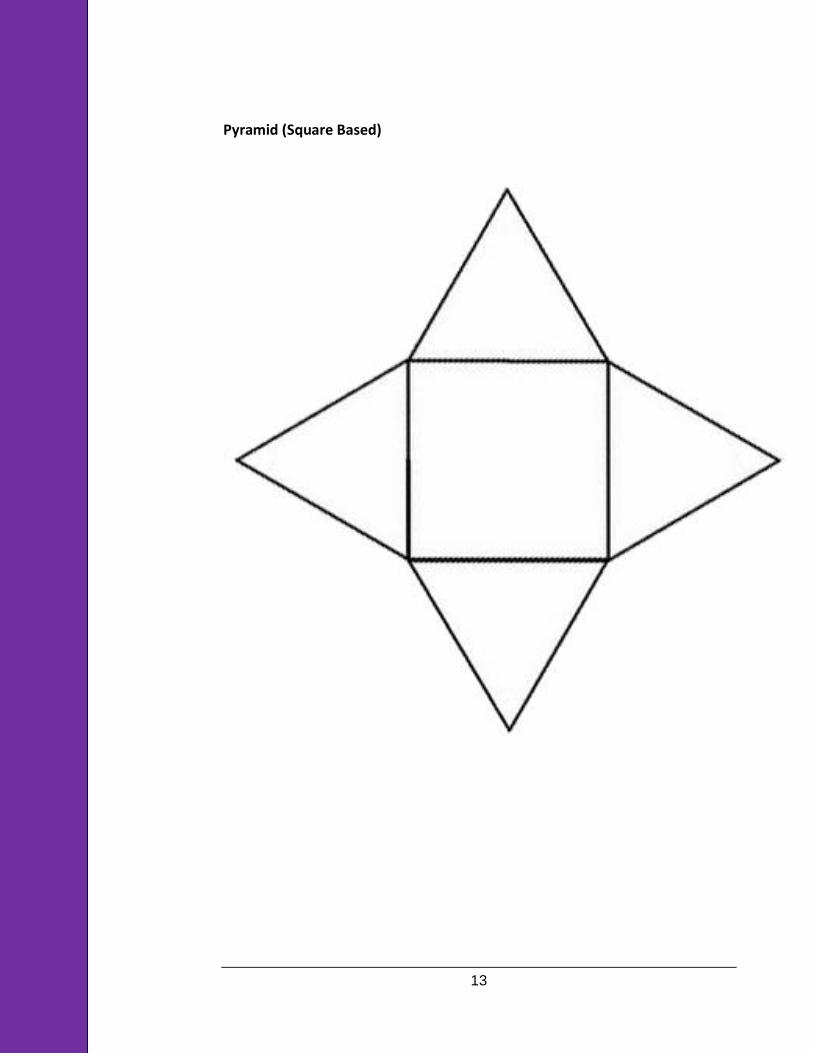
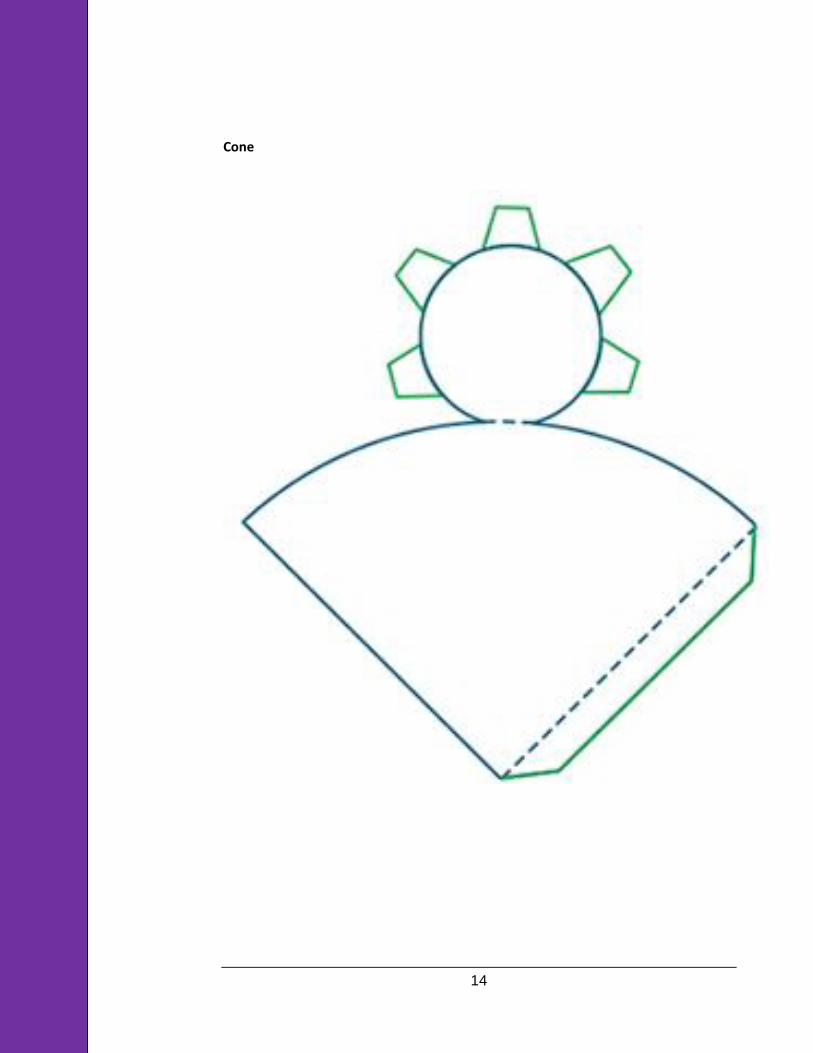
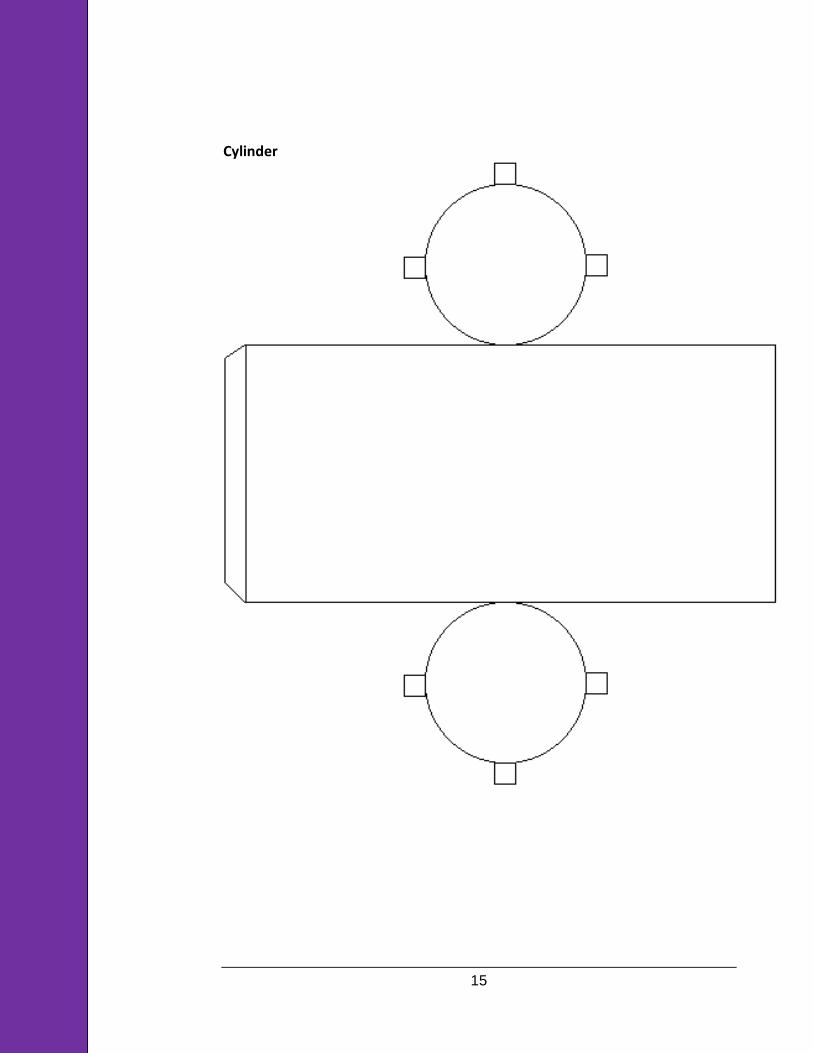
Cut out the figures and put them together. Show students how they can unfold the three-dimensional shape into a two-dimensional shape. Tabs are provided for assistance in “putting” the shape together. You may wish to access other shapes through a search on the Internet.
Rectangular Prism
10
Triangular Prism
11
Cube
12
Cuboid
13
Pyramid (Square Based)
14
Cone
15
Cylinder
16
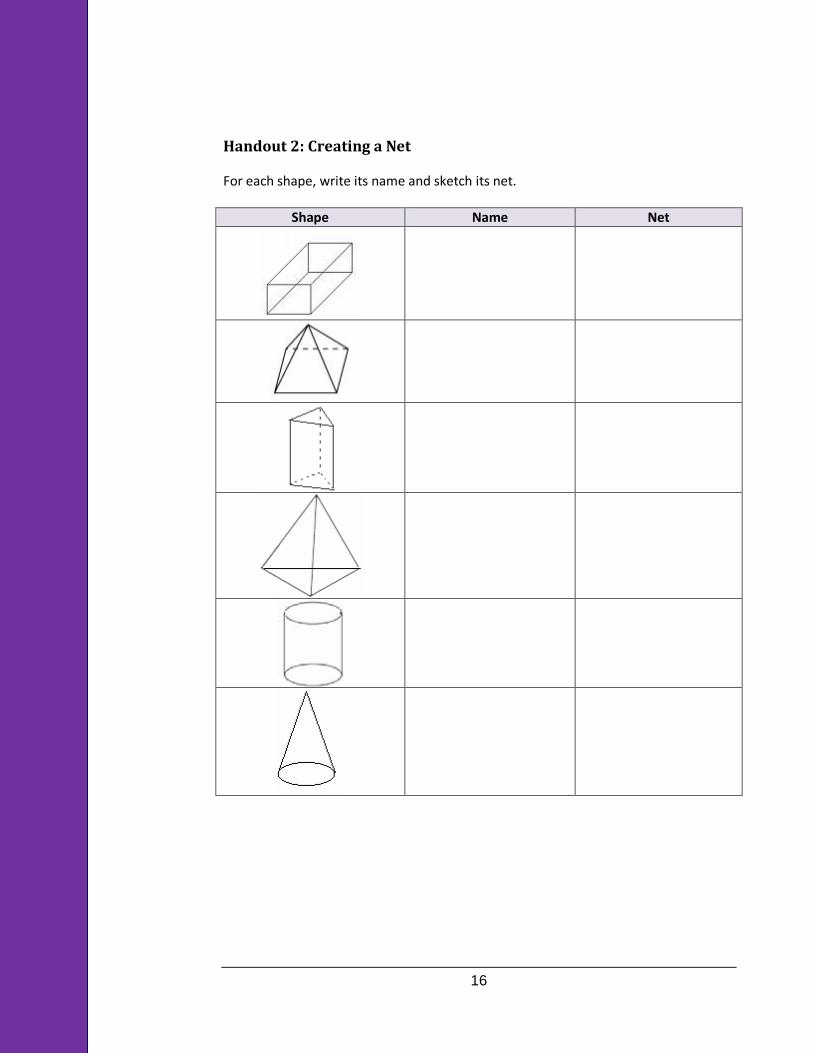
Handout 2: Creating a Net
For each shape, write its name and sketch its net.
Shape Name Net
17
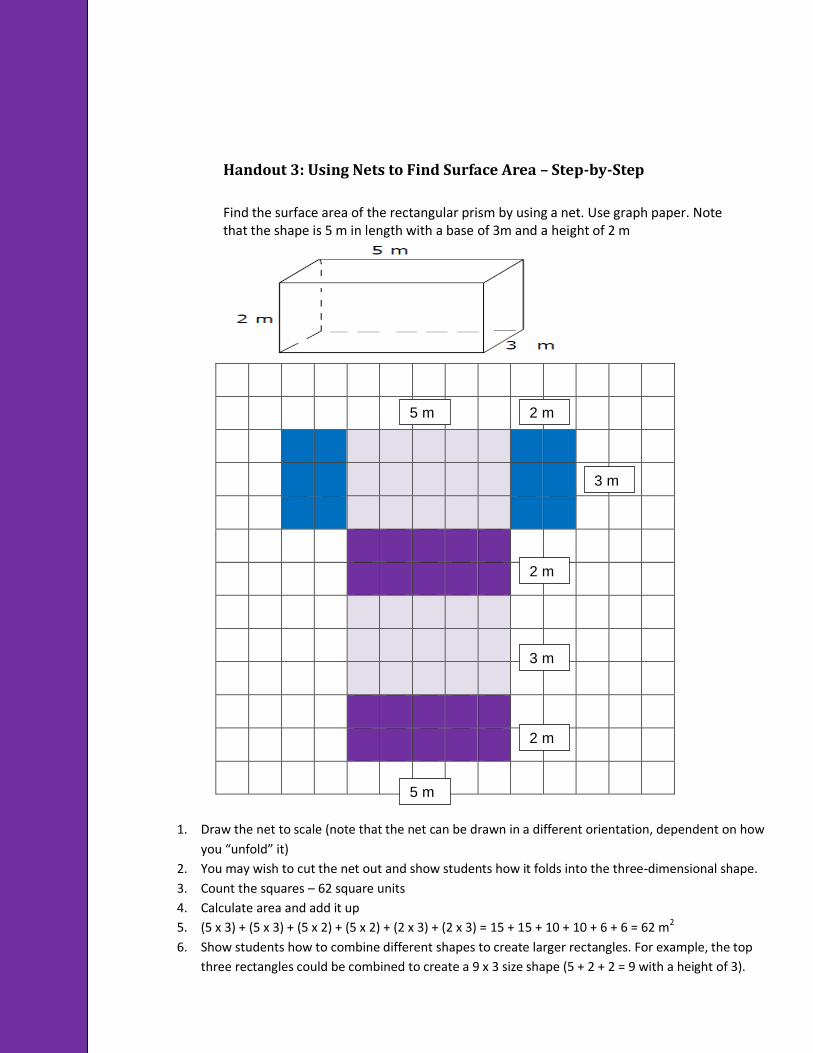
Handout 3: Using Nets to Find Surface Area – Step-by-Step
Find the surface area of the rectangular prism by using a net. Use graph paper. Note that the shape is 5 m in length with a base of 3m and a height of 2 m
5 m 2 m
3 m
2 m
2 m
3 m
5 m
1. Draw the net to scale (note that the net can be drawn in a different orientation, dependent on how
you “unfold” it)
2. You may wish to cut the net out and show students how it folds into the three-dimensional shape.
3. Count the squares – 62 square units
4. Calculate area and add it up
5. (5 x 3) + (5 x 3) + (5 x 2) + (5 x 2) + (2 x 3) + (2 x 3) = 15 + 15 + 10 + 10 + 6 + 6 = 62 m2
6. Show students how to combine different shapes to create larger rectangles. For example, the top
three rectangles could be combined to create a 9 x 3 size shape (5 + 2 + 2 = 9 with a height of 3).
18
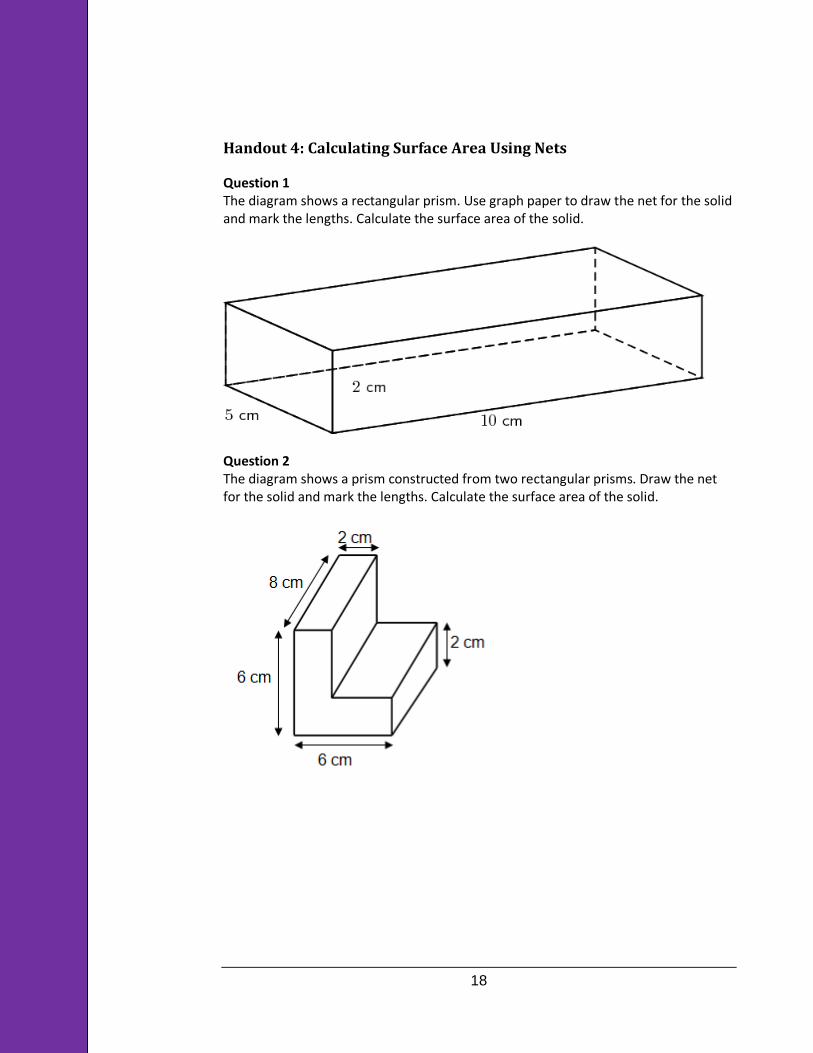
Handout 4: Calculating Surface Area Using Nets
Question 1 The diagram shows a rectangular prism. Use graph paper to draw the net for the solid and mark the lengths. Calculate the surface area of the solid.
Question 2 The diagram shows a prism constructed from two rectangular prisms. Draw the net for the solid and mark the lengths. Calculate the surface area of the solid.
19
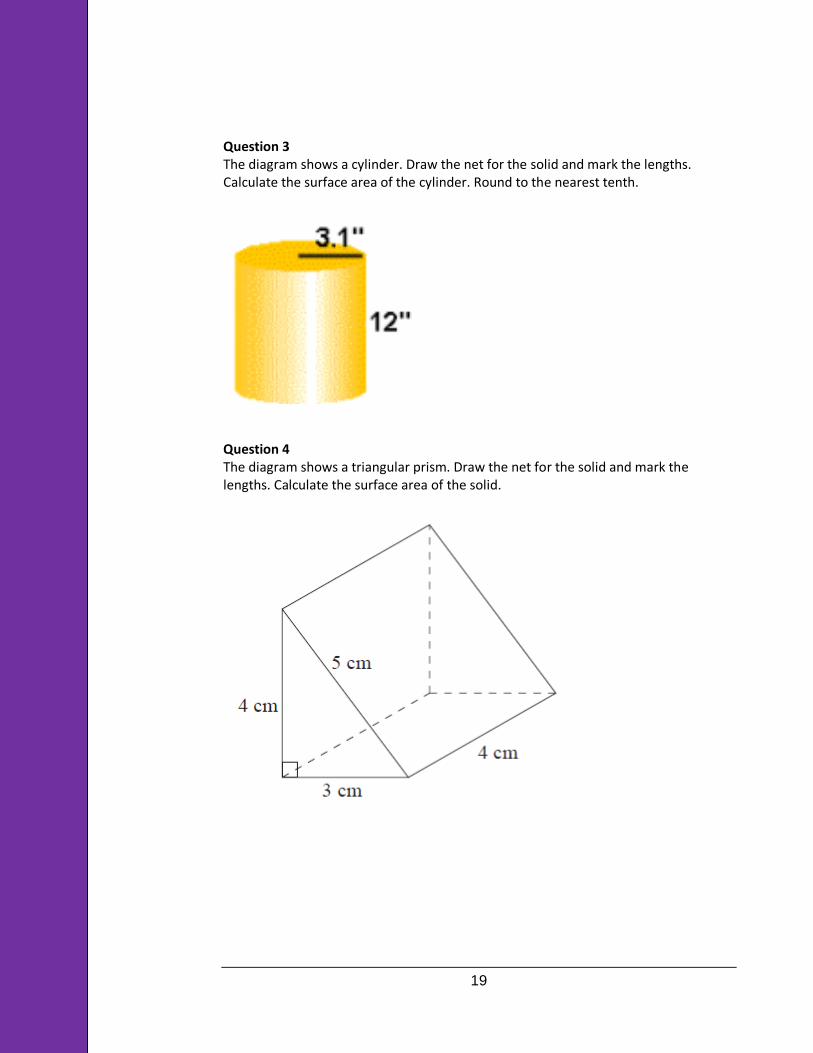
Question 3 The diagram shows a cylinder. Draw the net for the solid and mark the lengths. Calculate the surface area of the cylinder. Round to the nearest tenth.
Question 4 The diagram shows a triangular prism. Draw the net for the solid and mark the lengths. Calculate the surface area of the solid.
20
Handout 5: Graph Paper
21
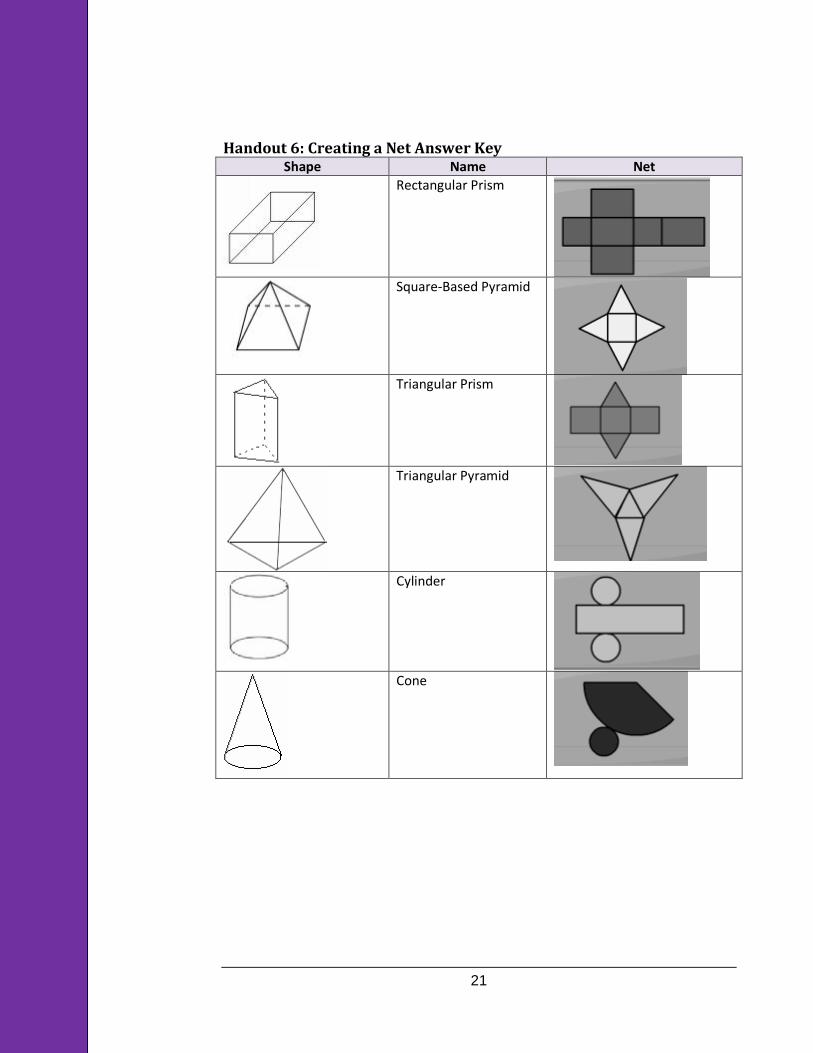
Handout 6: Creating a Net Answer Key
Shape Name Net
Rectangular Prism
Square-Based Pyramid
Triangular Prism
Triangular Pyramid
Cylinder
Cone
22
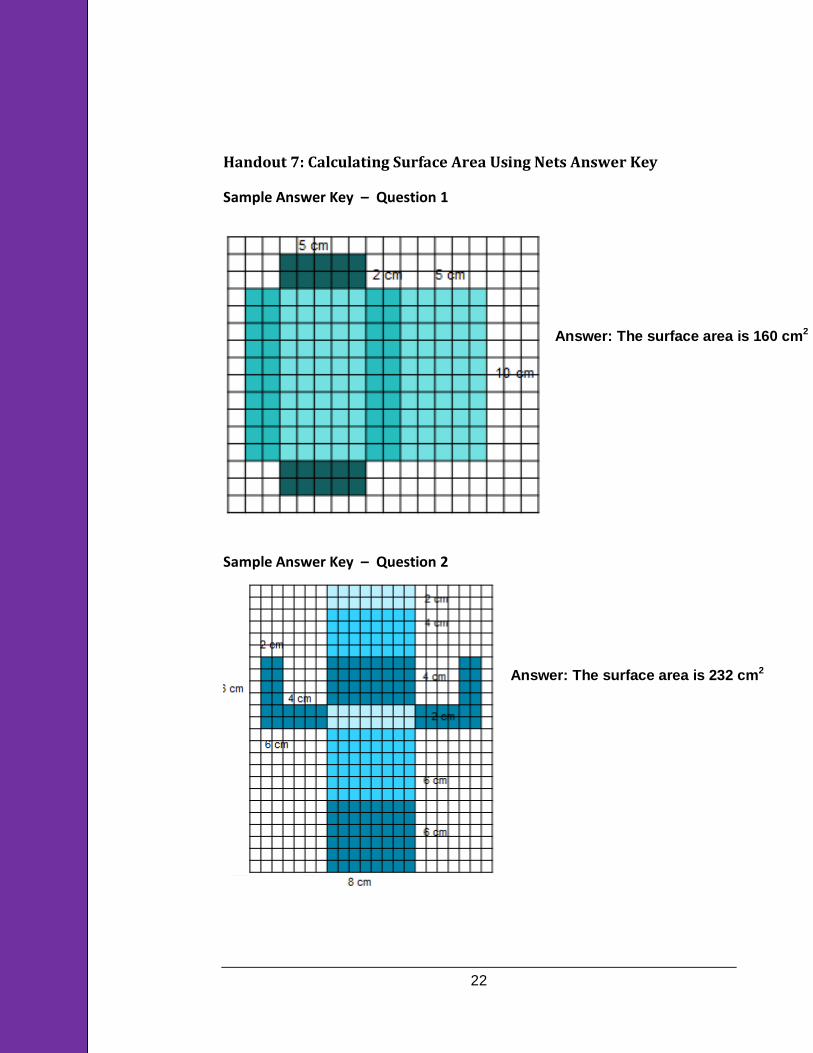
Handout 7: Calculating Surface Area Using Nets Answer Key
Sample Answer Key – Question 1
Sample Answer Key – Question 2
Answer: The surface area is 232 cm2
Answer: The surface area is 160 cm2
23
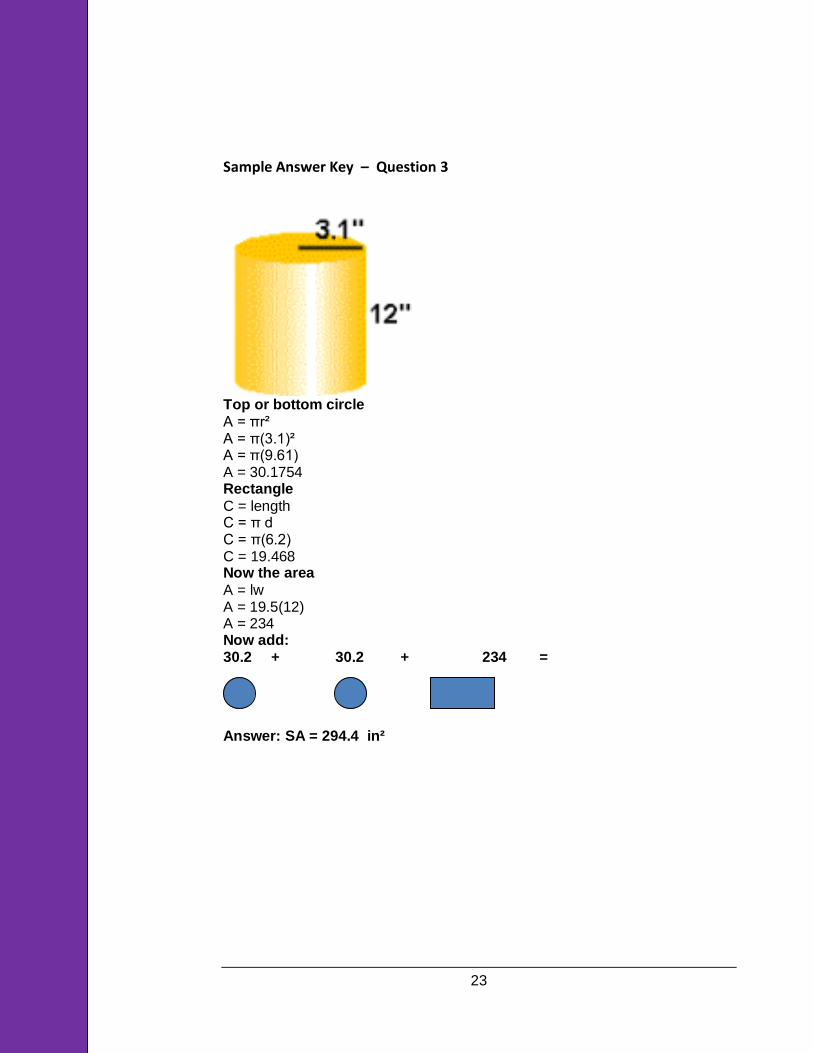
Sample Answer Key – Question 3
Top or bottom circle
A = πr² A = π(3.1)² A = π(9.61) A = 30.1754 Rectangle
C = length C = π d C = π(6.2) C = 19.468 Now the area
A = lw A = 19.5(12) A = 234 Now add: 30.2 + 30.2 + 234 =
Answer: SA = 294.4 in²
24
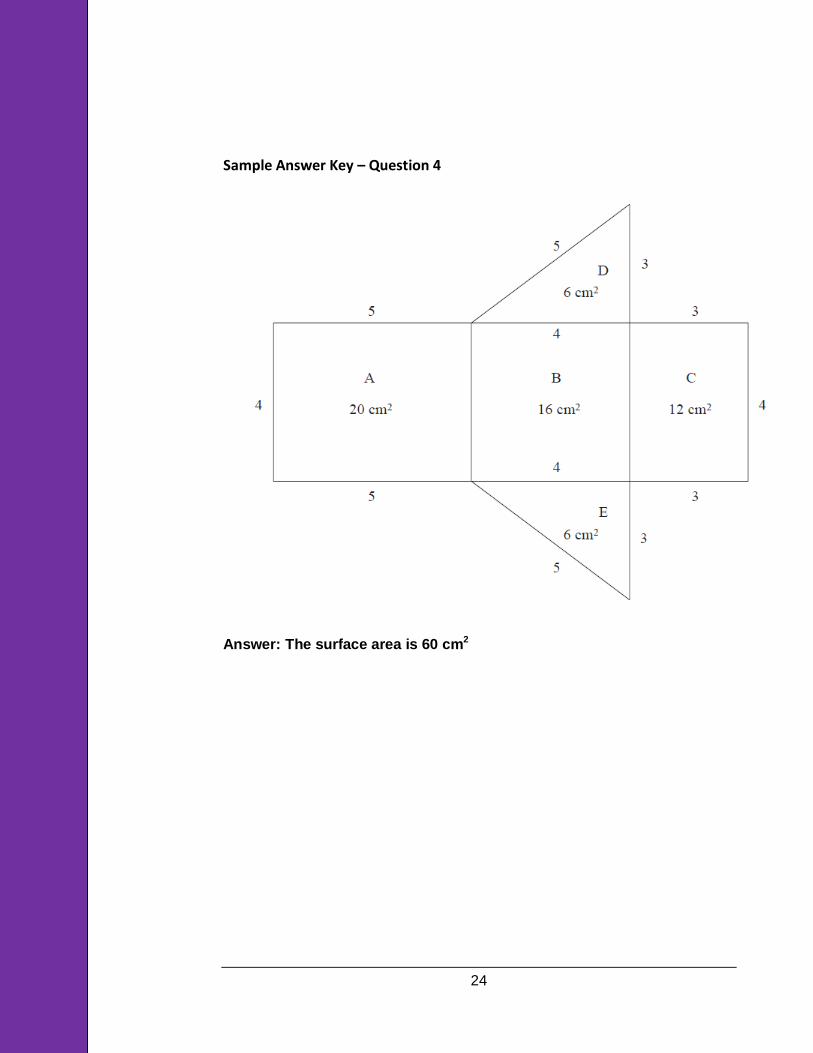
Sample Answer Key – Question 4
Answer: The surface area is 60 cm2
25
GED Testing Service®
High Impact Indicators – Mathematics
Math
Assessment Target Indicators What to look for in student work: The student can
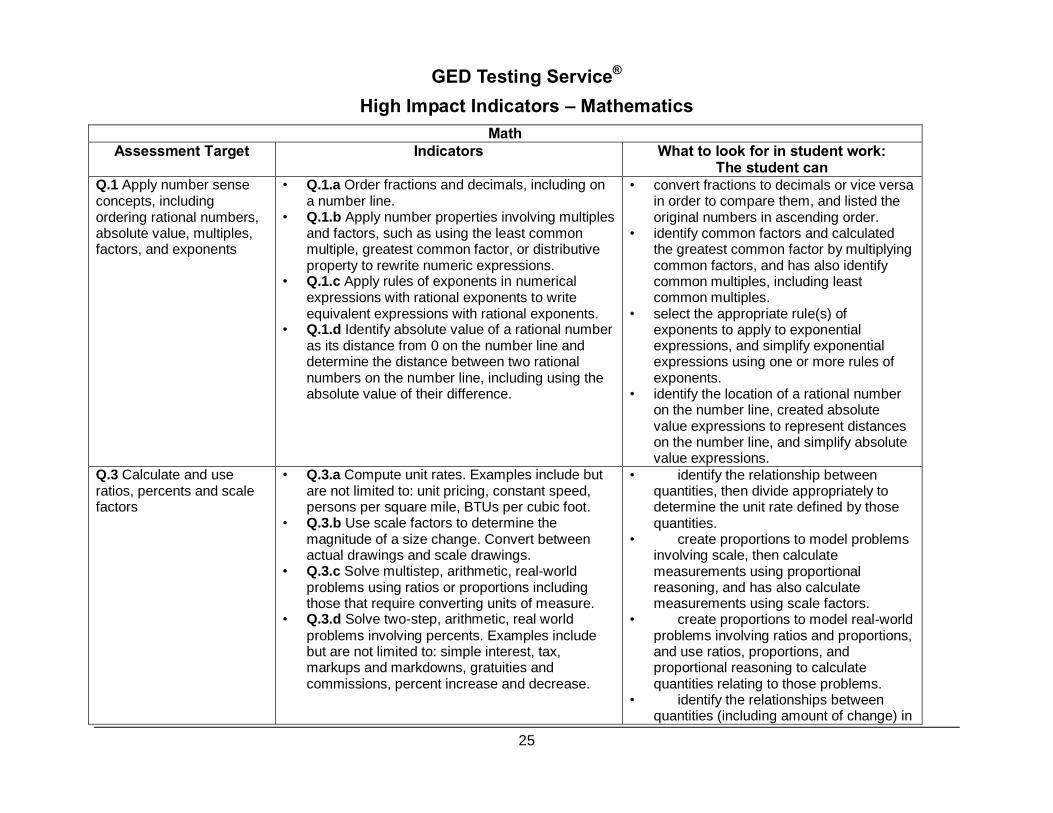
Q.1 Apply number sense concepts, including ordering rational numbers, absolute value, multiples, factors, and exponents
• Q.1.a Order fractions and decimals, including on a number line.
• Q.1.b Apply number properties involving multiples and factors, such as using the least common multiple, greatest common factor, or distributive property to rewrite numeric expressions.
• Q.1.c Apply rules of exponents in numerical expressions with rational exponents to write equivalent expressions with rational exponents.
• Q.1.d Identify absolute value of a rational number as its distance from 0 on the number line and determine the distance between two rational numbers on the number line, including using the absolute value of their difference.
• convert fractions to decimals or vice versa in order to compare them, and listed the original numbers in ascending order.
• identify common factors and calculated the greatest common factor by multiplying common factors, and has also identify common multiples, including least common multiples.
• select the appropriate rule(s) of exponents to apply to exponential expressions, and simplify exponential expressions using one or more rules of exponents.
• identify the location of a rational number on the number line, created absolute value expressions to represent distances on the number line, and simplify absolute value expressions.
Q.3 Calculate and use ratios, percents and scale factors
• Q.3.a Compute unit rates. Examples include but are not limited to: unit pricing, constant speed, persons per square mile, BTUs per cubic foot.
• Q.3.b Use scale factors to determine the magnitude of a size change. Convert between actual drawings and scale drawings.
• Q.3.c Solve multistep, arithmetic, real-world problems using ratios or proportions including those that require converting units of measure.
• Q.3.d Solve two-step, arithmetic, real world
problems involving percents. Examples include but are not limited to: simple interest, tax, markups and markdowns, gratuities and commissions, percent increase and decrease.
• identify the relationship between quantities, then divide appropriately to determine the unit rate defined by those quantities.
• create proportions to model problems involving scale, then calculate measurements using proportional reasoning, and has also calculate measurements using scale factors.
• create proportions to model real-world problems involving ratios and proportions, and use ratios, proportions, and proportional reasoning to calculate quantities relating to those problems.
• identify the relationships between quantities (including amount of change) in
26
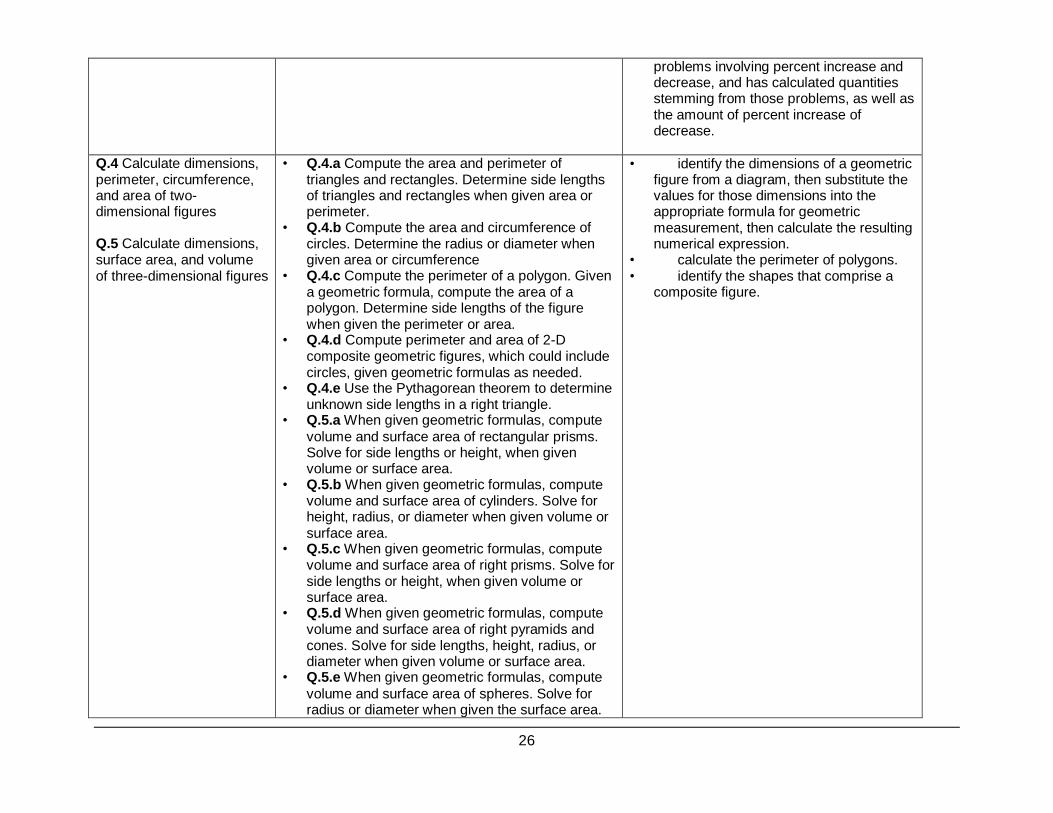
problems involving percent increase and decrease, and has calculated quantities stemming from those problems, as well as the amount of percent increase of decrease.
Q.4 Calculate dimensions, perimeter, circumference, and area of two-dimensional figures Q.5 Calculate dimensions, surface area, and volume of three-dimensional figures
• Q.4.a Compute the area and perimeter of triangles and rectangles. Determine side lengths of triangles and rectangles when given area or perimeter.
• Q.4.b Compute the area and circumference of circles. Determine the radius or diameter when given area or circumference
• Q.4.c Compute the perimeter of a polygon. Given a geometric formula, compute the area of a polygon. Determine side lengths of the figure when given the perimeter or area.
• Q.4.d Compute perimeter and area of 2-D composite geometric figures, which could include circles, given geometric formulas as needed.
• Q.4.e Use the Pythagorean theorem to determine unknown side lengths in a right triangle.
• Q.5.a When given geometric formulas, compute
volume and surface area of rectangular prisms. Solve for side lengths or height, when given volume or surface area.
• Q.5.b When given geometric formulas, compute volume and surface area of cylinders. Solve for height, radius, or diameter when given volume or surface area.
• Q.5.c When given geometric formulas, compute volume and surface area of right prisms. Solve for side lengths or height, when given volume or surface area.
• Q.5.d When given geometric formulas, compute volume and surface area of right pyramids and cones. Solve for side lengths, height, radius, or diameter when given volume or surface area.
• Q.5.e When given geometric formulas, compute
volume and surface area of spheres. Solve for radius or diameter when given the surface area.
• identify the dimensions of a geometric figure from a diagram, then substitute the values for those dimensions into the appropriate formula for geometric measurement, then calculate the resulting numerical expression.
• calculate the perimeter of polygons. • identify the shapes that comprise a
composite figure.
27
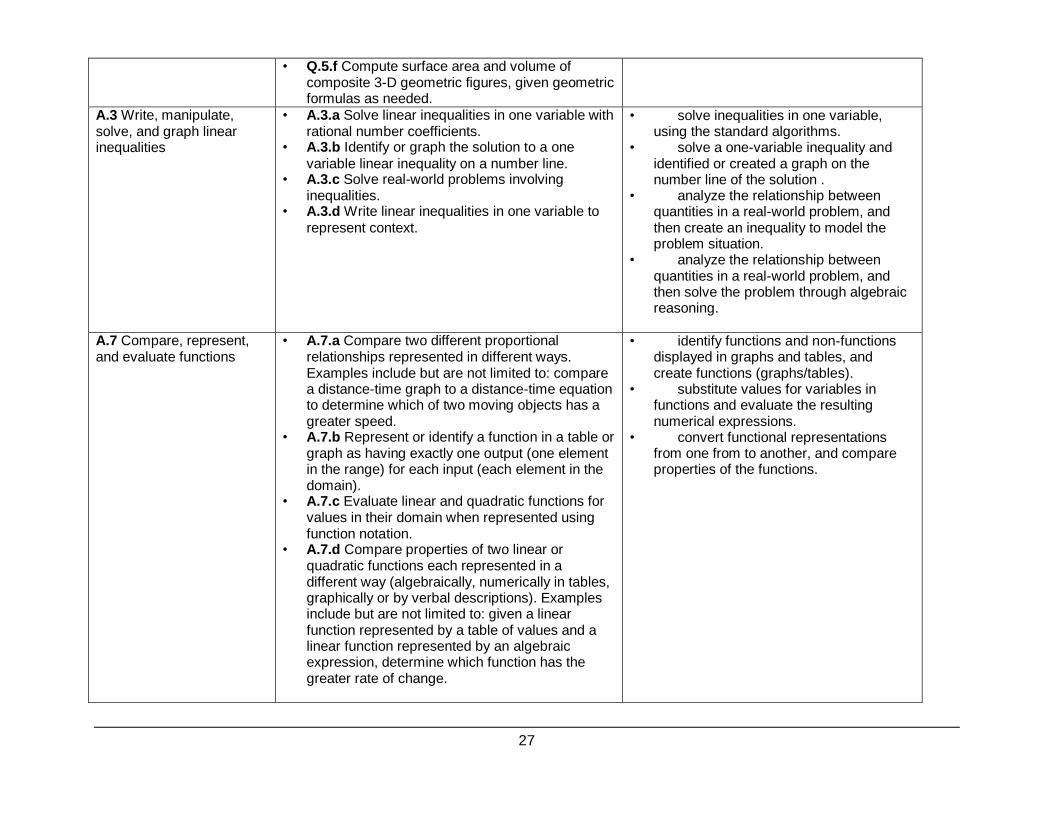
• Q.5.f Compute surface area and volume of composite 3-D geometric figures, given geometric formulas as needed.
A.3 Write, manipulate, solve, and graph linear inequalities
• A.3.a Solve linear inequalities in one variable with rational number coefficients.
• A.3.b Identify or graph the solution to a one
variable linear inequality on a number line. • A.3.c Solve real-world problems involving
inequalities. • A.3.d Write linear inequalities in one variable to
represent context.
• solve inequalities in one variable, using the standard algorithms.
• solve a one-variable inequality and identified or created a graph on the number line of the solution .
• analyze the relationship between quantities in a real-world problem, and then create an inequality to model the problem situation.
• analyze the relationship between quantities in a real-world problem, and then solve the problem through algebraic reasoning.
A.7 Compare, represent, and evaluate functions
• A.7.a Compare two different proportional relationships represented in different ways. Examples include but are not limited to: compare a distance-time graph to a distance-time equation to determine which of two moving objects has a greater speed.
• A.7.b Represent or identify a function in a table or graph as having exactly one output (one element in the range) for each input (each element in the domain).
• A.7.c Evaluate linear and quadratic functions for values in their domain when represented using function notation.
• A.7.d Compare properties of two linear or quadratic functions each represented in a different way (algebraically, numerically in tables, graphically or by verbal descriptions). Examples include but are not limited to: given a linear function represented by a table of values and a linear function represented by an algebraic expression, determine which function has the greater rate of change.
• identify functions and non-functions displayed in graphs and tables, and create functions (graphs/tables).
• substitute values for variables in functions and evaluate the resulting numerical expressions.
• convert functional representations from one from to another, and compare properties of the functions.