gee user handbook - university of south carolina · gee user handbook 1. about this manual 2. what...
TRANSCRIPT

GEE User Handbook
1. About this Manual
2. What is GEE?
3. System Requirements
4. Downloading GEE
5. Installing GEE
6. Getting Acquainted with GEE 6.a Starting GEE
6.b The Main Screen
6.c Internet Connection
6.d Looking at Seismograms
6.e Features
7. Exploring with GEE 7.a Recent Earthquakes
7.b Older Earthquakes
7.c Regional “Hot Spots”
7.d The Seismograph Day-Viewer
7.e The Real-Time Viewer
7.f Importing other data
8. Structured Learning Modules in GEE
9. Appendix A: Installation Issues
10. Appendix B: Internet Issues
11. Quick Reference Guide
12. Acknowledgements

2
1. About this Manual The purpose of this manual is to help to get new
users started with the Global Earthquake Explorer. It is
an ever-evolving document. Currently, it includes just
the basics, but GEE’s more advanced features will be
documented in the manual over time. If you simply
can't wait, feel free to start pressing buttons and
exploring! Once you are familiar with the basic
functions and behavior of GEE, the more advanced
options will start making sense!
What to expect:
First, you will be instructed on how to download
and install the program. Then, you will get acquainted
with the basics of GEE. After you feel comfortable
with the basics, you will explore with some of GEE’s
more advanced features. Next, you will learn about
GEE’s Structured Learning Modules. The last section
of the manual consists of the appendices, which will
help you with any problems you may be having with
the installation of the program or with your internet
connection. The GEE Manual also includes a Quick
Reference Guide, which lists the most important tools
you will use in the program and their functions.
This version of the GEE Manual is intended for use
with Version 2.1.4 of the program. Be advised that
later versions of GEE may include features not
discussed in this manual. For updates on the manual
and information about GEE releases, visit
http://www.seis.sc.edu/GEE.

3
2. What is GEE? The Global Earthquake Explorer (GEE) is a program
designed to allow you to access, view, and analyze
earthquake seismograms recorded throughout the
world. Within minutes of a significant earthquake
anywhere in the world, seismograms of that earthquake
are transmitted to central recording facilities for
analysis by professional seismologists. GEE accesses
these same data sources and provides an intuitive, map-
based interface, which allows even novices to easily
select the earthquakes and seismograph stations of their
choice. GEE then uses the Internet to deliver
seismograms to the user’s computer with a single click
of a mouse. This is the obvious software of choice for
students, teachers, and amateur seismologists who are
curious about earthquakes. It is also a teaching tool,
designed with education in mind, and offers teachers a
simple and fun way to introduce their students to the
world of seismology. GEE includes several Structured
Learning Modules that help to develop an elementary
understanding of the physical principles behind
earthquakes and seismology.
GEE accesses worldwide data primarily through the
archives of the IRIS Data Management Center in
Seattle. Seismograms in this archive are from stations
around the world operated by many different
institutions. IRIS, the U.S. Geological Survey, and
their equivalents in other countries are the primary
contributors. In addition, regional seismograph
networks in earthquake-prone regions such as
California, Washington, and Utah contribute data
available through GEE.
Figure 1 How GEE Gathers Data

4
3. System Requirements: GEE runs on most major computer operating
systems, including Microsoft Windows and Apple
OSX. In the main text of this handbook, we cover only
the Microsoft Windows system and installation
requirements. Information for other systems can be
found in Appendix A.
A high-speed data connection is recommended
under all Operating Systems. All of GEE’s features can
work over a dial-up Internet connection, but
performance may be seriously compromised. The
Structured Learning Modules (described later) are self-
contained within GEE and do not require an Internet
connection. This allows these learning modules to be
reliably used in a classroom setting even when the
Internet goes out (a rare occurrence in schools!).
PC Hardware Requirements:
Windows® 98 or higher
200Mhz Pentium® or better processor
32Mbytes RAM
60Mbytes free Hard Drive space
4. Downloading GEE 1. Go to www.seis.sc.edu/GEE. This site will have up-to-
date information on recent changes to GEE. For
now, all you need to do is:
2. Click the Downloads button in the upper right hand
corner of the web pages*. You should then be
looking at a web page that looks like the one shown
in Figure 2 to the right.
3. Choose the version of GEE for your operating
system (Windows, Mac, or Unix/Linux).
4. Next, you will be asked to save the file to disk.
Click OK and you have successfully downloaded
GEE.
*You can also get GEE via CD-ROM. Simply e-mail
[email protected] with your request.
Figure 2 Downloading from the GEE Website

5
5. Installing GEE:
PC:
If you are going to be using GEE on a school
system, you may need to have your system
administrator give you permission to install it.
1. Once you have the installer, double click the
gee_install.exe file (as seen in Figure 3) that
should be on your desktop.
2. The GEE installer (Figure 4) will guide you
through the installation process. If at any point
during the install process you are unsure what the
installer is asking you, the default settings should
be used. It is suggested that you quit all other
programs before installing because at the end of the
installation you may be prompted to restart your
computer in order to apply all of the changes you
have made to your system.
Figure 3 Installer Icon
Figure 4 Introduction to the Install Process

6
3. It is recommended that you install a Java Virtual
Machine specifically for GEE when prompted. This
is the default for this screen. If you choose to use a
pre-existing Java VM, be sure that it is version
1.4.1_03 or newer.
4. The GEE installer will next ask where you want
to install GEE on your hard drive. The default
setting is C:\Program Files\GEE.
Figure 5 Choosing a Java VM
Figure 6 Choosing Where to Install

7
5. The installer also will ask you where you want
shortcuts placed. For the purposes of this manual,
we will assume that you have placed a shortcut in
the Start menu.
6. After all GEE files have been copied to your
hard drive, the GEE installer will look on your
computer for a Microsoft software package called
“DirectX”. DirectX is simply a technology
developed by Microsoft that facilitates the
displaying of multimedia elements such as full-
color graphics, video, and 3-D animation on your
computer. If the installer finds that DirectX needs
to be updated on your system, it will attempt to do
so. Once DirectX is updated, it will ask you to
restart your computer so that the changes can be
applied. If for any reason you have trouble
installing DirectX, please refer to Appendix A.
Also, you should understand that the Particle
Motion Animation (seen in Figure 8) is the only
component of GEE that uses DirectX so if you face
insurmountable obstacles while attempting to
update DirectX, all is not lost. The Particle Motion
Animation is used in the Longitudinal and
Transverse Waves Learning Module, however, you
will be able to use most of this module and the rest
of GEE without DirectX. You can find the Particle
Motion Animation demo by clicking on Explore
Recent Earthquakes in the Main Screen, then by
selecting Tools from the menu at the top of the
screen, then Particle Motion Animation Demo. If
you need to know how to install GEE under other
operating systems, have any problems during the
install, or need help installing DirectX, please refer
to Appendix A.
Figure 7 Choosing Shortcuts
Figure 8 Particle Motion Animation

8
6. Getting Acquainted with GEE
6.a Starting GEE
As stated earlier, this manual assumes that you
have chosen to place a shortcut in the start menu.
If you did this, simply open the start menu and
select the GEE folder from the program list. Then
select the GEE application to start. This process is
shown in Figure 9.
If you chose to install a shortcut on your
desktop, simply double click the GEE icon, which
will look like the one in Figure 10. If you do not
have an icon on your desktop and would like one,
simply right-click on the program in the start menu
and choose “create shortcut” from the menu that
pops up. The new shortcut should appear at the
bottom of your program list window. Now click
on it and drag it to your desktop.
Figure 9 Starting GEE from the Start Menu
Figure 10 GEE Desktop Icon

9
6.b The Main Screen
The first screen you will see is the Main
Screen. This is where you will choose what you
would like to do with the program. You can return
to this screen at any time during your GEE session
by selecting from the File menu “Reset the Global
Earthquake Explorer.”
Activities in GEE are divided into two categories:
1. “Curiosity-driven” data exploration
2. Structured Learning Modules
Curiosity-driven data exploration describes the
top four activities on this main screen (shown in
red in Figure 11). These require an active internet
connection.
These activities are described as follows:
Explore Recent Earthquakes: Access and explore
seismograms for recent earthquakes anywhere in
the world.
Explore a Regional “Hot Spot”: Go directly to a spot in
the world known for active seismicity.
Seismograph Day Viewer: View an entire day of data
from an individual seismograph station.
Real Time Viewer: Watch ground motion at
seismograph stations anywhere in the world in real-
time!
Figure 11 The Main Screen: Curiosity-Driven Data Exploration

10
The last three activities on the Main Screen are
Structured Learning Modules (shown in red in
Figure 12), designed to address specific Physical
and Earth Science standards. They have been
developed and tested in high schools throughout
South Carolina as part of the South Carolina Earth
Physics Project and are well-suited for a classroom
environment. These options do not require an
active Internet connection.
These modules are described as follows:
Intro to GEE Module: Structured learning module for
examining wave properties using a classic
earthquake.
Detecting the Layered Earth Module: Structured
learning module that allows students to discover
Earth’s structure using a classic earthquake.
Longitude and Transverse Waves Module: Structured
learning module that explores the difference
between P-waves and S-waves using a classic
earthquake.
Figure 12 The Main Screen: Structured Learning Modules

11
6.c Internet Connection
An active Internet connection is highly
recommended for using GEE. Without one, you
will still be able to run the Structured Learning
Modules (last three Main Screen items), but you
will be unable to access recent earthquakes (first
three Main Screen items). To check your Internet
connection within GEE, click on the Help menu at
the top of the Main Screen and then choose
Connection Status (demonstrated in Figure 13).
If you are experiencing firewall problems,
your Connection Status box will look like Figure
14. Your system administrator should be able to
resolve the problem. Information in Appendix B
will help him/her make the necessary firewall
modifications.
If you are experiencing problems with your
local network connection, you will see red dots
next to the listed servers as seen in Figure 15.
This means that your internet connection is
currently down.
Figure 13 Checking Internet Connection Status
Figure 14 Firewall Problem Figure 15 Local Network Problem

12
6.d Looking at Seismograms
Now we are ready to look at some
seismograms! In order to get some seismic
information onto the display, open Explore Recent
Earthquakes from the Main Screen. The locations of
all noteworthy earthquakes in the last week are
shown as colored circles in the World Map tab.
The size of the circle is related to the magnitude of
the earthquake. The color of the circle is related to
the depth of the earthquake*. Details about these
earthquakes are displayed in the information bar at
the bottom of the display when you “roll over”
them with your mouse. This feature is shown
enlarged in Figure 16. The largest earthquake is
selected by default. You may select another
earthquake with your mouse by clicking within that
earthquake’s colored circle. When an earthquake
is selected, the purple-shaded lines, circles and arcs
on the screen illustrate distances from that
earthquake. The distances are given in degrees of
arc, which is the common way of measuring
distance on a sphere. 30 Degrees is approximately
3,335 km.
*The Help screen, which contains a Map Key,
(seen in Figure 17) can help you until you have
memorized what the colors mean. In order to turn
on the Help and Map Key, simply click on the help
icon at the top of your screen. To turn it off,
click it again.
Figure 16 The Information Bar Shows Earthquake Information When the Mouse Scrolls over
the Event Circle
Figure 17 The Help Screen with Map Key
13
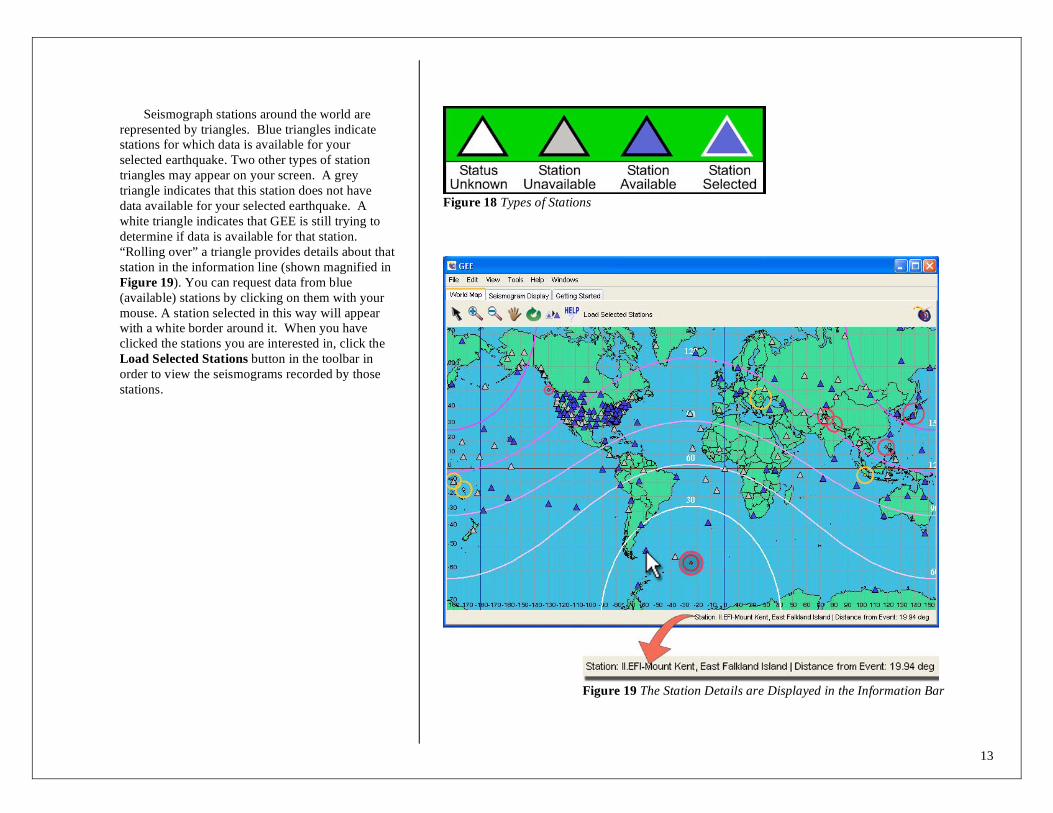
Seismograph stations around the world are
represented by triangles. Blue triangles indicate
stations for which data is available for your
selected earthquake. Two other types of station
triangles may appear on your screen. A grey
triangle indicates that this station does not have
data available for your selected earthquake. A
white triangle indicates that GEE is still trying to
determine if data is available for that station.
“Rolling over” a triangle provides details about that
station in the information line (shown magnified in
Figure 19). You can request data from blue
(available) stations by clicking on them with your
mouse. A station selected in this way will appear
with a white border around it. When you have
clicked the stations you are interested in, click the
Load Selected Stations button in the toolbar in
order to view the seismograms recorded by those
stations.
Figure 18 Types of Stations
Figure 19 The Station Details are Displayed in the Information Bar
14
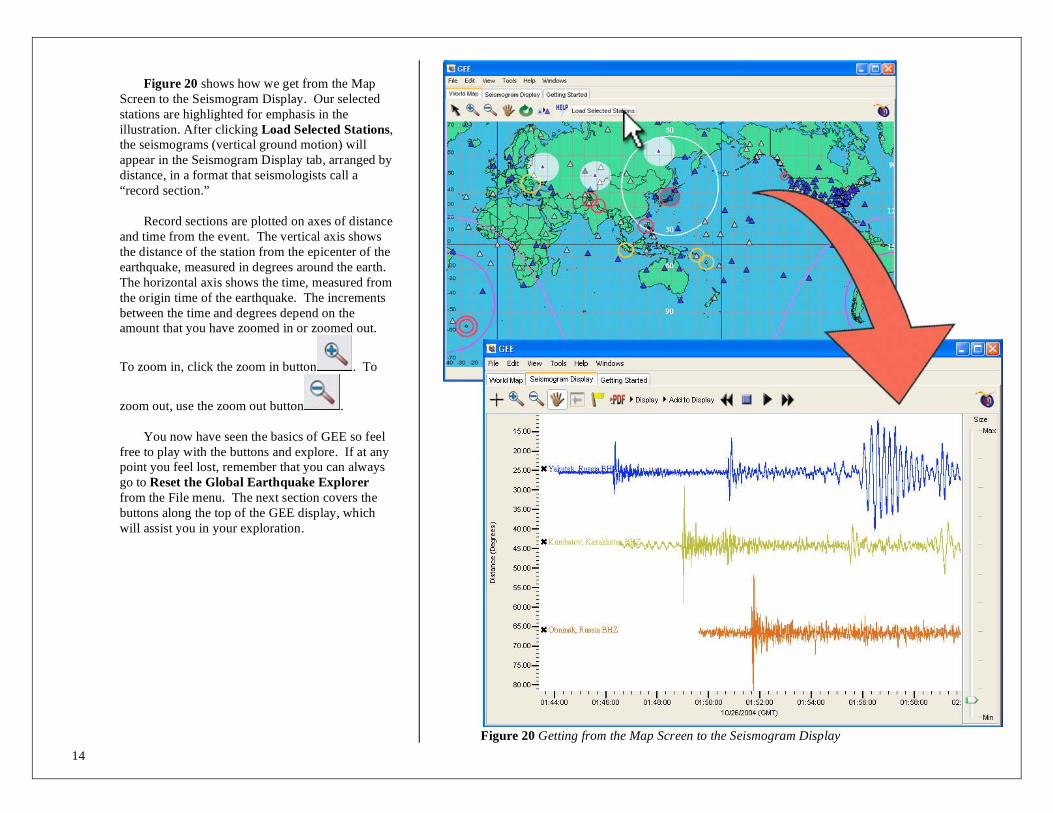
Figure 20 shows how we get from the Map
Screen to the Seismogram Display. Our selected
stations are highlighted for emphasis in the
illustration. After clicking Load Selected Stations,
the seismograms (vertical ground motion) will
appear in the Seismogram Display tab, arranged by
distance, in a format that seismologists call a
“record section.”
Record sections are plotted on axes of distance
and time from the event. The vertical axis shows
the distance of the station from the epicenter of the
earthquake, measured in degrees around the earth.
The horizontal axis shows the time, measured from
the origin time of the earthquake. The increments
between the time and degrees depend on the
amount that you have zoomed in or zoomed out.
To zoom in, click the zoom in button . To
zoom out, use the zoom out button .
You now have seen the basics of GEE so feel
free to play with the buttons and explore. If at any
point you feel lost, remember that you can always
go to Reset the Global Earthquake Explorer
from the File menu. The next section covers the
buttons along the top of the GEE display, which
will assist you in your exploration.
Figure 20 Getting from the Map Screen to the Seismogram Display

15
6.e Features
This section covers the tools you will use most
often while exploring with GEE. First, we will look
at the tools you will use while in the Map View.
They can be found in the tool-bar at the top of the
GEE window (enlarged in Figure 21) in the Explore
Recent Earthquakes section.
Arrow Cursor: Use the Arrow Cursor to select or
de-select stations and events from the world map.
Zoom In: Click on the Zoom In icon and then click
on the map anywhere to expand your view of that area.
Zoom Out: Click on the Zoom Out icon and click on
the map anywhere to reduce your view of that area.
Hand Tool: Click on the Hand Tool, then click on the
map and hold to move the map by dragging it.
Reset View: Clicking this will restore the map zoom
to the default and will center the view on your selected
event.
Unselect Stations: Clicking this will Unselect all
selected stations.
Help Button: This button will toggle between
showing brief help text and the map key and hiding it (see
Figure 17 for a view of the Help Screen and Map Key).
Figure 21 Map Screen Tools

16
Now we will cover the tools that can be found
in the Seismogram Display tab. These tools can be
seen at the top of Figure 22. You will notice that
three of the tools are the same ones used in the
Map View, but their uses will vary slightly now
that we are in the Seismogram Display window.
Crosshair: The Crosshair can be used for
multiple tasks. It is described in detail in the following
section.
Zoom In: Click on the Zoom In icon and then
click anywhere in the seismic display window to get a
closer view of the seismograms.
Zoom Out: Click on the Zoom Out icon and then
click anywhere in the seismic display window in order
to get a more distant view.
Hand Tool: Click on the Hand Tool, then click on
the seismic display and hold to move the display by
dragging it.
Pick Zone: The Pick Zone will be inactive when
you are displaying a Record Section. It will be
described later when you learn how to use GEE’s other
seismogram displays.
Flag Tool: Click the Flag Tool then click on a
seismogram in order to mark a special time.
Convert to .PDF: Click the Convert to .PDF
button to save your current display as a .PDF file for
printing.
Figure 22 Seismogram Display Tools

17
Crosshair: The Crosshair tool is useful
only for approximation of distance and time from
the beginning of the selected event when we are
simply viewing a record section in the
Seismogram Display tab. However, it can tell us
more precise data when we change our display to
show individual traces or if we choose to overlay
our traces. In order to do this, click the Display
tab at the top of the screen. An example of what
this will look like can be seen in Figure 23. The
options shaded light gray in Figure 23 are the
display options for which the Crosshair tool can
show exact amplitude and time readings. Now we
will see an example of exactly what the Crosshair
tool can do in Figure 24.
For the purposes of this example, we have
chosen to plot our seismograms as individual
traces in alphabetical order. This is one of the
many display options that will work for the
Crosshair tool. Once you have your display set,
click the Crosshair tool and place the mouse
anywhere within the seismic display. You will
see two red pointers and a reading for the
Amplitude and Time (both enlarged in Figure 24
for emphasis). The Crosshair allows you to see
the exact amplitude and time for a specific point
on the seismogram.
Figure 23 Display Options and the Crosshair Tool
Figure 24 Using the Crosshair Tool to Find Amplitude and Time
18
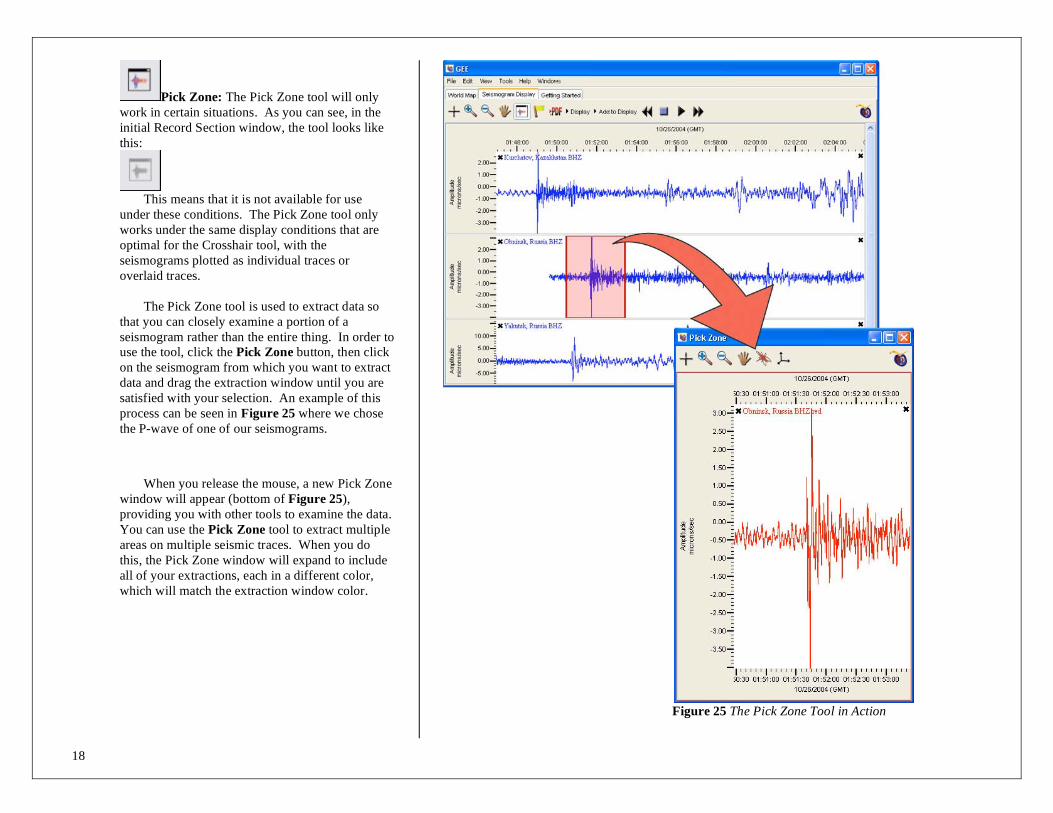
Pick Zone: The Pick Zone tool will only
work in certain situations. As you can see, in the
initial Record Section window, the tool looks like
this:
This means that it is not available for use
under these conditions. The Pick Zone tool only
works under the same display conditions that are
optimal for the Crosshair tool, with the
seismograms plotted as individual traces or
overlaid traces.
The Pick Zone tool is used to extract data so
that you can closely examine a portion of a
seismogram rather than the entire thing. In order to
use the tool, click the Pick Zone button, then click
on the seismogram from which you want to extract
data and drag the extraction window until you are
satisfied with your selection. An example of this
process can be seen in Figure 25 where we chose
the P-wave of one of our seismograms.
When you release the mouse, a new Pick Zone
window will appear (bottom of Figure 25),
providing you with other tools to examine the data.
You can use the Pick Zone tool to extract multiple
areas on multiple seismic traces. When you do
this, the Pick Zone window will expand to include
all of your extractions, each in a different color,
which will match the extraction window color.
Figure 25 The Pick Zone Tool in Action

19
7. Exploring with GEE
7.a Recent Earthquakes
To view recent earthquakes, select Explore Recent
Earthquakes from GEE’s intro screen. The world
map will appear. Your map will look different
than these examples due to GEE’s dynamic nature.
The map will show you all the seismic events from
the past week that are considered noteworthy by
the United States Geological Survey (USGS). They
will be marked with a red, orange, or yellow circle.
The largest of these events is automatically
selected. If you would like to select a different
event, click it and the map will re-center on that
event. Next, select several seismograph stations.
For the purpose of this manual we have selected a
seismic station on the Marianas Islands in Guam
and one in Taipei, Taiwan (highlighted in Figure
26). Remember, only stations that are blue will
have information for the selected earthquake. To
view the seismograms from these stations click on
the Load Selected Stations button in the toolbar.
Figure 26 Selecting Stations to View Recent Earthquakes

20
A seismograph from each selected station will
appear in a new tab with a different color assigned
to each trace (as in Figure 27). In this window you
can view the seismic traces in a record section. The
slider along the right side of the window will allow
you to change the size of the traces. Figure 27
shows the seismograms at their maximum
amplitude while Figure 28 shows the traces at the
minimum amplitude. The amplitude slider is
circled in both figures to demonstrate its position
relative to the size of the traces. The black “X”
next to the name of each seismogram allows you to
remove the seismograms one at a time. Simply
click on the X and the unwanted seismogram will
disappear.
Figure 27 Seismograms at Maximum Amplitude
Figure 28 Seismograms at Minimum Amplitude

21
We will now explore the Display menu
(Figure 29), which can be found on the toolbar at
the top of the Seismogram Display window. We
discussed this feature of GEE briefly when we
covered the Crosshair and Pick Zone tools. The
Display menu is a good place to explore, and
understanding it will help you to get the most out
of your data. It allows you to display the data in
different ways, such as overlaying it or splitting it
into separate windows.
This menu also allows you to Overlay Travel
Times which appear as labeled flags for the Origin,
the P-wave, and the S-wave for each event.
Is the Seismogram trace not reaching the edge
of the screen? Click on the Fill Display with Data
dog and GEE will get enough data to fill the rest of
the window.
If at any time you would like to clear the
Seismogram Display Window and start over, click
Clear Display.
If you have done a lot of zooming in or out
and would like to return to the original zoom, click
Reset Zoom.
Remember the Pick Zone tool from before? If
you would like to get rid of the extraction windows
you placed on the Seismogram Display with this
tool, simply click Clear Tag(s) and they will be
removed.
Now we will discuss displaying the seismic
data as individual traces.
Figure 29 The Display Menu
22
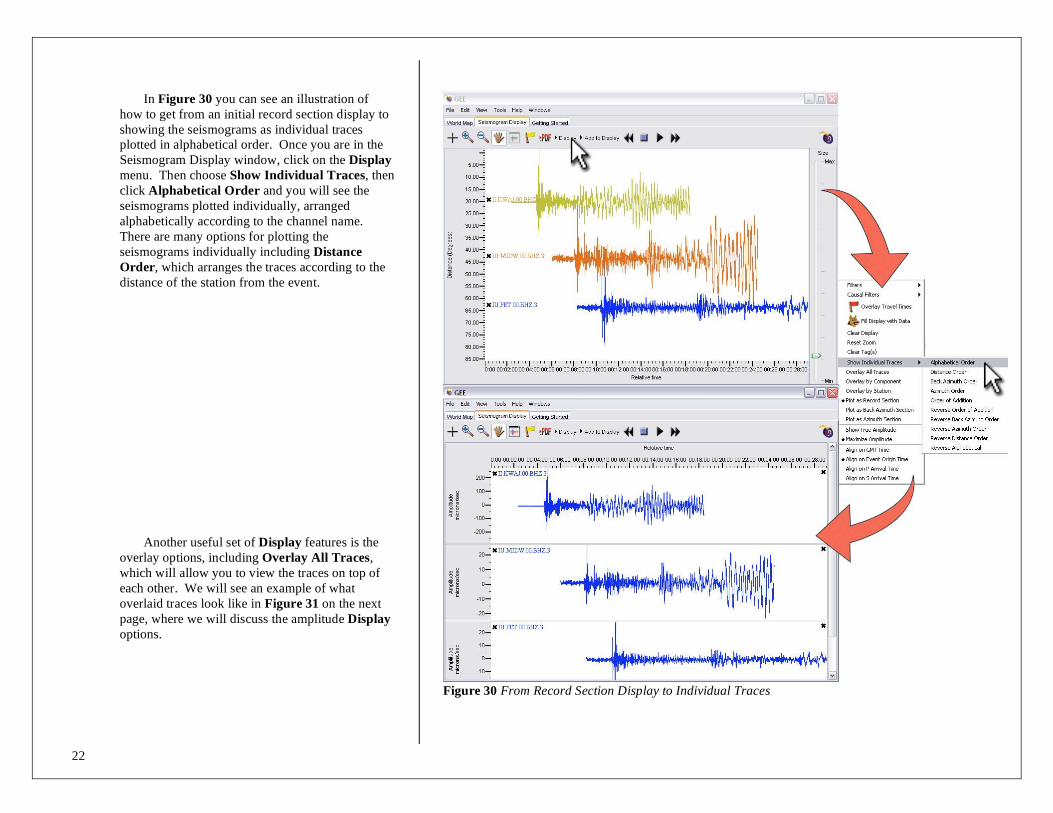
In Figure 30 you can see an illustration of
how to get from an initial record section display to
showing the seismograms as individual traces
plotted in alphabetical order. Once you are in the
Seismogram Display window, click on the Display
menu. Then choose Show Individual Traces, then
click Alphabetical Order and you will see the
seismograms plotted individually, arranged
alphabetically according to the channel name.
There are many options for plotting the
seismograms individually including Distance
Order, which arranges the traces according to the
distance of the station from the event.
Another useful set of Display features is the
overlay options, including Overlay All Traces,
which will allow you to view the traces on top of
each other. We will see an example of what
overlaid traces look like in Figure 31 on the next
page, where we will discuss the amplitude Display
options.
Figure 30 From Record Section Display to Individual Traces

23
The two Display options available concerning
amplitude are Show True Amplitude and
Maximize Amplitude.
Maximize Amplitude is the default setting for
the Seismic Display. It stretches all the traces to
fill their windows vertically. This is useful when
you want to see the maximum amount of detail in
your traces.
Show True Amplitude puts all of the traces
on the same scale, allowing comparison between
them. In order to display your data in this way,
click the Display menu, then click Show True
Amplitude.
At the bottom of the Display menu, you will
see options for aligning the seismograms according
to time. Click on these to align according to GMT,
event origin, P-wave arrival, or S-wave arrival
time.
As you can see, the Display menu is a good
place to explore since there are many options,
many of which can be combined. For example, in
Figure 31 we used Overlay All Traces, Show
True Amplitude, and Align on Event Origin
Time to produce the end result.
Figure 31 Maximum Amplitude vs. True Amplitude

24
7.b Older Earthquakes
To view older earthquakes, select Explore Recent
Earthquakes from GEE’s intro screen. After the
world map appears, select from the Edit menu:
Earthquake – Noteworthy Earthquakes
(Figure32).
Figure 32 How to Find Noteworthy Earthquakes
25
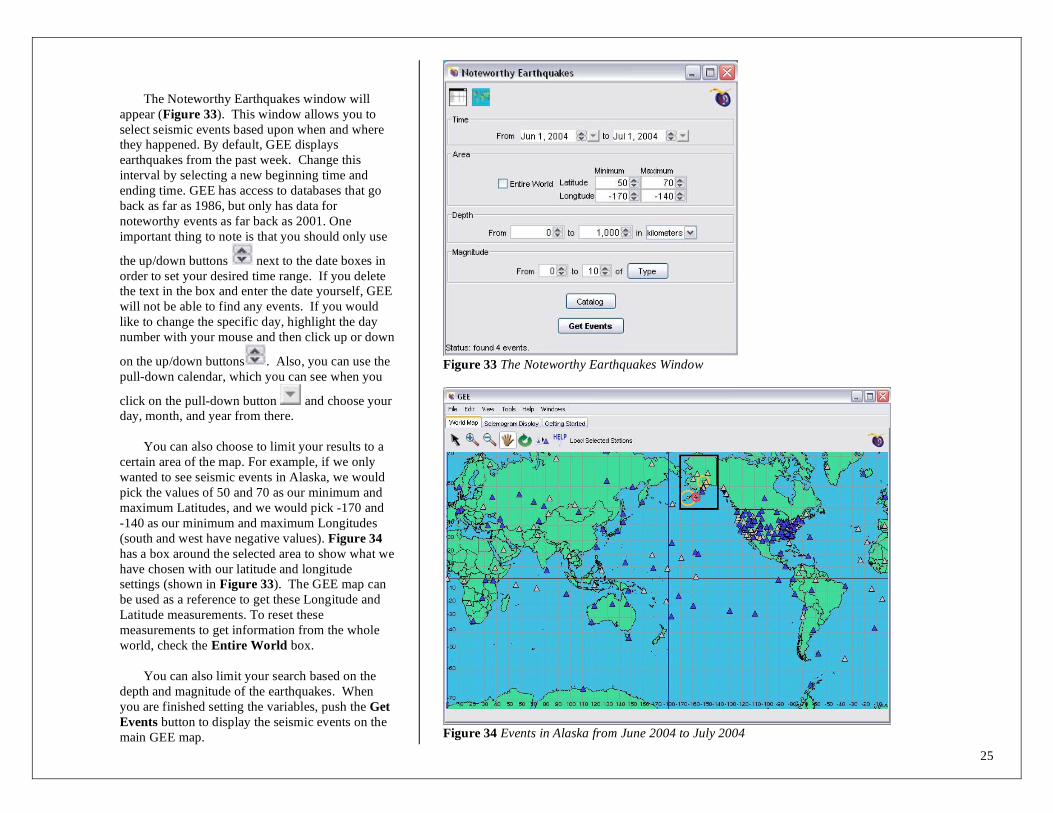
The Noteworthy Earthquakes window will
appear (Figure 33). This window allows you to
select seismic events based upon when and where
they happened. By default, GEE displays
earthquakes from the past week. Change this
interval by selecting a new beginning time and
ending time. GEE has access to databases that go
back as far as 1986, but only has data for
noteworthy events as far back as 2001. One
important thing to note is that you should only use
the up/down buttons next to the date boxes in
order to set your desired time range. If you delete
the text in the box and enter the date yourself, GEE
will not be able to find any events. If you would
like to change the specific day, highlight the day
number with your mouse and then click up or down
on the up/down buttons . Also, you can use the
pull-down calendar, which you can see when you
click on the pull-down button and choose your
day, month, and year from there.
You can also choose to limit your results to a
certain area of the map. For example, if we only
wanted to see seismic events in Alaska, we would
pick the values of 50 and 70 as our minimum and
maximum Latitudes, and we would pick -170 and
-140 as our minimum and maximum Longitudes
(south and west have negative values). Figure 34
has a box around the selected area to show what we
have chosen with our latitude and longitude
settings (shown in Figure 33). The GEE map can
be used as a reference to get these Longitude and
Latitude measurements. To reset these
measurements to get information from the whole
world, check the Entire World box.
You can also limit your search based on the
depth and magnitude of the earthquakes. When
you are finished setting the variables, push the Get
Events button to display the seismic events on the
main GEE map.
Figure 33 The Noteworthy Earthquakes Window
Figure 34 Events in Alaska from June 2004 to July 2004
26
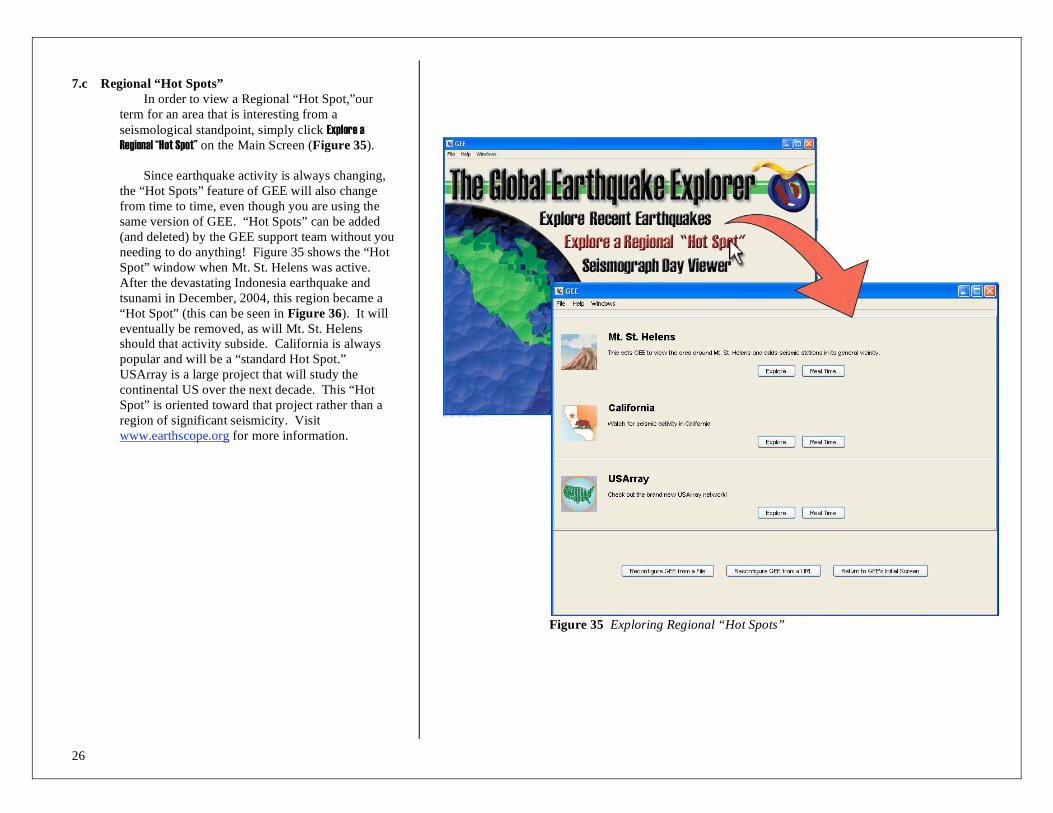
7.c Regional “Hot Spots”
In order to view a Regional “Hot Spot,”our
term for an area that is interesting from a
seismological standpoint, simply click Explore a
Regional “Hot Spot” on the Main Screen (Figure 35).
Since earthquake activity is always changing,
the “Hot Spots” feature of GEE will also change
from time to time, even though you are using the
same version of GEE. “Hot Spots” can be added
(and deleted) by the GEE support team without you
needing to do anything! Figure 35 shows the “Hot
Spot” window when Mt. St. Helens was active.
After the devastating Indonesia earthquake and
tsunami in December, 2004, this region became a
“Hot Spot” (this can be seen in Figure 36). It will
eventually be removed, as will Mt. St. Helens
should that activity subside. California is always
popular and will be a “standard Hot Spot.”
USArray is a large project that will study the
continental US over the next decade. This “Hot
Spot” is oriented toward that project rather than a
region of significant seismicity. Visit
www.earthscope.org for more information.
Figure 35 Exploring Regional “Hot Spots”
27
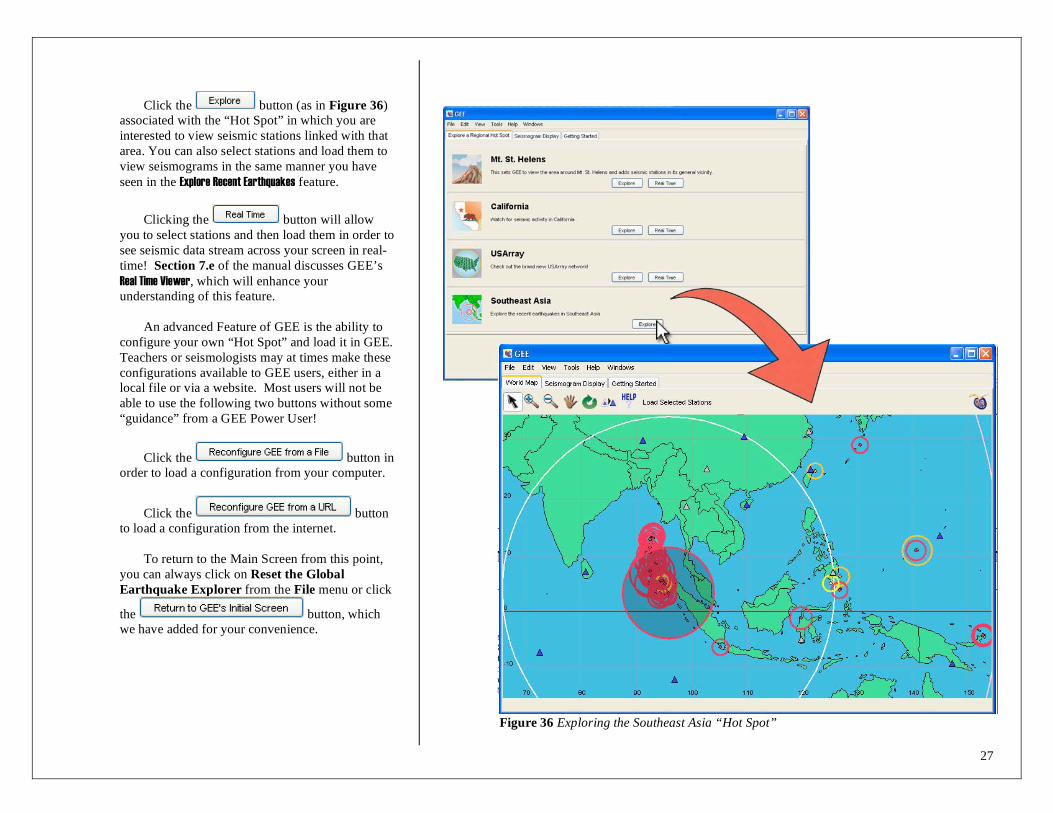
Click the button (as in Figure 36)
associated with the “Hot Spot” in which you are
interested to view seismic stations linked with that
area. You can also select stations and load them to
view seismograms in the same manner you have
seen in the Explore Recent Earthquakes feature.
Clicking the button will allow
you to select stations and then load them in order to
see seismic data stream across your screen in real-
time! Section 7.e of the manual discusses GEE’s
Real Time Viewer, which will enhance your
understanding of this feature.
An advanced Feature of GEE is the ability to
configure your own “Hot Spot” and load it in GEE.
Teachers or seismologists may at times make these
configurations available to GEE users, either in a
local file or via a website. Most users will not be
able to use the following two buttons without some
“guidance” from a GEE Power User!
Click the button in
order to load a configuration from your computer.
Click the button
to load a configuration from the internet.
To return to the Main Screen from this point,
you can always click on Reset the Global
Earthquake Explorer from the File menu or click
the button, which
we have added for your convenience.
Figure 36 Exploring the Southeast Asia “Hot Spot”

28
7.d The Seismograph Day-Viewer
To get started, click on Seismograph Day Viewer on
the GEE Main Screen (Remember, you can return
to the GEE Main Screen at any time by selecting
Reset the Global Earthquake Explorer from the
File menu). Then go to the “Station Map” tab and
choose one of the stations indicated by a blue
triangle. At the time this manual was produced,
only seismic stations within the SCEPP (South
Carolina Earth Physics Project) were available in
the Day Viewer. However, like the “Hot Spot”
display, the Day Viewer can be reconfigured
remotely. It could be that when you launch GEE,
Day Views of global stations will be available!
Selecting a station will switch to the Day
Viewer Display and show the vertical ground
motion at your selected station for today. If any
earthquakes occurred on the day displayed, a list of
those events appears on the top of the Day Viewer
Display. The origin time of the earthquake
(“Origin” flag), and the P- and S-wave arrival
times are displayed on the seismogram in the same
color as the text of the event. The Amplitude slider
along the top of this screen will change how large
the trace appears, and the Spacing slider will
change how far apart the traces are drawn.
Figure 37Using the Seismograph Day Viewer

29
“Rolling over” the earthquake name at the top
of the display will cause a red extraction window to
appear (seen in Figure 38). Clicking on the
earthquake name will lock the extraction window
into the display. You can then adjust the size of
the window with your cursor. Next, click the
Extract button. This will cause that portion of the
seismogram to appear in a new Seismogram
Display Tab (Figure 39).
You can more closely examine any portion of
the seismic display by clicking the Select Data
button at the top of the screen.
o You may adjust the date, ground motion
orientation, and display scales using the tools at the
top of the Day Viewer Display. However, if you
wish to view another station’s data, you must
return to the Station Map and select that station.
o You may also switch among selected stations from
the list at the top of the display. When changing
date, station, or orientation, you must click the
refresh button from the toolbar after you have set
your variables.
o If you leave the Day Viewer active, it will update
itself every 15 minutes.
Figure 38 Extracting Data
Figure 39 Extraction Data in a New Window
30
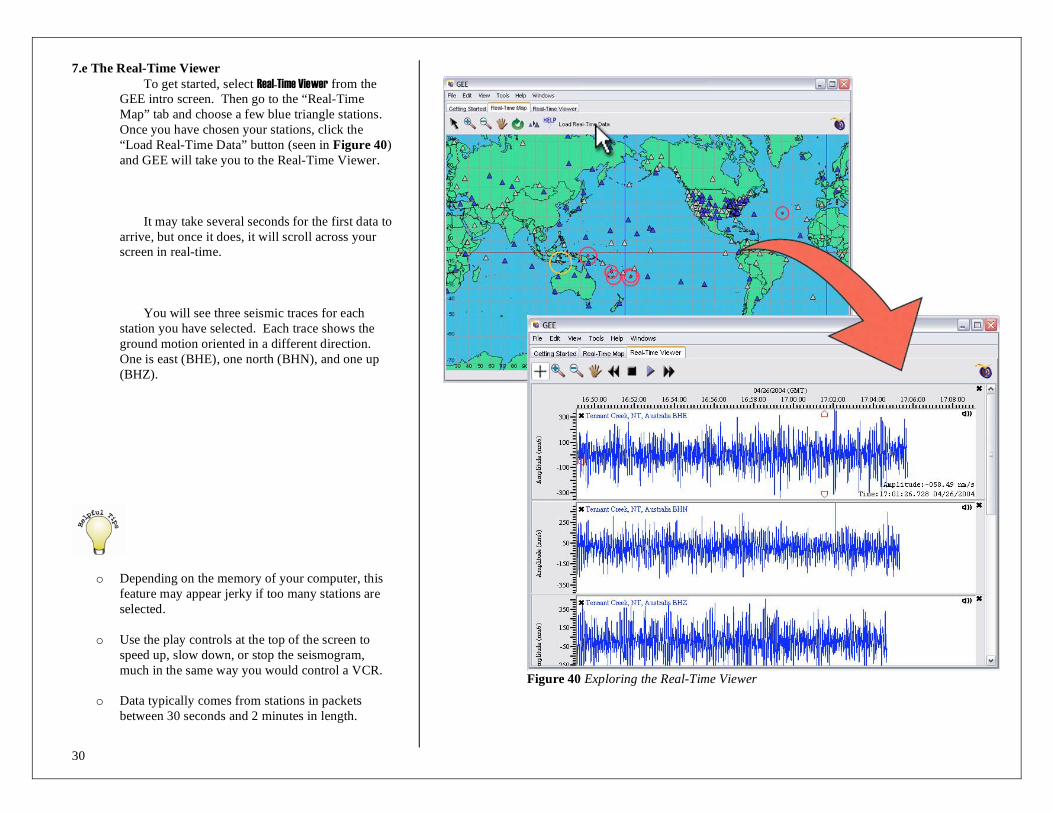
7.e The Real-Time Viewer
To get started, select Real-Time Viewer from the
GEE intro screen. Then go to the “Real-Time
Map” tab and choose a few blue triangle stations.
Once you have chosen your stations, click the
“Load Real-Time Data” button (seen in Figure 40)
and GEE will take you to the Real-Time Viewer.
It may take several seconds for the first data to
arrive, but once it does, it will scroll across your
screen in real-time.
You will see three seismic traces for each
station you have selected. Each trace shows the
ground motion oriented in a different direction.
One is east (BHE), one north (BHN), and one up
(BHZ).
o Depending on the memory of your computer, this
feature may appear jerky if too many stations are
selected.
o Use the play controls at the top of the screen to
speed up, slow down, or stop the seismogram,
much in the same way you would control a VCR.
o Data typically comes from stations in packets
between 30 seconds and 2 minutes in length.
Figure 40 Exploring the Real-Time Viewer

31
7.f Importing Other Data
Sometimes seismologists record interesting
seismic data that they have found in order to
demonstrate important geological principles. This
data is often used for educational purposes. GEE,
as we have seen, can be used to gather new and
current data, but it can also be used to view and
explore classic seismic data.
First, choose Explore Recent Earthquakes from the
Main Screen. Then, click on Load a Prepared
Data Set (refer to Figure 41) from the File menu
in order to select a file from the SCEPP Earthquake
Repository.
From this window (Figure 42), you can select
data from the folders, which are labeled based on
location and event times.
In order to open data files (.dsml format) that
have been saved on your computer, select Load a
Local Data Set from the File menu
To view data from an internet source, select
Load a Remote Data Set from the File menu and
type in the appropriate URL.
Figure 41 Importing Data: A Prepared Data Set
Figure 42 Loading a Prepared Data Set

32
To Load a SAC or PSN file from your
computer, select this option from the File menu
(seen in Figure 43). GEE will then allow you to
search through the files in your computer.
Once you have found the appropriate file,
double click on it (Figure 44) and the data will
appear in the seismogram display window.
Figure 43 Importing Data: Loading a SAC or PSN File
Figure 44 Choosing a SAC file to Load

33
8. Structured Learning Modules in GEE Three Structured Learning modules have been
included with all distributions of GEE. These
modules allow you to use GEE in a closely guided
environment with step-by-step instructions. These
exercises are intended for a classroom setting or for
first-time GEE users. To start a module, click on it
in the Main Screen. A brief explanation will appear
telling you what will be learned in this module
along with a button (enlarged in Figure 45) to
export detailed instructions and resources to your
hard drive. These resources will be in the form of
PDF (Portable Document Format) files, which can
be viewed and printed with the Adobe Reader or
any Adobe Acrobat program. If you do not already
have a version of Adobe Reader or Acrobat on
your computer, you can easily download it for free
from www.adobe.com/products/acrobat. The GEE
teaching material (also PDF documents) is
available once you have started each of the GEE
learning modules. Click on the Help menu and
select “Save Teacher Materials.”
The three Structured Learning modules are:
Intro to GEE Module: In this exercise you will use a
classic earthquake to learn about seismic wave
characteristics.
Detecting the Layered Earth Module: You will use a
classic earthquake to learn about the earth’s
structure based on variations in P-wave arrival
time.
Longitude and Transverse Waves Module: Learn the
differences between longitudinal and transverse
waves by examining the P-waves and S-waves of a
classic earthquake.
Figure 45 The Intro to GEE Structured Learning Module

34
9. Appendix A: Installation Issues
9a. What is this Appendix?
This Appendix will help you with any issues you may be having
while installing the Global Earthquake Explorer.
9b. Other Operating Systems
So you don’t have Windows on the computer you want to run GEE
on? Not a problem. GEE can be installed on any Mac OSX
computer as well as any Linux distribution with a Graphical User
Interface.
9b.1 Mac Installation
System Requirements:
OSX 10.2(Jaguar) required, OSX 10.3(Panther)
recommended
G3 Processor or better
32Megs of RAM
25Megs free Hard Drive space
1. Visit www.seis.sc.edu/gee to download the installer, or
send an email to [email protected] to receive GEE
via CD-ROM.
2. Click on the “downloads” button in the upper right
hand corner of the page.
3. Choose the Mac OSX version by clicking “self-
mounting disk image (18MB).”
4. Once you have the downloaded the Self-mounting disk
image, double click on the GEE.dmg.gz to unzip.
5. Drag the GEE program to your Applications Folder.
6. Double click on the box icon and follow the directions.
9b.2 Linux/Unix Installation
System Requirements:
X-Windows GUI capable of running Java
200 MHz Processor
32Megs of Ram
25Megs free Hard Drive space
1. Visit www.seis.sc.edu/gee to download the installer, or
send an email to [email protected] to receive GEE
via CD-ROM.
2. Click on the “downloads” button in the upper right hand
corner of the page.
3. Choose the Unix/Linux version by clicking
“tar.gz (20MB).”
4. Move the GEE.tar.gz file to the destination directory
<GEE DIR>
mv GEE.tar.gz <GEE DIR>
5. Change directory to the directory containing the
GEE.tar.gz.
cd <GEE DIR>
6. Un-zip the file using the tar command.
tar –xzf GEE.tar.gz
7. Run GEE by executing the GEE.sh inside the GEE
folder.

35
9c. DirectX
DirectX is a software package available for the Windows
operating system from Microsoft. The Global Earthquake
Explorer uses DirectX to render the Particle Motion
Animation Demo. If you find that installing DirectX on your
system is inconveniently difficult, you may skip it. The vast
majority of The Global Earthquake Explorer will function
properly but be aware that the Particle Motion Animation
Demo will be inaccessible to you. You can locate this
feature by choosing Explore Recent Earthquakes from the Main
Screen, then select Tools and click Particle Motion
Animation Demo (refer to Figure 46).
1. Go to www.microsoft.com/directx.
2. Within the “Quick Links” section select “DirectX9.0b
Runtime.”
3. Click the download button, and save this file to your
desktop.
4. On your desktop, double click the DXwebSetup, and
accept the User Agreement.
5. Follow the on-screen directions to finish installing
DirectX.
6. Once the installation is complete, DirectX will restart
your computer.
Figure 46 Particle Motion Animation Location

36
10. Appendix B: Internet Issues
10a. What is this Appendix?
This Appendix will help you with any issues you may be having
concerning your internet connection and the Global Earthquake
Explorer.
10b. Basic Internet Concerns
GEE uses the internet to access several databases of seismic
information. Without an internet connection several parts of GEE
will not function. The Learning Modules, however, were designed
to be used without an active internet connection. For the rest of
GEE, a high-speed internet connection will greatly enhance your
experience. If you have a dial-up connection you should be wary of
loading huge amounts of data. Selecting shorter time periods and
fewer stations at a time will allow you to make the most of your
connection.
10c.1 Working with your System Administrator
Like most System Administrators, yours is probably over-worked
and under-paid. As such, we will try to make his/her job easier.
Step-by-step installation instructions are included in the main body
of this manual. These directions are written for the beginning
computer user and should answer most of your installation
questions.
10c.2 Firewalls
Running GEE on school computers might cause a few
issues. Often, a system administrator will set up a firewall
to prevent illegal entry into your school’s system. This is a
good thing, but it sometimes errs on the side of caution, and
may prevent GEE from making outbound connections to our
servers. If you open GEE and go to Explore Recent Earthquakes
and the map appears blank with no station triangles or event
circles, you might be having firewall issues.
To check if this is the case, click on the Help menu and
choose Connection Status (see Figures 13-15). A small
window will pop up with green and red lights, telling you
what is active and what is inactive. If all the lights are red,
you are not connected to the internet. If the first light is red
and the other two are green, you are probably having a
firewall issue. Your system administrator will need to open
the ports used by GEE. Ask him/her to go to:
www.seis.sc.edu/wily/Check and open up the ports used by
IRIS and SCEPP (seen in Figure 47 with the ports column
highlighted for reference).
Figure 47 www.seis.sc.edu/wily/Check Showing Ports Location

37
11. Quick Reference Guide
You can view the Quick Reference Guide within the program or print
it out by following a few simple steps. First, choose Explore Recent
Earthquakes on the Main Screen. Once you are no longer on the Main
Screen, choose Help from the top menu. You should then see Quick
Reference Guide near the bottom of the menu. When you let the
mouse hover over this option, you will see that you can either View on
Screen or Export to PDF File for printing.

38
12. Acknowledgements:
The Global Earthquake Explorer project has benefited
from a number of software developers, teachers, and financial
sponsors. Developers include: Philip Crotwell, Charles
Groves, Chelsea Groves, Philip Oliver-Paull, Tom Owens, and
Evan Owens. Design input and significant feedback came
from: Jim Bartholomew, John Carpenter, Andy Frassetto,
Katrina Byerly and the teachers of the South Carolina Earth
Physics Project. Financial support is or has been provided by:
USC Department of Geological Sciences, the South Carolina
Commission on Higher Education, the IRIS Consortium, and
the NSF Information Technology Research program (award
#EAR-0312511).