gelation of ionic liquids with silica nanoparticles: the...
TRANSCRIPT

Gelation of Ionic Liquids with Silica
Nanoparticles: The Role of Cation
Structure and Interactions
Esteban Rucavado Leandro
Department of Applied Physics
Chalmers University of Technology
Göteborg, Sweden, 2011.
1
Gelation of ionic liquids with silica nanoparticles: The role of cation
structure and interactions.
ESTEBAN RUCAVADO LEANDRO
© ESTEBAN RUCAVADO LEANDRO
Department of Applied Physics
Chalmers University of Technology
SE-412 96 Gothenburg
Sweden
Telephone : +46 (0) 31 772 1000
This thesis was done under the framework of “Erasmus Mundus Master in
Nanoscience and Nanotechnology, EMM-Nano” within the trajectory of Katholieke
Univesiteit Leuven, Belgium and Chalmers University of Technology, Sweden.
2

Abstract
This project investigates the gelation of ionic liquids using silica nanoparticles. The
overall aim is to learn more about the ion-ion and ion-silica interactions in ionic
liquid-silica dispersions and gels. Differences in the interactions between ionic
liquid and silica are introduced by changing the structure of the cations. Four
different ionic liquid based on imidazolium cation and [TFSI] anion have been used
to gel silica nanoparticles. The structure of the cations is varied by changing the
length and the end-group on the alkyl chain of the imidazolium ring, introducing e.g.
the possibility of hydrogen bonding.
Each ionic liquid was found to have a different gel concentration, 3.8wt% for
[C2MIM][TFSI], 4wt% for [EtOHMIM][TFSI], 3.5wt% for [C5MIM][TFIS], and
3.6wt% for [SMIM][TFSI]. At the gel concentration all samples were weak gels,
showing a yield stress behaviour. Below 4wt% phase separation was observed for
the [EtOHMIM][TFSI] silica dispersions.
The gelation of the dispersions does not have any dramatic influence on the
properties of the ionic liquid. The glass transition temperature does not change and
the conductivity decreases only slightly. Raman spectroscopy shows that there are
no changes on the strong Raman band at 740 cm ¹ ⁻ (expantion-contraction of the
entire [TFSI] anion) with silica concentration. From the results obtained, it is
possible to conclude that in the gel, the silica matrix acts as a “container” for the
ionic liquid: immobilizing the ionic liquid without making important changes to the
properties.
Keywords: ionic liquid gel, silica, imidazolium, bis(trifluoromethylsolfonyl)imide,
phase behavior, ionic conductivity, glass transition.
3

Acknowledgment
First of all I want to thank Aleksandar Matic for his supervision during the whole
course of this thesis. Secondly I want to thank Jagath Pitawala, Jonas Nordström and
Ezio Zanghellini for their guidance and assistance during this semester, this work
would not be possible if not for their help. I also want to thank to the whole
Condensed Matted Department Physics group for creating a great work
environment.
I want to thank my mother, father and brother: for being my support during these
years of absence. I have become the person I am thanks to them. Even though there
were thousands of kilometers and two years between us, my love for them has no
limits in distance nor time. I want to thank the rest of my family as well, specially to
Silvia who was my role model, and to Valeria and Mariana, for whom I want to be
role model.
I want to thank my family away from home, all those people who were present for
me in these years when I really need them: Luis, Dries, Calle, Sofia, Chandra,
Adrian, Kornelia, Andre, Aniruddha, Federico, and many others.
Also many people helped me in one way or another to fulfill this work, from Costa
Rica and many other locations around the world. Thanks to: Gaby, Nella, Gera,
Cojal, Bermu, Laura, Natis, Lucía, Manu, Lia, Ana, Dennis, Monte. A special thanks
to my dear: “Chone-group” who I remember every time I did/say something wrong
or inappropriate.
Finally I would like to thank the European Commission for creating and supporting
a program such as Erasmus Mundus Master in Nanoscience and Nanotechnology,
which allows young people from overseas to study and improve themselves.
4

Table of Content
Abstract.................................................................................................................... 3
Acknowledgment..................................................................................................... 4
I. Introduction...........................................................................................................6
II. Ionic Liquid Gels................................................................................................. 7
A. Structure and Properties of Ionic Liquids...............................................7
B. Ionic Liquid Gels..................................................................................... 11
1. Colloidal Interactions....................................................................14
III. Experimental...................................................................................................... 16
A. Materials.................................................................................................. 16
1. Ionic Liquids.................................................................................16
2. A200 Silica Nanoparticles............................................................ 17
B. Sample Preparation.................................................................................. 19
C. Differential Scanning Calorimetry...........................................................20
1. Glass Transition............................................................................ 21
D. Dielectric Spectroscopy........................................................................... 22
E. Raman Spectroscopy................................................................................ 25
IV. Results and Discussion....................................................................................... 30
A. Gelation and Phase Separation................................................................ 30
B. Glass Transition Temperature.................................................................. 36
C. Ionic Conductivity................................................................................... 38
D. Molecular Interactions.............................................................................42
V. Conclusions and Further Work.................................................................46
References................................................................................................................ 47
5

I. Introduction
In Ionic Liquid Gels, a network of a dispersed phase is swollen with an ionic liquid
(IL). The dispersed phase can be a polymer or colloidal particles. Even thought there
are some reports on the applications of ionic liquid gels [1, 2], little is known about
the basic interaction between the dispersed phase and the continuous phase in
colloidal dispersions of this type and about the mechanisms controlling the gelation.
These issues will be addressed and investigated in the present work. [1] [2]
Ionic liquids are also of interest from an applied point of view. Efforts have been
made to develop new electrolytes, that are able to provide high ionic conductivity
together with chemical, thermal, and mechanical stability. Solutions based on ionic
liquids may satisfy the requirements needed for applications in batteries and fuel
cells. In order to apply ionic liquids in a battery or a fuel cell [2-5], it is an advantage
to have a solid electrolyte and to control the mechanical properties. This can be
achieved with ionic liquid gels.[3] [4][5][2]
In the present work, silica nanoparticles were used to make gels with four different
imidazolium based ionic liquids. The influence of silica nanoparticle concentration
on physical properties such as ion conductivity, glass transition temperature, and
molecular interactions in the ILs has been investigated. The used ionic liquids are
based on the imidazolium cation, and the bis(triflourosulfonyl)imide anion. Each
cation has a different side chain on the imidazolium ring, and the end group of this
chain is also different. In addition to straight forward results about phase behavior,
glass transition, ionic conductivity, gel concentration, and molecular interactions for
the different ILs, the analysis performed on these suspensions and gels give an
insight in how silica interacts with the ionic liquids, and how the cations and anions
interact with each other.
This thesis is divided into six chapters. After the introduction, the second chapter
describes basic concepts of ionic liquids and ionic liquid gels. It also summarizes the
6

research done previously on nano-silica ionic liquid gels. In the experimental
chapter, the materials used, the sample preparation, and characterization techniques
(Differential Scanning Calorimetry, Dielectric Spectroscopy and Raman
Spectroscopy) are discussed. The results and discussion chapter is an extended
description of the experimental results, their interpretation concerning gelation
concentration, phase separation, glass transition behavior, ionic conductivity,
molecular interactions, and particle size. The conclusions chapter summarizes the
results obtain in this work. Finally, there is a chapter giving recommendations for
further work.
7

II. Ionic Liquids and Ionic Liquid Gels
A. Structure and Properties of Ionic Liquids.
Ionic liquids are molten salts, i.e. liquids composed entirely of ions, with melting
temperatures below 100°C [6]. There is a broad range of applications for ionic
liquids. They may act as catalysts for chemical reactions, solvents for bioscience
studies, or electrolytes for batteries and fuel cells [7]. Some of the properties that
make ionic liquids interesting are: non-flammability, negligible vapor pressure,
thermal stability, chemical stability, and high ionic conductivity [8, 9]. [8][9]
Table 1. Melting temperatures of some salts and common ionic liquids
Salt/IL Melting Temperature (°C)
NaCl 803
KCl 772
[C3MIM]Cl⁻ 65
[C3MIM][PF6] 10
[C3MIM][TFSI] -22
Typically, an ionic liquid consists of a bulky asymmetric organic cation and a charge
delocalized anion. The asymmetry and the charge delocalization results in weak
electrostatic interactions, resulting in a low melting point. Table 1 presents some
examples of melting temperatures of some common salts and ionic liquids, showing
how the melting point is closely related to the size and shape of the anion and the
cation [6]. If the anions and the cations are small, they are able to pack efficiently to
form crystal structures with high melting temperatures (such as NaCl). As the size of
the ions increases, the packing becomes less efficient, hence the melting temperature
decreases, (such as 1-Butyl-3-methylimidazolium terafluoroborate).
8

Typical cations are made from nitrogen-containing organic aromatic rings with
linear alkyl side chains. Ionic liquids with cations such as tetraalkylamonium,
alkylpyrrolidinium, alkylimidazolium and alkylpyridinium are commercially
available, see Figure 1. Most anions are polyatomic, inorganic, and have delocalized
charge. Some commercially available anions are tetrafluoroborate,
hexafluorophosphate and bis(trifluoromethylsulfonyl)imide, see Figure 1.
To facilitate further reading of this thesis, a common short-hand notation is used for
ionic liquids. Imidazolium-based cations are denoted as [CnMIM], where n is the
number of carbon atoms in the linear alkyl chain, for example, [C5MIM] is notation
for 1-Pentyl-3-methylimidazolium. Anions such as tetrafluoroborate,
hexafluorophosphate and bis(trifluoromethylsulfonyl)imide are denoted as [BF4],
[PF6], and [TFSI] respectively.
9
Figure 1. Some commercially available anions and cations. Top from left to right: tetraalkylammonium, N-alkyl-N-alkylpyrrolidinium, 1-alkylpyridinium, 1-alkyl-3-alkylimidazolium. Bottom: tetrafluoroborate, hexafluorophosphate, bis(trifluoromethanesulfonyl)imide .
The possibility to independently change the molecular structure of anions and
cations allows the design of millions of different ionic liquids with different
properties. With small changes in the structure of the ions, it is possible to tune the
physicochemical properties to make an useful material for a specific application. For
this reason ionic liquids are considered as “designer solvents” [6]. For example, a
small change in the alkyl chain in alkyl-methylimidazolium ionic liquids can
considerably change the viscosity, the glass transition temperature, and the ionic
conductivity. As an example of this, the glass transition temperature of 1-(4-
sulfobutyl)-3-methylimidazolium bis(trifluoromethasulfonyl) imide is -56°C; while
for [C5MIM][TFSI] is -85°C. The only difference between these ionic liquids is a
SO3H group at the end of the alkyl chain for the 1-(4-sulfobutyl)-3-
methylimidazolium bis(trifluoromethasulfonyl)imide. The structures of the cations
are shown in figure 4, Chapter 3.
Commonly ionic liquids are divided into two categories, protic and aprotic [6].
Synthesis of aprotic ionic liquids is a two step process. First a tertiary amine is
alkylated by adding an alkyl chloride, then the chloride ions are exchanged with the
required anion to form a salt with low melting temperature. This is called the
quaternization method. Since this synthesis consist of two steps is easy to form
byproducts in the ionic liquid that will lower the purity of the final product. In the
synthesis of protic ionic liquids, the cations are obtained from the transfer of a
proton from a BrØnsted acid to a BrØnsted base in a neutralization process. Since it
is a one step process, there is less need for purification. Figure 2 shows
schematically the two different synthesis processes.
For the scope of this work, it is important to differentiate between the cation
structures of the ionic liquids, due to their influence on the physical properties of
ionic liquid suspensions and gels. Naturally, it is expected that the different ionic
liquids will have different interactions. The presence of an extra OH group on the
cation of the protic ionic liquid, can create interactions via hydrogen bonding. Thus
different anion-cation interactions as well as interactions with the silica
10

nanoparticles are expected.
B. Ionic Liquid Gels
The present work investigates properties of ionic liquid dispersions and gels. The
particles in a colloidal dispersion are small (1nm - 10 μm), thus they have a high
surface area [10]. At high enough concentrations the particles will interact with each
other and can form a gel. Even though there are several definitions of what a gel is
[11] for the purpose of this work we shall consider a gel as a colloidal dispersion
which exhibits the mechanical characteristics of a solid, where both the dispersed
component and the dispersion medium extend continuously throughout the whole
system [12]. To determine if a sample is a gel or not, a simple experiment is done in
which the tube containing the sample is turned upside-down. If the sample does not
flow it is considered to be a gel. [13]. A more rigorous determination is a
investigation of the elastic modulus (G') which should exhibit a plateau extending to
times at least of the order of seconds, and the viscous modulus (G'') which should be
considerably smaller than the elastic modulus in the plateau region [11].
Previously, research has been done with ionic liquids and silica nano-particles in the
gel state [13-18]. The group of Watanabe has contributed the most, by studying the
11
Figure 2. Synthesis of protic and aprotic imidazolium based ionic liquids. The product of the quaternization process is an aprotic ionic liquid while the product of the neutralization process is a protic ionic liquid.

colloidal stability, ionic transport, rheological properties, surface chemistry, and
microstructure of colloids in ionic liquids [13-19]. Rheology studies showed that, for
[C2MIM][TFSI] containing 5wt% of hydrophilic silica nanoparticles, G' is
frequency-independent and higher than G'' for one order of magnitude, indicating
that the colloidal suspension behaves as a solid-like material, i.e. as a gel [13]. In
contrast, [C4MIM][BF4] suspensions with 15wt% hydrophilic silica showed
frequency-dependence on both G' and G'', with the viscous modulus higher than the
elastic modulus, indicating that even at this high concentrations, the dispersion
behaves as a liquid-like material [13]. The shear rate dependence of viscosity was
measured for [C2MIM][TFSI] and [C4MIM][BF4] hydrophilic silica dispersions,
showing shear thinning for [C2MIM][TFSI] with a 5wt% silica concentration. For
[C4MIM][BF4] 5wt%, 8wt%, 10wt%, and 15wt% [13] the viscosity is constant at
low shear rates, but in increases drastically at high shear rates. This shear thickening
behavior is enhanced by the silica concentration i.e. with a higher concentration the
steeper is the increase. Using hydrophobic silica, dynamic oscillatory shear
measurements showed that in both types of IL, G' was higher than G'', indicating a
soft-solid behavior even for concentrations as low as 5wt%. The shear rate
dependence of viscosity showed that, when using hydrophobic nanoparticles, the
gels exhibit shear thinning, also for [C4MIM][BF4] [13]. These results suggest that
both anions and cations may interact with silica, for instance with hydrogen bonding
and electrostatic interactions. This may create steric hindrance and/or solvation
forces which stabilize the colloidal particles in the ILs.
[13][14][15][16][17][18]
Work has also been done on the physical properties of soft glassy colloidal arrays
consisting of polymer grafted silica nanoparticles and ionic liquids [17]. It has been
demonstrated that at low concentration, the polymer grafted particles are well
suspended in the ionic liquid without aggregation or sedimentation, and they show a
liquid-like behavior. However when the concentration is increased up to 14.2 wt%,
the suspension becomes solid. This type of suspensions (or gels) also exhibit
different colors that depend on the particle concentration: red, green and blue for
concentrations of 14.2wt%, 25.0wt%, 33.3wt% respectively [17]. For [C2MIM]
12
[TFSI] and polymer grafted silica nanoparticles (using side chains of poly(benzyl
methacrylate) and poly(methyl methacrylate) attached to the surface of the particle),
it was found that depending on the structure of the grafted polymer and the
nanoparticle concentration, the colloidal array might phase separate at certain
temperature [16].
Theoretical estimations of the colloidal interactions between silica particles in ionic
liquids have been performed using the Derjaguin-Landau-Verwey-Overbeek
(DLVO) theory [15]. With the DLVO theory and Dynamic Light Scattering
experiments, it was demonstrated that bare silica particles cannot be stabilized and
form aggregates in different imidazolium bases ionic liquids. The stability of bare
silica particles was compared with the colloidal behavior of polymer grafted
nanoparticles, which showed good colloidal stability for [C3MIM][PF6] and for
imidazolium [TFSI] ionic liquids [15]. Steric forces may cause the stabilization of
PMMA grafted silica nanoparticles [15].
The group of Liu has studied the immobilization of imidazolium based ionic liquids
on silica nanoparticles using DSC, X-ray diffraction, and Raman spectroscopy [14].
Studied cations are [C2MIM], [C3MIM], and [BenzylMIM]. They found that the
melting point of the immobilized ionic liquids decreases considerably compared
with the pure ionic liquid. They conclude that this is caused by hydrogen bonding
networks between the cations and the nano-Silica.
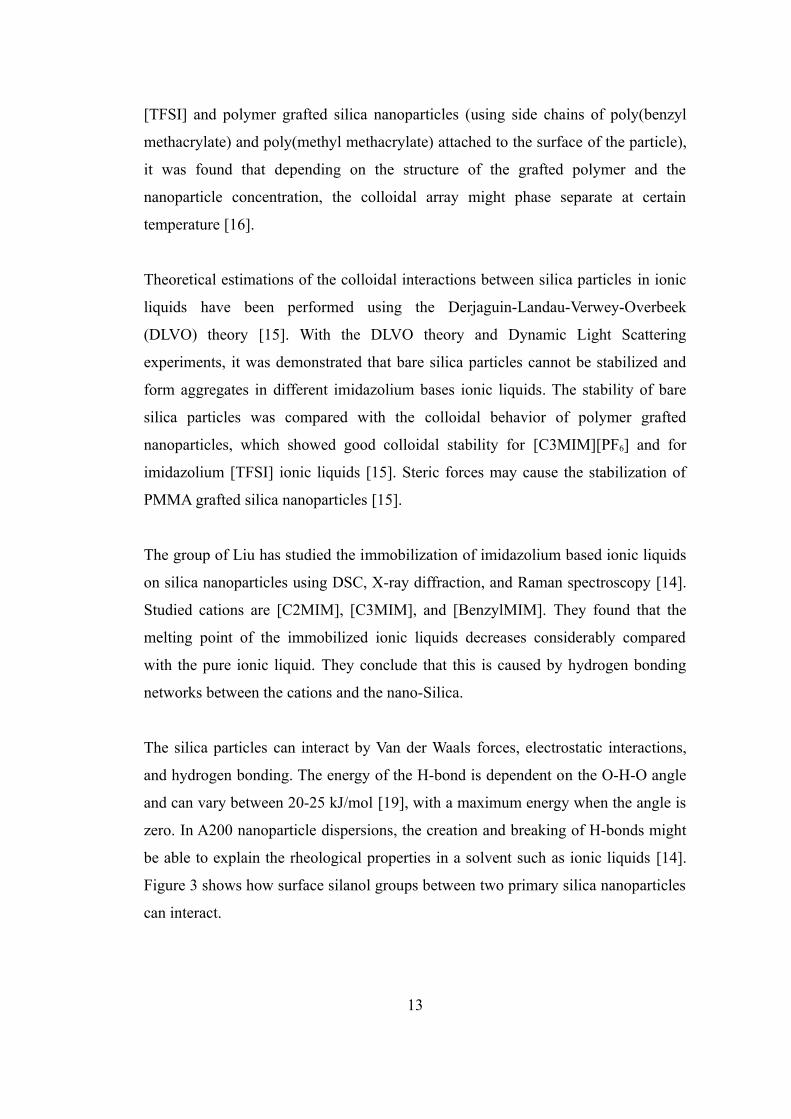
The silica particles can interact by Van der Waals forces, electrostatic interactions,
and hydrogen bonding. The energy of the H-bond is dependent on the O-H-O angle
and can vary between 20-25 kJ/mol [19], with a maximum energy when the angle is
zero. In A200 nanoparticle dispersions, the creation and breaking of H-bonds might
be able to explain the rheological properties in a solvent such as ionic liquids [14].
Figure 3 shows how surface silanol groups between two primary silica nanoparticles
can interact.
13
In protic and aprotic ionic liquids, hydrogen bonding has an important role by
stabilizing the ionic liquids suspensions and gels. It has been suggested that in
aprotic ionic liquids, hydrogen bond networks are formed between cations (such as
[C2MIM], [C3MIM], [C6MIM]) and the surface silanol groups of the Silica
nanoparticle [14] . On the other hand, for protic ionic liquids, a different interaction
is expected since the presence on OH groups on the cation creates hydrogen bonds
between the A200 nanoparticles and the cation but also a stronger anion-cation
interaction.
1. Colloidal Interactions
One factor affecting the stability of a colloidal suspension is gravity. If the dispersed
particles are denser than the liquid they will tend to sediment. On the other hand, if
the particles are less dense than the liquid they will tend to rise to the surface. Such
behavior is known as creaming [10]. Thermal motion of the particles (Brownian
motion) counteracts gravity, by randomizing the displacement of the particles in the
medium, hence preventing creaming or sedimentation of the colloidal dispersion
In addition to gravity and Brownian motion, there are attractive, and repulsive, long-
range and short-range forces in colloidal dispersions that will determine their
14
Figure 3. Hydrogen bond between two idealized A200 primary nanoparticles. (figure is not in scale)
behavior. Particles with a surface charge will result in repulsive forces. However in
an electrolyte, a solvation layer will form around the particles. As a result the surface
charge of the particles will be screened. The distance that characterizes this
electrostatic screening in a colloidal dispersion is the Debye screening length, κ ¹:⁻
κ⁻ ¹= ε r ε0 k B T
2e²n0 z² 1/2
(1)
where z is the charge of the ions in the solution, n0 is the ion concentration in the
solvent, εr the dielectric constant of the solvent, kB is the Boltzmann constant, and ε0
is the dielectric permittivity in vacuum. The screening of the surface charge will
destabilize the dispersion, leading to aggregation of the particles. Besides the
screening, there are more ways to control the stability in a colloidal dispersion, such
as changing the pH in the solution, grafting the particles with polymers, or even
adding polymer coils to the solvent [18].
It has been reported that cations and anions in ionic liquids may interact with silica
nanoparticles through hydrogen bonding [13,14]. Hydrogen bonding is a form of
association between an electronegative atom and a hydrogen atom attached to a
second, relatively electronegative atom. The electronegative atoms are usually
nitrogen, oxygen, or fluorine. The associated energy in hydrogen bonds are usually
20–25 kJ mol ¹ ⁻ [19], which is one order of magnitude more than the room
temperature thermal energy (2.4 kJ mol ¹). In the context of this work, hydrogen⁻
bonds are important because it is believed that the hydroxyl groups on the surface of
the silica particles can form hydrogen bonds with the ionic liquid, forming an
ordered solvation layer around the particles which influences surface interactions
and thus the phase behavior of the ionic liquid silica dispersion [14] [20]. In
literature we find [13,14] that some ionic liquids that might form hydrogen bond
with surface silanol groups are [C2MIM][PF6], [C3MIM][PF6], [EtOHMIM][TFSI]
and [BenzylMIM][BF4]. [13][14]
15

III. Experimental
This chapter describes the materials and experimental techniques that are used to
characterize the ionic liquid gels and suspensions. Differential Scanning Calorimetry
(DSC) was used to determine the glass transition temperature (Tg) of pure and gelled
ionic liquids. Dielectric Spectroscopy was used to investigate the ionic conductivity.
Finally, ion-ion and ion-silica interactions of the materials were studied using
Raman spectroscopy.
A. Materials
1. Ionic Liquids
For this work four ionic liquids were used, with different cations but the same anion.
The cations are: 1-(4-sulfobutyl)-3-methylimidazolium, 1–Pentyl–3-
methylimidazolium, 1–ethanol–3-methylimidazolium, and 1-ethyl-3-
methylimidazolium. The common anion is bis(trifluoromethasulfonyl)imide. To
facilitate reading, the following abbreviations, will be used for cations and anions:
[SMIM] for 1–(4-sulfobutyl)–3-methylimidazolium, [C5MIM] for 1–Pentyl–3-
methylimidazolium, [EtOHMIM] for 1– ethanol–3-methylimidazolium, [C2MIM]
for 1-ethyl-3-methylimidazolium and [TFSI] for bis(trifluoromethasulfonyl)imide.
Figure 4 summarizes the molecular structures of the cations and the anion. All the
ionic liquids were purchased from Solvionic Corporation and they were stored in the
glove-box.
These ionic liquids were chosen in order to compare the influence of the cation
structure, and in particular hydrogen bonding, on the ionic liquid/silica dispersion
and gels. Each cation contains one imidazolium ring and an alkyl chain. The
[C5MIM][TFSI] and [SMIM][TFSI] have a similar molecular structure, the only
difference is a sulfonic acid group at the end of the alkyl chain for [SMIM].
16

In a similar way, the only difference between [C2MIM][TFSI] and [EtOHMIM]
[TFSI] cations is a OH group at the end of the alkyl chain in [EtOHMIM][TFSI].
Table 2 shows some properties reported in literature of the ionic liquids.
Table 2. Physical properties of the four ionic liquids. For some of the ionic liquids, data is not
available in literature.
Property [C5MIM]
[TFSI]
[SMIM]
[TFSI]
[C2MIM]
[TFSI]
[EtOHMIM]
[TFSI]
Molecular Weight 433.39 499.43 391.32 407.32
Density (g/cm3) @ RT 1.403 [21] - 1.52 [22] 1.57 [23]
Tg (K) 188.15 [21] 217.1 181.15 [22] 194 [23]
Tm (K) 264.15 [21] - 256.15 [22] -
Viscosity (cp) @ RT - - 34 [24] 85.5 [13]
17
Figure 4. Molecular structure of the cations and the anion used in this work.
2. A200 Silica Nanoparticles.
The A200 nanoparticles were obtained from Evonic Industries. A200 nanoparticles
are large-scale industrial fabricated by continuous flame hydrolysis of silicon
tetrachloride (SiCl4). In the flame hydrolysis, SiCl4 is converted to the gas phase and
reacts spontaneously in an oxyhydrogen flame with the intermediately-formed water
to produce the silicon dioxide [25]. By changing the exposure time, concentration of
reactants and flame temperature it is possible to tune the particle size, size
distribution, and surface area.
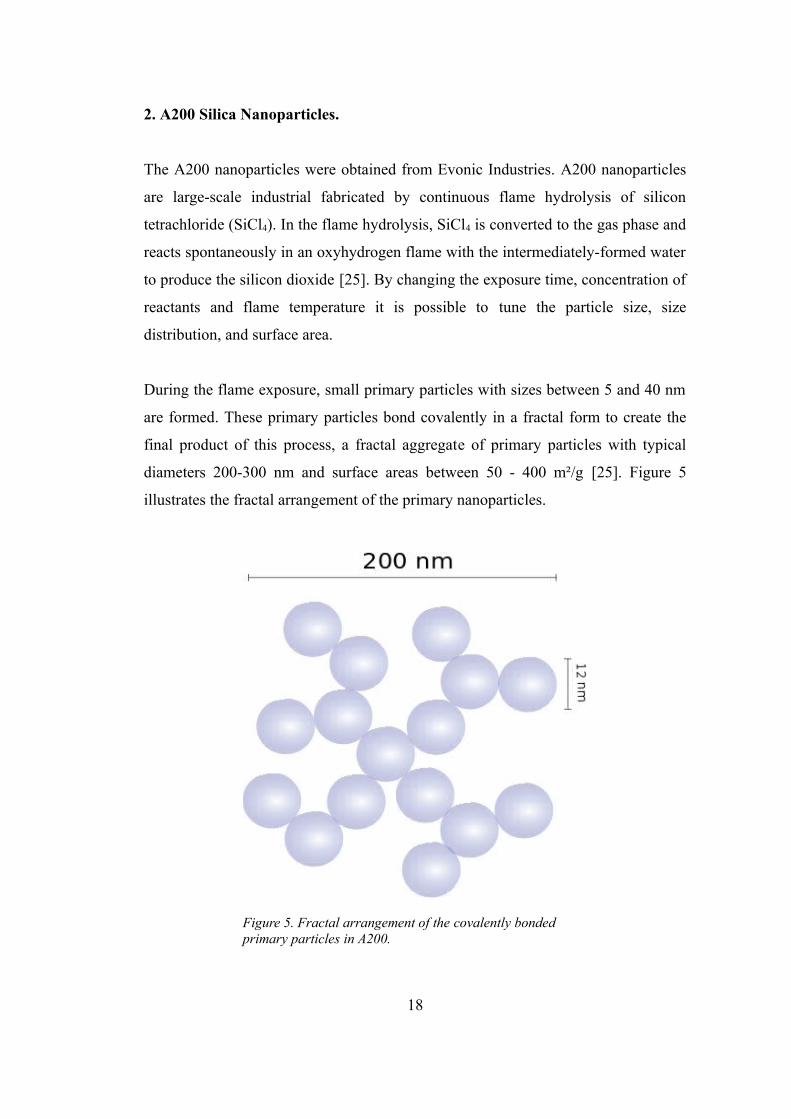
During the flame exposure, small primary particles with sizes between 5 and 40 nm
are formed. These primary particles bond covalently in a fractal form to create the
final product of this process, a fractal aggregate of primary particles with typical
diameters 200-300 nm and surface areas between 50 - 400 m²/g [25]. Figure 5
illustrates the fractal arrangement of the primary nanoparticles.
18
Figure 5. Fractal arrangement of the covalently bonded primary particles in A200.
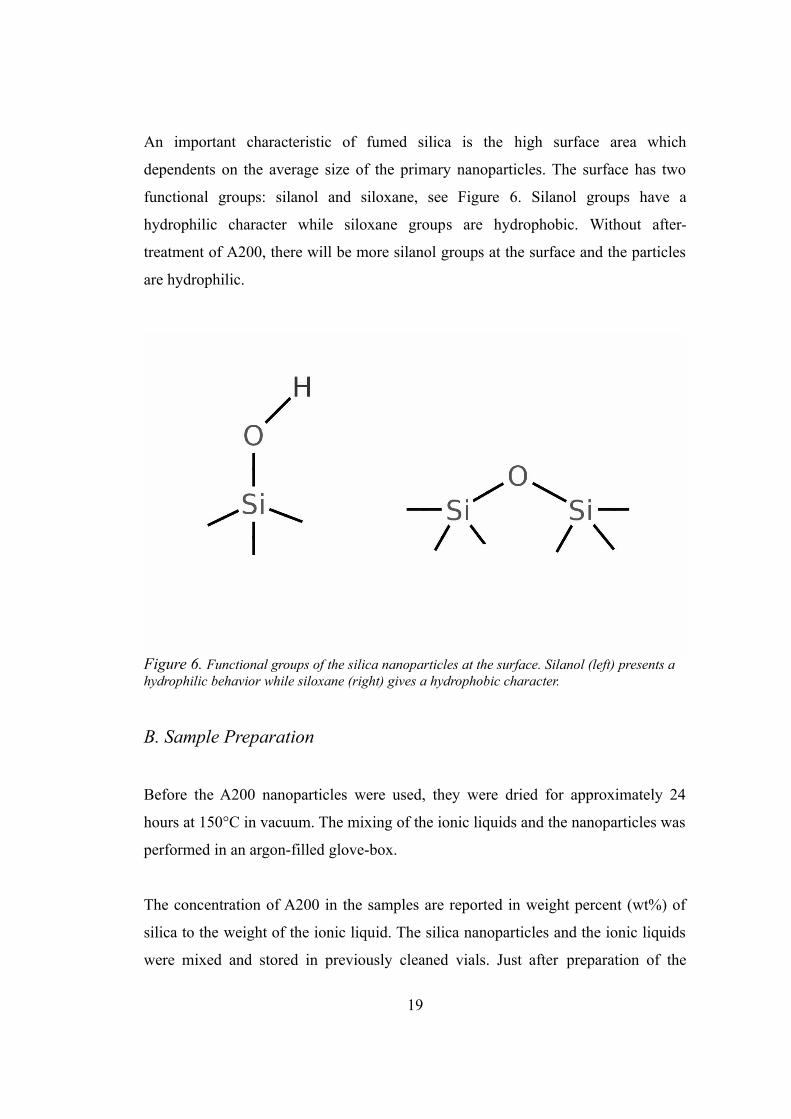
An important characteristic of fumed silica is the high surface area which
dependents on the average size of the primary nanoparticles. The surface has two
functional groups: silanol and siloxane, see Figure 6. Silanol groups have a
hydrophilic character while siloxane groups are hydrophobic. Without after-
treatment of A200, there will be more silanol groups at the surface and the particles
are hydrophilic.
B. Sample Preparation
Before the A200 nanoparticles were used, they were dried for approximately 24
hours at 150°C in vacuum. The mixing of the ionic liquids and the nanoparticles was
performed in an argon-filled glove-box.
The concentration of A200 in the samples are reported in weight percent (wt%) of
silica to the weight of the ionic liquid. The silica nanoparticles and the ionic liquids
were mixed and stored in previously cleaned vials. Just after preparation of the
19
Figure 6. Functional groups of the silica nanoparticles at the surface. Silanol (left) presents a hydrophilic behavior while siloxane (right) gives a hydrophobic character.

samples, the vials were para-filmed to avoid oxygen and water contamination. All
the samples were stored outside the glove-box.
An ultrasonic after-treatment for 2 hours was performed on all samples. This was
done in order to ensure an homogeneous dispersion of the nanoparticles in the ionic
liquid. The maximum power of the ultrasonic bath is 950W.
C. Differential Scanning Calorimetry
Differential scanning calorimetry (DSC) is one of the most used thermal analysis
techniques. Essentially, the main idea of this technique is to obtain information of
thermal changes in a sample. The heat flow is determined when heating (or cooling)
the sample and a reference at a specific heating (or cooling) rate [26]. DSC can be
used to obtain a wide range of information and on very different types of materials.
For instance, DSC can be used to study polymers, glasses, ceramics, liquid crystals,
biological materials, metals, alloys, minerals, pharmaceutical products, etc. For the
purpose of this thesis, DSC measurements will be focused on the glass transition
temperature (Tg). The next sub-chapter will shortly explain the glass transition and
why it is important for this work.
The DSC instrument determines heat flow, derived from the temperature difference
between the sample and a reference. During the measurements, the sample is placed
in a crucible and the reference is either an inert material or an empty crucible. Two
separate temperature sensors measure the temperature difference between the sample
and the reference. This difference is converted into differential power using an
algorithm in the software of the DSC instrument. The result of this is a thermal
analysis curve in which the instrument signal is plotted against temperature. As an
example of a DSC curve, Figure 7 shows the glass transition, the crystallization, and
the melting of [C2MIM][TFSI]. The glass transition is observed as a change in the
base line, crystallization is observed as two exothermic peaks whereas melting as
two endothermic peaks. All DSC measurements in this thesis were performed using
20
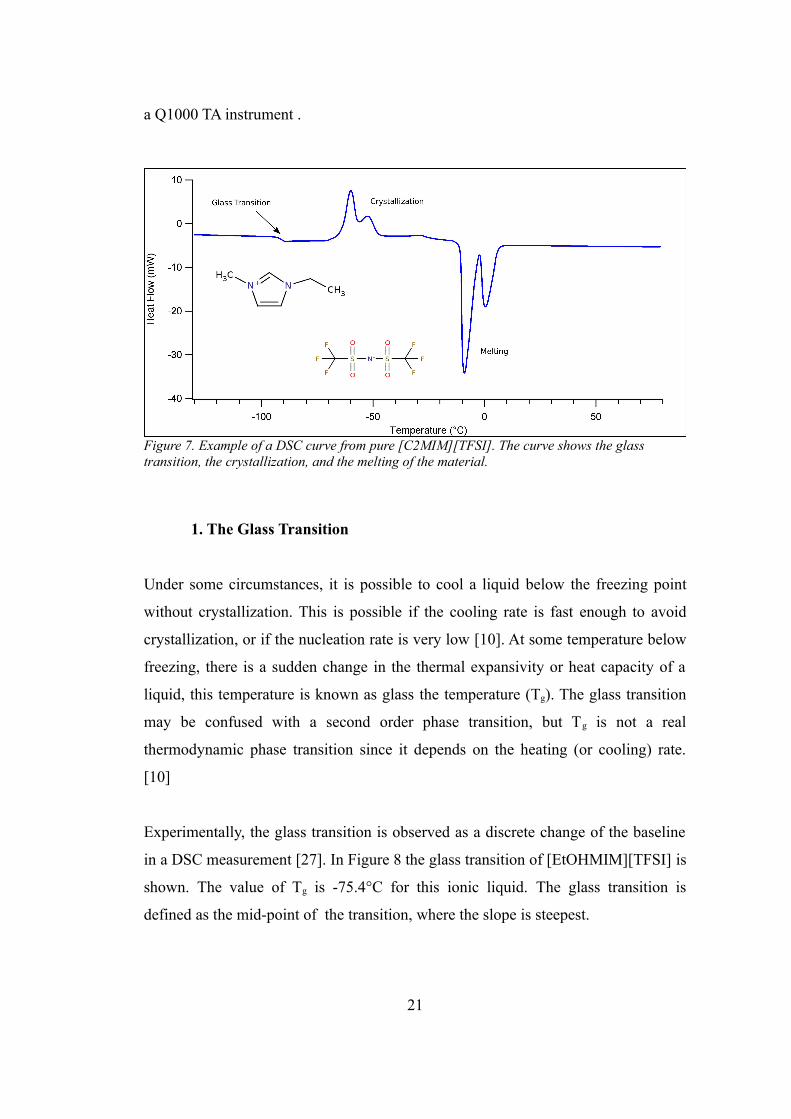
a Q1000 TA instrument .
1. The Glass Transition
Under some circumstances, it is possible to cool a liquid below the freezing point
without crystallization. This is possible if the cooling rate is fast enough to avoid
crystallization, or if the nucleation rate is very low [10]. At some temperature below
freezing, there is a sudden change in the thermal expansivity or heat capacity of a
liquid, this temperature is known as glass the temperature (Tg). The glass transition
may be confused with a second order phase transition, but Tg is not a real
thermodynamic phase transition since it depends on the heating (or cooling) rate.
[10]
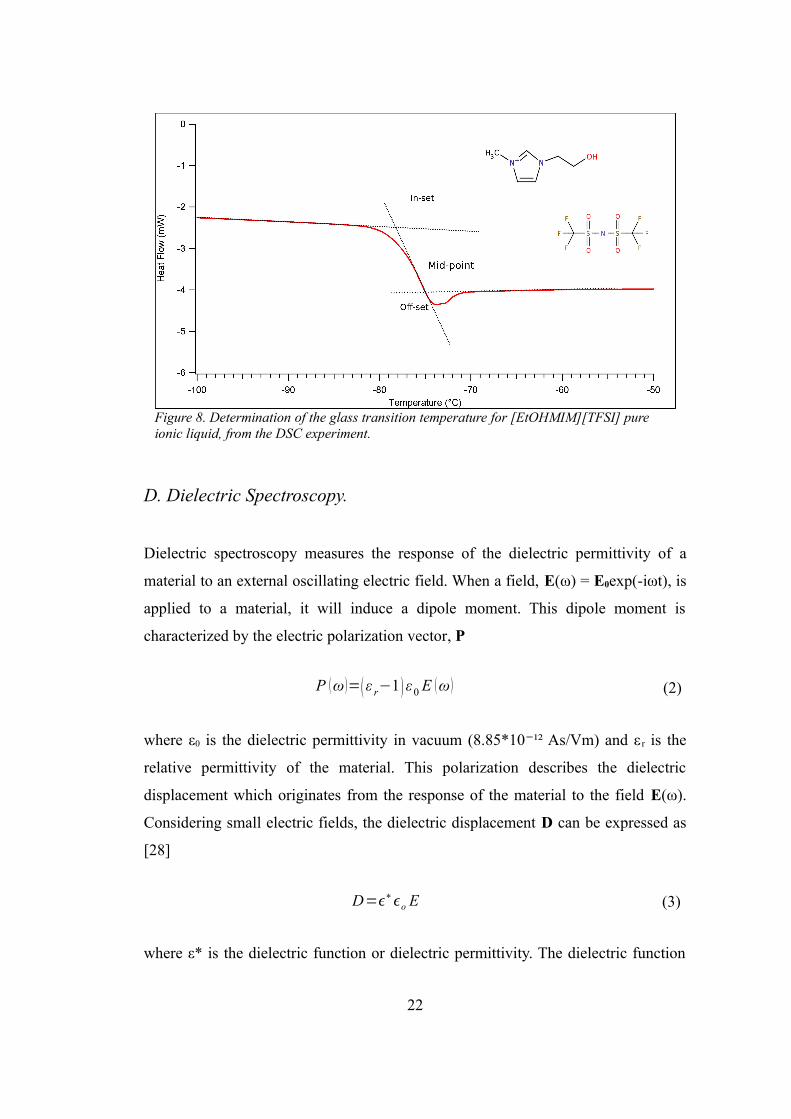
Experimentally, the glass transition is observed as a discrete change of the baseline
in a DSC measurement [27]. In Figure 8 the glass transition of [EtOHMIM][TFSI] is
shown. The value of Tg is -75.4°C for this ionic liquid. The glass transition is
defined as the mid-point of the transition, where the slope is steepest.
21
Figure 7. Example of a DSC curve from pure [C2MIM][TFSI]. The curve shows the glass transition, the crystallization, and the melting of the material.
D. Dielectric Spectroscopy.
Dielectric spectroscopy measures the response of the dielectric permittivity of a
material to an external oscillating electric field. When a field, E(ω) = E0exp(-iωt), is
applied to a material, it will induce a dipole moment. This dipole moment is
characterized by the electric polarization vector, P
P ω= ε r−1 ε0 E ω (2)
where ε0 is the dielectric permittivity in vacuum (8.85*10 ¹² As/Vm) and ε⁻ r is the
relative permittivity of the material. This polarization describes the dielectric
displacement which originates from the response of the material to the field E(ω).
Considering small electric fields, the dielectric displacement D can be expressed as
[28]
D=∗o E (3)
where ε* is the dielectric function or dielectric permittivity. The dielectric function
22
Figure 8. Determination of the glass transition temperature for [EtOHMIM][TFSI] pure ionic liquid, from the DSC experiment.
is complex and frequency dependent.
∗= ' −i ' ' (4)
By properly analyzing the dielectric function, it is possible to study effects such as
orientation of the dipoles, polarization effects, and ionic conductivity of a material
[30]. The conductivity is a result of an energy loss, hence is related to the imaginary
part of the dielectric function [28].
σ' ω =ωε0 ε'' ω (5)
When a material is under the influence of a field, the drift of the mobile carriers
(such as electrons or ions) cause conductive contributions to the dielectric response.
This response is characterized by a field displacement of the form D = D0exp[i(ωt-
δ(ω))] where δ(ω) is the phase shift and D0 is the amplitude of the displacement [28].
Considering this, it is possible to describe the permittivity as
∗=
D0
0 E 0
exp[−i] (6)
where E0 is the magnitude of the applied electric field.
Typically for dielectric spectroscopy, the current is measured as a function of the
applied voltage. The complex impedance is the ratio
Z∗=
U∗
I∗ (7)
Using the previous results, the complex dielectric function can be calculated as
∗=
−i
C0 Z∗
(8)
23

Where, C0 is the capacity of the empty cell. Using equation [7] and equation [8], the
conductivity can be calculated.
The experiments were performed by placing the sample in a coin-shaped container,
with electrodes at the top and the bottom of the coin. This cell has dimensions of 1.1
mm thickness and 13 mm diameter. The real part of the conductivity is plotted as a
function of the frequency for different temperatures. Measurements were performed
between 50°C and -100°C, at every 10°C (stabilization time of 900 s at each
temperature). The frequencies range was from 10 to 10 ² Hz. As an example,⁷ ⁻
Figure 9 shows the real part of the conductivity for pure [SMIM][TFSI].
The DC-conductivity is obtained from the conductivity plot by using the
conductivity value where there is a plateau over a range of frequencies. The DC-
conductivity determined from the data in figure 9 is shown in figure 10. As it is
expected for this type of systems, the conductivity increases with increasing
temperature.
24
Figure 9. The real part of the complex conductivity (σ'). This measurement is as function of frequency and temperature. For the pure ionic liquid [SMIM][TFSI]. The DC-conductivity plateau is indicated by the red lines.

E. Raman Spectroscopy.
Raman spectroscopy is used to provide information on chemical structures, to
identify substances from the characteristic spectral patterns and to determine
quantitatively or semi-quantitatively the amount of a substance in a sample. It can
also be used to determine chemical and physical interactions in a material. Solid,
liquid, or vapor samples can be examined using Raman spectroscopy. Modern
Raman instrumentation has simplified the experiments. These advances, together
with the ability of Raman spectroscopy to examine aqueous solutions and samples
inside glass containers, makes Raman spectroscopy an ideal characterization
technique for this work.
25
Figure 10. DC-conductivity plot for [SMIM][TFSI]. Each data point is extracted from a plateau of Figure 9.
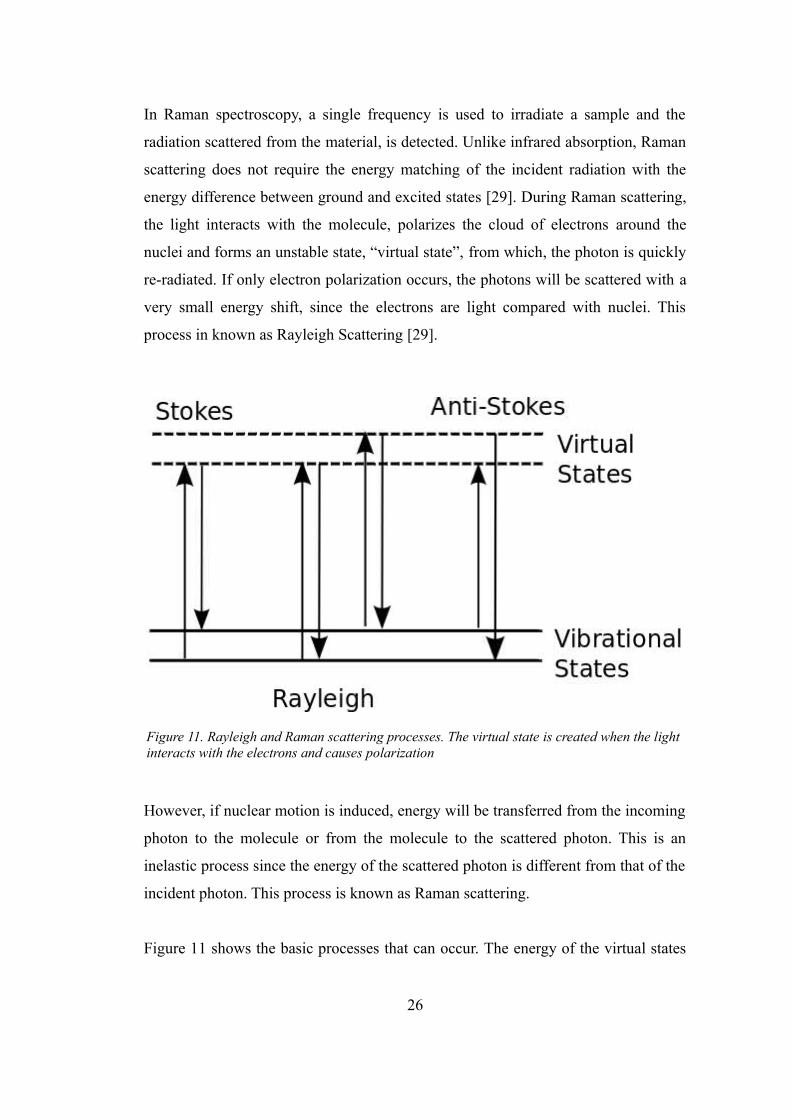
In Raman spectroscopy, a single frequency is used to irradiate a sample and the
radiation scattered from the material, is detected. Unlike infrared absorption, Raman
scattering does not require the energy matching of the incident radiation with the
energy difference between ground and excited states [29]. During Raman scattering,
the light interacts with the molecule, polarizes the cloud of electrons around the
nuclei and forms an unstable state, “virtual state”, from which, the photon is quickly
re-radiated. If only electron polarization occurs, the photons will be scattered with a
very small energy shift, since the electrons are light compared with nuclei. This
process in known as Rayleigh Scattering [29].
However, if nuclear motion is induced, energy will be transferred from the incoming
photon to the molecule or from the molecule to the scattered photon. This is an
inelastic process since the energy of the scattered photon is different from that of the
incident photon. This process is known as Raman scattering.
Figure 11 shows the basic processes that can occur. The energy of the virtual states
26
Figure 11. Rayleigh and Raman scattering processes. The virtual state is created when the light interacts with the electrons and causes polarization
is determined by the frequency of the incoming light [29]. The Rayleigh process is
more intense since a higher amount of photons scatter this way.
Stokes scattering occurs if the molecule has a higher vibrational state after the
scattering process [29]. However, some molecules may be in an excited state, due to
thermal energy, and the incoming light de-exites the molecule to the ground state,
from this mechanism, the outgoing light generates anti-Stokes scattering. During this
process, there is energy transfer to the scattered photon. At room temperature,
molecules are expected to be in a lower vibrational state, so Stokes scattering will be
more likely to occur than anti-Stokes.
The movement of molecules can be described with the degrees of freedom. Three
degrees of freedom describe the translation in space of the molecule (the Cartesian
coordinates in three dimensions), and three describe rotational movements (except
for linear molecules, that only need 2). If there are N atoms in a molecule, the
number of vibrational degrees of freedom, and therefore the number of vibrations
possible, is 3N-6, except for linear ones where it is 3N-5 [29].
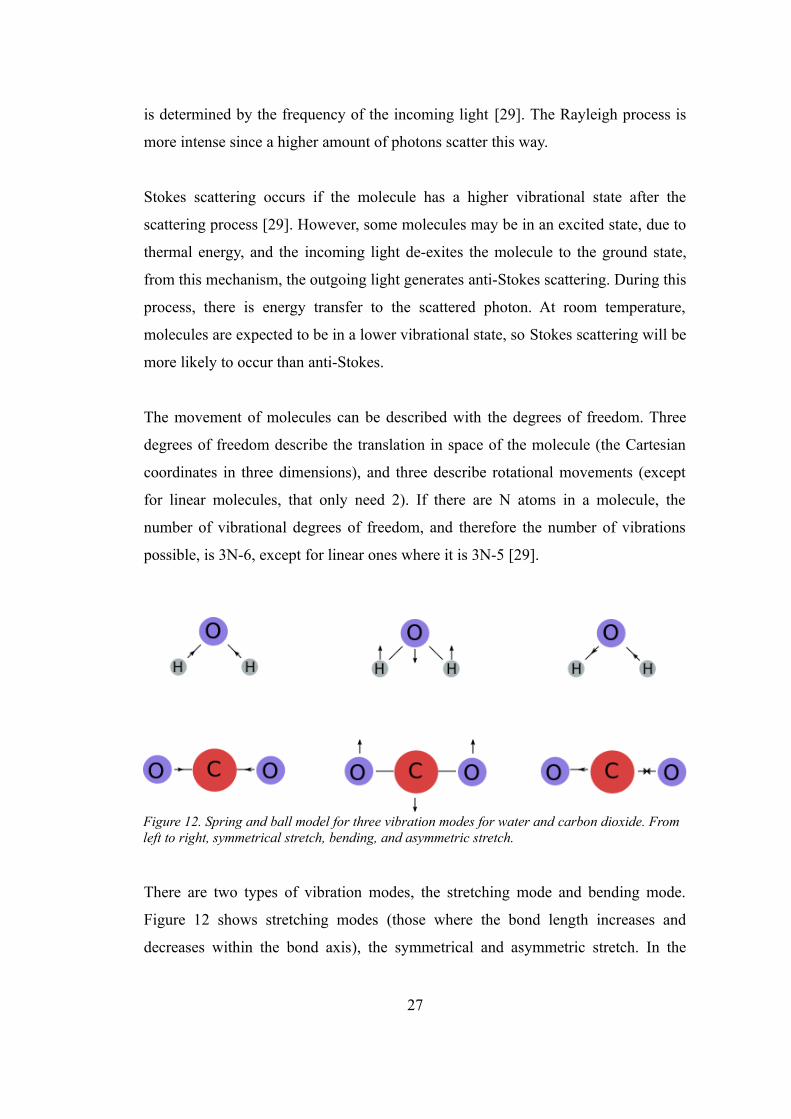
There are two types of vibration modes, the stretching mode and bending mode.
Figure 12 shows stretching modes (those where the bond length increases and
decreases within the bond axis), the symmetrical and asymmetric stretch. In the
27
Figure 12. Spring and ball model for three vibration modes for water and carbon dioxide. From left to right, symmetrical stretch, bending, and asymmetric stretch.

bending vibration, there is a change in the angle between the bonds of the molecule
[29]. Bending mode can be divided in 4 categories: rocking, scissoring, wagging and
twisting modes.
In the present study, Raman spectra were recorded using a Bruker IFS66 Fourier
Transform Spectrometer using the 1064 nm line of Nd:YAG laser. A germanium
detector was used to detect the scattered light. The power of the laser was 400 mW
and the resolution was set to 2 cm ¹. ⁻ The Raman measurements were performed at
room temperature
With Raman analysis it is possible to investigate the ionic interactions and
conformations within the ionic liquid. In this work there is a special interest in the
740 cm-1 band, which corresponds to the expansion and contraction mode of the hole
[TFSI] anion [30].This band may be shifted because of ionic interactions or by a
change in the conformation state of [TFSI]. The two conformations of this particular
anion will be discussed in detail in chapter IV. Figure 14 shows a zoom-in of the 740
cm-1 band for the pure ionic liquid [C5MIM][TFSI].
28
Figure 13. Stokes spectrum for [C5MIM][TFSI]. The inset shows the structure of the anion and the cation.

29
Figure 14. Zoom in of the 740 cm ¹ band ⁻ for [C5MIM][TFSI]. This band corresponds to the expansion and contraction of the whole TFSI anion [30].

IV. Results and Discussion.
A. Gelation and Phase separation.
To search for the gel concentration, a total of 32 samples were prepared from the
four ionic liquids. In the table 3 the physical state of each sample is reported. As
explained in the previous chapter, after making the sample, it was exposed to an
ultrasonic bath for two hours. This was done to ensure a homogeneous dispersion of
the silica nanoparticles.
Table 3. Concentration and phase of the prepared samples.
The concentration of A200 in the samples is reported in weight percent (wt%) of
silica to the total amount of the ionic liquid. The obtained values for the gelation
concentrations are given in Table 4. The samples are characterized in liquid, weak
gel or strong gel samples. The liquid samples flow inside the vial, the weak gels do
not flow if turned upside-down, but if they are shaken they flow. One strong sample
was found for every IL. These samples do not flow even when shaken manually.
30
[SMIM][TFSI] [C5MIM][TFSI]A200 Concentration Phase Behavior A200 Concentration Phase Behavior
0.2wt% Liquid 2.0wt% Liquid 1.0wt% Liquid 3.0wt% Liquid 1.2wt% Liquid 3.3wt% Liquid 2.0wt% Liquid 3.5wt% Weak Gel2.2wt% Liquid 3.8wt% Weak Gel2.6wt% Liquid 4.0wt% Weak Gel2.8wt% Liquid 6.1wt% Strong Gel3.0wt% Weak Gel3.2wt% Weak Gel3.6wt% Weak Gel6.3wt% Strong Gel A200 Concentration Phase Behavior
[C2MIM][TFSI] 0.2wt% Liquid A200 Concentration Phase Behavior 2.5wt% Liquid
2.0wt% Liquid 3.2wt% Liquid + Weak Gel3.0wt% Liquid 3.5wt% Liquid + Weak Gel3.2wt% Gel 3.7wt% Liquid + Weak Gel3.8wt% Gel 4.0wt% Weak Gel4.0wt% Gel 4.5wt% Weak Gel6.4wt% Strong Gel 6 wt% Strong Gel
[EtOHMIM][TFSI]

Table 4. Gel concentrations, i.e. at this concentration the mixture starts behaving as a solid like
material. aThe [SMIM][TFSI] dispersion present a meniscus if turned upside down. b[EtOHMIM][TFSI] presented phase separation in every concentration below 4 wt%, even
though the 3.2 wt% shows gel and liquid phase at the same time.
Ionic Liquid Silica wt%
[SMIM][TFSI] 3.0a
[C5MIM][TFSI] 3.5
[C2MIM][TFSI] 3.8
[EtOHMIM][TFSI] 4.0b
The values obtained for the gelation concentration are in agreement with literature
for similar ionic liquids [13] [14]. Studies done in literature use silica concentrations
high enough to gel the ILs, but they do not give much attention to an exact gel
concentration. The values reported in table 4 are meant to be a precise gel
concentration for A200. It is not yet clear what the mechanism for the gelation of the
ionic liquids is. Watanabe and coworkers have tried to explain the physicochemical
properties of protic and aprotic ionic liquids gels. However they have not discuss the
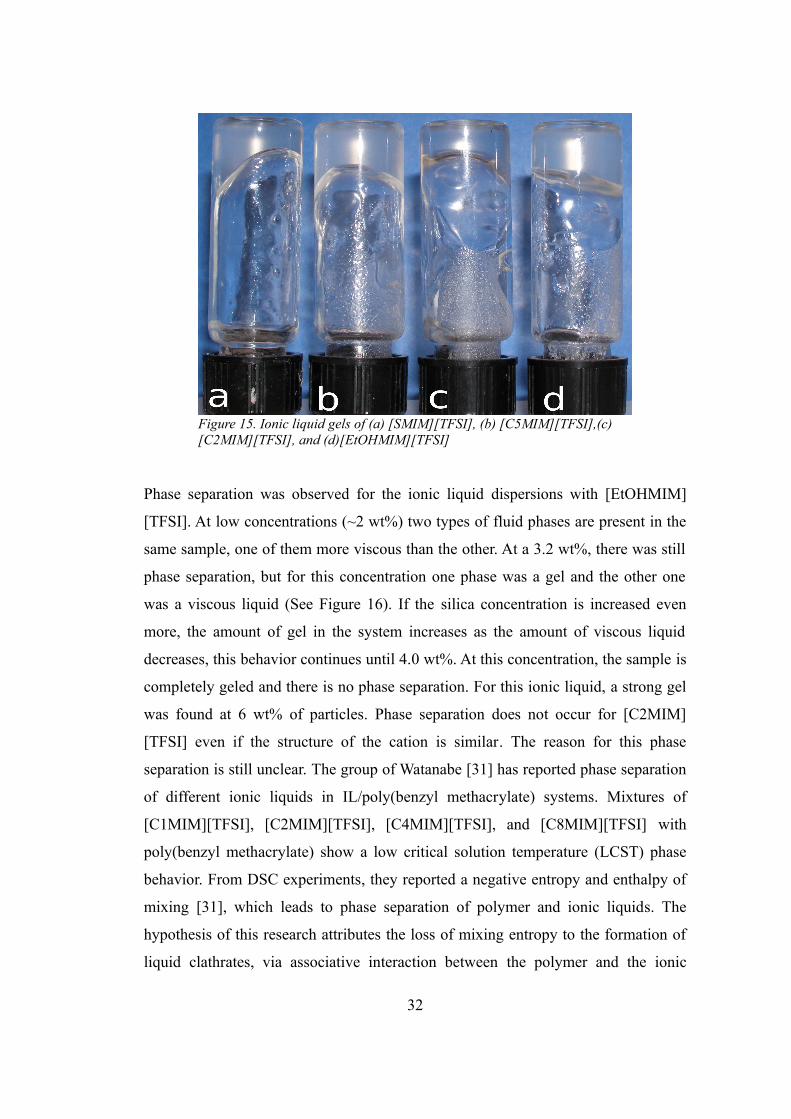
basic mechanisms for the gelation of ionic liquids in detail. Figure 15 shows the
ionic liquid gels for the concentrations mentioned in Table 4.
31
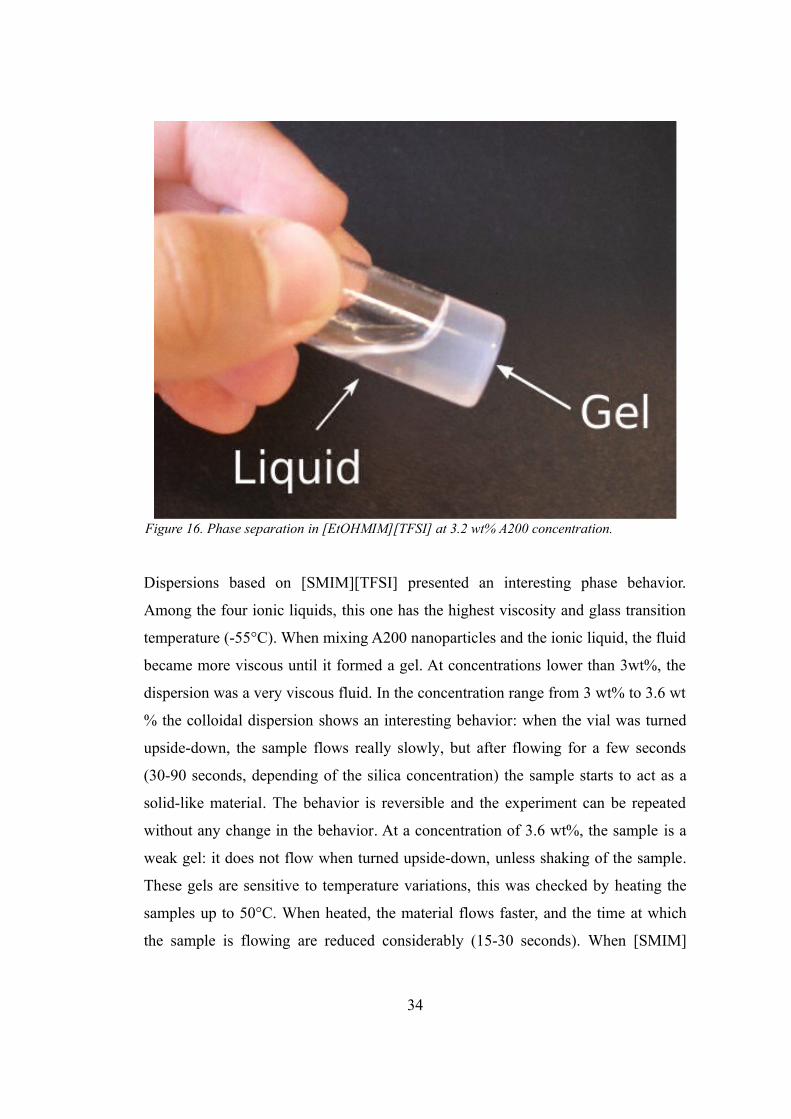
Phase separation was observed for the ionic liquid dispersions with [EtOHMIM]
[TFSI]. At low concentrations (~2 wt%) two types of fluid phases are present in the
same sample, one of them more viscous than the other. At a 3.2 wt%, there was still
phase separation, but for this concentration one phase was a gel and the other one
was a viscous liquid (See Figure 16). If the silica concentration is increased even
more, the amount of gel in the system increases as the amount of viscous liquid
decreases, this behavior continues until 4.0 wt%. At this concentration, the sample is
completely geled and there is no phase separation. For this ionic liquid, a strong gel
was found at 6 wt% of particles. Phase separation does not occur for [C2MIM]
[TFSI] even if the structure of the cation is similar. The reason for this phase
separation is still unclear. The group of Watanabe [31] has reported phase separation
of different ionic liquids in IL/poly(benzyl methacrylate) systems. Mixtures of
[C1MIM][TFSI], [C2MIM][TFSI], [C4MIM][TFSI], and [C8MIM][TFSI] with
poly(benzyl methacrylate) show a low critical solution temperature (LCST) phase
behavior. From DSC experiments, they reported a negative entropy and enthalpy of
mixing [31], which leads to phase separation of polymer and ionic liquids. The
hypothesis of this research attributes the loss of mixing entropy to the formation of
liquid clathrates, via associative interaction between the polymer and the ionic
32
Figure 15. Ionic liquid gels of (a) [SMIM][TFSI], (b) [C5MIM][TFSI],(c)[C2MIM][TFSI], and (d)[EtOHMIM][TFSI]

liquid. To further investigate the phase separation of [EtOHMIM][TFSI]
dispersions, further DSC experiments should be performed to determine the phase
diagram. A reasonable hypothesis would take into account that the OH group on
[EtOHMIM] changes the interaction of the IL with the A200 particles. The group of
Watanabe reports [31] that a slight difference in the structure of the cation, such as
the additional CH3 in the alkyl chain in imidazolium based ILs, results in a big
change (~20°C) in the critical temperature at which the mixture phase separates. In
the case of this work, the addition of an OH group in the alkyl chain also changes
the critical temperature.
The weak gel samples of show yield stress. This was checked by manually shaking
the vial containing the sample (for [EtOHMIM][TFSI] this was checked at
concentrations higher than 4 wt%). Before shaking the vial the samples do not flow
flow, even if the vials are upside-down, but if the sample is shaken, the ionic liquid
gel starts to flow. A short time (around one second) after the shaking stops, the
sample acts as a solid-like material again. This experiment can be done several times
without changing the outcome i.e. the sample changes from solid to liquid-like
material if shaken and from liquid to solid-behavior when the shaking stops. When
shaking the vials, it is possible that there is a disruption of the interparticle physical
bonds, leading to a liquid-behavior on the material. Once the shaking stops, the
bonds between nanoparticles are rapidly restored, this makes the material behave as
a gel again. Even though all the weak gel samples presented this behavior, it is worth
noting that the weak gels made of [SMIM][TFSI] are stiffer, i.e. to achieve yield
stress a higher strength is needed. It is possible that [SMIM][TFSI] has a higher
yield stress because the viscosity is the highest among all the ionic liquids.
33
Dispersions based on [SMIM][TFSI] presented an interesting phase behavior.
Among the four ionic liquids, this one has the highest viscosity and glass transition
temperature (-55°C). When mixing A200 nanoparticles and the ionic liquid, the fluid
became more viscous until it formed a gel. At concentrations lower than 3wt%, the
dispersion was a very viscous fluid. In the concentration range from 3 wt% to 3.6 wt
% the colloidal dispersion shows an interesting behavior: when the vial was turned
upside-down, the sample flows really slowly, but after flowing for a few seconds
(30-90 seconds, depending of the silica concentration) the sample starts to act as a
solid-like material. The behavior is reversible and the experiment can be repeated
without any change in the behavior. At a concentration of 3.6 wt%, the sample is a
weak gel: it does not flow when turned upside-down, unless shaking of the sample.
These gels are sensitive to temperature variations, this was checked by heating the
samples up to 50°C. When heated, the material flows faster, and the time at which
the sample is flowing are reduced considerably (15-30 seconds). When [SMIM]
34
Figure 16. Phase separation in [EtOHMIM][TFSI] at 3.2 wt% A200 concentration.

[TFSI] with 3.6 wt% of silica was heated at 50°C, there is no flow of the dispersion.
Figure 17 shows a scheme of how the [SMIM][TFSI] gels with concentrations
between 3 - 3.6 wt% behaves before and after turning the vial. It is worth noting that
this behavior does not happen for [C5MIM][TFSI], even if the structures of the ionic
liquids are similar.
To check the mechanical stability [32] of the ionic liquid gels, an experiment was
done were a metallic sphere with a diameter of 4.5 mm and a weight of 372 mg was
placed on top of the gel in the vial. This was performed for one sample of each type
of IL: [C2MIM][TFSI] 3.8 wt%, [C5MIM][TFSI] 4w%, [SMIM][TFSI] 3.6%, and
[EtOHMIM][TFSI] 3.2 wt%. The four samples (with the metallic sphere on the top)
were then heated up to 110°C. At this temperature, none of the balls descend to the
bottom of the sample. This indicates that up to 110°C, the gels are mechanically
stable. It is worth noting that in the [SMIM][TFSI] 3.6% sample, bubbles started to
appear around the metallic sphere at 110°C. To further check the stability of the gels
a simple experiment was performed: once the metallic sphere was placed in the vial
the gel were shaken. The result of this was that the spheres reached the bottom of the
vial. After a few minutes, the samples are turned upside-down: the balls do not fall
of the gel, unless there is some perturbation disrupting the structure of the gel (like
35
Figure 17. [SMIM][TFSI] gel behavior:(left) the weak gel is unperturbed, (center) when turned, the weak gel starts to flow, and (right) the gel reaches a final gel behavior.

manually shaking the sample). In figure 18 a picture of the metallic ball inside the
gel before and after turning, as it is clear, the gel is stable and the ball does not flow.
The metal ball experiment was also done for gels of [SMIM][TFSI] with
concentrations 3 – 3.2 wt%. At room temperature, the ionic liquid gels with low
silica concentration (3wt%) were not able to support the metallic sphere, i.e. the ball
touched the bottom of the vial as soon as it was placed in the container. However,
the sample with higher concentration (3.2 wt%) was able to support the ball at room
temperature. When the gel sample (3.2 wt%) was heated at ~100°C, the ball goes to
the bottom of the vial. This indicates that the interparticle interaction is not as strong
as for the gel samples with higher silica concentration.
B. Glass Transition Temperature.
DSC measurements were performed to determine the glass transition temperature of
the pure and gelled ionic liquids. By comparing different ionic liquids, it is noticed
36
Figure 18. Metallic sphere experiment for [C2MIM][TFSI] 3.8 wt% silica.
that the differences in Tg can be related to two main factors: from the change in the
length of the imidazolium side chain and from the addition of a side group in the
alkyl chain. It is clear from Table 5, that the influence of the side group on the alkyl
chain has stronger influence than the length of the alkyl chain, in agreement with
literature [33] [34].
Table 5. Glass Transition Temperature of the pure ionic liquids.
Ionic LiquidGlass Transition
Temperature
[SMIM][TFSI] -55°C
[C5MIM][TFSI] -85°C
[EtOHMIM][TFSI] -75°C
[C2MIM][TFSI] -91°C
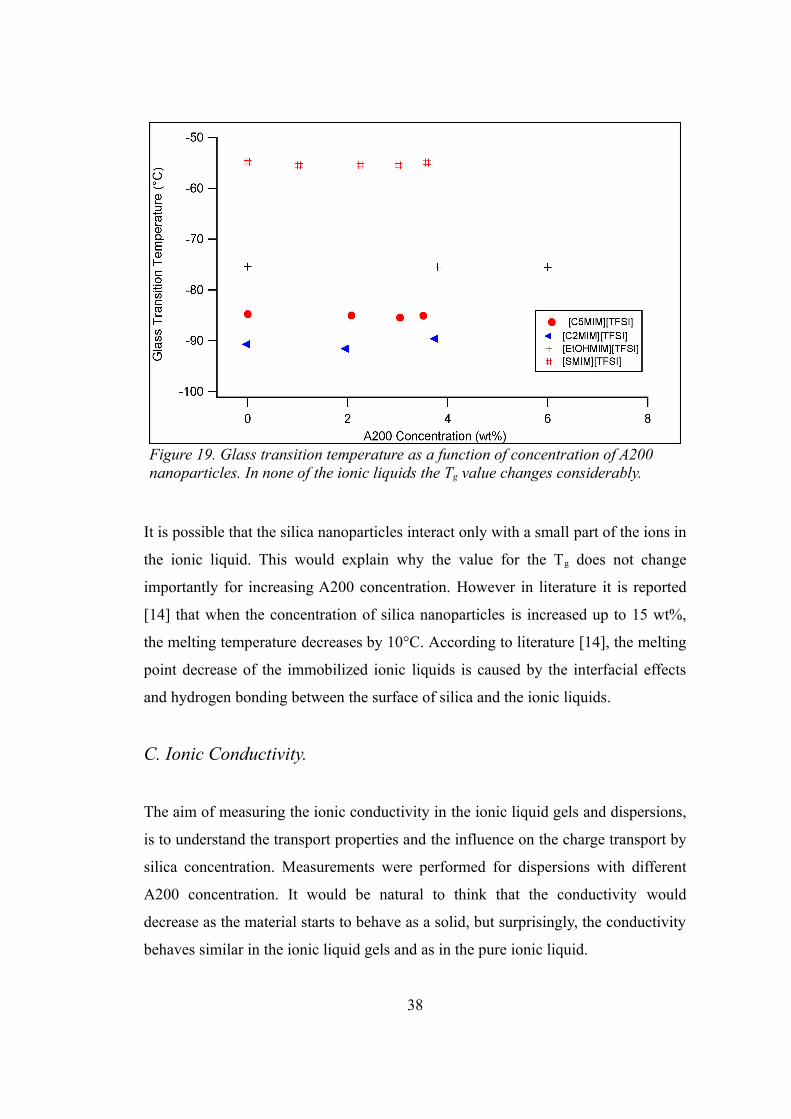
The variation of the glass transition temperature with A200 concentration is reported
in Figure 19. Which clearly shows that Tg does not change significantly with the
silica concentrations used in these experiments. The weak influence of the silica
concentration on the glass transition suggests that on average there is not a very
strong interaction between the ionic liquid and the silica nanoparticles, at least in
this concentrations range.
37
It is possible that the silica nanoparticles interact only with a small part of the ions in
the ionic liquid. This would explain why the value for the Tg does not change
importantly for increasing A200 concentration. However in literature it is reported
[14] that when the concentration of silica nanoparticles is increased up to 15 wt%,
the melting temperature decreases by 10°C. According to literature [14], the melting
point decrease of the immobilized ionic liquids is caused by the interfacial effects
and hydrogen bonding between the surface of silica and the ionic liquids.
C. Ionic Conductivity.
The aim of measuring the ionic conductivity in the ionic liquid gels and dispersions,
is to understand the transport properties and the influence on the charge transport by
silica concentration. Measurements were performed for dispersions with different
A200 concentration. It would be natural to think that the conductivity would
decrease as the material starts to behave as a solid, but surprisingly, the conductivity
behaves similar in the ionic liquid gels and as in the pure ionic liquid.
38
Figure 19. Glass transition temperature as a function of concentration of A200 nanoparticles. In none of the ionic liquids the Tg value changes considerably.

Figures 20 and 21 show Arrhenius plots of the ionic conductivity for the ionic
liquids and ionic liquid dispersions. In figure 20b and figure 21b, there is a scaling
of the conductivity using the glass transition temperature. This is done to analyze
how the conductivity depends on the glass transition temperature.
Figure 20a shows the ionic conductivity as a function of inverse temperature for
[C2MIM][TFSI] and [EtOHMIM][TFSI] for different silica concentrations. As
expected for ionic liquids, the conductivity follows a non-Arrhenius dependence
[33]. For [C2MIM][TFSI], there is an abrupt change in the conductivity at ~-15°C,
related to the crystallization of this ionic liquid (see the full DSC curve of [C2MIM]
[TFSI] in Figure 7). In the temperature range where the samples behave as liquids,
the conductivity is slightly higher for a sample with silica particles rather than the
pure ionic liquid. At 20°C, the sample with highest conductivity for [C2MIM][TFSI]
dispersions is the one with 2.0 wt% silica (which is a liquid sample), the second
highest conductivity is the pure ionic liquid, and the worst conductivity is found for
the sample with a 3.5wt% concentration (which is a gel) (see figure 15). This
suggest that the silica nanoparticles slightly enhance the conductivity of ionic liquid
39
Figure 20. Conductivity as a function of inverse temperature for [C2MIM][TFSI] and [EtOHMIM][TFSI] for different A200 concentrations. In figure 19b a scaling of the temperature axis with glass transition temperature is used.
dispersions at low silica concentration. However if the silica concentration is high
enough, the silica lowers the conductivity of the dispersion.
For [EtOHMIM][TFSI] the conductivity behaves in a similar way since this ionic
liquid phase separates for silica concentrations lower than 4wt%, the ionic
conductivity was measured for gel (4 and 6wt%) and for the pure ionic liquid. No
measurement of liquid dispersion was performed. Interestingly, a slightly higher
conductivity is found for the sample with 4wt% silica, compared to the pure ionic
liquid. The gel with 6wt% A200 has the lowest conductivity among the three
samples. In literature [35] a higher conductivity it is reported for the pure ionic
liquid compared to the gel samples for [C2MIM][TFSI], but the used concentrations
in reference [35] are higher than the ones used in this work (5-15 w% silica).
Near room temperature (20°C) the conductivity of [EtOHMIM][TFSI] and
[C2MIM][TFSI] are 2.16·10 ³ and ⁻ 1.11·10⁻² S/cm respectively. At every
temperature, [EtOHMIM][TFSI] presents a lower conductivity than [C2MIM]
[TFSI]. This may be due to the fact that the [EtOHMIM] cation is heavier and
bulkier than [C2MIM], thus reducing the diffusivity of the charge carrier. Also, the
presence of an additional OH group on the cation might induce more hydrogen-
bonds within the ionic liquid, leading to stronger ion-ion interaction, hence, reducing
the mobility of charge carriers and decreasing the conductivity.
The scaling of the conductivity using the glass transition temperature for
[EtOHMIM][TFSI], [C2MIM][TFSI] and the corresponding silica containing
samples, are shown in Figure 20b. Even though there is not much change in the
glass transition temperature with silica concentration, the conductivity values tend to
align on the same curve for both ionic liquids. This indicates that both ionic liquids
have the same temperature dependence of the conductivity. Furthermore, the results
suggest that in [EtOHMIM][TFSI] and [C2MIM][TFSI] gel samples, the
conductivity is closely related to the viscosity of the pure ionic liquids, rather than
the viscosity of the ionic liquid gels.
40

In Figure 21 the temperature dependence of conductivity is shown for [C5MIM]
[TFSI] and [SMIM][TFSI]. Similar to the other two ionic liquid dispersions, the
conductivity is higher for the samples containing [C5MIM][TFSI], since the cation
is smaller and lighter than the [SMIM] cation. The conductivities at room
temperature (~20°C) of [C5MIM][TFSI] and [SMIM][TFSI] are 3.4·10 ³ and⁻
2.5·10 S/cm.⁻⁴ For both dispersions, the conductivity dependance on concentration
is similar. The conductivity of the liquid material is the slightly higher than for the
gel material. For [C5MIM][TFSI] at room temperature, the conductivity is higher
for the pure ionic liquid than for the ionic liquid gel (3.8 wt%). In a similar way, for
[SMIM][TFSI], the sample with higher conductivity is the one with 2.2 wt% silica
(which is a viscous liquid at room temperature), the second highest conductivity is
found in the pure ionic liquid, and finally, the sample containing 3.6 wt% of A200
(which acts as a solid material at room temperature)
Conductivity scaling with Tg in Figure 21b, shows that the conductivities of the two
ionic liquids present the same temperature dependence. This shows that the
conduction process is dominated by the viscous properties of the ionic liquid
component, rather than the viscosity of the ionic liquid gels.
41
Figure 21. Conductivity for [C5MIM][TFSI] and [SMIM][TFSI] as a function of temperature. (a) shows the arrhenius plot, (b) presents the scaling with the glass transition temperature.

It is reported in literature that the addition of silica nanoparticles slightly decreases
the ionic conductivity due to a decrease in anion and cation mobility [35].
Nevertheless, in this work it is found that when the dispersions have a low silica
concentration, the ionic conductivity is slightly enhanced. Even though it is not clear
why this happens, a possible explanation would consider that when adding silica to
the IL, some impurity from the A200 nanoparticles could be introduced in the
dispersions. If the material has a low silica concentration, these impurities could
enhance the ionic conductivity. If the silica concentration is high enough, the
contribution of the impurity could be decreased due to the space restrictions imposed
by the silica particles. Possible impurities of A200 nanoparticle are listed in
reference [25]
D. Molecular Interactions
In the Raman spectra of the ionic liquid gels there are many bands to search for
vibrational information. In figure 22 the Raman spectrum for [SMIM][TFSI] is
shown. Nevertheless, in this thesis the interest is focused on the 740 cm ¹ band,⁻
which corresponds to the expansion and contraction of the hole TFSI anion [30].
The [TFSI] anion can exist in two conformations, a transoid (C1) and a cisoid form
42
Figure 22. Raman spectrum for [SMIM][TFSI].

(C2). In the C1 symmetry, the CF3 groups are both at the same side of the S-N-S
plane while in the C2 symmetry the CF3 groups are in opposite sides of the plane, see
Figure 23. The two conformations are able to co-exist in the ionic liquid, and the
conversion between them requires only a few kJ/mol, hence, TFSI is very flexible.
Ab-initio calculations have shown that the Raman shift difference between the two
conformations is around 3 cm ¹ ⁻ [36] and that the corresponding Raman cross-
sections are nearly equal. Hence the spectral component of the anion at 740cm ¹⁻ is
the sum of the contributions of the C1 and C2 conformations. In addition to
conformational effects, the band is very sensitive to interactions [36].
The 740 cm ¹ v⁻ ibrational mode for TFSI in the pure ionic liquids is shown in Figure
24. It is possible to see that there are shifts in the 740 cm ¹ peak for the ionic⁻
liquids. The differences in the vibrational modes are most likely related to changes
in the conformation of the TFSI, from the change in the C1/C2 ratio. The peaks are
located approximately at 740.5 cm ¹ ⁻ for [C2MIM][TFSI], 741.1 cm ¹ for⁻
[EtOHMIM][TFSI], 740.4 cm ¹ for [C5MIM][TFSI], and 741.3 for [SMIM][TFSI].⁻
From the shift in these peaks, it is possible to conclude that there is a higher change
from the influence of the addition of a side group in the alkyl chain than the length
of the side chain of the imidazolium ring.
43
Figure 23. Two conformations of [TFSI] anion transoid (left) and cisoid (right) symmetry

Figure 25 shows the 740 cm ¹ band for all ionic liquid gels. ⁻ All spectra were
normalized to the peak maximum. The background was subtracted from every
spectra in order to compare the results for different silica concentrations. Once
background is subtracted and the band is normalized, the peaks from each ionic
liquid overlap perfectly from 710 to 770 cm ¹. ⁻ This indicates that there is no change
of the vibrational mode of [TFSI] as the silica concentration increases, suggesting
that there is no change in conformation or ionic interactions of the [TFSI] anion as
the amount of silica increases.
44
Figure 24. Raman Spectra of 740 cm ¹ vibrational mode for the pure ionic liquids.⁻

45
Figure 25. Raman Spectra for 740 cm ¹ band for (a) [C⁻ 5MIM][TFSI], (b) [C2MIM][TFSI], (c) [SMIM][TFSI] and (d) [EtOHMIM][TFSI]
a.a. b.
c. d.

V. Conclusions and Further Work
Using A200 silica nanoparticles as a dispersed media, the ionic liquids: [SMIM]
[TFSI], [C5MIM][TFSI], [C2MIM][TFSI], and [EtOHMIM][TFSI] made stable
gels. For each ionic liquid gel, a different gel concentration was found. The phase of
the dispersions were characterized as liquid, gel, and strong gel. Results from
differential scanning calorimetry and dielectric spectroscopy, suggest that there is no
considerable influence of the A200 nanoparticles on the glass transition temperature
or ionic conductivity of the dispersion or gels, up to the reached silica concentration.
Using Raman spectroscopy, it was determined that there is not an important
influence of A200 on ionic interactions/conformation of TFSI, this was determined
up to the concentrations used in this work. A possible explanation is that the matrix
of silica nanoparticles act as a “container” for the ionic liquids: even though the
A200 nanoparticles are able to arrest the ionic liquid, they do not change
significantly thermal, ionic conductivity or vibrational properties of an ionic liquid.
Results suggest that the physical properties of pure ionic liquids are determined by
the structural differences of the ions, in this case, the length and end group of the
alkyl side chain on the cation. Usually, the end group of the side chain of the
imidazolium cation is of greater importance than the length of the chain.
Phase behavior was studied using a metallic sphere method. It was proven that the
ionic liquids form stable gels with A200 nanoparticles from room temperature until
110°C. The ionic liquid gel [EtOHMIM][TFSI] phase separates at concentrations
lower than 4wt% A200.
In the line of work of this thesis, some research ideas that could improve this work
are:
• Measure the temperature dependence of viscosity of the ionic liquid gels.
• Perform Photon Correlation Spectroscopy on the samples, this to obtain the
hydrodynamical size of the particles and the variation with A200
46

concentration.
• Perform rheological measurements for the gels, measuring elastic and
viscous moduli to characterize mechanical properties of gels, weak gels and
liquid dispersions.
• Perform infrared Spectroscopy to study hydrogen bonding between silica
nanoparticles.
47

Bibliography1. Wang, P.; Zakeeruddin, S. M.; Exnar, I.; Grätzel, M.; Journal of the American Chemical Society. 125, 1166-1167 (203)
2. Stathatos, E.; Lianos, P.; Zakeeruddin, S. M.; Grätzel, M.; Chemistry of Materials. 15, 1825-1829 (2003)
3. Seki, S. et al., J. Phys. Chem B. 110, 10228–10230 (2006)
4. Matsumoto, H., et all, J. Power Sources. 160, 1308-1313 (2006)
5. Gorlov, M.; Kloo, L.; Dalton Trans. 20, 2655-2666 (2008)
6. M. Freemantle, Introduction to Ionic Liquids. RSC Publishing, (2010)
7. Armand, M.; Endres, F.; MacFarlane, D. R.; Nat. Mat. 8, 621-629 (2009)
8. Welton T., Chem. Rev. 2071 (1999)
9. Wasserscheid, P; Keim, W; Angew Chem. Int. Ed. 39, 3772 (2000)
10. R.A.L Jones, Soft Condensed Matter Physics, (2002).
11. Klaas te Nijenhuis; Thermoreversible Networks, (1997).
12. Heremans, PH.; Colloidal Science II, (1949).
13. Ueno, K.; Imaizumi, S.; Hata, K.; Watanabe, M.; Langmuir. 25, 825-831 (2009)
14. Liu, Y.; Wu, G.; Fu, H.; Jiang, Z.; Sha, M.; Dalton Transactions. 39, 3190-3194 (2010)
15. Ueno, K.; Inaba, A.; Kondoh, M.; Watanabe, M.; Langmuir. 24, 5253-5259 (2008)
16. Ueno, K.; Inaba, A.; Ueki, T.; Watanabe, M.; American Chemical Society. 26, 18031-18038 (2010)
17. Ueno, K.; Inaba, A.; Kondoh, M.; Watanabe, M.; Journal of Physical Chemistry. 114, 13095-13103 (2010)
18. Jonas Nordtröm, Structure and Dynamics of Silica Dispersion and Gels, 2009.
19. IUPAC Compendium of Chemical Terminology, 66, (1997)
48

20. Trofymluk, O.; Levchenko, A.; Navrotsky, A; Journal of Chemical Physics. 123, 194509-1 - 194509-7 (2005)
21. Sergei V, Dzyuba, Chem. Phys. Chem. 3, 161-166 (2002)
22. Fredlake C. P.; Crosthwaite J. M.; Hert D. G.; J. Chem. Eng. Data. 49, 954 - 964 (2004)
23. Dzyuba S. V., Bartsch R.; Tetrahedron Letters. 43, 4657-4659 (2002)
24. Bonhote P.; Dias A. P.; Papageorgiou N; Inorg. Chem. 35, 1168-1178 (1996)
25. Technical Bulletin Fine Particles, 11, (1967)
26. P. J. Haines, Thermal Analysis and Calorimetry, (2002).
27. Jagath Pitawala, Structure-Property Relationship of Ionic Liquids and Their Li Salt Mixture, 2010.
28. Kremer, F.; Schonhals, A; Broadband Dielectric Spectroscopy, (2003).
29. Smith, Ewen; Dent, Geoffrey, Modern Raman Spectroscopy -A Practical Approach, (2005).
30. Martinelli, A.; Matic, A.; Johansson P.; Jacobsson P.; Bjorsson, L.; Journal of Raman Spectroscopy. 42, 522-528 (2010)
31. Ueki, T.; Kodama, K.; Kaino, S.; Takeshi, M.; Watanabe, M.; Pure Appl. Chem. 81-10, 1829–1841 (2009)
32. Yoshito, O.; Kanji, K.; Gels Handbook, (2001).
33. MacFarlane, D. R.; Pringle, J. M.; Johansson, K. M.; Forsyth, M.; Chem Communications. 1905, (2006)
34. Greaves, T. L.; Weerawerdena, A.; Fong, C.; Drummond, C.; J. Phys. Chem B. 110, 22479-22487 (2006)
35. Ueno, K.; Kenji, H.; Toru, K.; Masashi, K.; Watanabe, M.; J. Phys. Chem. B. 112, 9013-9019 (2008)
36. Rey, I.; Lassègues, J.C.; Grondin, J.; Servant, L., Electrochimica Acta. 43, 1505-1510 (1998)
49