genco shipping & trading limited - iis windows...
TRANSCRIPT

Genco Shipping & Trading Limited
Jefferies 5th Annual Shipping Logistics & Offshore Services Conference
September 16, 2008

Forward Looking Statements "Safe Harbor" Statement Under the Private Securities Litigation Reform Act of 1995
This presentation contains forward-looking statements made pursuant to the safe harbor provisions of the Private Securities Litigation Reform Act of 1995. These forward looking statements are based on management’s current expectations and observations. Included among the factors that, in our view, could cause actual results to differ materially from the forward looking statements contained in this presentation are the following: (i) changes in demand or rates in the drybulk shipping industry; (ii) changes in the supply of or demand for drybulk products, generally or in particular regions; (iii) changes in the supply of drybulk carriers including newbuilding of vessels or lower than anticipated scrapping of older vessels; (iv) changes in rules and regulations applicable to the cargo industry, including, without limitation, legislation adopted by international organizations or by individual countries and actions taken by regulatory authorities; (v) increases in costs and expenses including but not limited to: crew wages, insurance, provisions, repairs, maintenance and general and administrative expenses; (vi) the adequacy of our insurance arrangements; (vii) changes in general domestic and international political conditions; (viii) changes in the condition of the Company’s vessels or applicable maintenance or regulatory standards (which may affect, among other things, our anticipated drydocking or maintenance and repair costs) and unanticipated drydock expenditures; (ix) the number of offhire days needed to complete repairs on vessels and the timing and amount of any reimbursement by our insurance
209/16/08
offhire days needed to complete repairs on vessels and the timing and amount of any reimbursement by our insurance carriers for insurance claims including offhire days; (x) the Company’s acquisition or disposition of vessels; (xi) the fulfillment of the closing conditions under the Company's agreement to acquire a total of 11 remaining drybulk vessels; (xii) the decision of the charterer of the Genco Hadrian with respect to the option mentioned on slide 9; and other factors listed from time to time in our public filings with the Securities and Exchange Commission, including, without limitation, the Company's Annual Report on Form 10-K for the year ended December 31,2007 and its subsequent reports on Form 10-Q and Form 8-K.The timing and amount of purchases under the Company’s share repurchase program will be determined by management based upon market conditions and other factors. Purchases may be made pursuant to a program adopted under Rule 10b5-1 under the Securities and Exchange Act. The program does not require the Company to purchase any specific number or amount of shares and may be suspended or reinstated at any time in the Company’s discretion and without notice. Repurchases will be subject to restrictions under the Company’s existing credit facility. Our ability to pay dividends in any period will depend upon factors including the limitations under our loan agreements, applicable provisions of Marshall Islands law and the final determination by the Board of Directors each quarter after its review of our financial performance. The timing and amount of dividends, if any, could also be affected by factors affecting cash flows, results of operations, required capital expenditures, or reserves. As a result, the amount of dividends actually paid may vary. This presentation provides information only as of September 16, 2008 or such earlier date as may be specified in this presentation regarding particular information. The Company has no obligation to update any information contained in this presentation.

Genco Overview
� Founded in December 2004, completed IPO in July 2005
� High quality, modern fleet of 30 vessels
― Average age of 6.5 years compared to the average age of the world fleet of approximately 15 years
― Expected delivery of 11 additional vessels through the fourth quarter of 2009
� Dividend supported by time charter strategy
Consistent 75% coverage time charter strategy
3
― Consistent 75% coverage time charter strategy
― Over 90% of the remaining 2008 available days covered
― Over 60% of 2009 available days covered
― Charters with reputable multi-national companies
� 19.4% interest in Jinhui Shipping and Transportation Limited
� President and CFO have over 50 years of combined experience in shipping
� Internal commercial management and high-quality third-party technical management

Management
� Over 20 years of experience in the shipping industry
� Chairman and founder of Genco
� Chairman and CEO of
Peter GeorgiopoulosChairman
� Over 40 years of experience in the shipping industry
� Managing director of Wallem from 1996 to 2005
� Responsible for
Gerry BuchananPresident
� 15 years of experience in the shipping industry
� Formerly Senior Vice President of American Marine Advisors
� Significant experience in
John C. WobensmithChief Financial Officer
4
� Chairman and CEO of General Maritime and Chairman of Aegean Marine Petroleum
� Led growth of General Maritime from a single vessel to a fleet of 47
� Principal of Maritime Equity Management from 1991 to 1997
� Responsible for approximately 200 vessels at Wallem
� Prior experience with Canada Steamships Lines of Montreal and Denholm of Glasgow
� Worked in Asia, India and Hong Kong for over 15 years
� Significant experience in M&A, equity fund management and capital raising in the maritime industry
� Prior experience as a lender with First National Bank of Maryland
� Holds CFA designation

High Quality Operations
Selected Customer Relationships� Extensive relationships with established drybulk charterers
� These relationships help us to:
― Stabilize revenue through favorable contract terms
― Minimize counterparty risk
― Maximize fleet utilization
5
� We utilize four leading technical managers
― Allows access to savings from significant economies of scale
― In-house technical management staff actively oversees and benchmarks performance of each manager
Technical Managers
Anglo Eastern Group

28 2931
3841
32
37
42
To
tal
Nu
mb
er o
f V
ess
els
Execution of Growth Strategy� Genco Muse acquisition in August
2005 - $34.5 million
� Franco 3 vessel acquisition in July 2006 - $81.3 million
� Metrostar 9 vessel acquisition in July 2007 - $1.1 billion
� Evalend 6 vessel acquisition in August 2007 - $336.0 million
� Bocimar 3 vessel acquisition in May 2008 - $257.0 million
� 6 vessel acquisition in June 2008 -$530.0 million
6
1617 17
20 19
-3
2
7
12
17
22
27
1H 2005 2H 2005 1H 2006 2H 2006 1H 2007 2H 2007 1H 2008E 2H 2008E 1H 2009E 2H 2009E
To
tal
Nu
mb
er o
f V
ess
els
Handysize Handymax Supramax Panamax Capesize
Note: Reflects only announced and contracted acquisitions. The Metrostar, Bocimar / Delphis, and June 2008 six vessel acquisitions are subject to various closing conditions and delivery of vessels under the applicable contracts.

Built-In Growth
400 18,000EBITDA Ownership Days
� Ownership days expected to more than double after the completion of our expansion program as compared to 2007
� Significant time charter coverage supports dividend through volatile freight rate environments
― Over 90% of the remaining 2008 available days covered
― Over 60% of 2009 available days covered
EBITDA(1) Vs. Ownership Days
(Million $USD) (Days)
7
0
100
200
300
2005 2006 2007 2008E 2009E 2010E
0
3,000
6,000
9,000
12,000
15,000
(1) Please refer to page 31 for a definition of EBITDA

Diversified and Modern Fleet
Vessel Name Year Built DwtCapesize
Genco Augustus 2007 180,151
Genco Tiberius 2007 175,874
Genco London 2007 177,833
Genco Titus 2007 177,729
Genco Constantine 2008 180,183
Panamax
Genco Beauty 1999 73,941
Genco Knight 1999 73,941
Genco Vigour 1999 73,941
Genco Leader 1999 73,941
Genco Acheron 1999 72,495
Genco Surprise 1998 72,495
Genco Raptor 2007 76,499
Supramax
� Modern, diversified fleet
― 5 Capesize
― 7 Panamax
― 4 Supramax
― 6 Handymax
― 8 Handysize
A Portfolio Approach to Maximize ROC
8
Genco Predator 2005 55,407
Genco Warrior 2005 55,435
Genco Hunter 2007 58,729
Genco Cavalier 2007 53,617
Handymax
Genco Muse 2001 48,913
Genco Marine 1996 45,222
Genco Wisdom 1997 47,180
Genco Carrier 1998 47,180
Genco Success 1997 47,186
Genco Prosperity 1997 47,180
Handysize
Genco Explorer 1999 29,952
Genco Pioneer 1999 29,952
Genco Progress 1999 29,952
Genco Reliance 1999 29,952
Genco Sugar 1998 29,952
Genco Charger 2005 28,398
Genco Challenger 2003 28,428
Genco Champion 2006 28,445
� Total dwt capacity of 2,150,000 dwt
Built-In Growth
� Newbuilding and modern vessels to be delivered
― 7 Capesize newbuildings
― 1 Panamax built 2007
― 3 Handysize newbuildings
� Total dwt capacity of 1,366,000 dwt

Acquisition Vessels to be Delivered
Vessel Type Vessel Name DWT Yard Delivery(1) Year Built(1) Charterer
Duration/Expiration
Cash Daily Rate
CapesizeGenco Hadrian(2) 170,500 Sungdong Q1 2009 2009
Cargill International S.A. (2)
46 to 62 months from delivery
65,000(3)
Genco Commodus
170,500 Sungdong Q2 2009 2009
Genco Maximus 170,500 Sungdong Q2 2009 2009
Genco Aurelius 170,500 Daehan Q2 2009 2009
Genco Claudius 170,500 Sungdong Q3 2009 2009
Genco Julian 170,500 Daehan Q3 2009 2009
Genco Valerian 170,500 Daehan Q4 2009 2009
Panamax
7
9
(1) Built dates and delivery dates for vessels delivering in the future are estimates based on guidance received from the sellers and respective shipyards.(2) Under the terms of this charter, if the Genco Hadrian is not delivered during 2008, the charterer has the option to cancel the charter. Based on further guidance from the shipyard
constructing the Genco Hadrian, we now expect this vessel to be delivered in January 2009.(3) This charter includes a 50% index-based profit sharing component above the base rate listed in the table. The profit sharing between the charterer and us for each 15-day period is
calculated by taking the average over that period of the published Baltic Cape Index of the four time charter routes, as reflected in daily reports. If such average is more than the base rate payable under the charter, the excess amount is allocable 50% to each of the charterer and us. A third-party brokerage commission of 3.75% based on the profit sharing amount due to us is payable out of our share.
Panamax Genco Thunder 76,499 Hudong Q3 2008 2007
Handysize Genco Eagle 32,000 Jinse Q1 2009 2009
Genco Falcon 32,000 Jinse Q1 2009 2009
Genco Hawk 32,000 Jinse Q1 2009 2009
3
Financial OverviewFinancial Overview

Balance Sheet Liquidity Position
Balance Sheet
Selected Financial Information
Updated Pro Forma 06/30/08(Dollars in thousands)
Debt(2) $1,129,500
Revolving Credit FacilityCash(1) $1,377,000$64,168
Term Facility 320,000
11
Debt/Capitalization 57% Total Liquidity
Drawn PortionDebt(2) $1,129,500
Cash(1)Capitalization $1,974,986
Undrawn PortionShareholders’ Equity(3)
See the Appendix for a reconciliation of pro forma to actual figures.
(1) June 30, 2008 pro forma cash takes into effect the payment of $31.8 million in dividends on August 29, 2008 to all shareholders of record as of August 15, 2008.
(2) June 30, 2008 pro forma debt takes into effect the signing of a new $320 million term facility on September 4, 2008, the drawdown of $62.9 million for the 85% balance of the purchase price for the Genco Cavalier, and the anticipated drawdown of $77.35 million for the 85% balance of the purchase price for the Genco Thunder.
(3) June 30, 2008 pro forma equity takes into effect the payment of $31.8 million in dividends on August 29, 2008 to all shareholders of record as of August 15, 2008.
(1,129,500)
$567,500
$64,168
$631,668
$845,486

Q3 2008 Estimated Break-Even Levels(1)
Daily Expenses by Category Free Cash Flow(2) Net Income
Direct Vessel Operating(3) 4,700 4,700
General & Administrative(4) 1,021 1,556
Management Fees(5) 259 259
Dry Docking (6) 952 -
Interest Expense (7) 5,490 4,901
Depreciation(8) - 6,841
12
Depreciation - 6,841
Daily Break-Even(9) 12,422 18,257
(1) Breakeven levels are based on an average number of vessels of 29.98 vessels for Q3 2008.
(2) Free Cash Flow is defined as net income plus depreciation less capital expenditures, primarily vessel dry dockings, and other non-cash items, namely restricted stock compensation, deferred financing charges, and capitalized interest expenses.
(3) Direct Vessel Operating Expenses is based on management’s estimates and budgets submitted by our technical managers. We believe DVOE are best measured for comparative purposes over a 12-month period. Included in the 2008 are higher expenses related to the operation of the Capesize vessels we have taken delivery of as part of the Metrostar acquisition. As previously announced, the Company’s expected increase in its 2008 budget reflects the anticipated increased cost for crewing and lubes.
(4) General & Administrative amounts are based on a budget and may vary, including as a result of actual incentive compensation.
(5) Management Fees are based on the contracted monthly rate per vessel for the technical management of our fleet.
(6) Dry Docking represents the budgeted dry docking expenditures for Q3 2008.
(7) Interest Expense is based on our debt level as of June 30, 2008 of $989.2 million outstanding, the drawdown of $62.9 million for the 85% balance of the purchase price for the Genco Cavalier on July 17, 2008 and the anticipated drawdown of $77.3 million for the 85% balance of the purchase price for the Genco Thunder . Also included are unused commitment fees, and amortization of deferred financing costs for both the revolving and term credit facility. Of the outstanding amount, $681.2 million is calculated on our weighted average fixed swap rate of approximately 4.77% plus 0.85% margin and the remainder is calculated based on an assumed LIBOR rate of 3.25% plus 0.85% margin. Deferred financing costs as well as capitalized interest expense associated with the deposits on the capesize and handysize vessels from the Metrostar and six vessel acquisitions are taken into account, and carried interest with respect to our forward currency.
(8) Depreciation is based on the acquisition value of the current fleet, including the vessels to be acquired and amortization of dry docking costs.
(9) The amounts shown will vary based on actual results.
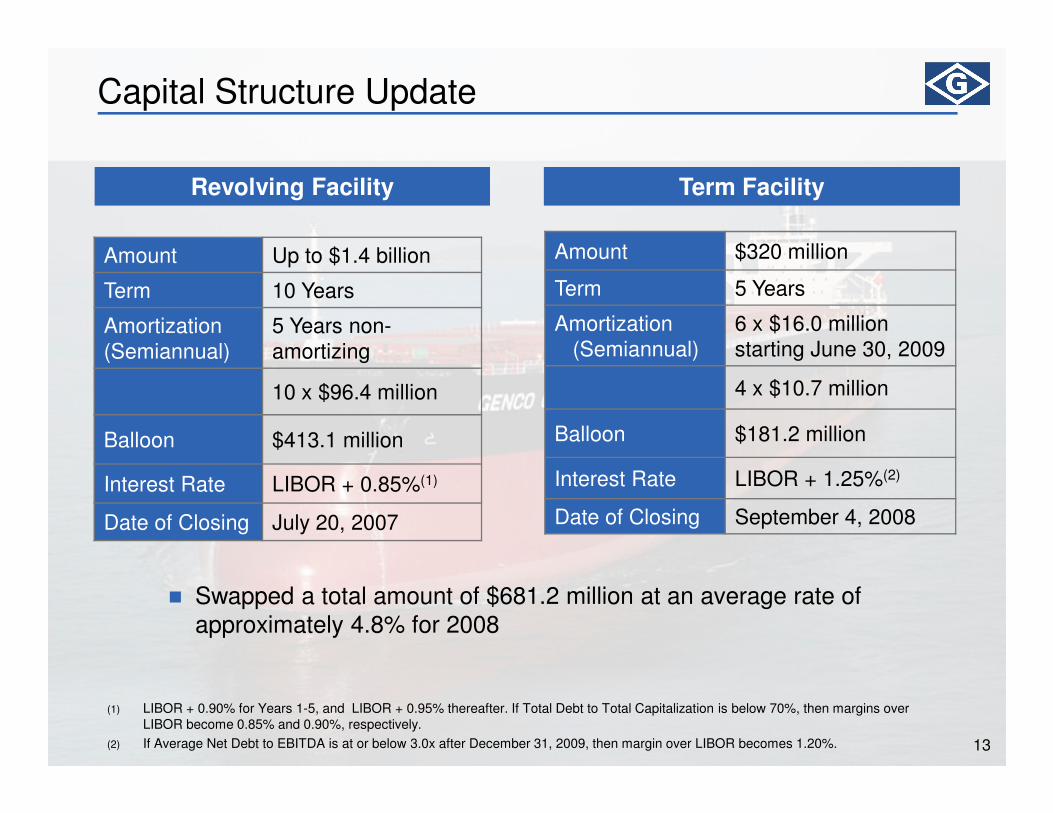
Capital Structure Update
Amount Up to $1.4 billion
Term 10 Years
Amortization (Semiannual)
5 Years non-amortizing
10 x $96.4 million
Amount $320 million
Term 5 Years
Amortization (Semiannual)
6 x $16.0 million starting June 30, 2009
4 x $10.7 million
Term FacilityTerm FacilityRevolving FacilityRevolving Facility
13
Balloon $413.1 million
Interest Rate LIBOR + 0.85%(1)
Date of Closing July 20, 2007
� Swapped a total amount of $681.2 million at an average rate of approximately 4.8% for 2008
(1) LIBOR + 0.90% for Years 1-5, and LIBOR + 0.95% thereafter. If Total Debt to Total Capitalization is below 70%, then margins over LIBOR become 0.85% and 0.90%, respectively.
(2) If Average Net Debt to EBITDA is at or below 3.0x after December 31, 2009, then margin over LIBOR becomes 1.20%.
Balloon $181.2 million
Interest Rate LIBOR + 1.25%(2)
Date of Closing September 4, 2008

Dividend Declaration & Policy
� Paid a Q2 2008 dividend of $1.00 on August 29, 2008 to all shareholders of record as of August 15, 2008
� Quarterly target rate of $1.00 per share for 2008
� Cash reserves are determined by our Board of Directors $0.60Q3 2006
$0.60Q2 2006
$0.60Q1 2006
$0.60Q4 2005
$0.60Q3 2005
Declared DividendPeriod
Disciplined Asset Growth and T/C Strategy
Disciplined Asset Growth and T/C Strategy
14
our Board of Directors
― Fleet maintenance, renewal and growth
― Future debt amortization
� Our charter coverage strategy provides us with stable cash flows
� Our dividend policy allows for future acquisitions
$1.00Q1 2008
$0.66Q3 2007
$0.66Q2 2007
$0.66Q1 2007
$0.66Q4 2006
$8.49Total:
$0.85Q4 2007
$0.60Q3 2006
10%
29%
18%
Q2 2008 $1.00

Growth Strategy: Timing Is Everything
Pursue Accretive Acquisitions
� Opportunistic and prudent acquisition strategy― Accretive earnings and cash flows while maintaining
a disciplined approach to return on capital
� Revolver is primary driver of growth strategy― Accretive to shareholders and reduces dependence
on capital markets
� Focus on high quality, modern drybulk vessels
15
� Focus on high quality, modern drybulk vessels
Maintain Strong Balance Sheet
� Maintain cash reserves
� Enhance stability and financial flexibility
� Grow fleet size, de-lever balance sheet, target increased dividend, repeat

Significant Opportunities in Fragmented Industry
100.0%
Ownership
� No single owner owns more than 7% of the vessels within each class
� Market capitalization for all U.S.-listed pure drybulk owners is approximately $10 billion (1)
� Drybulk industry has similarities to the tanker industry in 1999
16
31.8%21.6% 23.1% 17.7%
0.0%
20.0%
40.0%
60.0%
80.0%
Capesize Panamax Handymax Handysize
% o
f T
ota
l F
lee
t
Top 10 Owners
Consolidation Opportunities
Source: Clarkson’s Research Services(1) Combined market capitalization at close on September 12, 2008 of companies with the following ticker symbols: DRYS, DSX, EGLE, EXM, GNK, NM, NMM, OCNF, PRGN, SBLK, SB. Source: Bloomberg
Industry OverviewIndustry Overview

9%
16%38%
19%
38%
Global Seaborne Trade – 2007E
Total Seaborne Trade Drybulk Seaborne Trade
Bulk
Coking
Steam Coal
Container
General
Drybulk
18
16%
37%
38%
10% 26%
7%38%
Iron Ore
Grain
CokingCoal
Container
Liquid(Oil / Gases /
Chemical)
8.0 billion tons 3.0 billion tons
Source: Clarkson’s Research Services; 2007 Estimated

0
5,000
10,000
15,000
20,000
25,000
Week
1W
eek 3
Week
5W
eek 7
Week
9W
eek 1
1W
eek 1
3W
eek 1
5W
eek 1
7W
eek 1
9W
eek 2
1W
eek 2
3W
eek 2
5W
eek 2
7W
eek 2
9W
eek 3
1W
eek 3
3W
eek 3
5W
eek 3
7W
eek 3
9W
eek 4
1W
eek 4
3W
eek 4
5W
eek 4
7W
eek 4
9W
eek 5
1
Baltic Cape Index
(BCI Points)
Drybulk Indices
0
2,000
4,000
6,000
8,000
10,000
12,000
14,000
Wee
k 1
Week
3W
eek 5
Wee
k 7
Week
9W
eek
11W
eek 1
3W
eek 1
5W
eek
17W
eek 1
9W
eek
21W
eek
23W
eek 2
5W
eek 2
7W
eek
29W
eek 3
1W
eek 3
3W
eek
35W
eek 3
7W
eek 3
9W
eek
41W
eek 4
3W
eek 4
5W
eek
47W
eek 4
9W
eek 5
1
Baltic Dry Index
(BDI Points)
Baltic Panamax Index Baltic Supramax Index
19
Wee
k 11
Week
13
Week
15
Wee
k 17
Week
19
Wee
k 21
Wee
k 23
Week
25
Week
27
Wee
k 29
Week
31
Week
33
Wee
k 35
Week
37
Week
39
Wee
k 41
Week
43
Week
45
Wee
k 47
Week
49
Week
51
0
2,000
4,000
6,000
8,000
10,000
12,000
14,000
Week
1W
eek 3
Week
5W
eek 7
Week
9W
eek 1
1W
eek 1
3W
eek 1
5W
eek 1
7W
eek 1
9W
eek 2
1W
eek 2
3W
eek 2
5W
eek 2
7W
eek 2
9W
eek 3
1W
eek 3
3W
eek 3
5W
eek 3
7W
eek 3
9W
eek 4
1W
eek 4
3W
eek 4
5W
eek 4
7W
eek 4
9W
eek 5
1
(BPI Points)
Baltic Panamax Index
Source: Clarkson’s 2004 2005 2006 2007 2008
0
1,000
2,000
3,000
4,000
5,000
6,000
7,000
8,000
Week
1W
eek 3
Week
5W
eek 7
Week
9W
eek 1
1W
eek 1
3W
eek 1
5W
eek 1
7W
eek 1
9W
eek 2
1W
eek 2
3W
eek 2
5W
eek 2
7W
eek 2
9W
eek 3
1W
eek 3
3W
eek 3
5W
eek 3
7W
eek 3
9W
eek 4
1W
eek 4
3W
eek 4
5W
eek 4
7W
eek 4
9W
eek 5
1
(BSI Points)
Baltic Supramax Index

Major Drybulk Trade Routes
20
Source: Drewry
Iron Ore
Coal
Grains

China’s Development – Macro Picture� Chinese economic growth is predominantly domestically driven by urbanization
and industrialization
� $555 billion investment on transportation infrastructure to be invested as per the 11th five year plan
� $244 billion investment on reconstruction of earthquake-stricken Sichuan province
� Chinese fixed asset investment rise of 27.4% through August 2008
� Chinese industrial production grows 12.8% through August 2008
― Slowdown due to Olympic shutdowns
Chinese GDP
(Billion Yuan)
21
5,000
10,000
15,000
20,000
25,000
2002 2003 2004 2005 2006 2007
Private Consumption Government Consumption
Investment Net Exports
(1) Source: ICAP Hyde
(Billion Yuan)
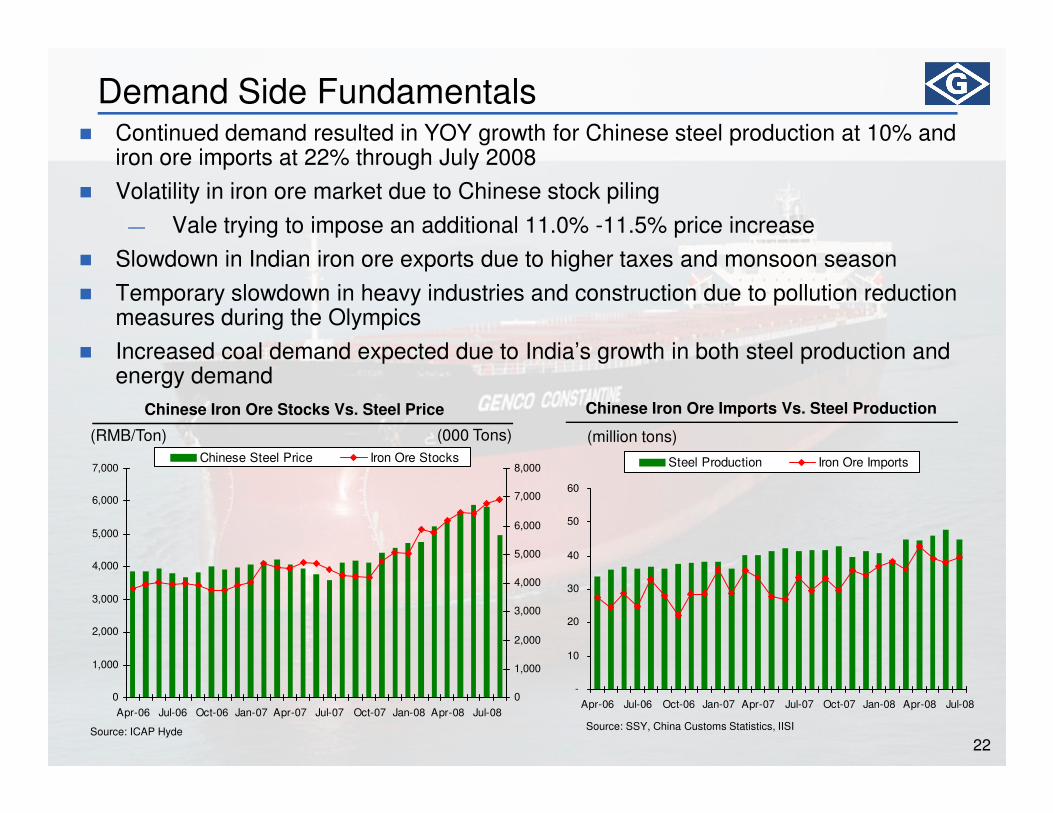
Demand Side Fundamentals� Continued demand resulted in YOY growth for Chinese steel production at 10% and
iron ore imports at 22% through July 2008
� Volatility in iron ore market due to Chinese stock piling
― Vale trying to impose an additional 11.0% -11.5% price increase
� Slowdown in Indian iron ore exports due to higher taxes and monsoon season
� Temporary slowdown in heavy industries and construction due to pollution reduction measures during the Olympics
� Increased coal demand expected due to India’s growth in both steel production and energy demand
Chinese Iron Ore Stocks Vs. Steel Price Chinese Iron Ore Imports Vs. Steel Production
22
Chinese Iron Ore Stocks Vs. Steel Price
(RMB/Ton)
Chinese Iron Ore Imports Vs. Steel Production
(million tons)
Source: SSY, China Customs Statistics, IISI
-
10
20
30
40
50
60
Apr-06 Jul-06 Oct-06 Jan-07 Apr-07 Jul-07 Oct-07 Jan-08 Apr-08 Jul-08
Steel Production Iron Ore Imports
Source: ICAP Hyde
0
1,000
2,000
3,000
4,000
5,000
6,000
7,000
Apr-06 Jul-06 Oct-06 Jan-07 Apr-07 Jul-07 Oct-07 Jan-08 Apr-08 Jul-08
0
1,000
2,000
3,000
4,000
5,000
6,000
7,000
8,000Chinese Steel Price Iron Ore Stocks
(000 Tons)

Commodity Volume Expansion
� Volume expansion might put pressure on commodity prices, but its transportation will benefit the dry bulk industry
� Ongoing Asian investments in Brazilian and Australian mining companies
� Iron ore production of approximately 600 Mt in 2007
― Potential to grow to 1,110 Mt in 2012
Estimated Iron Ore Production Expansion
(million tons)
23
0
200
400
600
800
1000
1200
2007 2008 2009 2010 2011 2012
Vale Rio Tinto BHP Billiton Fortescue MMX
Source: Vale, Rio Tinto, BHP Billiton, Fortescue, MMX, Jefferies Estimates

Supply Side Fundamentals
� 23% of Capesize orders for 2009 delivery and 33% of orders for 2010 being constructed at Greenfield yards(1)
� Credit crunch poses threat to new yards
� Newbuilding delivery delays starting to occur due to engine, crane and other part shortages
� Rising cost of steel has made some newbuildings unprofitable and will not be built by yards
� VLOC Conversions impact not certain
� Over 30% of the fleet is greater than 20 years old and will need renewal(1)
Drybulk Vessel Deliveries by Type(1)
(million dwt)
24
0
5
10
15
20
25
30
Q1 08 Q3 08 Q1 09 Q3 09 Q1 10 Q3 10 Q1 11 Q3 11 Q1 12 Q3 12
Handysize Handymax Panamax 60-85k Capesize 85-145k Capesize 145k+
(1) Source: ICAP Hyde

ConclusionsConclusions

Key Investment Highlights
Strong growth
Modern high-quality fleet with contracted growth
U.S.-based management team with strong track record
Dividend policy supported by time charters
26
Strong growth with dividends to
shareholders
time charters
Cost efficient operations
Built-In Growth
Favorable industry fundamentals

AppendixAppendix

Shareholders’ Equity(3)
06/30/08 Actual Adjustment
Pro Forma Reconciliation 06/30/08
(Dollars in thousands)
06/30/08 Pro Forma
Cash(1) $95,964 $64,168
Debt(2) $989,250 $1,129,500
$877,282
($31,796)
($31,796) $845,486
$140,250
28
Capitalization $1,866,532 $1,974,986-
(1) June 30, 2008 pro forma cash takes into effect the payment of $31.8 million in dividends on August 29, 2008 to all shareholders of record as of August 15, 2008.
(2) June 30, 2008 pro forma debt takes into effect the signing of a new $320 million term facility on September 4, 2008, the drawdown of $62.9 million for the 85% balance of the purchase price for the Genco Cavalier, and the anticipated drawdown of $77.35 million for the 85% balance of the purchase price for the Genco Thunder.
(3) June 30, 2008 pro forma equity takes into effect the payment of $31.8 million in dividends on August 29, 2008 to all shareholders of record as of August 15, 2008.

Year to Date Earnings
June 30, 2008 June 30, 2007 June 30, 2008 June 30, 2007
INCOME STATEMENT DATA:
Revenues 104,572$ 36,847$ 196,242$ 74,067$
Operating expenses:Voyage expenses 724 1,017 1,468 2,430 Vessel operating expenses 11,187 6,445 22,106 12,834 General and administrative expenses 4,431 3,052 8,842 6,247 Management fees 665 393 1,338 744 Depreciation and amortization 16,748 7,433 32,612 14,619 Gain on sale of vessel - - (26,227) (3,575)
Total operating expenses 33,755 18,340 40,139 33,299
(Dollars in thousands, except share and per
share data)
Three Months Ended
(unaudited)
(Dollars in thousands, except share and per share
data)
(unaudited)
Six Months Ended
29
Total operating expenses 33,755 18,340 40,139 33,299
Operating income 70,817 18,507 156,103 40,768
Other (expense) income:Income from short-term investment 2,590 - 2,590 - (Loss) Income from derivative instruments (1,315) (1,594) (1,380) (1,594) Interest income 422 888 975 1,954 Interest expense (11,615) (4,080) (23,402) (7,570)
Other (expense) income: (9,918)$ (4,786)$ (21,217)$ (7,210)$
Net income 60,899$ 13,721$ 134,886$ 33,558$
Earnings per share - basic 2.05$ 0.54$ 4.61$ 1.33$
Earnings per share - diluted 2.03$ 0.54$ 4.58$ 1.32$
Weighted average shares outstanding - basic 29,750,309 25,312,593 29,242,118 25,310,783
Weighted average shares outstanding - diluted 29,957,698 25,456,413 29,436,024 25,439,043

June 30, 2008 Balance Sheet
Dwt
June 30, 2008 December 31, 2007(Dollars in thousands)
BALANCE SHEET DATA:
Cash 95,964$ 71,496$ Current assets, including cash 270,895 267,594 Total assets 1,951,696 1,653,272 Current liabilities, including current portion of long-term debt 29,742 70,364 Total long-term debt 989,250 936,000 Shareholder's equity 877,282 622,185
June 30, 2008 June 30, 2007 June 30, 2008 June 30, 2007
OTHER FINANCIAL DATA:
(Dollars in thousands)
(unaudited) (unaudited)
(Dollars in thousands)
Three Months Ended
(unaudited)
Six Months Ended
30
(1) EBITDA represents net income plus net interest expense, income tax expense, depreciation and amortization, amortization of nonvested stock compensation, and amortization of the value of time charter acquired. EBITDA is a non-U.S. GAAP financial measure included because it is used by management and certain investors as a measure of operating performance. EBITDA is used by analysts in the shipping industry as a common performance measure to compare results across peers. Our management uses EBITDA as a performance measure in consolidating internal financial statements and it is presented for review at our board meetings. EBITDA is also used by our lenders in certain loan covenants. For these reasons, we believe that EBITDA is a useful measure to present to our investors. EBITDA is not an item recognized by U.S. GAAP and should not be considered as an alternative to net income, operating income or any other indicator of a company's operating performance required by U.S. GAAP. EBITDA is not a source of liquidity or cash flows as shown in our consolidated statement of cash flows. The definition of EBITDA used here may not be comparable to that used by other companies.
OTHER FINANCIAL DATA:
Net cash provided by operating activities 131,627$ 47,450$ Net cash used in investing activities (302,000) (90,401)
Net cash provided by financing activities 194,841 37,105
EBITDA Reconciliation: (unaudited) (unaudited)
Net Income 60,899$ 13,721$ 134,886$ 33,558$
+ Net interest expense 11,193 3,192 22,427 5,616 + Depreciation and amortization 16,748 7,433 32,612 14,619
+ Amortization of nonvested stock compensation 1,607 585 3,195 1,171
+ Amortization of value of time charters acquired (4,761) 461 (11,610) 917
EBITDA(1)85,686 25,392 181,510 55,881

2nd Quarter Highlights
June 30, 2008 June 30, 2007 June 30, 2008 June 30, 2007(unaudited) (unaudited)
FLEET DATA:Total number of vessels at end of period 29 19 29 19 Average number of vessels (1) 28.1 19.0 28.1 19.3 Total ownership days for fleet (2) 2,555 1,729 5,107 3,491 Total available days for fleet (3) 2,536 1,703 5,070 3,434 Total operating days for fleet (4) 2,518 1,668 5,033 3,371 Fleet utilization (5) 99.3% 98.0% 99.3% 98.2%
AVERAGE DAILY RESULTS:Time charter equivalent (6) 40,945$ 21,046$ 38,419$ 20,863$
Daily vessel operating expenses per vessel (7) 4,378 3,727 4,328 3,677
Six Months EndedThree Months Ended
31
(1) Average number of vessels is the number of vessels that constituted our fleet for the relevant period, as a measured by the sum of the number of days each vessel was part of our fleet during the period divided by the number of calendar days in that period.
(2) We define ownership days as the aggregate number of days in a period during which each vessel in our fleet has been owned by us. Ownership days are an indicator of the size of our fleet over a period and affect both the amount of revenues and the amount of expenses that we record during a period.
(3) We define available days as the number of our ownership days less the aggregate number of days that our vessels are off-hire due to scheduled repairs or repairs under guarantee, vessel upgrades or special surveys and the aggregate amount of time that we spend positioning our vessels. Companies in the shipping industry generally use available days to measure the number of days in a period during which vessels should be capable of generating revenues.
(4) We define operating days as the number of our available days in a period less the aggregate number of days that our vessels are off-hire due to unforeseen circumstances. The shipping industry uses operating days to measure the aggregate number of days in a period during which vessels actually generate revenues.
(5) We calculate fleet utilization by dividing the number of our operating days during a period by the number of our available days during the period. The shipping industry uses fleet utilization to measure a company's efficiency in finding suitable employment for its vessels and minimizing the number of days that its vessels are off-hire for reasons other than scheduled repairs or repairs under guarantee, vessel upgrades, special surveys or vessel positioning.
(6) We define TCE rates as our net voyage revenue (voyage revenues less voyage expenses) divided by the number of our available days during the period, which is consistent with industry standards. TCE rate is a common shipping industry performance measure used primarily to compare daily earnings generated by vessels on time charters with daily earnings generated by vessels on voyage charters, because charterhire rates for vessels on voyage charters are generally not expressed in per-day amounts while charterhire rates for vessels on time charters generally are expressed in such amounts.
(7) We define daily vessel operating expenses to include crew wages and related costs, the cost of insurance, expenses relating to repairs and maintenance (excluding drydocking), the costs of spares and consumable stores, tonnage taxes and other miscellaneous expenses. Daily vessel operating expenses are calculated by dividing vessel operating expenses by ownership days for the relevant period.