gender and racial discrimination in hiring: a pseudo audit ...ftp.iza.org/dp979.pdf · processes...
TRANSCRIPT
IZA DP No. 979
Gender and Racial Discrimination in Hiring:A Pseudo Audit Study for Three SelectedOccupations in Metropolitan Lima
Martin MorenoHugo ÑopoJaime SaavedraMaximo Torero
DI
SC
US
SI
ON
PA
PE
R S
ER
IE
S
Forschungsinstitutzur Zukunft der ArbeitInstitute for the Studyof Labor
January 2004

Gender and Racial Discrimination in Hiring: A Pseudo Audit Study for Three
Selected Occupations in Metropolitan Lima
Martin Moreno GRADE
Hugo Ñopo
Middlebury College, GRADE and IZA Bonn
Jaime Saavedra
World Bank, GRADE
Maximo Torero IFPRI, GRADE
Discussion Paper No. 979 January 2004
IZA
P.O. Box 7240 D-53072 Bonn
Germany
Tel.: +49-228-3894-0 Fax: +49-228-3894-210
Email: [email protected]
This Discussion Paper is issued within the framework of IZA’s research area Mobility and Flexibility of Labor. Any opinions expressed here are those of the author(s) and not those of the institute. Research disseminated by IZA may include views on policy, but the institute itself takes no institutional policy positions. The Institute for the Study of Labor (IZA) in Bonn is a local and virtual international research center and a place of communication between science, politics and business. IZA is an independent, nonprofit limited liability company (Gesellschaft mit beschränkter Haftung) supported by Deutsche Post World Net. The center is associated with the University of Bonn and offers a stimulating research environment through its research networks, research support, and visitors and doctoral programs. IZA engages in (i) original and internationally competitive research in all fields of labor economics, (ii) development of policy concepts, and (iii) dissemination of research results and concepts to the interested public. The current research program deals with (1) mobility and flexibility of labor, (2) internationalization of labor markets, (3) welfare state and labor market, (4) labor markets in transition countries, (5) the future of labor, (6) evaluation of labor market policies and projects and (7) general labor economics. IZA Discussion Papers often represent preliminary work and are circulated to encourage discussion. Citation of such a paper should account for its provisional character. A revised version may be available on the IZA website (www.iza.org) or directly from the author.
IZA Discussion Paper No. 979 January 2004
ABSTRACT
Gender and Racial Discrimination in Hiring: A Pseudo Audit Study for Three Selected Occupations in Metropolitan
Lima∗
In this paper, we adapt the audit studies methodology to analyze gender and racial differences in hiring for a particular segment of the market of three selected occupations in Metropolitan Lima: salespersons, secretaries and (accounting and administrative) assistants. The adapted pseudo-audit study methodology allows us to reduce the room for existence of statistical discrimination. The results suggest the existence of no significant differences in hiring rates for different gender-race groups but some systematic (and significant) differences in the aimed wages of the individuals in their job search processes. JEL Classification: C93, D63, J4, J7 Keywords: field experiments, discrimination, occupational segregation Corresponding author: Hugo R. Ñopo Warner 305C Economics Department Middlebury College Middlebury, Vermont 05753 USA Email: [email protected]
∗ The study was performed while the authors were researchers at GRADE. The Inter-American Development Bank financed a substantial component of this project. The comments of Loujia Hu, Claudia Piras, Andrew Morrison, Jacqueline Mazza and Chris Taber are deeply acknowledged.

1 Introduction
Despite social advances and a movement towards modernization of labor markets, there are still substantial
differences in earnings and opportunities for individuals from different gender and racial groups. Casual
observation of job openings posted in local newspapers reflects the existence of occupations for which
employers request only male or only female employees. In other postings, the euphemism “good presence”
is used to refer to specific racial preferences of those posting the job openings.
Occupational differences linked to racial differences among white, indigenous and mestizo individuals
persists due to the existence of stereotypes and prejudices, that are reinforced by differences in the oppor-
tunities of access to education and other assets. To these differences based on phenotypical characteristics,
one should also add cultural differences, observable through differences in behavior and speech. Sometimes
the employers make their decisions using these racial and ethnic differences as proxy measures of other
characteristics that they desire, but that are harder to observe in a job interview. As a result, the employers
discriminate individuals on the basis of their racial characteristics, but not because they have a “taste for
discrimination” instead because they use race as a signaling device (statistical discrimination).
In Peru, there are also substantial differences in occupational structures among gender and racial groups
and, to some extent, these differences explain the wage differences that have been documented by Ñopo,
Saavedra and Torero (2002). Occupational segregation is also linked to differences in asset ownership of
the individuals and their families. Blau and Ferber (2002) report that gender differences in occupational
structures in Latin America, measured by the Duncan index, are higher than those found in other regions
of the world. Occupational segregation, is the result of a sorting equilibrium that may involve the existence
of discrimination (either taste-based or statistical) from the employers or from the applicants (through
their decisions to apply only to those occupations for which they feel they have higher chances of being
accepted). By analyzing the figures of segregation only, it is not possible to identify whether the result has
a taste-based or statistical cause.
In this study we isolate and explore the first reason (employers decisions1), by analyzing the hiring
processes for some specific occupations, using information of real job applicants from the CIL-PROEMPLEO
network, the job intermediation service of the Peruvian Ministry of Labor and Employment Promotion.
For that purpose we followed males and females in the process of job seeking. Specifically, we focused on
salespersons, secretaries and accounting and administrative assistants. For those occupations, we captured
information about the gender and racial characteristics of applicants, as well as the characteristics that
would make them employable in the occupations for which they were applying. For every job posting, all
1Even more, as we will explain later in the paper, the design of the experiment leaves a small room for the existence ofstatistical discrimination.
2
the applicants had to fulfill a minimun set of requirements for age, schooling and occupational experience
that the firms required in their job postings. Hence, by construction, our sample has a reduced variance in
age, schooling and occupational experience (compared to the variance of those variables found at a national
level). Nonetheless, there is still a noticeable variance in family income, ownership of certain durable assets
and access to private schools. On the other hand, with respect to ethnic and racial differences of the indi-
viduals, there is considerable heterogeneity in the population under study, even though it represents only
a bounded portion of all the racial diversity that can be found in Lima. Individuals who can be typically
regarded as “Whites” do not seek employment through this intermediation service. Then, this study is
not oriented to analyze the possible segregation processes that occurs between a White elite and the rest
of the population, but to study the potential discriminatory processes that may affect the majority of the
population. The typically indigenous individuals, who have recently migrated to Lima, do not go to the
intermediation service either. In general, the population under study can be regarded as typical mestizos
with some degree of heterogeneity.
In this experiment we compare the performance of mestizo individuals (with different degrees of “mes-
tizaje”) that have similar characteristics in age, schooling and occupational experience. The heterogeneity
of the racial characteristics allow us to form, at the interior of the sample, groups of individuals such that,
in terms of their comparable differences, can be labeled as indigenous, mestizos and whites.
This study shares many of the characteristics present in traditional audit studies,2 but has overcome
some of the critiques given by Heckman.3 The paper first introduces the occupational segregation found
in Urban Peru and evaluates the methodology for this study. After this we show the characteristics of the
sample, results obtained from the study and finally we conclude by discussing the scope of this study in
the understanding of discrimination in the labor markets of Peru.
2 Occupational Segregation by Gender and Race in Peru
Blau and Ferber (1992) pointed out that Latin America reports the highest levels of occupational segre-
gation by gender in the world, measured by the Duncan index.4 However such high segregation occurs
not only by gender, but also by race. As there are some typically “male dominated” and “female domi-
nated” occupations, recent data allows us to document the existence of “white dominated” and “indigenous
dominated” occupations.
2Turner et al. (1991)3Heckman (1998)4This index is interpreted as the minimum percentage of individuals of one of the comparing groups that should change
their occupations in order to equalize the distributions of individuals accross occupations for both groups. See Fluckiger ySilber (1999) for a detailed description of the Duncan index as well as some other segregation measures.
3
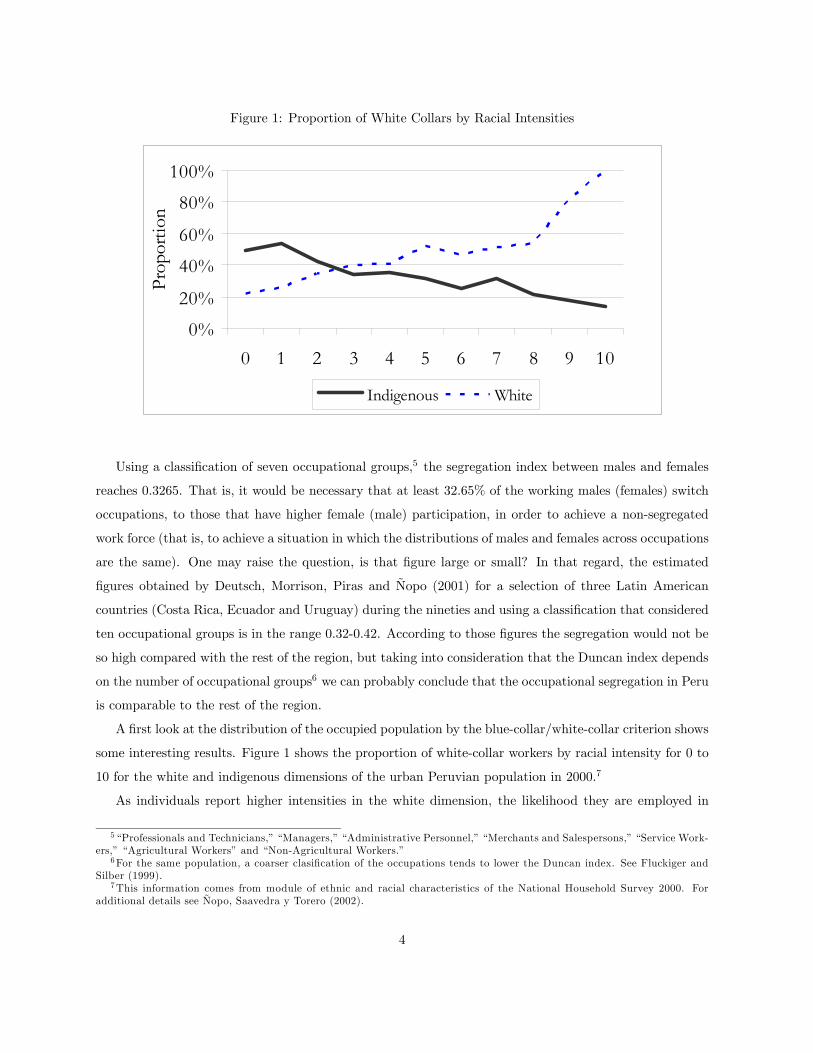
Figure 1: Proportion of White Collars by Racial Intensities
0%
20%
40%
60%
80%
100%
0 1 2 3 4 5 6 7 8 9 10
Prop
ortio
n
Indigenous White
Using a classification of seven occupational groups,5 the segregation index between males and females
reaches 0.3265. That is, it would be necessary that at least 32.65% of the working males (females) switch
occupations, to those that have higher female (male) participation, in order to achieve a non-segregated
work force (that is, to achieve a situation in which the distributions of males and females across occupations
are the same). One may raise the question, is that figure large or small? In that regard, the estimated
figures obtained by Deutsch, Morrison, Piras and Ñopo (2001) for a selection of three Latin American
countries (Costa Rica, Ecuador and Uruguay) during the nineties and using a classification that considered
ten occupational groups is in the range 0.32-0.42. According to those figures the segregation would not be
so high compared with the rest of the region, but taking into consideration that the Duncan index depends
on the number of occupational groups6 we can probably conclude that the occupational segregation in Peru
is comparable to the rest of the region.
A first look at the distribution of the occupied population by the blue-collar/white-collar criterion shows
some interesting results. Figure 1 shows the proportion of white-collar workers by racial intensity for 0 to
10 for the white and indigenous dimensions of the urban Peruvian population in 2000.7
As individuals report higher intensities in the white dimension, the likelihood they are employed in
5“Professionals and Technicians,” “Managers,” “Administrative Personnel,” “Merchants and Salespersons,” “Service Work-ers,” “Agricultural Workers” and “Non-Agricultural Workers.”
6For the same population, a coarser clasification of the occupations tends to lower the Duncan index. See Fluckiger andSilber (1999).
7This information comes from module of ethnic and racial characteristics of the National Household Survey 2000. Foradditional details see Ñopo, Saavedra y Torero (2002).
4

Figure 2: Duncan Index of Ocupational Segregation by Intensities in the Indigenous Dimension (BaseGroup= Intensity 0)
0
0.05
0.1
0.15
0.2
0.25
0.3
1 2 3 4 5 6 to 10
Intensities
Dun
can
Inde
x
Females Males
white-collar occupations increases rapidly. If only 20% of the individuals with white intensity equal to zero
work in white-collar occupations, that figure is almost 100% of individuals with white intensity equal to
ten. In the indigenous dimension the relationship is the opposite, the higher the intensity the lower the
share of white-collars.
Analyzing the seven occupational categories with a racial perspective will shed some light about the
segregation that exists in urban Peruvian labor markets. For that purpose, we compute the Duncan
indices that result from the comparison of those individuals that report intensity zero with different groups
of higher intensities, separating the comparison by gender. The results of the comparison in the indigenous
dimension are reported in Figure 2
As differences in the racial characteristics of individuals increase, the differences in their occupations
also increase. This result is more pronounced among females than among the males. In that sense, if it is
necessary that at least 12% (14%) of females (males) reporting indigenous intensity one switch occupations
with the group that has zero indigenous intensity in order to be distributed across occupations in the same
way, it would be necessary that at least 28% (18%) of females (males) that have intensity six or more do
so. The analogous analysis of the white dimension shows even more pronounced results. The levels of
occupational segregation increase as we compare individuals that report more characteristics that would
make them be perceived as indisputably white.
5

Figure 3: Duncan Index of Ocupational Segregation by Intensities in the White Dimension (Base Group=Intensities 0 and 1)
0
0.05
0.1
0.15
0.2
0.25
0.3
2 3 4 5 6 7 to 10
Intensities
Dun
can
Inde
x
Females Males
In summary, national statistics show that Peruvian labor markets are segregated, not only by gender,
but also by race. From the information we have yet shown, it is not possible to distinguish whether these
results are the outcome of a series of individual decisions (self-segregation) or the result of discriminatory
practices of the employers in their hiring decisions (discrimination in any of its forms, either statistically-
based or taste-based).
Given the nature of our study, which concentrates on some occupations for particular segments of
the market, it is expected that a great part of the “self-segregation effect” has already operated on the
individuals that belong to our sample. Hence, the gender and racial differences that we can find, if any,
will not be affected by the typical criticisms related to the existence of self-segregation or self-exclusion
from the labor markets.
6

3 Methodology of the Pseudo Audit Study.
3.1 Design of the study
This study is inspired by the audit studies proposed and then improved on by the researchers at the Urban
Institute.8 These studies try to verify the hypothesis of discriminatory behavior by a decision maker (the
interviewer for a job posting) by simulating the arrival of a group of observationally similar applicants
(called “auditors”) to the face of the decision maker. The simulation is repeated for many decision makers
and, if the outcome statistically favors (hurts) individuals with a particular set of characteristics, the
conclusion is that the individuals who show that particular set of characteristics are discriminated in favor
(against). As this audit study methodology has received some criticism,9 the specific methodology for the
study we present here represents a substantial improvement in the approach of verifying such discriminatory
hypothesis in the setup of hiring processes.
Typically, auditors are individuals specially hired for the purposes of the study. They show up to the job
interviews carrying CV’s that are specially tailored for the study in a way that the auditors that apply to
the same position have similar CV’s (therefore, they bring synthetic CV’s to their interviews). The typical
auditors who work for these studies are college students that look at their participation in the study as a
source of income. They are trained to show up to the interviews and make the pretense of being interested
in getting a job. In addition, they have to act as if they have the education and experience that their CV’s
claim. Interestingly enough, the occupations to which these studies are made typically require minimal
skills (this is done in order to keep to a minimum the possible differences in observable characteristics).
Finally, the job openings are found by the designers of the study in the newspapers.
These characteristics of the audit studies imply the following problems:
1. An auditor does not necessarily put in the same level of effort to get a job that a real job-seeker
would. Also, it is not possible to assure that the auditor will experience the same pressure and anxiety
that would be present in a real job interview.
2. The auditor knows the purpose of the study and, as is documented in the literature of experimental
psychology literature,10 this may generate incentives (conscious or unconscious) to bias the results towards
those that the researches are looking for.
3. Description of job requirements that appear in newspapers are typically very brief and rarely exhaus-
tive. In that case, the role of unobservable characteristics (which in this case would be those characteristics
8Cross et al. (1990); Turner et al. (1991).9Heckman pointed out that the results obtained from audit studies are, in general, unclear and unconvincing. See Heck-
man (1993, 1998) and Heckman and Siegelman (1993) for a critical description of the results from a detail analysis of theidentification assumptions behid the audit study model.10 See Lindzey and Aronson (1975) and Rosenthal (1976).
7
that the employers look after in the interviews, but the designers of the audit study do not take into account
to form the groups of auditors) can play prevalent role.
4. A college student who applies to a low skill position will, involuntarily, show personal characteristics
that eventually could make him/her be seen as an over-qualified applicant. As a consequence, the employers
may decide not to hire the over-qualified applicant because they may get afraid that he/she would not last
in the position.
For these reasons, one has to be suspicious about the results that come from the audit studies. There
are many sources of noise that could invalidate the results.
We overcome some of these critiques by designing a pseudo-audit study in which, instead of hiring
auditors to go to the job interviews, we select them from a pool of applicants to a job intermediation
service in Lima, Peru, the CIL-PROEMPLEO network. For that reason:
1. As opposed to taking the demand side of the labor market as given and simulate the supply side
with auditors, we simply monitor both sides of the market without simulating any behavior among the
agents. This is crucial for alleviating the problems related to issues 1 and 2 above.
2. Since the CIL-PROEMPLEO network (the intermediation service of the Ministry of Labor and Em-
ployment Promotion) has direct contact with the firms that post the job openings, they know the details
of the full requirements attached to every job posting. The information related to the observable charac-
teristics that the firms require is more complete than the information one could obtain from the reading
of a job posting in the newspaper. Having a richer set of information about observable characteristics, the
room for unobservables (in the sense enunciated in point 3 of the list of problems) is substantially smaller.
Hence, PROEMPLEO can send homogeneous groups of applicants to the interviews, more than what we
could expect from a traditional audit study. This alleviates the potential problems coming from points 3
and 4 in the previous list.
Given these considerations, the figures obtained from the data set of this pseudo-audit study would
have less room for noise than those reported in the previous literature. As a result, their validity is more
certain than the figures that were previously reported using traditional audit studies.
Nonetheless, this study has also the advantage that it is not based upon simulated behaviors of the
individuals. We did not need to hire a pool of auditors, but only a pool of monitors to observe the job
postings, as well as the applicants and the interviewers at each firm. consequently, we were able to afford
fieldwork that captures information (for job openings, interviewers and applicants) in numbers that are
substantially above those that the literature has for the studies of discrimination in hiring.11
11As it can be understood, the cost of each “observation” (a job posting with all its applicants) in the typical audit studiesis substantially higher than the cost of each observation in this pseudo-audit study. That cost reduction per observationallows us to manage a bigger data set.
8

3.2 Description of the fieldwork
Most of the information of the applicants to the occupations of interest was taken at the headquarters of
PROEMPLEO. The process was as follows. First, the intermediation specialists received the job postings
from the firms. Simultaneously, applicants that showed up to the offices of PROEMPLEO were interviewed
by the intermediation specialists who matched the individual characteristics of the applicants with the
requirements of the job postings available at the moment of the applicant’s arrival. The applicants were
sent to the firm for job interview only when they satisfied the minimum set of requirements for a posting.
The intermediation specialists were prohibited, by law, from using age, race or gender as characteristics
that define a match between applicants and postings. Even more, the application forms that the firms filled
to post their vacancies do not give space for these data. However, informally, many firms ask for applicants
of determined sex, and the intermediation specialists use this information. Before the applicants were sent
to the firms for their interviews, they were interviewed by our pool of monitors. There, they were asked
about some additional labor and socio-demographic characteristics (duration of the unemployment spell,
and familiy income among others), a picture was taken and their racial characteristics were registered in
our database. In other cases in which the applicant was sent to a job interview from an office other than the
headquarters, our poll of monitors visited the applicant at home. Part of our pool of monitors were sent to
the firms to give a questionaire to the job interviewers. Pretending to conduct a survey about the quality
of the services of PROEMPLEO, our monitors obtained information about personal characteristics of the
interviewers such as schooling, tenure, and age. The emphasis of this process, however, was on observing
their gender and racial characteristics.
With all the information collected through field work, there are three possible units for analysis in this
study: the applicants, the postings and the interviewers. Since we are interested in quantifying to what
extent the chances of getting hired for an individual are affected by their gender and racial characteristics,
after controlling for a set of observable covariates, we will analyze the job postings and all its applicants.
One firm may post more than one vacancy on the system, simultaneously or not. Additionally, one
applicant may apply to more than one posting, as long as he/she satisfies the requirements of each posting.
According to the scheme in Figure 4, we have a first hypothetical case in which firm 1 (F1) posts a
vacancy (V1) and three applicants go for the job interviews (A1,A2 and A3). For a second vacancy (V2),
offered by another firm (F2), there are two applicants (A4 and A5). In a more complex situation, the same
firm (F2) post another vacancy (V3) and three individuals apply (A6, A7 and A3, being the case that this
last applicant also applied to other vacancy).
9

Figure 4: Relationships Among Applicants, Vacancies and Firms
Applicants Vacancies Firms
A1
A2
A3
A4
A5
A6
A7
V1
V2
V3
F1
F2
4 Characteristics of the Sample
With the purpose of seeking the highest possible number of observations, we selected three occupations
with high levels of intermediation through PROEMPLEO. For that reason we selected job postings for
accounting and administrative assistants, secretaries and salespersons.12
We interviewed 1557 applicants between September 2002 and March 2003. They represented 2650
different applications to the 435 job postings offered by 202 different firms.
In some cases, the initial postings were cancelled by the firm (43% of them), either because the firm
hired somebody else from out of the system or because the opening was closed without any hiring. The
observations linked to those postings were not used. Also, for some other postings, PROEMPLEO sent
only one applicant to the firm (either by request of the firm or because there were no other applicants
satisfying the requirements at the moment of the posting). These observations were also left apart because
it is not possible to detect discrimination when an applicant has no competitors. For those reasons, the
number of observations was reduced to 882 applicants, 1713 applications and 292 postings.
On the other hand, 55 of the 202 firms surveyed had to be left unused because of missing observations
for one or more of the applicants to their postings. Finally, combining the restrictions imposed on the data,
we are left with 91 firms, 113 postings, 565 applicants and 760 applications, as seen in Figure 5.
12 Initially we also considered data-entry assistants, but the number of job openings that were posted into the system wastoo small to be considered.
10

Figure 5: The Sample
Sample Size
Total Valid ConstrainedSample a/ Sample b/ Sample c/
Applicants 2650 1713 760Individuals 1557 882 565
Postings 435 292 113Firms 202 146 91
a/ Includes applicants sent to postings that were cancelled by the firm or to postings with only one applicantb/ Includes postings for which we have information about all the applicants sentc/ Includes postings for which we have all the information about the applicants and the interviewers
Figure 6: The Sample by Occupations
Distribution of Applicants by Occupations
SALESPERSONS 227 29.87 29.87ACCOUNTING ASSITANT/ ADMINISTRATIVE ASSISTANT SECRETARY 350 46.05 100
Total Applicants 760 100
183 24.08 53.95
Frequency % Accumulated
11

4.1 Characteristics of the applicants
The sample of individuals for this study is composed of technicians and professionals from the middle
and lower income classes of metropolitan Lima, they are relatively young and generally have an above
high-school education. The average number of years of schooling is 13.6 (with a standard deviation of 1.9).
Only 20% of the individuals did not study after high-school. 23% graduated from a private high-school.
Their parents’ education was on average less than their own. Among the parents, those who just finished
high-school are in the majority, especially among mothers. Two thirds of the applicants are females.
Almost all the applicants have some labor experience, 87% have worked during the last twelve months
in some dependent position and 50% have been self-employed. This also reveals a prevalence of individuals
with secondary occupations. The average monthly earnings of the individuals in their last occupation as
an employee exceeds minimum wages by 50% and is close to the average monthly earnings in Metropolitan
Lima. The average unemployment spell of the applicants is 3.5 months. 36% report to have the required
experience for the position at which they apply and those figures are substantially higher among secretaries
and accounting assistants. Only 17% of the applicants were hired.
Females in the sample, on average, are one year younger than males and come from families with a higher
average income (although this difference is not significant). The percentage of females with unemployment
periods during the last 12 months is smaller than the analogous percentage of males.
Family and per-capita income are generally higher for those individuals who attended high-school at
a private institution, have taken some technical or professional studies at a university and whose parents
got post-high-school diplomas (either at universities or occupational institutions). The individuals who
attended private institutions for their technical or professional degrees have earnings that, on average, are
not substantially above the earnings of those who attended public institutions for the same degree.13
In terms of asset ownership, we found the expected patterns: the higher the monthly family income
quintile, the higher the asset ownership in the household. There is small dispersion in the ownership of
stoves and color TV’s, but it is higher for the rest of the assets. Even though the sample of applicants for
our study is drawn from a specific segment of the Limenian population that has relatively homogeneous
schooling, experience, and age; we observe high dispersion in earnings for both the applicants and their
families, that has a correlation with asset ownership, as can be seen in Figure 8.
13This is probably related to the fact that the private institutions that this segment of the population typically attendsare not of better quality than the public institutions. Actually, graduates from the elite Limenian universities do not use theservices of PROEMPLEO in their job search processes.
12

Figure 7: Average per-capita household income by characteristics of the applicant (in S/.)
AverageStandar
Deviation N
Attended High School in a:Private Institucion 348.4 201.1 173Public Institution 280.5 205.2 566
Attended Profesional or Technical studies in a:Private Institucion 317.0 204.5 242Public Institution 297.5 233.9 285
Attended Profesional or Technical studies in a:Superior Technological Institu 268.7 167.3 233University 336.8 243.1 329
Applicant's father maximun achievement:High School 269.5 188.4 503College and higher 353.6 229.6 236
Applicant's mother maximun achievement:High School 284.3 203.7 595College and higher 346.1 209.1 144
Per-Cápita Income
Figure 8: Selected assets of the applicant’s household by monthly household income quintile
Assets Total I II III IV VStove 94% 85% 96% 93% 98% 99%Color TV 88% 78% 83% 93% 96% 99%Dryer 61% 47% 50% 63% 70% 86%Boiler 42% 20% 32% 41% 51% 81%Cable 34% 19% 23% 26% 49% 56%Phone line 27% 10% 23% 24% 35% 52%Washing machine 19% 7% 18% 13% 28% 30%Savings 16% 10% 9% 15% 18% 32%Car 16% 4% 8% 11% 24% 36%Microwave oven 2% 0% 1% 2% 3% 7%
Applicant's Family Income Quintile
13

Figure 9: Comparison of characteristics between the applicants to PROEMPLEO and the sample of theNational Survey of Households (ENAHO) 2001
Enaho 2001-III Enaho 2001-III (a) (b)
Years of education 13.6 12.3 12.1Female 71% 53% 56%Age (in years) 27.5 29.9 25.4Household size (persons) 4.9 4.3 4.4Monthly household income (S/.) 1355.8 1583.1 1464.1Monthly household income, per-capita (S/.) 306.5 420.4 375.1Superior Studies in:
Public University 15% 9% 6%Private University 18% 6% 5%Public Superior Technological Institute 14% 7% 6%Private Superior Technological Institute 28% 30% 32%Others 4% 12% 14%Without superior studies 20% 37% 36%
Born in Lima 75% 66% 69%Born in Lima and never migrated 66% 66% 69%Has worked once in his life 100% 100% 100%Worked as a dependent during the last 12 months 86% 75% 80%Worked as a self-employed in the last 12 months 50% 28% 22%Number of observations 565 122 94
Survey to the applicants to Proempleo
4.2 Comparing the sample drawn from PROEMPLEO with the sample of the
National Household Survey.
With the purpose of comparing the applicants of PROEMPLEO with similar segments of the labor force
in the greater metropolitan Lima population, we present a comparison of our sample with a sub-sample of
the National Household Survey 2001 (ENAHO 2001). The first column of Figure 9 reports averages for a
set of variables from the sample of applicants. The second column comes from a sub-sample of individuals
of the ENAHO 2001 who reached a high-school diploma, who were looking for employment during the
week previous to the survey and worked as a dependent at least one of the last twelve months. The
third column reports the averages for a sample that is similar to the second but restricted to individuals
between 18 and 37 years old (the age range of the applicants to PROEMPLEO). The group of the third
column is younger, less educated and has worked less in the self-employed sector than the applicants at
PROEMPLEO. The average income of the applicants of our sample is approximately 20% lower than the
averages of the corresponding ENAHO samples.
14
4.3 Characterization of the Interviewers
The main demographic, academic and labor characteristics of the interviewers that were surveyed makes
them a relatively homogeneous group. However, it is possible to note some differences in these characteris-
tics that are linked to the size of the firm for which they work. Hence, if the interviewers are equally split
by gender, as the firm size increases, the prevalence of males increases (40% in small firms compared to
60% in big firms). The average age shows a similar pattern. The average for the whole group is 40 years
old, being the case that the average for males is above the average for females (42 and 35 respectively). In
the smaller firms the average age of interviewers are higher than the average age of those in medium and
big firms.
Regarding the schooling of the interviewers, 80% have achieved a college degree. In the bigger firms,
this percentage is higher, as is the percentage of individuals with post-graduate studies. The distribution
of professional degrees varies by firm size. In the smaller firms the area of expertise of the interviewers
coincides with the areas for which they are requiring applicants: accounting, administration, economics
or engineering; meanwhile, in the bigger firms, the area of expertise of the interviewers is related to the
positions that are typically in charge of the processes of selection of personnel: psychologist or industrial
relations professionals. Finally, males have longer tenure, at the firm and at the position, than females (7
and 5 years against 5 and 4 years respectively).
5 Characterization of the Applicants by Gender and Race
Following the same criterion described in Ñopo, Saavedra and Torero (2002), information about racial
characteristics of the individuals was collected according to racial intensities. In our sample, individuals
perceived as indigenous have a significant presence. The distribution of racial intensities along the Indige-
nous dimension is concentrated around 5 and 6. On the other hand, the distribution of racial intensities
along the White dimension is concentrated around 3.
A comparison of the distributions of racial intensities of the sample obtained for this study and the
sample of the ENAHO used in Ñopo et al. (2002) reveals that the PROEMPLEO applicants show racial
characteristics of higher intensity in the indigenous dimension and lower intensity in the white dimension
than the national averages. There are no substantial differences between both samples with regard to the
distribution of intensities along the Asian and Black dimensions.
15
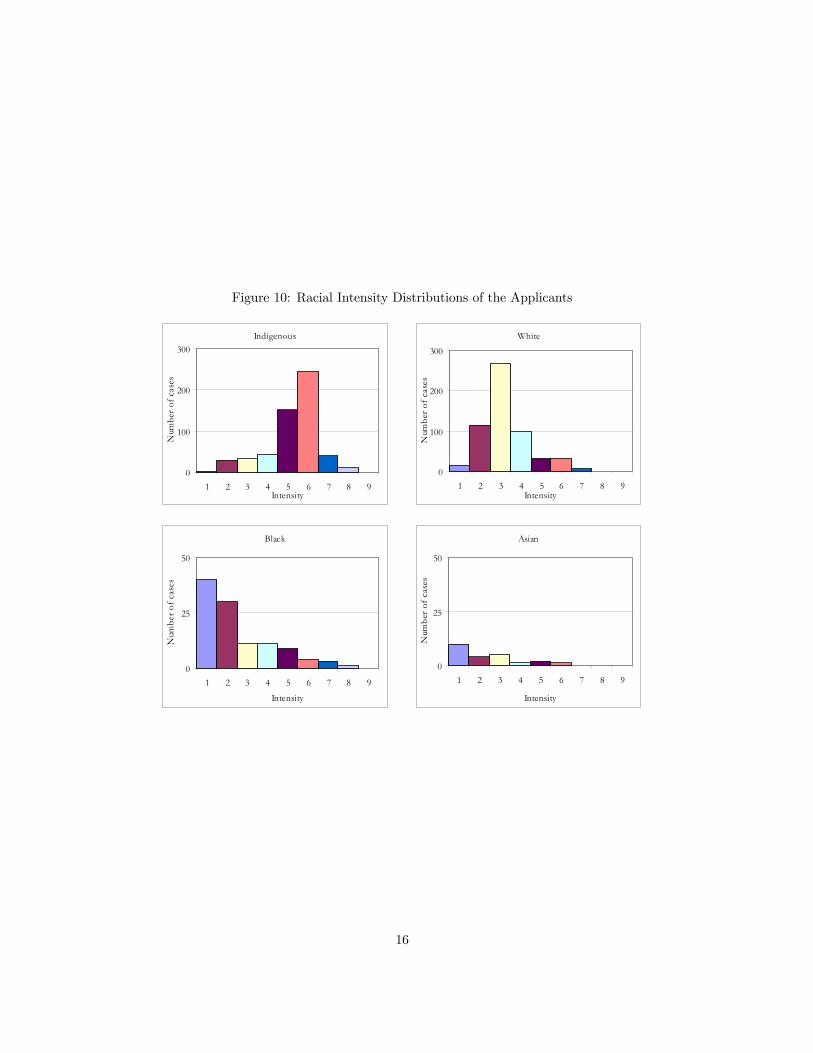
Figure 10: Racial Intensity Distributions of the Applicants
Asian
0
25
50
1 2 3 4 5 6 7 8 9
Intensity
Num
ber o
f cas
es
Black
0
25
50
1 2 3 4 5 6 7 8 9
Intensity
Num
ber o
f cas
es
Indigenous
0
100
200
300
1 2 3 4 5 6 7 8 9Intensity
Num
ber o
f cas
es
White
0
100
200
300
1 2 3 4 5 6 7 8 9Intensity
Num
ber o
f cas
es
16

5.1 Classifying the population under study into racial groups.
5.1.1 Criterion for a partition of the sample
As in Ñopo et al. (2002) it is necessary to define a criterion in order to classify the population according its
racial characteristics. The criterion has to take into account the number of observations in the total sample
and the resulting numbers of observations in each of the newly defined groups. In this paper, considering
that the population under study is a particular segment of the national population, we decided to use a
relative cut-off criterion. The cut-off is defined using the distribution of racial characteristics of the sample.
In that sense, if in Ñopo et al. (2002) the cut-off criterion was:
If an individual has her/his Indigenous intensity variable greater than or equal to a cut-off “c” and
her/his White intensity variable smaller than the same cut-off “c”, she/he will be considered as an Indige-
nous.
Analogously, if an individual has her/his White intensity variable greater than or equal to a cut-off “c”
and her/his Indigenous intensity variable smaller than the same cut-off “c”, she/he will be considered as a
White.
An individual that is considered neither Indigenous nor White will be considered a Mestizo.
First, we use the median of the distributions of intensities in the White and Indigenous dimensions
respectively as a cut-off point. In order to analyze the sensitivity of the results, we will also use the 75th
percentile as a cut-off.
Consequently, for the case of the median, if an individual reports intensity in the Indigenous dimension
that is above the median of the distribution of the variable “Indigenous intensity” and intensity in the
White dimension that is below the median of the distribution of the variable “White intensity” he/she will
be considered as an Indigenous. Analogously, if an individual reports intensity in the indigenous dimension
that is below the median of the distribution of the variable “Indigenous intensity” and intensity in the
White dimension that is above the median of the distribution of the variable “White intensity” he/she will
be considered as a White. An individual who is neither in the group of Indigenous nor in the group of
Whites will be considered in the group of Mestizos.
5.1.2 Characterization of the Applicants by Racial Groups
We defined racial groups following the criterion described above for two different cut-offs: the median
(50th percentile) and the 75th percentile. Using the median cut-off, 45% of the population can be classified
as Indigenous, 10% as mestizo and 45% as White. With the cut-off in the 75th percentile the resulting
percentages are 21%, 56% and 23% respectively. With both cut-offs we found a prevalence of indigenous
applicants among the accounting and administrative assistants and a prevalence of white individuals among
17

Figure 11: Number of Applications and Individuals by Definition of Race
Percentile 50
Total Salespersons Secretaries AssistantsIndigenous 344 90 62 192Mestizo 77 13 24 40White 339 124 97 118Total 760 227 183 350
Percentile 75
Total Salespersons Secretaries AssistantsIndigenous 160 40 27 93Mestizo 424 120 100 204White 176 67 56 53Total 760 227 183 350
Percentile 50
Total Salespersons Secretaries AssistantsIndigenous 255 86 43 126Mestizo 45 12 15 18White 265 107 75 83Total 565 205 133 227
Percentile 75
Total Salespersons Secretaries AssistantsIndigenous 105 38 17 50Mestizo 327 110 75 142White 133 57 41 35Total 565 205 133 227
Total Applications
Total Individuals
Total Applications
Total Individuals
the salespersons and secretaries.
In Table 12 we report a set of individual and family characteristics for the three racial groups defined
according to the cut-off of the medians. For most of the variables, a comparison of the applicants from
different racial groups does not denote the existence of clearly defined patterns. However we find some dif-
ferences in the asset ownership of the households, in the type of education of the applicants (public/private)
and in the schooling level of the parents for different racial groups.
18

Figure 12: Household and Individual Characteristics of the Applicants by Race
Total Indigenous Mestizo WhiteDemographic characteristicsFemales 73% 63% 77% 82%Age (in years) 28.13 28.26 29.23 27.75Migratory Experience
Born in Lima 77% 72% 94% 78%Born in Lima and never migrated 70% 66% 81% 71%
Socio-Economic CharacteristicsHousehold size (persons) 5.08 5.08 5.17 5.05Monthly household income (S/.) 1370.49 1308.57 1372.21 1432.75Monthly household income, per-capita (S/.) 296.38 288.03 278.78 308.95Household Assets
Microwave oven 20% 19% 19% 21%Washing machine 33% 30% 38% 35%Dryer 4% 2% 3% 6%Car 17% 17% 4% 19%
Educational background (individual)Years of education 13.63 13.99 13.09 13.40Attended High School in a:
Public Institution 77% 83% 71% 72%Private Institution 23% 17% 29% 28%
Pursued Superior Studies in:Public University 19% 21% 29% 14%Private University 16% 15% 13% 18%Public Superior Technological Institute 14% 18% 12% 11%Private Superior Technological Institute 26% 27% 18% 27%Others 6% 4% 13% 5%Without superior studies 19% 15% 16% 24%
Educational background (family)Father's Educational Level
Elementary 23% 25% 26% 20%High School 45% 49% 32% 43%College or higher 33% 26% 42% 37%
Mother's Educational LevelElementary 33% 42% 34% 24%High School 47% 42% 53% 50%College or higher 20% 16% 13% 26%
Labor HistoryHas worked once in his life 99% 100% 100% 99%Labor Experience (in years) 3.86 3.81 4.15 3.85Worked as a dependent during the last 12 months 87% 87% 91% 86%Monthly Earnings in their last dependent occupation 654.13 639.20 726.31 653.52Last employment spell (years) 12.74 12.23 10.57 13.77Worked as a self-employed in the last 12 months 50% 56% 47% 44%
Job searchUnemployment spell (months) 3.47 3.31 3.25 3.69Months looking for a job 2.11 2.09 1.89 2.18Applications sent to Proempleo 1.88 1.87 3.16 1.60Has prior experience at the job 36% 39% 40% 32%Hired (%) 17% 15% 16% 19%
Number of Applicants 760 344 77 339
Race of the Applicant (Perccentile 50)
19
6 Results of the Pseudo Audit
6.1 Characteristics of the Hired Applicants
A comparison of the individual characteristics between the hired and non-hired applicants initially reveals
a higher hiring rate for females than for males. The hired applicants are slightly older and belong to bigger
families with higher income.
It is important to note that the previously reported results should be understood “globally.” In the
sense that for the computation of the basic statistics we have considered all the applicants without taking
into consideration the number of interviews that each applicant got.
6.2 The Percentages of Hired Applicants by Gender and Race.
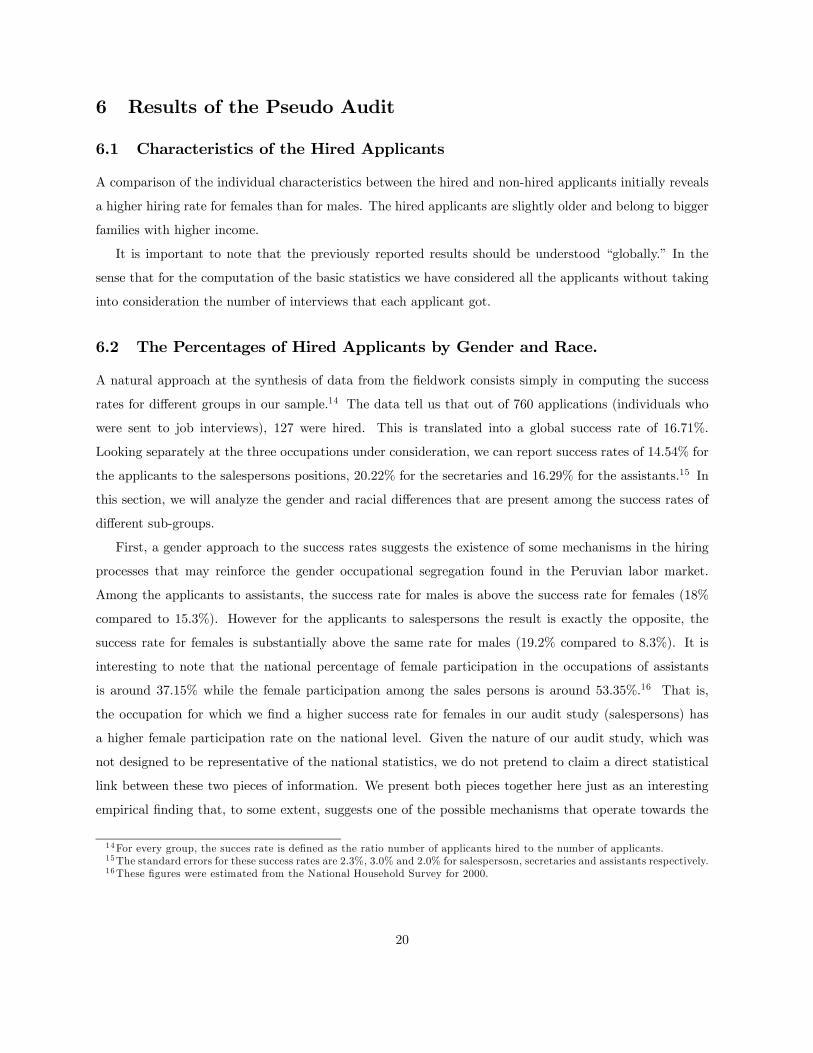
A natural approach at the synthesis of data from the fieldwork consists simply in computing the success
rates for different groups in our sample.14 The data tell us that out of 760 applications (individuals who
were sent to job interviews), 127 were hired. This is translated into a global success rate of 16.71%.
Looking separately at the three occupations under consideration, we can report success rates of 14.54% for
the applicants to the salespersons positions, 20.22% for the secretaries and 16.29% for the assistants.15 In
this section, we will analyze the gender and racial differences that are present among the success rates of
different sub-groups.
First, a gender approach to the success rates suggests the existence of some mechanisms in the hiring
processes that may reinforce the gender occupational segregation found in the Peruvian labor market.
Among the applicants to assistants, the success rate for males is above the success rate for females (18%
compared to 15.3%). However for the applicants to salespersons the result is exactly the opposite, the
success rate for females is substantially above the same rate for males (19.2% compared to 8.3%). It is
interesting to note that the national percentage of female participation in the occupations of assistants
is around 37.15% while the female participation among the sales persons is around 53.35%.16 That is,
the occupation for which we find a higher success rate for females in our audit study (salespersons) has
a higher female participation rate on the national level. Given the nature of our audit study, which was
not designed to be representative of the national statistics, we do not pretend to claim a direct statistical
link between these two pieces of information. We present both pieces together here just as an interesting
empirical finding that, to some extent, suggests one of the possible mechanisms that operate towards the
14For every group, the succes rate is defined as the ratio number of applicants hired to the number of applicants.15The standard errors for these success rates are 2.3%, 3.0% and 2.0% for salespersosn, secretaries and assistants respectively.16These figures were estimated from the National Household Survey for 2000.
20

Figure 13: Characteristics of the Hired and Non-Hired Applicants
No Yes
Hired (%) 83 17Gender (%)
Male 88 12Female 81 19
Age (years) 27.9 28.3Household size (persons) 4.9 5.3Monthly household income (S/.) 1308.7 1485.2
Rate: Hired/Number of Applications 0.9 0.9Number of applications 1.4 1.3
Attended High School in a (%):Public Institution 83 17Private Institution 84 16
Pursued Superior Studies in a (%):Public University 88 12Private University 82 18Public Superior Technological 81 19Institute 81 19
Monthly Household Income (S/.) (%)Between 100-700 92 8Between 701-1050 84 16Between 1051-1400 77 23Between 1750-+ 80 20
Father's Educational Level (%)Elementary 84 16High School 84 16College or higher 82 18
Mother's Educational Level (%)Elementary 82 18High School 86 14College or higher 80 20
Hired
21

determination of an occupational segregation by gender in Peru.
It is also interesting to note that these differences in success rates by gender show particular patterns
after the incorporation of the sex of the interviewer into the analysis. While, among the salespersons, the
highest success rate occur when female interviewers evaluated female applicants, the reverse is true for the
assistant applicants. The highest success rates are found when male interviewers evaluated male applicants,
as illustrated in Table 14.17
Following the criterion of the median cut-off for a partition of the population into three racial groups,
we can also report differences in success rates. While the 13.3% of Indigenous who applied to salesperson
positions were hired, the success rate for whites in those occupations is 14.5%. Slightly bigger differences
are found in the success rates of the applicants to assistant positions. For those occupations, 15.1% of
indigenous applicants got a job, but 18.6% of whites had success. The differences in success rates by race
attain a maximum among the secretarial positions, for which there are only female applicants. While 16.1%
of indigenous applicants got a job (one out of six), their white competitors had a higher success rate, 24.7%
(one out of four).
Disaggregating these success rates by racial characteristics of the interviewers also produces notable
results, especially among the secretaries. For this occupation, the interviewer-applicant racial combination
has a minimum success rate when the interviewer is mestizo and the applicant indigenous (10.0%). By
comparison, when the interviewer is mestizo and the applicant is white, the success rate is 33%, a maximum.
Combining applicant’s gender and racial characteristics, reveals that among the salespersons (Tables
16 and 17) the male applicants in general, and the indigenous males in particular, have the lowest success
rates (6.4%). Among the accounting and administrative assistant applicants, white males have superior
success rates while indigenous females have the lowest rate of 14.2%.
These success rates have been computed without consideration of some observable characteristics (there
is no perfect alignment of all the observable characteristics for all the applicants at each occupation). Since
these differences in characteristics may have an impact in the success of the applicants, it is necessary to
control for them. That will be the purpose of the next sub-section. For that reason we will use discrete
models which will seek to explain the hiring outcomes in terms of individual and family characteristics of
the individuals, occupations, firms and interviewers.
17For this and the next tables reported in this section, we will report three basic statistics: the succes rate (percentage ofhired individuals), the standard error of such a percentage (in parenthesis) and finally the number of observations.
22

Figure 14: Succes Rates by Occupation and Gender
Male Female Total5.9% 9.5% 8.3%(4%) (4%) (3%)34 63 97
15.9% 22.4% 19.2%(5%) (5%) (3%)63 67 130
12.4% 16.2% 14.5%(3%) (3%) (2%)97 130 227
Male Female Total
21.6% 19.3% 20.2%(5%) (4%) (3%)74 109 183
21.6% 19.3% 20.2%(5%) (4%) (3%)74 109 183
Hombre Mujer Total20.4% 17.0% 18.5%(6%) (5%) (4%)49 59 108
14.3% 16.3% 15.3%(3%) (3%) (2%)119 123 242
16.1% 16.5% 16.3%(3%) (3%) (2%)168 182 350
Assistants
Secretaries
Salespersons
Female
Mujer
Total
Total
Total
Interviewer
Interviewer
Entrevistador
App
lican
t
Male
App
lican
t
Male
Post
ulan
te
Hombre
Female
23
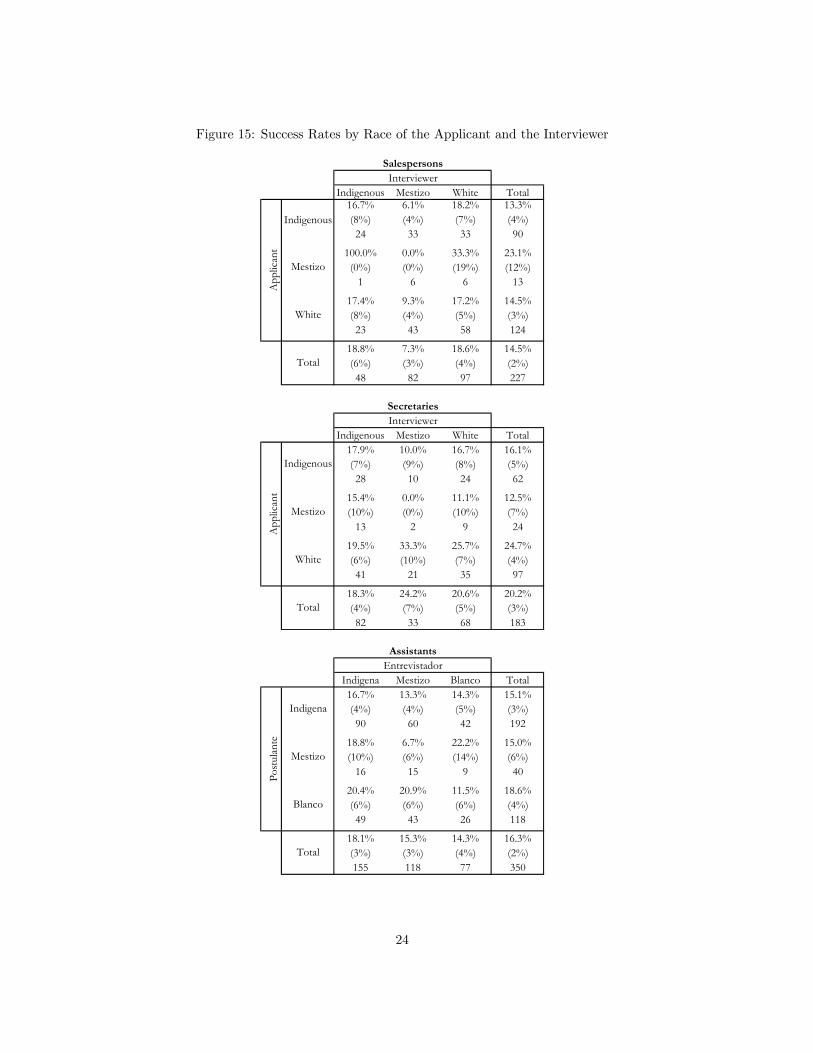
Figure 15: Success Rates by Race of the Applicant and the Interviewer
Indigenous Mestizo White Total16.7% 6.1% 18.2% 13.3%(8%) (4%) (7%) (4%)24 33 33 90
100.0% 0.0% 33.3% 23.1%(0%) (0%) (19%) (12%)
1 6 6 13
17.4% 9.3% 17.2% 14.5%(8%) (4%) (5%) (3%)23 43 58 124
18.8% 7.3% 18.6% 14.5%(6%) (3%) (4%) (2%)48 82 97 227
Indigenous Mestizo White Total17.9% 10.0% 16.7% 16.1%(7%) (9%) (8%) (5%)28 10 24 62
15.4% 0.0% 11.1% 12.5%(10%) (0%) (10%) (7%)
13 2 9 24
19.5% 33.3% 25.7% 24.7%(6%) (10%) (7%) (4%)41 21 35 97
18.3% 24.2% 20.6% 20.2%(4%) (7%) (5%) (3%)82 33 68 183
Indigena Mestizo Blanco Total16.7% 13.3% 14.3% 15.1%(4%) (4%) (5%) (3%)90 60 42 192
18.8% 6.7% 22.2% 15.0%(10%) (6%) (14%) (6%)
16 15 9 40
20.4% 20.9% 11.5% 18.6%(6%) (6%) (6%) (4%)49 43 26 118
18.1% 15.3% 14.3% 16.3%(3%) (3%) (4%) (2%)155 118 77 350
Salespersons
Secretaries
Assistants
Total
Total
Total
Mestizo
Mestizo
White
White
Blanco
Interviewer
Interviewer
Entrevistador
App
lican
t
Indigenous
App
lican
t
Indigenous
Post
ulan
te
Indigena
Mestizo
24

Figure 16: Success Rates of Males by Race
Indigenous Mestizo White Total0.0% 5.0% 18.2% 6.4%(0%) (5%) (12%) (4%)16 20 11 47
0.0% 50.0% 14.3%(0%) (35%) (13%)
5 2 7
25.0% 4.2% 0.0% 9.3%(13%) (4%) (0%) (4%)
12 24 7 43
10.7% 4.1% 15.0% 8.3%
28 49 20 97
Indigena Mestizo Blanco Total14.3% 20.0% 16.7% 16.5%(6%) (9%) (8%) (4%)35 20 24 79
33.3% 0.0% 25.0% 18.2%(27%) (0%) (22%) (12%)
3 4 4 11
22.2% 33.3% 33.3% 27.8%(14%) (27%) (19%) (11%)
9 3 6 18
17.0% 18.5% 20.6% 18.5%
47 27 34 108Total
Salespersons
Assistants
App
lican
t
Indigenous
Mestizo
White
Entrevistador
App
lican
t
Indigenous
Mestizo
Total
Interviewer
White
25

Figure 17: Success Rates of Females by Race
Indigenous Mestizo White Total50.0% 7.7% 18.2% 20.9%(18%) (7%) (8%) (6%)
8 13 22 43
100.0% 0.0% 25.0% 33.3%(0%) (0%) (22%) (19%)
1 1 4 6
9.1% 15.8% 19.6% 17.3%(9%) (8%) (6%) (4%)11 19 51 81
30.0% 12.1% 19.5% 19.2%(10%) (6%) (5%) (3%)
20 33 77 130
Indigenous Mestizo White Total17.9% 10.0% 16.7% 16.1%(7%) (9%) (8%) (5%)28 10 24 62
15.4% 0.0% 11.1% 12.5%(10%) (0%) (10%) (7%)
13 2 9 24
19.5% 33.3% 25.7% 24.7%(6%) (10%) (7%) (4%)41 21 35 97
18.3% 24.2% 20.6% 20.2%(4%) (7%) (5%) (3%)82 33 68 183
Indigena Mestizo Blanco Total18.2% 10.0% 11.1% 14.2%(5%) (5%) (7%) (3%)55 40 18 113
15.4% 9.1% 20.0% 13.8%(10%) (9%) (18%) (6%)
13 11 5 29
20.0% 20.0% 5.0% 17.0%(6%) (6%) (5%) (4%)40 40 20 100
18.5% 14.3% 9.3% 15.3%(4%) (4%) (4%) (2%)108 91 43 242
Total
App
lican
t
Indigenous
Mestizo
White
Assistants
Secretaries
Salespersons
App
lican
t
Indigenous
Mestizo
White
Total
Total
White
Interviewer
Interviewer
Entrevistador
App
lican
t
Indigenous
Mestizo
26

6.3 Race, gender, wages and aimed wages
In the hiring and job search processes, there is a complex relationship among the aimed wages (the wage
that the individuals would like to get at their new job), the reservation wages (the minimum wage the
individuals are willing to accept in order to work), the entry wages (the wages at which the individuals
start their new jobs) and the gender and racial characteristics of the individuals.
In the Peruvian labor markets, there are some sorting mechanisms operating (for example, occupational
segregation). It should expected that the agents in this system –employers, employees and job seekers–
make their decisions based on the assumption that there is, at least, some statistical discrimination in
the market. Then, at the equilibrium, it would not be surprising to find differences in the distribution
of wages offered and in the distribution of the unemployment spells by gender and race. The individuals
that belong to a discriminated group, anticipating differentiated treatment, adjust their beliefs and as a
consequence they go on their job search processes by choosing reservation wages that are below those of
the non-discriminated group.
On the other side of the market, employers assume the same prior common beliefs, and know that
individuals from the discriminated groups are willing to accept lower wages. In such a way, an equilibrium is
achieved and the beliefs of the individuals are confirmed ex-post, creating a typical “self-fulfilling prophecy.”
These theoretical predictions of the search models18 are related to reservation wages but not aimed
wages. There is an interesting issue about aimed wages that we want to analyze and expand upon in this
paper. Aimed wages capture the value (in monetary units) of a set of individual characteristics that are
not observable by the econometrician and in many situations, not even by the employer. For this reason,
aimed wages have the “human capital” of the individuals as a component that is typically not captured by
a Mincerian model.
The data obtained from this study allows us to explore, at least partially, the complex relationship
that may involve wages, aimed wages and gender and racial characteristics of the individuals. We have
information about the wages of the individuals in their previous jobs as well as their aimed wages for the
jobs they are applying to. To analyze the relationship between these two variables, controlling for a set of
individual characteristics (including gender and race) will shed some light on the processes of adjustment
of beliefs and expectations of the individuals in the Peruvian labor market. For that purpose, in a simple
linear model, we try to explain the logarithm of the aimed wages of the individuals from a set of individual
characteristics, including gender, race and their wages in their last occupations.19 Figure 18 shows the
results. The statistical relationship between the last wage and aimed wages is clearly positive. The other
18Mortensen and Pissarides (1994).19With the purpose of minimizing some possible statistical noises, we restrict the analysis to those individuals with no more
than 12 months unemployed who did not work as self-employed in their last job.
27

Figure 18: Determinants of the Aimed Wages
Determinants of the Aimed Wages of the Individuals For Different Cut-Offs of Race Intensity
Percentile 50 Percentile 75Ln earnings in the Last Occupation 0.143 0.147
(8.04)** (8.25)**Ln Family Monthly Income 0.033 0.038
(2.20)** (2.50)**Father's Schooling 0.032 0.035
(3.69)** (3.99)**Single 0.08 0.074
(2.79)** (2.58)**Age 0.011 0.011
(5.56)** (5.63)**Occupation (Salespersons) -0.199 -0.192
(9.01)** (8.70)**Occupation (Secretaries) -0.065 -0.06
(3.01)** (2.81)**Indigenous -0.009 0.043
-0.49 -1.62Mestizo 0.049 -0.005
-1.71 -0.24Female -0.079 -0.065
(3.70)** (3.06)**Constant 4.964 4.89
(32.42)** (31.65)**
controls we introduced in the regression show clear relationships with the aimed wages. First, the logarithm
of the family income which has the purpose of controlling for the effects of family or social pressure that
may experience the individuals in order to look after better paying jobs. Second, the schooling of the father
which aims to capture “role model” effects as individuals with better educated parents would aspire for a
better career. Third, the marital status of the individuals as a proxy measure of the urgency the applicants
have to generate income (we presume that an individual who is single has less pressure to find a job than
somebody who is married, and for that reason, they can indulge to go to their job search processes with
higher pretensions). Finally we included the age of the individuals, two controls for the occupations to
which the individuals were applying and the controls that are the object of our study: dummy variables
for race and gender of the individuals.
All the proposed controls have statistically significant impacts in determining aimed wages. The role
of family pressure, parent education and marital status are positive. Our estimation suggests that females
28
adjust their aims by 7% to 8% below the average aimed wages of males. However there is no evidence of
racial differences in aimed wages.
6.4 Controlling gender and racial differences in hiring by observable charac-
teristics: logit estimates
The design of our pseudo audit study requires that all applicants who are sent to the same job inter-
view satisfy a minimum set of requirements (which are established by the posting firm and verified by
PROEMPLEO). But, we cannot assure that all the applicants that go to the same interview have exactly
the same set of observable characteristics. Analyzing the data we have found that there are some small
differences among applicants to the same position. If applicants for the same position differ in observable
characteristics as well as in racial characteristics, it is necessary to explore to what extent the differences
found in the success rates of gender and racial groups can be explained by those differences in observable
characteristics, what can be directly explained by the differences in racial characteristics and what remains
unexplained.
For that purpose, we estimate discrete choice models (logit) where the explained variable is whether
the individual is hired or not. This hiring outcome is explained by a set of observable characteristics: sex
and race of the applicant, sex and race of the interviewer, age of the applicant, schooling, marital status, a
dummy indicating whether the applicant is chief of a household or not, migratory condition, unemployment
spell, education of their parents, a dummy indicating if the individual currently has a job by the time of the
interview. In addition, we have two proxy measures of the ability of the applicants: the logarithm of their
wages at their last job and the difference between the logarithm of the aimed wages and the logarithm
of the wages in their last main occupation. The logarithm of the wages of the applicants works as a
proxy variable for their “human capital.” It is expected that those individuals who had higher earnings in
their last occupations are better trained than those who had lower earnings. The difference bewteen the
logarithm of the aimed wages and the logarithm of their wages at their last occupation pretends to capture
the effect of characteristics that are observed by the individual but unobservable for the econometrician
and the labor market.
These discrete models are estimated for different partitions of the sample: by occupations, by firm size,
by race of the interviewer and by sex of the interviewer. In order to control for the set of unobservable
characteristics that are common to all the individuals that apply to the same job posting, we will include
posting fixed effects. Due to the typical identification problem of these types of discrete models, we will
report only the partial derivatives of the estimated coefficients.
Tables 19, 20 and 21 show some selected coefficients of the estimations: the coefficients related to the
29
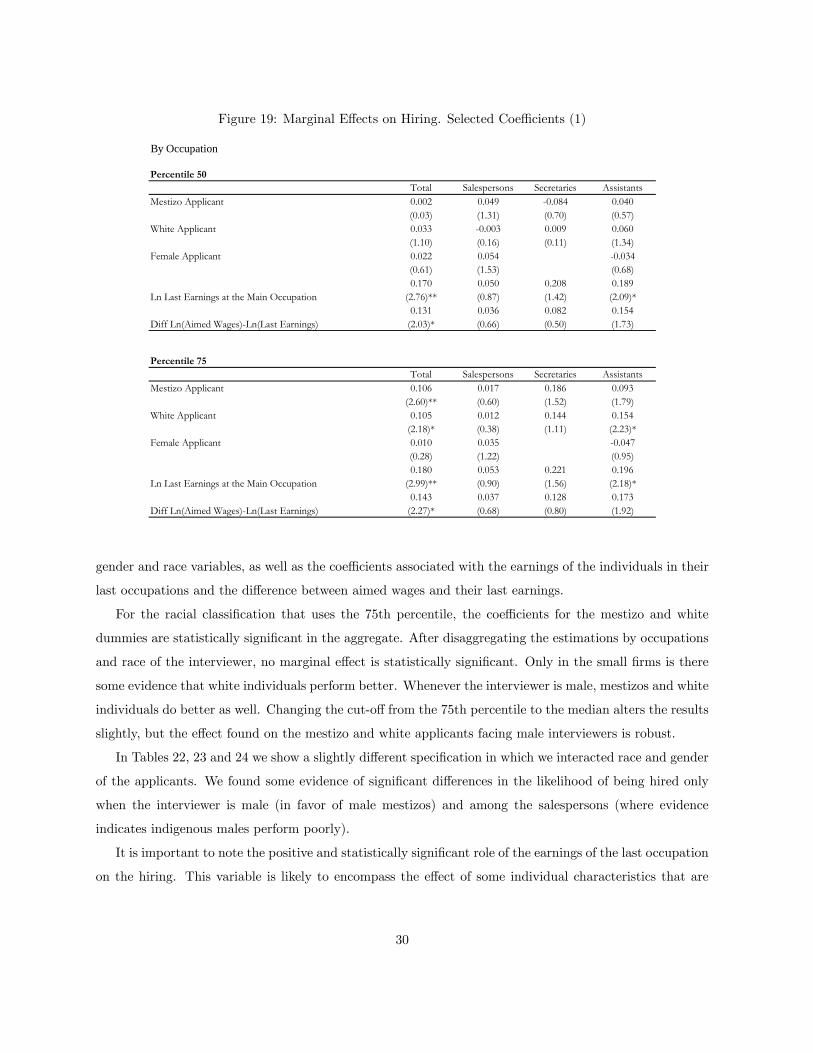
Figure 19: Marginal Effects on Hiring. Selected Coefficients (1)
By Occupation
Percentile 50Total Salespersons Secretaries Assistants
Mestizo Applicant 0.002 0.049 -0.084 0.040(0.03) (1.31) (0.70) (0.57)
White Applicant 0.033 -0.003 0.009 0.060(1.10) (0.16) (0.11) (1.34)
Female Applicant 0.022 0.054 -0.034(0.61) (1.53) (0.68)0.170 0.050 0.208 0.189
(2.76)** (0.87) (1.42) (2.09)*0.131 0.036 0.082 0.154
(2.03)* (0.66) (0.50) (1.73)
Percentile 75Total Salespersons Secretaries Assistants
Mestizo Applicant 0.106 0.017 0.186 0.093(2.60)** (0.60) (1.52) (1.79)
White Applicant 0.105 0.012 0.144 0.154(2.18)* (0.38) (1.11) (2.23)*
Female Applicant 0.010 0.035 -0.047(0.28) (1.22) (0.95)0.180 0.053 0.221 0.196
(2.99)** (0.90) (1.56) (2.18)*0.143 0.037 0.128 0.173
(2.27)* (0.68) (0.80) (1.92)
Ln Last Earnings at the Main Occupation
Diff Ln(Aimed Wages)-Ln(Last Earnings)
Ln Last Earnings at the Main Occupation
Diff Ln(Aimed Wages)-Ln(Last Earnings)
gender and race variables, as well as the coefficients associated with the earnings of the individuals in their
last occupations and the difference between aimed wages and their last earnings.
For the racial classification that uses the 75th percentile, the coefficients for the mestizo and white
dummies are statistically significant in the aggregate. After disaggregating the estimations by occupations
and race of the interviewer, no marginal effect is statistically significant. Only in the small firms is there
some evidence that white individuals perform better. Whenever the interviewer is male, mestizos and white
individuals do better as well. Changing the cut-off from the 75th percentile to the median alters the results
slightly, but the effect found on the mestizo and white applicants facing male interviewers is robust.
In Tables 22, 23 and 24 we show a slightly different specification in which we interacted race and gender
of the applicants. We found some evidence of significant differences in the likelihood of being hired only
when the interviewer is male (in favor of male mestizos) and among the salespersons (where evidence
indicates indigenous males perform poorly).
It is important to note the positive and statistically significant role of the earnings of the last occupation
on the hiring. This variable is likely to encompass the effect of some individual characteristics that are
30
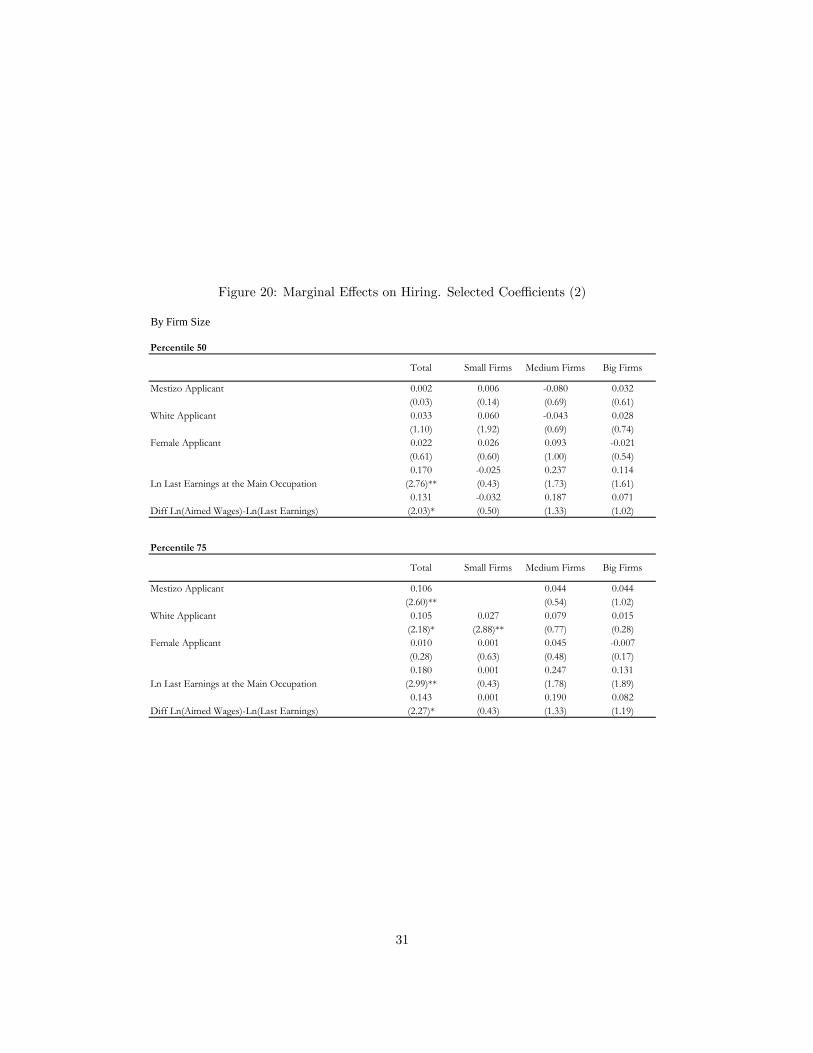
Figure 20: Marginal Effects on Hiring. Selected Coefficients (2)
By Firm Size
Percentile 50
Total Small Firms Medium Firms Big Firms
Mestizo Applicant 0.002 0.006 -0.080 0.032(0.03) (0.14) (0.69) (0.61)
White Applicant 0.033 0.060 -0.043 0.028(1.10) (1.92) (0.69) (0.74)
Female Applicant 0.022 0.026 0.093 -0.021(0.61) (0.60) (1.00) (0.54)0.170 -0.025 0.237 0.114
(2.76)** (0.43) (1.73) (1.61)0.131 -0.032 0.187 0.071
(2.03)* (0.50) (1.33) (1.02)
Percentile 75
Total Small Firms Medium Firms Big Firms
Mestizo Applicant 0.106 0.044 0.044(2.60)** (0.54) (1.02)
White Applicant 0.105 0.027 0.079 0.015(2.18)* (2.88)** (0.77) (0.28)
Female Applicant 0.010 0.001 0.045 -0.007(0.28) (0.63) (0.48) (0.17)0.180 0.001 0.247 0.131
(2.99)** (0.43) (1.78) (1.89)0.143 0.001 0.190 0.082
(2.27)* (0.43) (1.33) (1.19)
Ln Last Earnings at the Main Occupation
Diff Ln(Aimed Wages)-Ln(Last Earnings)
Ln Last Earnings at the Main Occupation
Diff Ln(Aimed Wages)-Ln(Last Earnings)
31

Figure 21: Marginal Effects on Hiring. Selected Coefficients (3)
By Interviewer's Characteristics
Percentile 50
Total Indigenous Interviewer
Mestizo Interviewer
White Interviewer
Male Interviewer
Female Interviewer
Mestizo Applicant 0.002 -0.035 0.060 0.178 -0.101(0.03) (0.43) (0.97) (2.30)* (1.53)
White Applicant 0.033 0.009 0.062 0.005 0.109 -0.009(1.10) (0.16) (1.17) (0.12) (2.19)* (0.23)
Female Applicant 0.022 0.072 0.053 0.004 -0.060 0.072(0.61) (1.06) (0.82) (0.08) (0.97) (1.50)0.170 0.177 0.192 0.081 0.158 0.206
(2.76)** (1.57) (1.62) (0.93) (1.54) (2.65)**0.131 0.122 0.233 0.017 0.076 0.198
(2.03)* (1.09) (1.71) (0.18) (0.73) (2.36)*
Percentile 75
Total Indigenous Interviewer
Mestizo Interviewer
White Interviewer
Male Interviewer
Female Interviewer
Mestizo Applicant 0.106 0.058 0.020 0.197 0.036(2.60)** (1.31) (0.68) (2.93)** (0.70)
White Applicant 0.105 0.069 0.020 0.121 0.084(2.18)* (1.35) (0.67) (1.47) (1.47)
Female Applicant 0.010 0.029 0.000 -0.062 0.056(0.28) (0.72) (0.08) (1.06) (1.15)0.180 0.153 0.003 0.140 0.204
(2.99)** (2.10)* (0.38) (1.41) (2.63)**0.143 0.125 -0.001 0.083 0.202
(2.27)* (2.09)* (0.44) (0.81) (2.37)*
Ln Last Earnings at the Main Occupation
Diff Ln(Aimed Wages)-Ln(Last Earnings)
Ln Last Earnings at the Main Occupation
Diff Ln(Aimed Wages)-Ln(Last Earnings)
32

Figure 22: Marginal Effects on Hiring. Race and Gender Interactions (1)
By Occupations
Percentile 50Total Salespersons Secretaries Assistants
Male and Indigenous Applicant -0.023 -0.085 0.041(0.49) (2.35)* (0.70)
Male and Mestizo Applicant 0.007 -0.012 0.013(0.08) (0.33) (0.11)
Male and White Applicant 0.003 -0.052 0.115(0.04) (1.78) (1.27)
Female and Mestizo Applicant -0.007 0.022 -0.084 0.079(0.12) (0.63) (0.70) (0.93)
Female and White Applicant 0.035 -0.019 0.009 0.057(1.04) (1.03) (0.11) (1.11)0.171 0.055 0.208 0.190
(2.78)** (1.44) (1.42) (2.05)*0.133 0.040 0.082 0.147
(2.06)* (1.04) (0.50) (1.62)
Percentile 75Total Salespersons Secretaries Assistants
Male and Indigenous Applicant -0.036 0.020(0.48) (0.22)
Male and Mestizo Applicant 0.093 -0.074 0.131(1.51) (1.40) (1.57)
Male and White Applicant 0.075 -0.062 0.200(0.86) (1.27) (1.40)
Female and Mestizo Applicant 0.092 -0.029 0.186 0.076(1.82) (0.87) (1.52) (1.09)
Female and White Applicant 0.095 -0.046 0.144 0.137(1.66) (1.21) (1.11) (1.67)0.180 0.075 0.221 0.195
(2.99)** (1.08) (1.56) (2.16)*0.145 0.049 0.128 0.175
(2.29)* (0.82) (0.80) (1.93)
Ln Last Earnings at the Main Occupation
Diff Ln(Aimed Wages)-Ln(Last Earnings)
Ln Last Earnings at the Main Occupation
Diff Ln(Aimed Wages)-Ln(Last Earnings)
33

Figure 23: Marginal Effects on Hiring. Race and Gender Interactions (2)
By Firm Size
Percentile 50
Total Small Firms Medium Firms Big Firms
Male and Indigenous Applicant -0.023 -0.055 -0.131 0.072(0.49) (0.97) (1.29) (1.46)
Male and Mestizo Applicant 0.007 -0.006 0.055(0.08) (0.10) (0.64)
Male and White Applicant 0.003 0.038 0.081 0.027(0.04) (0.56) (0.41) (0.42)
Female and Mestizo Applicant -0.007 -0.020 -0.078 0.074(0.12) (0.35) (0.68) (1.11)
Female and White Applicant 0.035 0.046 -0.057 0.071(1.04) (1.38) (0.91) (1.53)0.171 -0.021 0.238 0.120
(2.78)** (0.36) (1.76) (1.72)0.133 -0.025 0.190 0.082
(2.06)* (0.40) (1.37) (1.17)
Percentile 75
Total Small Firms Medium Firms Big Firms
Male and Indigenous Applicant -0.036 -0.103 0.046(0.48) (0.69) (0.59)
Male and Mestizo Applicant 0.093 0.162 -0.040 0.071(1.51) (1.73) (0.28) (1.09)
Male and White Applicant 0.075 0.164 0.384 -0.008(0.86) (1.68) (1.40) (0.09)
Female and Mestizo Applicant 0.092 0.168 0.036 0.060(1.82) (1.70) (0.41) (1.03)
Female and White Applicant 0.095 0.167 0.049 0.051(1.66) (1.69) (0.45) (0.75)0.180 0.005 0.224 0.136
(2.99)** (0.31) (1.64) (1.95)0.145 0.006 0.173 0.090
(2.29)* (0.31) (1.24) (1.29)
Ln Last Earnings at the Main Occupation
Diff Ln(Aimed Wages)-Ln(Last Earnings)
Ln Last Earnings at the Main Occupation
Diff Ln(Aimed Wages)-Ln(Last Earnings)
34
Figure 24: Marginal Effects on Hiring. Race and Gender Interactions (3)
By Interviewer's Characteristics
Percentile 50
Total Indigenous Interviewer
Mestizo Interviewer
White Interviewer
Male Interviewer
Female Interviewer
Male and Indigenous Applicant -0.023 -0.148 -0.055 0.033 0.009 -0.053(0.49) (1.79) (0.66) (0.57) (0.12) (0.88)
Male and Mestizo Applicant 0.007 -0.023 0.089 0.280(0.08) (0.12) (0.91) (2.29)*
Male and White Applicant 0.003 0.019 0.009 -0.089 0.211 -0.088(0.04) (0.18) (0.11) (0.91) (1.95) (1.10)
Female and Mestizo Applicant -0.007 -0.068 0.066 0.144 -0.068(0.12) (0.79) (0.88) (1.53) (0.93)
Female and White Applicant 0.035 -0.034 0.061 0.035 0.093 0.002(1.04) (0.58) (0.90) (0.75) (1.74) (0.06)0.171 0.142 0.191 0.072 0.155 0.216
(2.78)** (1.27) (1.61) (0.85) (1.50) (2.68)**0.133 0.100 0.233 0.009 0.082 0.204
(2.06)* (0.89) (1.71) (0.10) (0.78) (2.33)*
Percentile 75
Total Indigenous Interviewer
Mestizo Interviewer
White Interviewer
Male Interviewer
Female Interviewer
Male and Indigenous Applicant -0.036 -0.052 0.063 -0.109(0.48) (0.66) (0.48) (1.21)
Male and Mestizo Applicant 0.093 0.028 0.272 -0.028(1.51) (0.41) (2.68)** (0.35)
Male and White Applicant 0.075 0.023 0.106 0.002(0.86) (0.25) (0.57) (0.02)
Female and Mestizo Applicant 0.092 0.045 0.063 0.199 0.017(1.82) (0.81) (1.73) (2.24)* (0.27)
Female and White Applicant 0.095 0.061 0.065 0.130 0.066(1.66) (0.98) (1.76) (1.27) (0.97)0.180 0.160 0.013 0.161 0.198
(2.99)** (2.31)* (1.90) (1.60) (2.56)*0.145 0.155 0.009 0.099 0.206
(2.29)* (2.12)* (1.33) (0.98) (2.42)*
Ln Last Earnings at the Main Occupation
Diff Ln(Aimed Wages)-Ln(Last Earnings)
Ln Last Earnings at the Main Occupation
Diff Ln(Aimed Wages)-Ln(Last Earnings)
35

unobservable by the econometrician but observable by the interviewer.
7 Discussion and conclusions
In this study we explore the role of gender and race in the explanation of differences in hiring, for particular
occupations, using information of real applications and job interviews obtained from the CIL-PROEMPLEO
network, the intermediation system of the Ministry of Labor and Employment Promotion. We studied
salespersons, secretaries and accounting and administrative assistants. The racial information was captured
following the same approach used in Ñopo, Saavedra and Torero (2002).
The experiment consists of comparing the relative performance in the job seeking process of mestizo
individuals that are heterogeneous in terms of observable racial characteristics but somewhat homogeneous
in other observable characteristics such as age, schooling and experience. The racial heterogeneity of the
sample allows us to form groups of individuals that we labeled as whites mestizos and indigenous. The
construction of those groups depended on a cut-off criterion and we performed the analysis for two different
cut-offs.
The design of this pseudo-audit study left small room for the existence of statistical discrimination as
the differences in observable characteristics are small.
A first look at the hiring rates shows some evidence that may suggest the existence of discriminatory
patterns against females and in favor of whites. On the other hand, an analysis of the hiring rates by
occupation reveals a result that is aligned with the evidence for occupational segregation by gender that
exists in Peru. Among secretaries, an occupation for which there are only female applicants, the racial
differences in hiring rate are higher than in any other occupation. Even though, by the nature of this
experiment, the observable differences among the applicants that go to the same job interview are expected
to be small, we can not guarantee that there are in fact no such differences.
Logit estimations that control for these differences in observable characteristics among the individuals,
which may influence the hiring decision of the interviewers, wash out some of the discriminatory evidences.
The statistically significant differences in hiring rates among groups are not robust to different specifications
of the logit model or different partitions of the population. Although, we recognize that this may be a
consequence of the sample size. It would be necessary to increase the sample size of the study to reach
definitive conclusions.
Nevertheless, provided that in this study we have controlled for differences in observable characteristics
in a very detailed way, not only in the formation of the groups of applicants per posting but also in the
econometric models, can we affirm that there is no discrimination in hiring practices in Peru?
At the very specific level of the occupations analyzed, the answer is probably yes, there is no evidence of
36

discrimination. The question then becomes, why is there high occupational segregation by gender and race
in the aggregate national figures? And why are there such substantial differences in earnings for individuals
with different gender and racial traits?
The answer is two-fold. First, there are large discrepancies in access to education, asset ownership, and
social networks according to the race and gender of individuals. Second, there should be some pre-sorting
mechanisms operating in the Peruvian society that influence individuals of the traditionally dominated
groups to “choose” not to even apply to certain occupations. Along the same line of thought, some
individuals of the traditionally discriminated groups, anticipating their poor expectancies for their future
careers, find less profitable to invest in education and human capital in general and decide not to invest,
later, they will find themselves into a “poverty trap” from which it is not easy to escape. These two
explanations represent important research avenues towards the future understanding of the inequalities in
Peruvian labor market.
References
[1] Blau, Francine and Marianne Ferber (1992). “The Economics of Women, Men and Work.” 2nd Ed.
Englewood Cliffs, NJ: Prentice-Hall.
[2] Blau, Francine and Lawrence Khan (1996). “International Differences in Male Wage Inequality: Insti-
tutions versus Market Forces.” Journal of Political Economy, 104(4), 791-837.
[3] Blau, Francine D. and Lawrence M. Khan; (1997). “Swimming Upstream: Trends in the Gender Wage
Differential in 1980s.” Journal of Labor Economics, January, 15:1 (Part 1), 1-42.
[4] Chay, Kenneth (1998). “The Impact of Federal Civil Rights Policy on Black Economics Progress:
Evidence From The Equal Employment Opportunity Act of 1972.” Industrial and Labor Relations
Review, 51(4), July 1998, pp. 608-632.
[5] Cross, Harry, Ganevieve Kenney, Jane Mell and Wendy Zimmerman (1990). “Employer Hiring Prac-
tices: Differential Treatment of Hispanic and Anglo Job Seekers”. The Urban Institute Press, Wash-
ington D.C.
[6] Deutsch, Ruthanne, Andrew Morrison, Claudia Piras and Hugo Ñopo (2002). “Working Within Con-
fines: Occupational Segregation by Gender in Three Latin American Countries.” Inter-American De-
velopment Bank. Sustainable Development Department. Technical Papers Series No. 126. Washington
D.C.
37

[7] Fluckiger, Y. and Silber, J. (1999). “The measurement of segregation in the labor force.” Heidelberg:
Physica-Verlag.
[8] Gottschalk, Peter; (1997). “Inequality, Income growth and Mortality: The Basic Facts” Journal of
Economic Perspectives, Spring, 11:2, 21-40.
[9] Heckamn, James and Peter Siegelman (1993). “The Urban Institute Audit Studies: Their Methods
and Findings”. In: Clear and Convincing Evidence: Measure of Discrimination in America. Michael
Fix and Raymond Struyk, editors. The Urban Institute Press, Washington D.C.
[10] Heckman, James (1998). “Detecting Discrimination”. The Journal of Economic Perspectives, Vol 12,
Issue 2 (Spring 1998), 101-116.
[11] Lindzey, G. and E. Aronson (1975). “The Handbook of Social Psychology” 2nd. Ed. Vol 2. Addison-
Wesley. Reading Mass.
[12] Mortensen Dale and C.A. Pissarides (1994), “Job Creation and Job Destruction in the Theory of
Unemployment”, Review of Economic Studies, 61, pp. 397-415.
[13] Ñopo, Hugo, Jaime Saavedra and Maximo Torero (2002). “Ethnicity and Earnings in Urban Peru”.
Unpublished. GRADE.
[14] Rosenthal, R. (1976). “Experimenter Effects in Behavioral Research” 2nd. Ed. Irvington Publishers.
New York.
[15] Turner, Margey, Michael Fix and Raymond Struyk (1991). “Opportunities Denied, Opportunities
Diminished: Racial Discrimination in Hiring”. UI Report 81-9. The Urban Institute Press, Washington
D.C.
[16] Waldfogel, Jane; (1998). “Understanding the ‘Family Gap’ in Pay for Women with Children.” Journal
of Economic Perspectives, Winter, 13:1,137-56.
[17] Yinger, John, 1998. “Evidence on Discrimination in Consumer Markets,” Journal of Economic Per-
spectives, Vol. 12 (2) pp. 23-40.
38
IZA Discussion Papers No.
Author(s) Title
Area Date
964 R. Schettkat L. Yocarini
The Shift to Services: A Review of the Literature
5 12/03
965 M. Merz E. Yashiv
Labor and the Market Value of the Firm
1 12/03
966 T. Palokangas
Optimal Taxation with Capital Accumulation and Wage Bargaining
3 12/03
967 M. Lechner R. Vazquez-Alvarez
The Effect of Disability on Labour Market Outcomes in Germany: Evidence from Matching
6 12/03
968 M. Blázquez M. Jansen
Efficiency in a Matching Model with Heterogeneous Agents: Too Many Good or Bad Jobs?
1 12/03
969 J.-P. Schraepler G. G. Wagner
Identification, Characteristics and Impact of Faked Interviews in Surveys
7 12/03
970 G. Kertesi J. Köllõ
Fighting “Low Equilibria” by Doubling the Minimum Wage? Hungary’s Experiment
4 12/03
971 J. De Loecker J. Konings
Creative Destruction and Productivity Growth in an Emerging Economy: Evidence from Slovenian Manufacturing
4 12/03
972 J. Köllõ Transition on the Shop Floor - The Restructuring of a Weaving Mill, Hungary 1988-97
4 12/03
973 C. Belzil J. Hansen
Structural Estimates of the Intergenerational Education Correlation
1 12/03
974 J. Schwarze M. Härpfer
Are People Inequality Averse, and Do They Prefer Redistribution by the State? A Revised Version
3 12/03
975 A. Constant K. F. Zimmermann
Occupational Choice across Generations 1 12/03
976 J. D. Angrist K. Lang
Does School Integration Generate Peer Effects? Evidence from Boston’s Metco Program
6 01/04
977 M. Corak G. Lipps J. Zhao
Family Income and Participation in Post-Secondary Education
5 01/04
978 J. T. Addison P. Portugal
How Does the Unemployment Insurance System Shape the Time Profile of Jobless Duration?
3 01/04
979 M. Moreno H. Ñopo J. Saavedra M. Torero
Gender and Racial Discrimination in Hiring: A Pseudo Audit Study for Three Selected Occupations in Metropolitan Lima
1 01/04
An updated list of IZA Discussion Papers is available on the center‘s homepage www.iza.org.