gender and racial disparities in the management of diabetes mellitus among medicare patients
TRANSCRIPT
B
SSN(t
AMO
Women’s Health Issues 17 (2007) 150–161
CP
GENDER AND RACIAL DISPARITIES IN THE MANAGEMENTOF DIABETES MELLITUS AMONG MEDICARE PATIENTS
Ann F. Chou, PhD, MPHa*, Arleen F. Brown, MD, PhDb, Roxanne E. Jensenc, Sarah Shih,MPHd, Greg Pawlson, MD, MPHd, Sarah Hudson Scholle, DrPH, MPHd
aDepartment of Health Administration and Policy, College of Public Health and College of Medicine, University of Oklahoma,bDivision of General Internal Medicine and Health Services Research, University of California,
cDepartment of Health Policy and Management, Johns Hopkins Bloomberg School of Public Health,dThe National Committee for Quality Assurance 2000 L St., Suite 500, Washington, DC
Received 21 December 2006; revised 11 January 2007; accepted 23 March 2007
Background: Racial/ethnic disparities in diabetes care have been demonstrated in severalsettings, but few studies have evaluated whether racial/ethnic differences vary by gender. Theobjective of this study is to understand gender and racial effects on diabetes care for Medicaremanaged care beneficiaries.
Methods: Using data from: (1) Healthcare Effectiveness Data and Information Set (HEDIS®); (2)Medicare Enrollment Files; and (3) U.S. Census, hierarchical generalized linear analyses wereconducted to model the six HEDIS comprehensive diabetes care quality indicators, includingprocesses of care and intermediate outcome measures, as a function of gender and race/ethnicity.
Results: Women were more likely to have received HbA1c screening or eye examination, but lesslikely to have LDL control at <100 mg/dL, compared to men. Racial disparities favored whites in fivemeasures, where African Americans were less likely to have received HbA1c screening, eye examina-tion, cholesterol screening, or achieve adequate HbA1c control or LDL control at <100 mg/dL. Enrolleesin managed care plans where African Americans constituted more than 20% of their insuredpopulation tended to have lower likelihood of meeting the HbA1c screening, HbA1c control, and eyeexamination measures.
Conclusions and Discussion: Gender and racial disparities in performance indicators were presentamong persons enrolled in Medicare managed care. White women were more likely to have met theperformance measures related to process of care, but African Americans fared worse in both processof care and intermediate health outcome measures, compared to their white counterparts. Poorperformance in cholesterol control observed in women of both races suggests the possibility of lessintensive cholesterol treatment in women. The differences in the pattern of care demonstrate the need
for interventions tailored to address gender and race/ethnicity.(dddpewirpwr
ackground
everal studies have demonstrated less than optimalmanagement of diabetes mellitus in the United
tates (McGlynn et al., 2003). Data from the 1999-2000ational Health and Nutrition Examination Surveys
NHANES) showed that only 37% of adults with diabe-es achieved the recommended goals of Hemoglobin A1c
* Corresponding Author: Ann F. Chou. Department of Healthdministration and Policy, College of Public Health and College ofedicine, University of Oklahoma, 801 NE 13th St., CHB 355,klahoma City, OK 73120, Phone: 405-271-2115; Fax: 405-271-1868;
iE-mail: [email protected]
opyright © 2007 by the Jacobs Institute of Women’s Health.ublished by Elsevier Inc.
HbA1c) level, blood pressure, and cholesterol level (Say-ah, Fradkin, & Cowie, 2004). McGlynn and colleaguesocumented only 24% of adults with diabetes had un-ergone three or more HbA1c testing over a two-yeareriod (McGlynn et al., 2003). These problems are oftenxacerbated when groups of vulnerable patients, such asomen and racial/ethnic minorities, experience dispar-
ties in the quality of care, and the consequences mayesult in adverse implications on their health. For exam-le, Correa-de-Araujo et al. reported that 28.9% ofomen versus 33.9% of men who had diabetes have
eceived all five recommended services (i.e., HbA1c test-
ng, lipid profile, influenza immunization, eye and foot1049-3867/07 $-See front matter.doi:10.1016/j.whi.2007.03.003
eAiidcthrchcaaA1
bltaaAcAoCAafNimtaSZ(AmIdtw
hse&ThdFidwr
mtgIomdrr
M
DTlaaTpt(dcMpv9rrcarAqdZhi
adSlmidpmizflbw
A. F. Chou, et al. / Women’s Health Issues 17 (2007) 150–161 151
xamination) in the appropriate time frame (Correa-de-raujo, McDermott, & Moy, 2006). While racial dispar-
ties for process of care outcomes may have slightlymproved over time, Trivedi et al. showed that theseisparities did not decrease for intermediate health out-omes such as HbA1c control (Trivedi et al., 2005). Theserends are particularly concerning as women are atigher relative risk than men of having complicationselated to diabetes, including diabetic ketoacidosis andardiovascular disease (CVD), and African Americansave higher rates than whites of having microvascularomplications, including end-stage renal disease (ESRD)nd lower extremity amputation (AHRQ, 2004; Cowie etl., 1989; Karter et al., 2002; Lavery, van Houtum, Ashry,rmstrong, & Pugh, 1999; Rostand, Kirk, Rutsky, & Pate,
982).African American women have higher rates of dia-
etes than white women and they may be at particu-arly high risk for inferior care and poor outcomes forhe cardiovascular complications of diabetes. For ex-mple, a study using clinical vignettes found thatmong patients with identical clinical presentations,frican American women were referred less often for
ardiac catherization than white women or Africanmerican or white men (Schulman et al., 1999). More-ver, African American women have a higher risk ofVD than white women. Studies have shown thatfrican American women were less likely to receive
ppropriate preventive therapy and adequate riskactor control than white women (Jha et al., 2003).onetheless, there is some recent evidence showing
mprovement in quality of care among enrollees ofanaged care plans and racial disparities in achieving
hese clinical performance standards have improveds well (Jencks et al., 2000; Jha et al., 2003; Jha, Perlin,teinman, Peabody, & Ayanian, 2005; Trivedi,aslavsky, Schneider, & Ayanian, 2005). Trivedi et al.
2005) showed that the gap between white and Africanmerican Medicare beneficiaries narrowed for severaleasures from the Healthcare Effectiveness Data and
nformation Set (HEDIS®), although the rates of racialisparities were increasing for glucose control in pa-
ients with diabetes and cholesterol control in patientsith heart disease (Trivedi et al., 2005).While racial and ethnic disparities in diabetes care
ave been demonstrated in several settings, only a fewtudies have evaluated whether racial/ethnic differ-nces vary by gender (Correa-de-Araujo, McDermott,
Moy, 2006; Schneider et al., 2001; Trivedi et al., 2005;seng et al., 2006). Moreover, some previous studiesave small sample sizes, biases related to self-reportedata, or have not detected significant differences.urthermore, research documenting racial disparities
n diabetes management has focused on incidence ofiabetes-related complications (Karter et al., 2002),hich could be biologically determined, rather than
elated to differential treatment of risk factors that are c
ore directly controlled by clinicians. Nevertheless,hese studies have provided the basis for our investi-ation (Correa-de-Araujo, McDermott, & Moy, 2006).n this study, we assessed the effect of race and gendern both processes of care and intermediate outcomeeasures related to the provision of comprehensive
iabetes care from the HEDIS set in a nationallyepresentative sample of Medicare beneficiaries en-olled in managed care.
ethods
ata and Sample Selectionhis study employed three data sources: (1) Member-
evel HEDIS data submitted by 160 Medicare man-ged care plans from 2004; (2) Centers for Medicarend Medicaid Services (CMS) Enrollment Files; and (3)he U.S. Census Data. HEDIS is a comprehensiveerformance measurement program administered by
he National Committee for Quality AssuranceNCQA). The program evaluates the quality of careelivered under managed care, with measures that areonsidered industry standard used by most Health
aintenance Organizations to report performance torivate and public purchasers, including CMS andarious state agencies. HEDIS reporting covers about0% of managed care enrollees across the country,epresenting more than 90 million Americans. Theeporting uses data derived from administrativelaims, such as billing records, and chart reviews. Inddition to submitting plan-level aggregate data, CMSequires all health plans participating in the Medicaredvantage Program to report member-level HEDISuality indicators. We linked these indicators with theemographic profiles in the CMS Enrollment Files.ip codes were extracted to match the average house-old income derived from the Census data for persons
n the sample.Prior to the merging of HEDIS member-level data
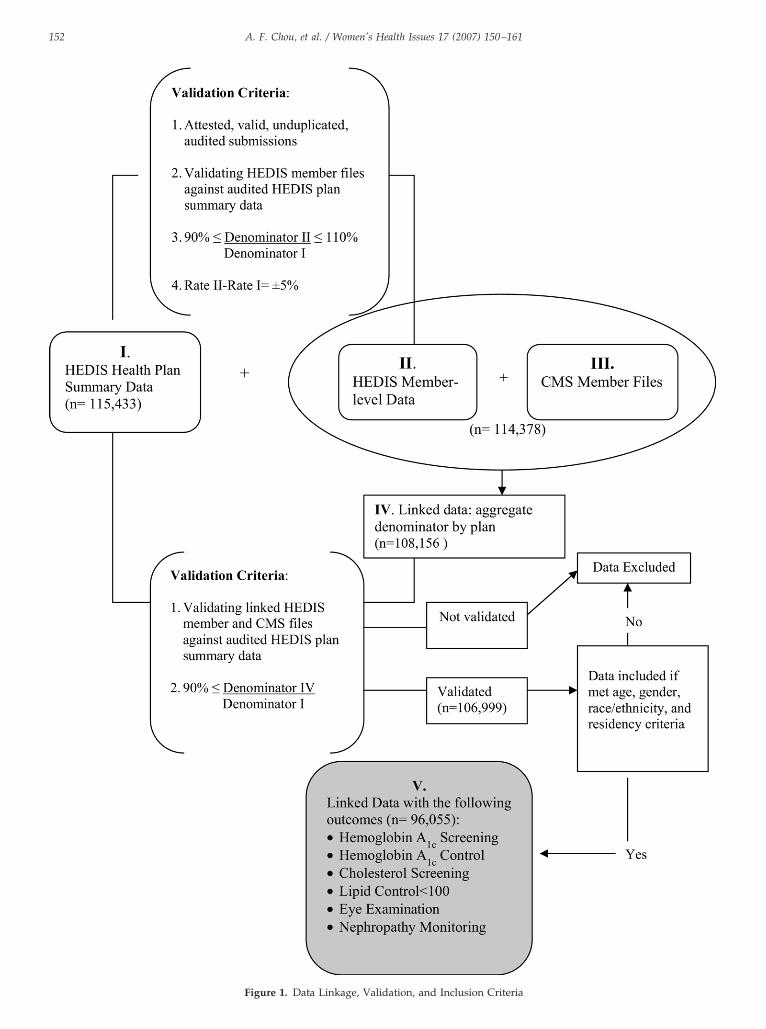
nd CMS Enrollment Files, the HEDIS member-levelata were validated against HEDIS Health Planummary Data. We excluded plans whose member-evel data submissions had incongruent perfor-
ance rates, defined as a 5% differential in denom-nator sizes between member- and plan-level HEDISata. These rules led to the exclusion of 1.3% oflans and 5.4% of patients. We linked the HEDISember-level data to CMS Enrollment Files contain-
ng information on age, gender, race/ethnicity andip code using Medicare program’s unique identi-ier (HICNUM). We excluded those whose overallinkage rate was less than 90%. Furthermore, mem-ers with missing age, gender, and residency dataere excluded (Figure 1).CMS Enrollment Files categorize Medicare benefi-
iaries into racial/ethnic categories of White, African
A. F. Chou, et al. / Women’s Health Issues 17 (2007) 150–161152
Figure 1. Data Linkage, Validation, and Inclusion Criteria
AcSmwLs3PLaaAnVecbef1
M
DtHidsesm1cclm
civ
T
C
** can be
A. F. Chou, et al. / Women’s Health Issues 17 (2007) 150–161 153
merican, Latino, Asian, or other race, based on dataollected from the member at the time of enrollment inocial Security. However, we limited our sample toembers who were identified as African American orhite for two reasons. First, proportions of Asians andatinos in the sample identified in the CMS file weremall. In our sample, Asians and Latinos constituted% and 2.6% of available population, respectively.revious reports have also noted underreporting ofatino ethnicity and Asian race, resulting in too smallsample size to conduct separate analyses (Virnig et
l., 2002). Second, reporting of enrollees who weresians, Latinos, or others, was inconsistent and couldot be further verified (Escarce & McGuire, 2003;irnig et al., 2002). While CMS data for race andthnicity categorization have changed over time, theategorization of African Americans and whites haveeen shown to be the most consistent. In addition, wexcluded observations with missing race data. Theinal dataset for analysis yielded 96,055 members in
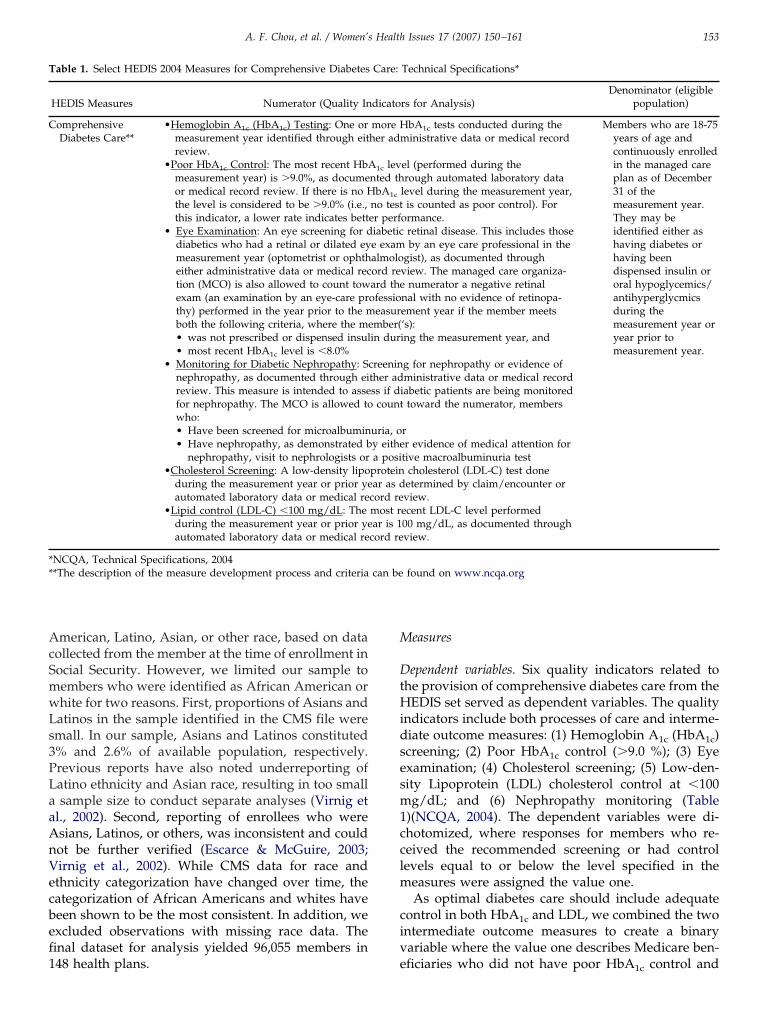
able 1. Select HEDIS 2004 Measures for Comprehensive Diabetes
HEDIS Measures Numerator (Quality In
omprehensiveDiabetes Care**
•Hemoglobin A1c (HbA1c) Testing: One ormeasurement year identified through eitreview.
•Poor HbA1c Control: The most recent HbAmeasurement year) is �9.0%, as documeor medical record review. If there is no Hthe level is considered to be �9.0% (i.e.,this indicator, a lower rate indicates bett
• Eye Examination: An eye screening for ddiabetics who had a retinal or dilated eymeasurement year (optometrist or ophtheither administrative data or medical rection (MCO) is also allowed to count towexam (an examination by an eye-care prthy) performed in the year prior to the mboth the following criteria, where the me• was not prescribed or dispensed insul• most recent HbA1c level is �8.0%
• Monitoring for Diabetic Nephropathy: Snephropathy, as documented through eireview. This measure is intended to assefor nephropathy. The MCO is allowed towho:• Have been screened for microalbumin• Have nephropathy, as demonstrated b
nephropathy, visit to nephrologists or•Cholesterol Screening: A low-density lipo
during the measurement year or prior yeautomated laboratory data or medical re
•Lipid control (LDL-C) �100 mg/dL: Theduring the measurement year or prior yeautomated laboratory data or medical re
NCQA, Technical Specifications, 2004*The description of the measure development process and criteria
48 health plans. e
easures
ependent variables. Six quality indicators related tohe provision of comprehensive diabetes care from the
EDIS set served as dependent variables. The qualityndicators include both processes of care and interme-iate outcome measures: (1) Hemoglobin A1c (HbA1c)creening; (2) Poor HbA1c control (�9.0 %); (3) Eyexamination; (4) Cholesterol screening; (5) Low-den-ity Lipoprotein (LDL) cholesterol control at �100g/dL; and (6) Nephropathy monitoring (Table
)(NCQA, 2004). The dependent variables were di-hotomized, where responses for members who re-eived the recommended screening or had controlevels equal to or below the level specified in the
easures were assigned the value one.As optimal diabetes care should include adequate
ontrol in both HbA1c and LDL, we combined the twontermediate outcome measures to create a binaryariable where the value one describes Medicare ben-
Technical Specifications*
rs for Analysis)Denominator (eligible
population)
bA1c tests conducted during theinistrative data or medical record
Members who are 18-75years of age andcontinuously enrolledin the managed careplan as of December31 of themeasurement year.They may beidentified either ashaving diabetes orhaving beendispensed insulin ororal hypoglycemics/antihyperglycmicsduring themeasurement year oryear prior tomeasurement year.
el (performed during therough automated laboratory data
level during the measurement year,is counted as poor control). For
ormance.retinal disease. This includes thoseby an eye care professional in the
gist), as documented throughview. The managed care organiza-
numerator a negative retinalnal with no evidence of retinopa-ement year if the member meets‘s):ing the measurement year, and
g for nephropathy or evidence ofministrative data or medical record
iabetic patients are being monitoredtoward the numerator, members
rr evidence of medical attention for
tive macroalbuminuria testcholesterol (LDL-C) test doneetermined by claim/encounter orview.ecent LDL-C level performed00 mg/dL, as documented throughview.
found on www.ncqa.org
Care:
dicato
more Hher adm
1c levnted th
bA1c
no tester perfiabetice examalmoloord reard theofessio
easurmber(
in dur
creeninther adss if d
count
uria, oy eithea posi
proteinar as d
cord remost rar is 1
cord re
ficiaries who did not have poor HbA1c control and
awo
EmAobftw
CearatlamsEAwuDsuos$tlsv5
SDofrs
opaHtmaRHtg
mrlmewt
R
TMcimt$otMEpA
rAmo
T
G
R
A
H
R
E
A. F. Chou, et al. / Women’s Health Issues 17 (2007) 150–161154
chieved adequate LDL control, and the value zeroere assigned to those who had poor control in both
utcome measures.
xplanatory variables. Race and gender were the twoain covariates. The value, one, was assigned tofrican Americans and women. To explore the effectf race associated with health plans, we created ainary variable where Medicare managed care bene-iciaries who enrolled in health plans where greaterhan 20% of their enrollees were African Americans
ere assigned the value one.
ontrol variables. Several demographic variables werentered into the model at the first level. Using thoseged 65–69 as the reference group, we compared theeferent to those who were aged (1) less than 65 years;nd (2) 70–75. For this analysis, we limited the age tohose below 75 years in accordance to national guide-ines. We also controlled for possible geographic vari-tions by creating eight categories of regions whereembers reside, using the categories of the U.S. cen-
us, including Pacific, Mountain, West North Central,ast North Central, South Central, South Atlantic, Midtlantic, with Northeast as the comparison. Northeastas the designated reference group as this regionsually demonstrates the highest performance in HE-IS measures. As the information on socioeconomic
tatus for individual members was unavailable, wesed the average household income for ages 65 orlder by zip code as a proxy. Household income wastratified into four groups: (1) less than $15,000; (2)15,000-$30,000; (3) $30,000-$45,000; and (4) greaterhan $45,000 as the reference group. At the secondevel of our modeling, we controlled for health planize using the enrollment number, where a binaryariable was created with plans that had more than0,000 members assigned the value of one.
tatistical Analysisescriptive statistics were compiled to describe theverall sample. We also generated unadjusted ratesor gender, race, and the interaction of gender andace, and conducted significance testing among theubgroups.
To assess disparities, we estimated the probabilityf meeting individual diabetes management HEDISerformance measures for each patient using a hier-rchical generalized linear model (HGLM). TheGLM model accommodates the nested data struc-
ure and gives each level of the data its own sub-odel, taking into account bias due to differences
ttributed to health plans (Raudenbush & Bryk, 2002;audenbush, Bryk, Cheong, & Congdon, 2004). TheGLM analyses modeled HEDIS measures as func-
ions of gender and race, controlling for socio-demo-
raphic characteristics, enrolling in a health plan with rore than 20% minority population, and region ofesidence at the first level, and plan size at the secondevel. Adjusted rates of meeting the HEDIS perfor-
ance measures were calculated based on the HGLMstimates, with a 95% confidence interval. All analysesere conducted using SAS software v9.1 [SAS Insti-
ute, Cary, NC].
esults
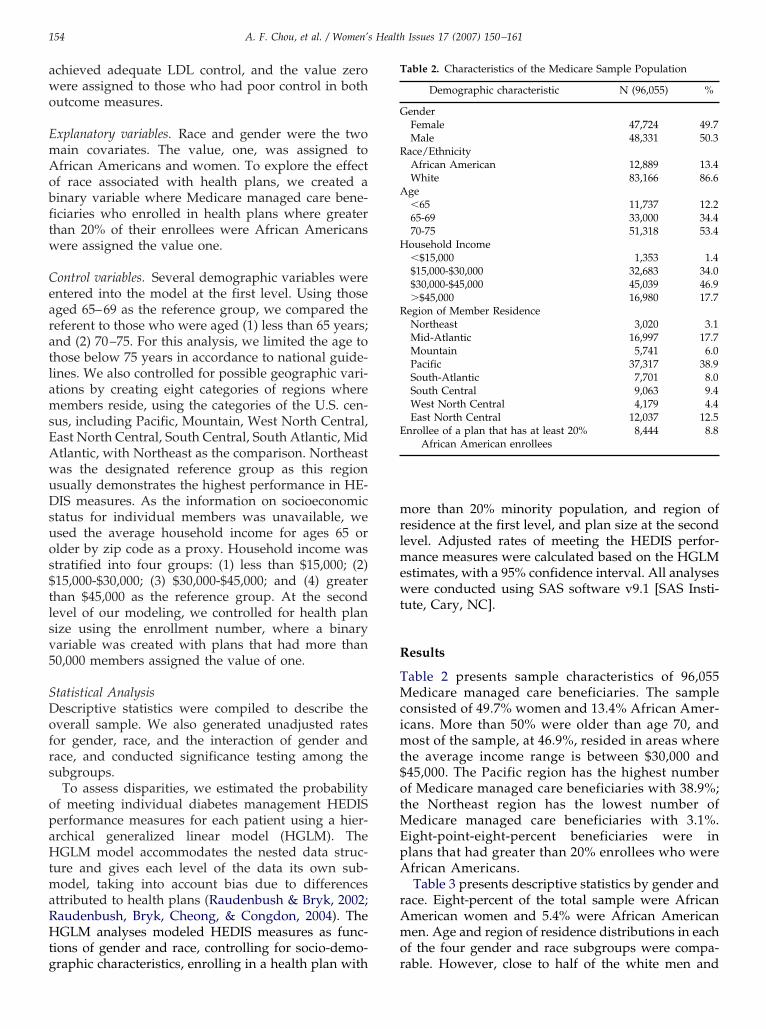
able 2 presents sample characteristics of 96,055edicare managed care beneficiaries. The sample
onsisted of 49.7% women and 13.4% African Amer-cans. More than 50% were older than age 70, and
ost of the sample, at 46.9%, resided in areas wherehe average income range is between $30,000 and45,000. The Pacific region has the highest numberf Medicare managed care beneficiaries with 38.9%;he Northeast region has the lowest number of
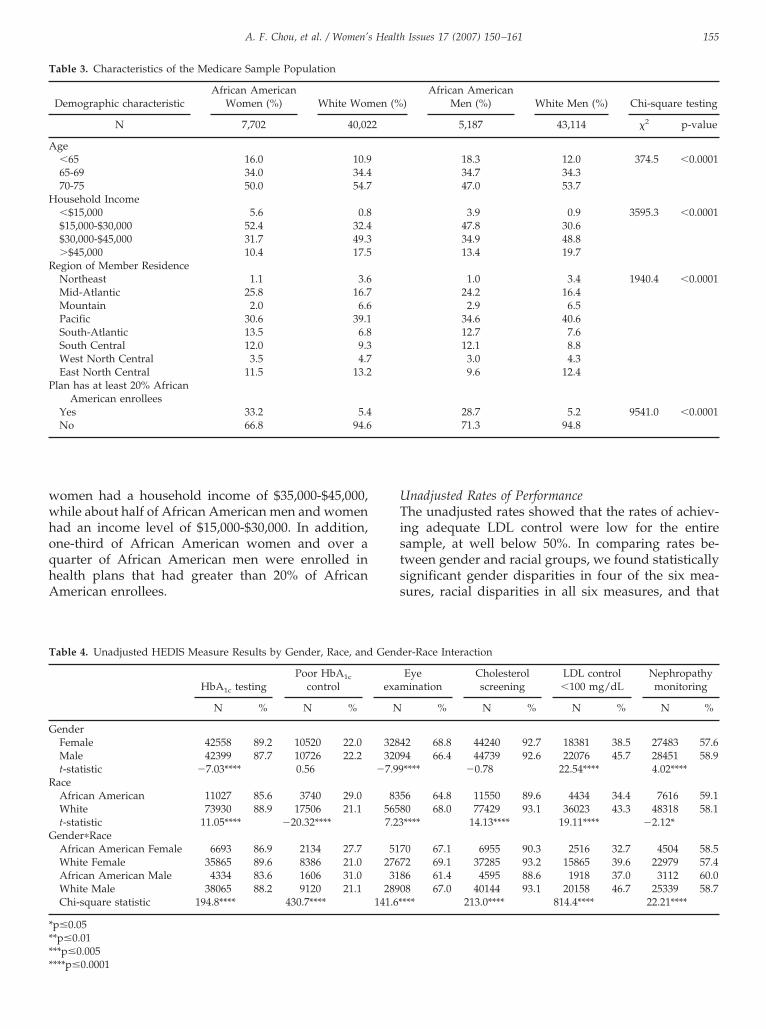
edicare managed care beneficiaries with 3.1%.ight-point-eight-percent beneficiaries were inlans that had greater than 20% enrollees who werefrican Americans.Table 3 presents descriptive statistics by gender and
ace. Eight-percent of the total sample were Africanmerican women and 5.4% were African Americanen. Age and region of residence distributions in each
f the four gender and race subgroups were compa-
able 2. Characteristics of the Medicare Sample Population
Demographic characteristic N (96,055) %
enderFemale 47,724 49.7Male 48,331 50.3
ace/EthnicityAfrican American 12,889 13.4White 83,166 86.6ge�65 11,737 12.265-69 33,000 34.470-75 51,318 53.4ousehold Income�$15,000 1,353 1.4$15,000-$30,000 32,683 34.0$30,000-$45,000 45,039 46.9�$45,000 16,980 17.7
egion of Member ResidenceNortheast 3,020 3.1Mid-Atlantic 16,997 17.7Mountain 5,741 6.0Pacific 37,317 38.9South-Atlantic 7,701 8.0South Central 9,063 9.4West North Central 4,179 4.4East North Central 12,037 12.5
nrollee of a plan that has at least 20%African American enrollees
8,444 8.8
able. However, close to half of the white men and
wwhoqhA
UTistss
T
A
H
R
P
T
G
R
G
****
A. F. Chou, et al. / Women’s Health Issues 17 (2007) 150–161 155
omen had a household income of $35,000-$45,000,hile about half of African American men and women
ad an income level of $15,000-$30,000. In addition,ne-third of African American women and over auarter of African American men were enrolled inealth plans that had greater than 20% of Africanmerican enrollees.
able 3. Characteristics of the Medicare Sample Population
Demographic characteristicAfrican American
Women (%) White Wom
N 7,702 40,02
ge�65 16.0 10.965-69 34.0 34.470-75 50.0 54.7ousehold Income�$15,000 5.6 0.8$15,000-$30,000 52.4 32.4$30,000-$45,000 31.7 49.3�$45,000 10.4 17.5
egion of Member ResidenceNortheast 1.1 3.6Mid-Atlantic 25.8 16.7Mountain 2.0 6.6Pacific 30.6 39.1South-Atlantic 13.5 6.8South Central 12.0 9.3West North Central 3.5 4.7East North Central 11.5 13.2
lan has at least 20% AfricanAmerican enrollees
Yes 33.2 5.4No 66.8 94.6
able 4. Unadjusted HEDIS Measure Results by Gender, Race, and
HbA1c testingPoor HbA1c
control
N % N %
enderFemale 42558 89.2 10520 22.0Male 42399 87.7 10726 22.2t-statistic �7.03**** 0.56
aceAfrican American 11027 85.6 3740 29.0White 73930 88.9 17506 21.1t-statistic 11.05**** �20.32****ender�RaceAfrican American Female 6693 86.9 2134 27.7White Female 35865 89.6 8386 21.0African American Male 4334 83.6 1606 31.0White Male 38065 88.2 9120 21.1Chi-square statistic 194.8**** 430.7****
p�0.05*p�0.01**p�0.005
***p�0.0001nadjusted Rates of Performancehe unadjusted rates showed that the rates of achiev-
ng adequate LDL control were low for the entireample, at well below 50%. In comparing rates be-ween gender and racial groups, we found statisticallyignificant gender disparities in four of the six mea-ures, racial disparities in all six measures, and that
)African American
Men (%) White Men (%) Chi-square testing
5,187 43,114 �2 p-value
18.3 12.0 374.5 �0.000134.7 34.347.0 53.7
3.9 0.9 3595.3 �0.000147.8 30.634.9 48.813.4 19.7
1.0 3.4 1940.4 �0.000124.2 16.42.9 6.5
34.6 40.612.7 7.612.1 8.83.0 4.39.6 12.4
28.7 5.2 9541.0 �0.000171.3 94.8
er-Race Interaction
Eyeination
Cholesterolscreening
LDL control�100 mg/dL
Nephropathymonitoring
% N % N % N %
2 68.8 44240 92.7 18381 38.5 27483 57.64 66.4 44739 92.6 22076 45.7 28451 58.9**** �0.78 22.54**** 4.02****
6 64.8 11550 89.6 4434 34.4 7616 59.10 68.0 77429 93.1 36023 43.3 48318 58.1**** 14.13**** 19.11**** �2.12*
0 67.1 6955 90.3 2516 32.7 4504 58.52 69.1 37285 93.2 15865 39.6 22979 57.46 61.4 4595 88.6 1918 37.0 3112 60.08 67.0 40144 93.1 20158 46.7 25339 58.7
*** 213.0**** 814.4**** 22.21****
en (%
2
Gend
exam
N
32843209
�7.99
83556587.23
5172767318
2890141.6*
tltrtDA8Ht
mwwweeaiwdcrtnshp1CY
rsegwrpembwaswbeTw
pwcwfg
rw%as
trAewegiAm
HoTadpLte(Owamon
aAl((iw(Leo
mc2Wg2(h0
A. F. Chou, et al. / Women’s Health Issues 17 (2007) 150–161156
he pattern of disparity varied by race (Table 4). Theargest disparities were observed in measures relatedo intermediate health outcomes. The difference inates of adequate LDL control at �100 mg/dL be-ween men and women was 7.2% in favor of men.ifferences in the rates for LDL control betweenfrican Americans and whites were even greater, at
.9% in favor of whites. In addition, the rate of poorbA1c control for African Americans was 7.9% greater
han that for their white counterparts.On the other hand, the rates for process of careeasures were fairly comparable between men andomen as well as between African Americans andhite. Gender disparities in process of care measuresere mostly small in magnitude, where the differ-
nces were 1.5% in HbA1c testing and 2.4% in eyexamination in favor of women, and 1.3% in nephrop-thy monitoring in favor of men. All racial differencesn process of care measures were in favor of whites,
ith the exception of nephropathy monitoring. Racialifferences in rates for meeting the HbA1c screening,holesterol screening, and eye examination standardsanged from 3.2-3.5% in favor of whites. Albeit ex-remely small, the 1% difference in the rates forephropathy screening was the only difference ob-erved in favor of African Americans, who as a cohortas well-documented elevation in ESRD risk that careroviders may recognize and take action (Cowie et al.,989; Cowie, Harris, Silverman, Johnson, & Rust, 1993;owie, Port, Rust, & Harris, 1994; Karter et al., 2002;oung, Maynard, Reiber, & Boyko, 2003).The rates for race and gender interactions show that
ace effects dominated in measures related to HbA1ccreening and control, while both race and genderffects are strong for LDL control. Among the fourender/race groups, African American men fared theorst on HbA1c control. African American men had a
ate that exceeded white men by 10.0 percentageoints and African American women had a rate thatxceeded white women by 6.7%. The rates for whiteen and women were similar and the difference
etween those of African American men and womenas 3.3%. In contrast, African American women were
t the greatest disadvantage on the LDL control mea-ure. Among both African Americans and whites, menere better off than women (a 7.1-point difference
etween white men and women and 4.3-point differ-nce between African American men and women).he difference between African American women andhite men was 14%.Similar racial disparities are observed in the two
rocess of care measures. African American men andomen were less likely to have received HbA1c and
holesterol screening compared to white men andomen, but within each racial group, the performance
or women exceeded that of men. Across the four
ender/racial groups, white women had the highest tates of getting HbA1c screening (89.6%), followed byhite men at 88.2%, African American women at 86.9, and African American men at 83.6%. Similar trends
mong the four groups were observed for cholesterolcreening.
Gender effects were apparent for the eye examina-ion measure, in that white women had the highestate of having eye examinations, followed by Africanmerican women. The difference in rates in obtaining
ye examination between African American and whiteomen was only 2% in favor of white women. How-
ver, in comparing gender effects within each racialroup, the difference in rates between African Amer-
can men and women was 5.7% in favor of Africanmerican women and the difference between whiteen and women was 2.1% in favor of white women.
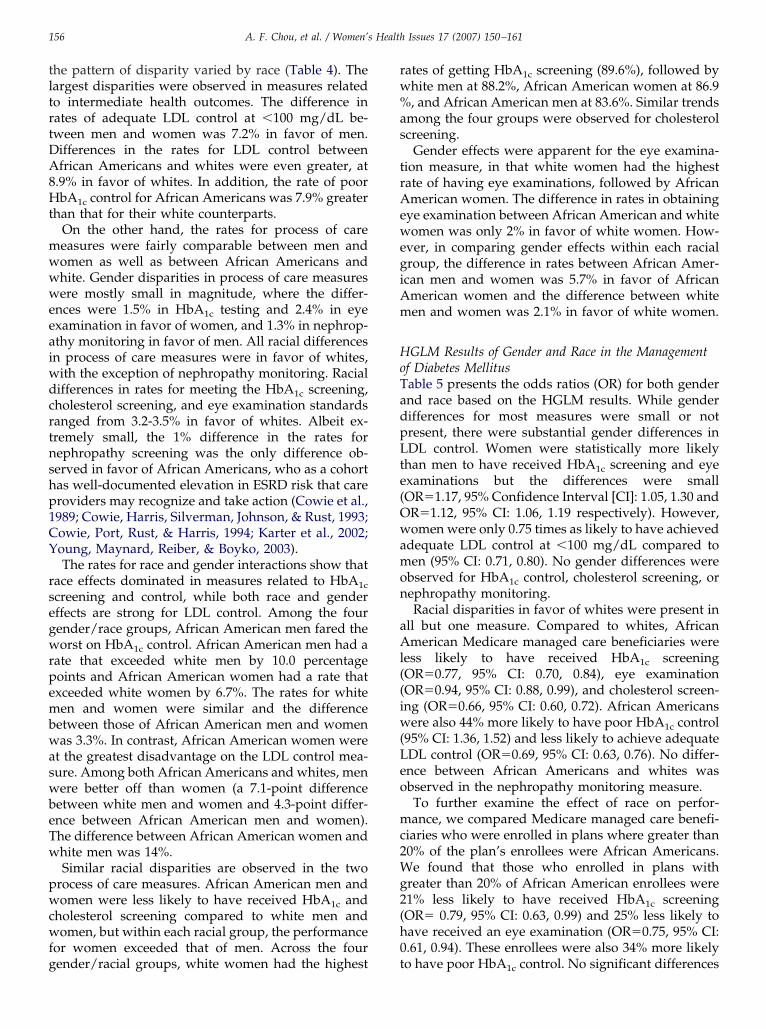
GLM Results of Gender and Race in the Managementf Diabetes Mellitusable 5 presents the odds ratios (OR) for both gendernd race based on the HGLM results. While genderifferences for most measures were small or notresent, there were substantial gender differences inDL control. Women were statistically more likely
han men to have received HbA1c screening and eyexaminations but the differences were smallOR�1.17, 95% Confidence Interval [CI]: 1.05, 1.30 andR�1.12, 95% CI: 1.06, 1.19 respectively). However,omen were only 0.75 times as likely to have achieved
dequate LDL control at �100 mg/dL compared toen (95% CI: 0.71, 0.80). No gender differences were
bserved for HbA1c control, cholesterol screening, orephropathy monitoring.Racial disparities in favor of whites were present in
ll but one measure. Compared to whites, Africanmerican Medicare managed care beneficiaries were
ess likely to have received HbA1c screeningOR�0.77, 95% CI: 0.70, 0.84), eye examinationOR�0.94, 95% CI: 0.88, 0.99), and cholesterol screen-ng (OR�0.66, 95% CI: 0.60, 0.72). African Americans
ere also 44% more likely to have poor HbA1c control95% CI: 1.36, 1.52) and less likely to achieve adequateDL control (OR�0.69, 95% CI: 0.63, 0.76). No differ-nce between African Americans and whites wasbserved in the nephropathy monitoring measure.To further examine the effect of race on perfor-ance, we compared Medicare managed care benefi-
iaries who were enrolled in plans where greater than0% of the plan’s enrollees were African Americans.e found that those who enrolled in plans with
reater than 20% of African American enrollees were1% less likely to have received HbA1c screeningOR� 0.79, 95% CI: 0.63, 0.99) and 25% less likely toave received an eye examination (OR�0.75, 95% CI:.61, 0.94). These enrollees were also 34% more likely
o have poor HbA1c control. No significant differences
Table 5. Predictors of HEDIS Measures Related to Comprehensive Diabetes Care (Odds Ratios and 95% Confidence Intervals)§
Odds Ratio (95% Confidence Interval)
HbA1c testingPoor HbA1c
controlEye
examinationCholesterolscreening
LDL control�100 mg/dL
Nephropathymonitoring
HbA1c & LDLcontrol#
Female (Male)† 1.17** (1.05, 1.30) 0.97 (0.93, 1.02) 1.12*** (1.06, 1.19) 1.06 (0.99, 1.14) 0.75**** (0.71, 0.80) 0.98 (0.94, 1.01) 0.85**** (0.79, 0.91)African American (White) 0.77**** (0.70, 0.84) 1.44**** (1.36, 1.52) 0.94* (0.88, 0.99) 0.66**** (0.60, 0.72) 0.69**** (0.63, 0.76) 1.08 (0.90, 1.30) 0.57**** (0.52, 0.62)African American Female 1.16* (1.03, 1.31) 0.85*** (0.79, 0.93) 1.19**** (1.11, 1.27) 1.20* (1.04, 1.38) 1.13*** (1.06, 1.21) 1.02 (0.94, 1.11) 1.20**** (1.10, 1.32)Age (65-70 years)
Under 65 0.73**** (0.65, 0.82) 1.51**** (1.40, 1.62) 0.69**** (0.64, 0.74) 0.71**** (0.64, 0.78) 0.89**** (0.85, 0.93) 1.00 (0.94, 1.07) 0.65**** (0.60, 0.69)Age 70-75 0.98 (0.94, 1.02) 0.94**** (0.91, 0.97) 1.15**** (1.09, 1.22) 0.87** (0.82, 0.93) 0.95* (0.92, 0.99) 0.94* (0.87, 0.99) 1.10**** (1.06, 1.14)
SES (Income�$45,000)Income �$15,000 0.86 (0.72, 1.04) 1.09 (0.96, 1.24) 0.74**** (0.67, 0.83) 0.87**** (0.82, 0.93) 0.95* (0.92, 0.99) 0.94* (0.87, 0.99) 0.84* (0.72, 0.99)Income $15,000-$30,000 0.93* (0.87, 1.00) 1.07* (1.01, 1.14) 0.80** (0.75, 0.86) 1.10 (0.85, 1.42) 1.52**** (1.28, 1.80) 1.03 (0.88, 1.21) 0.91** (0.85, 0.97)Income $30,000-$45,000 1.04 (0.98, 1.10) 0.95* (0.92, 0.99) 0.92*** (0.87, 0.97) 0.96 (0.90, 1.01) 0.99 (0.95, 1.02) 0.99 (0.97, 1.02) 1.03 (0.99, 1.08)
Region (Northeast)Mid-Atlantic 0.63*** (0.47, 0.86) 1.41 (0.85, 2.32) 0.62*** (0.46, 0.84) 0.63* (0.42, 0.92) 0.88 (0.71, 1.10) 0.81 (0.51, 1.30) 0.67 (0.37, 1.21)Mountain 0.70 (0.50, 0.97) 1.05 (0.65, 1.70) 0.51**** (0.37, 0.70) 0.65 (0.41, 1.02) 0.89 (0.70, 1.13) 0.90 (0.54, 1.50) 0.91 (0.50, 1.64)Pacific 0.81 (0.57, 1.15) 0.96 (0.59, 1.57) 0.80 (0.58, 1.10) 0.62* (0.43, 0.90) 0.74* (0.59, 0.93) 0.83 (0.52, 1.34) 0.91 (0.50, 1.67)South Atlantic 0.71 (0.51, 1.00) 0.95 (0.57, 1.57) 0.65* (0.46, 0.92) 0.65 (0.41, 1.06) 0.88 (0.73, 1.06) 0.75 (0.47, 1.21) 0.91 (0.52, 1.57)South Central 0.67* (0.49, 0.91) 1.06 (0.66, 1.71) 0.59 (0.42, 0.81) 0.65* (0.43, 0.99) 0.80* (0.66, 0.99) 0.78 (0.49, 1.25) 0.74 (0.41, 1.31)West North Central 0.75 (0.47, 1.19) 1.03 (0.61, 1.72) 0.79 (0.57, 1.09) 0.46*** (0.28, 0.77) 0.90 (0.67, 1.21) 0.85 (0.53, 1.38) 0.83 (0.46, 1.51)East North Central 0.74 (0.53, 1.04) 1.10 (0.67, 1.81) 0.62*** (0.45, 0.84) 0.58** (0.38, 0.86) 0.89 (0.72, 1.09) 0.80 (0.50, 1.27) 0.79 (0.45, 1.40)�20% African American Enrollees 0.79* (0.63, 0.99) 1.34* (1.06, 1.68) 0.75* (0.61, 0.94) 0.81 (0.63, 1.05) 0.93 (0.76, 1.13) 1.04 (0.79, 1.37) 0.75 (0.55, 1.03)
*p�0.05**p�0.01***p�0.005****p�0.0001†Reference groups are in parentheses§Odds ratios were computed based on parameter estimates generated from the hierarchical linear analysis, modeling each HEDIS measure as a function of gender and race/ethnicity, controllingfor age, income, and geographic region.#This analysis was limited only to individuals who met the performance indicators for both HbA1c and LDL, compared to individuals who had poor control in both outcomes.
A.F.C
hou,etal./
Wom
en’sH
ealthIssues
17(2007)
150–161
157
wt
wAilhw0cia
rrewe
mcAuHtcwA
D
BaowcA
ts
lsrtbmdRggrarAthTcodmA
asmdcgprccc
T
G
R
G
*r
A. F. Chou, et al. / Women’s Health Issues 17 (2007) 150–161158
ere observed for nephropathy monitoring, choles-erol screening and control measures.
In addition, our results demonstrated that thereere significant barriers for women and Africanmericans to achieve optimal diabetes care, which
ncludes adequate control in both HbA1c and LDL. Inimiting our analysis to those who had and those whoad not met both HbA1c and LDL control measures,e found that women were 0.85 times (95% CI: 0.79,
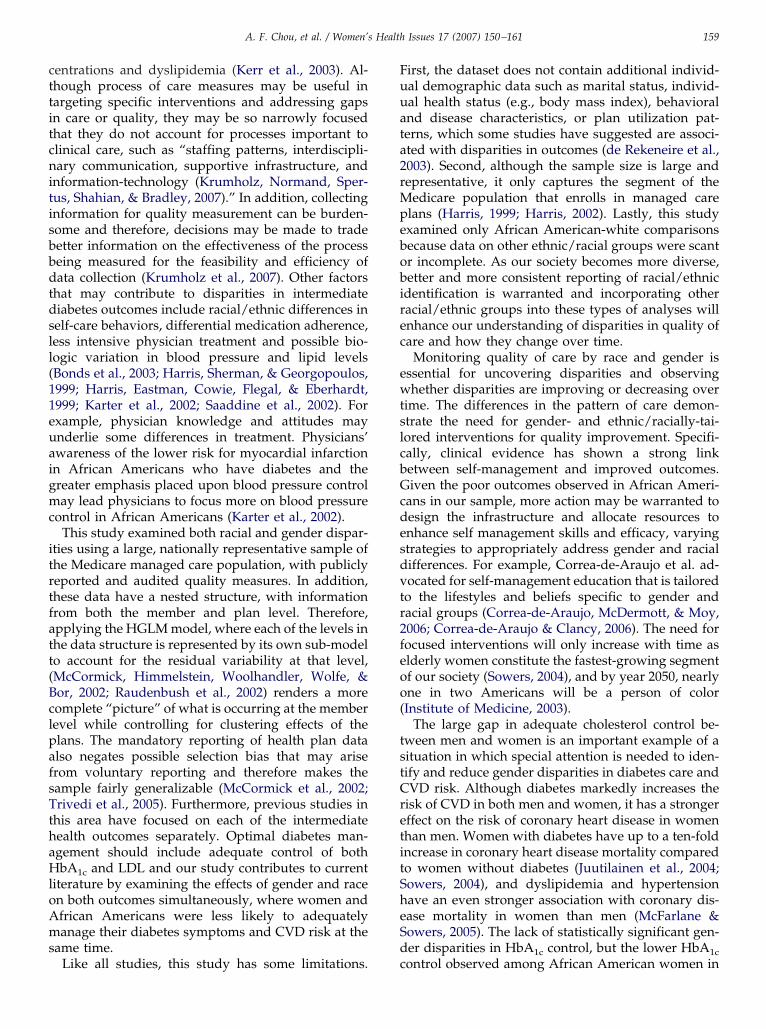
.91) as likely as men to have achieved adequateontrol in both outcome measures and African Amer-cans were only 0.57 times (95% CI: 0.52, 0.62) as likelys whites to have done so.Table 6 illustrates the magnitude of the gender and
ace disparities by presenting rates based on theegression analyses adjusted for demographic, socio-conomic, and regional variations. The adjusted ratesere very similar to the unadjusted rates, with differ-
nces generally about or less than a percent.Specifically among the four subgroups, clinicallyeaningful differences can be observed in the LDL
ontrol measure between white men and both Africanmerican men and women. Similar to the results fromnadjusted rates computation and the ORs fromGLM analyses, African American women were at
he greatest disadvantage in achieving adequate LDLontrol. The difference between African Americanomen and white men was 13.6% and that betweenfrican American and white men was 9.9%.
iscussion
oth gender and racial disparities in performancemong Medicare managed care beneficiaries werebserved. Our findings showed that women, bothhite and African American, were disadvantaged
ompared to men in cholesterol control, and African
able 6. Adjusted Rates* of HEDIS Measures by Gender, Race, and
HbA1c
testingPoor HbA
control
enderFemale (48,331) 89.5 (87.2, 91.4) 23.4 (19.5, 2Male (47,724) 88.0 (85.4, 90.1) 23.9 (20.0, 2
aceAfrican Americans (12,889) 85.8 (82.7, 88.4) 30.6 (25.9, 3White (83,166) 89.2 (86.7, 91.1) 22.6 (18.8, 2ender�RaceAfrican American Female (7,702) 87.2 (84.3, 89.6) 29.0 (24.5, 3White Female (40,022) 89.9 (87.8, 91.7) 22.3 (18.5, 2African American Male (5,187) 83.7 (80.4, 86.6) 32.8 (28.0, 3White Male (43,114) 88.5 (86.1, 90.5) 22.8 (19.1, 2
Adjusted rates were derived from hierarchical linear analysis resace/ethnicity, controlling for age, income, and geographic region.
mericans, both male and female, were disadvan- p
aged compared to whites on the two control mea-ures and three of the four screening measures.
In general, African American men received theowest rates for processes of care measures with theole exception of nephropathy screening, where theegression results were not statistically significant. Ashe unadjusted rates showed, the average disparityetween African Americans and whites for screeningeasures was approximately 3% but the greatest
isparities were observed in the control measures.acial disparity for HbA1c control was 7.9% and theap in meeting the performance standard was evenreater for the cholesterol control measure. Findingselated to the rates of meeting screening standardsmong African American men were similar to thoseeported by Correa-de-Araujo et al. Although Africanmerican women fared better than their male coun-
erparts in most measures, African American womenad the poorest LDL control among all beneficiaries.hese findings pose serious warnings for the healthare community as these poor intermediate healthutcomes are likely to lead to the development ofevastating long-term complications, increasing theorbidity and mortality as well as cost of care amongfrican Americans.These analyses suggest that gender and racial gaps
re smaller for process of care measures while they areubstantially larger for the intermediate outcomeseasures. The relative magnitude in gender and racial
isparities in the process of care measures may indi-ate a ceiling effect, as the screening rates for all fourroups were fairly high. On the other hand, thearadox of comparable process of diabetes care butacial/ethnic disparities in intermediate health out-omes may be explained by several factors. The pro-ess measures assessed in HEDIS may not adequatelyapture the patient-, provider-, and system-level com-
er-Race Interaction in Diabetes Management
(%, 95% CI)
Eyeexamination
Cholesterolscreening
LDL control�100 mg/dL
Nephropathymonitoring
8.2 (63.6, 72.5) 91.9 (89.7, 93.6) 37.8 (33.6, 42.2) 53.0 (48.1, 57.8)5.5 (60.6, 70.2) 91.4 (89.1, 93.2) 44.7 (40.2, 49.4) 53.5 (48.4, 58.4)
4.4 (59.2, 69.2) 88.5 (85.4, 91.1) 33.7 (29.2, 38.5) 54.7 (49.0, 60.3)7.3 (62.5, 71.7) 92.1 (90.0, 93.8) 42.5 (38.1, 47.0) 53.0 (48.2, 57.8)
6.7 (61.7, 71.4) 89.4 (86.4, 91.8) 32.2 (28.0, 36.7) 54.6 (48.9, 60.1)8.5 (63.9, 72.7) 92.3 (90.3, 93.9) 38.9 (34.7, 43.3) 52.7 (47.9, 57.3)0.9 (55.5, 66.0) 87.2 (83.8, 89.9) 35.9 (31.0, 41.1) 54.9 (49.0, 60.5)6.1 (61.2, 70.7) 91.9 (89.8, 93.6) 45.8 (41.3, 50.4) 53.3 (48.4, 58.2)
hich estimated each HEDIS measure as a function of gender and
Gend
1c
7.8) 68.3) 6
5.6) 66.9) 6
4.0) 66.6) 68.0) 67.2) 6
ults, w
onents of care needed to manage blood sugar con-
cttitcnitisbbdtdsll(11euaigmc
itrtfatt(BclpafsTthaHloAms
Fuuata2rMpebobirec
ewtslcbGcdesdvtr2feoo(
tstCretitSheSd
A. F. Chou, et al. / Women’s Health Issues 17 (2007) 150–161 159
entrations and dyslipidemia (Kerr et al., 2003). Al-hough process of care measures may be useful inargeting specific interventions and addressing gapsn care or quality, they may be so narrowly focusedhat they do not account for processes important tolinical care, such as “staffing patterns, interdiscipli-ary communication, supportive infrastructure, and
nformation-technology (Krumholz, Normand, Sper-us, Shahian, & Bradley, 2007).” In addition, collectingnformation for quality measurement can be burden-ome and therefore, decisions may be made to tradeetter information on the effectiveness of the processeing measured for the feasibility and efficiency ofata collection (Krumholz et al., 2007). Other factors
hat may contribute to disparities in intermediateiabetes outcomes include racial/ethnic differences inelf-care behaviors, differential medication adherence,ess intensive physician treatment and possible bio-ogic variation in blood pressure and lipid levelsBonds et al., 2003; Harris, Sherman, & Georgopoulos,999; Harris, Eastman, Cowie, Flegal, & Eberhardt,999; Karter et al., 2002; Saaddine et al., 2002). Forxample, physician knowledge and attitudes maynderlie some differences in treatment. Physicians’wareness of the lower risk for myocardial infarctionn African Americans who have diabetes and thereater emphasis placed upon blood pressure controlay lead physicians to focus more on blood pressure
ontrol in African Americans (Karter et al., 2002).This study examined both racial and gender dispar-
ties using a large, nationally representative sample ofhe Medicare managed care population, with publiclyeported and audited quality measures. In addition,hese data have a nested structure, with informationrom both the member and plan level. Therefore,pplying the HGLM model, where each of the levels inhe data structure is represented by its own sub-modelo account for the residual variability at that level,McCormick, Himmelstein, Woolhandler, Wolfe, &or, 2002; Raudenbush et al., 2002) renders a moreomplete “picture” of what is occurring at the memberevel while controlling for clustering effects of thelans. The mandatory reporting of health plan datalso negates possible selection bias that may ariserom voluntary reporting and therefore makes theample fairly generalizable (McCormick et al., 2002;rivedi et al., 2005). Furthermore, previous studies in
his area have focused on each of the intermediateealth outcomes separately. Optimal diabetes man-gement should include adequate control of bothbA1c and LDL and our study contributes to current
iterature by examining the effects of gender and racen both outcomes simultaneously, where women andfrican Americans were less likely to adequatelyanage their diabetes symptoms and CVD risk at the
ame time.
Like all studies, this study has some limitations. cirst, the dataset does not contain additional individ-al demographic data such as marital status, individ-al health status (e.g., body mass index), behavioralnd disease characteristics, or plan utilization pat-erns, which some studies have suggested are associ-ted with disparities in outcomes (de Rekeneire et al.,003). Second, although the sample size is large andepresentative, it only captures the segment of the
edicare population that enrolls in managed carelans (Harris, 1999; Harris, 2002). Lastly, this studyxamined only African American-white comparisonsecause data on other ethnic/racial groups were scantr incomplete. As our society becomes more diverse,etter and more consistent reporting of racial/ethnic
dentification is warranted and incorporating otheracial/ethnic groups into these types of analyses willnhance our understanding of disparities in quality ofare and how they change over time.
Monitoring quality of care by race and gender isssential for uncovering disparities and observinghether disparities are improving or decreasing over
ime. The differences in the pattern of care demon-trate the need for gender- and ethnic/racially-tai-ored interventions for quality improvement. Specifi-ally, clinical evidence has shown a strong linketween self-management and improved outcomes.iven the poor outcomes observed in African Ameri-
ans in our sample, more action may be warranted toesign the infrastructure and allocate resources tonhance self management skills and efficacy, varyingtrategies to appropriately address gender and racialifferences. For example, Correa-de-Araujo et al. ad-ocated for self-management education that is tailoredo the lifestyles and beliefs specific to gender andacial groups (Correa-de-Araujo, McDermott, & Moy,006; Correa-de-Araujo & Clancy, 2006). The need forocused interventions will only increase with time aslderly women constitute the fastest-growing segmentf our society (Sowers, 2004), and by year 2050, nearlyne in two Americans will be a person of colorInstitute of Medicine, 2003).
The large gap in adequate cholesterol control be-ween men and women is an important example of aituation in which special attention is needed to iden-ify and reduce gender disparities in diabetes care andVD risk. Although diabetes markedly increases the
isk of CVD in both men and women, it has a strongerffect on the risk of coronary heart disease in womenhan men. Women with diabetes have up to a ten-foldncrease in coronary heart disease mortality comparedo women without diabetes (Juutilainen et al., 2004;owers, 2004), and dyslipidemia and hypertensionave an even stronger association with coronary dis-ase mortality in women than men (McFarlane &owers, 2005). The lack of statistically significant gen-er disparities in HbA1c control, but the lower HbA1c
ontrol observed among African American women in
cwsmprposwmsmc
tarswgesTacdramrnehtctrtihcamfcama2mo
ATE
tdfmBt
RD
AB
C
C
C
C
C
d
E
H
H
H
H
I
J
J
J
A. F. Chou, et al. / Women’s Health Issues 17 (2007) 150–161160
omparison to white men, suggests that at least whiteomen were receiving care to manage their primary
ymptoms of diabetes that was similar to their whiteale counterparts. Notwithstanding this small im-
rovement, the significantly pronounced gender andacial disparities in LDL control suggest missed op-ortunities for managing CVD risk. Given that the ratef LDL control is modest even for white men, the goalhould not be just to reduce gaps between men andomen, but to increase the rate of all members ineeting this important quality indicator and at the
ame time striving to reduce the disparities betweenen and women and those between African Ameri-
ans and whites.Reducing the racial and gender gaps we observed in
his study will require a multifaceted approach. First,s mentioned previously, the overall low LDL controlates observed among the four subgroups in ourample demonstrate the need to improve care for all,hich may in turn ameliorate the gender and racial
aps. It is important to work with health care provid-rs, managed care organizations, and purchasers totrengthen efforts to monitor progress in this area.his includes educating the health care communitybout these disparities and their implications for out-omes in populations as well as updating a nationalatabase that includes member level information onace, gender and health indicators. Data with gendernd race/ethnicity information allow for measure-ent to assess the effectiveness of interventions in
educing disparities. Second, additional studies areeeded to identify and evaluate causes that wouldxplain these differences at the various levels of theealth care system. We need to identify also interven-
ions that can be most effectively implemented bylinical practices, health care organizations, other en-ities, such as CMS, or in coordination with localesources, such as community centers. Finally, ‘closinghe quality gap’ in health care disparities shouldnclude educating patients to seek health care that willelp them manage their chronic conditions and avoidomplications. In particular, educational efforts tolert women about CVD risk and to engage in treat-ent and those targeting African American men to
ocus on HbA1c control and other risks for diabeticomplications are urgently needed. Collaborationmong consumers, health plans, providers, and, com-unity organizations is essential in moving towards
chieving the goals of Healthy People 2010 (CDC,001), “to eliminate health disparities among seg-ents of the population, including differences that
ccur by gender, race or ethnicity.”
cknowledgementshis work was supported by a grant from The California
ndowment (TCE Grant No. 20032907). We thank the Cen-ers for Medicare and Medicaid Services for sharing theirata and Richard Mierzejewski at the National Committee
or Quality Assurance for his assistance with data manage-ent and cleaning. We would like to acknowledge Edward
randt, MD, PhD, and the three anonymous reviewers forheir helpful review.
eferencesiabetes and Women’s Health Across the Life Stages: A PublicHealth Perspective (2001). Centers for Disease Control and Pre-vention.
HRQ (2004). National Healthcare Disparities Report.onds, D. E., Zaccaro, D. J., Karter, A. J., Selby, J. V., Saad, M., &
Goff, D. C., Jr.(2003). Ethnic and racial differences in diabetescare: The Insulin Resistance Atherosclerosis Study. Diabetes Care,26, 1040–1046.
orrea-de-Araujo, R. & Clancy, C. M. (2006) Catalyzing quality ofcare improvements for women. Women’s Health Issues, 16, 41–43.
orrea-de-Araujo, R., McDermott, K., & Moy, E. (2006). Genderdifferences across racial and ethnic groups in the quality of carefor diabetes. Women’s Health Issues, 16, 56–65.
owie, C. C., Harris, M. I., Silverman, R. E., Johnson, E. W., & Rust,K. F. (1993). Effect of multiple risk factors on differences betweenblacks and whites in the prevalence of non-insulin-dependentdiabetes mellitus in the United States. American Journal of Epide-miology, 137, 719–732.
owie, C. C., Port, F. K., Rust, K. F., & Harris, M. I. (1994).Differences in survival between black and white patients withdiabetic end-stage renal disease. Diabetes Care, 17, 681–687.
owie, C. C., Port, F. K., Wolfe, R. A., Savage, P. J., Moll, P. P., &Hawthorne, V. M. (1989). Disparities in incidence of diabeticend-stage renal disease according to race and type of diabetes.New England Journal of Medicine, 321, 1074–1079.
e Rekeneire, N., Rooks, R. N., Simonsick, E. M., Shorr, R. I., Kuller,L. H., Schwartz, A. V. et al. (2003). Racial differences in glycemiccontrol in a well-functioning older diabetic population: findingsfrom the Health, Aging and Body Composition Study. DiabetesCare, 26, 1986–1992.
scarce, J. J. & McGuire, T. G. (2003). Methods for using Medicaredata to compare procedure rates among Asians, blacks, Hispan-ics, Native Americans, and whites. Health Services Research, 38,1303–1317.
arris, E. L., Sherman, S. H., & Georgopoulos, A. (1999). Black-white differences in risk of developing retinopathy among indi-viduals with type 2 diabetes. Diabetes Care, 22, 779–783.
arris, M. I. (2002). Effect of private health insurance on health careaccess and health status of diabetic patients covered by Medicare.Diabetes Care, 25, 405–406.
arris, M. I. (1999). Racial and ethnic differences in health insurancecoverage for adults with diabetes. Diabetes Care, 22, 1679–1682.
arris, M. I., Eastman, R. C., Cowie, C. C., Flegal, K. M., &Eberhardt, M. S. (1999). Racial and ethnic differences in glycemiccontrol of adults with type 2 diabetes. Diabetes Care, 22, 403–408.
nstitute of Medicine (2003). Unequal Treatment: Confronting Racialand Ethnic Disparities in Healthcare. Washington DC: NationalAcademies Press.
encks, S. F., Cuerdon, T., Burwen, D. R., Fleming, B., Houck, P. M.,Kussmaul, A. E. et al. (2000). Quality of medical care delivered toMedicare beneficiaries: A profile at state and national levels.Journal of American Medical Association, 284, 1670–1676.
ha, A. K., Perlin, J. B., Steinman, M. A., Peabody, J. W., & Ayanian,J. Z. (2005). Quality of ambulatory care for women and men in theVeterans Affairs Health Care System. Journal of General InternalMedicine, 20, 762–765.
ha, A. K., Varosy, P. D., Kanaya, A. M., Hunninghake, D. B., Hlatky,
M. A., Waters, D. D. et al. (2003). Differences in medical care and
J
K
K
K
L
M
M
M
NR
R
R
S
S
S
S
S
T
T
V
Y
A
iiHsm
iHnwc
DJHR
ttrosr
dHssq
Vfhf
A. F. Chou, et al. / Women’s Health Issues 17 (2007) 150–161 161
disease outcomes among black and white women with heartdisease. Circulation, 108, 1089–1094.
uutilainen, A., Kortelainen, S., Lehto, S., Ronnemaa, T., Pyorala, K., &Laakso, M. (2004). Gender difference in the impact of type 2 diabeteson coronary heart disease risk. Diabetes Care, 27, 2898–2904.
arter, A. J., Ferrara, A., Liu, J. Y., Moffet, H. H., Ackerson, L. M., &Selby, J. V. (2002). Ethnic disparities in diabetic complications inan insured population. Journal of American Medical Association,287, 2519–2527.
err, E. A., Smith, D. M., Hogan, M. M., Hofer, T. P., Krein, S. L.,Bermann, M. et al. (2003). Building a better quality measure: aresome patients with ’poor quality’ actually getting good care?Medical Care, 41, 1173–1182.
umholz, H. M., Normand, S. T., Spertus, J. A., Shahian, D. M., &Bradley, E. H. (2007). Measuring performance for treating heartattacks and heart failure: The case for outcomes measurement.Health Affairs, 26, 75–85.
avery, L. A., van Houtum, W. H., Ashry, H. R., Armstrong, D. G.,& Pugh, J. A. (1999). Diabetes-related lower-extremity amputa-tions disproportionately affect Blacks and Mexican Americans.Southern Medical Journal, 92, 593–599.
cCormick, D., Himmelstein, D. U., Woolhandler, S., Wolfe, S. M.,& Bor, D. H. (2002). Relationship between low quality-of-carescores and HMOs’ subsequent public disclosure of quality-of-care scores. Journal of American Medical Association, 288, 1484–1490.
cFarlane, S. I. & Sowers, J. R. (2005). Gender disparities in thecontrol of cardiovascular risk factors in people with diabetes.Journal of Clinical Hypertension (Greenwich.), 7, 383–385.
cGlynn, E. A., Asch, S. M., Adams, J., Keesey, J., Hicks, J.,DeCristofaro, A. et al. (2003). The quality of health care deliveredto adults in the United States. New England Journal of Medicine,348, 2635–2645.
CQA (2004). HEDIS 2004: Technical Specifications.audenbush, S. & Bryk, A. (2002). Hierarchical Linear Models: Appli-
cations and Data Analysis Methods. Thousand Oaks, CA: SagePublications.
audenbush, S., Bryk, A., Cheong, Y., & Congdon, R. (2004). HLM 6:Hierarchical Linear and Nonlinear Modeling. Lincolnwood, IL: Sci-entific Software International.
ostand, S. G., Kirk, K. A., Rutsky, E. A., & Pate, B. A. (1982). Racialdifferences in the incidence of treatment for end-stage renaldisease. New England Journal of Medicine, 306, 1276–1279.
aaddine, J. B., Engelgau, M. M., Beckles, G. L., Gregg, E. W.,Thompson, T. J., & Narayan, K. M. (2002). A diabetes report cardfor the United States: quality of care in the 1990s. Annals ofInternal Medicine, 136, 565–574.
aydah, S. H., Fradkin, J., & Cowie, C. C. (2004). Poor control of riskfactors for vascular disease among adults with previously diag-nosed diabetes. Journal of American Medical Association, 291,335–342.
chneider, E. C., Leape, L. L., Weissman, J. S., Piana, R. N., Gatsonis,C., & Epstein, A. M. (2001). Racial differences in cardiac revas-cularization rates: does “overuse” explain higher rates amongwhite patients? Annals of Internal Medicine, 135, 328–337.
chulman, K. A., Berlin, J. A., Harless, W., Kerner, J. F., Sistrunk, S.,Gersh, B. J. et al. (1999). The effect of race and sex on physicians’recommendations for cardiac catheterization. New England Jour-nal of Medicine, 340, 618–626.
owers, J. R. (2004). Diabetes in the elderly and in women: cardio-
vascular risks. Cardiology Clinic, 22, 541–51, vi.d
rivedi, A. N., Zaslavsky, A. M., Schneider, E. C., & Ayanian, J. Z.(2005). Trends in the quality of care and racial disparities inMedicare managed care. New England Journal of Medicine, 353,692–700.
seng, C. L., Sambamoorthi, U., Rajan, M., Tiwari, A., Frayne, S.,Findley, P. et al. (2006). Are there gender differences in diabetescare among elderly Medicare enrolled veterans? Journal of GeneralInternal Medicine, 21 Suppl 3, S47–S53.
irnig, B. A., Lurie, N., Huang, Z., Musgrave, D., McBean, A. M., &Dowd, B. (2002). Racial variation in quality of care amongMedicare�Choice enrollees. Health Affairs (Millwood.), 21, 224–230.
oung, B. A., Maynard, C., Reiber, G., & Boyko, E. J. (2003). Effectsof ethnicity and nephropathy on lower-extremity amputationrisk among diabetic veterans. Diabetes Care, 26, 495–501.
uthor Descriptions
Ann F. Chou, PhD, MPH, is an Assistant Professorn the Department of Health Administration and Pol-cy at the University of Oklahoma College of Public
ealth and College of Medicine. She is a healthervices researcher whose interests focus on imple-entation of best practices and quality of care.Arleen F. Brown, MD, PhD, is an Assistant Professor
n the Division of General Internal Medicine andealth Services Research at the University of Califor-ia, Los Angeles. She is a health services researcherith an interest in health disparities and quality of
are for older adults with diabetes.Roxanne E. Jensen is a doctoral student in theepartment of Health Policy & Management at the
ohns Hopkins Bloomberg School of Public Health.er concentration is in Health Services and Outcomesesearch.Sarah Shih, MPH, is a Senior Health Care Analyst in
he Department of Research and Analysis at the Na-ional Committee for Quality Assurance. Ms. Shih isesponsible for the management and implementationf funded health services research projects. She alsoupports NCQA’s development and maintenance ofesearch collaborations.
Greg Pawlson, MD, MPH, is Executive Vice Presi-ent of NCQA and Clinical Professor of Medicine andealth Care Sciences at George Washington Univer-
ity. He has been involved in a broad range of healthervices research and policy related to health careuality and the care of older persons.Sarah Hudson Scholle, MPH, DrPH, is Assistant
ice President for Research at the National Committeeor Quality Assurance in Washington, DC. She is aealth services researcher, and her current researchocuses on quality measurement, women’s health, and
isparities.