gender and the legume alliance - cabi.org
TRANSCRIPT
Gender and the Legume Alliance
Deliverable 2.3: Intra-household household
survey in Ghana
November 2017
Prepared by on behalf of SAIRLA:
Monica K. Kansiime1*, Martin Macharia1, Paul Adraki2, Francis Obeng2 1CAB International (CABI), Nairobi, Kenya 2University of Development Studies (UDS), Tamale Ghana *Correspondence: [email protected]
2
Contents
Acronyms 3
Executive Summary 4
1 Introduction 5
1.1 Background to the study 5
1.2 Gender and Legume Alliance 5
2 Methods 6
2.1 Study design 6
2.2 Study area and sampling procedure 6
2.3 Data collection and analysis 7
3 Results 7
3.1 Descriptive characteristics 7
3.2 Sources of agricultural information 8
3.2.1 Major sources of agricultural information 8
3.2.2 Ranking information sources 10
3.2.3 Agricultural information sources by crop 11
3.2.4 Awareness of Agricultural practices 12
3.2.5 Information sharing within the household 14
3.4 Soybean current information sources and practices 17
3.4.1 Sources of information on soybean 17
3.4.2 Awareness of soybean practices 19
3.4.3 Soybean practices applied by farmers 20
4 Insights from the study 21
Acknowledgements 23
References 24
3
Acronyms
Acronym
ASHC Africa Soil Health Consortium
FFF Farmer Field Forum
FFS Farmer Field School
GALA Gender and the Legume Alliance
HH Household
NGO Non-Governmental Organisation
ODK Open Data Kit
QDS Quality Declared Seed
PIC Purdue Improved Crop Storage
SAI Sustainable Agricultural Intensification
SAIRLA Sustainable Agricultural Intensification Research and Learning in Africa
TLU Total Livestock Units
4
Executive Summary This study analyses farmers’ access to information on agriculture in general and soybean in particular. This is aimed to contribute to understanding the extent of awareness of sustainable agricultural intensification (SAI) practices to inform appropriate policy interventions, as well as serving as a baseline for the SAIRLA/GALA soybean campaign in Ghana. The analysis interrogates information sharing at household level, farmer practices and their motivations.
Data were collected from 300 households (and 868 respondents) in 5 districts in Northern Ghana. An intra-household approach was used where up to 4 members, aged 18 years and above per household were interviewed. Intra-household assessment aimed to understand information flow and decision making within the household related to legume and SAI technologies.
Results show that farmers had access to various information sources, though they mainly relied on neighbours and relatives (52%) and own experience (49%). There were significant differences (p<0.01) between men’s and women’s access to information from various sources. Women were more likely to seek information from other household members and agro-dealers than men, while men were more likely to seek information from extension workers, radio and demonstration plots than women.
Information received from different information sources tended to be similar, prioritising maize, soybean, other cereal crops and oil crops. In terms of technologies, the focus was on traditional farming practices, such as timing of field operations, and good agricultural practices. These practices, despite being the mostly shared even from external sources, may reflect farmers’ inherent knowledge and adjustments they make over time to respond to changing environmental conditions. This is in comparison to relatively new practices, such as rhizobium inoculants and PICS storage bags, that farmers indicated to have learned mainly from external sources such as extension, radio and demonstration plots.
A greater proportion of farmers (63%) shared information with others, reaching on average four other people. Comparatively more men than women shared agricultural information, while older persons (36 years and above) were more likely to share information compared to younger persons. For men, this could be attributed to their ability to access external sources of information gained on behalf of the household, while for older people, this could be as a result of experience they have and their position as opinion leaders.
These results have the following implications: i) there is still margin for improving learning of more recently introduced practices, so it is important to link promotion with targeted information sources; ii) targeting women and older people with channels that are farm-based, such as extension visits and on-farm demonstrations, may enhance their access to information; iii) need to focus on complementary role of legumes in production of key staples in the region, such as cassava, in efforts to promote SAI; and iv) given the observed dynamics of intra-household information sharing, targeting information to various gender and age categories provides an opportunity to ensure information can effectively reach different household members.
5
1 Introduction
1.1 Background to the study
In Ghana legumes – cowpea, groundnut and soybean - are important as both food staples and commercial crops. Legume value chains therefore impact significantly on food security and household income (Rusike et al. 2013). Soybean, in particular, has become one of the most important commodities and its production has been promoted by the Ministry of Food and Agriculture to increase cash income and improve the nutritional status of rural households.
However, as yet there has been little increase in soybean cultivation. Its production has also been erratic. This is attributed to various factors but mainly the lack of improved production technologies and poorly organised processing and marketing channels which has affected expected incomes from its production (Mbanya 2011). Small-scale farmers use basic technologies without mechanization, mostly use recycled seed and apply insufficient fertilizers and agrochemicals. In addition, there is a lack of effective government extension services. Where extension workers exist, they are inadequate in providing knowledge on production technologies, especially to women farmers (Rusike et al. 2013). Moreover, getting research information into a format that is of practical use to small-scale farmers also remains problematic (Sones et al. 2015), not only in Ghana but Africa in general.
In order to enhance the efficiency of legume value chains and encourage their integration into farming systems, it is important to understand: current farmer knowledge and practices in legume production, information flows through the legume value chain, and how information flow could be changed to facilitate: a) input supply from private sector parties, b) farmers in adopting productivity enhancing practices, and c) farmer access to output markets. It is also important to understand which communication channels are more suited for different gender groups.
This study focuses on understanding knowledge and information flows within small-scale farming households in Northern Ghana to better understand: 1. The role of different legume value chain actors and intermediaries in delivering information to
famers. 2. Which communication channels are more suited for different gender groups (men, women and
youth). 3. How information flows within households vis à vis gender and SAI legume practices. 4. How information flow facilitates farmers in adopting productivity enhancing legume practices The results will enable public, private and NGO sectors to engage with men, women and youth based on evidence on which communication channels work. They will also indicate where support is required to strengthen legume value chains in Ghana. This will enable small-scale farmers, particularly women and youth, to profit from legume technologies that allow intensification without further land degradation.
1.2 Gender and Legume Alliance
The Gender and Legume Alliance (GALA) project, funded by the UK Department of International Development, seeks to address the current opportunities for improving access to and capacity to use information and knowledge by poor small-scale farmers to achieve sustainable intensification in legume production in Tanzania and Ghana. The project is developed under the umbrella of the Sustainable Agricultural Intensification Research and Learning in Africa (SAIRLA) programme that seeks to generate new evidence and design tools to enable governments, investors and other key actors to deliver more effective policies and investments in SAI that strengthen the capacity of poorer farmers, especially women and youth, to access and benefit from SAI. In this context youth means younger farmers under the age of 35.
6
The GALA project is led by CAB International (CABI) in collaboration with the International Institute of Tropical Agriculture (IITA), Sokoine University of Agriculture and the University of Development Studies in Tamale, Ghana. The project leverages existing partnerships in the Legume Alliance supported by the Bill & Melinda Gates Foundation (B&MGF) funded project Africa Soil Health Consortium (ASHC) and the IDRC funded Scaling-up Improved Legume Technologies in Tanzania. GALA also works in close collaboration with N2Africa and local partners, especially the national agricultural research systems (NARS). The Legume Alliance promotes improved legume varieties combined with inputs of phosphorus (P) fertilizer, and in the case of soybean, inoculant, along with good agricultural practices. These are promoted through campaigns that combine media (film, radio, print, SMS, social media) and different interpersonal approaches (farmer training days, radio listening groups). In Ghana, GALA has undertaken campaigns on soybean intensification using diverse approaches: extension meetings, video, leaflets and demonstration plots. Central to the campaign have been video screenings which have proved effective in reaching women, men and youth farmers. The campaigns has been concentrated in the Northern Region of Ghana, considering this is the area where about 80% of legumes are grown and where most of value chain initiatives partnering with N2Africa are located. This study partly serves as a baseline to the campaign against which change in farmers’ practices and production will be measured.
2 Methods
2.1 Study design
An intra-household survey approach was used for the study. Intra-household analysis aims to understand household dynamics in receipt, sharing and application of information from various sources. The primary respondent in the survey was the household head or their spouse, considered the key decision makers for the household. The survey also interviewed up to three additional members of the household (only those above 18 years). Care was taken to ensure representation of different age categories and gender within the household, where possible. It was anticipated that different household members interact with different information sources, but intra-household information sharing is possible. In this case, household members could still be reached with information even if they were not directly targeted by a specific information source. Besides, decision making at household level and power relations may affect access to and utilisation of information, necessitating a clear understanding of intra-household dynamics vis à vis information access and sharing.
2.2 Study area and sampling procedure
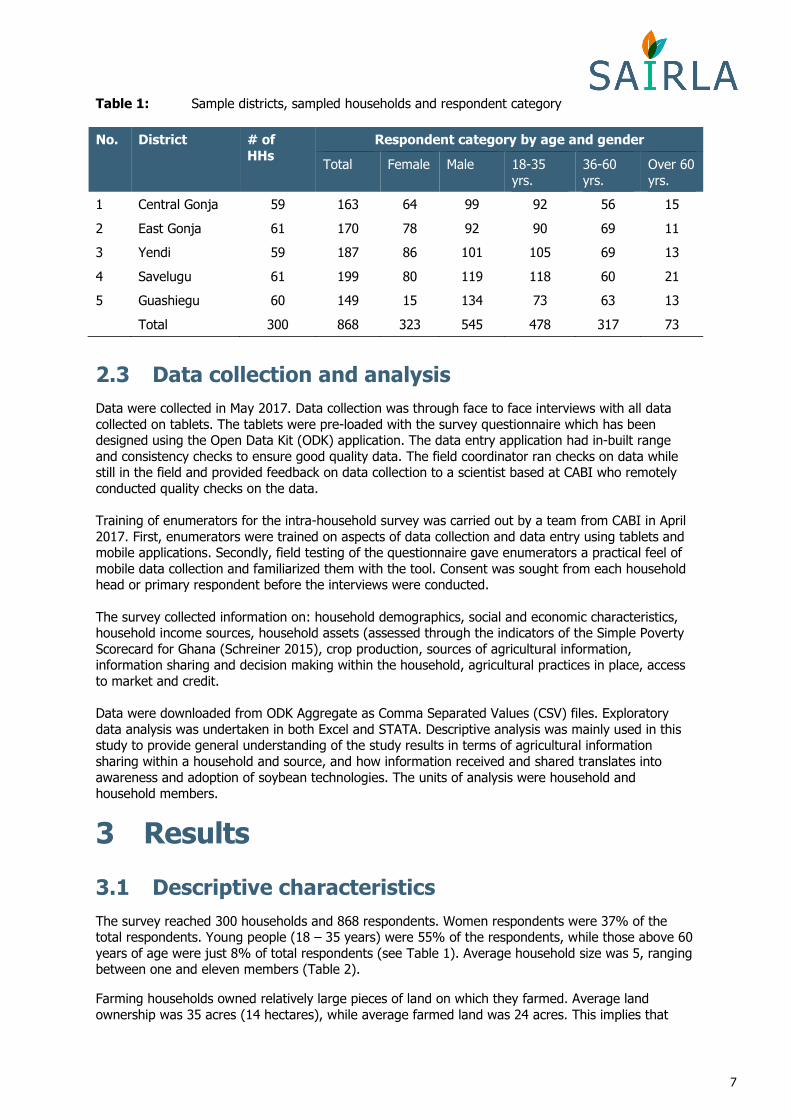
The study was undertaken in the Northern Region of Ghana covering five districts. Districts were selected based on areas where soybean growing is common. While this study aimed to understand information access and flow, it also serves as a baseline for the soybean campaign. As such, selected districts and communities were those that had been targeted by the GALA soybean campaign. The selection also took into consideration areas where parallel or complementary initiatives were taking place. Some of the initiatives included: Scaling Seed Technology Partnership (SSTP), Agriculture Technology Transfer (ATT), AgDevCo Ghana Limited, Youth Advocacy on Rights and Opportunities (YARO), and Soybean Innovation Lab (SIL). A total of 300 households (868 respondents) were interviewed in the five districts (Table 1). The targeted crop was soybean.
7
Table 1: Sample districts, sampled households and respondent category
No. District # of
HHs
Respondent category by age and gender
Total Female Male 18-35 yrs.
36-60 yrs.
Over 60 yrs.
1 Central Gonja 59 163 64 99 92 56 15
2 East Gonja 61 170 78 92 90 69 11
3 Yendi 59 187 86 101 105 69 13
4 Savelugu 61 199 80 119 118 60 21
5 Guashiegu 60 149 15 134 73 63 13
Total 300 868 323 545 478 317 73
2.3 Data collection and analysis
Data were collected in May 2017. Data collection was through face to face interviews with all data collected on tablets. The tablets were pre-loaded with the survey questionnaire which has been designed using the Open Data Kit (ODK) application. The data entry application had in-built range and consistency checks to ensure good quality data. The field coordinator ran checks on data while still in the field and provided feedback on data collection to a scientist based at CABI who remotely conducted quality checks on the data. Training of enumerators for the intra-household survey was carried out by a team from CABI in April 2017. First, enumerators were trained on aspects of data collection and data entry using tablets and mobile applications. Secondly, field testing of the questionnaire gave enumerators a practical feel of mobile data collection and familiarized them with the tool. Consent was sought from each household head or primary respondent before the interviews were conducted. The survey collected information on: household demographics, social and economic characteristics, household income sources, household assets (assessed through the indicators of the Simple Poverty Scorecard for Ghana (Schreiner 2015), crop production, sources of agricultural information, information sharing and decision making within the household, agricultural practices in place, access to market and credit. Data were downloaded from ODK Aggregate as Comma Separated Values (CSV) files. Exploratory data analysis was undertaken in both Excel and STATA. Descriptive analysis was mainly used in this study to provide general understanding of the study results in terms of agricultural information sharing within a household and source, and how information received and shared translates into awareness and adoption of soybean technologies. The units of analysis were household and household members.
3 Results
3.1 Descriptive characteristics
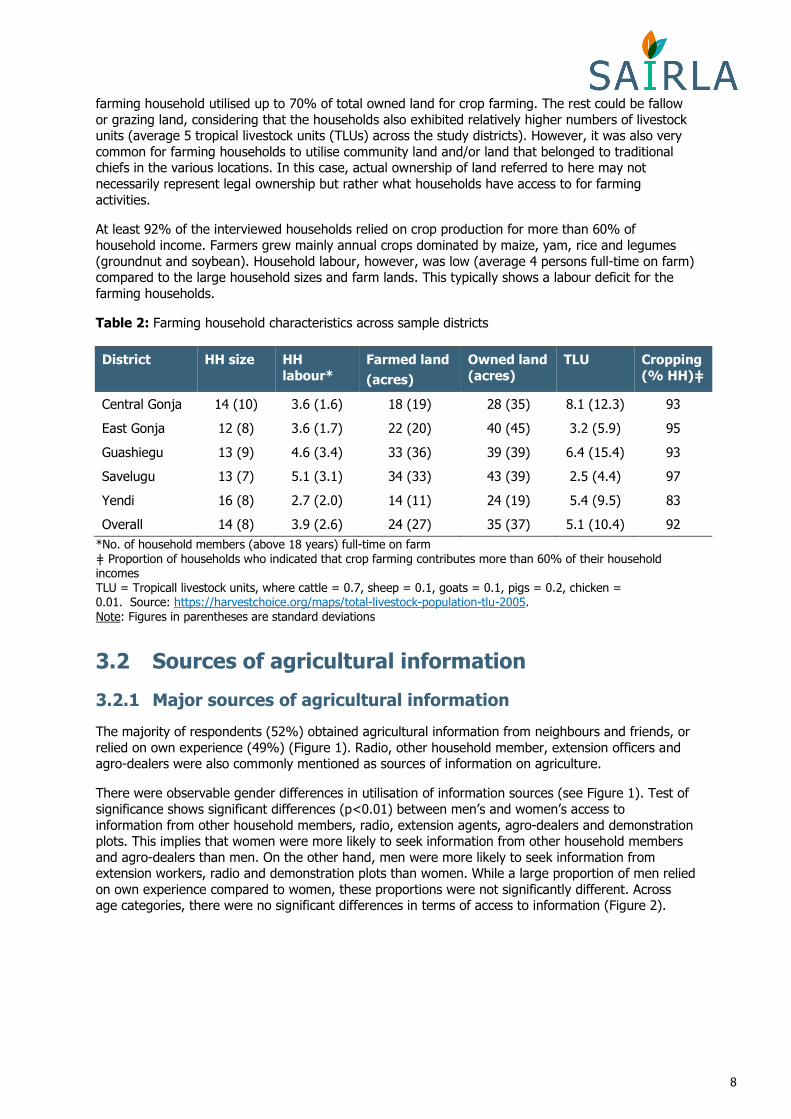
The survey reached 300 households and 868 respondents. Women respondents were 37% of the total respondents. Young people (18 – 35 years) were 55% of the respondents, while those above 60 years of age were just 8% of total respondents (see Table 1). Average household size was 5, ranging between one and eleven members (Table 2).
Farming households owned relatively large pieces of land on which they farmed. Average land ownership was 35 acres (14 hectares), while average farmed land was 24 acres. This implies that
8
farming household utilised up to 70% of total owned land for crop farming. The rest could be fallow or grazing land, considering that the households also exhibited relatively higher numbers of livestock units (average 5 tropical livestock units (TLUs) across the study districts). However, it was also very common for farming households to utilise community land and/or land that belonged to traditional chiefs in the various locations. In this case, actual ownership of land referred to here may not necessarily represent legal ownership but rather what households have access to for farming activities.
At least 92% of the interviewed households relied on crop production for more than 60% of household income. Farmers grew mainly annual crops dominated by maize, yam, rice and legumes (groundnut and soybean). Household labour, however, was low (average 4 persons full-time on farm) compared to the large household sizes and farm lands. This typically shows a labour deficit for the farming households.
Table 2: Farming household characteristics across sample districts
District HH size HH
labour*
Farmed land
(acres)
Owned land
(acres)
TLU Cropping
(% HH)ǂ
Central Gonja 14 (10) 3.6 (1.6) 18 (19) 28 (35) 8.1 (12.3) 93
East Gonja 12 (8) 3.6 (1.7) 22 (20) 40 (45) 3.2 (5.9) 95
Guashiegu 13 (9) 4.6 (3.4) 33 (36) 39 (39) 6.4 (15.4) 93
Savelugu 13 (7) 5.1 (3.1) 34 (33) 43 (39) 2.5 (4.4) 97
Yendi 16 (8) 2.7 (2.0) 14 (11) 24 (19) 5.4 (9.5) 83
Overall 14 (8) 3.9 (2.6) 24 (27) 35 (37) 5.1 (10.4) 92
*No. of household members (above 18 years) full-time on farm ǂ Proportion of households who indicated that crop farming contributes more than 60% of their household incomes TLU = Tropicall livestock units, where cattle = 0.7, sheep = 0.1, goats = 0.1, pigs = 0.2, chicken = 0.01. Source: https://harvestchoice.org/maps/total-livestock-population-tlu-2005. Note: Figures in parentheses are standard deviations
3.2 Sources of agricultural information
3.2.1 Major sources of agricultural information
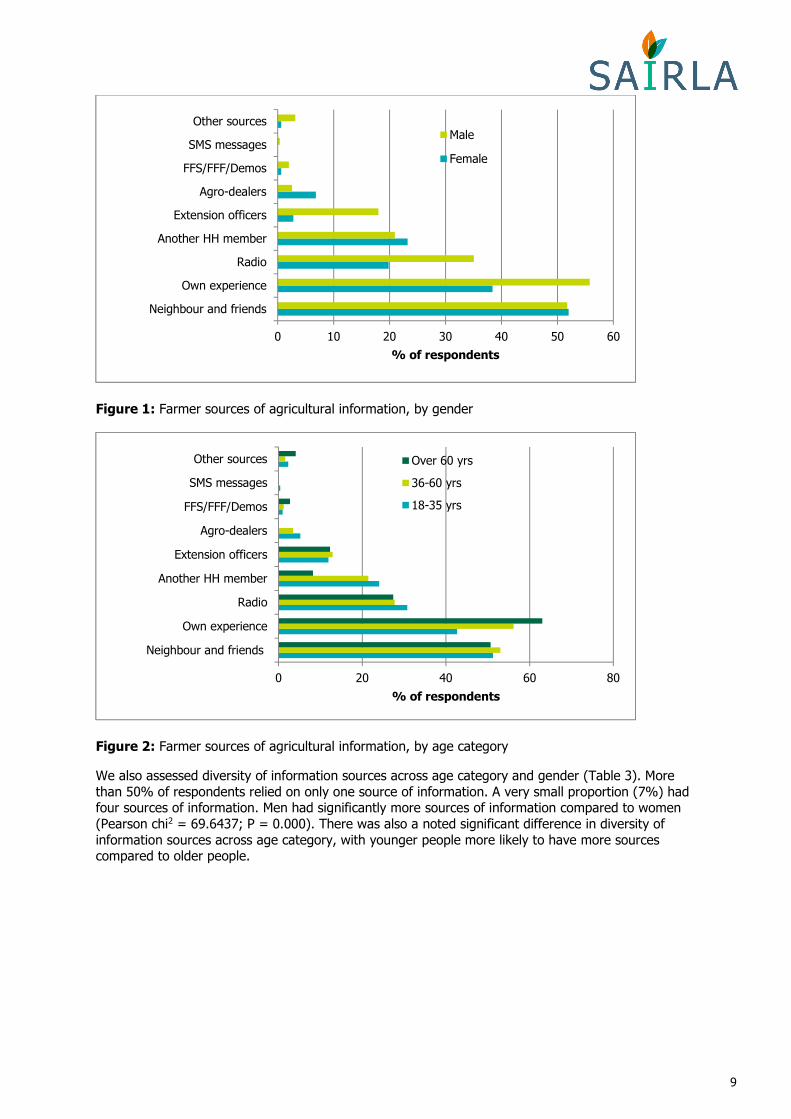
The majority of respondents (52%) obtained agricultural information from neighbours and friends, or relied on own experience (49%) (Figure 1). Radio, other household member, extension officers and agro-dealers were also commonly mentioned as sources of information on agriculture.
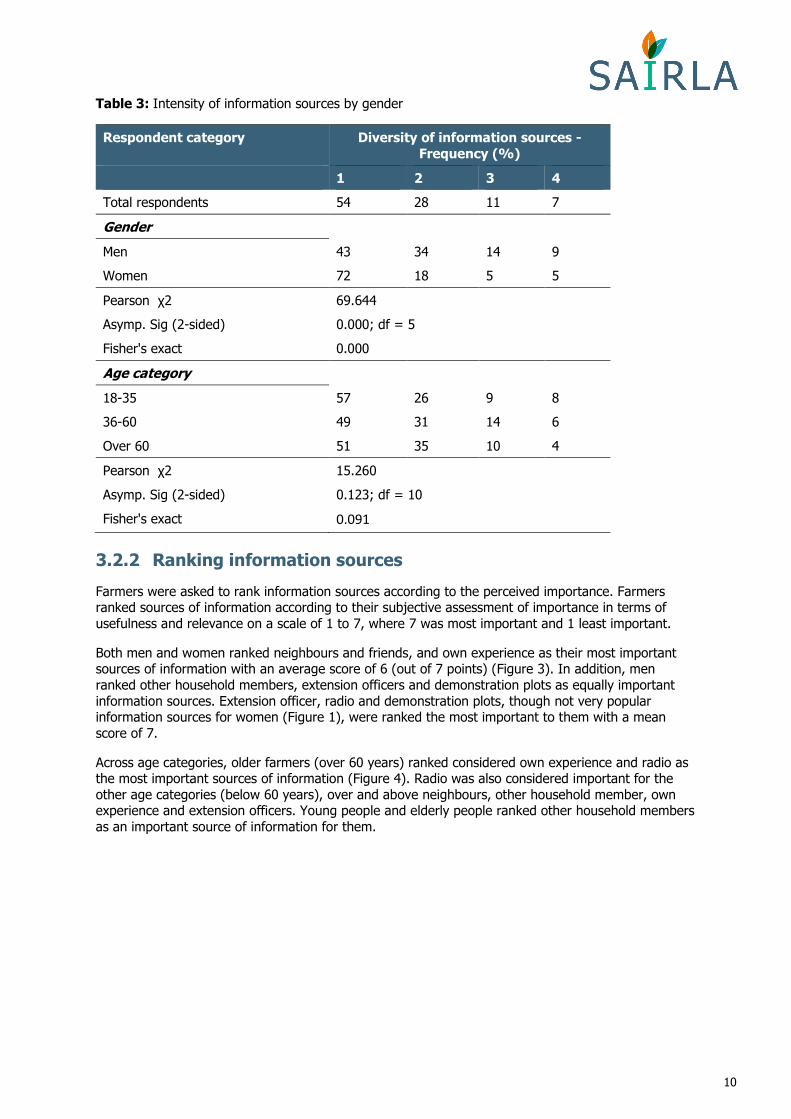
There were observable gender differences in utilisation of information sources (see Figure 1). Test of significance shows significant differences (p<0.01) between men’s and women’s access to information from other household members, radio, extension agents, agro-dealers and demonstration plots. This implies that women were more likely to seek information from other household members and agro-dealers than men. On the other hand, men were more likely to seek information from extension workers, radio and demonstration plots than women. While a large proportion of men relied on own experience compared to women, these proportions were not significantly different. Across age categories, there were no significant differences in terms of access to information (Figure 2).
9
Figure 1: Farmer sources of agricultural information, by gender
Figure 2: Farmer sources of agricultural information, by age category
We also assessed diversity of information sources across age category and gender (Table 3). More than 50% of respondents relied on only one source of information. A very small proportion (7%) had four sources of information. Men had significantly more sources of information compared to women (Pearson chi2 = 69.6437; P = 0.000). There was also a noted significant difference in diversity of information sources across age category, with younger people more likely to have more sources compared to older people.
0 10 20 30 40 50 60
Neighbour and friends
Own experience
Radio
Another HH member
Extension officers
Agro-dealers
FFS/FFF/Demos
SMS messages
Other sources
% of respondents
Male
Female
0 20 40 60 80
Neighbour and friends
Own experience
Radio
Another HH member
Extension officers
Agro-dealers
FFS/FFF/Demos
SMS messages
Other sources
% of respondents
Over 60 yrs
36-60 yrs
18-35 yrs
10
Table 3: Intensity of information sources by gender
Respondent category Diversity of information sources -
Frequency (%)
1 2 3 4
Total respondents 54 28 11 7
Gender
Men 43 34 14 9
Women 72 18 5 5
Pearson χ2 69.644
Asymp. Sig (2-sided) 0.000; df = 5
Fisher's exact 0.000
Age category
18-35 57 26 9 8
36-60 49 31 14 6
Over 60 51 35 10 4
Pearson χ2 15.260
Asymp. Sig (2-sided) 0.123; df = 10
Fisher's exact 0.091
3.2.2 Ranking information sources
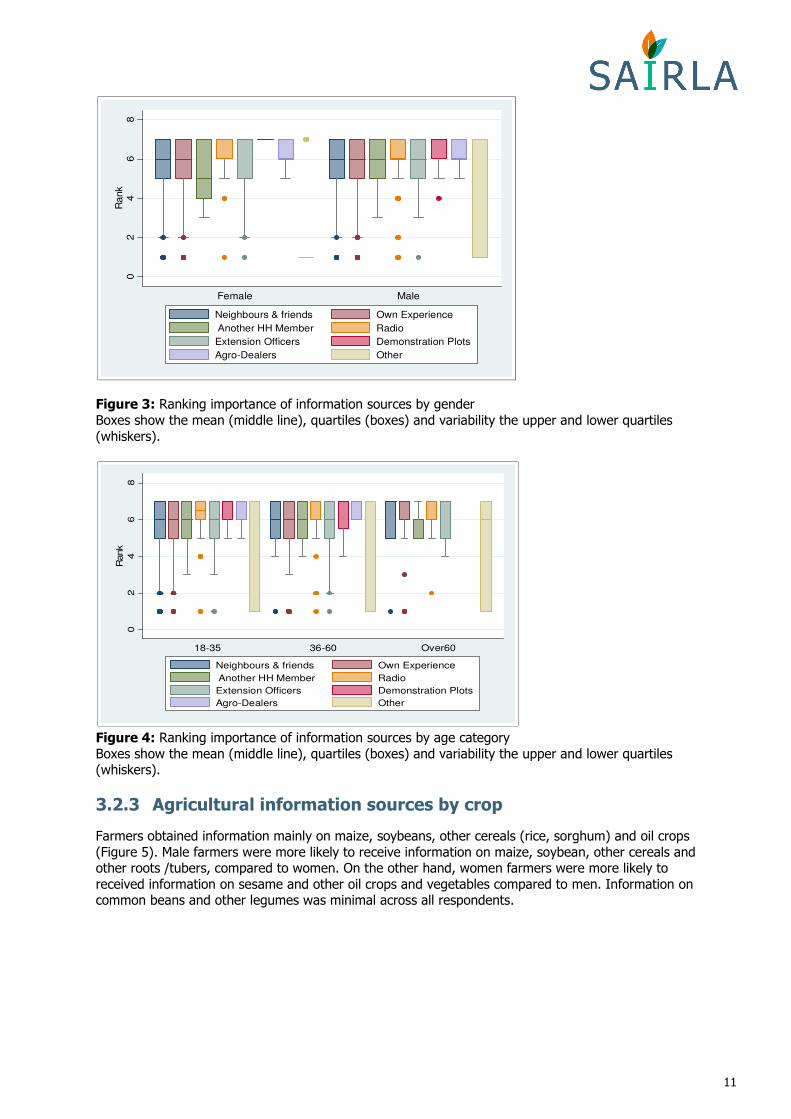
Farmers were asked to rank information sources according to the perceived importance. Farmers ranked sources of information according to their subjective assessment of importance in terms of usefulness and relevance on a scale of 1 to 7, where 7 was most important and 1 least important.
Both men and women ranked neighbours and friends, and own experience as their most important sources of information with an average score of 6 (out of 7 points) (Figure 3). In addition, men ranked other household members, extension officers and demonstration plots as equally important information sources. Extension officer, radio and demonstration plots, though not very popular information sources for women (Figure 1), were ranked the most important to them with a mean score of 7.
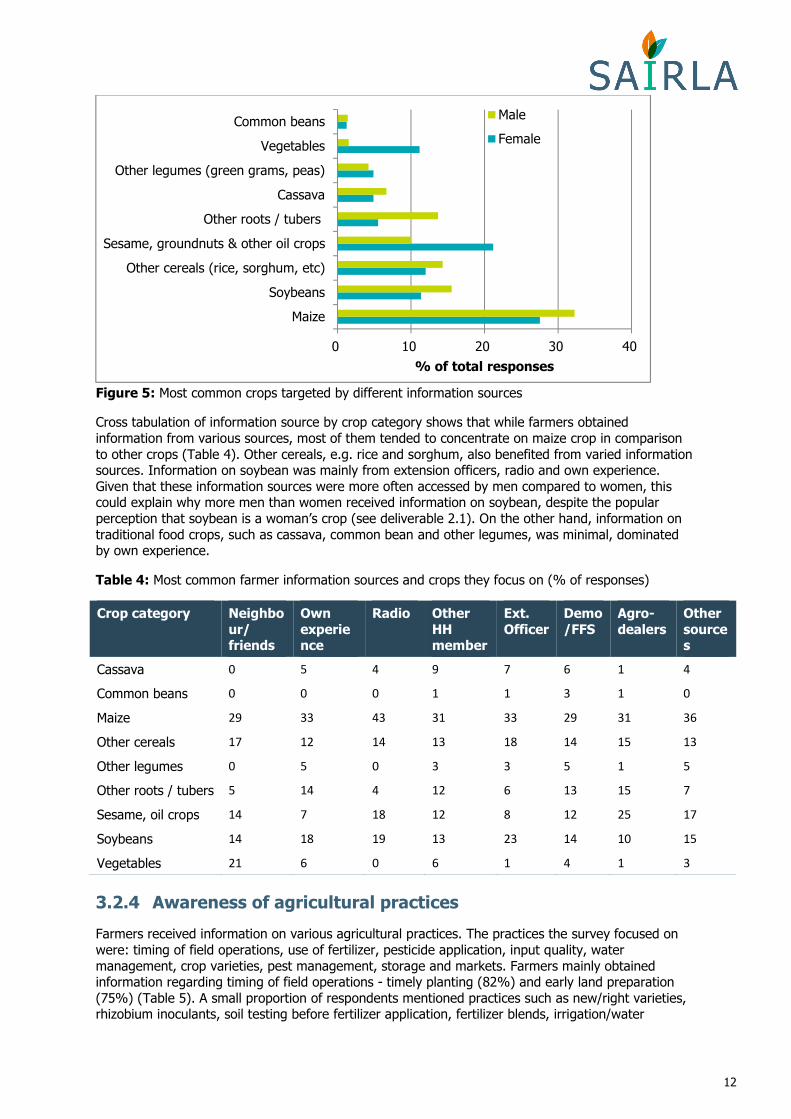
Across age categories, older farmers (over 60 years) ranked considered own experience and radio as the most important sources of information (Figure 4). Radio was also considered important for the other age categories (below 60 years), over and above neighbours, other household member, own experience and extension officers. Young people and elderly people ranked other household members as an important source of information for them.
11
Figure 3: Ranking importance of information sources by gender Boxes show the mean (middle line), quartiles (boxes) and variability the upper and lower quartiles (whiskers).
Figure 4: Ranking importance of information sources by age category Boxes show the mean (middle line), quartiles (boxes) and variability the upper and lower quartiles (whiskers).
3.2.3 Agricultural information sources by crop
Farmers obtained information mainly on maize, soybeans, other cereals (rice, sorghum) and oil crops (Figure 5). Male farmers were more likely to receive information on maize, soybean, other cereals and other roots /tubers, compared to women. On the other hand, women farmers were more likely to received information on sesame and other oil crops and vegetables compared to men. Information on common beans and other legumes was minimal across all respondents.
02
46
8R
ank
Female Male
Neighbours & friends Own Experience
Another HH Member Radio
Extension Officers Demonstration Plots
Agro-Dealers Other
02
46
8
Rank
18-35 36-60 Over60
Neighbours & friends Own Experience
Another HH Member Radio
Extension Officers Demonstration Plots
Agro-Dealers Other
12
Figure 5: Most common crops targeted by different information sources
Cross tabulation of information source by crop category shows that while farmers obtained information from various sources, most of them tended to concentrate on maize crop in comparison to other crops (Table 4). Other cereals, e.g. rice and sorghum, also benefited from varied information sources. Information on soybean was mainly from extension officers, radio and own experience. Given that these information sources were more often accessed by men compared to women, this could explain why more men than women received information on soybean, despite the popular perception that soybean is a woman’s crop (see deliverable 2.1). On the other hand, information on traditional food crops, such as cassava, common bean and other legumes, was minimal, dominated by own experience.
Table 4: Most common farmer information sources and crops they focus on (% of responses)
Crop category Neighbo
ur/ friends
Own
experience
Radio Other
HH member
Ext.
Officer
Demo
/FFS
Agro-
dealers
Other
sources
Cassava 0 5 4 9 7 6 1 4
Common beans 0 0 0 1 1 3 1 0
Maize 29 33 43 31 33 29 31 36
Other cereals 17 12 14 13 18 14 15 13
Other legumes 0 5 0 3 3 5 1 5
Other roots / tubers 5 14 4 12 6 13 15 7
Sesame, oil crops 14 7 18 12 8 12 25 17
Soybeans 14 18 19 13 23 14 10 15
Vegetables 21 6 0 6 1 4 1 3
3.2.4 Awareness of agricultural practices
Farmers received information on various agricultural practices. The practices the survey focused on were: timing of field operations, use of fertilizer, pesticide application, input quality, water management, crop varieties, pest management, storage and markets. Farmers mainly obtained information regarding timing of field operations - timely planting (82%) and early land preparation (75%) (Table 5). A small proportion of respondents mentioned practices such as new/right varieties, rhizobium inoculants, soil testing before fertilizer application, fertilizer blends, irrigation/water
0 10 20 30 40
Maize
Soybeans
Other cereals (rice, sorghum, etc)
Sesame, groundnuts & other oil crops
Other roots / tubers
Cassava
Other legumes (green grams, peas)
Vegetables
Common beans
% of total responses
Male
Female
13
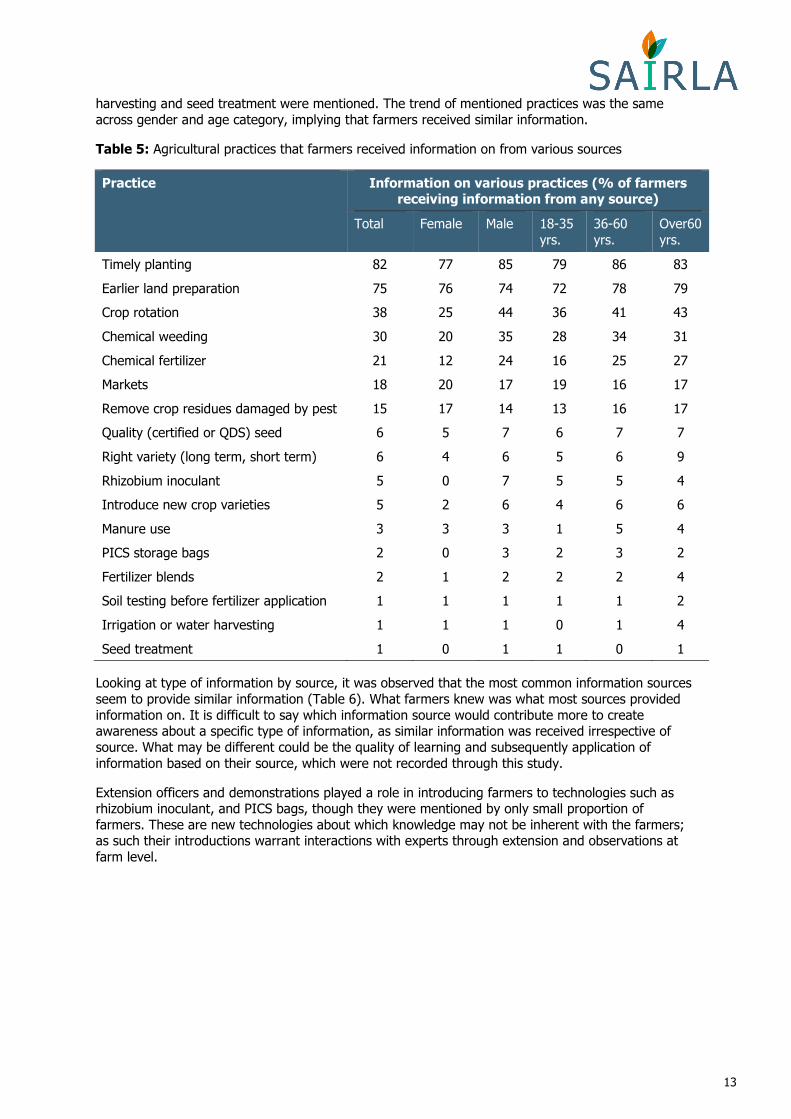
harvesting and seed treatment were mentioned. The trend of mentioned practices was the same across gender and age category, implying that farmers received similar information.
Table 5: Agricultural practices that farmers received information on from various sources
Practice Information on various practices (% of farmers receiving information from any source)
Total Female Male 18-35 yrs.
36-60 yrs.
Over60 yrs.
Timely planting 82 77 85 79 86 83
Earlier land preparation 75 76 74 72 78 79
Crop rotation 38 25 44 36 41 43
Chemical weeding 30 20 35 28 34 31
Chemical fertilizer 21 12 24 16 25 27
Markets 18 20 17 19 16 17
Remove crop residues damaged by pest 15 17 14 13 16 17
Quality (certified or QDS) seed 6 5 7 6 7 7
Right variety (long term, short term) 6 4 6 5 6 9
Rhizobium inoculant 5 0 7 5 5 4
Introduce new crop varieties 5 2 6 4 6 6
Manure use 3 3 3 1 5 4
PICS storage bags 2 0 3 2 3 2
Fertilizer blends 2 1 2 2 2 4
Soil testing before fertilizer application 1 1 1 1 1 2
Irrigation or water harvesting 1 1 1 0 1 4
Seed treatment 1 0 1 1 0 1
Looking at type of information by source, it was observed that the most common information sources seem to provide similar information (Table 6). What farmers knew was what most sources provided information on. It is difficult to say which information source would contribute more to create awareness about a specific type of information, as similar information was received irrespective of source. What may be different could be the quality of learning and subsequently application of information based on their source, which were not recorded through this study.
Extension officers and demonstrations played a role in introducing farmers to technologies such as rhizobium inoculant, and PICS bags, though they were mentioned by only small proportion of farmers. These are new technologies about which knowledge may not be inherent with the farmers; as such their introductions warrant interactions with experts through extension and observations at farm level.

14
Table 6: Agricultural practices learned through various information sources (as a proportion of farmers accessing information from the respective source)
Row Labels Own experie
nce
Neighbours &
friends
Radio Ext. officer
Other HH
member
Agro-dealers
FFS / FFF /
Demo
Timely planting 85 80 87 85 82 47 79
Earlier land preparation 79 84 70 68 55 47 57
Crop rotation 45 46 23 43 27 17 14
Chemical weeding 37 30 29 44 25 3 21
Chemical fertilizer 18 22 24 31 18 14 29
Markets 14 24 22 15 8 6 29
Remove crop residues damaged by pests
24 17 9 12 4 0 0
Quality (certified or QDS) seed
4 12 5 10 0 0 0
Right variety (long / short term)
5 8 6 7 4 0 0
Rhizobium inoculant 4 3 5 21 1 0 29
Introduce new crop varieties 3 5 10 7 3 0 0
Manure use 3 3 1 3 0 0 14
PIC bags for storage 2 2 1 11 1 0 14
Fertilizer blends 2 2 2 5 0 3 0
Soil testing before fertilizer application
1 0 2 2 1 0 0
Irrigation or water harvesting
1 0 0 1 1 0 7
Seed treatment with recommended pesticides
0 0 0 2 1 0 0
3.2.5 Information sharing within the household
Respondents were asked if they shared any of the agricultural information they received with others. At least 63% of the respondents indicated that they shared information with others (Table 7). Comparatively more men than women shared agricultural information with others, while older persons were more likely to share information compared to younger persons. This may possibly be the reason why these categories of farmers – male farmers and older farmers – relied more on own experience and information sharing across their networks in the community.
When asked with whom information is shared, a greater proportion (75%) mentioned ‘other household members’ followed by ‘neighbours’ (30%) (Table 8). This cut across age and gender categories, as mostly information was shared within the household. On average, recipients of agricultural information engaged about four other members within their households. Older household members and men engaged more members compared to women and younger persons in the household.
While other household members were not considered important sources of information, the obvious information sharing at household level makes them an important target for promoting innovations at household level. Men and older family members have a higher likelihood of sharing information at
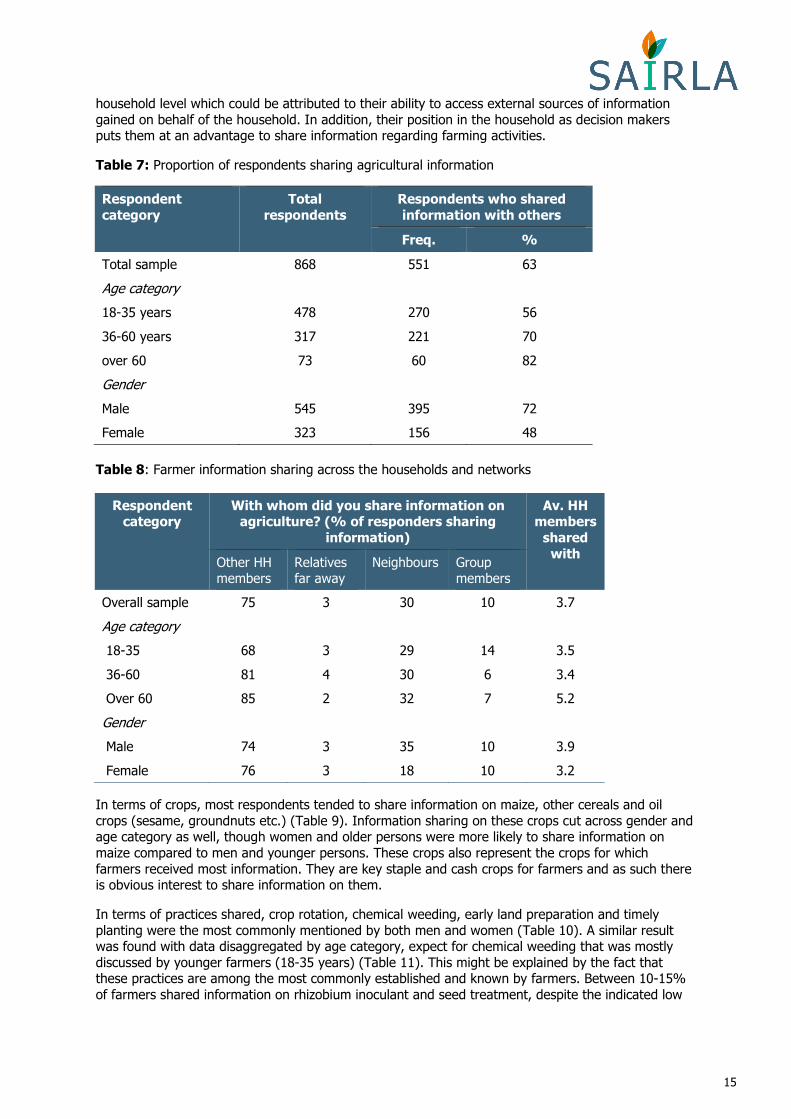
15
household level which could be attributed to their ability to access external sources of information gained on behalf of the household. In addition, their position in the household as decision makers puts them at an advantage to share information regarding farming activities.
Table 7: Proportion of respondents sharing agricultural information
Respondent
category
Total
respondents
Respondents who shared
information with others
Freq. %
Total sample 868 551 63
Age category
18-35 years 478 270 56
36-60 years 317 221 70
over 60 73 60 82
Gender
Male 545 395 72
Female 323 156 48
Table 8: Farmer information sharing across the households and networks
Respondent category
With whom did you share information on agriculture? (% of responders sharing
information)
Av. HH members
shared
with Other HH members
Relatives far away
Neighbours Group members
Overall sample 75 3 30 10 3.7
Age category
18-35 68 3 29 14 3.5
36-60 81 4 30 6 3.4
Over 60 85 2 32 7 5.2
Gender
Male 74 3 35 10 3.9
Female 76 3 18 10 3.2
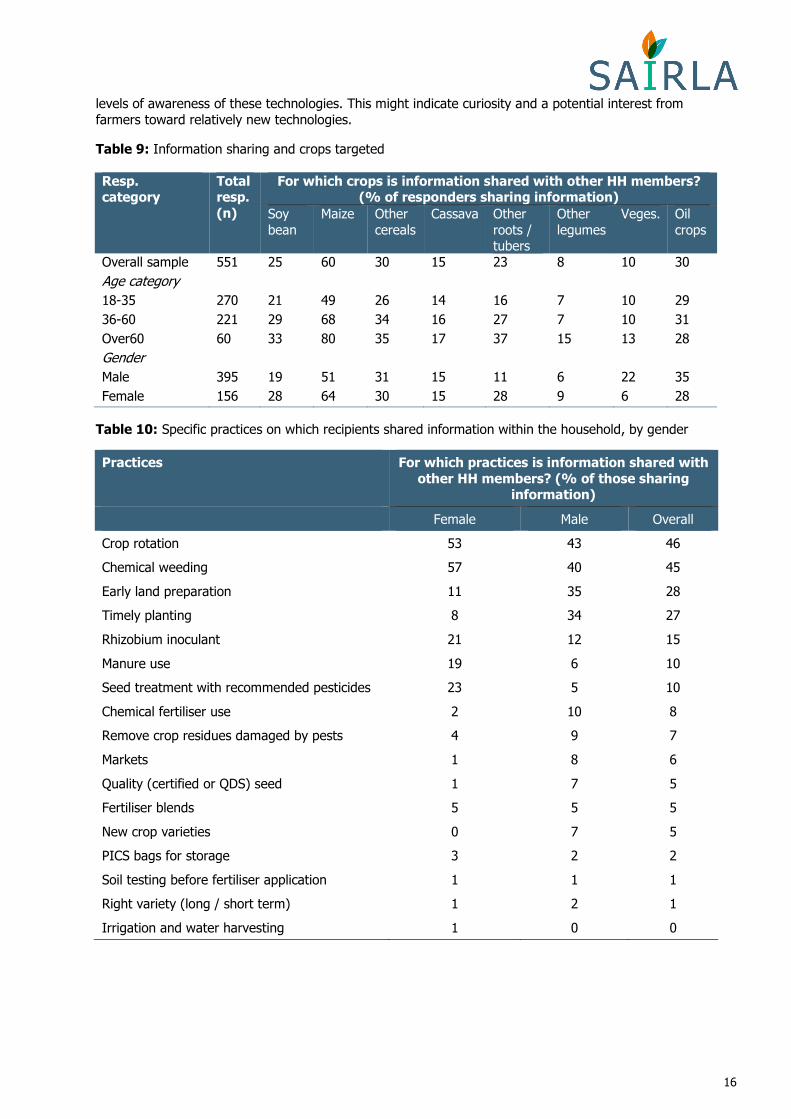
In terms of crops, most respondents tended to share information on maize, other cereals and oil crops (sesame, groundnuts etc.) (Table 9). Information sharing on these crops cut across gender and age category as well, though women and older persons were more likely to share information on maize compared to men and younger persons. These crops also represent the crops for which farmers received most information. They are key staple and cash crops for farmers and as such there is obvious interest to share information on them.
In terms of practices shared, crop rotation, chemical weeding, early land preparation and timely planting were the most commonly mentioned by both men and women (Table 10). A similar result was found with data disaggregated by age category, expect for chemical weeding that was mostly discussed by younger farmers (18-35 years) (Table 11). This might be explained by the fact that these practices are among the most commonly established and known by farmers. Between 10-15% of farmers shared information on rhizobium inoculant and seed treatment, despite the indicated low
16
levels of awareness of these technologies. This might indicate curiosity and a potential interest from farmers toward relatively new technologies.
Table 9: Information sharing and crops targeted Resp. category
Total resp.
(n)
For which crops is information shared with other HH members? (% of responders sharing information)
Soy bean
Maize Other cereals
Cassava Other roots / tubers
Other legumes
Veges. Oil crops
Overall sample 551 25 60 30 15 23 8 10 30
Age category
18-35 270 21 49 26 14 16 7 10 29
36-60 221 29 68 34 16 27 7 10 31
Over60 60 33 80 35 17 37 15 13 28
Gender
Male 395 19 51 31 15 11 6 22 35
Female 156 28 64 30 15 28 9 6 28
Table 10: Specific practices on which recipients shared information within the household, by gender
Practices For which practices is information shared with
other HH members? (% of those sharing information)
Female Male Overall
Crop rotation 53 43 46
Chemical weeding 57 40 45
Early land preparation 11 35 28
Timely planting 8 34 27
Rhizobium inoculant 21 12 15
Manure use 19 6 10
Seed treatment with recommended pesticides 23 5 10
Chemical fertiliser use 2 10 8
Remove crop residues damaged by pests 4 9 7
Markets 1 8 6
Quality (certified or QDS) seed 1 7 5
Fertiliser blends 5 5 5
New crop varieties 0 7 5
PICS bags for storage 3 2 2
Soil testing before fertiliser application 1 1 1
Right variety (long / short term) 1 2 1
Irrigation and water harvesting 1 0 0

17
Table 11: Specific practices on which recipients shared information within the household, by age category
Practices For which practices is information shared with other HH members? (% of those
sharing information)
18-35 yrs. 36-60 yrs. Over60 yrs.
Early land preparation 14 39 55
Timely planting 13 37 53
Crop rotation 44 48 47
Chemical weeding 46 46 38
Quality (certified or QDS) seed 3 6 12
Remove crop residues damaged by pests 4 10 10
Chemical fertiliser use 5 11 8
Markets 4 9 8
Rhizobium inoculant 16 15 8
Manure use 11 8 7
Seed treatment with recommended pesticides 14 7 5
Right variety (long / short term) 0 2 3
Fertiliser blends 6 5 2
New crop varieties 6 5 2
PICS bags for storage 3 2 2
Irrigation and water harvesting - 1 -
Soil testing before fertiliser application 1 2 -
3.4 Soybean current information sources and
practices
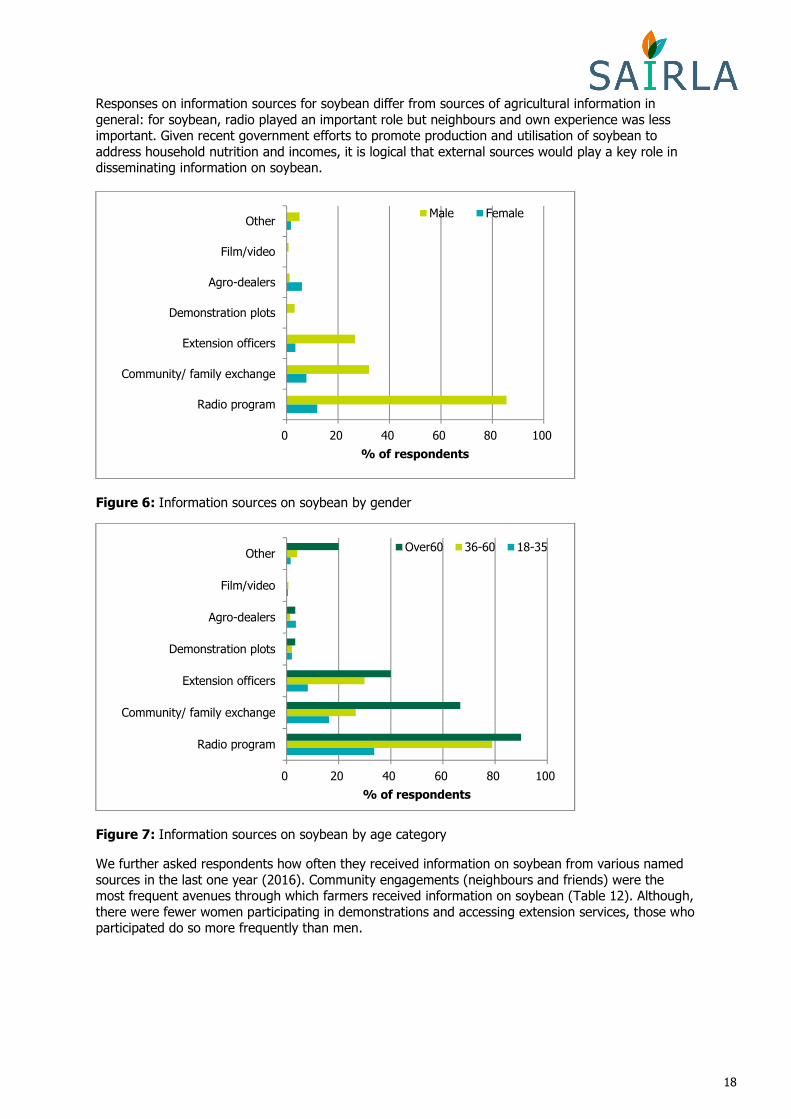
3.4.1 Sources of information on soybean
Besides asking information about general agricultural practices, we specifically asked farmers if they received any information on soybean technologies. At least 43% of the respondents acknowledged receipt of information on soybean practices. There were slightly more male recipients (47%) of information on soybean compared to their female (36%) counterparts. Again, despite the perception that soybean is a woman’s crop, current information about soybean does not look to target in particular women. The most commonly mentioned sources of information on soybean were: radio, community exchange and extension officers (Figure 6), which were significantly more accessible to men and women farmers. Similarly, men exhibited access to more diverse sources of information on soybean compared to women, further explaining the higher awareness on soybean technologies. Young people exhibited more diverse information sources compared to elderly persons who were limited to radio, extension officers, and community/family exchange (Figure 7). Mentioned under ‘other sources’ of information on soybean were Vodafone farmers’ club (a mobile phone based agricultural information service), NGOs (Resiliency in Northern Ghana (RING)), family members and markets.
18
Responses on information sources for soybean differ from sources of agricultural information in general: for soybean, radio played an important role but neighbours and own experience was less important. Given recent government efforts to promote production and utilisation of soybean to address household nutrition and incomes, it is logical that external sources would play a key role in disseminating information on soybean.
Figure 6: Information sources on soybean by gender
Figure 7: Information sources on soybean by age category
We further asked respondents how often they received information on soybean from various named sources in the last one year (2016). Community engagements (neighbours and friends) were the most frequent avenues through which farmers received information on soybean (Table 12). Although, there were fewer women participating in demonstrations and accessing extension services, those who participated do so more frequently than men.
0 20 40 60 80 100
Radio program
Community/ family exchange
Extension officers
Demonstration plots
Agro-dealers
Film/video
Other
% of respondents
Male Female
0 20 40 60 80 100
Radio program
Community/ family exchange
Extension officers
Demonstration plots
Agro-dealers
Film/video
Other
% of respondents
Over60 36-60 18-35
19
Table 12: Frequency of receiving information by farmers from various sources
Information
source
No. of times information on soybean was received from
various sources in 2016 (average)
18-35
years
36-60
years
Over60
years
Male Female Total
sample Agro-dealer 2 2 0 2 2 2
Community 3 3 4 3 3 3
Demo plots 2 3 0 2 4 2
Extension officer 3 3 3 2 4 3
Film 2 3 0 3 0 3
Radio 3 3 3 3 3 3
SMS 3 0 0 3 0 3
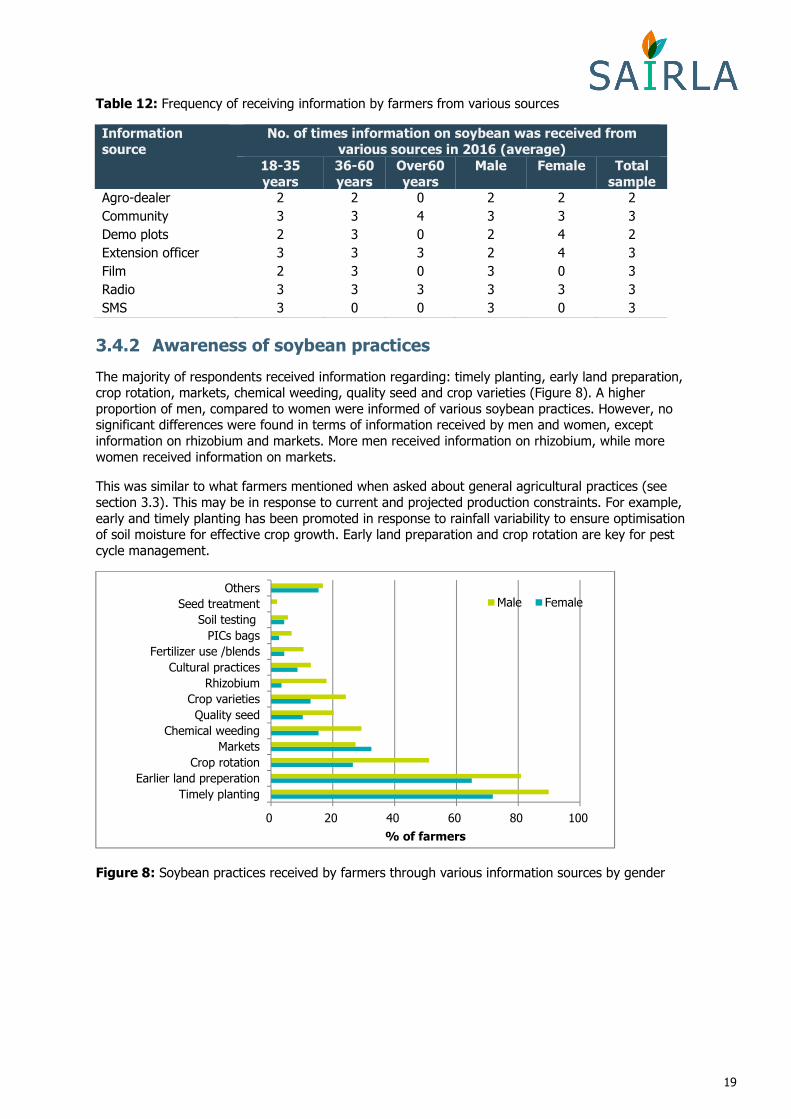
3.4.2 Awareness of soybean practices
The majority of respondents received information regarding: timely planting, early land preparation, crop rotation, markets, chemical weeding, quality seed and crop varieties (Figure 8). A higher proportion of men, compared to women were informed of various soybean practices. However, no significant differences were found in terms of information received by men and women, except information on rhizobium and markets. More men received information on rhizobium, while more women received information on markets.
This was similar to what farmers mentioned when asked about general agricultural practices (see section 3.3). This may be in response to current and projected production constraints. For example, early and timely planting has been promoted in response to rainfall variability to ensure optimisation of soil moisture for effective crop growth. Early land preparation and crop rotation are key for pest cycle management.
Figure 8: Soybean practices received by farmers through various information sources by gender
0 20 40 60 80 100
Timely planting
Earlier land preperation
Crop rotation
Markets
Chemical weeding
Quality seed
Crop varieties
Rhizobium
Cultural practices
Fertilizer use /blends
PICs bags
Soil testing
Seed treatment
Others
% of farmers
Male Female
20
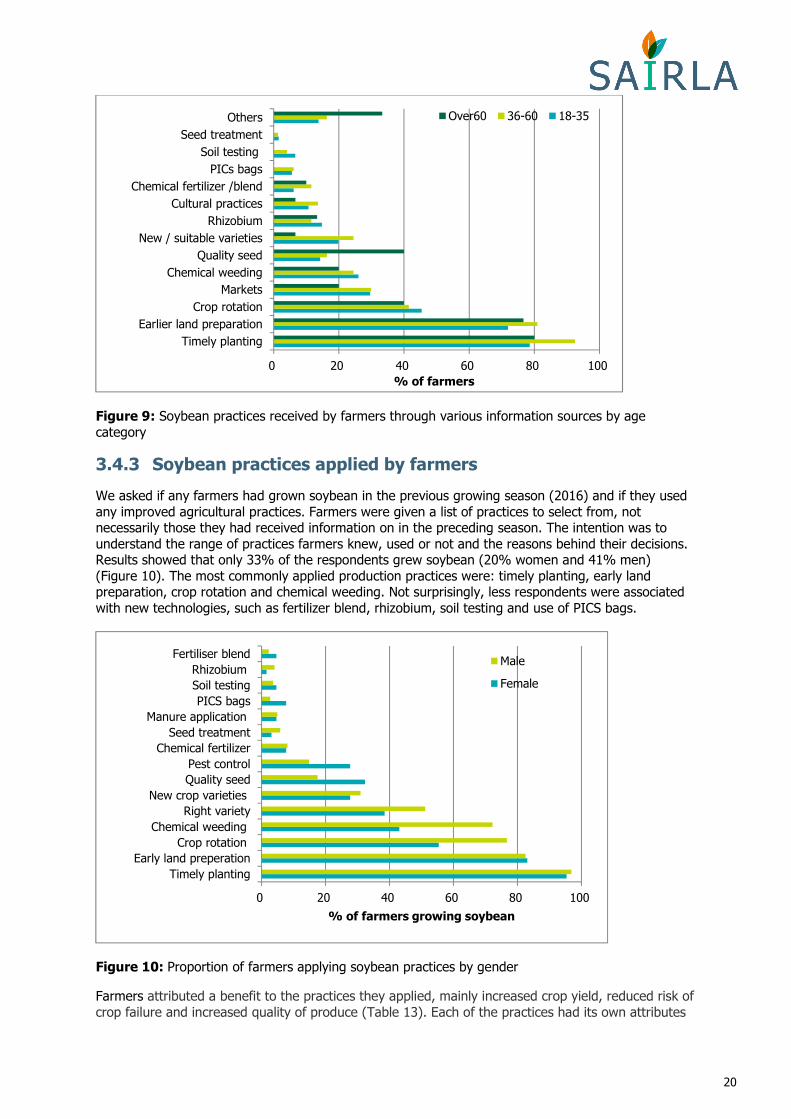
Figure 9: Soybean practices received by farmers through various information sources by age category
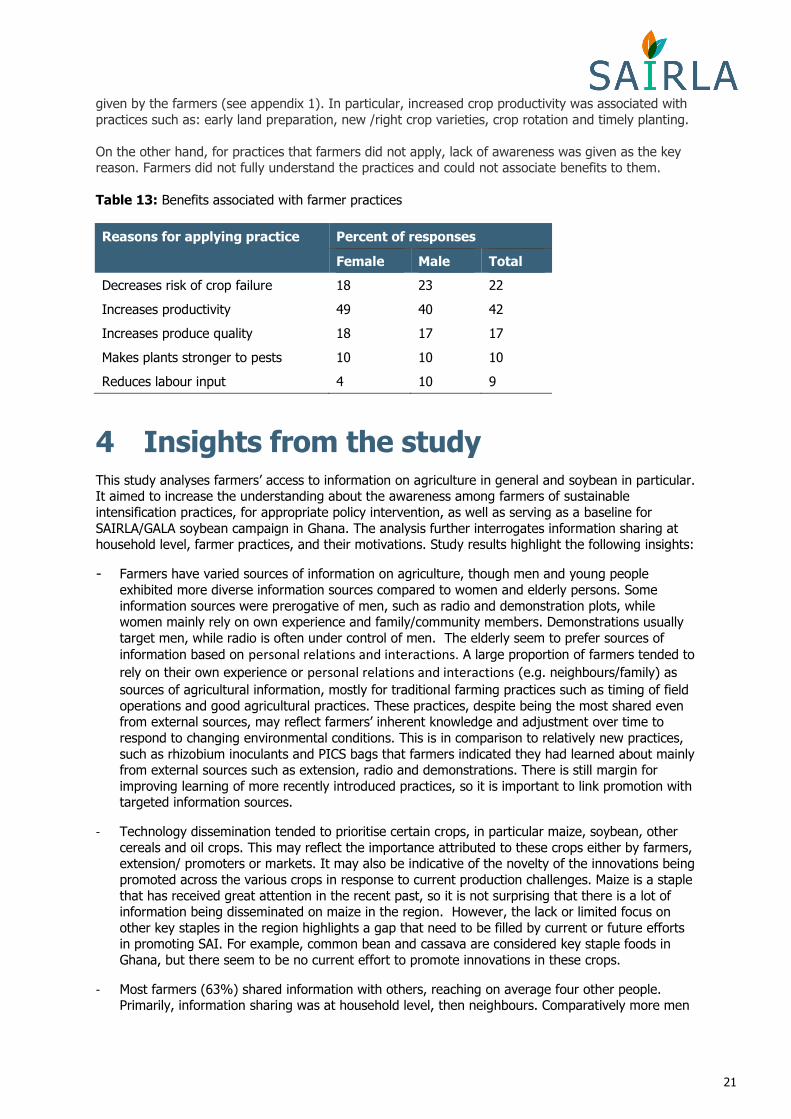
3.4.3 Soybean practices applied by farmers
We asked if any farmers had grown soybean in the previous growing season (2016) and if they used any improved agricultural practices. Farmers were given a list of practices to select from, not necessarily those they had received information on in the preceding season. The intention was to understand the range of practices farmers knew, used or not and the reasons behind their decisions. Results showed that only 33% of the respondents grew soybean (20% women and 41% men) (Figure 10). The most commonly applied production practices were: timely planting, early land preparation, crop rotation and chemical weeding. Not surprisingly, less respondents were associated with new technologies, such as fertilizer blend, rhizobium, soil testing and use of PICS bags.
Figure 10: Proportion of farmers applying soybean practices by gender
Farmers attributed a benefit to the practices they applied, mainly increased crop yield, reduced risk of crop failure and increased quality of produce (Table 13). Each of the practices had its own attributes
0 20 40 60 80 100
Timely planting
Earlier land preparation
Crop rotation
Markets
Chemical weeding
Quality seed
New / suitable varieties
Rhizobium
Cultural practices
Chemical fertilizer /blend
PICs bags
Soil testing
Seed treatment
Others
% of farmers
Over60 36-60 18-35
0 20 40 60 80 100
Timely planting
Early land preperation
Crop rotation
Chemical weeding
Right variety
New crop varieties
Quality seed
Pest control
Chemical fertilizer
Seed treatment
Manure application
PICS bags
Soil testing
Rhizobium
Fertiliser blend
% of farmers growing soybean
Male
Female
21
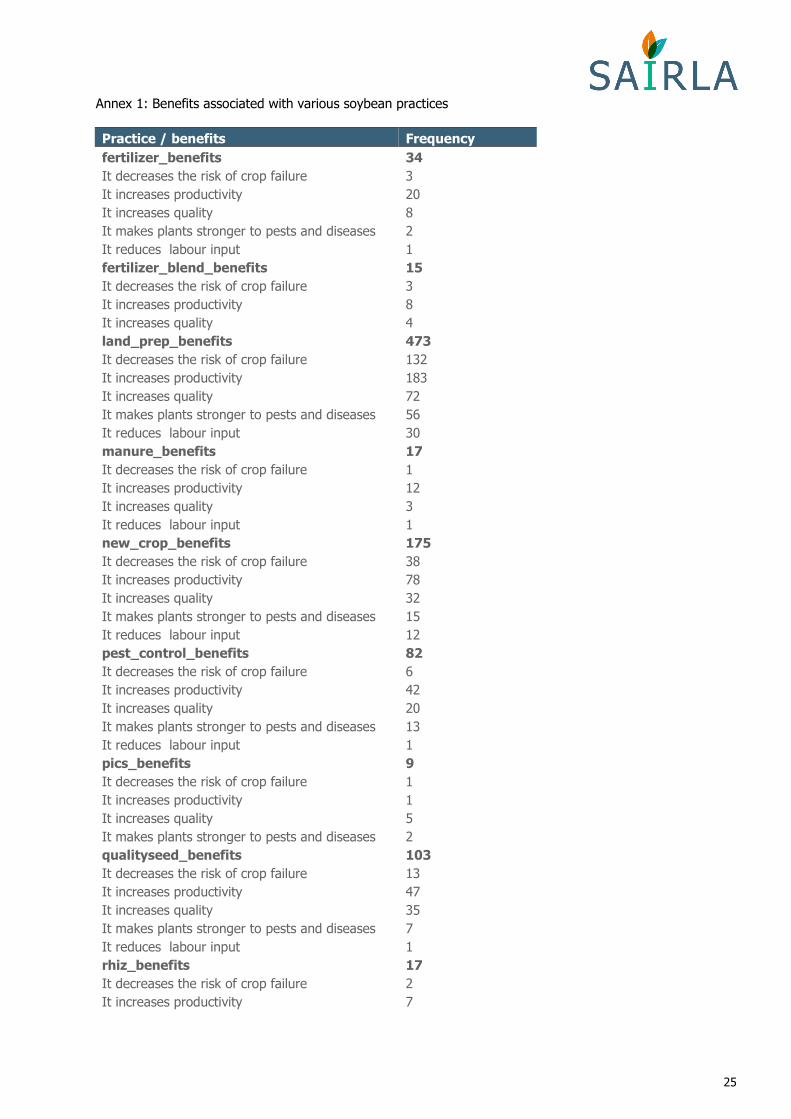
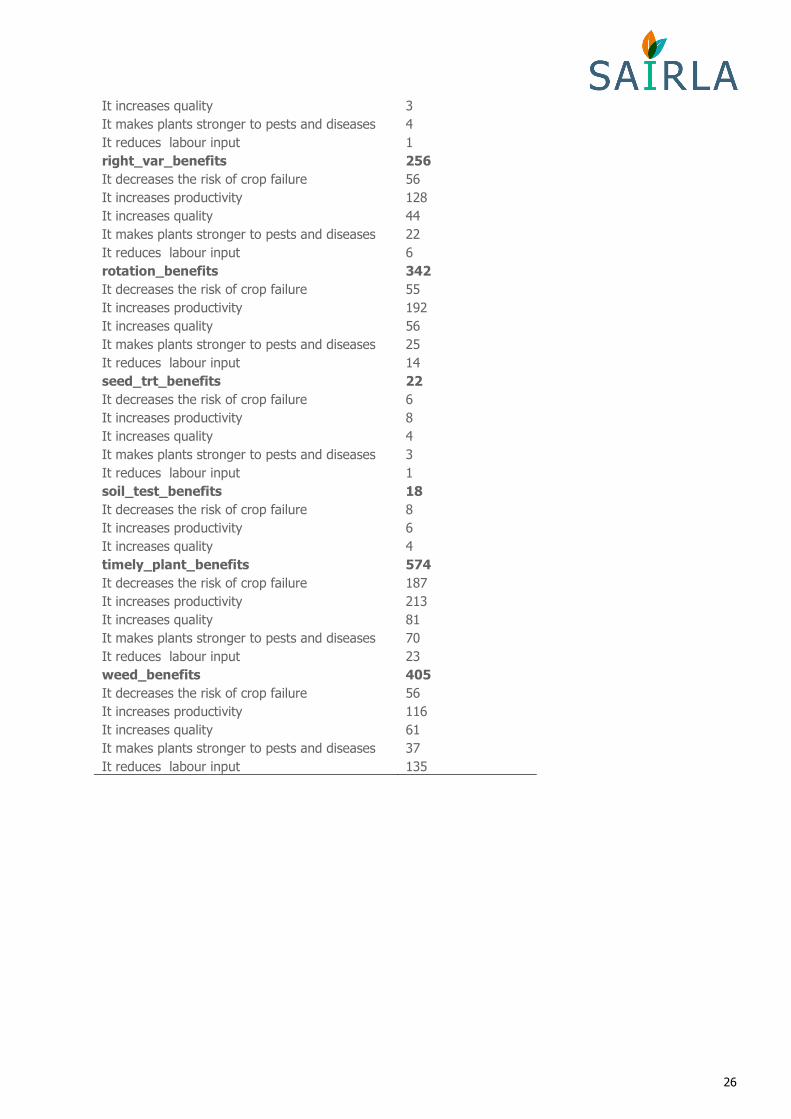
given by the farmers (see appendix 1). In particular, increased crop productivity was associated with practices such as: early land preparation, new /right crop varieties, crop rotation and timely planting. On the other hand, for practices that farmers did not apply, lack of awareness was given as the key reason. Farmers did not fully understand the practices and could not associate benefits to them. Table 13: Benefits associated with farmer practices
Reasons for applying practice Percent of responses
Female Male Total
Decreases risk of crop failure 18 23 22
Increases productivity 49 40 42
Increases produce quality 18 17 17
Makes plants stronger to pests 10 10 10
Reduces labour input 4 10 9
4 Insights from the study This study analyses farmers’ access to information on agriculture in general and soybean in particular. It aimed to increase the understanding about the awareness among farmers of sustainable intensification practices, for appropriate policy intervention, as well as serving as a baseline for SAIRLA/GALA soybean campaign in Ghana. The analysis further interrogates information sharing at household level, farmer practices, and their motivations. Study results highlight the following insights:
- Farmers have varied sources of information on agriculture, though men and young people exhibited more diverse information sources compared to women and elderly persons. Some information sources were prerogative of men, such as radio and demonstration plots, while women mainly rely on own experience and family/community members. Demonstrations usually target men, while radio is often under control of men. The elderly seem to prefer sources of information based on personal relations and interactions. A large proportion of farmers tended to
rely on their own experience or personal relations and interactions (e.g. neighbours/family) as
sources of agricultural information, mostly for traditional farming practices such as timing of field operations and good agricultural practices. These practices, despite being the most shared even from external sources, may reflect farmers’ inherent knowledge and adjustment over time to respond to changing environmental conditions. This is in comparison to relatively new practices, such as rhizobium inoculants and PICS bags that farmers indicated they had learned about mainly from external sources such as extension, radio and demonstrations. There is still margin for improving learning of more recently introduced practices, so it is important to link promotion with targeted information sources.
- Technology dissemination tended to prioritise certain crops, in particular maize, soybean, other cereals and oil crops. This may reflect the importance attributed to these crops either by farmers, extension/ promoters or markets. It may also be indicative of the novelty of the innovations being promoted across the various crops in response to current production challenges. Maize is a staple that has received great attention in the recent past, so it is not surprising that there is a lot of information being disseminated on maize in the region. However, the lack or limited focus on other key staples in the region highlights a gap that need to be filled by current or future efforts in promoting SAI. For example, common bean and cassava are considered key staple foods in Ghana, but there seem to be no current effort to promote innovations in these crops.
- Most farmers (63%) shared information with others, reaching on average four other people. Primarily, information sharing was at household level, then neighbours. Comparatively more men
22
than women shared agricultural information with others, while older persons were more likely to share information compared to younger persons. For men, this could be attributed to their ability to access external sources of information gained on behalf of the household, while for older people this could be as a result of experience they have and their position as opinion leaders.
- We found a very low percentage of farmers (below 10%) using practices that will be promoted through the SAIRLA/GALA soybean campaign: fertilizer blend (used by 3% of farmers), rhizobium (3%), soil testing (4%) and use of PICS bags (4%).
23
Acknowledgements The GALA project is funded through WYG by UK’s Department for International Development (DFID). The project also leverages thematic and on co-funding from the African Soil Health Consortium (ASHC) [funded by the Bill & Melinda Gates Foundation] and N2Africa Project (IITA - led).
Authors acknowledge the contribution of project team members in designing the study and reviewing the report: Duncan Sones, Silvia Silvestri, George Oduor, Dannie Romney and James Watiti. Contributions of other project team members from IITA (Edward Baars), and ILogix (Dharmesh Ganatra) during study design, tools development and report review are acknowledged.
Finally, we acknowledge the contribution of University of Development Studies (UDS), Tamale for implementing field data collection, the ten enumerators from UDS who supported this work and farmers who provided the information. We acknowledge the role of local chiefs in mobilising communities to participate in the study. As much as possible, the authors have tried to ensure confidentiality of information provided by respondents, depicting only the general situation rather than individual responses.
24
References Mbanya, W. 2011. "Assessment of the Constraints in Soybean Production: A Case of
Northern Region, Ghana." Journal of Developments in Sustainable Agriculture 6:199-214.
Rusike, J., G. van den Brand, S. Boahen, K. Dashiell, S. Kantengwa, O. Ongoma, D.M. Mongane, et al. 2013. "Value chain analyses of grain legumes in N2Africa: Kenya, Rwanda, eastern DRC, Ghana, Nigeria, Mozambique, Malawi and Zimbabwe." In www.N2Africa.org, 96 pp.
Schreiner, M. 2015. "A Simple Poverty Scorecard for Ghana " In.: http://www.microfinance.com/English/Papers/Scoring_Poverty_Ghana_2012_EN.pdf.
Sones, K. R., G. I. Odour, J. W. Watiti, and D. Romney. 2015. "Communicating with smallholder farming families–A review with a focus on agro-dealers and youth as intermediaries in subSaharan Africa." CAB Reviews 10 (30):1-6.
25
Annex 1: Benefits associated with various soybean practices
Practice / benefits Frequency
fertilizer_benefits 34
It decreases the risk of crop failure 3
It increases productivity 20
It increases quality 8
It makes plants stronger to pests and diseases 2
It reduces labour input 1
fertilizer_blend_benefits 15
It decreases the risk of crop failure 3
It increases productivity 8
It increases quality 4
land_prep_benefits 473
It decreases the risk of crop failure 132
It increases productivity 183
It increases quality 72
It makes plants stronger to pests and diseases 56
It reduces labour input 30
manure_benefits 17
It decreases the risk of crop failure 1
It increases productivity 12
It increases quality 3
It reduces labour input 1
new_crop_benefits 175
It decreases the risk of crop failure 38
It increases productivity 78
It increases quality 32
It makes plants stronger to pests and diseases 15
It reduces labour input 12
pest_control_benefits 82
It decreases the risk of crop failure 6
It increases productivity 42
It increases quality 20
It makes plants stronger to pests and diseases 13
It reduces labour input 1
pics_benefits 9
It decreases the risk of crop failure 1
It increases productivity 1
It increases quality 5
It makes plants stronger to pests and diseases 2
qualityseed_benefits 103
It decreases the risk of crop failure 13
It increases productivity 47
It increases quality 35
It makes plants stronger to pests and diseases 7
It reduces labour input 1
rhiz_benefits 17
It decreases the risk of crop failure 2
It increases productivity 7
26
It increases quality 3
It makes plants stronger to pests and diseases 4
It reduces labour input 1
right_var_benefits 256
It decreases the risk of crop failure 56
It increases productivity 128
It increases quality 44
It makes plants stronger to pests and diseases 22
It reduces labour input 6
rotation_benefits 342
It decreases the risk of crop failure 55
It increases productivity 192
It increases quality 56
It makes plants stronger to pests and diseases 25
It reduces labour input 14
seed_trt_benefits 22
It decreases the risk of crop failure 6
It increases productivity 8
It increases quality 4
It makes plants stronger to pests and diseases 3
It reduces labour input 1
soil_test_benefits 18
It decreases the risk of crop failure 8
It increases productivity 6
It increases quality 4
timely_plant_benefits 574
It decreases the risk of crop failure 187
It increases productivity 213
It increases quality 81
It makes plants stronger to pests and diseases 70
It reduces labour input 23
weed_benefits 405
It decreases the risk of crop failure 56
It increases productivity 116
It increases quality 61
It makes plants stronger to pests and diseases 37
It reduces labour input 135