gender budgeting; janet g. stotsky; imf working paper 06 ... · gender differences can be...
TRANSCRIPT

WP/06/232
Gender Budgeting
Janet G. Stotsky


© 2006 International Monetary Fund WP/06/232 IMF Working Paper Fiscal Affairs Department
Gender Budgeting
Prepared by Janet G. Stotsky∗
Authorized for distribution by Jesús Seade
October 2006
Abstract
This Working Paper should not be reported as representing the views of the IMF. The views expressed in this Working Paper are those of the author(s) and do not necessarily represent those of the IMF or IMF policy. Working Papers describe research in progress by the author(s) and are published to elicit comments and to further debate.
Women are disadvantaged relative to men, according to key economic, social, and political measures of equality, but in many areas, such as education, differences are narrowing. The concept of externalities underlies the arguments for including gender considerations in budget programs and policies. Other arguments have a weaker economic basis but may be more socially or politically compelling. The experience to date with “gender budgeting,” which entails looking at gender issues comprehensively within the budget, has been mixed. To become more useful, gender budgeting should be integrated into budget processes in a way that generates tangible improvements in policy outcomes. The International Monetary Fund should encourage fiscal authorities to take into account the external benefits of reducing gender inequalities and to remove from fiscal legislation any arbitrary discrimination against women. JEL Classification Numbers: H6, J16 Keywords: Gender budgeting, government budgets
Author’s E-Mail Address: [email protected]
∗ The author would like to thank Ben Clements, Peter Heller, Prachi Mishra, Enrique Palma, Tej Prakash, Dawn Rehm, Jesús Seade, and Marijn Verhoeven for providing instructive comments and suggestions. Thanks also go to Nadia Malikyar and Beulah David for ably assisting with the preparation of the document, Sandra Stotsky and Van Wallach for their valuable editorial assistance, Assi WoldeMariam for her usual capable and generous assistance in putting together the data, and the IMF for granting me study leave.

- 2 -
Contents
Page
I. Introduction ............................................................................................................................3
II. Measuring Gender Inequalities and Gender Equity Indexes.................................................3
III. Gender Budgeting: Concepts and Framework...................................................................12
IV. Gender Budgeting: Experiences ........................................................................................24
V. Conclusions.........................................................................................................................30
References................................................................................................................................46 Tables 1. Gender Inequalities in Education and Health Status, 2001/02 (summarized) .......................5 2. Gender Equity Indexes, 2002.................................................................................................9 Appendix Tables 3. Gender Inequalities in Education and Health Status, 2001/02 ...........................................33 4. High Human Development and Gender Equity Indexes, 2002............................................40 5. Medium Human Development and Gender Equity Indexes, 2002 ......................................42 6. Low Human Development and Gender Equity Indexes, 2002 ............................................45

- 3 -
I. INTRODUCTION
This study examines how public processes can contribute to improving women’s status. “Gender budgeting,” which refers to the systematic examination of budget programs and policies for their impact on women, has been tried in a range of countries in recent years. Australia was the first country to formally incorporate gender budgeting into its budget process by developing the concept of a “women’s budget” to address inequalities between women and men. Government ministries and departments were required to provide an analysis of the impact of the annual budget on women and girls, focusing mainly but not exclusively on public expenditures. Gender budgeting is sometimes seen as outside mainstream research on budgeting. This study attempts to place it squarely within that mainstream and to show that gender budgeting is just good budgeting—budgeting that properly accounts for the positive externalities that are derived from improving women’s opportunities for health care, education, and employment. Studies show that programs and policies designed to improve women’s economic opportunities lead to higher rates of economic growth (Stotsky, 2006). Section II presents and assesses evidence on the linkage between poverty and women’s lack of opportunities for educational, social, and economic advancement, highlighting data on key indicators of inequality, such as access to education and average longevity. Sections III and IV examine critically the literature on gender budgeting, survey some experiences, and suggest directions for moving forward with these initiatives. Section V concludes with implications for the work of the International Monetary Fund. Key findings include: (i) Measures of inequality in key economic, social, and political indicators show that women are disadvantaged relative to men, but in many areas, such as education, differences are narrowing; (ii) The concept of externalities underpins the arguments for including gender considerations in budget policies. Other arguments have a weaker economic basis but may be more socially or politically compelling; and (iii) The experience to date with gender budgeting, which entails looking at gender issues comprehensively within the budget, has been mixed, though some initiatives are thriving. These conclusions have the important implications that to become more useful as a budgeting tool, gender budgeting should be mixed into budget processes in a way that generates tangible improvements in policymaking and policy outcomes. International Monetary Fund surveillance and program work should be geared toward ensuring that fiscal authorities take into account the potential external benefits of reducing gender inequalities and enhancing the status of women. Research in a number of areas can enhance the value of gender budgeting, including measuring the differential incidence of fiscal policies by gender and the benefits of reducing gender inequalities.
II. MEASURING GENDER INEQUALITIES AND GENDER EQUITY INDEXES
This section examines measures of differences between men and women in important economic and social indicators and indicators of relative poverty. It also examines how
- 4 -
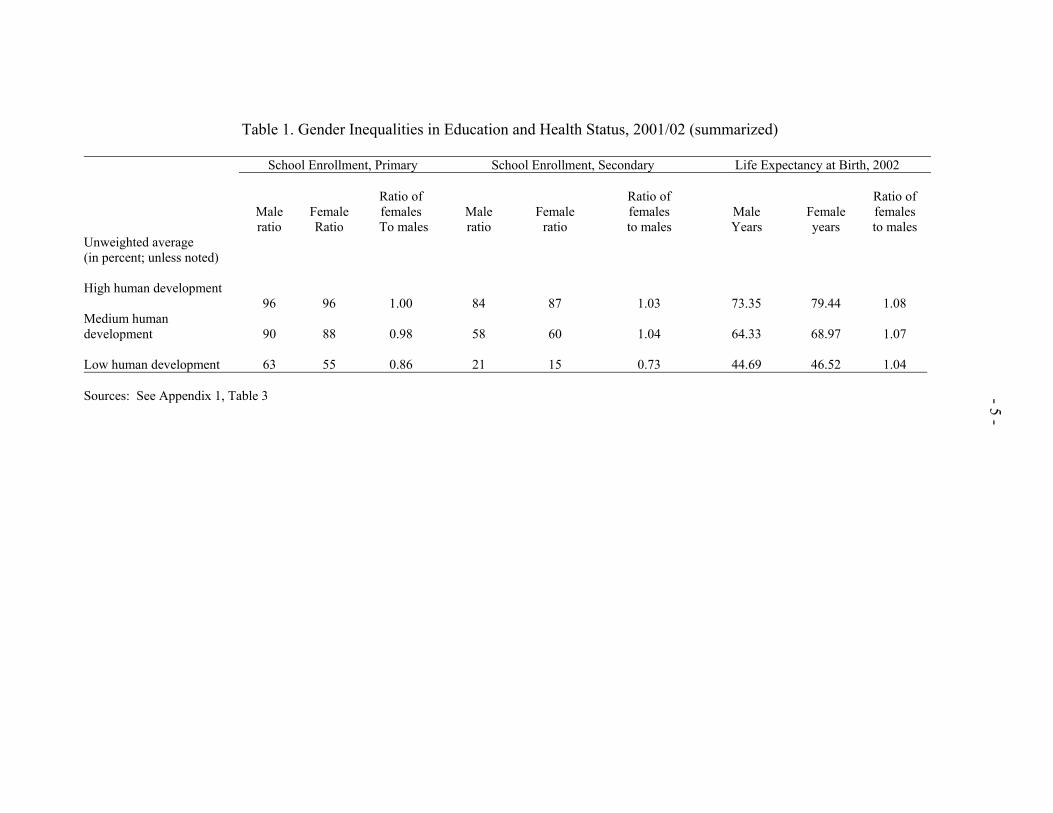
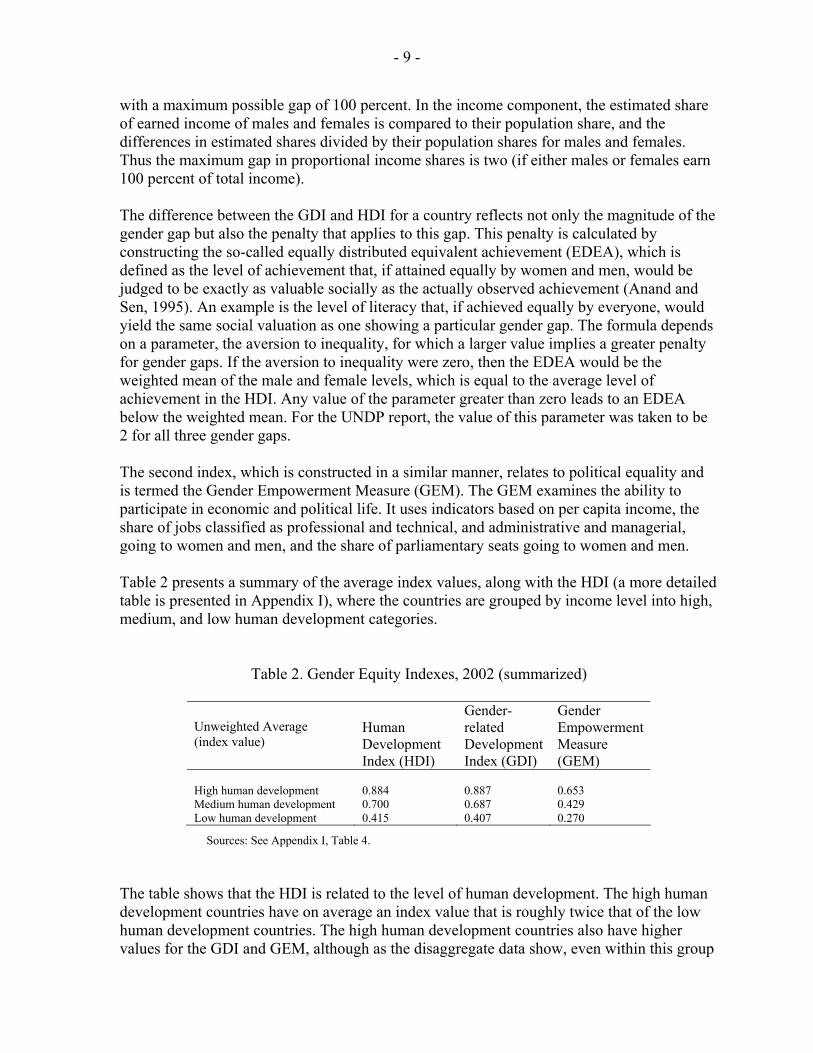
gender differences can be aggregated and summarized by measures that take the form of index numbers. These measures are used to compare gender inequality across countries. Gender Inequalities in Key Economic and Social Indicators Throughout the world, there continue to be differences in key economic and social indicators between men and women. Table 1 presents data on average values of key indicators of education and health, grouped by countries at a high, medium, or low level of human development, classified on the basis of per capita income (a more detailed table is presented in Appendix I). In this table, gender inequalities are measured as the ratios of females to males for the relevant variable. For instance, educational inequalities are measured as the ratio of female to male primary school enrollment and secondary school enrollment. The data suggest that educational inequalities exist, though they are concentrated in the poorest developing countries. The ratio of females to males in school enrollment is essentially equalized in the high and medium human development countries, while in low human development countries, female enrollment continues to lag, and becomes more pronounced at the secondary school level. Health inequalities are measured as the ratio of female to male life expectancy. For biological reasons, average female life expectancy is higher than male life expectancy, and this difference exists in virtually all countries, but, as indicated in the table, the gap between female and male life expectancy tends to narrow in the low human development countries. Inequalities in health appear as excess mortality of female children and differences in life expectancy that do not accord with biological norms. These inequalities lead to excess mortality of females, a well-documented phenomenon referred to as the “missing women” (Sen, 1989), where the number of “missing women” is an estimate of how many more females would be alive, as predicted by biological models, if there were no gender discrimination.1 The World Bank (2001, pp. 3, 41-47) summarizes some trends over the past half century in gender equality in developing countries. With the exception of a few countries, female educational levels have improved considerably. In South Asia, Sub-Saharan Africa, and the Middle East and North Africa, the gender gap in schooling fell substantially. Women’s life expectancy increased by 15 to 20 years and the expected biological pattern in female and male longevity has emerged in all developing regions, including for the first time in South Asia.
1 Klasen (1994) estimates that for the world as a whole in the early 1990s, 90 million women were missing, which he obtains by comparing actual sex ratios of populations with excess female mortality to an expected sex ratio that would have prevailed in the absence of discrimination. Asian countries (principally China and India) account for the major portion of these missing women.
- 5 -
Table 1. Gender Inequalities in Education and Health Status, 2001/02 (summarized)
School Enrollment, Primary School Enrollment, Secondary Life Expectancy at Birth, 2002 Ratio of Ratio of Ratio of Male Female females Male Female females Male Female females ratio Ratio To males ratio ratio to males Years years to males Unweighted average (in percent; unless noted) High human development
96 96 1.00 84 87 1.03 73.35 79.44
1.08 Medium human development 90 88 0.98 58 60 1.04 64.33 68.97 1.07 Low human development 63 55 0.86 21 15 0.73 44.69 46.52 1.04 Sources: See Appendix 1, Table 3
- 6 -
Although more difficult to measure with simple summary measures, differences also exist between men and women in access to productive assets, such as land and credit. In many countries, women’s rights to land ownership are vested in men. Gender differences also are present in labor markets. Occupational segregation is a pervasive feature of labor markets, limiting the jobs that women can perform, leading to their underrepresentation in better jobs and overrepresentation in worse jobs, including in the informal sector. Women also perform the bulk of unpaid labor throughout the world, including developed countries. Gender differences exist in rights under the law and as a result of cultural norms. Women are generally underrepresented in the political sphere (World Bank, 2001, pp 51-58). Women’s labor force participation has been rising across the world in recent decades, so that women’s employment constitutes an important and increasing share of aggregate labor supply. Using International Labor Organization (ILO) data, Standing (1999) shows that during 1975–95, women’s labor force participation increased in the vast majority of developing countries, with similar trends observed in developed countries. In contrast, during this period, men’s participation decreased in the majority of developing and developed countries. Thus for this period, total labor force participation increased but increased female labor more than substituted for decreased male labor. Occupational segregation and wage differences between men and women continue to characterize most labor markets. In labor markets in developing countries, the female share of non-agricultural employment has risen, even though women still comprise a minority of such employment. In rapidly industrializing countries, the share of women is higher, while in lower income countries, barriers to formal employment for women remain strong. Women’s average wages also remain significantly lower than men’s average wages. Standing presents data that suggest that these differences have narrowed somewhat, especially in Western Europe, though cross-country comparisons of wage data are fraught with difficulty. The greatest gaps between the average wages of men and women are in the newly industrializing countries, especially Southeast Asia. Gender Inequalities in Poverty Incidence Although there are disparities between men and women in key indicators, poverty should not be seen as a phenomenon limited or even primarily found among women. Male and female poverty remains pervasive in the world. Chen and Ravallion (2004) estimate that over the period 1981–2001, the proportion of the world’s population living below one dollar a day, the most frequently used standard for international comparisons, declined from 33 percent to 18 percent and in absolute terms fell by 390 million people. Their estimates suggest that there has been less progress in reducing the proportion of people living on less than two dollars day, which still constitute about half the world’s population. In this period, Sub-Saharan Africa overtook East Asia as the region of the world with the highest incidence of extreme poverty, reflecting in large measure the decline in poverty in China as a result of sustained economic growth. Men and women’s unequal ability to develop their human capital and gain access to resources and have a say in governance should imply differences in poverty rates by gender
- 7 -
as well. It is widely believed that female poverty is more pervasive than male poverty, although the evidence on this is mixed and incomplete. It is difficult to measure the difference between male and female poverty because the most commonly used measure of welfare is household consumption and this is typically collected on the basis of the household, not the individual. Some studies have surmounted this problem by comparing only male- and female-headed households, but these households may not be entirely representative and are generally a heterogeneous group in any society. An alternative approach is to compare indicators of poverty, such as education, health and nutritional status, work opportunities, and time use. Summarizing the literature that uses survey data, and that compares female and male poverty, Lipton and Ravallion (1995) conclude that despite a lack of data on intra-household distribution, the available studies suggest that female poverty is not greater than male poverty in households which have a low level of consumption, nor are female-headed households more likely to be poor. They do note, however, that women work longer than men to achieve the same level of living because of the burden of market and domestic labor, and this is especially pronounced for poor women. And there is evidence that except for the very poor, women participate more in market work the lower their income and that as women participate more in such work, men do not assume a substantial share of women’s domestic work. They also find that women face a lower chance of independent escape from poverty, in part because of domestic commitments and in part because of discrimination in education and job assignments. Lipton and Ravallion’s results contrast, however, with those of some other studies. Buvinic and Gupta (1997) find in their review of studies comparing income and poverty levels of female and male headed households that the majority of such studies conclude that female-headed households are overrepresented among the poor. In a recent study using data from a cross-section of developing countries, Quisumbing, Haddad, and Pena (2001) compare rates of poverty for males and females and for male-and female-headed households to assess whether women and female-headed households contribute disproportionately to poverty. They use data from 10 developing countries in Sub-Saharan Africa, Asia, and Latin America. They calculate income and expenditure based poverty measures to investigate the sensitivity of these results to different ways of measuring income and the poverty line. They find that poverty is higher for female-headed households and females, but in well under half of the countries they examine. The contribution of female-headed households to aggregate poverty is less than that of females, owing to their low share of the population. Overall, the evidence thus suggests that female poverty is greater than male poverty, but this result remains inconclusive. Gender Equity Indexes The measurement of gender inequalities and trends over time is essential to fostering good policy making. The main sources of data are census surveys, the System of National Accounts, and sample surveys of the population. Time use studies are a particularly important part of household survey data. Hedman, Perucci, and Sundstrom (1996) and Beck (1999) provide useful guides to the compilation of gender-sensitive statistics. Key areas for

- 8 -
the collection of gender-sensitive indicators include: statistics on population or demographic characteristics; workforce characteristics; education and health indicators; access to productive resources and credit, and legal and political rights, and to social insurance and other fiscal support programs. Using gender-disaggregated data, the development of measures of gender inequality are important because they give shape to the data, can be used as a guide to public policies, and provide a means to measure progress. The United Nations Development Program (UNDP) constructs a general index that attempts to capture cross-country differences in levels of human development. This index, which is termed the Human Development Index (HDI), measures the change in broad indicators of well-being (UNDP, 1995). In contrast to some measures that focus only on income as a measure of economic well-being, the HDI also examines measures of education and health status. These non-income measures add more fullness to the assessment of well-being, and al though the specific methodology of construction of the index is not without drawbacks, the HDI has achieved broad acceptance (Bardhan and Klasen, 1999). The HDI consists of three equally weighted components to come up with an aggregate score for each country: income at purchasing power parity, adult literacy and years of schooling, and life expectancy. The first component provides a proxy for the level of welfare. The second provides a proxy for measures of human capital, and the third for measures of health status. By design, the value of the HDI ranges from 0 to 1, where 1 indicates the highest level of well-being. The disparity between the HDI and other income-based measures of progress suggest the importance at looking at several dimensions of well-being in constructing a summary measure. In 1995, the UNDP began presenting two indicators of well-being that focus on gender for the purpose of measuring the extent of gender inequalities and changes over time (UNDP, 1995). The derivation of these indexes is premised on the theoretical notion developed in Anand and Sen (1995) that, ceteris paribus, societies have an aversion to gender inequality.2 These indexes are constructed so that they also range in value for each country from 0 to 1, where values closer to 1 indicate higher levels of women’s well-being and empowerment relative to men. The first index relates to economic equality and is termed the Gender Development Index (GDI). The GDI uses the same, equally weighted components, as the HDI, but examines the gaps between men and women on each of these components in relation to the maximum possible achievement in that component, and applies a penalty to this gap (Bardhan and Klasen, 1999). In the life expectancy component, it is assumed that women would outlive men by an average of five years, given equal treatment. If female life expectancy exceeds male life expectancy by less (or more) than five years, a gender gap is held to exist. The range of possible life expectancies is 60 years and there is thus a maximum possible gender gap of 60 years. In the literacy and school enrollment component of the index, women and men are assumed to have the same potential achievement so that differences constitute a gap,
2 Anand and Sen (1995) develop the mathematical properties of the index and show how the parameter values relate to society’s notion of welfare.
- 9 -
with a maximum possible gap of 100 percent. In the income component, the estimated share of earned income of males and females is compared to their population share, and the differences in estimated shares divided by their population shares for males and females. Thus the maximum gap in proportional income shares is two (if either males or females earn 100 percent of total income). The difference between the GDI and HDI for a country reflects not only the magnitude of the gender gap but also the penalty that applies to this gap. This penalty is calculated by constructing the so-called equally distributed equivalent achievement (EDEA), which is defined as the level of achievement that, if attained equally by women and men, would be judged to be exactly as valuable socially as the actually observed achievement (Anand and Sen, 1995). An example is the level of literacy that, if achieved equally by everyone, would yield the same social valuation as one showing a particular gender gap. The formula depends on a parameter, the aversion to inequality, for which a larger value implies a greater penalty for gender gaps. If the aversion to inequality were zero, then the EDEA would be the weighted mean of the male and female levels, which is equal to the average level of achievement in the HDI. Any value of the parameter greater than zero leads to an EDEA below the weighted mean. For the UNDP report, the value of this parameter was taken to be 2 for all three gender gaps. The second index, which is constructed in a similar manner, relates to political equality and is termed the Gender Empowerment Measure (GEM). The GEM examines the ability to participate in economic and political life. It uses indicators based on per capita income, the share of jobs classified as professional and technical, and administrative and managerial, going to women and men, and the share of parliamentary seats going to women and men. Table 2 presents a summary of the average index values, along with the HDI (a more detailed table is presented in Appendix I), where the countries are grouped by income level into high, medium, and low human development categories.
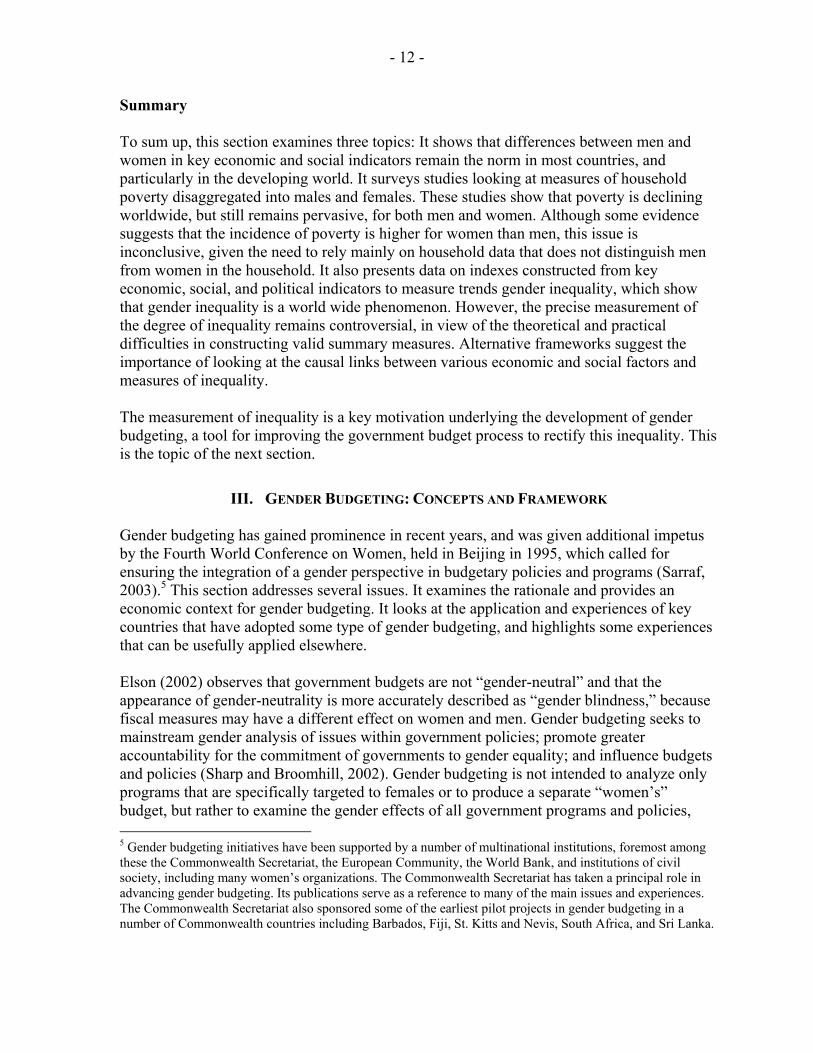
Table 2. Gender Equity Indexes, 2002 (summarized)
Unweighted Average (index value)
Human Development Index (HDI)
Gender-related Development Index (GDI)
Gender Empowerment Measure (GEM)
High human development 0.884 0.887 0.653 Medium human development 0.700 0.687 0.429 Low human development 0.415 0.407 0.270
Sources: See Appendix I, Table 4. The table shows that the HDI is related to the level of human development. The high human development countries have on average an index value that is roughly twice that of the low human development countries. The high human development countries also have higher values for the GDI and GEM, although as the disaggregate data show, even within this group

- 10 -
of countries there is considerable variation. The Scandinavian countries generally score highest in terms of gender equality, with regard to both economic and political equality for reasons that appear to be both cultural and economic. Developing countries tend to have greater gender inequalities, but within this group, there are also considerable differences. The Middle Eastern, Sub-Saharan African, and South Asian countries score relatively low in both economic and political dimensions of gender equality. Beck (1999) notes, for instance, that some developing countries outperform some developed countries in gender equality in political, economic and professional activities; and some countries have low GEM rankings compared to their GDI ranking, so that they are achieving unequally in these two areas. Lahiri and others (2002) evaluate the existing degree of gender inequality in India and present an interesting application of these indexes. The study provides some broad indicators of the status of women in India, showing the degree of disadvantage in education and health indicators for Indian females. The GDI for India shows a considerable gender disparity, though it has improved over time, rising from 0.401 in 1992 to 0.533 in 2001. Nevertheless, it remains low. The GEM also shows the disadvantage of Indian women. Poverty measures also show a higher rate of female poverty, despite the overall continuing pervasiveness of poverty in India. One interesting feature in India is the considerable variation across states in measures of gender disadvantage, highlighting a feature that within diverse countries, the degree of disadvantage can be quite large relative to variation on a cross-country basis. The use of the indexes is not without criticism. Beck notes that the choice of indicators for gender equality and their weighting in the indexes are to some extent arbitrary. Bardhan and Klasen also critique these indexes. Regarding the GDI, they observe that when the index is disaggregated into its three components, the earned-income gap dominates the calculation of the index, and gaps in longevity and education receive negligible weight. The component reflecting gaps in education appears to be the least problematic, placing emphasis on gaps in enrollments and achievements. The measure of life expectancy is flawed because it ignores the importance of differences in mortality at a young age. The most serious conceptual problem is with the earned income component and they suggest some alternative ways to measure this component.3 Finally, they argue that the uniform treatment of the three components may not be appropriate in that it implies the same aversion to inequality for all three gaps between men and women.
3 As a measure of welfare, they observe that the share of income earned by males and females does not reliably measure the gender gaps in consumption or standards of living at the household level since income is shared within the household and therefore a low share for females does not necessarily imply a low female share of consumption, notwithstanding the influence of shares earned by males and females on spending within the household. Also, it assumes that an equal share in earned income between men and women is desirable, which it may not be if there is some economically advantageous division of labor within the household. Finally, earned income excludes unremunerated work and reproductive work, which is substantial in most parts of the developing world, and suggests these are not worthwhile forms of labor. They also point to problems with the approximations used to measure male and female earned income, and the assumption implicit in the formulation of the index that implies that every dollar of difference in earned income is the same, regardless of average income level so that the penalty for a given gender gap is proportional to the income level of a country, unlike in the HDI.
- 11 -
To improve these indexes, Bardhan and Klasen suggest a number of changes. They propose to re-weight the gaps and increase the weights for the life expectancy and education measures. They also suggest either dropping the earned income measure or measuring it differently to address its most severe statistical shortcomings. With regard to the GEM, they suggest that the use of earned-income in this measure is less of a problem because it proxies for women’s empowerment rather than welfare. But they note that this measure still has several deficiencies. In many countries, parliaments are relatively powerless. And it focuses excessively on representation at the national level and in the formal sectors rather than at the local and grassroots level. Several other studies have critiqued the UNDP’s indexes. Dijkstra and Hanmer (2000) assess the GDI, arguing that a major problem with the index is that it conflates relative gender equality with absolute levels of human development and thus does not measure cross-country gender inequality. They also critique the measure of income used in the UNDP index as too heavily reliant on urban data, which they feel tends to understate the differences in earnings relative to the rural and informal sectors and the share of women in the economically active population, which have opposing effects on the calculation of the relative earnings measure. They also note that it ignores the importance of control over family income and that if women have relatively little control, then their well-being is not accurately measured by relative income share. Using the same broad indicators as the GDI, they construct an alternative index, which they term a Relative Status of Women (RSW) index. This index consists of the sum of the ratios of a female to male index for education, life expectancy, and income rather than a weighted average of the levels of these indexes. They measure the education and life expectancy the same as in the UNDP index. For the income indicator, they use the ratio of the implicit rate of return of women to men’s labor. All components of the index are weighted equally. A value less than 1 indicates that women are discriminated against. The RSW index suggests a different set of rankings than the GDI, with the main difference being that the most gender-equal countries tend not to be only the countries with the highest per capita incomes. In fact, with their measure, some very poor countries, including several in southern Africa, score much better on gender equality than with the GDI measure.4 Morrisson and Jutting (2005) also critique these measures. They share the concerns noted in the other studies about the limitations of the measures, but in their view, these indexes also suffer from their lack of attention to institutional frameworks. They examine the importance of social institutions, access to resources, and level of development in determining the economic role of women. They conclude that social institutions are the most important single factor determining women’s participation in economic activities outside the household.
4 They do, however, note some qualifications to the RSW index. One deficiency is that gender equality appears to increase if only because the male indicators are declining, a pyrrhic victory for gender equality. They suggest that rather than constructing summary measures of inequality, a focus on identifying the most important indicators of inequality and classifying these indicators according to causal links.
- 12 -
Summary To sum up, this section examines three topics: It shows that differences between men and women in key economic and social indicators remain the norm in most countries, and particularly in the developing world. It surveys studies looking at measures of household poverty disaggregated into males and females. These studies show that poverty is declining worldwide, but still remains pervasive, for both men and women. Although some evidence suggests that the incidence of poverty is higher for women than men, this issue is inconclusive, given the need to rely mainly on household data that does not distinguish men from women in the household. It also presents data on indexes constructed from key economic, social, and political indicators to measure trends gender inequality, which show that gender inequality is a world wide phenomenon. However, the precise measurement of the degree of inequality remains controversial, in view of the theoretical and practical difficulties in constructing valid summary measures. Alternative frameworks suggest the importance of looking at the causal links between various economic and social factors and measures of inequality. The measurement of inequality is a key motivation underlying the development of gender budgeting, a tool for improving the government budget process to rectify this inequality. This is the topic of the next section.
III. GENDER BUDGETING: CONCEPTS AND FRAMEWORK Gender budgeting has gained prominence in recent years, and was given additional impetus by the Fourth World Conference on Women, held in Beijing in 1995, which called for ensuring the integration of a gender perspective in budgetary policies and programs (Sarraf, 2003).5 This section addresses several issues. It examines the rationale and provides an economic context for gender budgeting. It looks at the application and experiences of key countries that have adopted some type of gender budgeting, and highlights some experiences that can be usefully applied elsewhere. Elson (2002) observes that government budgets are not “gender-neutral” and that the appearance of gender-neutrality is more accurately described as “gender blindness,” because fiscal measures may have a different effect on women and men. Gender budgeting seeks to mainstream gender analysis of issues within government policies; promote greater accountability for the commitment of governments to gender equality; and influence budgets and policies (Sharp and Broomhill, 2002). Gender budgeting is not intended to analyze only programs that are specifically targeted to females or to produce a separate “women’s” budget, but rather to examine the gender effects of all government programs and policies, 5 Gender budgeting initiatives have been supported by a number of multinational institutions, foremost among these the Commonwealth Secretariat, the European Community, the World Bank, and institutions of civil society, including many women’s organizations. The Commonwealth Secretariat has taken a principal role in advancing gender budgeting. Its publications serve as a reference to many of the main issues and experiences. The Commonwealth Secretariat also sponsored some of the earliest pilot projects in gender budgeting in a number of Commonwealth countries including Barbados, Fiji, St. Kitts and Nevis, South Africa, and Sri Lanka.

- 13 -
their effects on resource allocation and outcomes, and how to improve them. It draws upon the literature on the measurement of inequality in that it tries to improve the allocation of resources within the government budget to reduce those inequalities with consequent benefits to economic and social well-being. Beyond these common goals, gender budgeting means something different in each of its applications. Budlender (2002) summarizes the goals of a few of the prominent initiatives: the Asia Foundation’s motivation in supporting this initiative in the Philippines is summarized as follows: to promote a more efficient, equitable, and effective government policy making; to promote accountability and transparency, and to minimize corruption in government; to inform and enhance citizen participation and advocacy, especially for women; to encourage citizens’ budget literacy; and to contribute to effective decentralization. The South African initiative, in contrast, aimed to develop an alternative set of values and principles for prioritizing the socioeconomic needs of poor women; to provide a tool to monitor spending and empower the institutions of government to do so; to empower the government to draw up gender sensitive budgets; and to empower civil society to engage in discussion of issues from which they had been excluded. Both initiatives seek to benefit women, but the first has a more general emphasis on good government and effective decentralization, while the latter is more focused on empowering the government to benefit poor women. We next turn to the theoretical rationale and empirical basis for gender budgeting, before surveying some recent initiatives for lessons to be learned from them. Externalities as a Justification for Gender Budgeting Although gender budgeting seems straightforward, in practice, integrating gender considerations in an economically meaningful way in the budget process is a difficult analytical task. A natural question to ask is what is missing in the typical budget process that suggests a need for gender budgeting? Section I presented evidence on the continuing disadvantages faced by women. Stotsky (2006) surveys evidence suggesting that reducing the disadvantaged status of women can be linked to a higher rate of economic growth and greater economic stability, which yields benefits that the private market, when left to itself, does not fully take into account. In other words, raising the status of women produces positive externalities and thus justifies public policies that do so.6 Palmer (1995) observes that the distribution of labor within the household, with women doing most of the work of reproduction and care, produces a positive social externality that the market fails to take into account and should be integrated into public policies, offering another dimension on this issue.
6 Externalities (or spillovers) are costs and benefits resulting from economic activities (either consumption or production) that are not taken into account by the market. Hence they cause economic distortions. Activities that cause negative externalities are undertaken in excess and those that cause positive externalities are undertaken insufficiently. Externalities are a main reason that justifies government intervention in the economy.

- 14 -
The notion of externality is a flexible one, and although it is typically formulated in the context of economic efficiency, where an externality reduces economic efficiency, this notion can also encompass equity as well as efficiency considerations (Thurow, 1971). As a consequence, there may be external benefits in moving society to a more fair distribution of income or well-being, thereby justifying public intervention. In this context, even if improving the status of women or reducing gender inequalities do not necessarily improve economic growth but simply create a more fair society, there is a justification for public intervention to encourage this process. The Millennium Development Goals implicitly recognize this bidimensional aspect of women’s equality, which is seen in these goals as both a means to aid the achievement of the economic goals as well as social equity. These goals thus rely on an underlying externality concept that takes into account both equity and efficiency considerations as objectives of public policies. Government policies can be used to internalize externalities through various means including the allocation of property rights, taxes, subsidies, and regulations. Each of these methods has implications for the optimal design of fiscal policy. Governments can subsidize private activities that raise the status of women or reduce gender inequalities, or they can provide such services themselves, depending on the extent of the externality. A good example would be spending on women’s health care or education. Government could subsidize private provision or else provide such services themselves. Similarly, to internalize an externality, government could tax harmful activities (for instance, by imposing a tax on parents who do not give proper medical care to their children). By a sensible allocation of property rights or regulation of existing rights, government can also intervene to internalize an externality. An example would be in changing the laws and customs of many countries that do not afford women the opportunity to own or retain possession of their own property. These weak property rights diminish the incentive to invest productively in these assets and limit economic development. The principle of government intervention to reduce externalities underlies sound budgeting in an economic context and provides a strong case for incorporating gender concerns through a gender budgeting exercise. The chief difficulty of a practical nature lies in measuring that externality and choosing the appropriate and most effective method of government intervention. It that sense, gender budgeting can be done as an aggregate exercise, but also needs to be done in a disaggregated manner either with regard to government programs or areas of law or regulation to be most fully useful. Gender Budgeting in Practice Theoretical concerns often seem like an abstraction in real world budgeting processes. Government budgeting is a process that in practice generally consists of several main elements. Starting at the macroeconomic level, the prospective budget is placed within the appropriate macrofiscal framework of the economy, and generally targets some overall balance as an objective. Various measures of the balance are used, depending on the circumstances. These may include a primary balance, if sustainability concerns are important, or a structural balance, to remove cyclical influences on the budget outcome. At the microeconomic level of the budget, economic theory has much to say about optimal budgeting, and specific policies may be adopted on the basis of good economic logic. However, absent an economic crisis, there is usually considerable inertia built into

- 15 -
government budgets, and most revenues and expenditures change (relative to each other and as a share of the economy) only marginally from one year to the next, unless specific policy changes are adopted with the intention of making a more significant alteration in the structure and/or importance of a revenue source or spending program. To contribute usefully to this budgeting process, gender budgeting needs to address several main issues, as outlined in Budlender, Sharp, and Allen (1998): who should be responsible for the exercise and how should it be integrated into the budget? And what is the scope of issues to be covered in the exercise? How should it be reported? This discussion addresses these issues in turn. Gender budgeting can be undertaken as a specific exercise of the government, separate from its standard budgeting process, it can be fully integrated in a centralized way, perhaps by a budget department in a ministry of finance, or it can be integrated piece by piece into the deliberations of spending ministries and the ministry of finance for revenue issues. Many governments have a ministry devoted to women and children’s development, as in India, which might be a natural alternative to a ministry of finance to conduct a gender budgeting exercise, though such ministries generally lack the clout of the ministry of finance. It may be difficult to gain support for the concept of gender budgeting within a government because it adds to work responsibilities and has to avoid being seen as another program simply designed to respond to a special interest group. Sen (2000) notes the difficulty in getting ministries of finance to participate in gender budgeting exercises. It may thus fare better when undertaken in a more decentralized way, but with clear direction from the ministry of finance or budget department. However, this may decentralization may weaken its overall message. There are thus tradeoffs in considering how to integrate it within government. A gender budgeting exercise could also be undertaken as an exercise outside of government and the analysis and recommendations simply presented to government, but this runs the risk that the exercise may not receive the support that is needed to put its recommendations into practice. In terms of its scope, gender budgeting could be geared to the macrofiscal dimensions of the budget (the deficit or spending levels) or it could focus more on the microeconomic dimensions (the composition of spending or revenues, or the structure of government policies or programs). In terms of its macrofiscal dimension, gender budgeting might have advice to offer about the appropriate pace of fiscal adjustment or the appropriate scope for government activity in the economy. Gender considerations might alter the desirable approach to government stabilization policies, and in particular, where women might be disproportionately affected by austerity measures, it might lead to a different composition or pace of fiscal adjustment. Gender budgeting could address the consequences of economic instability, including in the labor market or financial sector, and its potentially disproportionate impact on women. Or if externalities resulting from education or health care are pervasive, it could argue in favor of expanding the scope of government intervention in these areas of the economy, with implications for aggregate public spending or tax policies. In terms of its microeconomic dimensions, gender budgeting might have advice to offer about the composition of spending or revenues. Most often, a gender budgeting exercise would suggest different structures for spending programs or taxes. For instance, it would

- 16 -
suggest greater spending on critical education and health programs or a reduced reliance on fees for certain critical education or health services linked to an improvement in women’s or girls’ well-being. Finally, gender budgeting might have advice to offer with respect to the means of financing a deficit, the use of public assets, or the division of responsibilities among different levels of government. For instance, gender budgeting might imply as a consideration in the sale of public assets, the need to avoid disproportionate unemployment among women workers by either slowing the pace of privatization, building in some process to retrain workers or otherwise providing them with a social safety net, or transferring some employment conditions of the public sector to the private sector. Gender budgeting might imply devolving spending or revenue responsibilities to a level of government which would be more responsive to the needs of the population and thus is better able to address externalities in establishing budget policies. The reporting formats for a gender budgeting exercise would differ, depending in part on who is involved in the process, but also on how the analysis or recommendations are to be conveyed as a consequence of the exercise. These budgets may take the form of a report issued around the time of the budget that discusses gender issues, such as fiscal reforms and how they differentially effect men and women (as in the United Kingdom or Canada). They may also take the form of an explicit measurement of the impact of government programs and policies on women (as in a number of European countries). Some examples of gender budgeting will be presented later. The gender budgeting literature has developed a somewhat stylized approach, adapted from a framework laid out by Elson. It has been applied in a number of recent gender budgeting exercises. Drawing from descriptions in Budlender and Hewitt (2003) and Budlender and Sharp (1998), it is summarized here. They suggest the following approach: ● Undertake a policy appraisal, to identify gender issues and resource allocations, and
how policies will affect existing inequalities. ● Evaluate the beneficiaries of policies, using survey and other techniques. ● Evaluate public expenditure incidence, using cost data and numbers of beneficiaries.
Similarly, evaluate tax incidence. ● Examine the impact of the budget on time use and the care (or reproductive
economy). ● Examine the medium term and how these considerations change the macroeconomic
framework and projections. ● Prepare a budget statement or means to disseminate the results.
- 17 -
This stylized approach suggests an important feature of gender budgeting: it is good budgeting, augmented by greater attention to the importance of gender—its impact on the productivity and the use of time, and the importance of reducing inequalities. It need not follow one particular format but should be integrated into the budget process in the way that makes it most likely to be effective as a guide to good policy. Sharp (2003) suggests combining gender budgeting with other budget initiatives including performance budgeting. Performance oriented budgeting attempts to make government expenditure more effective by focusing on outputs and outcomes rather than just inputs to better assess their effectiveness. This emphasis on outputs and outcomes is very much in keeping with the spirit of gender budgeting. The emphasis on a medium term is essential for gender budgeting to be truly meaningful, as with other budget planning. A sensible approach to budgeting should link the annual budget process to a medium term, but all too frequently, the medium term is neglected. However, to gain the full value added of gender budgeting, it is necessary to place it in a medium term context because so many of the measures to reduce gender inequalities bear fruit over the medium term and thus any short term analysis is likely to understate the value of these measures. For example, efforts to improve girls’ education would reduce fertility but would have a significant effect over a period of time that extends through a woman’s childbearing years. Similarly, the impact of programs to reduce illiteracy may only produce dramatic effects over a generation as the newly literate are able to participate more fully and productively in labor markets and in civic governance, and to transmit these values to their children or communities. In contrast, a program to improve water quality might have more dramatic immediate effects by reducing mortality, particularly of children. One of the limitations of the gender budgeting literature is that it generally fails to spell out the precise mechanism by which the rationalization of fiscal policies is to be undertaken to achieve the gender budgeting goals. The economic rationale for gender budgeting does not imply that equal spending or revenue (per capita or otherwise) is necessarily economically ideal, but as discussed earlier, spending and revenue programs and policies should be geared to addressing economic needs and government intervention is justified on the grounds of externalities. A number of recent studies provide an approach to evaluating the incidence of government programs in a disaggregated fashion, which can be used to incorporate gender considerations, and hence provide a guide to how spending or revenue policies should be altered to achieve gender-related goals. Public Expenditures In most countries, governments have the primary responsibility for providing critical public services such as education and health care, and for providing basic economic infrastructure such as clean water and roads. The government also typically is responsible for the provision of a social safety net for the poor, the elderly, and the unemployed. The scope and quality of

- 18 -
government provision of all these services varies widely depending on the ability of government to finance them and the underlying support for their place in government. Analytical Frameworks for Public Expenditures Since public expenditures have been the main focus of gender budgeting, it is useful to summarize the stylized analytical framework that is most often used. Sharp and Broomhill (1990) provide a framework for classifying public expenditures, which was developed in the Australian context, its first real application. They classify expenditures into three categories: ● Gender specific expenditures: These are expenditures that are specifically targeted to
groups of men, women, boys, or girls. For example, this would include programs to promote men's health or to reduce violence against women.
● Expenditures that promote gender equality within the public service: These are
expenditures targeted to equalizing employment opportunities in the public sector. For example, this would include programs that promote representation of women in management and decision making across all occupational sectors, as well as those promoting equitable pay and conditions of service.
● General or mainstream expenditures: This category comprises all other spending,
which they estimate encompasses about 99 per cent of government expenditures. Although these programs may be general in nature, they may have differential effects by gender.
As with the stylized approach to gender budgeting overall, this stylized approach to classifying public expenditures offers a simple and workable breakdown, which could presumably be derived from most government budget documents. But it does have a number of limitations. For one, it confounds to some extent two separate areas of government activity, spending in the budget and public employment practices, which is not necessarily part of a budget process. Second, most spending falls within the last category, and thus looking only at the first two, would encompass only a small part of government activity and not provide a full picture of the gender-differentiated effects of government programs and policies. In a formal statistical sense, this disaggregation of the spending side does not adhere to any formal statistical accounting treatment for government as might be presented by the International Monetary Fund’s Government Finance Statistics or the United Nations’ System of National Accounts. In the Government Finance Statistics and System of National Accounts methodologies, government budgets are broken down into functional and economic categorizations, where spending is disaggregated by administrative units or economic categories. These three categories above do not neatly fit into either a functional or economic classification and hence it would be difficult to compare meaningfully different government budgets using the classification presented above. A useful way to organize the budget data would be by one of these standard classification schemes and then to examine within each category, the differential incidence of public expenditures by gender.
- 19 -
Measuring the Benefit Incidence of Public Expenditures Assessing the incidence of public expenditures in a gender budgeting context requires differentiating benefits by gender. In this vein, Glick, Saha, and Younger (2004) lay out a framework derived from microeconomic principles for evaluating the benefits of public spending with specific application to data disaggregated by gender. In their scheme, it is first necessary to choose the unit of measurement for welfare, the most common unit being per capita household expenditures. However, for the purpose of gender budgeting it is essential to disaggregate by gender. Unfortunately, expenditure per capita is more practical and it may be impossible to separate benefits for different members of a household. Second, it is necessary to estimate the value of public subsidies. Unlike private goods, for which demand is continuous and one can use standard marginal conditions to derive estimates of benefits, many public services are non-excludable, such as national defense or public administration, so it is impossible to value the benefits based on these standard tools alone. Even when public services are excludable, such as education or health care, public services are often provided with a heavy subsidy or free so that the recipient’s acceptance of the service indicates only that the service is worth more to the recipient than the cost to the recipient, but does not indicate the value of the subsidy. Demand for many public services is discrete (for instance, a person will only attend primary school once). The marginal value of a discrete service may be quite different than the price paid. In addition, since many public services are rationed, the standard microeconomic conditions do not adhere, and there is no equality between price and marginal benefit of a service. As a result of these difficulties, benefit incidence for public services does not use price as a measure of value, but instead usually relies on one of several methods. These include: the government’s cost of provision, compensating (or equivalent) variations from estimated demand functions, a simple binary (0/1) indicator of use, and contingent valuation. The first approach is the most commonly used methodology. This approach, termed “benefit incidence” analysis, uses the cost of providing public goods and services as a way to approximate benefits.7 In this approach, information on unit costs, usually obtained from the government, is combined with information on the use of these services so that a particular level of spending can be assigned to a group or household, depending on how finely the analysis is done, and the subsidy from government is measured as a consequence. Demery (2000) and Davoodi (2003) lay out practical approaches to conducting this analysis, including ways to calculate unit subsidies, taking into account issues related to capturing the full cost of provision and netting for cost recovery, and issues related to measurement of welfare. Although this framework is practical and straightforward, it does have some theoretical and practical shortcomings. From a theoretical perspective, the subsidy does not correspond to
7 See Meerman (1979) and Selowsky (1979) for an early development of this approach. See Davoodi, et al (2003) and Demery (2003) for recent applications of this approach.
- 20 -
the value of the benefit from this public expenditure, which is revealed by demand behavior. Valuing it in a more theoretically rigorous framework would address the issue of quality raised above. From a practical perspective, it is very difficult to collect the information necessary to construct an accurate measure. The most significant data problems include a lack of adequate disaggregation and misreporting or inaccurate reporting of actual expenditures by government. In some countries, actual spending outcomes are not available or are presented inaccurately. Relying on budget data may introduce a serious inaccuracy, where budgets are not adhered or need to be altered because of cyclical considerations that arise in the fiscal year. Thus in most situations, the “benefit incidence” framework may be the only feasible one. Following Aaron and McGuire (1970), a more theoretically satisfying way to measure benefits, derived from microeconomic theory, estimates demand for services and then calculates compensating (or equivalent) variations from which the measure of benefits is derived.8 This approach can be used even when demand is discrete and the full cost of provision is not borne by the buyer, as long as households must pay some price to obtain the good or serve, to trace out a demand curve (Gertler and Glewwe, 1990; Gertler and van der Gaag, 1990). This approach is, however, very demanding relative to the first approach both conceptually and in the data required and would not be feasible for most public officials. A third approach relies on a binary variable to indicate whether the individual has received the good or service or not. While simplifying the data requirements quite considerably, it has the main drawback that it implies that all recipients receive the same amount of benefits, while, in fact, there are usually systematic differences in the amount of benefits received. For instance, poorer recipients generally receive less benefit from government spending than wealthier recipients (Younger, 1999; Sahn and Younger, 2000). A fourth approach uses contingent valuation, and relies on surveys that ask how much a good or service is worth to someone. For pure public goods (that are nonrival and nonexcludable), this is the only theoretically appealing approach. But from a practical perspective, surveys containing such information are not generally available for developing countries. As a practical matter, much of the literature focuses on estimating the distribution of specific expenditures such as education and health, as discussed earlier, on the basis of government cost or a binary indicator of receipt. Research of this nature can be used to measure inequalities and then in combination with research on the growth effects of inequalities, measure the aggregate welfare losses from inequalities stemming from the level of provision of government goods and services. From this point, the budget can be assessed to determine where useful reallocations of spending would lead to a reduction of inequalities and yield economic benefits. 8 The compensating variation is the amount by which income would have to change to compensate an individual for a change in an exogenous variable, such as price, to leave his/her utility (welfare) unchanged. This is the correct measure of the value of the policy change to the individual. The equivalent variation is a similar concept but based on the new utility level rather than the original utility level.

- 21 -
Public programs do not only have effects on the immediate beneficiary but may also have significant indirect effects. Most households consist of more than one person and usually people of both genders. This raises the issue of how to allocate the benefits of services received by one member of a household to the other members of the household who may also benefit, and may confound measures of benefit, disaggregated by gender. For instance, programs to improve prenatal care would generally benefit both women and their children. It would thus be inaccurate to say that only women benefit from such programs, though they might be the main beneficiary. Here there is scope to apply the concepts discussed earlier in which the neoclassical framework is applied more realistically to reflect the presence of multiple members of the household, and preferences that differ over household members. As noted earlier, time is not exogenous in the household decision. Public spending programs influence the availability of certain critical goods, such as education and clean water, and hence they affect the allocation of time within the household. It is thus critical to look beyond the immediate impact of a government program to its indirect effects—on the allocation of time, including unpaid labor required to produce a certain level of household welfare. These examples point out the difficulties inherent in any type of benefit analysis that presumes to be broken down by gender and suggests that unless issues such as externalities, indirect effects on other family or community members, and time reallocation effects, derived from the more general framework of welfare economics, any estimates of gender breakdown should be regarded circumspectly. To avoid excessive complication, it may be desirable to rely on the most straightforward measures while acknowledging their incompleteness—for instance the number of children benefiting from an education, broken down into girls and boys or users of health services, similarly broken down by gender. And then it is possible to use this information to evaluate inequalities and how to address them. Gender Inequalities, Poverty, and the Incidence of Public Spending Several studies have examined the association of gender inequalities in public spending and poverty. They find that although gender inequalities are evident for both rich and poor households, these inequalities are greatest for the poor, particularly for investments in education and health. In a comprehensive international comparison, Filmer (1999) analyzes gender differences in school enrollment using data from 41 countries across the world in the 1990s. Ranking households by wealth, he finds that gender inequalities in school enrollment rates tend to be greater for the poor than the rich. In no country were these inequalities greater for the rich than the poor. He also finds similar patterns between the rich and poor for mortality of children under five, where in contrast to access to schooling, females enjoy a natural advantage. In about two-thirds of countries, the female advantage is smaller for the poor than the rich. Glick, Saha, and Younger (2004) also assess the distribution of public expenditures, focusing on education and health services, water supply, and public employment, for nine countries in different regions of the world, including a sample of transition economies, and countries in Sub-Saharan Africa, Latin America, the Middle East, and Southeast Asia. They break down the data for each country by quintiles using per capita household expenditures as a measure
- 22 -
of welfare and by gender (hence there are 45 comparisons by gender for the nine countries). With regard to education, a majority of their comparisons for primary education show a gap in favor of boys, rising slightly over the second period of their observation. The largest gaps are in Ghana, Pakistan, and Uganda. Most of the changes in gaps over the two periods benefit girls. The results for secondary education are similar. For public medical visits, the gender gap favors women in every country and virtually every quintile in the sample of countries presented by Glick, Saha, and Younger (2004). These results are stable over time. Since the results may be influenced by the differentially greater need of women in childbearing years, they also examine the number of medical care visits for people outside the childbearing years and find no gender gap. Public vaccinations also show no gender gap. Public employment, in contrast, shows a significant gender gap, except in Bulgaria. In addition, when tracked over time, public employment gaps show relatively little reduction (and an increase in a few countries). For time spent collecting water, there is a significant gender gap in both countries, Madagascar and Uganda, in the sample for which data exist. An important finding is that for education and health care services that there is no consistent correlation between gender gaps in these services and per capita expenditures. For water collection, the gap moves in opposite directions for the two countries. Only for public employment is the gap large and strongly correlated with per capita expenditures. Demery and others (1995) use discrete choice modeling techniques to estimate the incidence of education and health spending in Ghana, disaggregated by gender and income. They combine estimates of the cost of service provision with information on household use of services, from the Ghana Living Standards Surveys. They find marked gender inequalities in education spending with girls receiving less than boys. Sahn and Younger (2000) examine cumulative shares of benefits across the expenditure distribution for eight African countries. They find that for primary education in only one country do concentration curves, reflecting the aggregate benefits, differ significantly by gender, which implies that the degree of inequality is relatively constant across the expenditure distribution rather than that there is no gender inequality. With regard to health expenditures, Demery and others (1995) find for outpatient services an even split between males and females and little variation across the expenditure distribution. But for inpatient care, they find that there are substantial differences, with females receiving less than half the total share in the lowest quintile and more than half in the other quintiles. To sum up, this research suggests that, in general, educational inequalities exist between boys and girls and they are more pronounced at higher levels of education and for poorer families, and in poorer countries. However, there is considerable variation across countries and certain regions of the world, especially Sub-Saharan Africa, the Middle East and North Africa, and South Asia show the greatest inequalities. A simple rule of thumb suggests that encouraging greater schooling of girls is beneficial where there are inequalities, and that the greatest remaining problem is among low income households. Health inequalities exist in some areas of health care, especially for poorer households and in poorer countries, but are less in evidence for some components of health care, such as vaccinations. The trend is toward the reduction of these inequalities, though progress has been uneven. The implications are not substantively different from those for education, but suggest that the magnitude of the

- 23 -
problem is smaller. There continue to be significant inequalities in public employment and time spent collecting water (which in many countries consumes a considerable share of female time). These results suggest that properly targeted and structured public spending can contribute to reducing gender inequalities in these important areas, with beneficial effects on well-being and economic growth overall. They highlight the importance of looking not only at gender but also income class since the differences by gender seem to vary greatly for different income classes. Public Revenues On the revenue side, the application of gender budgeting has been less well defined, but tax incidence analysis can be conducted in principle the same way as expenditure incidence analysis. Sahn and Younger (2003) discuss its application to indirect taxes, and reflect on how such analysis can be used to examine gender disaggregated incidence of public revenues. The implications for reducing gender inequalities is, however, less immediate than for spending. Nevertheless, since indirect taxes affect the price of private goods and services, and may therefore interact also with demand for public goods and services, a general enough framework could establish the links between tax policies and gender inequalities. The importance of extending models of the household to incorporate multiple individuals with different preferences in the specific context of assessing tax policy is developed in Apps and Rees (1999). There are many inherent gender biases—both explicit and implicit—in tax systems (Stotsky, 1997, 2005; Barnett and Grown, 2004). For direct taxes, the explicit and implicit dimensions are more clear cut, especially when the taxes apply to individuals, as is most often the case. Explicit gender discrimination in the personal income tax may take several different forms, including the rules governing the allocation of shared income (such as nonlabor income and income from a family business), the allocation of exemptions, deductions, and other tax preferences, as well as the setting of tax rates and legal responsibilities for paying the tax. Implicit gender bias is often seen as the result of increasing marginal tax rates that may discourage secondary workers in a household from working (Feenberg and Rosen, 1995). Indirect taxes may also contain gender biases, though explicit biases are less likely since the tax is impersonalized. However, implicit biases exist in several forms. For instance, under sales taxes, there may be differential application or rates applied to different commodities. If taxes apply less heavily to necessities or products predominantly purchased by women, this creates a certain implicit gender bias. Similarly for taxes on international trade, since these taxes are also impersonal, rarely does one find explicit gender bias but there are also implicit biases built into the definition of the base, the structure of tax rates, and other features of the tax system (Goldman, 2000; Smith, 2000). An interesting recent study examines the gender dimensions of the incidence of tariff liberalization, using South African expenditure data (Daniels and Southern Africa Labour and Development Research Unit, 2005). It evaluates the differential impact of tariff
- 24 -
reductions on male and female-headed households in South Africa, during 1995, 2000, and 2004. Using data on consumption by sex of household head, it shows that there were statistically significant differences in the impact of tariff reductions. It finds that male-headed households almost always bear a greater share of tariff incidence (mainly because of their greater consumption of some highly taxed goods, such as alcohol) but that both male and female-headed households across all expenditure quantiles other than the most wealthy bear a greater share of the tariff burden relative to total expenditures. Finally, it finds that changes in the incidence over the three-year panel period between the sexes mimicked the trends for the population as a whole, but showed crucial differences at the bottom end of the expenditure distribution. There are many issues of interest in taxation, most of which have received little scrutiny. For instance, what are the gender dimensions of changing the structure of taxes toward greater reliance on domestic revenue sources? Often reductions in trade taxes are offset by increases in indirect taxes. Despite the difficulties in assessing the gender impact of either of these two types of taxes, they are unlikely to have the same incidence and thus this may involve some distributional issues of relevance. Gender issues figure prominently in considering the appropriate use and scope of user fees to recover costs of providing government services or products. The use of fees for cost recovery purposes has been advocated as a means to strengthen revenue systems and generate a more efficient use of public services. However, their use has also been criticized for what are seen as adverse equity effects, by reducing access to certain essential services such as primary education and health care. The standard prescription to offer a viable social safety net for the poorest to insulate them from the effect of changes in government fees or taxes is often unrealistic. User fees can be looked at from this perspective as a source of explicit or implicit gender bias, and like direct taxes, they can be personalized (different people are charged different amounts). There are some examples of explicit gender bias in user fees. Nanda (2002) examines the use of user fees in terms of its effect on women’s utilization of health services, in Africa. She finds that these fees discourage use and recommends greater collection of relevant gender-disaggregated data and assessment of these effects. Hillman and Jenkner (2004) suggest, however, that school fees may even, at times, increase access to schooling for poor children by augmenting the ability of the government to provide schools and improve their quality, and the ability of parents to control the flow of finances to schools rather than to public services that do not benefit their families.
IV. GENDER BUDGETING: EXPERIENCES This section provides a brief review of experience with gender budgeting. Some form of gender budgeting or initiatives have been tried in more than 40 countries worldwide, in most cases at the national level, but in some cases, at subnational levels as well. Although the use of gender budgeting in some form is widespread, the experiences have been rather varied. Budlender and Hewitt (2002) provide the most comprehensive survey on recent gender
- 25 -
budgeting initiatives. Some additional information for this survey is drawn from European sources.9 In summarizing gender budgeting initiatives, Budlender and Hewitt (2002) observe that gender budgeting takes many forms and is strongly influenced by the unique milieu of the country. The initiative has been undertaken in all regions of the world. It can be undertaken by government, in either the executive or legislative branches, or by civil society. International organizations can play a supportive role. Gender budgeting seeks to inform and change government policies and programs to better the status of women and reduce gender disparities, and it also seeks to improve budget process in general by enhancing participation and accountability. Most gender initiatives focus on the spending side of the budget. However, there are examples where these initiatives have focused on the revenue side, such as in the United Kingdom. Some initiatives are targeted at specific components of the government budget, while others have a larger focus. Australia Australia was the first country to develop the concept of a “women’s” budget. Instituted in 1984 at the federal level, this exercise was, at one point, undertaken in each of Australia’s territories and states as well, with varying degrees of success. The original exercise at the federal level was developed within the government, where departments and agencies were required to provide an analysis of the annual budget’s achievements in relation to women and girls, to be included in a document circulated with the budget documents (Sawer, 2002). Departments were expected to identify objectives and mechanisms to improve performance in meeting the needs of women. From 1987 the program was called the women’s budget statement and given more formal status within the budget process. Early on, the budget was seen as playing an important role in educating the bureaucracy as to the differential impact of mainstream government policies on women, even while direct allocations to improve the status of women remained small. For example, it gave focus to job market segmentation and the need to reorient labor market programs to benefit women more fully. It recognized the role of women in the unpaid economy as caregivers. Another example is its role in focusing attention on the nongender neutrality of the dependent spouse rebate, which was overwhelmingly claimed by men and which created a disincentive to women’s workforce participation. Another example is in focusing on the disproportionate effect industrial restructuring had had on industries where women were dominant, such as textiles and clothing.
9 The experience of continental Europe is drawn largely from European Union publications, Spanish sources, and unpublished sources.
- 26 -
The South Australian budget, initiated in 1985, provided a statement of women’s disadvantage and a context for understanding that even apparently neutral policies may have a disparate impact across genders. It also brought in an international dimension. It influenced the budgeting process by bringing into focus the need to evaluate activities in terms of their outcomes for women, for instance, by improving their employment. It also tracked implementation of government policy on the appointment of women to higher level position within government. Victoria pursued a similar approach but chose not to submit the women’s budget with the regular budget. This exercise served the important purpose of highlighting the need to disaggregate the effect of mainstream programs on women, rather than simply focusing on women’s programs. It also stimulated international efforts. Eventually, however, this initiative suffered, at both the federal and state levels. By 2000, this exercise was confined to the Northern Territory, and was mainly an activity report. Overall, it appeared that the women’s budget had not been sufficiently influential of policy to justify the work required to produce it. This discouraging result was attributed in part to the absence of effective civil society participation in the initiative and also political changes that resulted in governments less predisposed to be sympathetic to gender budgeting objectives. Some components of the process were, however, integrated elsewhere in the budget process, in particular through the development of a women’s statistics unit in the Australian Bureau of Statistics, in place of the gender equality indicators published in the women’s budget statement (this unit did not survive subsequent budget cuts). It was also replaced through the inclusion of gender reporting in program statements provided annually by departments to parliament and integration of gender equity criteria into program targets. Some jurisdictions introduced annual audits of government programs assessing performance against election commitments to women. Gender auditing remained in place in some states and territories, but without the formal ties to the budget or scope of analysis relative to the budget as originally intended. South Africa A second initiative was initiated in 1995 in South Africa, motivated in part by changes in the post-apartheid South African constitution that emphasized equality. The Women’s Budget Initiative was a joint project of parliament and several nongovernmental organizations, with the goal of looking at the gender implications of departmental budgets. South Africa served as the first pilot for the Commonwealth Secretariat initiative on gender budgeting. The South African initiative was perceived to have raised awareness of the issues. Tangible outcomes included the development of training materials that are accessible to a broad cross-section of the population, and a series of Women’s Budget Documents, which contain studies on various gender-related issues, such as taxation and spending programs, and provide useful elaboration of issues raised elsewhere, particularly on the revenue side, where relatively little work has been done. As in Australia, the initiative did not become institutionalized, which might be attributed in part to the lack of an effective advocate for it within government. Nevertheless, some of the training and research materials provide a valuable source of inspiration for like-minded work.
- 27 -
European Union10 In the European Union, gender equality has taken a front burner status. With the Amsterdam Treaty, a two-pronged approach was adopted that combines gender mainstreaming in all Community policies with the introduction of specific measures to improve women’s status. As far back as 1994, however, a key objective of the Structural Funds was to equalize opportunities for men and women. The most recently adopted instruments for achieving gender equality within the European Union include the Framework Strategy on Gender Equality (2001–2005) and annual gender equality work programs and the Structural Funds. The Framework is designed to coordinate activities and programs on a sectoral basis to improve coherence, for example, by developing reliable indicators and a system for monitoring, evaluating, and publicizing the results. The strategy identifies five areas for promoting gender equality: the economy, linked to the employment strategy of the Structural funds as well as mainstreaming more generally; participation and representation; social rights; civil life; and changes in role and stereotypes. The quantitative objectives of the Lisbon agenda are to increase female workforce participation to 60 percent by 2010 and to ensure that preschool education is available to 90 percent of children between the age of three and mandatory school age and to at least 33 percent of children under the age of three. Nordic countries The Nordic countries have achieved the greatest gender equality (Schmitz, 2005). They have also forged ahead with gender budgeting in practice. The Nordic countries are characterized by high labor force participation of women and an increase in men’s participation in the care of children, mainly due to societal attitudes encouraging this and also the availability of paid parental leave for women and men. Day care facilities are available to all children at an affordable cost. There are pilot projects in each Nordic country which will focus on gender analysis of government programs, with an eye to developing a gender perspective on resource allocation and integrating gender equality as an objective in the national budget. In Finland, Norway, and Sweden, the budget will contain an assessment of the distribution of financial resources between men and women. In Denmark, this analysis will be undertaken with regard to elderly care, and in Iceland, with regard to disability payments. All the countries are attempting to improve the collection of gender disaggregated statistics. The Swedish government has committed itself to integrate gender into the budgetary process. Starting in 2003, it has conducted three pilot projects in the transport, regional development, and social sectors. The goal is to undertake this analysis in all policy areas and to define objectives for each area and outcome indicators. The overall objective is to equalize for men and women in Sweden “opportunities, rights and responsibilities in all areas of life.” The specific goals are: to achieve an equal distribution of power and influence; the same
10 REX/192-CESE 128/2005, Opinion of the European Economic and Social Committee on Beijing+10: progress in gender equality, Brussels, February 9, 2005.
- 28 -
opportunities for economic independence; equal conditions and opportunities in employment; equal access to education and training as well as to opportunities to develop personal interests and talents; shared responsibility for children and domestic chores; and freedom from gender related violence. A National Action Plan for Gender Equality was presented to parliament in June 2003. A plan for implementing gender mainstreaming was adopted in April 2004 for years 2004–2009. Each ministry will be expected to develop performance measures and external evaluations will be undertaken every second year. Implementation measures will include: appointment of strategically placed gender equality coordinators; establishing an organization for coordination in all ministries; undertaking extensive training for the Gender Equality Unit; undertaking training for gender coordinators; establishing a program of continuous training and support for all officials involved in gender-related work; and presenting the results with performance measures to parliament in 2006. Spain In Spain, this initiative has been undertaken at both the central and provincial levels, which in Spain have a relatively large degree of autonomy in spending and receive most revenues from the central level through sharing agreements. At the central level, law 30/2003 establishes that all projects and rules of the government should include a report on the gender impact of the measures undertaken. Spain has heretofore been required to report to the European Union on mainstreaming of equal opportunities for women and men as a condition of receiving structural funds. The expectation is that law 30/2003 will be implemented by requiring each spending ministry to assess its programs and explain the impact of these programs on gender equality. This initiative comes against a backdrop of increased interest in social reform. The Ministry of Labor Women’s Institute is currently developing a guide for spending ministries to create these gender reports. It will recommend that these reports describe the situation of women with quantitative data that are available and examine the impact of the law on the status of women. Laws will be assessed for their gender impact following implementation. In addition, each year, in the annual budget, the main document, the “Presupuesto de Gastos/Beneficios Fiscales,” shows what gender-related goals, such as the integration of women in the labor markets, social benefits, and so on, the government hopes to achieve through spending and tax incentives. At the regional level, three regions have undertaken initiatives in this area. The most extensive exercise has been undertaken in the autonomous community of Andalucia, where law 18/2003 mandates gender analysis in all laws of the province. So far, this law has been institutionalized in the regional government through several specific measures. First, a committee, composed of representatives from different parts of the regional government, and consisting of an equal number of male and female representatives, was formed. Second, data collection on a gender disaggregated basis was made mandatory and is presented each year in a document that accompanies the budget along with an assessment of progress made in reducing gender inequalities in important areas, such as education. The government has shown real commitment to the process as well as institutionalizing the process so that it would survive a change of government. Although the process is still in its beginning stages,

- 29 -
the example of Andalucia perhaps represents one of the more successful initiatives and might be a useful guide for subsequent such efforts. In the Basque region, the Basque Country’s Women’s Office, Emakunde, in partnership with a private company, Infopolis, put together a collection of materials on gender budgeting. However, there are no official initiatives of the government, itself, other than support for the Women’s Office. In the region of Catalunya, a law mandating gender analysis appears to have produced little practical result so far. India Gender budgeting is a concept that was introduced in the Budget Speech for 2000-01 and the initiative so far has some similar elements to those described above. Lahiri and others (2002) report on gender budgeting initiatives in India in a report of the National Institute of Public Finance and Policy, commissioned by the government. To provide the analytical basis for its recommendations, this study constructs an econometric model to link spending on public education and health to the GDI, showing the positive effect of such spending on this indicator of gender inequality. This study also then disaggregates spending on the federal level (Union) budget. It using a modified Sharp and Broomhill approach to categorize budget expenditure, dividing it into expenditure specifically targeted for women, expenditure which have what they term pro-women allocations, and mainstream expenditure. Expenditure targeted to women consists of four main types: that specifically targeted to women such as protective services, social services that can empower women, self employment, and regulatory-like maternity schemes. These are overall a small percentage of the budget—about 1 percent. There are also expenditures that are pro-women, though they are not specifically targeted to women, and are derived from budget expenditure by a formula, developed in the study. Such spending includes certain programs related to poverty alleviation and water supply. These expenditures also constitute a relatively small portion of the total. For the third category of mainstream expenditures, this study uses a gender disaggregated public expenditure benefit incidence analysis by constructing unit costs for different public services, and looking at utilization by gender. For education, they find a disadvantage for girls relative to boys. Altogether, this report represents an interesting effort at focusing on the gender-differentiated effects of budgetary spending and although the linkages of such spending to gender disparity measures and economic growth and welfare are only treated in brief, it provides a framework for such analyses to support sensible budget making. Mexico Mexico provides another variation on gender budgeting initiatives (Hofbauer, 2002). The initiative began in 1993, motivated by an interest in population control policies for poor women living in developing countries. An initial collaboration turned into the Foro Nacional de Mujeres y Politicas de Poblacion (Foro), a network linking together almost 80 women’s groups throughout Mexico. In 1999, a group of researchers of the Foro began an assessment of trends in federal programs and spending regarding reproductive health, and found that there had been a downward trend. This research highlighted the inequities faced by different groups of women regarding their health requirements. Simultaneously a series of public

- 30 -
finance workshops for women leaders was launched by Equidad de Genero, Ciudadania, Trabajo Y Familia (Equidad). Pressure was building to integrate a gender perspective into public policy making. Federal and state committees on gender and equity were established to provide an opportunity for women to express their views and influence public policies. A gender equity provision was incorporated into anti-poverty programs. In 2000, Equidad and Fundar, a think tank involved in budget research to promote democracy, started a joint project on gender-sensitive budget analysis, operating at the federal level and in four states. It began by training and collaborating with Foro and others. It linked the technical skills of the research center with broad advocacy. At first, it focused on 21 government-funded anti-poverty programs and examined how these programs addressed the difficulties faced by women and whether women’s needs were covered and their capacities built. At the state level, the effort focused on establishing a more comprehensive anti-poverty program, including better access to health, education, and nutrition. These efforts continued, especially to increase understanding of the gender aspect of health issues for public officials and civil society. A handbook was developed which emphasized these points and was distributed to government officials. The strength of the initiative is perceived to lie in its combination of solid academic analysis and advocacy based on this research basis, thus emphasizing the importance developed in the earlier discussion of further developing the analytical basis for gender budgeting and placing it within an appropriate economic context, and then taking it forward. But it also points to the challenges in translating those academic exercises into practical results.
V. CONCLUSIONS
The Way Forward for Gender Budgeting Gender budgeting seeks to integrate gender considerations more fully into the government budget process, but it is not one uniform approach. Instead it is applied differently from one place to another. It can be a separate document presented with the budget or it can be integrated into departmental processes and program analysis. Externalities offer a strong justification for government intervention in the private economy. Gender inequalities may generate externalities and changes in public policies that take into account ways to reduce these externalities and can contribute to improving the efficiency and equity of public policies. Most often, gender budgeting is not couched in an explicitly theoretical framework, in part because of the difficulties in measuring the externalities from government activities, including spending programs. The gender budgeting literature has developed tools for integrating gender budgeting into the standard budget process. These tools rely on simplifications of the theoretical framework, but suggest the importance of evaluating the incidence of government expenditures and revenues. Gender budgeting should not, however, ignore the important next step, which is to evaluate the effect of the budget on well-being, including by considering the use of time as an important component contributing to household welfare.

- 31 -
Since the benefits of reducing gender inequalities may manifest themselves only over the medium term, it is essential to place gender budgeting in the medium term context of the budget, and to ensure that the budget is supported by an appropriate macroeconomic framework and projections. For international organizations, gender considerations have a role to play in focusing on the differential effect of government policies and programs on gender disparities. They may certainly have an influence on the scope and timing of fiscal adjustment needed to restore macroeconomic stability, as well as on the type of social safety nets put in place to cushion the most vulnerable against the harshest effects of fiscal austerity. The experience with gender budgeting suggests that even initiatives adopted with enthusiasm may fall by the wayside if the process appears to produce more added work than added value. Several important lessons can be learned from the experience so far. Gender budgeting should be incorporated into standard budget processes and fully institutionalized. It should not be seen as something to be done in addition to the standard budget process, though elements of it, such as an analysis of benefit or tax incidence, may require periodic special efforts. It should address specific and identifiable goals, such as reducing the inequality in educational attainment, that have clear benefits and that can be measured, even with somewhat crude tools and data. It should draw upon civil society for support and assistance in the more research-oriented aspects, and apply to subnational levels of government, where relevant. It should be comprehensive and include considerations of all aspects of the budget, not only spending, where it is most often applied. Gender budgeting should not as a rule set specific goals for spending on women-related objectives, unless budgets are severely constrained and such spending is well below what an unconstrained budget would otherwise choose, since this tends to introduce inflexibilities and hence inefficiencies in the budget process. Several existing models are producing useful results, including the work in some parts of the European Union, most notably the Nordic countries and some provinces in Spain, and many useful models can be drawn from past and ongoing experiences elsewhere, in both developed and developing countries. Implications This survey has examined and critically assessed the literature on gender budgeting. Based on measures of inequality in key economic, social, and political indicators, women continue to be disadvantaged relative to men; but in many areas, such as education, differences are narrowing. The concept of externalities underlies the arguments for including gender considerations in budget policies. Other arguments have a weaker economic basis but may be more socially or politically compelling. The experience with gender budgeting has been mixed so far and much work remains to ensure that gender budgeting exercises are productive and become institutionalized as a standard part of budgeting. There are several implications of this research. First, to become more useful as a budgeting tool, gender budgeting should be mixed into budget processes in a way that generates tangible improvements in policymaking and policy outcomes. International Monetary Fund surveillance, program, and technical assistance work should encourage fiscal authorities to take into account the potential external benefits of reducing gender inequalities and to removing arbitrary discrimination against women in fiscal legislation. Second, to enhance the

- 32 -
value of gender budgeting, additional research should focus measuring the differential incidence of fiscal policies by gender and on the benefits of reducing gender inequalities.

- 33 - A
PPEND
IX TA
BLES
Table 3. Gender Inequalities in Education and Health Status, 2001/02
School Enrollment, Primary School Enrollment, Secondary Life Expectancy at Birth, 2002 Ratio of Ratio of Ratio of Male Female females to Male Female females to Male Female females to ratio ratio males Ratio ratio males years years Males High human development Norway 102 102 1.00 94 95 1.01 76.5 81.5 1.07 Sweden 102 102 1.00 98 99 1.01 77.7 82.1 1.06 Australia 95 96 1.01 87 90 1.03 76.4 82.2 1.08 Canada 100 100 1.00 98 98 1.00 76.2 82.4 1.08 Netherlands 101 100 0.99 90 90 1.00 76.0 80.7 1.06 Belgium 101 101 1.00 ... ... ... 75.4 81.8 1.08 Iceland 101 101 1.00 81 85 1.05 77.5 82.1 1.06 United States 92 93 1.01 85 85 1.00 74.7 80.1 1.07 Japan 101 101 1.00 100 101 1.01 78.1 85.2 1.09 Ireland 94 95 1.01 80 85 1.07 74.1 79.8 1.08 Switzerland 100 99 0.99 90 85 0.95 77.4 83.3 1.08 United Kingdom 101 101 1.00 93 95 1.02 75.0 80.1 1.07 Finland 100 100 1.00 93 95 1.02 74.6 81.6 1.09 Austria 91 91 1.01 89 88 0.99 76.0 81.9 1.08 Luxembourg 96 96 1.00 76 83 1.09 74.7 81.1 1.09 France 100 100 1.00 91 93 1.02 75.5 83.0 1.10 Denmark 99 99 1.00 88 91 1.03 74.7 79.2 1.06 New Zealand 99 98 0.99 91 93 1.02 76.0 80.9 1.06 Germany 82 84 1.02 88 88 1.00 75.2 81.2 1.08 Spain 105 104 0.99 92 96 1.04 74.8 82.0 1.10 Italy 100 100 1.00 84 85 1.01 75.0 81.9 1.09 Israel 101 101 1.00 88 89 1.01 76.7 80.7 1.05 Hong Kong, China (SAR) 98 98 1.00 71 72 1.02 77.5 82.6 1.07 Greece 95 95 1.00 84 86 1.03 75.4 80.8 1.07 Singapore ... ... ... ... ... 76.4 80.4 1.05 Portugal ... ... ... 83 89 1.08 72.8 79.4 1.09 Slovenia 94 93 0.99 95 97 1.02 72.2 79.8 1.11 Korea, Rep. of 101 101 1.00 89 89 1.00 70.5 77.5 1.10 Barbados 103 103 1.00 87 86 0.99 72.5 77.5 1.07 Cyprus 94 95 1.01 87 89 1.02 75.8 80.5 1.06 Malta 97 98 1.01 79 80 1.01 75.9 81.0 1.07

- 34 - A
PPEND
IX TA
BLES
Table 3. Gender Inequalities in Education and Health Status, 2001/02 (cont.)
School Enrollment, Primary School Enrollment, Secondary Life Expectancy at Birth, 2002 Ratio of Ratio of Ratio of
Male Female females to Male Female females to Male Female females to ratio ratio males ratio Ratio males years years males High Human Development Czech Republic 88 88 1.00 89 90 1.01 71.7 78.5 1.09 Brunei Darussalam ... ... ... … ... ... 74.3 79.1 1.06 Argentina 108 108 1.00 78 83 1.06 70.9 77.9 1.10 Seychelles 107 106 0.99 96 101 1.05 69.1 77.0 1.11 Estonia 99 97 0.98 90 95 1.06 65.0 76.5 1.18 Poland 98 98 1.00 90 93 1.03 69.8 77.9 1.12 Hungary 91 90 0.99 92 92 1.00 68.3 76.6 1.12 Saint Kitts & Nevis 98 107 1.09 96 116 1.21 68.8 74.0 1.08 Bahrain 90 91 1.01 77 86 1.12 70.8 75.9 1.07 Lithuania 98 97 0.99 91 92 1.01 67.7 77.9 1.15 Slovakia 86 88 1.02 86 87 1.01 69.4 77.4 1.12 Chile 89 88 0.99 74 76 1.03 73.3 79.4 1.08 Kuwait 85 84 0.99 75 79 1.05 74.9 79.0 1.05 Costa Rica 89 91 1.02 48 53 1.11 75.0 80.4 1.07 Uruguay 89 90 1.01 69 76 1.11 70.7 78.6 1.11 Qatar 96 94 0.98 76 80 1.06 74.6 75.3 1.01 Croatia 90 88 0.98 85 87 1.03 69.7 78.1 1.12 United Arab Emirates 83 80 0.97 71 74 1.05 74.0 76.8 1.04 Latvia 91 90 0.99 88 89 1.01 65.1 76.0 1.17 Bahamas 86 88 1.03 78 79 1.01 65.5 74.1 1.13 Cuba 96 95 0.99 83 84 1.01 74.8 78.8 1.05 Mexico 101 102 1.01 59 61 1.03 70.7 76.7 1.08 Trinidad and Tobago 94 94 1.00 67 69 1.03 70.4 74.5 1.06 Antigua & Barbuda ... ... ... ... ... ... 72.5 78.2 1.08
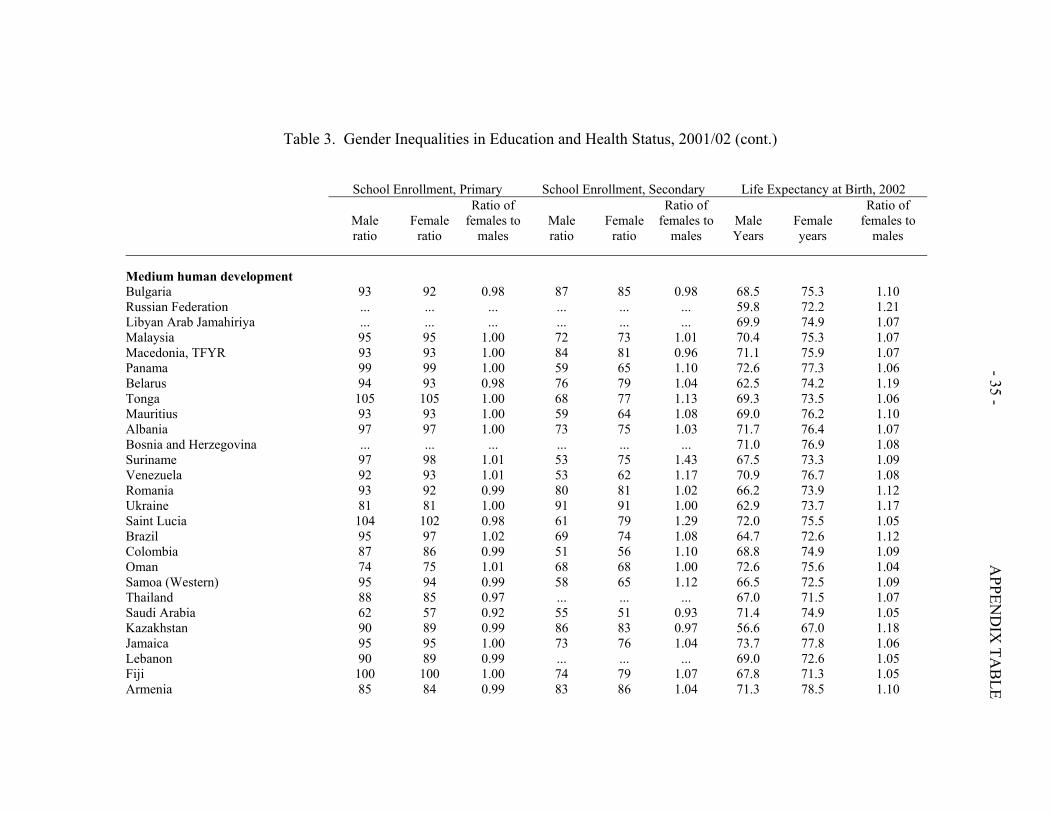
- 35 -
APPEN
DIX
TAB
LE
Table 3. Gender Inequalities in Education and Health Status, 2001/02 (cont.)
School Enrollment, Primary School Enrollment, Secondary Life Expectancy at Birth, 2002 Ratio of Ratio of Ratio of
Male Female females to Male Female females to Male Female females to ratio ratio males ratio ratio males Years years males Medium human development Bulgaria 93 92 0.98 87 85 0.98 68.5 75.3 1.10 Russian Federation ... ... ... ... ... ... 59.8 72.2 1.21 Libyan Arab Jamahiriya ... ... ... ... ... ... 69.9 74.9 1.07 Malaysia 95 95 1.00 72 73 1.01 70.4 75.3 1.07 Macedonia, TFYR 93 93 1.00 84 81 0.96 71.1 75.9 1.07 Panama 99 99 1.00 59 65 1.10 72.6 77.3 1.06 Belarus 94 93 0.98 76 79 1.04 62.5 74.2 1.19 Tonga 105 105 1.00 68 77 1.13 69.3 73.5 1.06 Mauritius 93 93 1.00 59 64 1.08 69.0 76.2 1.10 Albania 97 97 1.00 73 75 1.03 71.7 76.4 1.07 Bosnia and Herzegovina ... ... ... ... ... ... 71.0 76.9 1.08 Suriname 97 98 1.01 53 75 1.43 67.5 73.3 1.09 Venezuela 92 93 1.01 53 62 1.17 70.9 76.7 1.08 Romania 93 92 0.99 80 81 1.02 66.2 73.9 1.12 Ukraine 81 81 1.00 91 91 1.00 62.9 73.7 1.17 Saint Lucia 104 102 0.98 61 79 1.29 72.0 75.5 1.05 Brazil 95 97 1.02 69 74 1.08 64.7 72.6 1.12 Colombia 87 86 0.99 51 56 1.10 68.8 74.9 1.09 Oman 74 75 1.01 68 68 1.00 72.6 75.6 1.04 Samoa (Western) 95 94 0.99 58 65 1.12 66.5 72.5 1.09 Thailand 88 85 0.97 ... ... ... 67.0 71.5 1.07 Saudi Arabia 62 57 0.92 55 51 0.93 71.4 74.9 1.05 Kazakhstan 90 89 0.99 86 83 0.97 56.6 67.0 1.18 Jamaica 95 95 1.00 73 76 1.04 73.7 77.8 1.06 Lebanon 90 89 0.99 ... ... ... 69.0 72.6 1.05 Fiji 100 100 1.00 74 79 1.07 67.8 71.3 1.05 Armenia 85 84 0.99 83 86 1.04 71.3 78.5 1.10
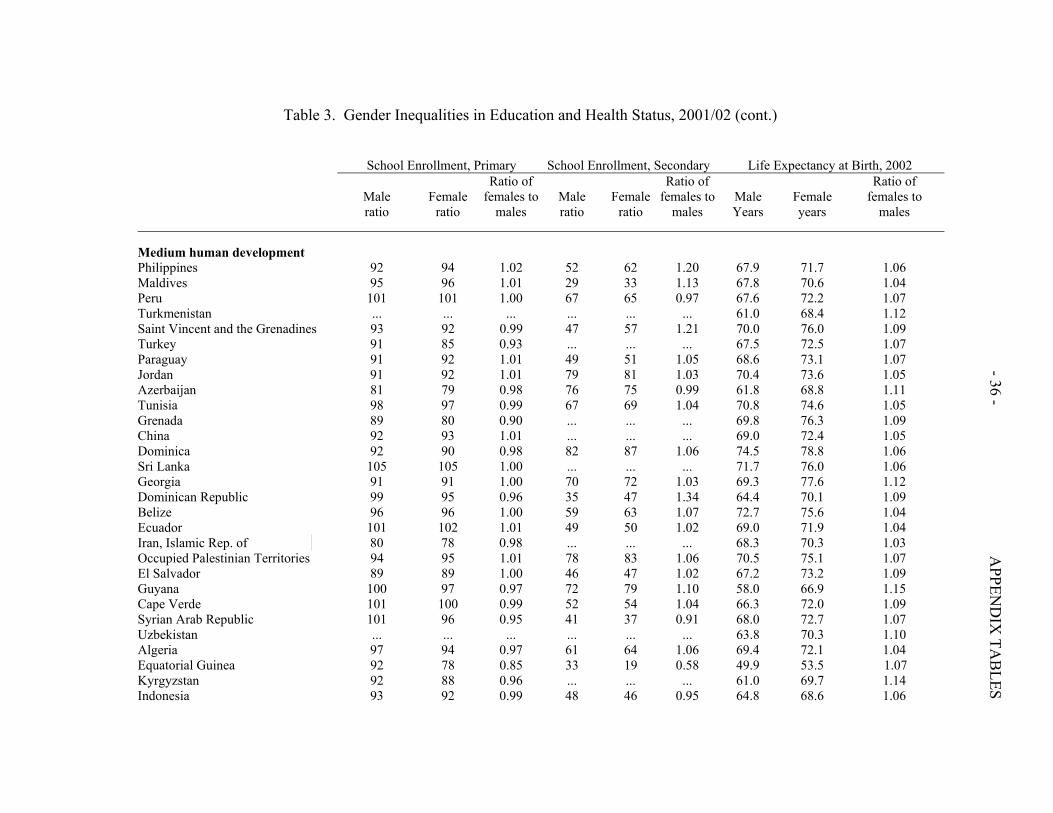
- 36 - A
PPEND
IX TA
BLES
Table 3. Gender Inequalities in Education and Health Status, 2001/02 (cont.)
School Enrollment, Primary School Enrollment, Secondary Life Expectancy at Birth, 2002 Ratio of Ratio of Ratio of Male Female females to Male Female females to Male Female females to ratio ratio males ratio ratio males Years years males Medium human development Philippines 92 94 1.02 52 62 1.20 67.9 71.7 1.06 Maldives 95 96 1.01 29 33 1.13 67.8 70.6 1.04 Peru 101 101 1.00 67 65 0.97 67.6 72.2 1.07 Turkmenistan ... ... ... ... ... ... 61.0 68.4 1.12 Saint Vincent and the Grenadines 93 92 0.99 47 57 1.21 70.0 76.0 1.09 Turkey 91 85 0.93 ... ... ... 67.5 72.5 1.07 Paraguay 91 92 1.01 49 51 1.05 68.6 73.1 1.07 Jordan 91 92 1.01 79 81 1.03 70.4 73.6 1.05 Azerbaijan 81 79 0.98 76 75 0.99 61.8 68.8 1.11 Tunisia 98 97 0.99 67 69 1.04 70.8 74.6 1.05 Grenada 89 80 0.90 ... ... ... 69.8 76.3 1.09 China 92 93 1.01 ... ... ... 69.0 72.4 1.05 Dominica 92 90 0.98 82 87 1.06 74.5 78.8 1.06 Sri Lanka 105 105 1.00 ... ... ... 71.7 76.0 1.06 Georgia 91 91 1.00 70 72 1.03 69.3 77.6 1.12 Dominican Republic 99 95 0.96 35 47 1.34 64.4 70.1 1.09 Belize 96 96 1.00 59 63 1.07 72.7 75.6 1.04 Ecuador 101 102 1.01 49 50 1.02 69.0 71.9 1.04 Iran, Islamic Rep. of 80 78 0.98 ... ... ... 68.3 70.3 1.03 Occupied Palestinian Territories 94 95 1.01 78 83 1.06 70.5 75.1 1.07 El Salvador 89 89 1.00 46 47 1.02 67.2 73.2 1.09 Guyana 100 97 0.97 72 79 1.10 58.0 66.9 1.15 Cape Verde 101 100 0.99 52 54 1.04 66.3 72.0 1.09 Syrian Arab Republic 101 96 0.95 41 37 0.91 68.0 72.7 1.07 Uzbekistan ... ... ... ... ... ... 63.8 70.3 1.10 Algeria 97 94 0.97 61 64 1.06 69.4 72.1 1.04 Equatorial Guinea 92 78 0.85 33 19 0.58 49.9 53.5 1.07 Kyrgyzstan 92 88 0.96 ... ... ... 61.0 69.7 1.14 Indonesia 93 92 0.99 48 46 0.95 64.8 68.6 1.06

- 37 -
APPEN
DIX
TAB
LES
Table 3. Gender Inequalities in Education and Health Status, 2001/02 (cont.)
School Enrollment, Primary School Enrollment, Secondary Life Expectancy at Birth, 2002 Ratio of Ratio of Ratio of
Male Female females to Male Female females to Male Female females to ratio ratio males ratio ratio males Years years males Medium human development Viet Nam 98 92 0.94 ... ... ... 67.3 72.2 1.07 Moldova, Rep. of 79 78 0.99 68 70 1.03 63.4 70.7 1.12 Bolivia 94 94 1.00 68 67 0.98 61.9 65.3 1.05 Honduras 86 88 1.02 ... ... ... 63.2 69.1 1.09 Tajikistan 107 102 0.95 86 72 0.84 63.7 69.6 1.09 Mongolia 86 88 1.03 66 78 1.19 63.9 67.1 1.05 Nicaragua 81 82 1.01 34 40 1.18 66.5 71.1 1.07 South Africa 89 90 1.01 58 65 1.11 45.5 47.5 1.04 Egypt 92 88 0.96 83 79 0.95 67.3 70.5 1.05 Guatemala 87 83 0.95 28 27 0.95 62.6 68.5 1.09 Gabon 79 78 0.99 ... ... ... 51.6 54.3 1.05 São Tomé and Principe 102 96 0.94 ... ... ... 63.2 68.5 1.08 Solomon Islands ... ... ... ... ... ... 67.9 70.7 1.04 Morocco 91 85 0.93 34 28 0.83 66.4 70.4 1.06 Namibia 77 81 1.06 32 44 1.36 41.7 41.3 0.99 India 92 76 0.83 ... ... ... 62.6 64.2 1.03 Botswana 80 83 1.04 52 59 1.15 38.3 37.9 0.99 Vanuatu 92 94 1.02 28 28 1.01 67.0 70.1 1.05 Cambodia 89 83 0.93 25 15 0.60 52.6 55.5 1.06 Ghana 62 59 0.96 35 30 0.87 54.3 55.6 1.02 Myanmar 82 82 1.00 36 34 0.94 54.7 59.8 1.09 Papua New Guinea 82 73 0.89 25 20 0.80 56.4 58.1 1.03 Bhutan ... ... ... ... ... ... 62.0 64.5 1.04 Lao People's Dem. Rep. 86 79 0.92 35 28 0.81 53.3 55.8 1.05 Comoros 60 50 0.84 ... ... ... 60.1 62.7 1.04 Swaziland 76 77 1.01 29 35 1.21 43.5 44.0 1.01 Bangladesh 86 88 1.02 42 46 1.10 61.5 62.7 1.02 Sudan 51 42 0.83 ... ... ... 57.0 59.8 1.05 Nepal 75 66 0.88 ... ... ... 60.1 59.6 0.99 Cameroon ... ... ... ... ... ... 47.5 49.4 1.04
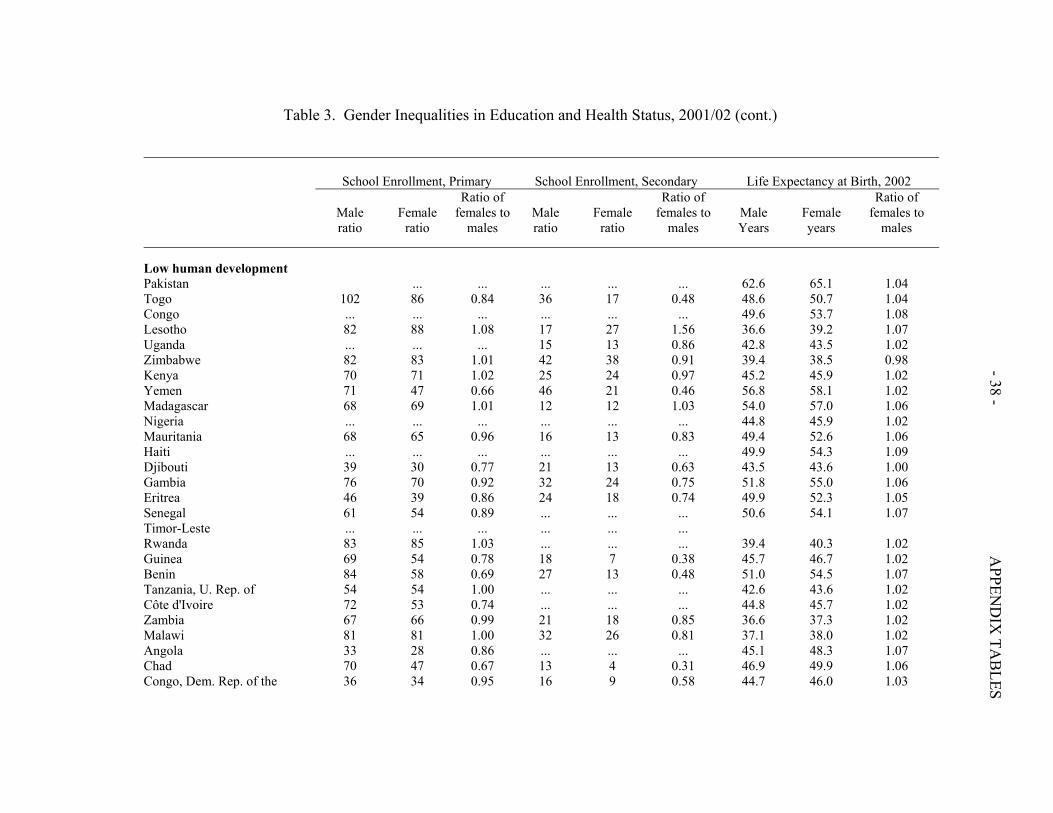
- 38 -
APPEN
DIX
TAB
LES
Table 3. Gender Inequalities in Education and Health Status, 2001/02 (cont.)
School Enrollment, Primary School Enrollment, Secondary Life Expectancy at Birth, 2002 Ratio of Ratio of Ratio of Male Female females to Male Female females to Male Female females to ratio ratio males ratio ratio males Years years males Low human development Pakistan ... ... ... ... ... 62.6 65.1 1.04 Togo 102 86 0.84 36 17 0.48 48.6 50.7 1.04 Congo ... ... ... ... ... ... 49.6 53.7 1.08 Lesotho 82 88 1.08 17 27 1.56 36.6 39.2 1.07 Uganda ... ... ... 15 13 0.86 42.8 43.5 1.02 Zimbabwe 82 83 1.01 42 38 0.91 39.4 38.5 0.98 Kenya 70 71 1.02 25 24 0.97 45.2 45.9 1.02 Yemen 71 47 0.66 46 21 0.46 56.8 58.1 1.02 Madagascar 68 69 1.01 12 12 1.03 54.0 57.0 1.06 Nigeria ... ... ... ... ... ... 44.8 45.9 1.02 Mauritania 68 65 0.96 16 13 0.83 49.4 52.6 1.06 Haiti ... ... ... ... ... ... 49.9 54.3 1.09 Djibouti 39 30 0.77 21 13 0.63 43.5 43.6 1.00 Gambia 76 70 0.92 32 24 0.75 51.8 55.0 1.06 Eritrea 46 39 0.86 24 18 0.74 49.9 52.3 1.05 Senegal 61 54 0.89 ... ... ... 50.6 54.1 1.07 Timor-Leste ... ... ... ... ... ... Rwanda 83 85 1.03 ... ... ... 39.4 40.3 1.02 Guinea 69 54 0.78 18 7 0.38 45.7 46.7 1.02 Benin 84 58 0.69 27 13 0.48 51.0 54.5 1.07 Tanzania, U. Rep. of 54 54 1.00 ... ... ... 42.6 43.6 1.02 Côte d'Ivoire 72 53 0.74 ... ... ... 44.8 45.7 1.02 Zambia 67 66 0.99 21 18 0.85 36.6 37.3 1.02 Malawi 81 81 1.00 32 26 0.81 37.1 38.0 1.02 Angola 33 28 0.86 ... ... ... 45.1 48.3 1.07 Chad 70 47 0.67 13 4 0.31 46.9 49.9 1.06 Congo, Dem. Rep. of the 36 34 0.95 16 9 0.58 44.7 46.0 1.03
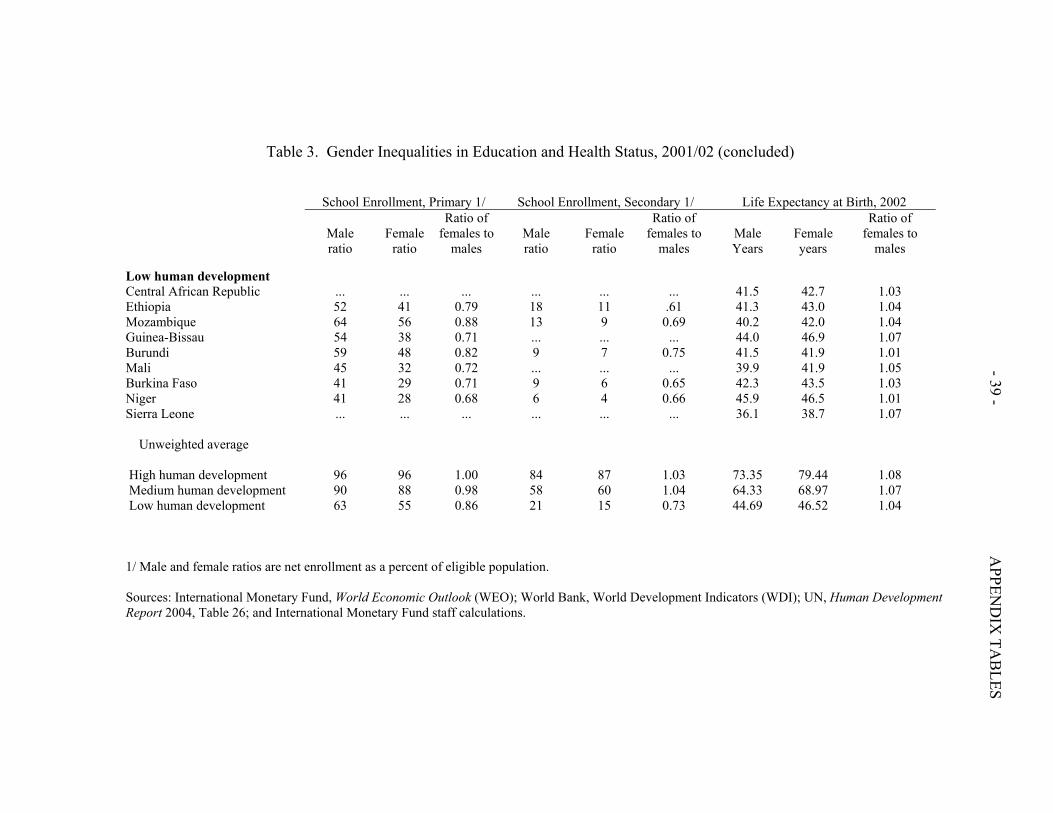
- 39 -
APPEN
DIX
TAB
LES
Table 3. Gender Inequalities in Education and Health Status, 2001/02 (concluded)
School Enrollment, Primary 1/ School Enrollment, Secondary 1/ Life Expectancy at Birth, 2002 Ratio of Ratio of Ratio of Male Female females to Male Female females to Male Female females to ratio ratio males ratio ratio males Years years males Low human development Central African Republic ... ... ... ... ... ... 41.5 42.7 1.03 Ethiopia 52 41 0.79 18 11 .61 41.3 43.0 1.04 Mozambique 64 56 0.88 13 9 0.69 40.2 42.0 1.04 Guinea-Bissau 54 38 0.71 ... ... ... 44.0 46.9 1.07 Burundi 59 48 0.82 9 7 0.75 41.5 41.9 1.01 Mali 45 32 0.72 ... ... ... 39.9 41.9 1.05 Burkina Faso 41 29 0.71 9 6 0.65 42.3 43.5 1.03 Niger 41 28 0.68 6 4 0.66 45.9 46.5 1.01 Sierra Leone ... ... ... ... ... ... 36.1 38.7 1.07 Unweighted average High human development 96 96 1.00 84 87 1.03 73.35 79.44 1.08 Medium human development 90 88 0.98 58 60 1.04 64.33 68.97 1.07 Low human development 63 55 0.86 21 15 0.73 44.69 46.52 1.04 1/ Male and female ratios are net enrollment as a percent of eligible population. Sources: International Monetary Fund, World Economic Outlook (WEO); World Bank, World Development Indicators (WDI); UN, Human Development Report 2004, Table 26; and International Monetary Fund staff calculations.

- 40 - APPENDIX TABLES
Table 4. High Human Development and Gender Equity Indexes, 2002
Human Gender-Related Gender Development Development Empowerment Index (HDI) Index (GDI) Measure (GEM) Norway 0.956 0.955 0.908 Sweden 0.946 0.946 0.854 Australia 0.946 0.945 0.806 Canada 0.943 0.941 0.787 Netherlands 0.942 0.938 0.817 Belgium 0.942 0.938 0.808 Iceland 0.941 0.938 0.816 United States 0.939 0.936 0.769 Japan 0.938 0.932 0.531 Ireland 0.936 0.929 0.71 Switzerland 0.936 0.932 0.771 United Kingdom 0.936 0.934 0.698 Finland 0.935 0.933 0.82 Austria 0.934 0.924 0.77 Luxembourg 0.933 0.926 ... France 0.932 0.929 ... Denmark 0.932 0.931 0.847 New Zealand 0.926 0.924 0.772 Germany 0.925 0.921 0.804 Spain 0.922 0.916 0.716 Italy 0.920 0.914 0.583 Israel 0.908 0.906 0.614 Hong Kong, China (SAR) 0.903 0.898 ... Greece 0.902 0.894 0.523 Singapore 0.902 0.884 0.648 Portugal 0.897 0.894 0.644 Slovenia 0.895 0.892 0.584 Korea, Rep. of 0.888 0.882 0.377 Barbados 0.888 0.884 0.634 Cyprus 0.883 0.875 0.497 Malta 0.875 0.866 0.48 Czech Republic 0.868 0.865 0.586 Brunei Darussalam 0.867 .. ... Argentina 0.853 0.841 0.645 Seychelles 0.853 ... ... Estonia 0.853 0.852 0.592 Poland 0.850 0.848 0.606 Hungary 0.848 0.847 0.529 Saint Kitts and Nevis 0.844 ... ...
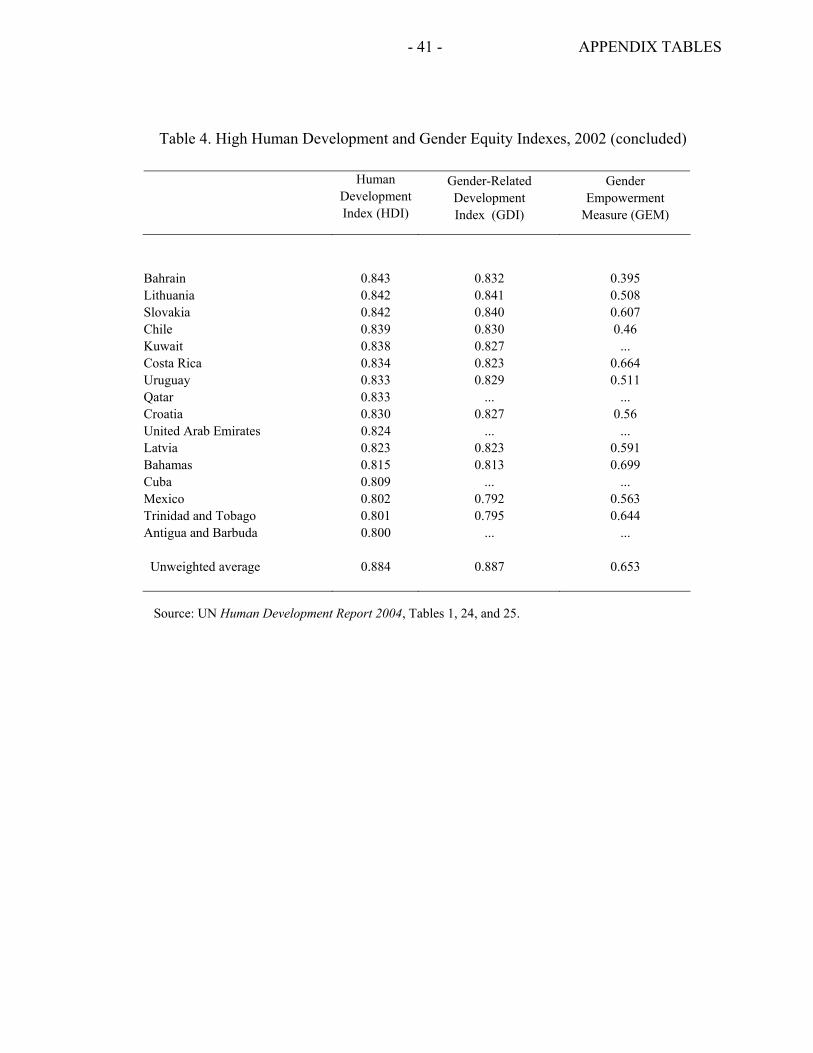
- 41 - APPENDIX TABLES
Table 4. High Human Development and Gender Equity Indexes, 2002 (concluded)
Human Gender-Related Gender Development Development Empowerment Index (HDI) Index (GDI) Measure (GEM)
Bahrain 0.843 0.832 0.395 Lithuania 0.842 0.841 0.508 Slovakia 0.842 0.840 0.607 Chile 0.839 0.830 0.46 Kuwait 0.838 0.827 ... Costa Rica 0.834 0.823 0.664 Uruguay 0.833 0.829 0.511 Qatar 0.833 ... ... Croatia 0.830 0.827 0.56 United Arab Emirates 0.824 ... ... Latvia 0.823 0.823 0.591 Bahamas 0.815 0.813 0.699 Cuba 0.809 ... ... Mexico 0.802 0.792 0.563 Trinidad and Tobago 0.801 0.795 0.644 Antigua and Barbuda 0.800 ... ... Unweighted average 0.884 0.887 0.653
Source: UN Human Development Report 2004, Tables 1, 24, and 25.

- 42 - APPENDIX TABLES
Table 5. Medium Human Development and Gender Equity Indexes, 2002 Human Gender-Related Gender Development Development Empowerment Index (HDI) Index (GDI) Measure (GEM) Bulgaria 0.796 0.795 ... Russian Federation 0.795 0.794 0.467 Libyan Arab Jamahiriya 0.794 ... ... Malaysia 0.793 0.786 0.519 Macedonia, TFYR 0.793 ... 0.517 Panama 0.791 0.785 0.486 Belarus 0.79 0.789 ... Tonga 0.787 ... ... Mauritius 0.785 0.775 ... Albania 0.781 0.778 ... Bosnia and Herzegovina 0.781 ... ... Suriname 0.78 ... ... Venezuela 0.778 0.77 0.444 Romania 0.778 0.775 0.465 Ukraine 0.777 0.773 0.411 Saint Lucia 0.777 ... ... Brazil 0.775 0.768 ... Colombia 0.773 0.77 0.498 Oman 0.77 0.747 ... Samoa (Western) 0.769 ... ... Thailand 0.768 0.766 0.461 Saudi Arabia 0.768 0.739 0.207 Kazakhstan 0.766 0.761 ... Jamaica 0.764 0.762 ... Lebanon 0.758 0.755 ... Fiji 0.758 0.747 0.335 Armenia 0.754 0.752 ... Philippines 0.753 0.751 0.542 Maldives 0.752 ... ... Peru 0.752 0.736 0.524 Turkmenistan 0.752 0.748 ... Saint Vincent and the Grenadines 0.751 ... ... Turkey 0.751 0.746 0.29 Paraguay 0.751 0.736 0.417 Jordan 0.75 0.734 ... Azerbaijan 0.746 ... ... Tunisia 0.745 0.734 ... Grenada 0.745 ... ... China 0.745 0.741 ... Dominica 0.743 ... ...
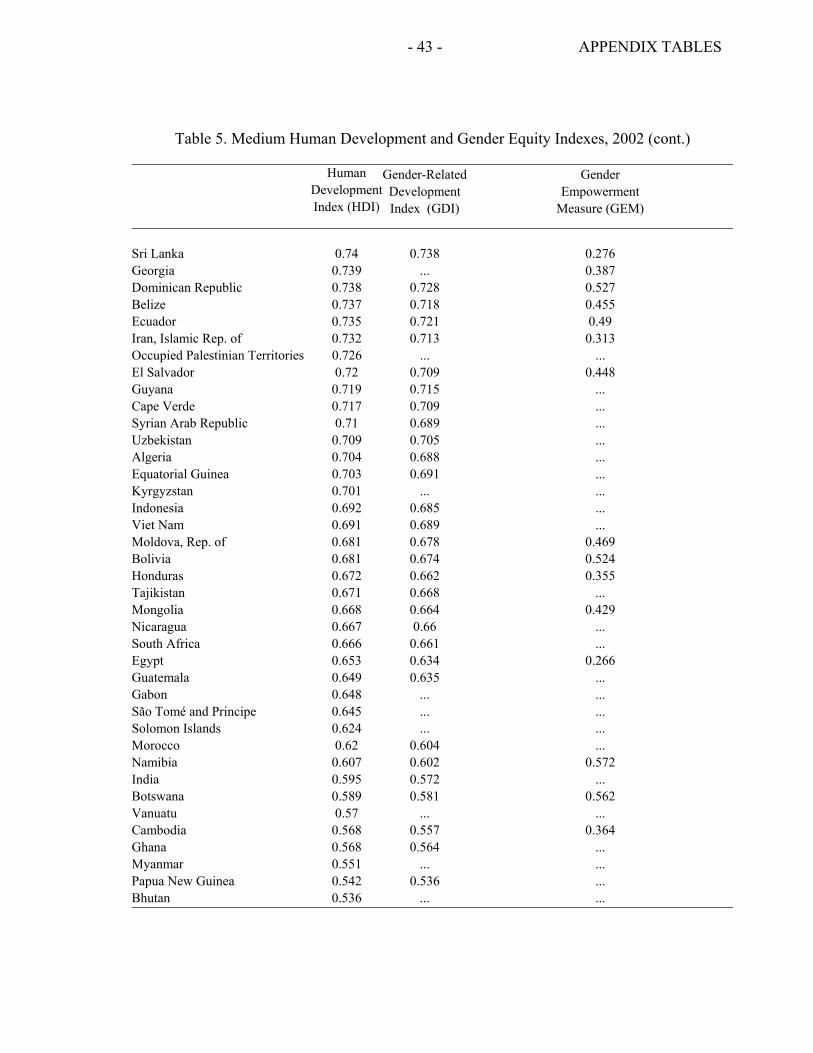
- 43 - APPENDIX TABLES
Table 5. Medium Human Development and Gender Equity Indexes, 2002 (cont.) Human Gender-Related Gender Development Development Empowerment Index (HDI) Index (GDI) Measure (GEM) Sri Lanka 0.74 0.738 0.276 Georgia 0.739 ... 0.387 Dominican Republic 0.738 0.728 0.527 Belize 0.737 0.718 0.455 Ecuador 0.735 0.721 0.49 Iran, Islamic Rep. of 0.732 0.713 0.313 Occupied Palestinian Territories 0.726 ... ... El Salvador 0.72 0.709 0.448 Guyana 0.719 0.715 ... Cape Verde 0.717 0.709 ... Syrian Arab Republic 0.71 0.689 ... Uzbekistan 0.709 0.705 ... Algeria 0.704 0.688 ... Equatorial Guinea 0.703 0.691 ... Kyrgyzstan 0.701 ... ... Indonesia 0.692 0.685 ... Viet Nam 0.691 0.689 ... Moldova, Rep. of 0.681 0.678 0.469 Bolivia 0.681 0.674 0.524 Honduras 0.672 0.662 0.355 Tajikistan 0.671 0.668 ... Mongolia 0.668 0.664 0.429 Nicaragua 0.667 0.66 ... South Africa 0.666 0.661 ... Egypt 0.653 0.634 0.266 Guatemala 0.649 0.635 ... Gabon 0.648 ... ... São Tomé and Principe 0.645 ... ... Solomon Islands 0.624 ... ... Morocco 0.62 0.604 ... Namibia 0.607 0.602 0.572 India 0.595 0.572 ... Botswana 0.589 0.581 0.562 Vanuatu 0.57 ... ... Cambodia 0.568 0.557 0.364 Ghana 0.568 0.564 ... Myanmar 0.551 ... ... Papua New Guinea 0.542 0.536 ... Bhutan 0.536 ... ...
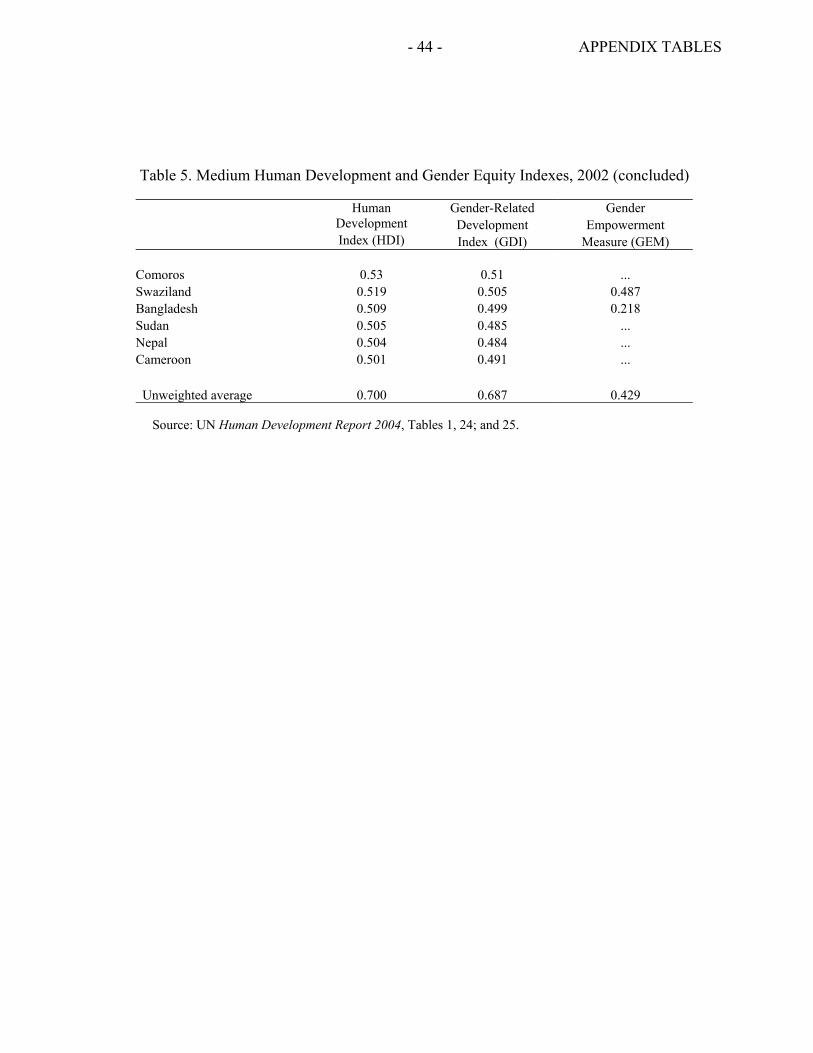
- 44 - APPENDIX TABLES
Table 5. Medium Human Development and Gender Equity Indexes, 2002 (concluded)
Human Gender-Related Gender Development Development Empowerment Index (HDI) Index (GDI) Measure (GEM) Comoros 0.53 0.51 ... Swaziland 0.519 0.505 0.487 Bangladesh 0.509 0.499 0.218 Sudan 0.505 0.485 ... Nepal 0.504 0.484 ... Cameroon 0.501 0.491 ... Unweighted average 0.700 0.687 0.429 Source: UN Human Development Report 2004, Tables 1, 24; and 25.

- 45 - APPENDIX TABLES
Table 6. Low Human Development and Gender Equity Indexes, 2002
Human Gender-Related Gender Development Development Empowerment Index (HDI) Index (GDI) Measure (GEM) Pakistan 0.497 0.471 0.416 Togo 0.495 0.477 ... Congo 0.494 0.488 ... Lesotho 0.493 0.483 ... Uganda 0.493 0.487 ... Zimbabwe 0.491 0.482 ... Kenya 0.488 0.486 ... Yemen 0.482 0.436 0.123 Madagascar 0.469 0.462 ... Nigeria 0.466 0.458 ... Mauritania 0.465 0.456 ... Haiti 0.463 0.458 ... Djibouti 0.454 ... ... Gambia 0.452 0.446 ... Eritrea 0.439 0.431 ... Senegal 0.437 0.429 ... Timor-Leste 0.436 ... ... Rwanda 0.431 0.423 ... Guinea 0.425 ... ... Benin 0.421 0.406 ... Tanzania, U. Rep. of 0.407 0.401 ... Côte d'Ivoire 0.399 0.379 ... Zambia 0.389 0.375 ... Malawi 0.388 0.374 ... Angola 0.381 ... ... Chad 0.379 0.368 ... Congo, Dem. Rep. of the 0.365 0.355 ... Central African Republic 0.361 0.345 ... Ethiopia 0.359 0.346 ... Mozambique 0.354 0.339 ... Guinea-Bissau 0.35 0.329 ... Burundi 0.339 0.337 ... Mali 0.326 0.309 ... Burkina Faso 0.302 0.291 ... Niger 0.292 0.278 ... Sierra Leone 0.273 ... ... Unweighted average 0.415 0.407 0.270
Source: UN Human Development Report 2004, Tables 1, 24; and 25.
- 46 -
REFERENCES Anand, Sudhir, and Amartya Sen, 1995, “Gender Inequality and Human Development:
Theories and Measurement,” background papers for Human Development Report 1995 (New York: UN Human Development Report Office).
Apps, Patricia, and Ray Rees, 1999, “On the Taxation of Trade within and between
Households,” Journal of Public Economics, Vol. 73, pp. 241–63. Bardhan, Kalpana, and Stephan Klasen, 1999, “UNDP’s Gender-Related Indices: A
Critical Review,” World Development, Vol. 27, No. 6, pp. 985–1010. Barnett, Kathleen, and Caren Grown, 2004, Gender Impacts of Government Revenue
Collection: The Case of Taxation, Economic Paper 62 (London: Commonwealth Secretariat).
Beck, Tony, 1999, Using Gender-Sensitive Indicators: A Reference Manual for
Governments and Other Stakeholders (London: Commonwealth Secretariat). Budlender, Debbie, and Rhonda Sharp, with Kerri Allen, 1998, How to do a Gender-
Sensitive Budget Analysis: Contemporary Research and Analysis (Commonwealth Secretariat and the Australian Agency for International Development).
Budlender, Debbie, 2002, “A Global Assessment of Gender Responsive Budget
Initiatives,” in Gender Budgets Make More Cents: Country Studies and Good Practice, ed. by Debbie Budlender and Guy Hewitt (London: Commonwealth Secretariat), pp. 83–130.
Budlender, Debbie, and Guy Hewitt, eds., 2002, Gender Budgets Make More Cents:
Country Studies and Good Practice (London: Commonwealth Secretariat). Budlender, Debbie, Diane Elson, Guy Hewitt, and Tanni Mukhopadhyay, 2002, Gender
Budgets Make Cents: Understanding Gender-Responsive Budgets (London: Commonwealth Secretariat).
Budlender, Debbie, and Guy Hewitt, 2003, Engendering Budgets: A Practitioners’ Guide
to Understanding and Implementing Gender-Responsive Budgets (London: Commonwealth Secretariat).
Buvinic, Mayra, and Geeta Rao Gupta, 1997, “Female-headed Households and Female
Maintained Familes: Are They Worth Targeting to Reduce Poverty in Developing Countries?” Economic Development and Cultural Change, Vol. 45, No. 2, pp. 259–80.

- 47 -
Chen, Shaohua, and Martin Ravallion, 2004, “How Have the World’s Poorest Fared
Since the Early 1980s?” Policy Research Working Paper 3341 (Washington: World Bank).
Daniels, Reza C. and the Southern Africa Labour and Development Research Unit, 2005,
“Gender Dimensions of the Incidence of Tariff Liberalization” (Washington: United States Agency for International Development).
Davoodi, Hamid R., Erwin R. Tiongson, and Sawitree S. Asawanuchit, 2003, “How
Useful Are Benefit Incidence Analyses of Public Education and Health Spending?” International Monetary Fund Working Paper 03/227 (Washington: International Monetary Fund).
Demery, Lionel, 2000, Benefit Incidence: A Practitioner’s Guide (Washington: World
Bank). Demery, Lionel, 2003, “Analyzing the Incidence of Public Spending,” in The Impact of
Economic Policies on Poverty and Income Distribution: Evaluation Techniques and Tools, ed. by Francois Bourguignon and Luiz A. Pereira da Silva (New York, NY: World Bank and Oxford University Press), pp. 41–68.
Demery, Lionel, Shiyan Chao, Rene Bernier, and Kalpana Mehra, 1995, “The Incidence
of Social Spending in Ghana,” Poverty and Social Policy Discussion Paper No. 82 (Washington: World Bank).
Dijkstra, A. Geske, and Lucia C. Hanmer, 2000, “Measuring Socio-Economic Gender
Inequality: Toward an Alternative to the UNDP Gender-Related Development Index,” Feminist Economics, Vol. 6, No. 2, pp. 41–75.
Elson, Diane, 2002, “Integrating Gender into Government Budgets within a Context of
Economic Reform,” in Gender Budgets Make Cents: Understanding Gender-Responsive Budgets, ed. by Debbie Budlender, Diane Elson, Guy Hewitt, and Tanni Mukhopadhyay (London: Commonwealth Secretariat), pp. 23–47.
European Economic and Social Committee, 2005, Opinion of the European Economic
and Social Committee on Beijing+10: Progress in Gender Equality, Brussels, February 9, REX/192-CESE 128/2005.
Feenberg, Daniel R., and Harvey S. Rosen, 1995, “Recent Developments in the Marriage Tax,” National Tax Journal, Vol. 48, No. 1, pp. 91–101.
Filmer, Deon, 1999, “The Structure of Social Disparities in Education: Gender and
Wealth,” Background paper for Engendering Development (Washington: World Bank).
- 48 -
Gertler, Paul, and Jacques van der Gaag, 1990, The Willingness to Pay for Medical Care:
Evidence from Two Developing Countries (Baltimore: Johns Hopkins University Press).
Gertler, Paul, and Paul Glewwe, 1990, “The Willingness to Pay for Education in
Developing Countries: Evidence from Rural Peru,” Journal of Public Economics, Vol. 42, No. 3, pp. 251–75.
Glick, Peter, Rumki Saha, and Stephen D. Younger, 2004, Integrating Gender into
Benefit Incidence and Demand Analysis,” Cornell University Food and Nutrition Policy Program (unpublished).
Goldman, Tanya, 2000, “Customs and Excise Paper,” IDASA Women’s Budget Series,
Community Agency for Social Enquiry and the Parliamentary Committee on the Quality of Life and Status of Women.
Hedman, Birgitta, Francesca Perucci, and Pehr Sundstrom, 1996, Engendering Statistics:
A Tool for Change (Stockholm: Statistics Sweden). Hillman, Arye, and Eva Jenkner, 2004, Educating Children in Poor Countries, Economic
Issues 33 (Washington: International Monetary Fund). Hofbauer, Helena, 2002, “Mexico: Collaborating with a Wide Range of Actors,” in
Gender Budgets Make More Cents: Country Studies and Good Practice, ed. by Debbie Budlender and Guy Hewitt (London: Commonwealth Secretariat), pp. 84–97.
International Monetary Fund, 2005, World Economic Outlook (Washington: International
Monetary Fund). Klasen, Stephan, 1994, “‘Missing Women’ Reconsidered,” World Development, Vol. 22,
No. 7, pp. 1061–71. Lahiri, Ashok K., Lekha S. Chakraborty, and P.N. Bhattacharyya in association with
Hiranya Mukhopadhyay and Anuradha Bhasin, 2002, “Gender Budgeting in India,” National Institute of Public Finance and Policy, New Delhi.
Lipton, Michael, and Martin Ravallion, 1995, “Poverty and Policy,” in Handbook of
Development Economics, Vol. 3B, ed. by Jere Behrman and T.N. Srinivasan (Amsterdam: Elsevier Science), pp. 2551–2657.
Meerman, Jacob, 1979, Public Expenditure in Malaysia: Who Benefits and Why? (New
York: Oxford University Press).
- 49 -
Morrisson, Christian, and Johannes P. Jutting, 2005, “Women’s Discrimination in Developing Countries: A New Data Set for Better Policies,” World Development, Vol. 33, No. 7, pp. 1065–81.
Nanda, Priya, 2002, “Gender Dimensions of User Fees: Implications for Women’s
Utilization of Health Care,” Reproductive Health Matters, Vol. 10, No. 20, pp. 127–34.
Palmer, Ingrid, 1995, “Public Finance From a Gender Perspective,” World Development,
Vol. 23, No. 11, pp. 1981–86. Quisumbing, Agnes R., Lawrence Haddad, and Christine Pena, 2001, “Are Women
Overrepresented Among the Poor? An Analysis of Poverty in 10 Developing Countries,” Journal of Development Economics, Vol. 66, pp. 225–69.
Sahn, David E., and Stephen D. Younger, 2000, “Expenditure Incidence in Africa:
Microeconomic Evidence,” Fiscal Studies, Vol. 21, No. 3, pp. 329–47. Sahn David E., and Stephen D. Younger, 2003, “Estimating the Incidence of Indirect
Taxes in Developing Countries,” in The Impact of Economic Policies on Poverty and Income Distribution: Evaluation Techniques and Tools, ed. by Francois Bourguignon and Luiz A. Pereira da Silva (New York: World Bank and Oxford University Press), pp. 27–40.
Sarraf, Feridoun, 2003, “Gender-Responsive Government Budgeting,” International
Monetary Fund Working Paper 03/83 (Washington: International Monetary Fund).
Sawer, Marian, 2002, “Australia: The Mandarin Approach to Gender Budgets,” in
Gender Budgets Make More Cents: Country Studies and Good Practice, ed. by Debbie Budlender and Guy Hewitt (London: Commonwealth Secretariat), pp. 43–64.
Schmitz, Catharina, 2005, “Gender Responsive Budgeting in the Nordic Countries,”
Nordic Council of Ministers (unpublished). Selowsky, Marcel, 1979, Who Benefits from Public Expenditure (New York: Oxford
University Press). Sen, Amartya, 1989, “Women’s Survival as a Development Problem,” Bulletin of the
American Academy of Arts and Sciences, Vol. 43, pp. 14–29. Sen, Gita, 2000, “Gender Mainstreaming in Finance Ministries,” World Development,
Vol. 28, No. 7, pp. 1379–90.

- 50 -
Sharp, Rhonda, 2003, “Budgeting for Equity: Gender Budget Initiatives within a Framework of Performance Oriented Budgeting,” UNIFEM.
Sharp, Rhonda, and Ray Broomhill, 1990, “Women and Government Budgets,”
Australian Journal of Social Issues, Vol. 25, No. 1, pp. 1–14. Sharp, Rhonda, and Ray Broomhill, 2002, “Budgeting for Equality: The Australian
Experience,” Feminist Economics, Vol. 8, No. 1, pp. 25–47. Smith, Terence, 2000, “Women and Tax in South Africa,” IDASA Women’s Budget
Series, Community Agency for Social Enquiry and the Parliamentary Committee on the Quality of Life and Status of Women.
Standing, Guy, 1999, “Global Feminization Through Flexible Labor: A Theme
Revisited,” World Development, Vol. 27, No. 3, pp. 583–602. Stotsky, Janet G., 1997, “Gender Bias in Tax Systems,” Tax Notes International (June 9),
pp. 1913–23. Stotsky, Janet G., 2005, “Sesgos de Genero en los Sistemas Tributarios,” (Gender Bias in
Tax Systems) in Politica Fiscal y Genero, ed. by Maria Pazos Moran (Madrid: Instituto de Estudios Fiscales), pp. 41–62.
Stotsky, Janet G., forthcoming, “Gender and its Relevance to Macroeconomic Policy,”
International Monetary Fund Working Paper (Washington: International Monetary Fund).
Thurow, Lester C., 1971, “The Income Distribution as a Pure Public Good,” Quarterly
Journal of Economics, Vol. 85, No. 2, pp. 327–36. United Nations, 1995, Human Development Report 1995 (New York: Oxford University
Press). United Nations, 2004, Human Development Report 2004 (New York: Oxford University
Press). World Bank, 2001, Engendering Development: Through Gender Equality in Rights,
Resources, and Voice (New York: Oxford University Press). World Bank, 2005, World Development Indicators (Washington: World Bank). Younger, Stephen D., 1999, “The Relative Progressivity of Social Services in Ecuador,”
Public Finance Review, Vol. 27, no. 3, pp. 310–52.