gender earnings ratio/gap 2002 weekly earnings ratio: =.77 “women earn 77% as much as men”...
TRANSCRIPT

Gender earnings ratio/gap
• 2002 weekly earnings ratio:= .77• “women earn 77% as much as men”• “women earn 77 cents to men’s dollar”
• 2002 weekly earnings gap= .23• “gender wage gap of 23 cents”
note
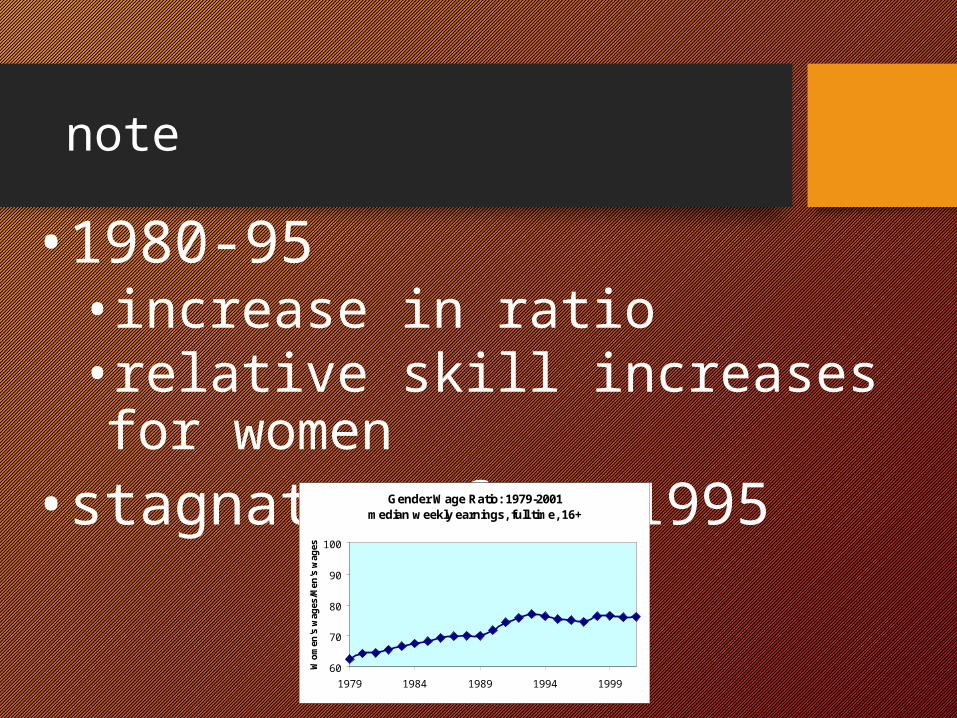
•1980-95• increase in ratio•relative skill increases for women
•stagnates after 1995Gender Wage Ratio: 1979-2001median weekly earnings, full time, 16+
60
70
80
90
100
1979 1984 1989 1994 1999
Wo
men
's w
ages
/Men
's w
ages
why a gap in earnings?
•different skills between men and women?•by choice or constraint?
•different return to the same skills?• labor market discrimination
Earnings ratio varies
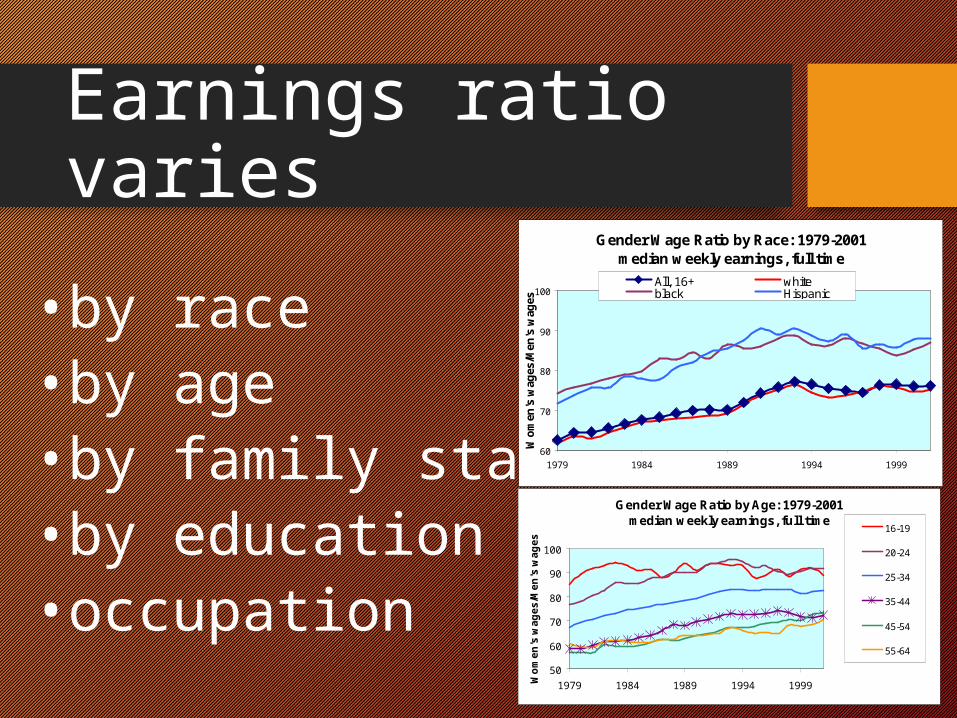
•by race•by age•by family status•by education•occupation
Gender Wage Ratio by Race: 1979-2001median weekly earnings, full time
60
70
80
90
100
1979 1984 1989 1994 1999
Wo
men
's w
ages
/Men
's w
ages
All, 16+ whiteblack Hispanic
Gender Wage Ratio by Age: 1979-2001median weekly earnings, full time
50
60
70
80
90
100
1979 1984 1989 1994 1999Wo
me
n's
wa
ge
s/M
en
's w
ag
es
16-19
20-24
25-34
35-44
45-54
55-64

Gender Wage Ratio by Age: 1979-2001median weekly earnings, full time
50
60
70
80
90
100
1979 1984 1989 1994 1999Wo
me
n's
wa
ge
s/M
en
's w
ag
es
16-19
20-24
25-34
35-44
45-54
55-64

age cohorts
•each generation is faring better in the labor market
•BUT•women lose ground in their 20s and 30s
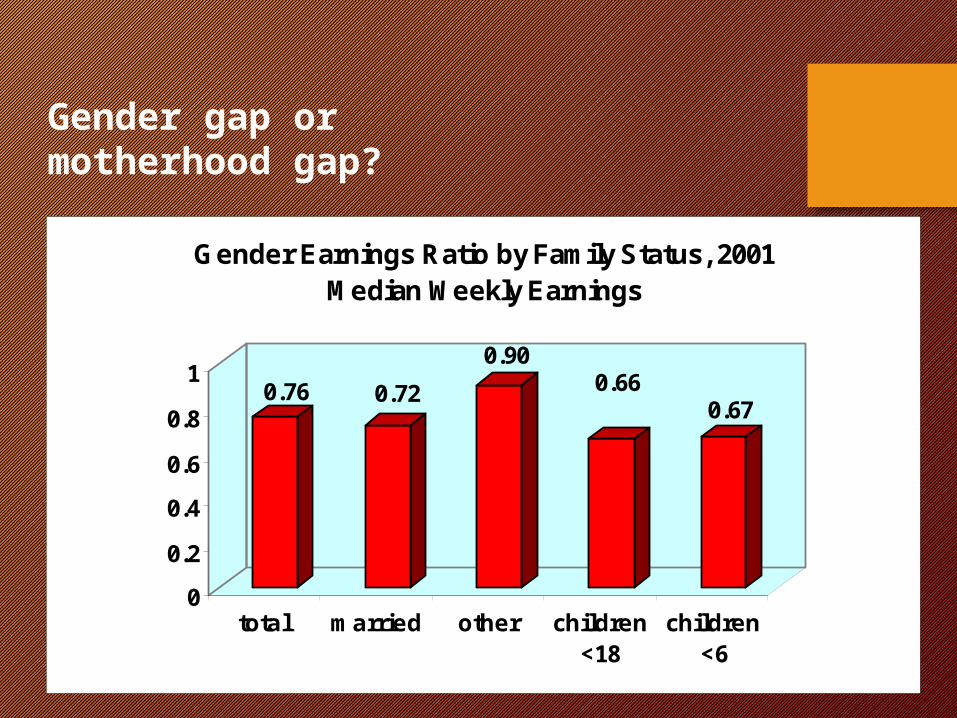
0.76 0.72
0.900.66
0.67
0
0.2
0.4
0.6
0.8
1
total married other children<18
children<6
Gender Earnings Ratio by Family Status, 2001Median Weekly Earnings
Gender gap or motherhood gap?
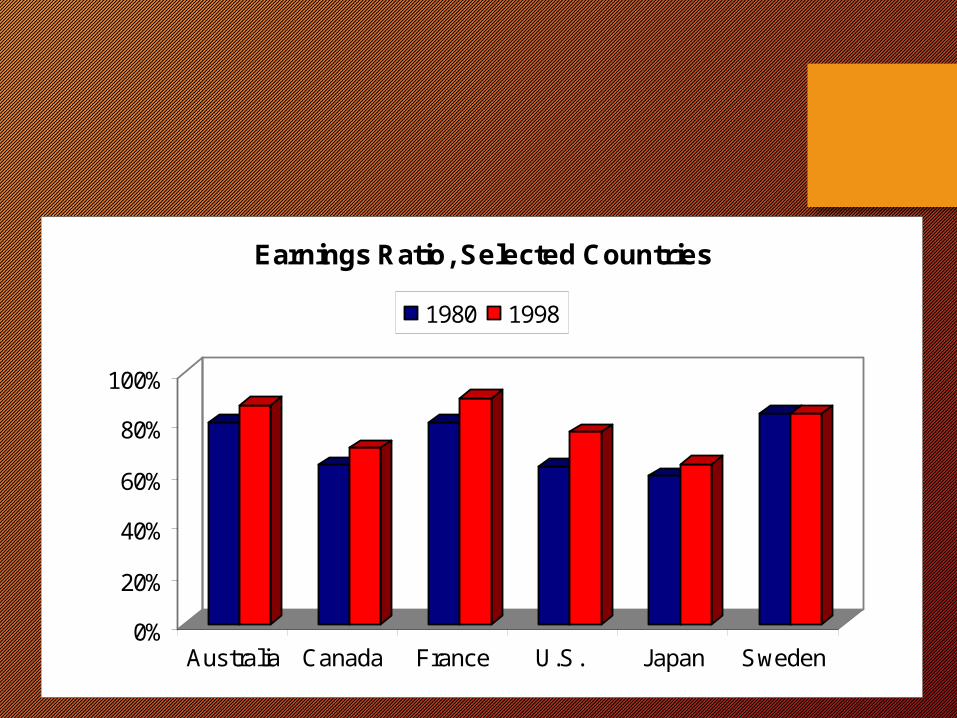
0%
20%
40%
60%
80%
100%
Australia Canada France U.S. Japan Sweden
Earnings Ratio, Selected Countries
1980 1998
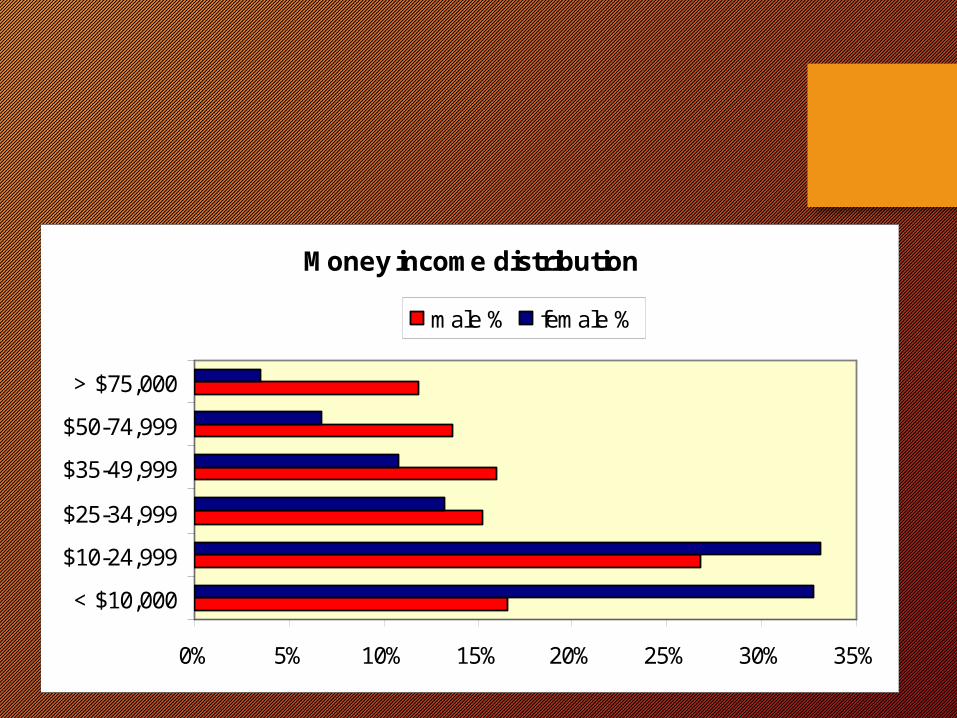
Money income distribution
0% 5% 10% 15% 20% 25% 30% 35%
< $10,000
$10-24,999
$25-34,999
$35-49,999
$50-74,999
> $75,000
male % female %
Occupational Segregation
•the extent to which there are “men’s jobs” and “women’s jobs”
•in general, occupational segregation has fallen since 1970 in the U.S.
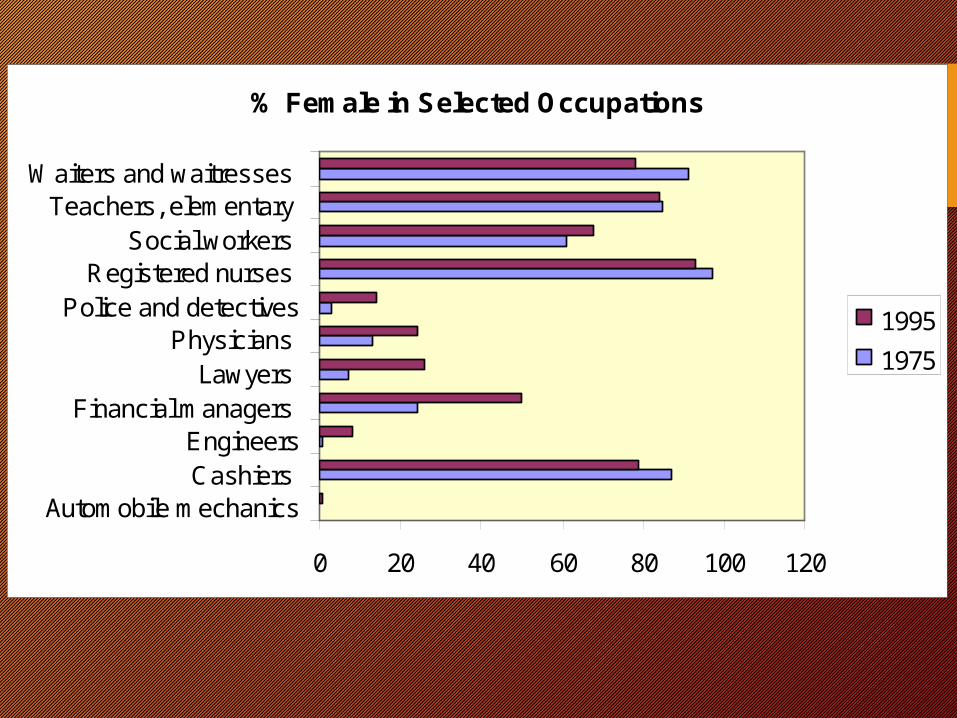
% Female in Selected Occupations
0 20 40 60 80 100 120
Automobile mechanicsCashiers Engineers
Financial managers Lawyers
Physicians Police and detectives
Registered nurses Social workers
Teachers, elementary Waiters and waitresses
1995
1975

Earnings ratio & occupation
88% 87% 91%
70%
95% 93%
0%
20%
40%
60%
80%
100%
RNsprogram
mers
secondary teachers
HR managers
Police
social workers
Gender Earnings Ratios by Occupation, 2002
0%
10%
20%
30%
40%
50%
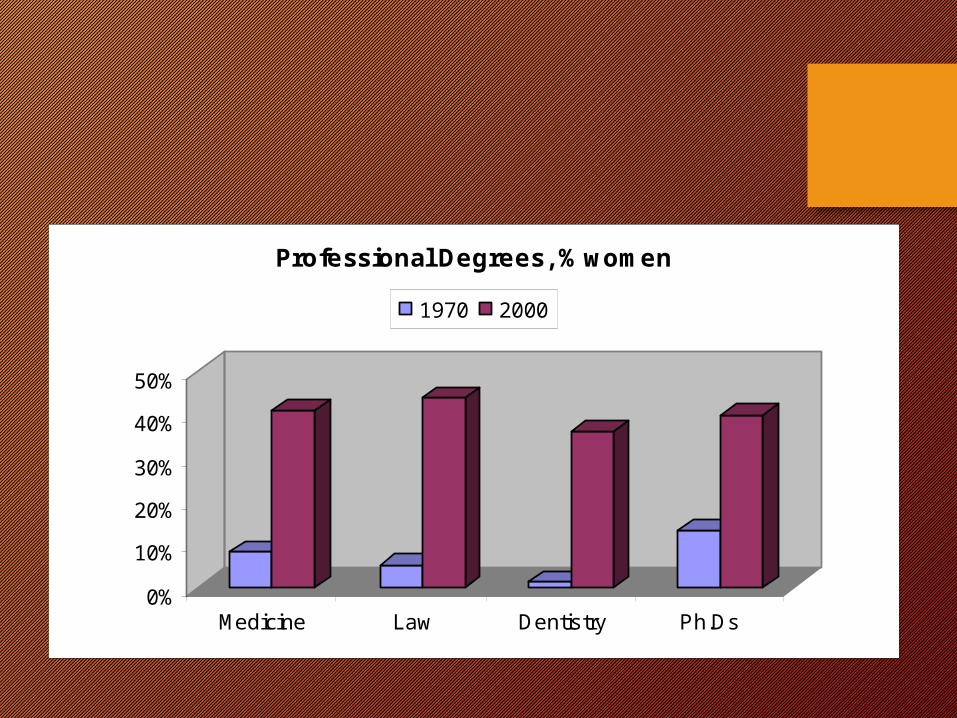
Medicine Law Dentistry Ph.Ds
Professional Degrees, % women
1970 2000

0%10%20%30%40%50%60%70%80%
All Residents
OB/GYNPediatrics
Family Practice
SurgeryRadiology
Medical Specialties of Residents, % female 2001
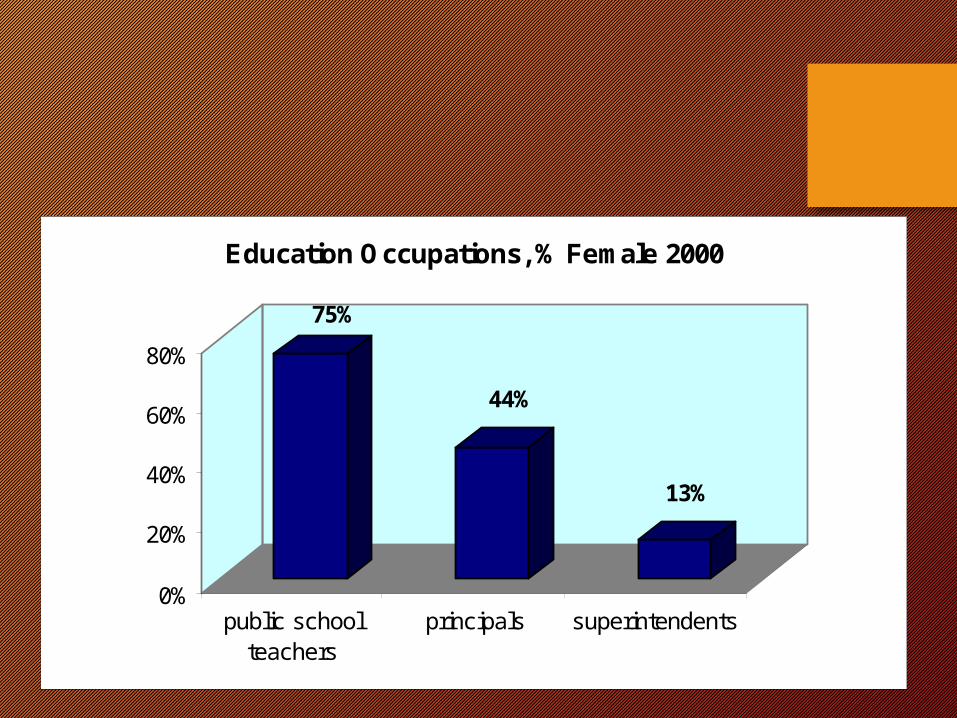
75%
44%
13%
0%
20%
40%
60%
80%
public schoolteachers
principals superintendents
Education Occupations, % Female 2000