gender imbalance and spatiotemporal patterns of
TRANSCRIPT

Gender Imbalance and Spatiotemporal Patterns of Contributions
to Citizen Science Projects: the case of Zooniverse
Khairunnisa Ibrahim1, Samuel Khodursky2,3, Taha Yasseri1,4,5,6*
1 Oxford Internet Institute, University of Oxford, Oxford, UK 2 Laboratory of Evolutionary Genetics and Genomics, The Rockefeller University, New York, USA 3 Department of Physics, University of Oxford, Oxford, UK 4 School of Sociology, University College Dublin, Dublin, Ireland 5 Geary Institute for Public Policy, University College Dublin, Dublin, Ireland 6 Alan Turing Institute for Data Science and AI, London, UK
* Corresponding Author: [email protected]
Abstract
Citizen Science is research undertaken by professional scientists and members of the public collaboratively.
Despite numerous benefits of citizen science for both the advancement of science and the community of
the citizen scientists, there is still no comprehensive knowledge of patterns of contributions, and the
demography of contributors to citizen science projects. In this paper we provide a first overview of
spatiotemporal and gender distribution of citizen science workforce by analyzing 54 million classifications
contributed by more than 340 thousand citizen science volunteers from 198 countries to one of the largest
citizen science platforms, Zooniverse. First we report on the uneven geographical distribution of the citizen
scientist and model the variations among countries based on the socio-economic conditions as well as the
level of research investment in each country. Analyzing the temporal features of contributions, we report
on high “burstiness” of participation instances as well as the leisurely nature of participation suggested by
the time of the day that the citizen scientists were the most active. Finally, we discuss the gender imbalance
among citizen scientists (about 30% female) and compare it with other collaborative projects as well as the
gender distribution in more formal scientific activities. Citizen science projects need further attention from
outside of the academic community, and our findings can help attract the attention of public and private
stakeholders, as well as to inform the design of the platforms and science policy making processes.
Keyword: citizen science, human dynamics, digital divide, circadian pattern, Zooniverse
Introduction
The growth of online collaboration between scientists and the public on research projects in recent years
have led to numerous discoveries at unprecedented rates in various fields of science. These projects called
citizen science, are part of scientific initiatives that involve non-scientists in research work. Not only does
citizen science facilitate new breakthroughs [1], they do so thanks to voluntary contributions. The collective
efforts of citizen scientists, as these volunteers are known, to one of the citizen science platforms

2
Zooniverse1, was estimated to be worth US$1.5 million in 2015 by Sauermann & Franzoni [2] and represent
the equivalent of 34 years’ full time service [3] and 50 years of non-stop research [4].
It is not only the scientific community that benefits from citizen science; Research has shown that volunteers
gain learning opportunities, positive attitudes towards science and the ability to participate in research [5,
6, 7, 8] as well opportunity for socializing and participating in an online community [6, 9]. In addition to
making science more open and accessible, online citizen science accelerates research by leveraging human
and computing resources [10, 11, 12], tapping into rare and diverse pools of expertise [2, 13], providing
informal scientific education and training, motivating individuals to learn more about science [14]. Given
these advantages, there has been a surge in research that seek to understand the activities and drives of both
the scientists and the citizen scientists involved. As Rotman et al. note, by “understanding the shared and
unique motivations of these two groups” citizen science developers can design “the technical and social
infrastructures needed to promote effective partnerships” [15].
This paper contributes towards those efforts by focusing on the geographical and temporal patterns of
participation in the multi-project citizen science platform, the Zooniverse. Previous studies have focused
on motivations of citizen scientists [11, 12], the frequency, productivity and intensity of volunteers’
engagement [18] and preference between contributing a classification – defined as a unit of task completed
in a citizen science project [4] – and participating in a discussion forum [11, 7]. Others have looked at
factors that promote or hinder participation, such as whether taking part in discussion forums have any
influence on classification activities [19] and why volunteers only ‘drabble’ or contribute occasionally, or
even drop-out [6]. To date, however, there is little research on where volunteers come from, and when they
are active, although Ponciano et al. [18] and Sauermann and Franzoni [2] do briefly examine temporal
patterns with regard to frequency of activity over certain time periods.
Access to the technologies and skills to participate in online activities and for data creation and sharing is
becoming ever more ubiquitous. Consequently, significant amount of research has been undertaken to
discover the spatiotemporal patterns of these activities towards better understanding of human behavior,
society and technology. A common finding among geographical studies of online activity is the
disproportionate spatial distribution of both participation and data creation. These “stark core-periphery
patterns” [20] reaffirm the dominance of resources and power in the West, and the lack of both in the global
South. These are patterns that have been mapped and replicated across various online platforms, such as the
1 https://www.zooniverse.org/

3
photo-sharing site Flickr [21], the online encyclopedia Wikipedia [20], Twitter [22] and Google Maps [23].
Studies that examine where and what data are and are not available online thus reveal social realities,
processes and divisions [19, 20, 21].
Temporal patterns of online activity have also been extensively studied in the field of Human Dynamics.
Recent research include the editing behavior of editors on OpenStreetMap [27], Wikipedia [28], check-ins
on the location-based social network Foursquare [29], phone calls [30], text messages [31], and traffic on
the video-sharing platform Youtube [32]. These studies helped discern human tendencies at different time-
scales. For instance, Noulas et al., by comparing Foursquare activity during the weekday and weekends
[29], found distinct variance in when and where people check in. Similarly, Kaltenbrunner et al. discovered
that people were considerably more active on the technology-news website Slashdot during the weekday
compared to weekends [33]. Temporal patterns were also used to infer other information not readily
available, such as the geographical location of editors of different language editions of Wikipedia [28].
According to a survey by the Zooniverse, about 30% of their respondents are from the UK, 35% from the
US and the rest from other parts of the world [34]. Our paper investigates the patterns of activity in the
Zooniverse between 2009 and 2013 by analyzing 54 million classifications made in 17 different citizen
science projects by more than 340,000 volunteer citizen scientists. Our focus is on the spatial and temporal
patterns of activity; we are interested in where volunteers contribute to citizen science from, and during
what times of the day and week they are most active. We seek to answer two basic questions:
1) Where do volunteers contribute from, and when?
2) What are some of the reasons for these patterns?
3) What is the gender distribution among the contributors?
Materials and Methods
Data overview
This study utilizes a dataset of 54 million classifications made in 17 different citizen science projects in the
Zooniverse made between November 2009 and June 2013 (see Supplementary Information for a list and
timeline of the projects). The classifications were produced by more than 340,000 volunteers from 198
different countries. Each classification record includes a unique classification id, the volunteer’s distinct
user-id and their approximate geographical location, the timestamp of the classification and the project to
which the classification is made. The records also include gender information. However, volunteers are not
required to identify as either male or female, so gender information in the dataset is derived from a separate
4
analysis of the first names that they used to register using the Gender API.2 The complete dataset is available
at https://doi.org/10.5281/zenodo.583182.
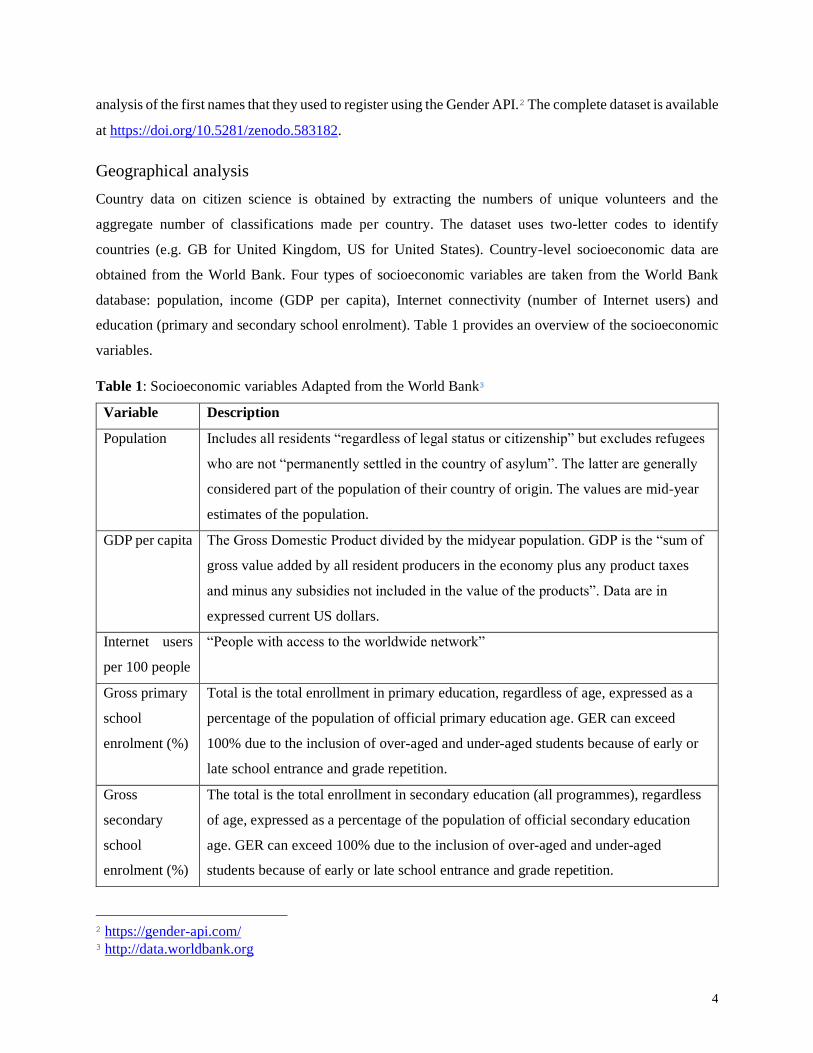
Geographical analysis
Country data on citizen science is obtained by extracting the numbers of unique volunteers and the
aggregate number of classifications made per country. The dataset uses two-letter codes to identify
countries (e.g. GB for United Kingdom, US for United States). Country-level socioeconomic data are
obtained from the World Bank. Four types of socioeconomic variables are taken from the World Bank
database: population, income (GDP per capita), Internet connectivity (number of Internet users) and
education (primary and secondary school enrolment). Table 1 provides an overview of the socioeconomic
variables.
Table 1: Socioeconomic variables Adapted from the World Bank3
Variable Description
Population Includes all residents “regardless of legal status or citizenship” but excludes refugees
who are not “permanently settled in the country of asylum”. The latter are generally
considered part of the population of their country of origin. The values are mid-year
estimates of the population.
GDP per capita The Gross Domestic Product divided by the midyear population. GDP is the “sum of
gross value added by all resident producers in the economy plus any product taxes
and minus any subsidies not included in the value of the products”. Data are in
expressed current US dollars.
Internet users
per 100 people
“People with access to the worldwide network”
Gross primary
school
enrolment (%)
Total is the total enrollment in primary education, regardless of age, expressed as a
percentage of the population of official primary education age. GER can exceed
100% due to the inclusion of over-aged and under-aged students because of early or
late school entrance and grade repetition.
Gross
secondary
school
enrolment (%)
The total is the total enrollment in secondary education (all programmes), regardless
of age, expressed as a percentage of the population of official secondary education
age. GER can exceed 100% due to the inclusion of over-aged and under-aged
students because of early or late school entrance and grade repetition.
2 https://gender-api.com/ 3 http://data.worldbank.org

5
The three variables for scientific culture are also obtained from the World Bank. An overview is provided
in Table 2.
Table 2: Scientific culture variables Adapted from the World Bank
Variable Description
Research and
development
expenditure (% of GDP)
Figures indicate the “current and capital expenditures (both public and
private) on creative work undertaken systematically to increase knowledge,
including knowledge of humanity, culture, and society, and the use of
knowledge for new applications” and includes “basic research, applied
research, and experimental development”.
Researchers in R&D
(per million people)
Figures indicate the number of professional involved in “the conception or
creation of new knowledge, products, processes, methods, or systems and in
the management of the projects concerned”, including postgraduate PhD
students.
Scientific and technical
journal articles
Figures indicate the number of scientific and engineering articles published
in the fields of physics, biology, chemistry, mathematics, clinical medicine,
biomedical research, engineering and technology, and earth and space
sciences.
Temporal analysis
The daily cycles of activity are examined for the 20 countries most active in the Zooniverse. The
standardized time is taken to be the Greenwich Meridian Time (GMT). All other countries’ data were
adjusted to the GMT. Several countries, most notably the US, Canada, Australia, the Russian Federation
and Brazil, span several time zones. The decision was taken to adjust the data using an average of +3 and -
3 hours respectively for the Russian Federation and Brazil. For the US, Canada and Australia, the data for
various regions are aggregated and adjusted according to their various time zones. The hourly contributions
by region are then added to represent the countries’ overall activity per hour.
The circadian rhythms for each country (𝐶𝑖𝑟𝑐𝑎𝑑𝑖𝑎𝑛∆𝑡) are obtained by dividing the number of
classifications made at any particular hour (𝐶𝑙𝑎𝑠𝑠𝑖𝑓𝑖𝑐𝑎𝑡𝑖𝑜𝑛𝑠∆𝑡) with the total number of classifications
made within that country (𝐶𝑙𝑎𝑠𝑠𝑖𝑓𝑖𝑐𝑎𝑡𝑖𝑜𝑛𝑠).
𝐶𝑖𝑟𝑐𝑎𝑑𝑖𝑎𝑛∆𝑡 = 𝐶𝑙𝑎𝑠𝑠𝑖𝑓𝑖𝑐𝑎𝑡𝑖𝑜𝑛𝑠∆𝑡
𝐶𝑙𝑎𝑠𝑠𝑖𝑓𝑖𝑐𝑎𝑡𝑖𝑜𝑛𝑠
6
Meanwhile, the universal curve is the ratio of the total number of classifications per hour made by the 20
countries over the overall number of classifications from the 20 countries made throughout the 24-hour
period.
𝑈𝑛𝑖𝑣𝑒𝑟𝑠𝑎𝑙 = ∑ 𝐶𝑙𝑎𝑠𝑠𝑖𝑓𝑖𝑐𝑎𝑡𝑖𝑜𝑛𝑠∆𝑡20
∑ 𝐶𝑙𝑎𝑠𝑠𝑖𝑓𝑖𝑐𝑎𝑡𝑖𝑜𝑛𝑠20
Results
Spatial patterns of citizen science activity
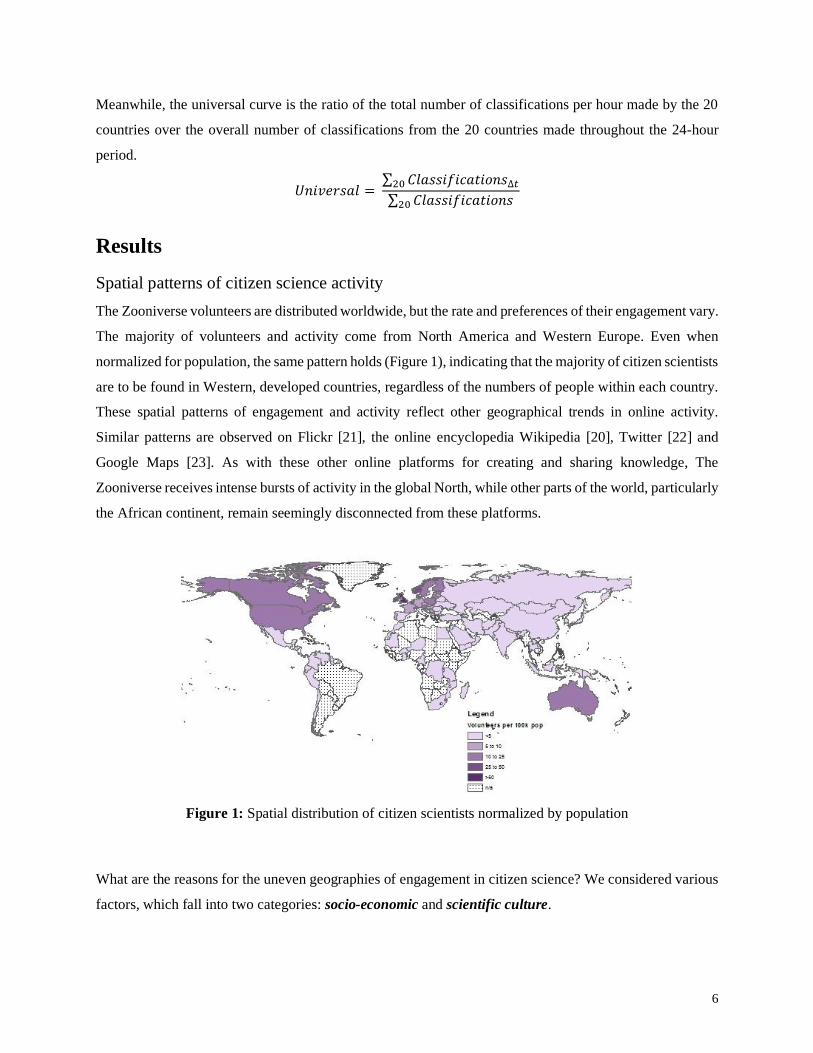
The Zooniverse volunteers are distributed worldwide, but the rate and preferences of their engagement vary.
The majority of volunteers and activity come from North America and Western Europe. Even when
normalized for population, the same pattern holds (Figure 1), indicating that the majority of citizen scientists
are to be found in Western, developed countries, regardless of the numbers of people within each country.
These spatial patterns of engagement and activity reflect other geographical trends in online activity.
Similar patterns are observed on Flickr [21], the online encyclopedia Wikipedia [20], Twitter [22] and
Google Maps [23]. As with these other online platforms for creating and sharing knowledge, The
Zooniverse receives intense bursts of activity in the global North, while other parts of the world, particularly
the African continent, remain seemingly disconnected from these platforms.
Figure 1: Spatial distribution of citizen scientists normalized by population
What are the reasons for the uneven geographies of engagement in citizen science? We considered various
factors, which fall into two categories: socio-economic and scientific culture.

7
Socioeconomic factors can indicate the propensity of the average individual in a country to engage in citizen
science. Citizen science requires the voluntary participation of many people, which is more readily provided
if the volunteers are relatively well-off, have easy access to the Internet, and have ample free time. Our
analysis of the temporal patterns of activity, shared later in the paper, also point to citizen science as being
primarily a leisurely pursuit, taken up after the normal workday is over. Finally, the nature of the citizen
science projects indicates at least a certain level of education on the part of the volunteer, in order for them
to understand and be interested in the projects.
A country's scientific culture can also be a good indicator for its residents' involvement in citizen science.
Countries that spend more on research and development, cultivates more researchers, and produce more
scientific outputs signal a vibrant scientific community that encourages experimentation and learning. This
positive inclination towards knowledge production may also extend to those outside the formal institutions
of science, for even when individuals move into non-scientific careers, their early education will most likely
have included science subjects.
Using the latest available indicators from the World Bank, we analyzed the relationship between
engagement in citizen science, defined as the number of contributions made from each country. The
socioeconomic variables include population, GDP per capita, Internet connectivity (the number of Internet
users per 1000 people) as well as primary school enrolment. Countries' scientific cultures are measured by
the expenditure on research and development initiatives, the number of researchers employed in various
sectors and the overall number of publications in science and technology journals and books.
The socioeconomic analyses confirm a positive link between citizen science and socioeconomic indicators;
that is, the wealthier and connected a country is and the more educated its residents, the higher the rate of
participation and contribution. Table 3 shows the Pearson correlation results of the socioeconomic analysis
(controlling for population). On the whole, most of the variables have a positive relationship with citizen
science engagement, although the magnitude of these relationship varies.
Table 3: Bivariate correlations (Pearson correlation) among citizen science and socioeconomic variables
Internet Users GDP per capita Primary
education
volunteers (log) 0.72 0.58 0.51
contributions (log) 0.80 0.66 0.41
8
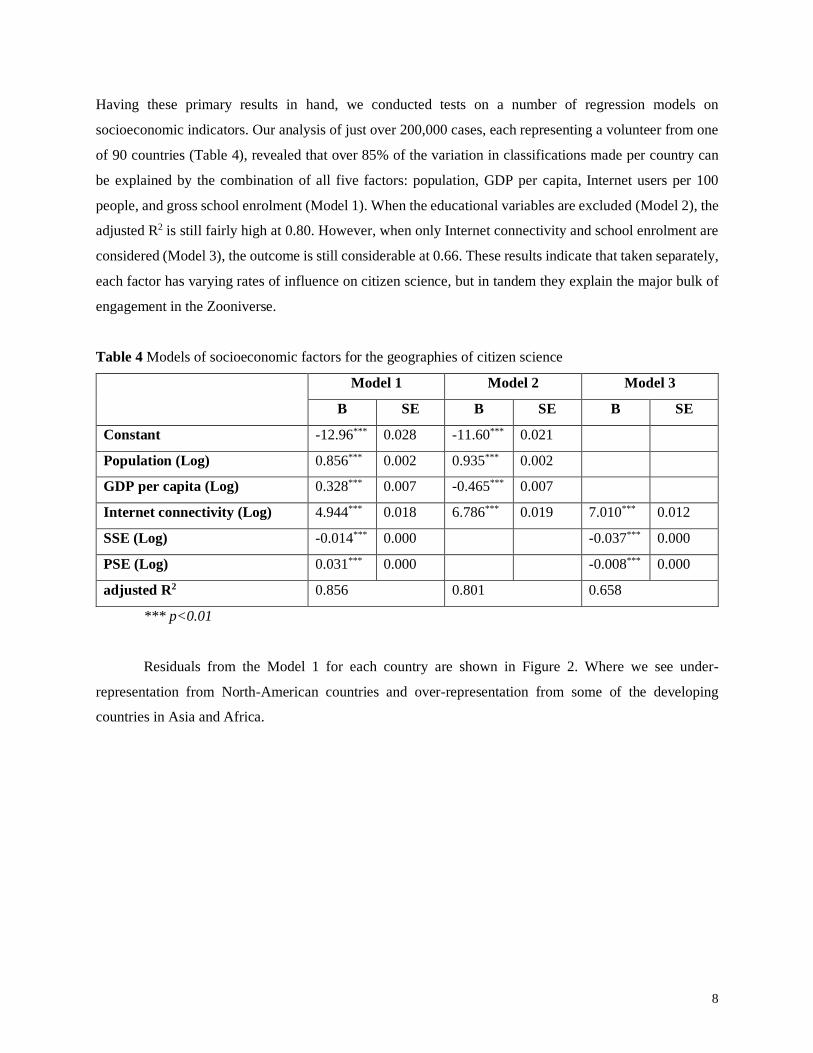
Having these primary results in hand, we conducted tests on a number of regression models on
socioeconomic indicators. Our analysis of just over 200,000 cases, each representing a volunteer from one
of 90 countries (Table 4), revealed that over 85% of the variation in classifications made per country can
be explained by the combination of all five factors: population, GDP per capita, Internet users per 100
people, and gross school enrolment (Model 1). When the educational variables are excluded (Model 2), the
adjusted R2 is still fairly high at 0.80. However, when only Internet connectivity and school enrolment are
considered (Model 3), the outcome is still considerable at 0.66. These results indicate that taken separately,
each factor has varying rates of influence on citizen science, but in tandem they explain the major bulk of
engagement in the Zooniverse.
Table 4 Models of socioeconomic factors for the geographies of citizen science
Model 1 Model 2 Model 3
B SE B SE B SE
Constant -12.96*** 0.028 -11.60*** 0.021
Population (Log) 0.856*** 0.002 0.935*** 0.002
GDP per capita (Log) 0.328*** 0.007 -0.465*** 0.007
Internet connectivity (Log) 4.944*** 0.018 6.786*** 0.019 7.010*** 0.012
SSE (Log) -0.014*** 0.000 -0.037*** 0.000
PSE (Log) 0.031*** 0.000 -0.008*** 0.000
adjusted R2 0.856 0.801 0.658
*** p<0.01
Residuals from the Model 1 for each country are shown in Figure 2. Where we see under-
representation from North-American countries and over-representation from some of the developing
countries in Asia and Africa.

9
Figure 2: Standard residuals for Model 1 (pop, GDP per capita, Internet users and education)
Our analysis of the influence of scientific culture on citizen science engagement indicate that more
scientifically active countries are more likely to be involved in citizen science. We ran a correlation test of
over 21,000 cases from 56 countries with available science data - spending on research and development,
the number of researchers and publications - from the World Bank. Table 5 shows the result of this analysis.
All three variables show a positive correlation, with R&D budget and science publications being highly
correlated at over 70% and 80% respectively.
Table 5: Pearson-moment correlation among citizen science variables and science indicators
R&D budget (log) # of researchers (log) S & T publications (Log)
Volunteers (log) 0.75 0.48 0.80
Contributions (log) 0.78 0.56 0.82
A linear combination of the three variables contribute to 73.2% of the variation in citizen science activity
(Table 6). The results indicate that while research spending and the availability of human resource in science
are necessary, it is the outcomes of these investment and resources that have greatest impact on involvement
in citizen science. In other words, researchers and funding agencies should aim for increasing their
publication record as this research shows that greater publications can influence more involvement in
science even outside academia and industry.

10
Table 6: Least squares linear regression predicting log (contributions) per country
B SE 95% CI
Intercept 1.545*** 0.033 1.481 1.609
Budget (log) -0.298*** 0.005 1.124 1.140
Researchers (log) 0.832*** 0.004 -0.308 -0.288
S&T publications
(log)
1.132*** 0.004 0.824 0.840
Adjusted R2 0.732
*** p<0.01
In Figure 3, the residuals of the model are shown which is similar to the pattern in Figure 2, with the
exception of more contributions from the USA compared to the model prediction.
Figure 3: Standard residuals for scientific culture model
Temporal patterns of citizen science activity
Distribution of Time between Contributions to Zooniverse
Many social and complex systems variables exhibit fat-tailed distributions. The wealth of people [35], the
populations of cities [36], and the number of citations to papers [37], are all quantities that are distributed
very far from a normal distribution, with few instances of very large values an many instances of small
values. The distribution of time between successive contributions by each citizen scientist to Zooniverse is
shown in Figure 4. The fat-tailed distribution of the time intervals is in line with previous reports on similar
patterns among Wikipedia edits [38], emails sent/received [39], phone calls made [40], and many more
11
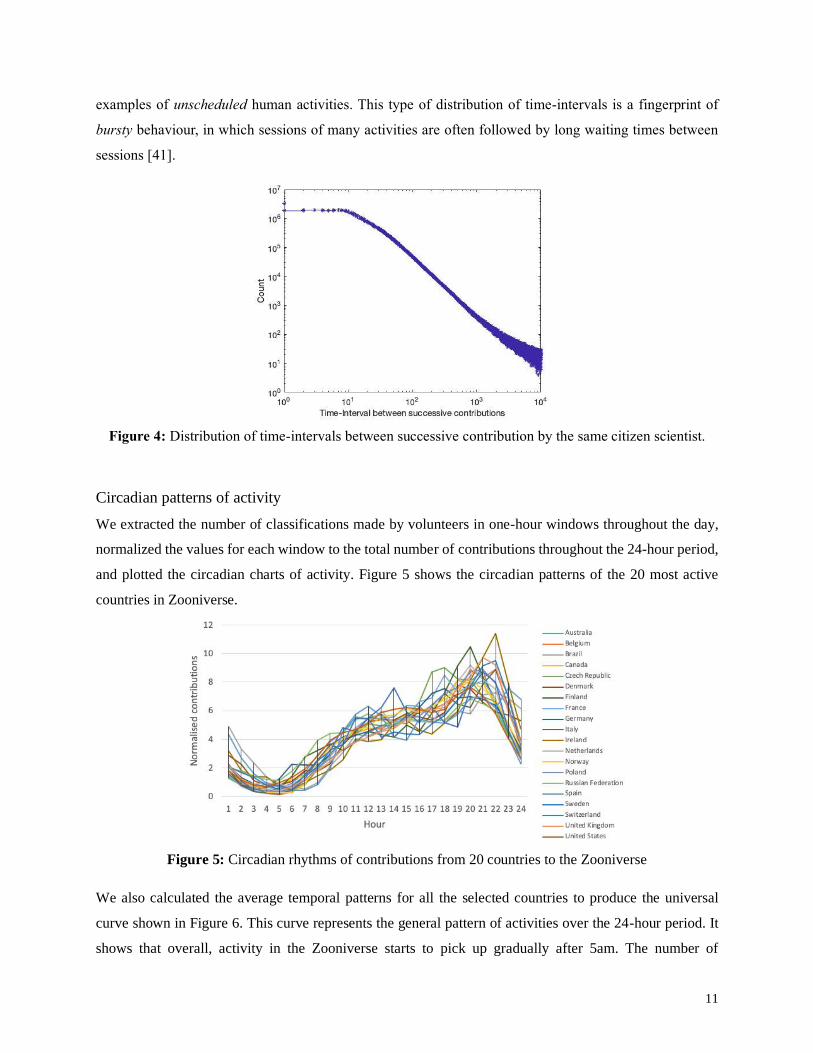
examples of unscheduled human activities. This type of distribution of time-intervals is a fingerprint of
bursty behaviour, in which sessions of many activities are often followed by long waiting times between
sessions [41].
Figure 4: Distribution of time-intervals between successive contribution by the same citizen scientist.
Circadian patterns of activity
We extracted the number of classifications made by volunteers in one-hour windows throughout the day,
normalized the values for each window to the total number of contributions throughout the 24-hour period,
and plotted the circadian charts of activity. Figure 5 shows the circadian patterns of the 20 most active
countries in Zooniverse.
Figure 5: Circadian rhythms of contributions from 20 countries to the Zooniverse
We also calculated the average temporal patterns for all the selected countries to produce the universal
curve shown in Figure 6. This curve represents the general pattern of activities over the 24-hour period. It
shows that overall, activity in the Zooniverse starts to pick up gradually after 5am. The number of

12
classifications continue to increase throughout the day, with small dips in activity in the afternoon (around
2pm) and early evening (around 6pm). The rate of activity peaks at 9pm, and falls in volume in the following
hours.
Figure 6: The universal curve showing the average contributions per hour for the 20 countries
This universal circadian pattern for the 20 selected countries indicates that while classifications were made
at all hours of the day, most of the activity took place at night. The peak hour of 9pm is typically leisure
time for most households. Assuming that most people only have about an hour or less to contribute to the
Zooniverse, this pattern corresponds with findings from a survey on the Zooniverse community, in which
the majority of respondents selected the option 'Only when I have spare time' in answer to the query on
when they tend to classify [34]. It also reflects the tendency of people to collectively contribute to a pursuit
en masse when they are in possession of free time and the resources to do so, a phenomenon that Shirky
calls 'cognitive surplus' [42].
Time of first contributions
Two-thirds of volunteers to the Zooniverse make only one classification and do not return [18]. Given that
such a large proportion of volunteers do not continue to contribute, it is important to know when most
people first come to the project, so that project managers can identify measures to retain participation, and
schedule them at the appropriate times. We investigated time of first contribution for the 20 countries and
found that show that on average there is a marked concentration of volunteers making an initial contribution
at 9pm (Figure 7). This corresponds with the universal circadian pattern above, where 9pm is shown to
experience the highest activity rates in the 20 countries. Here we see a sharper peak around 9pm compared
to the overall activity curve. Citizen science in general seems to be a leisure activity, undertaken when
individuals have time to spare. The prevalence of nighttime activity might also be due to individuals first
learning about the various projects through social media, whether directly from the Zooniverse or others
[2], when they become connected to these informational outlets after work and dinner.

13
Figure 7: Time of first contribution, when volunteers make their first, and for many their only,
classification
Gender balance across projects
Overall the gender imbalance among the contributors to the Zooniverse projects is large. Among all the
contributions, where the gender of the contributor could be determined with high confidence, only about
30% are committed by female contributors. Whilst the share of female citizen scientists’ contributions is
considerably larger than similar collaborative projects such a Wikipedia [43] and free/libre/open source
software development [44], there is still a large gap of about 40% between the two main genders. Figure 8
shows the percentage of female volunteers foe each country (see Supplementary Information for the full
list).
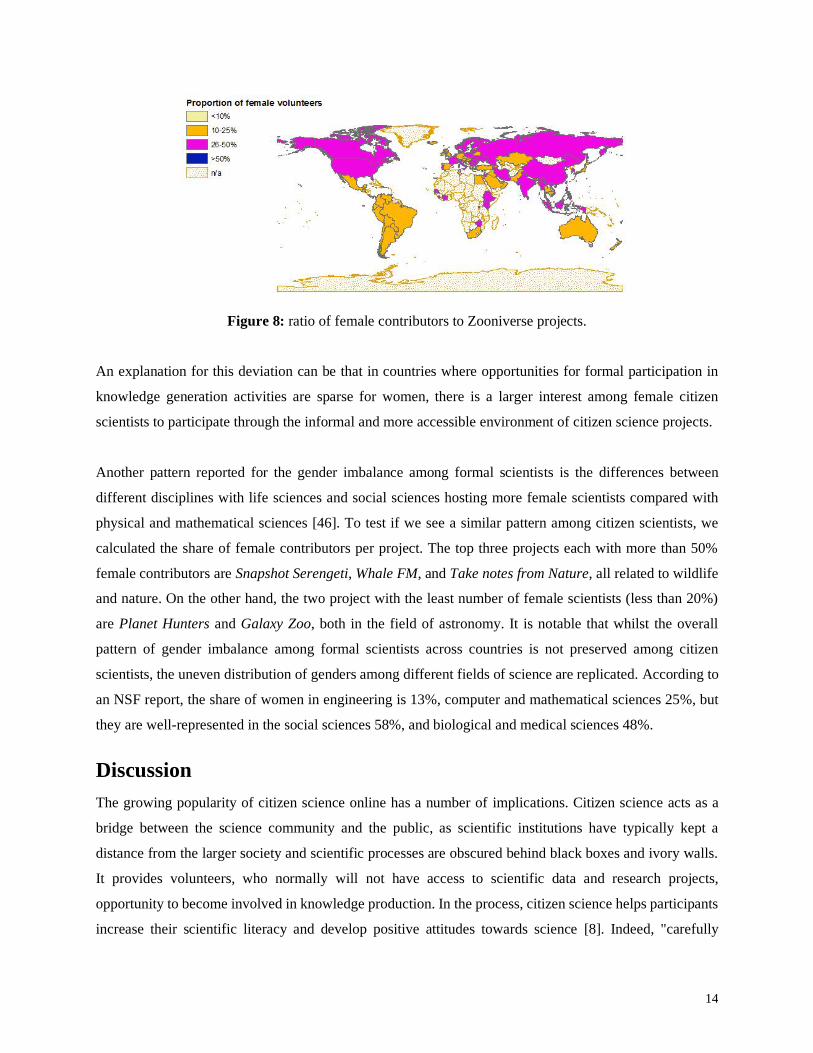
Female volunteers are underrepresented in most countries. In many countries, women make up less than
one-third of number of volunteers whose gender is known. The female ratio of participation in the UK and
Australia, for instance, is 25 per cent, while the figures for US, Canada and Germany are between 27 and
30 per cent. What is notable here is we see no clear correlation between these ratios and the estimated
percentage of female authors in each country [45] with India, Iran, and Ukraine among the countries with
the larger share of female contributors in Zooniverse.
14
Figure 8: ratio of female contributors to Zooniverse projects.
An explanation for this deviation can be that in countries where opportunities for formal participation in
knowledge generation activities are sparse for women, there is a larger interest among female citizen
scientists to participate through the informal and more accessible environment of citizen science projects.
Another pattern reported for the gender imbalance among formal scientists is the differences between
different disciplines with life sciences and social sciences hosting more female scientists compared with
physical and mathematical sciences [46]. To test if we see a similar pattern among citizen scientists, we
calculated the share of female contributors per project. The top three projects each with more than 50%
female contributors are Snapshot Serengeti, Whale FM, and Take notes from Nature, all related to wildlife
and nature. On the other hand, the two project with the least number of female scientists (less than 20%)
are Planet Hunters and Galaxy Zoo, both in the field of astronomy. It is notable that whilst the overall
pattern of gender imbalance among formal scientists across countries is not preserved among citizen
scientists, the uneven distribution of genders among different fields of science are replicated. According to
an NSF report, the share of women in engineering is 13%, computer and mathematical sciences 25%, but
they are well-represented in the social sciences 58%, and biological and medical sciences 48%.
Discussion
The growing popularity of citizen science online has a number of implications. Citizen science acts as a
bridge between the science community and the public, as scientific institutions have typically kept a
distance from the larger society and scientific processes are obscured behind black boxes and ivory walls.
It provides volunteers, who normally will not have access to scientific data and research projects,
opportunity to become involved in knowledge production. In the process, citizen science helps participants
increase their scientific literacy and develop positive attitudes towards science [8]. Indeed, "carefully
15
designed citizen-science projects can be successful environments for increasing adult knowledge of factual
science" [5]. Additionally, by leveraging on knowledge creation and sharing models of crowdsourcing [47]
and peer-production [48], citizen science bypasses the problems of funding and human resource shortages.
It is by harnessing crowd power and engaging in these new forms of scientific collaboration that online
citizen science can help facilitate and accelerate scientific discovery.
Our research examined the spatiotemporal patterns of activity in citizen science on the Zooniverse platform.
We found that volunteers are unevenly distributed around the world. They are found predominantly in North
America and Europe, and in small numbers in the rest of the world. These variations can be explained by
socio-economic factors. Over 80 per cent of the variations are due to the combined effects of a country's
population, wealth (GDP per capita), Internet connectivity and rate of school enrolment. National emphasis
on science, as represented by spending on research and development, the number of researchers employed
and publication records, also have an effect on citizen science, accounting for 73% of variation in citizen
science activity. By identifying these trends and the factors that produce them, policy makers, scientific
institutions as well as citizen science developers can pinpoint strategies to increase involvement in science,
one of them through promoting participation in informal science projects such as citizen science.
We also studied the temporal patterns of activity on the Zooniverse, and the results demonstrate that
volunteers tend to be most active during the evening, which corresponds with a typical household's leisure
time. First time volunteers are also most likely to start classifying during the same time intervals of the day.
Studying the gender imbalance among contributors, we see a higher participation from female citizen
scientists compare to Wikipedia and open software development projects, however, still a large gap between
the number of male and female contributors is present. We observe smaller gaps in countries with larger
gender imbalance in more formal research professions, which suggest citizen science projects can
practically play the role of an informal channel for females with strong interest in science where more
formal channels are less accessible.
Our findings represent initial forays into research to understand the influence of time and place on
involvement in scientific knowledge production. Further studies are needed to discover not just the
national-level factors for varying levels of citizen science involvement, but also variables that affect
participation on a micro-scale. Doing so would help identify ways to best tap into the vast reserves of
interest, time and effort and channel them towards scientific pursuits that the public can contribute to.

16
Data Availability All the dataset used in this research is available at https://doi.org/10.5281/zenodo.583182.
Authors’ Contributions
K.I., S.K., and T.Y. Analyzed the data. T.Y. designed the study and secured the funding. K.I. and T.Y.
drafted the manuscript. All authors contributed to writing the manuscript and gave final approval for
publication.
Competing Interest The authors declare no competing interests.
Funding This publication arises from research funded by the John Fell Oxford University Press (OUP) Research
Fund, grant no. 132/126. T.Y. was partially supported by the Alan Turing Institute under the EPSRC grant
no. EP/N510129/1.
Acknowledgement We thank Robert Simpson, Grant Robert MacKinnon Miller, and Chris Lintott from Zooniverse for
sharing the data and insightful discussions. We thank Ksenia Musaelyan for comments on the manuscript.
References
1. Nielsen M. Reinventing Discovery: The New Era of Networked Science. USA: Princeton
University Press (2011).
2. Sauermanna H, Franzonib C. Crowd science user contribution patterns and their implications.
Proc Natl Acad Sci U S A (2015) 112:679–684. doi:10.1073/pnas.1408907112
3. Cox J, Oh EY, Simmons B, Lintott C, Masters K, Greenhill A, Graham G, Holmes K. Defining
and Measuring Success in Online Citizen Science: A Case Study of Zooniverse Projects. Comput
Sci Eng (2015) 17:28–41. doi:10.1109/MCSE.2015.65
4. Simpson R, Page KR, De Roure D. Zooniverse: Observing the world’s largest citizen science
platform. in WWW 2014 Companion - Proceedings of the 23rd International Conference on World Wide Web (New York, New York, USA: Association for Computing Machinery, Inc), 1049–1054.
doi:10.1145/2567948.2579215
5. Brossard D, Lewenstein B, Bonney R. Scientific knowledge and attitude change: The impact of a
citizen science project. Int J Sci Educ (2005) 27:1099–1121. doi:10.1080/09500690500069483
6. Eveleigh A, Jennett C, Blandford A, Brohan P, Cox AL. Designing for dabblers and deterring
drop-outs in citizen science. in Conference on Human Factors in Computing Systems -
Proceedings (New York, NY, USA: Association for Computing Machinery), 2985–2994.
doi:10.1145/2556288.2557262
7. Luczak-Roesch M, Tinati R, Simperl E, Van Kleek M, Shadbolt N, Simpson R. Why won’t aliens
talk to us? Content and community dynamics in online citizen science. in Proceedings of the 8th
International Conference on Weblogs and Social Media, ICWSM 2014, 315–324.
8. Price CA, Lee HS. Changes in participants’ scientific attitudes and epistemological beliefs during
an astronomical citizen science project. J Res Sci Teach (2013) 50:773–801.
17
doi:10.1002/tea.21090
9. Kloetzer L;, Schneider D;, Jennett C;, Iacovides I;, Eveleigh A;, Cox A, Gold M. Learning by
volunteer computing, thinking and gaming: What and how are volunteers learning by participating
in Virtual Citizen Science ? In: Changing Configurations of Adult Education in Transitional
Times: Conference Proceedings, ESREA: European Society for Research on the Education of
Adults, pp. 73–92.10.
10. Hand E. Citizen science: People power. Nature (2010) 466:685–687. doi:10.1038/466685a
11. Tsvetkova M, Yasseri T, Meyer ET, Pickering JB, Engen V, Walland P, Lüders M, Følstad A,
Bravos G. Understanding human-machine networks: A cross-disciplinary survey. ACM Comput
Surv (2017) 50: doi:10.1145/3039868
12. Eide AW, Pickering JB, Yasseri T, Bravos G, Følstad A, Engen V, Tsvetkova M, Meyer ET,
Walland P, Lüders M. Human-machine networks: Towards a typology and profiling framework. in
Lecture Notes in Computer Science (including subseries Lecture Notes in Artificial Intelligence
and Lecture Notes in Bioinformatics) (Springer Verlag), 11–22. doi:10.1007/978-3-319-39510-4_2
13. Yasseri T, Kertész J. Value Production in a Collaborative Environment: Sociophysical Studies of
Wikipedia. J Stat Phys (2013) 151:414–439. doi:10.1007/s10955-013-0728-6
14. Straub VJ, Tsvetkova M, Yasseri T. The cost of coordination can exceed the benefit of
collaboration in performing complex tasks. (2020) Available at: http://arxiv.org/abs/2009.11038
[Accessed January 7, 2021]
15. Kloetzer L;, Schneider D;, Jennett C;, Iacovides I;, Eveleigh A;, Cox A, Gold M, Kloetzer L,
Schneider D, Jennett C, et al. Learning by volunteer computing, thinking and gaming: What and
how are volunteers learning by participating in Virtual Citizen Science ? Proc 2013 Eur Res Conf
Netw Access, Learn Careers Identities (pp pp 73-92) Eur Soc Res Educ Adults Linköping, Sweden
(2013) Available at: https://liu.se/esrea2013?l=en [Accessed January 5, 2021]
16. Jackson CB, Østerlund C, Mugar G, De Vries Hassman K, Crowston K. Motivations for sustained
participation in crowdsourcing: Case studies of citizen science on the role of talk. in Proceedings
of the Annual Hawaii International Conference on System Sciences (IEEE Computer Society),
1624–1634. doi:10.1109/HICSS.2015.196
17. Raddick MJ, Bracey G, Gay PL, Lintott CJ, Murray P, Schawinski K, Szalay AS, Vandenberg J.
Galaxy Zoo: Exploring the Motivations of Citizen Science Volunteers. Astron Educ Rev (2010) 9:
doi:10.3847/aer2009036
18. Ponciano L, Brasileiro F. Finding Volunteers’ Engagement Profiles in Human Computation for
Citizen Science Projects. Hum Comput (2014) 1: doi:10.15346/hc.v1i2.12
19. Tinati R, Simperl E, Luczak-Roesch M, Van Kleek M, Shadbolt N. Collective Intelligence in
Citizen Science -- A Study of Performers and Talkers. (2014) Available at:
http://arxiv.org/abs/1406.7551 [Accessed January 5, 2021]
20. Graham M, Hogan B, Straumann RK, Medhat A. Uneven Geographies of User-Generated
Information: Patterns of Increasing Informational Poverty. Ann Assoc Am Geogr (2014) 104:746–
764. doi:10.1080/00045608.2014.910087
21. Graham M, Hale S, Stephens M. Geographies of the World’s Knowledge. (2011)
22. Graham M, Hale SA, Gaffney D. Where in the World Are You? Geolocation and Language
Identification in Twitter. Prof Geogr (2014) 66:568–578. doi:10.1080/00330124.2014.907699

18
23. Graham M, Zook M. Augmented realities and uneven geographies: Exploring the geolinguistic
contours of the web. Environ Plan A (2013) 45:77–99. doi:10.1068/a44674
24. Brunn SD, Wilson MW. Cape Town’s million plus black township of Khayelitsha: Terrae
incognitae and the geographies and cartographies of silence. Habitat Int (2013) 39:284–294.
doi:10.1016/j.habitatint.2012.10.017
25. Crutcher M, Zook M. Placemarks and waterlines: Racialized cyberscapes in post-Katrina Google
Earth. Geoforum (2009) 40:523–534. doi:10.1016/j.geoforum.2009.01.003
26. Shelton T, Poorthuis A, Graham M, Zook M. Mapping the data shadows of Hurricane Sandy:
Uncovering the sociospatial dimensions of “big data.” Geoforum (2014) 52:167–179.
doi:10.1016/j.geoforum.2014.01.006
27. Yasseri T, Quattrone G, Mashhadi A. Temporal analysis of activity patterns of editors in
collaborative mapping project of openstreetmap. in Proceedings of the 9th International
Symposium on Open Collaboration, WikiSym + OpenSym 2013 (New York, NY, USA: ACM), 1–
4. doi:10.1145/2491055.2491068
28. Yasseri T, Sumi R, Kertész J. Circadian patterns of wikipedia editorial activity: A demographic
analysis. PLoS One (2012) 7:e30091. doi:10.1371/journal.pone.0030091
29. Noulas A, Scellato S, Mascolo C, Pontil M. An Empirical Study of Geographic User Activity
Patterns in Foursquare. Proc Fifth Int AAAI Conf Weblogs Soc Media (2011) 11:570–573.
doi:papers3://publication/uuid/557455DB-AC4A-4C73-968A-31E7A663BC4E
30. Aledavood T, López E, Roberts SGB, Reed-Tsochas F, Moro E, Dunbar RIM, Saramäki J. Daily
Rhythms in Mobile Telephone Communication. PLoS One (2015) 10:e0138098.
doi:10.1371/journal.pone.0138098
31. Aledavood T, Lehmann S, Saramäki J. Digital daily cycles of individuals. Front Phys (2015) 3:73.
doi:10.3389/fphy.2015.00073
32. Gill P, Arlitt M, Li Z, Mahanti A. YouTube traffic characterization: A view from the edge. in
Proceedings of the ACM SIGCOMM Internet Measurement Conference, IMC (New York, New
York, USA: ACM Press), 15–28. doi:10.1145/1298306.1298310
33. Kaltenbrunner A, Gómez V, Moghnieh A, Meza R, Blat J, López V. Homogeneous temporal
activity patterns in a large online communication space. in CEUR Workshop Proceedings
Available at: http://arxiv.org/abs/0708.1579 [Accessed January 5, 2021]
34. TTFNROB. Who Are The Zooniverse Community? We Asked Them… | Zooniverse. Zooniverse
Blog (2015) Available at: https://blog.zooniverse.org/2015/03/05/who-are-the-zooniverse-
community-we-asked-them/ [Accessed January 5, 2021]
35. Davies JB, Shorrocks AF. The distribution of wealth. Handb Income Distrib (2000) 1:605–675.
doi:10.1016/S1574-0056(00)80014-7
36. Eeckhout J. Gibrat’s law for (all) cities. Am Econ Rev (2004) 94:1429–1451.
doi:10.1257/0002828043052303
37. Goldberg SR, Anthony H, Evans TS. Modelling citation networks. Scientometrics (2015)
105:1577–1604. doi:10.1007/s11192-015-1737-9
38. Yasseri T, Sumi R, Rung A, Kornai A, Kertész J. Dynamics of conflicts in wikipedia. PLoS One
(2012) 7:38869. doi:10.1371/journal.pone.0038869

19
39. Goh K-I, Barabási A-L. Burstiness and memory in complex systems. EPL (Europhysics Lett
(2008) 81:48002.
40. Jo HH, Karsai M, Kertesz J, Kaski K. Circadian pattern and burstiness in mobile phone
communication. New J Phys (2012) 14:13055. doi:10.1088/1367-2630/14/1/013055
41. Barabási AL. The origin of bursts and heavy tails in human dynamics. Nature (2005) 435:207–
211. doi:10.1038/nature03459
42. Harvey K. “Cognitive Surplus,” in Encyclopedia of Social Media and Politics
doi:10.4135/9781452244723.n113
43. Antin J, Yee R, Cheshire C, Nov O. Gender differences in Wikipedia editing. in Proceedings of
the 7th International Symposium on Wikis and Open Collaboration - WikiSym ’11 (New York,
New York, USA: ACM Press), 11. doi:10.1145/2038558.2038561
44. Barcomb A, Grottke M, Stauffert JP, Riehle D, Jahn S. How developers acquire FLOSS skills. in
IFIP Advances in Information and Communication Technology (Springer New York LLC), 23–32.
doi:10.1007/978-3-319-17837-0_3
45. Holman L, Stuart-Fox D, Hauser CE. The gender gap in science: How long until women are
equally represented? PLOS Biol (2018) 16:e2004956. doi:10.1371/journal.pbio.2004956
46. Huang J, Gates AJ, Sinatra R, Barabási AL. Historical comparison of gender inequality in
scientific careers across countries and disciplines. Proc Natl Acad Sci U S A (2020) 117:4609–
4616. doi:10.1073/pnas.1914221117
47. Brabham DC. Crowdsourcing. Mit Press (2013).
48. Cropf RA. Benkler, Y. (2006). The Wealth of Networks: How Social Production Transforms
Markets and Freedom. Soc Sci Comput Rev (2008) 26:259–261. doi:10.1177/1084713807301373