gender, statistics and gender indicators...regional core set of gender statistics and indicators for...
TRANSCRIPT
Gender, Statistics and Gender Indicators Developing a Regional Core Set of Gender Statistics and Indicators in Asia and
the Pacific
REGIONAL CONSULTATIVE WORKSHOP TO DEVELOP A FRAMEWORK AND CORE SET OF GENDER
STATISTICS AND INDICATORS IN ASIA AND THE PACIFIC
4‐6 NOVEMBER 2013, UNITED NATIONS CONFERENCE CENTRE, BANGKOK, THAILAND
Regional Core Set of Gender Statistics and Indicators for Asia and the Pacific
ESCAP, Statistics Division page 2
Contents
Contents..................................................................................................................................................2
I. Gender, statistics and indicators ....................................................................................................3
A. What are Gender Statistics? .......................................................................................................3
1. Gender IN statistics or gender‐responsive statistics...............................................................3
2. Gender Statistics ..................................................................................................................... 7
3. What does this mean? ............................................................................................................7
For national statistical systems:..................................................................................................7
For sectoral and special statistics ...............................................................................................7
For the Regional Core Set of Gender Statistics and Indicators ...................................................7
For national women’s machineries, gender focal points, gender experts .................................8
B. Gender Indicators globally and in Asia and the Pacific ...............................................................8
1. What are Gender Indicators?..................................................................................................8
2. Global efforts to develop gender indicator sets .........................................................................9
3. Gender Indicator sets in Asia and the Pacific........................................................................11
4. What can we learn from previous gender indicator sets .....................................................11
II. Requirements for a Regional Core Set of Gender Statistics and Indicators .................................13
III. Structure of the Regional Core Set ...........................................................................................16
IV. Draft Regional Core Set of Gender Statistics and Indicators ....................................................18
V. List of References..........................................................................................................................38
Regional Core Set of Gender Statistics and Indicators for Asia and the Pacific
ESCAP, Statistics Division page 3
I. Gender, statistics and indicators
An indicator is a statistic that has been standardised or has a reference point to enable comparisons
to be made across populations.
For example, the total number of women Members of Parliament (MPs) is a statistic but not an indicator
because it cannot be compared across populations. The meaning of the statistic depends on the size of
the parliament – 25 women MPs in a parliament of 50 MPs has a totally different meaning from 25
women MPs in a parliament of 200 MPs in Country B. However, the number of women MPs expressed as
a percentage of all MPs is an indicator that can be compared across populations: the proportion of women
MPs in the first country is 50% compared with only 12.5% in the second.
Indicators are based on statistics. Should gender indicators be based on gender statistics? And what
are gender statistics? Are they different from other statistics and if so, how?
A. WHAT ARE GENDER STATISTICS?
Gender statistics have been defined as statistics that “adequately reflect differences and inequalities
in the situation of women and men in all areas of life” (United Nations 2006). This is somewhat
confusing because it describes what should be a basic requirement for all statistics relating to people
and their activities and to a basic responsibility of national statistical systems.
The literature on gender statistics tends to conflate two different although closely related aspects of
the role of gender in statistics. The first refers to an important dimension of the quality of statistics.
It might be better described as Gender IN Statistics or gender‐responsive statistics and covers
virtually all areas of demographic, social and economic statistics. The second refers to a specific and
finite set of Gender Statistics defined in terms of the topics covered1, namely statistics that are
broadly related to equality /inequality between women and men (girls and boys) and women’s
empowerment.
1. Gender IN statistics or gender‐responsive statistics
This perspective refers to the effect of differences between women and men on data and statistics
throughout the entire statistical system. Gender differences affect every activity in the system, from
identifying priorities within resource constraints and deciding on what data is to be collected down
to the design of data collection instruments, the implementation of data collection in the field, data
compilation and data dissemination.
Gender is a cross‐cutting dimension of all demographic, social & economic statistics and all statistics
relating to the characteristics of individuals and/or their activities. Gender is also a cross‐cutting
dimension of the interpretation of many aggregate statistics in areas such as economic statistics,
agricultural and environmental statistics (see e. below). Demographic, social & economic statistics
and most other statistics about individuals relate directly or indirectly to the different roles &
positions of women & men in society and the economy. Some such as the number of children ever
1 In this way, gender statistics would be similar to other areas of statistics such as agricultural statistics, economic statistics, health statistics and education statistics.
Regional Core Set of Gender Statistics and Indicators for Asia and the Pacific
ESCAP, Statistics Division page 4
born or number of months of breastfeeding directly reflect aspects of women’s reproductive role.
However, most reflect the combined effects of gender roles and gender‐based norms and
stereotypes as well as women’s reproductive roles.
National statistical systems are mandated to provide policy‐relevant data that appropriately
represent the different needs, interests and priorities of the population and of significant sub‐groups
within it. Women and girls make up one of the largest population sub‐groups, comprising slightly
more than half of normal populations. Their specific gender and reproductive roles give rise to
experiences, needs and priorities that are different from those of men and, in accordance with
international human rights obligations, therefore require equal attention and coverage in national
statistics. However, current statistical systems provide more data on men’s then women’s roles and
activities. For example, many provide little data on women’s unpaid domestic work, and under‐
enumeration is widely recognised as a major problem in data on women’s labour force participation
and the informal sector, which tends to be dominated by women. As a result, women’s contribution
to the economy is poorly recognised and the value and implications of the amount of unpaid work
carried out by women tend to be overlooked by policy makers.
International statistical standards as well as most national statistical systems have also largely failed
to recognise and accommodate the effects of gender differences and gender stereotypes on the
quality and meaning of data. Women and men have different kinds of knowledge and information
due to their different roles and activities. However, with the notable exception of data on fertility,
women’s reproductive health and childcare, in most developing countries data on women continues
to be largely collected from male heads of households by male interviewers using data collection
instruments largely designed by men. Data on men provided by men will be generally of better
quality than data on women provided by men, resulting in a better overall quality of data on men
than women in national statistical systems.
Some national statistical systems have, through the application of good statistical methods and in
response to user demands, adapted their approaches and methods in ways that do account for the
impact of gender on data and capture most gender differences. However, the integration of a
gender perspective has rarely been considered explicitly in such processes. An important exception
is the work that has been done in Nepal and in India in the 2001 Censuses of Population and Housing
and continued in Nepal in the 2011 census round.2
Integrating a gender perspective throughout the statistical system is thus a methodological
requirement for improving both data coverage and data quality. It requires the integration of
gender and the participation of women, including in decision making.
The gender statistics literature identifies a need for a gender perspective in statistics in five areas: a. Content: the topics and issues covered and how these are decided
b. Structure: concepts, definitions and classification systems
c. Data collection methods
d. Data compilation and dissemination
e. Data analysis.
2This will be discussed in the Regional Consultation 4‐6
th November.
Regional Core Set of Gender Statistics and Indicators for Asia and the Pacific
ESCAP, Statistics Division page 5
1. Content: Collect data on gender issues and women’s activities, interests and concerns
The statistical system must cover gender issues, which are those issues that influence gender
relations and contribute to the observed differences and inequalities between women and
men. More broadly, gender‐responsive statistics must cover the issues, problems and
concerns that relate to all aspects of women’s, as well as men’s lives, including their specific
needs, opportunities and contributions to society (United Nations 2013). Women and
women’s groups must be active participants in the decision making processes that identify
data priorities and determine what data will be collected.
2. Structure: Review concepts, definitions and classification systems from a gender perspective
Women also need to be involved in developing the concepts, definitions and classification
systems used in data collection to ensure that their diverse characteristics, activities and
interests are adequately captured and to eliminate any gender bias.
For example, the Occupation and Industry Classification Committee reviewing gender in the 2001
Population and Housing Census of Nepal discovered that the coding schemes previously applied provided
a more detailed 4‐digit level of classification for industries and occupations that were dominated by men,
while female‐dominated industries and occupations were often disaggregated only to the 2‐digit level. As
a result, the committee developed a Nepal standard 4 digit code classification of occupation and industry
for both male‐ and female‐dominated occupations and industries.
3. Collection methods: take into account the impact of gender stereotypes & socio‐cultural
factors on the data; actively involve women in all aspects of data collection
Data collection methods need to be reviewed and adapted take into account stereotypes
and social and cultural factors that may create gender biases in the data. This includes
implementing specific measures to address known issues such as the under‐reporting of
women’s economic activity and violence against women and in some cultures, the under‐
reporting of girls, their births and their deaths
(http://unstats.un.org/unsd/genderstatmanual/What‐are‐gender‐stats.ashx). Women
should also be involved in data collection as enumerators and field supervisors on an equal
basis with men.
4. Data compilation and dissemination: Individual‐level data are disaggregated by sex as a
primary and overall classification; dissemination should specifically target women and
women’s groups.
Data should be compiled disaggregated by sex at an aggregate level and for all lower levels
of analysis. For example, economic data should be disaggregated by sex for employment
and for employment by age, by urban/rural residence, by industry, by occupation, etc.
While sex disaggregation is essential, it is not sufficient. Data compilation should also be
specifically designed in consultation with women users and gender analysts in order to meet
their particular needs. Data compilation and presentation in the standard formats used for
conventional statistical analysis is also no longer sufficient. Data presentation now needs to
consider the interests, needs and capacities of a wider range of users and potential users
across the entire statistical skills spectrum. On the one hand, collaboration between national
Regional Core Set of Gender Statistics and Indicators for Asia and the Pacific
ESCAP, Statistics Division page 6
statistics offices and media experts is needed to develop creative ways of engaging new
users through the various media and the social media. On the other, particularly in less
developed countries, collaboration between NSOs and NGOs and others experienced in
working at the grassroots level is needed to present statistics and indicators on gender to
poorer rural and urban communities in ways that they can understand and use.
5. Approaches to data analysis:
Many NSOs undertake only basic descriptive analysis of their major data sets. International
statistical standards require that all individual‐level data and statistics be compiled and
disseminated disaggregated by sex. Data should be disaggregated at all levels. For example,
data on school enrolment might be disaggregated by sex for total enrolment, enrolment by
level of education, enrolment by rural/urban location of school, enrolment by rural/urban
residence and distance from school or by time taken to travel to school, etc.
Data analysis should incorporate gender through both sex‐disaggregation and gender‐
sensitive interpretation. For example, the interpretation of sex‐disaggregated data on
enrolment by rural/urban location of school and distance/time taken to travel to school
needs to consider the different attitudes of parents and societies to girls and boys travelling
far from home. Whether schools have separate toilets and running water also has a greater
(positive) effect on enrolment for girls than boys, particularly at puberty and older ages.
Analysis of household‐level data and statistics & aggregate statistics should incorporate
gender by interpretation. For example, interpretation of household data on access to
improved sources of water and sanitation or on distance to or time taken to water sources
should recognise the greater importance of access to improved sources of water for women
than men because women’s domestic roles revolve around the use of water. Interpretation
of household access to electricity should recognise has a particularly large effect on women
because it enables them to save time through labour‐saving devices such as electric cookers
and electric irons, to refrigerate food and thus prepare and store cooked food safely for
household use (reducing the need for daily trips to market and the incidence of diarrhoeal
diseases) or for sale in small enterprises (contributing to household income), etc.
Even the interpretation of economic aggregates such as production and trade statistics has a
gender dimension. For example, exports and imports have a potentially different impact on
women and men in terms of whether the most significant goods or services are primarily
produced by (or used by) women or men. When Viet Nam entered the World Trade
Agreement, many women in labour‐intensive sectors producing goods that could not
compete with similar products from China lost their jobs. While new employment
opportunities were created, these were in male‐dominated high technology industries
requiring higher levels of education and skills than those possessed by the displaced women
workers.3
3 Research Center for Female Labour and Gender (2008) ‘Impacts of Viet Nam’s admission to WTO on the employment, income and lives of women workers: Synthesis Report’, Hanoi: ILSSA; Nguyen, T.B.T., N.N. Dao, A. Moser and A. Pham (2009) Socio‐Economic Impacts of WTO Accession on Rural Women: Qualitative Research in Hai Duong and Dong Tharp, Vietnam. Hanoi: ILSSA, UNIFEM and AusAID
Regional Core Set of Gender Statistics and Indicators for Asia and the Pacific
ESCAP, Statistics Division page 7
Analysis that routinely identifies differences between women and men in all aspects of life
must become a standard element of quality analysis carried out as a matter of course by the
relevant experts rather than something that is only carried out as a special commission
under the label of ‘gender analysis’ and with the support of a ‘gender expert’.
2. Gender Statistics
Accepting that all statistics should be gender‐responsive, gender statistics and gender indicators can
then be defined as a specific set of statistics and indicators that describe and measure ‘women’s and
men’s status, gender roles and relations in society’
(http://unstats.un.org/unsd/genderstatmanual/Chapter‐2‐Introduction.ashx) and monitor changes
in the factors that influence women’s and men’s status, gender roles and relations.
3. What does this mean?
For national statistical systems:
Collecting gender‐responsive data and generating gender‐responsive statistics is the
responsibility of national statistical systems supported by regional and international statistical
bodies and international development agencies.
Real mainstreaming means that the statistical mainstream takes responsibility for serving the
statistical interests and meeting the statistical needs of 100% of the population by providing data
of equal quality and coverage on both females and males.
For sectoral and special statistics
All sectors (agriculture, economics, population and social statistics, health statistics, education statistics, industry statistics, environmental statistics etc) should:
Integrate a gender perspective in the definition, collection, compilation and dissemination of
their data and statistics
Provide sex‐disaggregated indicators for all individual‐level indicators
Integrate a gender perspective in the development and use of all indicator sets.
Each sector should use gender‐responsive data to generate gender‐responsive statistics and indicators that address the key gender equality policy issues in that sector. i.e.
Education statistics are responsible for developing and monitoring specialist indicators for
monitoring policies and programmes promoting gender equality in education and women’s
empowerment through education, particularly at the input and output levels
Agriculture statistics are responsible for developing and monitoring specialist indicators for
monitoring policies and programmes promoting gender equality and women’s
empowerment in agriculture, particularly at the input and output levels.
For the Regional Core Set of Gender Statistics and Indicators
Only the key ‘headline’ gender indicators for education and health that clearly measure and can monitor the general education and health dimensions of gender equality and/or women’s
Regional Core Set of Gender Statistics and Indicators for Asia and the Pacific
ESCAP, Statistics Division page 8
empowerment would be included in the Regional Core Set of Gender Statistics and Indicators. Ideally, these will be outcome indicators.
For national women’s machineries, gender focal points, gender experts
Collecting gender‐responsive data and generating gender‐responsive statistics are NOT the responsibilities of the national women’s machineries or of gender focal points. Funding for collecting gender‐responsive data and generating gender‐responsive statistics should be provided in the budgets of statistical agencies and should not be taken from budgets for national women’s machineries.
The role of women’s machineries and gender focal points is to:
1. Advocate and lobby for the integration of a gender perspective in national statistical systems
2. Advocate and lobby government and the Ministry of Finance for the allocation of adequate
budgets to enable statistical agencies to fulfil their obligation to meet the statistical needs of
women and girls
3. Provide technical support on gender in statistics and gender‐responsive statistics and
indicators
4. Monitor budgeting and the allocation of resources within the national statistical system for
the collection of gender‐responsive and the generation of gender indicators
5. Hold government and the statistical system to account for addressing the statistical needs of
women.
B. GENDER INDICATORS GLOBALLY AND IN ASIA AND THE PACIFIC
1. What are Gender Indicators?
Gender indicators are designed to measure women’s empowerment and progress toward gender
equality between women and men, including women’s and men’s status, gender roles and relations
in social, economic, cultural and political life. Gender equality/inequality can be measured directly
or indirectly.
Since equality and inequality are multi‐dimensional phenomena, composite indicators are required
to measure equality/inequality directly. However, the available composite measures face major
conceptual, practical and measurement difficulties and none are able to measure gender
equality/inequality directly.
Most regional and national efforts to develop gender indicators use sets of indicators covering a
range of topics considered to contribute directly or indirectly to gender equality or women’s
empowerment. The topics have often been drawn from UN processes, particularly the Beijing
Platform for Action (BPFA) and the Millennium Development Goals (MDGs).
Regional Core Set of Gender Statistics and Indicators for Asia and the Pacific
ESCAP, Statistics Division page 9
2. Global efforts to develop gender indicator sets
Beginning with the processes around the World Conferences on Women4, the United Nations system
and UN agencies have been the major focus of international efforts to develop and promote the use
of gender statistics and gender indicators. Paras 209‐212 of the 2005 Beijing Platform for Action
provides a comprehensive description of the responsibilities of national, regional and international
statistical agencies for providing sex‐disaggregated data, data on specific gender issues and gender‐
responsive data and statistics. However, at its twenty‐third special session (Beijing+5), the General
Assembly of the United Nations noted the lack of a minimum set of gender indicators to monitor
initiatives to implement the BPFA at the national, regional and global levels.
As a result, in 2006 an Interagency and Expert Group on the Development of Gender Statistics (IAEG‐
GS) was convened by the United Nations in New York to review initiatives supporting capacity
development of national statistical systems to develop gender statistics. Subsequent meetings were
held in Rome (2007), Accra (2009) and Manila (2010). In Rome advisory groups were established on
establishing an international gender statistics and indicators database and on gender statistics
training. In 2009, a subgroup of the Advisory Group working on the international database was
formed to develop a Global Minimum Set of Gender Indicators and a new advisory group was
established on gender statistics legislation. In 2011, a programme review of gender statistics
prepared by Ghana (E/CN.3/2011/3) was discussed by the 42nd session of the UN Statistical
Commission (UNSC), which requested implementation of a global programme on gender statistics
including a further review of gender statistics aimed at establishing a minimum set of gender
indicators (E/2011/24‐E/CN.3/2011/37). These were subsequently developed by the subgroup “for
international compilation and dissemination to facilitate global comparisons of the state of gender
statistics to evaluate the situation of women and men and the capacity of countries in this regard”
(ESA/STAT/AC.242/5).
The concept note recognised at least three levels of indicators covering international comparisons,
specific regional circumstances and national monitoring. However, the global minimum set covered
only the international level. Although it recognised the need for indicators and statistics for gender
analysis, the stated main purpose of the minimum set of indicators was to provide a basis for
monitoring gender issues. The Advisory Group felt that a much larger set with additional cross‐
tabulations would be needed for gender analysis at the national level and for national policy
development and monitoring.
The global set is organised in terms of topic‐oriented domains linked to particular kinds of data.
Domain I, Economic structures, participation in productive activities and access to resources covers
time use, labour force statistics and data on the use of technology and media. Domains II Education
and III Health and related services cover education and health statistics, while Domain IV Public life
and decision making covers statistics on the women’s share of a range of decision making positions.
Domain V Human rights of women and girl children covers early marriage and domestic and other
forms of violence against women and girls. A specific UN agency has been assigned responsibility for
each indicator. This approach links the indicators to a general area of policy interest and to a
4 The Nairobi Forward Looking Strategies 1985 called on governments to provide reliable statistics on women (paras 58 and 64) and gender‐specific statistics and information (para 120).
Regional Core Set of Gender Statistics and Indicators for Asia and the Pacific
ESCAP, Statistics Division page 10
potential source of technical and other support for indicator development. However, it does not
provide very clear guidance to users on how the indicators should be used.
The main criteria for inclusion in the Global Minimum Set of Gender Indicators were that the indicators should:
1. Address relevant issues related to gender equality and/or women’s empowerment 2. Be conceptually clear, easy to interpret, and have an agreed international definition 3. Be regularly produced5 by countries, with sufficient coverage to track progress over time.
However, the final set included indicators that only partially meet the criteria. The set is divided into
three tiers: Indicators in Tier 1 meet all three criteria. Those in Tier 2 meet criteria 1 and 2, while
Tier 3 includes indicators that meet only criterion 1 but are conceptually important and are
therefore included to “encourage methodological development and/or further data production”
(ESA/STAT/AC.242/5: 3).
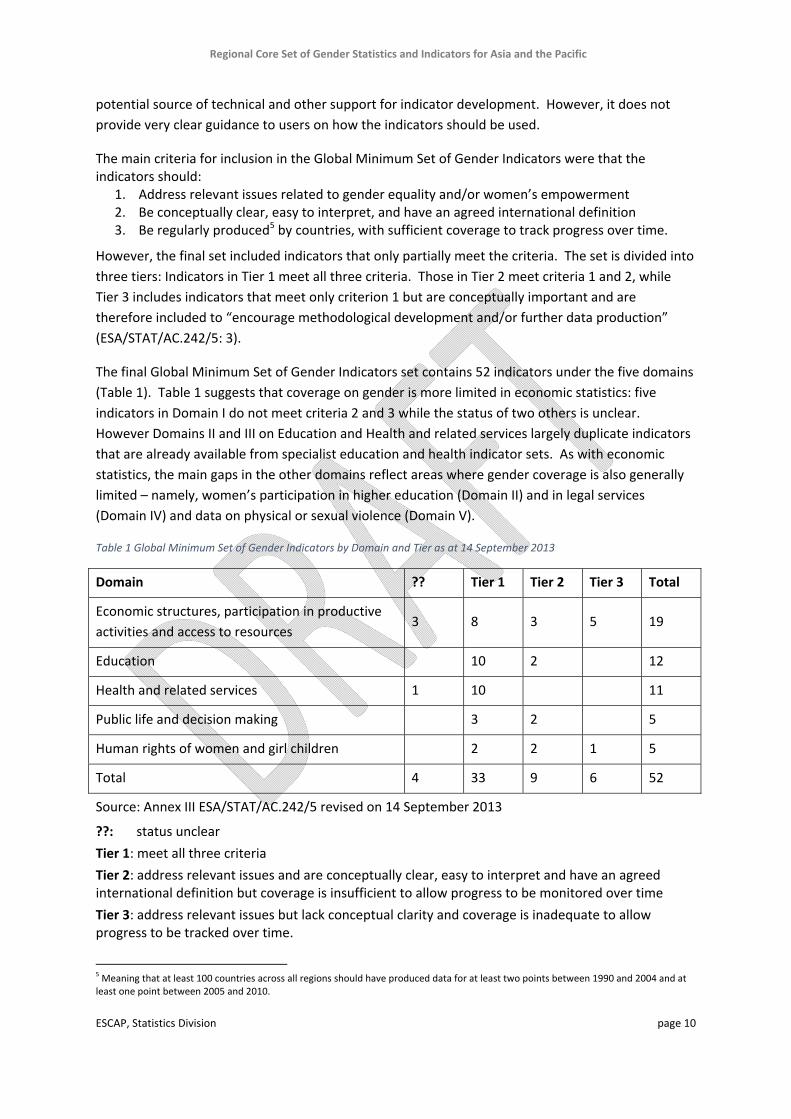
The final Global Minimum Set of Gender Indicators set contains 52 indicators under the five domains
(Table 1). Table 1 suggests that coverage on gender is more limited in economic statistics: five
indicators in Domain I do not meet criteria 2 and 3 while the status of two others is unclear.
However Domains II and III on Education and Health and related services largely duplicate indicators
that are already available from specialist education and health indicator sets. As with economic
statistics, the main gaps in the other domains reflect areas where gender coverage is also generally
limited – namely, women’s participation in higher education (Domain II) and in legal services
(Domain IV) and data on physical or sexual violence (Domain V).
Table 1 Global Minimum Set of Gender Indicators by Domain and Tier as at 14 September 2013
Domain ?? Tier 1 Tier 2 Tier 3 Total
Economic structures, participation in productive
activities and access to resources 3 8 3 5 19
Education 10 2 12
Health and related services 1 10 11
Public life and decision making 3 2 5
Human rights of women and girl children 2 2 1 5
Total 4 33 9 6 52
Source: Annex III ESA/STAT/AC.242/5 revised on 14 September 2013
??: status unclear
Tier 1: meet all three criteria
Tier 2: address relevant issues and are conceptually clear, easy to interpret and have an agreed international definition but coverage is insufficient to allow progress to be monitored over time
Tier 3: address relevant issues but lack conceptual clarity and coverage is inadequate to allow progress to be tracked over time.
5 Meaning that at least 100 countries across all regions should have produced data for at least two points between 1990 and 2004 and at least one point between 2005 and 2010.
Regional Core Set of Gender Statistics and Indicators for Asia and the Pacific
ESCAP, Statistics Division page 11
3. Gender Indicator sets in Asia and the Pacific
The Beijing Fourth World Conference on Women clearly established the need for gender indicators
to monitor progress in addressing the 12 critical areas of concern in Asia and the Pacific the first
major set of gender indicators appeared only in November 2003.6 The proposed set comprised 152
indicators organised around the strategic objectives and the 12 critical areas of concern of the BPFA
together with an additional 6 indicators focused on institutional and financial arrangements.
For the Bejing+10 process, the ESCAP Statistical Division identified a more limited set of indicators of
gender equality covering education and health, economic opportunities and employment and
political participation.7
Although the BPFA continued to influence the selection of gender indicators other international
processes, particularly the MDGs began to play an important role. A 2007 discussion paper
reflected a widespread concern8 that the MDG targets and indicators did not adequately reflect the
commitments made in the Millennium Declaration and other international standards on gender
equality. The paper ‘Promoting Gender Equality and Women’s Empowerment in the Asia‐Pacific:
Linking the Millennium Development Goals with the CEDAW9 and Beijing Indicators’ resulted from an
Expert Group Meeting on Developing Supplementary Indicators on Social Inclusion, Population,
Gender Equality and Health Promotion in the MDG Process.10 Chapter 4 recommended the addition
of two complementary targets and 21 region‐specific indicators to strengthen monitoring of gender
equality and to align the MDGs with CEDAW and BPFA. These included a target and three indicators
on violence against women, a topic that was covered in the BPFA but not in the MDGs. However,
because the development of the MDG indicators was driven at a global level these regional inputs
had little impact.
4. What can we learn from previous gender indicator sets
The link between the early gender indicators and the Beijing Platform for Action was strong. Most
indicator sets were structured in terms of the 12 critical areas of concern, while some were also
organised around the strategic objectives identified for each area of concern. The 12 critical areas of
concern created a comprehensive topical structure, while the strategic objectives generally linked
the indicators to specific gender issues and policy objectives.
However, development of gender indicator sets did not lead to a significant increase in the
availability of gender statistics or gender indicators. Nor did it increase the use of the indicators that
were available. This was partly due to problems in the way in which the first gender indicators were
developed and to weaknesses in the indicators themselves:
6 Social Development Division, Gender Indicators for monitoring the implementation of the Beijing Platform for Action on women in the ESCAP region. November 2003. 7 ESCAP Statistics Division, Gender Equality and Empowerment: A Statistical Profile of the ESCAP region, 2005. 8 See also Marie Sicat, ‘Promoting Gender Equality and Women’s Empowerment in the Asia‐Pacific Gender and Development Indicators: Synergies between Beijing, CEDAW and the MDGs’, Gender Equality and Empowerment Section Division for Social Development, UNESCAP Bangkok, Thailand, Closing the Gap: Strategies to Combat and Monitor Exclusion in Asia and the Pacific 29 September‐1 October 2009 9 CEDAW – Convention of the Elimination of All Forms of Discrimination Against Women. 10 United Nations Economic and Social Commission for Asia and the Pacific Bangkok, Thailand, 13‐15 November 2007.
Regional Core Set of Gender Statistics and Indicators for Asia and the Pacific
ESCAP, Statistics Division page 12
Lack of technical input from statistics agencies or statistics experts resulted in major technical
flaws in early indicator sets that made it difficult for national statistics offices to become
involved or to provide support.11
Organising the indicators around the 12 critical areas of concern resulted in very large indicator
sets that could not be regularly produced or supported by national statistics offices.
Organising the indicators around the strategic objectives for each of the 12 critical areas of
concern had the advantage of creating a clear link to policy but contributed to the large number
of individual indicators.
Organising the indicators around the 12 critical areas of concern also led to indicator sets that
lacked a clear focus on gender equality or women’s empowerment and which included many
general indicators (particularly on poverty) that were not directly linked to a gender
dimension.12
Indicators were not designed to meet the needs of specific users. In particular, the needs of
civil society users for simple, easy‐to‐use indicators tended to be overlooked.
The purpose of indicators was usually not specified, making it difficult for many potential users
to understand how to use them.
Development of indicator sets was often not linked to capacity development for either users or
producers.
11 See the 2003 gender indicator set for examples.
12 Some indicators covered the entire population – e.g. Percentage of the population living below the national poverty line. While
it is a general indicator of the development context, it is not clear how this might be regarded as a ‘gender indicator’.
Regional Core Set of Gender Statistics and Indicators for Asia and the Pacific
ESCAP, Statistics Division page 13
II. Requirements for a Regional Core Set of Gender Statistics and
Indicators
In developing the Regional Core Set of Gender Statistics and Indicators in Asia and the Pacific, a
number of issues and requirements were considered. The regional set should:
1. FACILITATE CROSS‐COUNTRY COMPARISONS WITHIN THE REGION AND AT GLOBAL LEVEL
In order to permit international comparisons at the global level, the Regional Core Set of Gender
Statistics and Indicators has to mirror to a large extent the Global Minimum Set of Gender Indicators.
Despite the diversity within the region, the Regional Core Set of Gender Statistics and Indicators
needs to draw on the underlying commonalities of women’s situation and gender relations in order
to monitor and compare gender equality and women’s empowerment at the regional level.
Asia and the Pacific presents a major challenge for any effort that seeks to identify commonalities
and make comparisons. The region is characterised by enormous economic and cultural diversity,
rapid change and great variation in levels of development both within some individual member
states and between member states. The region includes some of the highest income countries in
the world as well as thirteen LDCs.
Some of the salient features of the region include:
A. High levels of poverty in the midst of rapidly escalating affluence
800 million+ live on less than $1.25‐a‐day
Many of the poor are women & female headed households.
The impact of poverty on women and men is different, especially where gender inequality is
extreme.
B. Marked income disparities within and between member states:
From LDCs and high income countries
From high levels of gender inequality to significant gains in women’s empowerment
Male‐female wage gap for similar work also large (0.63 in India 2010)
C. Large rural‐urban disparities and large rural populations with poor access to basic services:
1/4 of the rural population lacks safe drinking water (7% in urban areas); Less than 1/3 have improved sanitation (70% in urban areas);
Similar disparities in access to education, especially for girls.
D. Great variation in the development & related gender issues affecting countries
International labour in‐migration is a major issue for a number of member states.
International labour outmigration is a major issue for others
Domestic workers and care workers (both mainly women) are significant policy targets in
member states of in‐migration and outmigration, although from different perspectives.
A number of member states are in conflict or post‐conflict situations
Regional Core Set of Gender Statistics and Indicators for Asia and the Pacific
ESCAP, Statistics Division page 14
Some member states are destination countries for large numbers of refugees, while
others are source countries for large numbers of refugees.
2. ADDRESS THE SPECIFIC NEEDS AND SITUATIONS OF MEMBER STATES IN THE ASIA AND PACIFIC REGION
The Regional Core Set goes beyond the Global Minimum Set to monitor dimensions of gender
equality that are specific to the region or of greater significance in Asia and the Pacific. However, it
preserves the ability to monitor gender equality and women’s empowerment at the global level by
including most of the indicators from the Global Minimum Set. While focusing on commonalities at
the global and regional levels, the draft Regional Core Set also includes gender statistics and gender
indicators that cover the diversity of gender issues in the region in order to support gender analysis
and policy development and monitoring at the sub‐regional and national levels.
3. MEET THE NEEDS OF USERS
In order to ensure that the Regional Core Set will be used in gender analysis and for national gender equality policy development and monitoring, the structure and presentation of the indicators were designed to focus on users. A broader range of users and potential users have been identified and a variety of possible uses have been suggested.
4. ADDRESS THE NEEDS OF DATA PRODUCERS
While the main focus of the Regional Core Set of Gender Statistics and Indicators is on users, the needs and capacities of data producers to provide the underlying statistics and to support production of the indicators has also been considered. Sources of data have been identified for each individual indicator for which data currently are available. Potential sources of data have also been identified for the “aspirational indicators” for which data are not currently available but which are considered a priority for future statistical development in the region. The needs of National Statistics Offices for capacity development on gender‐responsive statistics are also identified and a regional capacity building programme will be developed.
5. UTILISE EXISTING DATA
In order to ensure that indicators in the Regional Core Set can be constructed by the majority of member states, the gender indicators included should be based on statistics that are collected by most national statistical systems.
6. IDENTIFY AREAS THAT REQUIRE THE DEVELOPMENT OF NEW GENDER STATISTICS
However, gender statistics is a new area and statistics (particularly gender‐responsive statistics) are not available for the construction of gender indicators in a number of important areas. This has been explicitly recognised in the EDGE programme (see below), which includes the development of standards and guidelines for indicators of entrepreneurship and assets, two such areas for which statistics are not currently available in most member states. Consequently, the Regional Core Set includes a number of indicators that require statistics that may not be available in many countries but which are of such importance that their development should be a priority for national statistical systems in the region with the support of the international statistical system. In many cases, their collection would involve fairly minor changes to data collection in existing surveys. In others, particularly time use data, they involve the extension of a relatively well developed methodology to

Regional Core Set of Gender Statistics and Indicators for Asia and the Pacific
ESCAP, Statistics Division page 15
countries that have not previously collected such data, either as a stand‐alone survey or as a module in an existing survey.
Regional Core Set of Gender Statistics and Indicators for Asia and the Pacific
ESCAP, Statistics Division page 16
III. Structure of the Regional Core Set
The Regional Core Set of Gender Statistics and Indicators consists of seven domains and one target
group sub‐set. Indicators are divided into headline indicators and supporting indicators.
1. DOMAIN
The domains of the Regional Core Set of Gender Statistics and Indicators based on the domains of
the Global Minimum Set of Gender Indicators. However, the decision to link each domain to broad
policy goals as a guide to the potential uses of the indicators for national policy development and
monitoring led to a tentative decision to divide Domain I of the Global Minimum Set into three more
policy‐related domains.
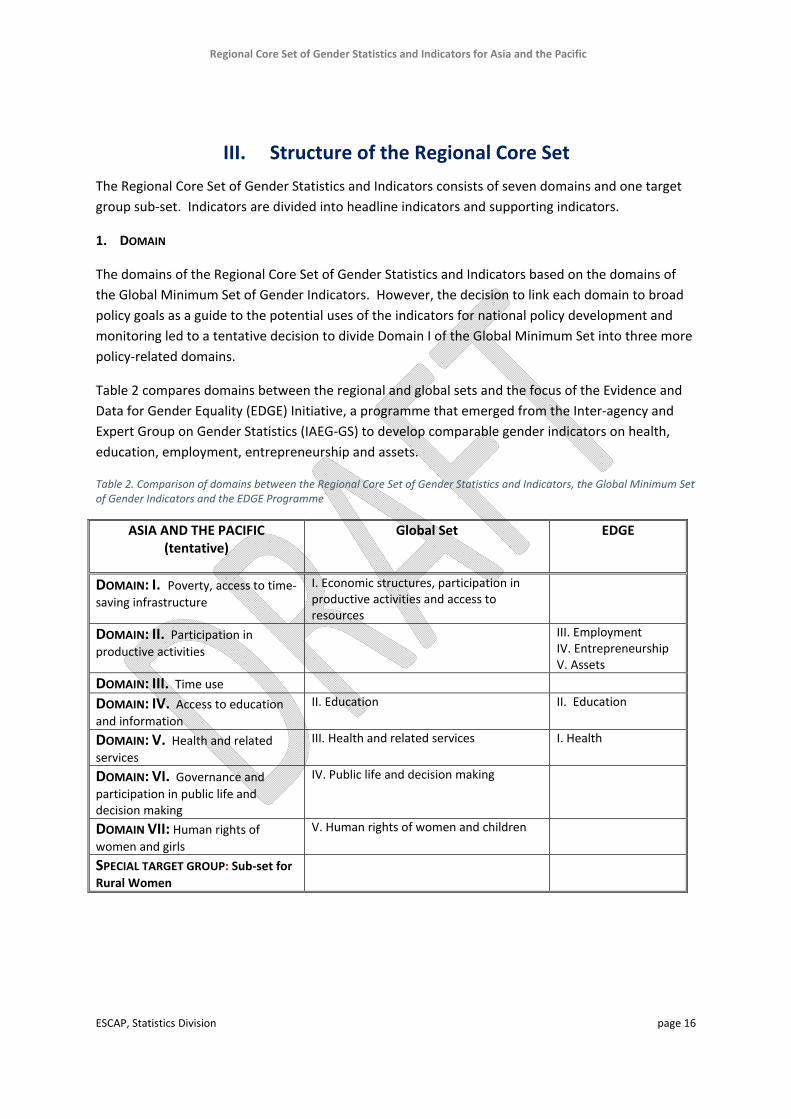
Table 2 compares domains between the regional and global sets and the focus of the Evidence and
Data for Gender Equality (EDGE) Initiative, a programme that emerged from the Inter‐agency and
Expert Group on Gender Statistics (IAEG‐GS) to develop comparable gender indicators on health,
education, employment, entrepreneurship and assets.
Table 2. Comparison of domains between the Regional Core Set of Gender Statistics and Indicators, the Global Minimum Set of Gender Indicators and the EDGE Programme
ASIA AND THE PACIFIC (tentative)
Global Set EDGE
DOMAIN: I. Poverty, access to time‐
saving infrastructure
I. Economic structures, participation in productive activities and access to resources
DOMAIN: II. Participation in productive activities
III. Employment IV. Entrepreneurship V. Assets
DOMAIN: III. Time use
DOMAIN: IV. Access to education and information
II. Education II. Education
DOMAIN: V. Health and related services
III. Health and related services I. Health
DOMAIN: VI. Governance and participation in public life and decision making
IV. Public life and decision making
DOMAIN VII: Human rights of
women and girls
V. Human rights of women and children
SPECIAL TARGET GROUP: Sub‐set for Rural Women
Regional Core Set of Gender Statistics and Indicators for Asia and the Pacific
ESCAP, Statistics Division page 17
2. GENDER EQUALITY OR WOMEN’S EMPOWERMENT POLICY OBJECTIVE
The domains in the draft Regional Core Set of Gender Statistics and Indicators are linked indicators
to specific but relatively broad gender equality and women’s empowerment policy objectives. Each
domain includes at least one gender‐related policy objective. These were chosen for their broad
relevance to the majority of member states or for their particular importance for particular sub‐
groups of member states, such as LDCs. Linking priority gender‐related issues to specific policy
objectives helps to avoid lengthy unfocused “shopping lists” of indicators and suggests how the
indicator set might be used.
3. HEADLINE INDICATOR
Headline indicators are designed primarily for global and regional monitoring and for cross‐country
comparisons within significant sub‐regional groupings, such as among LDCs. At least one headline
indicator is provided to monitor progress towards achieving each gender equality or women’s
empowerment policy objective. In general, they are measures of outcomes or major outputs that
are directly linked to the gender policy objective.
4. SUPPORTING INDICATORS
Each headline indicator is provided with several supporting gender indicators or gender statistics at
the input or output level to facilitate gender equality policy analysis, more general kinds of gender
analysis and advocacy and lobbying, particularly but not only around the specific policy objective. As
the name suggests, they support the Headline indicator, in some cases as inputs to the headline
indicator and in others as aids to its interpretation. Supporting indicators are also more specific and
thus provide space for indicators of specifically regional, sub‐regional or national issues.
5. RATIONALE FOR INDICATOR SELECTION
Supporting indicators were selected to focus on the most strategic aspects of gender equality and/or
women’s empowerment. Since ALL specialist indicator sets should be gender‐responsive, the core
set of gender indicators should add value and challenge both gender analysts and the statistical
system.
The supporting indicators are intended primarily for use at the national or sub‐national level or for
comparisons among countries at similar levels of development and with comparable data sources.
For example, the supporting indicators could support cross‐country comparisons among LDCs with
access to MICS, LSMS or the gender module of the Demographic and Health Surveys.
Regional Core Set of Gender Statistics and Indicators for Asia and the Pacific
ESCAP, Statistics Division page 18
IV. Draft Regional Core Set of Gender Statistics and Indicators
INDICATOR
*Indicators included in the Global Minimum Set of Gender
Indicators (September 2013)
DATA SOURCE
Frequency
Responsive institution
USES
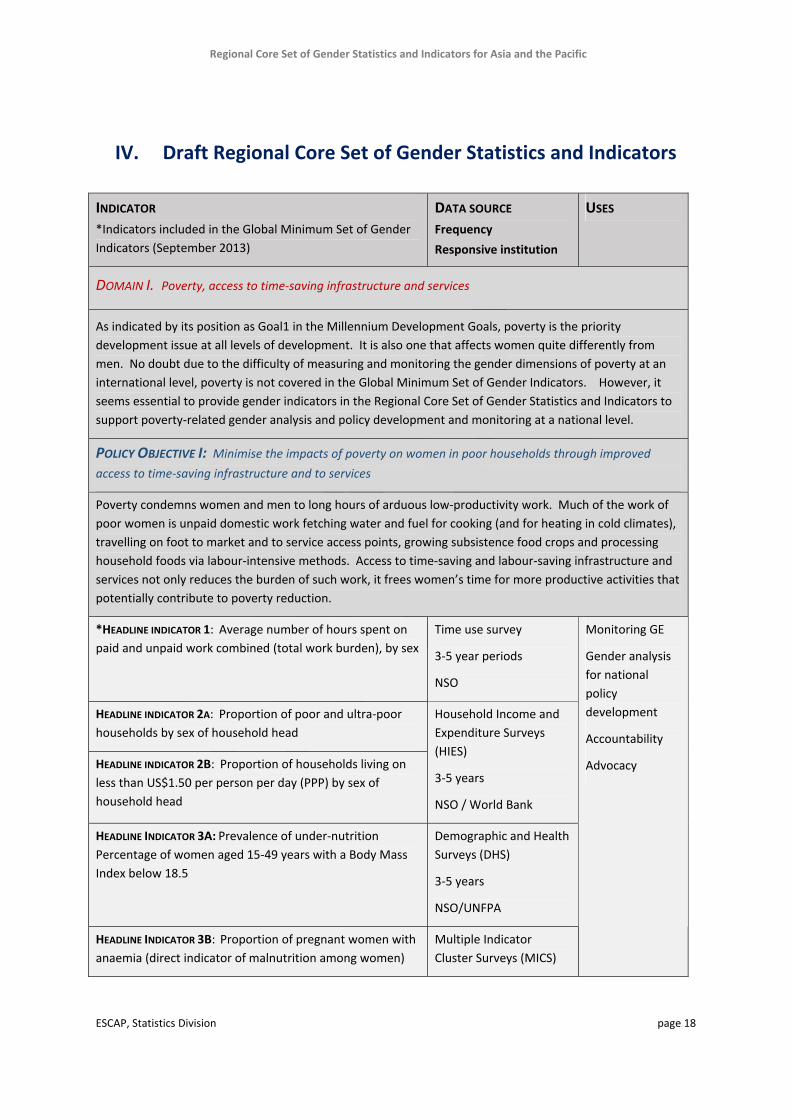
DOMAIN I. Poverty, access to time‐saving infrastructure and services
As indicated by its position as Goal1 in the Millennium Development Goals, poverty is the priority
development issue at all levels of development. It is also one that affects women quite differently from
men. No doubt due to the difficulty of measuring and monitoring the gender dimensions of poverty at an
international level, poverty is not covered in the Global Minimum Set of Gender Indicators. However, it
seems essential to provide gender indicators in the Regional Core Set of Gender Statistics and Indicators to
support poverty‐related gender analysis and policy development and monitoring at a national level.
POLICY OBJECTIVE I: Minimise the impacts of poverty on women in poor households through improved
access to time‐saving infrastructure and to services
Poverty condemns women and men to long hours of arduous low‐productivity work. Much of the work of
poor women is unpaid domestic work fetching water and fuel for cooking (and for heating in cold climates),
travelling on foot to market and to service access points, growing subsistence food crops and processing
household foods via labour‐intensive methods. Access to time‐saving and labour‐saving infrastructure and
services not only reduces the burden of such work, it frees women’s time for more productive activities that
potentially contribute to poverty reduction.
*HEADLINE INDICATOR 1: Average number of hours spent on
paid and unpaid work combined (total work burden), by sex
Time use survey
3‐5 year periods
NSO
HEADLINE INDICATOR 2A: Proportion of poor and ultra‐poor
households by sex of household head
HEADLINE INDICATOR 2B: Proportion of households living on
less than US$1.50 per person per day (PPP) by sex of
household head
Household Income and
Expenditure Surveys
(HIES)
3‐5 years
NSO / World Bank
HEADLINE INDICATOR 3A: Prevalence of under‐nutrition
Percentage of women aged 15‐49 years with a Body Mass
Index below 18.5
Demographic and Health
Surveys (DHS)
3‐5 years
NSO/UNFPA
HEADLINE INDICATOR 3B: Proportion of pregnant women with
anaemia (direct indicator of malnutrition among women)
Multiple Indicator
Cluster Surveys (MICS)
Monitoring GE
Gender analysis
for national
policy
development
Accountability
Advocacy
Regional Core Set of Gender Statistics and Indicators for Asia and the Pacific
ESCAP, Statistics Division page 19
INDICATOR
*Indicators included in the Global Minimum Set of Gender
Indicators (September 2013)
DATA SOURCE
Frequency
Responsive institution
USES
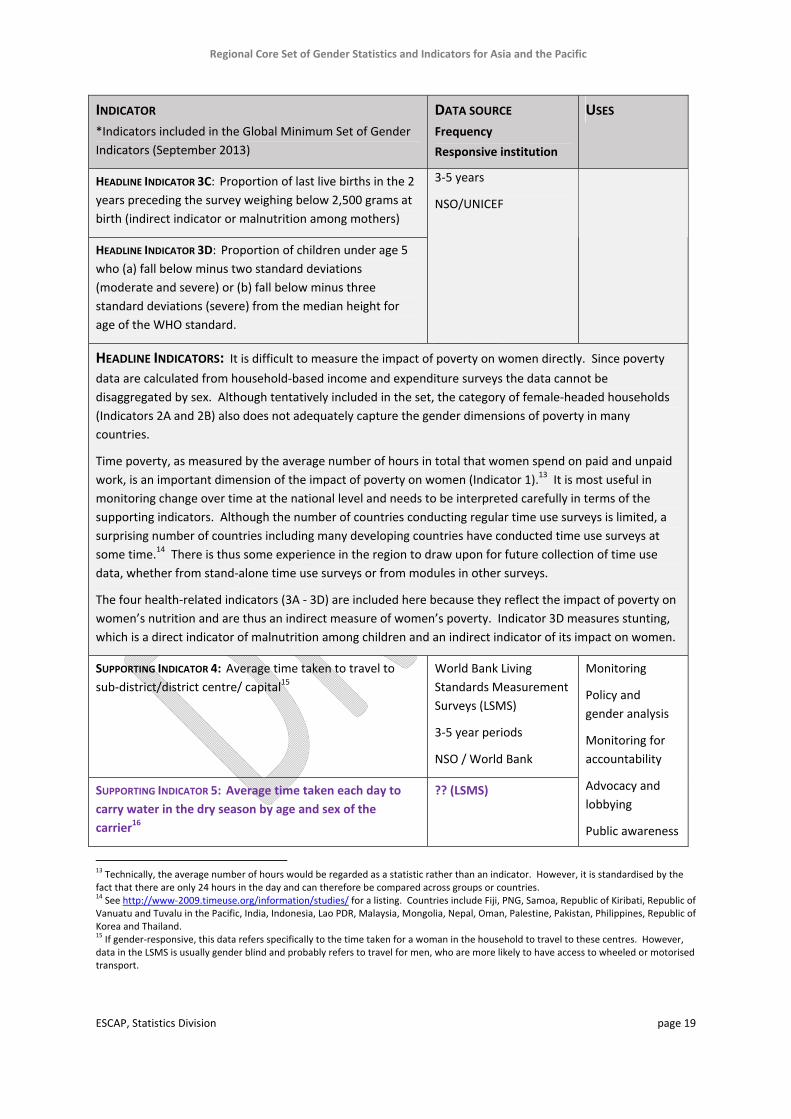
HEADLINE INDICATOR 3C: Proportion of last live births in the 2
years preceding the survey weighing below 2,500 grams at
birth (indirect indicator or malnutrition among mothers)
HEADLINE INDICATOR 3D: Proportion of children under age 5
who (a) fall below minus two standard deviations
(moderate and severe) or (b) fall below minus three
standard deviations (severe) from the median height for
age of the WHO standard.
3‐5 years
NSO/UNICEF
HEADLINE INDICATORS: It is difficult to measure the impact of poverty on women directly. Since poverty
data are calculated from household‐based income and expenditure surveys the data cannot be
disaggregated by sex. Although tentatively included in the set, the category of female‐headed households
(Indicators 2A and 2B) also does not adequately capture the gender dimensions of poverty in many
countries.
Time poverty, as measured by the average number of hours in total that women spend on paid and unpaid
work, is an important dimension of the impact of poverty on women (Indicator 1).13 It is most useful in
monitoring change over time at the national level and needs to be interpreted carefully in terms of the
supporting indicators. Although the number of countries conducting regular time use surveys is limited, a
surprising number of countries including many developing countries have conducted time use surveys at
some time.14 There is thus some experience in the region to draw upon for future collection of time use
data, whether from stand‐alone time use surveys or from modules in other surveys.
The four health‐related indicators (3A ‐ 3D) are included here because they reflect the impact of poverty on
women’s nutrition and are thus an indirect measure of women’s poverty. Indicator 3D measures stunting,
which is a direct indicator of malnutrition among children and an indirect indicator of its impact on women.
SUPPORTING INDICATOR 4: Average time taken to travel to
sub‐district/district centre/ capital15 World Bank Living
Standards Measurement
Surveys (LSMS)
3‐5 year periods
NSO / World Bank
SUPPORTING INDICATOR 5: Average time taken each day to
carry water in the dry season by age and sex of the
carrier16
?? (LSMS)
Monitoring
Policy and
gender analysis
Monitoring for
accountability
Advocacy and
lobbying
Public awareness
13 Technically, the average number of hours would be regarded as a statistic rather than an indicator. However, it is standardised by the
fact that there are only 24 hours in the day and can therefore be compared across groups or countries. 14 See http://www‐2009.timeuse.org/information/studies/ for a listing. Countries include Fiji, PNG, Samoa, Republic of Kiribati, Republic of
Vanuatu and Tuvalu in the Pacific, India, Indonesia, Lao PDR, Malaysia, Mongolia, Nepal, Oman, Palestine, Pakistan, Philippines, Republic of Korea and Thailand. 15 If gender‐responsive, this data refers specifically to the time taken for a woman in the household to travel to these centres. However,
data in the LSMS is usually gender blind and probably refers to travel for men, who are more likely to have access to wheeled or motorised transport.
Regional Core Set of Gender Statistics and Indicators for Asia and the Pacific
ESCAP, Statistics Division page 20
INDICATOR
*Indicators included in the Global Minimum Set of Gender
Indicators (September 2013)
DATA SOURCE
Frequency
Responsive institution
USES
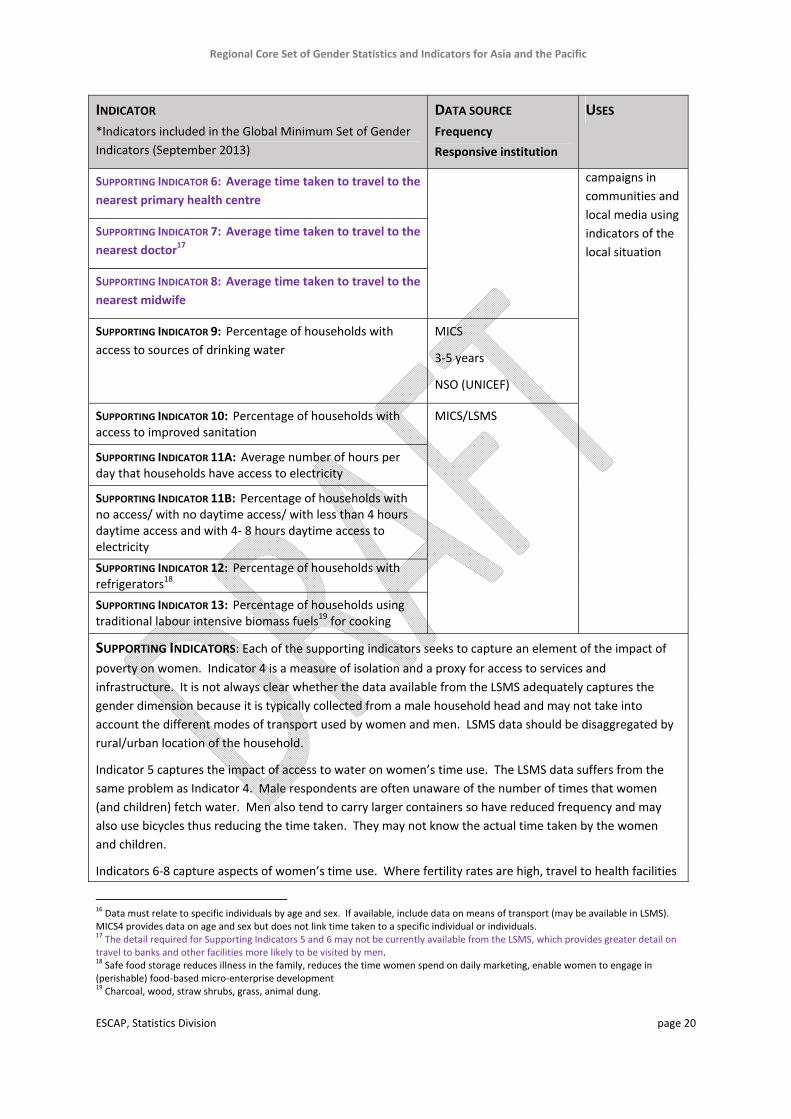
SUPPORTING INDICATOR 6: Average time taken to travel to the
nearest primary health centre
SUPPORTING INDICATOR 7: Average time taken to travel to the
nearest doctor17
SUPPORTING INDICATOR 8: Average time taken to travel to the
nearest midwife
SUPPORTING INDICATOR 9: Percentage of households with
access to sources of drinking water
MICS
3‐5 years
NSO (UNICEF)
SUPPORTING INDICATOR 10: Percentage of households with access to improved sanitation
SUPPORTING INDICATOR 11A: Average number of hours per day that households have access to electricity
SUPPORTING INDICATOR 11B: Percentage of households with no access/ with no daytime access/ with less than 4 hours daytime access and with 4‐ 8 hours daytime access to electricity
SUPPORTING INDICATOR 12: Percentage of households with refrigerators18 SUPPORTING INDICATOR 13: Percentage of households using traditional labour intensive biomass fuels19 for cooking
MICS/LSMS
campaigns in
communities and
local media using
indicators of the
local situation
SUPPORTING INDICATORS: Each of the supporting indicators seeks to capture an element of the impact of
poverty on women. Indicator 4 is a measure of isolation and a proxy for access to services and
infrastructure. It is not always clear whether the data available from the LSMS adequately captures the
gender dimension because it is typically collected from a male household head and may not take into
account the different modes of transport used by women and men. LSMS data should be disaggregated by
rural/urban location of the household.
Indicator 5 captures the impact of access to water on women’s time use. The LSMS data suffers from the
same problem as Indicator 4. Male respondents are often unaware of the number of times that women
(and children) fetch water. Men also tend to carry larger containers so have reduced frequency and may
also use bicycles thus reducing the time taken. They may not know the actual time taken by the women
and children.
Indicators 6‐8 capture aspects of women’s time use. Where fertility rates are high, travel to health facilities
16 Data must relate to specific individuals by age and sex. If available, include data on means of transport (may be available in LSMS).
MICS4 provides data on age and sex but does not link time taken to a specific individual or individuals. 17 The detail required for Supporting Indicators 5 and 6 may not be currently available from the LSMS, which provides greater detail on
travel to banks and other facilities more likely to be visited by men. 18 Safe food storage reduces illness in the family, reduces the time women spend on daily marketing, enable women to engage in
(perishable) food‐based micro‐enterprise development 19 Charcoal, wood, straw shrubs, grass, animal dung.
Regional Core Set of Gender Statistics and Indicators for Asia and the Pacific
ESCAP, Statistics Division page 21
INDICATOR
*Indicators included in the Global Minimum Set of Gender
Indicators (September 2013)
DATA SOURCE
Frequency
Responsive institution
USES
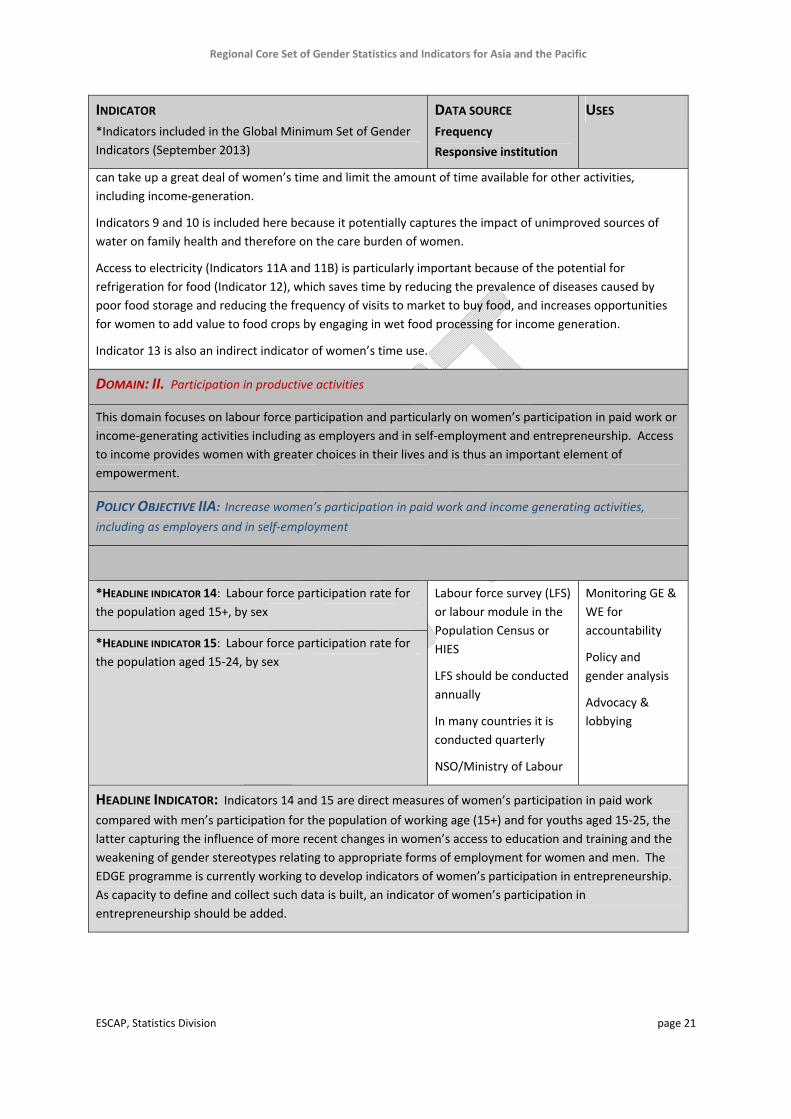
can take up a great deal of women’s time and limit the amount of time available for other activities,
including income‐generation.
Indicators 9 and 10 is included here because it potentially captures the impact of unimproved sources of
water on family health and therefore on the care burden of women.
Access to electricity (Indicators 11A and 11B) is particularly important because of the potential for
refrigeration for food (Indicator 12), which saves time by reducing the prevalence of diseases caused by
poor food storage and reducing the frequency of visits to market to buy food, and increases opportunities
for women to add value to food crops by engaging in wet food processing for income generation.
Indicator 13 is also an indirect indicator of women’s time use.
DOMAIN: II. Participation in productive activities
This domain focuses on labour force participation and particularly on women’s participation in paid work or
income‐generating activities including as employers and in self‐employment and entrepreneurship. Access
to income provides women with greater choices in their lives and is thus an important element of
empowerment.
POLICY OBJECTIVE IIA: Increase women’s participation in paid work and income generating activities,
including as employers and in self‐employment
*HEADLINE INDICATOR 14: Labour force participation rate for
the population aged 15+, by sex
*HEADLINE INDICATOR 15: Labour force participation rate for
the population aged 15‐24, by sex
Labour force survey (LFS)
or labour module in the
Population Census or
HIES
LFS should be conducted
annually
In many countries it is
conducted quarterly
NSO/Ministry of Labour
Monitoring GE &
WE for
accountability
Policy and
gender analysis
Advocacy &
lobbying
HEADLINE INDICATOR: Indicators 14 and 15 are direct measures of women’s participation in paid work
compared with men’s participation for the population of working age (15+) and for youths aged 15‐25, the
latter capturing the influence of more recent changes in women’s access to education and training and the
weakening of gender stereotypes relating to appropriate forms of employment for women and men. The
EDGE programme is currently working to develop indicators of women’s participation in entrepreneurship.
As capacity to define and collect such data is built, an indicator of women’s participation in
entrepreneurship should be added.
Regional Core Set of Gender Statistics and Indicators for Asia and the Pacific
ESCAP, Statistics Division page 22
INDICATOR
*Indicators included in the Global Minimum Set of Gender
Indicators (September 2013)
DATA SOURCE
Frequency
Responsive institution
USES
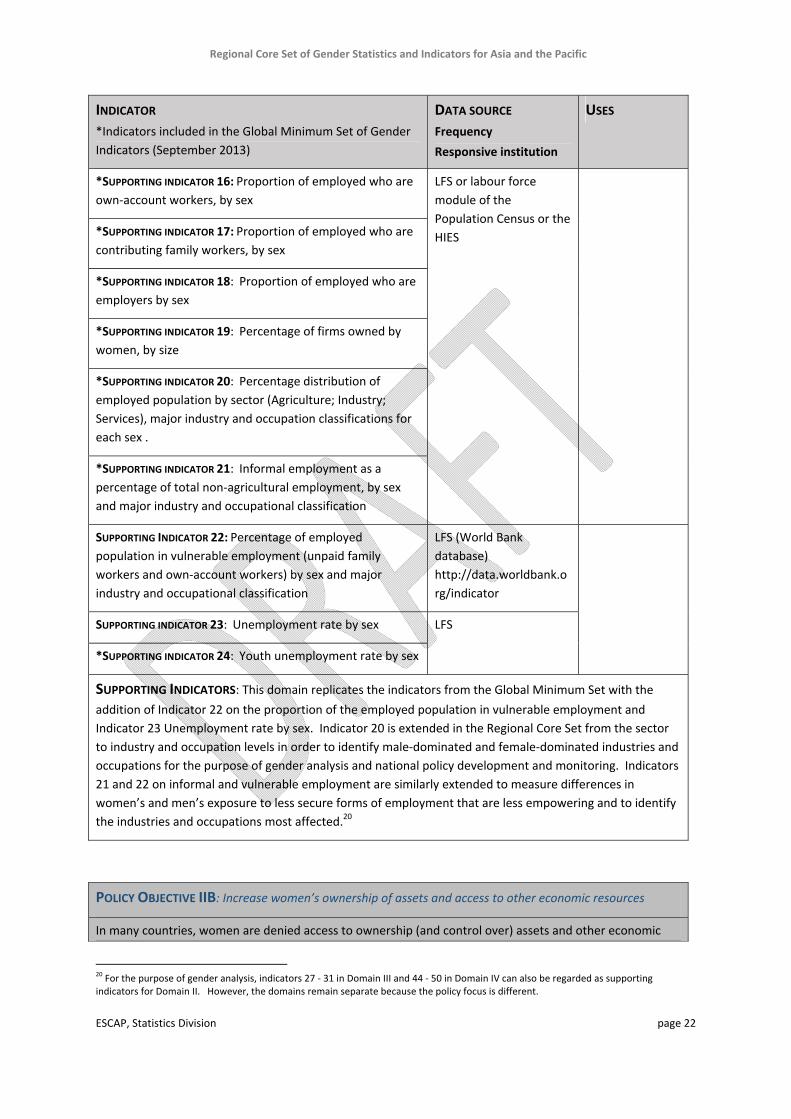
*SUPPORTING INDICATOR 16: Proportion of employed who are
own‐account workers, by sex
*SUPPORTING INDICATOR 17: Proportion of employed who are
contributing family workers, by sex
*SUPPORTING INDICATOR 18: Proportion of employed who are
employers by sex
*SUPPORTING INDICATOR 19: Percentage of firms owned by
women, by size
*SUPPORTING INDICATOR 20: Percentage distribution of
employed population by sector (Agriculture; Industry;
Services), major industry and occupation classifications for
each sex .
*SUPPORTING INDICATOR 21: Informal employment as a
percentage of total non‐agricultural employment, by sex
and major industry and occupational classification
LFS or labour force
module of the
Population Census or the
HIES
SUPPORTING INDICATOR 22: Percentage of employed
population in vulnerable employment (unpaid family
workers and own‐account workers) by sex and major
industry and occupational classification
LFS (World Bank
database)
http://data.worldbank.o
rg/indicator
SUPPORTING INDICATOR 23: Unemployment rate by sex
*SUPPORTING INDICATOR 24: Youth unemployment rate by sex
LFS
SUPPORTING INDICATORS: This domain replicates the indicators from the Global Minimum Set with the
addition of Indicator 22 on the proportion of the employed population in vulnerable employment and
Indicator 23 Unemployment rate by sex. Indicator 20 is extended in the Regional Core Set from the sector
to industry and occupation levels in order to identify male‐dominated and female‐dominated industries and
occupations for the purpose of gender analysis and national policy development and monitoring. Indicators
21 and 22 on informal and vulnerable employment are similarly extended to measure differences in
women’s and men’s exposure to less secure forms of employment that are less empowering and to identify
the industries and occupations most affected.20
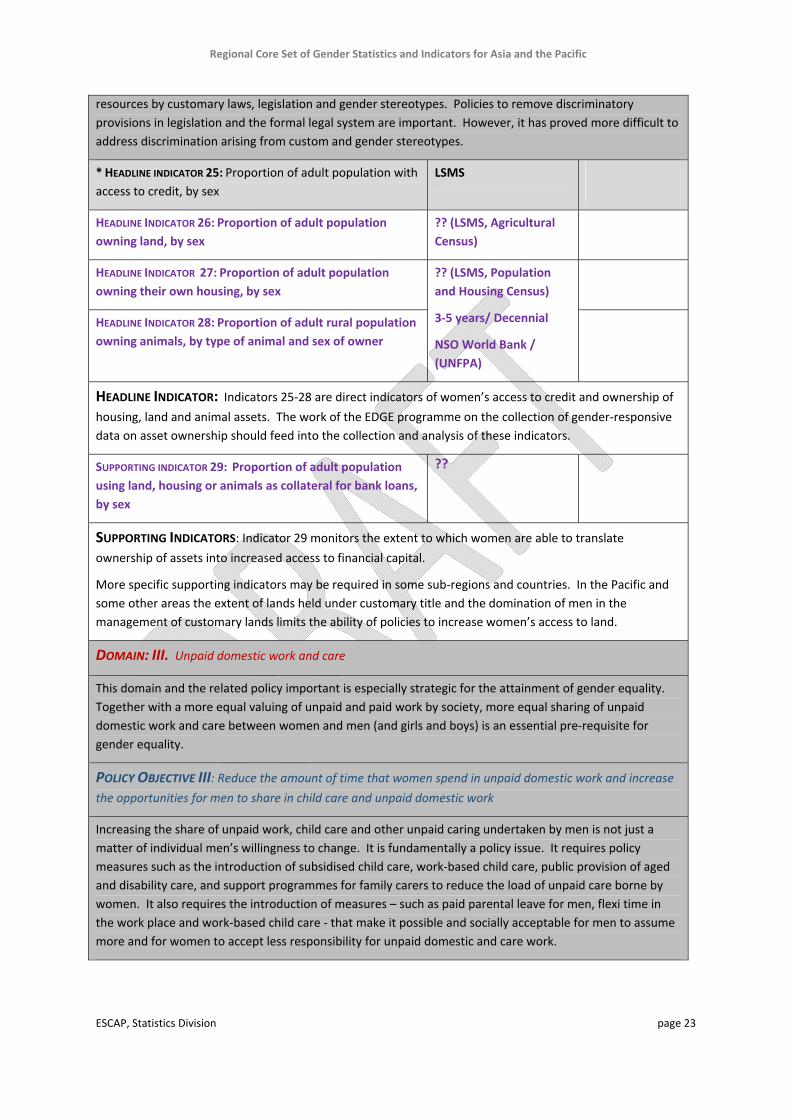
POLICY OBJECTIVE IIB: Increase women’s ownership of assets and access to other economic resources
In many countries, women are denied access to ownership (and control over) assets and other economic
20 For the purpose of gender analysis, indicators 27 ‐ 31 in Domain III and 44 ‐ 50 in Domain IV can also be regarded as supporting
indicators for Domain II. However, the domains remain separate because the policy focus is different.
Regional Core Set of Gender Statistics and Indicators for Asia and the Pacific
ESCAP, Statistics Division page 23
resources by customary laws, legislation and gender stereotypes. Policies to remove discriminatory
provisions in legislation and the formal legal system are important. However, it has proved more difficult to
address discrimination arising from custom and gender stereotypes.
* HEADLINE INDICATOR 25: Proportion of adult population with
access to credit, by sex
LSMS
HEADLINE INDICATOR 26: Proportion of adult population
owning land, by sex
?? (LSMS, Agricultural
Census)
HEADLINE INDICATOR 27: Proportion of adult population
owning their own housing, by sex
HEADLINE INDICATOR 28: Proportion of adult rural population
owning animals, by type of animal and sex of owner
?? (LSMS, Population
and Housing Census)
3‐5 years/ Decennial
NSO World Bank /
(UNFPA)
HEADLINE INDICATOR: Indicators 25‐28 are direct indicators of women’s access to credit and ownership of
housing, land and animal assets. The work of the EDGE programme on the collection of gender‐responsive
data on asset ownership should feed into the collection and analysis of these indicators.
SUPPORTING INDICATOR 29: Proportion of adult population
using land, housing or animals as collateral for bank loans,
by sex
??
SUPPORTING INDICATORS: Indicator 29 monitors the extent to which women are able to translate
ownership of assets into increased access to financial capital.
More specific supporting indicators may be required in some sub‐regions and countries. In the Pacific and
some other areas the extent of lands held under customary title and the domination of men in the
management of customary lands limits the ability of policies to increase women’s access to land.
DOMAIN: III. Unpaid domestic work and care
This domain and the related policy important is especially strategic for the attainment of gender equality.
Together with a more equal valuing of unpaid and paid work by society, more equal sharing of unpaid
domestic work and care between women and men (and girls and boys) is an essential pre‐requisite for
gender equality.
POLICY OBJECTIVE III: Reduce the amount of time that women spend in unpaid domestic work and increase
the opportunities for men to share in child care and unpaid domestic work
Increasing the share of unpaid work, child care and other unpaid caring undertaken by men is not just a
matter of individual men’s willingness to change. It is fundamentally a policy issue. It requires policy
measures such as the introduction of subsidised child care, work‐based child care, public provision of aged
and disability care, and support programmes for family carers to reduce the load of unpaid care borne by
women. It also requires the introduction of measures – such as paid parental leave for men, flexi time in
the work place and work‐based child care ‐ that make it possible and socially acceptable for men to assume
more and for women to accept less responsibility for unpaid domestic and care work.
Regional Core Set of Gender Statistics and Indicators for Asia and the Pacific
ESCAP, Statistics Division page 24
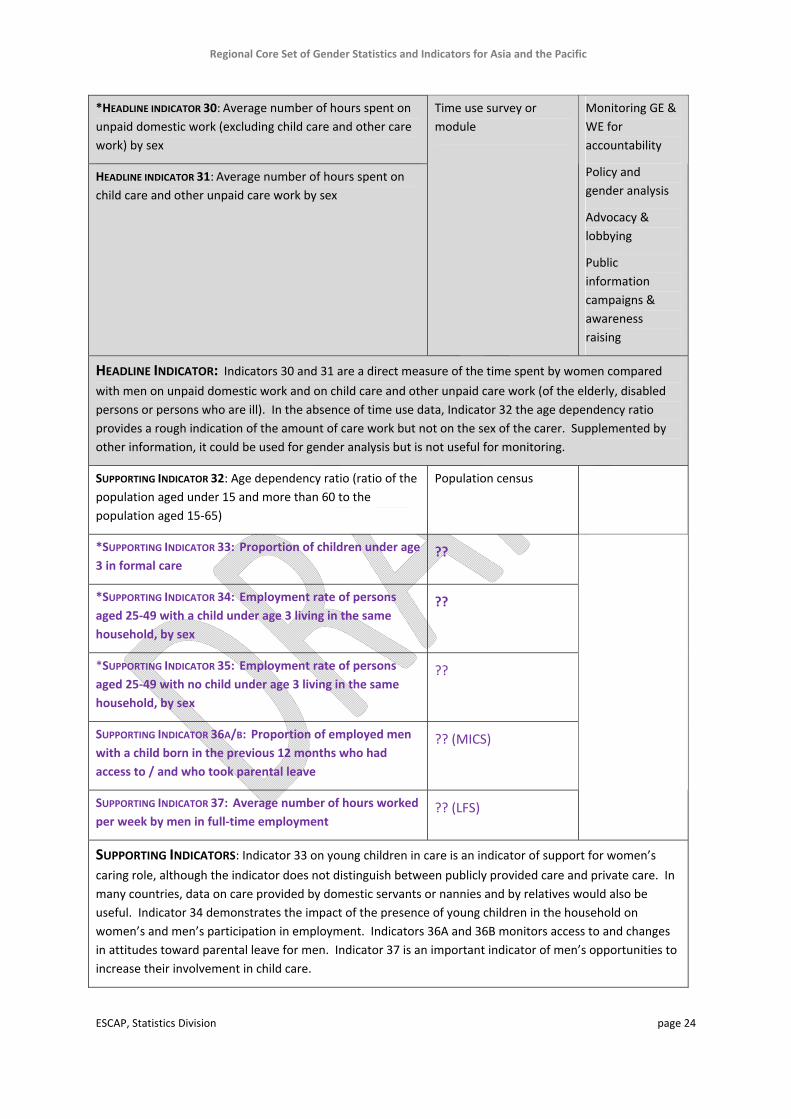
*HEADLINE INDICATOR 30: Average number of hours spent on
unpaid domestic work (excluding child care and other care
work) by sex
HEADLINE INDICATOR 31: Average number of hours spent on
child care and other unpaid care work by sex
Time use survey or
module
Monitoring GE &
WE for
accountability
Policy and
gender analysis
Advocacy &
lobbying
Public
information
campaigns &
awareness
raising
HEADLINE INDICATOR: Indicators 30 and 31 are a direct measure of the time spent by women compared
with men on unpaid domestic work and on child care and other unpaid care work (of the elderly, disabled
persons or persons who are ill). In the absence of time use data, Indicator 32 the age dependency ratio
provides a rough indication of the amount of care work but not on the sex of the carer. Supplemented by
other information, it could be used for gender analysis but is not useful for monitoring.
SUPPORTING INDICATOR 32: Age dependency ratio (ratio of the
population aged under 15 and more than 60 to the
population aged 15‐65)
Population census
*SUPPORTING INDICATOR 33: Proportion of children under age
3 in formal care ??
*SUPPORTING INDICATOR 34: Employment rate of persons
aged 25‐49 with a child under age 3 living in the same
household, by sex
??
*SUPPORTING INDICATOR 35: Employment rate of persons
aged 25‐49 with no child under age 3 living in the same
household, by sex
??
SUPPORTING INDICATOR 36A/B: Proportion of employed men
with a child born in the previous 12 months who had
access to / and who took parental leave
?? (MICS)
SUPPORTING INDICATOR 37: Average number of hours worked
per week by men in full‐time employment ?? (LFS)
SUPPORTING INDICATORS: Indicator 33 on young children in care is an indicator of support for women’s
caring role, although the indicator does not distinguish between publicly provided care and private care. In
many countries, data on care provided by domestic servants or nannies and by relatives would also be
useful. Indicator 34 demonstrates the impact of the presence of young children in the household on
women’s and men’s participation in employment. Indicators 36A and 36B monitors access to and changes
in attitudes toward parental leave for men. Indicator 37 is an important indicator of men’s opportunities to
increase their involvement in child care.
Regional Core Set of Gender Statistics and Indicators for Asia and the Pacific
ESCAP, Statistics Division page 25
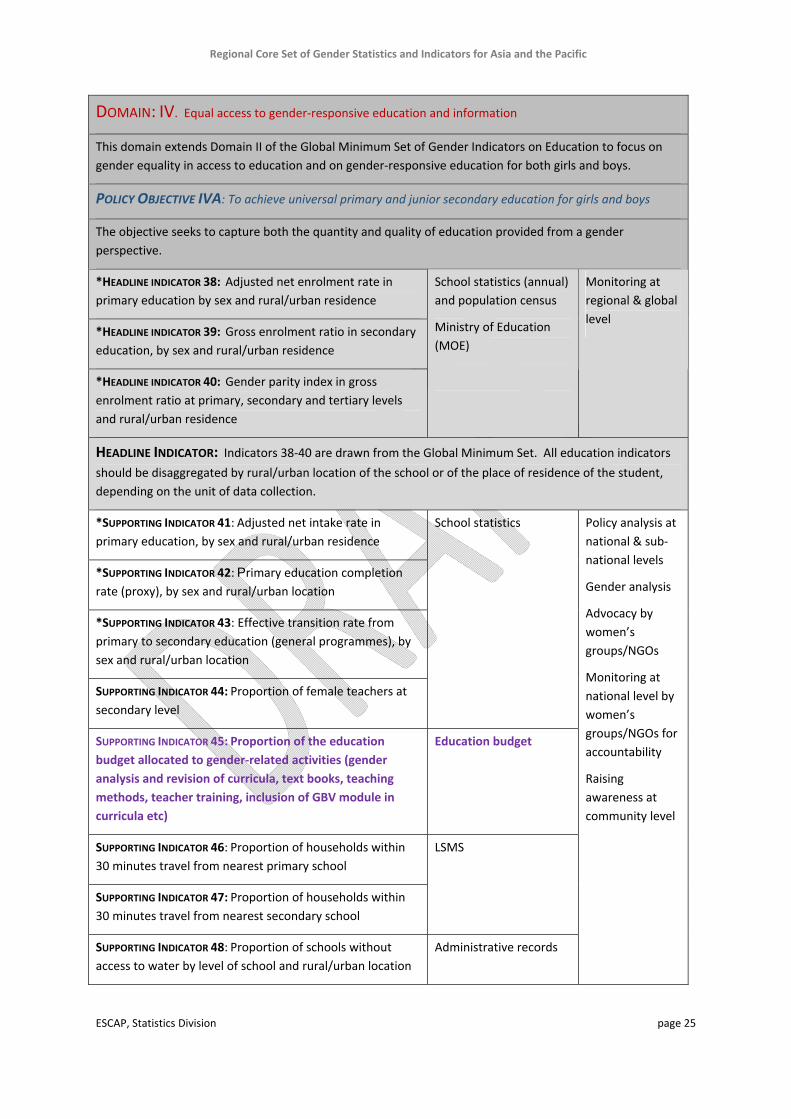
DOMAIN: IV. Equal access to gender‐responsive education and information
This domain extends Domain II of the Global Minimum Set of Gender Indicators on Education to focus on
gender equality in access to education and on gender‐responsive education for both girls and boys.
POLICY OBJECTIVE IVA: To achieve universal primary and junior secondary education for girls and boys
The objective seeks to capture both the quantity and quality of education provided from a gender
perspective.
*HEADLINE INDICATOR 38: Adjusted net enrolment rate in
primary education by sex and rural/urban residence
*HEADLINE INDICATOR 39: Gross enrolment ratio in secondary
education, by sex and rural/urban residence
*HEADLINE INDICATOR 40: Gender parity index in gross
enrolment ratio at primary, secondary and tertiary levels
and rural/urban residence
School statistics (annual)
and population census
Ministry of Education
(MOE)
Monitoring at
regional & global
level
HEADLINE INDICATOR: Indicators 38‐40 are drawn from the Global Minimum Set. All education indicators
should be disaggregated by rural/urban location of the school or of the place of residence of the student,
depending on the unit of data collection.
*SUPPORTING INDICATOR 41: Adjusted net intake rate in
primary education, by sex and rural/urban residence
*SUPPORTING INDICATOR 42: Primary education completion
rate (proxy), by sex and rural/urban location
*SUPPORTING INDICATOR 43: Effective transition rate from
primary to secondary education (general programmes), by
sex and rural/urban location
SUPPORTING INDICATOR 44: Proportion of female teachers at
secondary level
School statistics
SUPPORTING INDICATOR 45: Proportion of the education
budget allocated to gender‐related activities (gender
analysis and revision of curricula, text books, teaching
methods, teacher training, inclusion of GBV module in
curricula etc)
Education budget
SUPPORTING INDICATOR 46: Proportion of households within
30 minutes travel from nearest primary school
SUPPORTING INDICATOR 47: Proportion of households within
30 minutes travel from nearest secondary school
LSMS
SUPPORTING INDICATOR 48: Proportion of schools without
access to water by level of school and rural/urban location
Administrative records
Policy analysis at
national & sub‐
national levels
Gender analysis
Advocacy by
women’s
groups/NGOs
Monitoring at
national level by
women’s
groups/NGOs for
accountability
Raising
awareness at
community level
Regional Core Set of Gender Statistics and Indicators for Asia and the Pacific
ESCAP, Statistics Division page 26
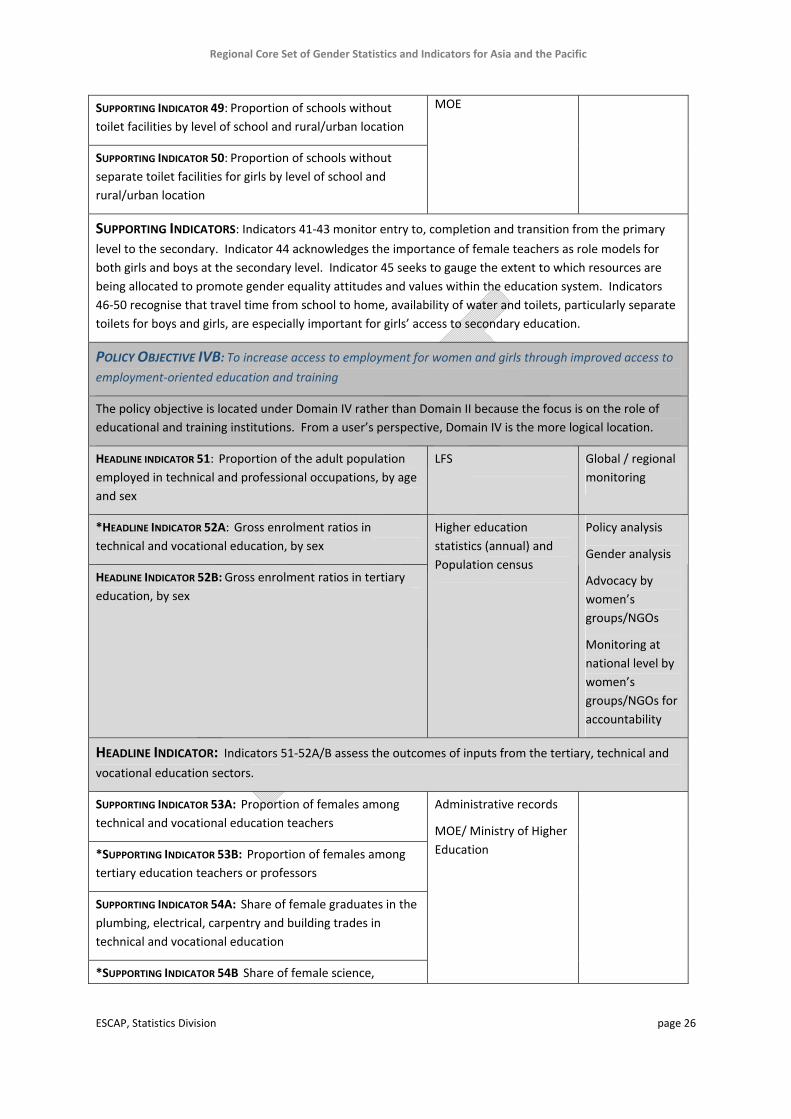
SUPPORTING INDICATOR 49: Proportion of schools without
toilet facilities by level of school and rural/urban location
SUPPORTING INDICATOR 50: Proportion of schools without
separate toilet facilities for girls by level of school and
rural/urban location
MOE
SUPPORTING INDICATORS: Indicators 41‐43 monitor entry to, completion and transition from the primary
level to the secondary. Indicator 44 acknowledges the importance of female teachers as role models for
both girls and boys at the secondary level. Indicator 45 seeks to gauge the extent to which resources are
being allocated to promote gender equality attitudes and values within the education system. Indicators
46‐50 recognise that travel time from school to home, availability of water and toilets, particularly separate
toilets for boys and girls, are especially important for girls’ access to secondary education.
POLICY OBJECTIVE IVB: To increase access to employment for women and girls through improved access to
employment‐oriented education and training
The policy objective is located under Domain IV rather than Domain II because the focus is on the role of
educational and training institutions. From a user’s perspective, Domain IV is the more logical location.
HEADLINE INDICATOR 51: Proportion of the adult population
employed in technical and professional occupations, by age
and sex
LFS Global / regional
monitoring
*HEADLINE INDICATOR 52A: Gross enrolment ratios in
technical and vocational education, by sex
HEADLINE INDICATOR 52B: Gross enrolment ratios in tertiary
education, by sex
Higher education
statistics (annual) and
Population census
Policy analysis
Gender analysis
Advocacy by
women’s
groups/NGOs
Monitoring at
national level by
women’s
groups/NGOs for
accountability
HEADLINE INDICATOR: Indicators 51‐52A/B assess the outcomes of inputs from the tertiary, technical and
vocational education sectors.
SUPPORTING INDICATOR 53A: Proportion of females among
technical and vocational education teachers
*SUPPORTING INDICATOR 53B: Proportion of females among
tertiary education teachers or professors
SUPPORTING INDICATOR 54A: Share of female graduates in the
plumbing, electrical, carpentry and building trades in
technical and vocational education
*SUPPORTING INDICATOR 54B Share of female science,
Administrative records
MOE/ Ministry of Higher
Education
Regional Core Set of Gender Statistics and Indicators for Asia and the Pacific
ESCAP, Statistics Division page 27
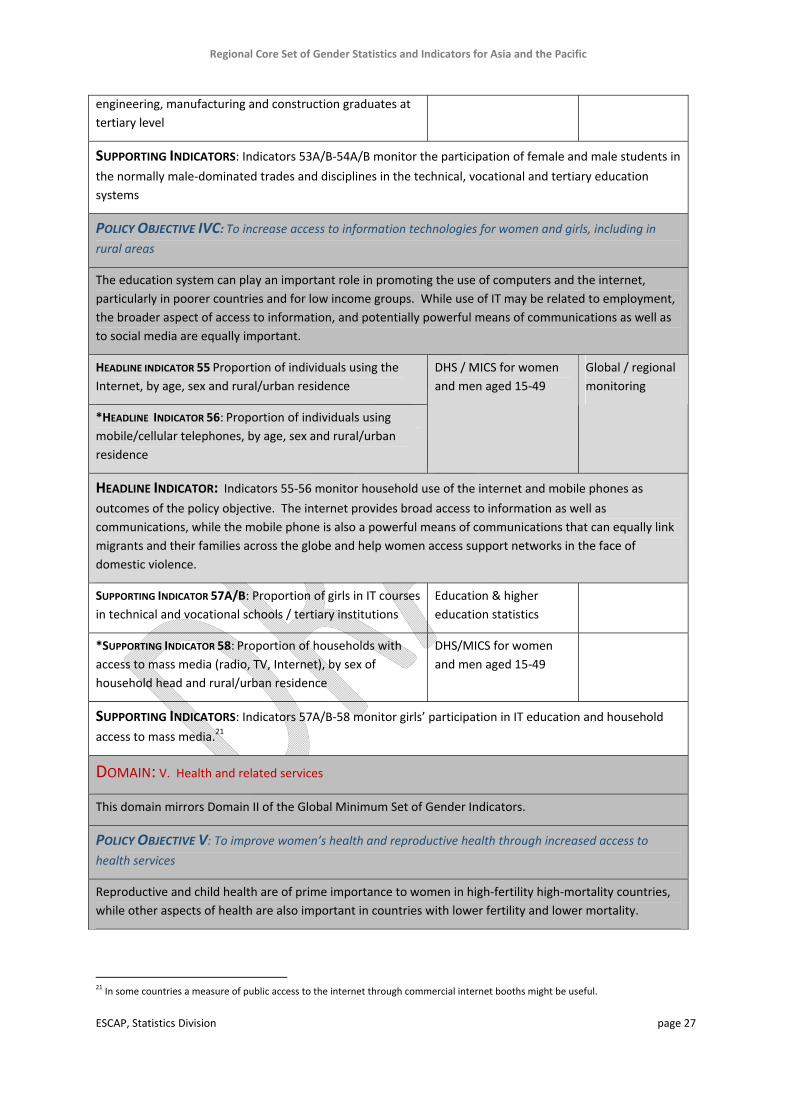
engineering, manufacturing and construction graduates at
tertiary level
SUPPORTING INDICATORS: Indicators 53A/B‐54A/B monitor the participation of female and male students in
the normally male‐dominated trades and disciplines in the technical, vocational and tertiary education
systems
POLICY OBJECTIVE IVC: To increase access to information technologies for women and girls, including in
rural areas
The education system can play an important role in promoting the use of computers and the internet,
particularly in poorer countries and for low income groups. While use of IT may be related to employment,
the broader aspect of access to information, and potentially powerful means of communications as well as
to social media are equally important.
HEADLINE INDICATOR 55 Proportion of individuals using the
Internet, by age, sex and rural/urban residence
*HEADLINE INDICATOR 56: Proportion of individuals using
mobile/cellular telephones, by age, sex and rural/urban
residence
DHS / MICS for women
and men aged 15‐49
Global / regional
monitoring
HEADLINE INDICATOR: Indicators 55‐56 monitor household use of the internet and mobile phones as
outcomes of the policy objective. The internet provides broad access to information as well as
communications, while the mobile phone is also a powerful means of communications that can equally link
migrants and their families across the globe and help women access support networks in the face of
domestic violence.
SUPPORTING INDICATOR 57A/B: Proportion of girls in IT courses
in technical and vocational schools / tertiary institutions
Education & higher
education statistics
*SUPPORTING INDICATOR 58: Proportion of households with
access to mass media (radio, TV, Internet), by sex of
household head and rural/urban residence
DHS/MICS for women
and men aged 15‐49
SUPPORTING INDICATORS: Indicators 57A/B‐58 monitor girls’ participation in IT education and household
access to mass media.21
DOMAIN: V. Health and related services
This domain mirrors Domain II of the Global Minimum Set of Gender Indicators.
POLICY OBJECTIVE V: To improve women’s health and reproductive health through increased access to
health services
Reproductive and child health are of prime importance to women in high‐fertility high‐mortality countries,
while other aspects of health are also important in countries with lower fertility and lower mortality.
21 In some countries a measure of public access to the internet through commercial internet booths might be useful.
Regional Core Set of Gender Statistics and Indicators for Asia and the Pacific
ESCAP, Statistics Division page 28
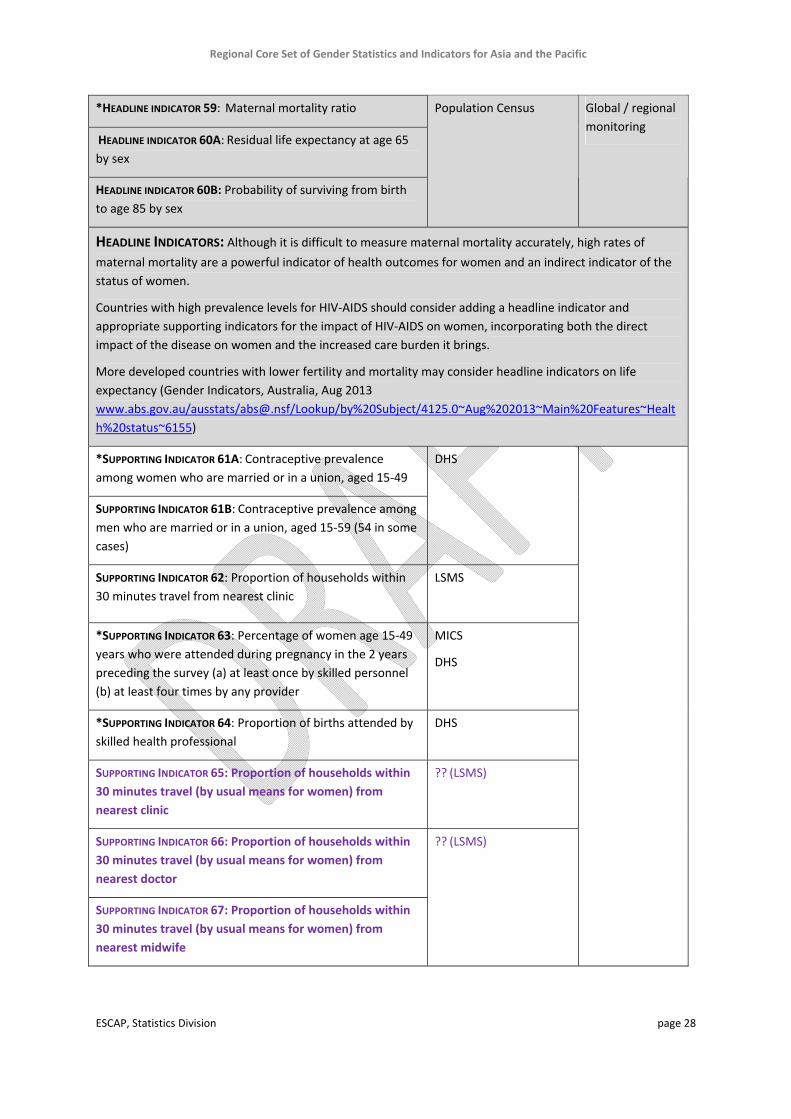
*HEADLINE INDICATOR 59: Maternal mortality ratio
HEADLINE INDICATOR 60A: Residual life expectancy at age 65
by sex
HEADLINE INDICATOR 60B: Probability of surviving from birth
to age 85 by sex
Population Census Global / regional
monitoring
HEADLINE INDICATORS: Although it is difficult to measure maternal mortality accurately, high rates of
maternal mortality are a powerful indicator of health outcomes for women and an indirect indicator of the
status of women.
Countries with high prevalence levels for HIV‐AIDS should consider adding a headline indicator and
appropriate supporting indicators for the impact of HIV‐AIDS on women, incorporating both the direct
impact of the disease on women and the increased care burden it brings.
More developed countries with lower fertility and mortality may consider headline indicators on life
expectancy (Gender Indicators, Australia, Aug 2013
www.abs.gov.au/ausstats/[email protected]/Lookup/by%20Subject/4125.0~Aug%202013~Main%20Features~Healt
h%20status~6155)
*SUPPORTING INDICATOR 61A: Contraceptive prevalence
among women who are married or in a union, aged 15‐49
SUPPORTING INDICATOR 61B: Contraceptive prevalence among
men who are married or in a union, aged 15‐59 (54 in some
cases)
DHS
SUPPORTING INDICATOR 62: Proportion of households within
30 minutes travel from nearest clinic
LSMS
*SUPPORTING INDICATOR 63: Percentage of women age 15‐49
years who were attended during pregnancy in the 2 years
preceding the survey (a) at least once by skilled personnel
(b) at least four times by any provider
MICS
DHS
*SUPPORTING INDICATOR 64: Proportion of births attended by
skilled health professional
DHS
SUPPORTING INDICATOR 65: Proportion of households within
30 minutes travel (by usual means for women) from
nearest clinic
?? (LSMS)
SUPPORTING INDICATOR 66: Proportion of households within
30 minutes travel (by usual means for women) from
nearest doctor
SUPPORTING INDICATOR 67: Proportion of households within
30 minutes travel (by usual means for women) from
nearest midwife
?? (LSMS)
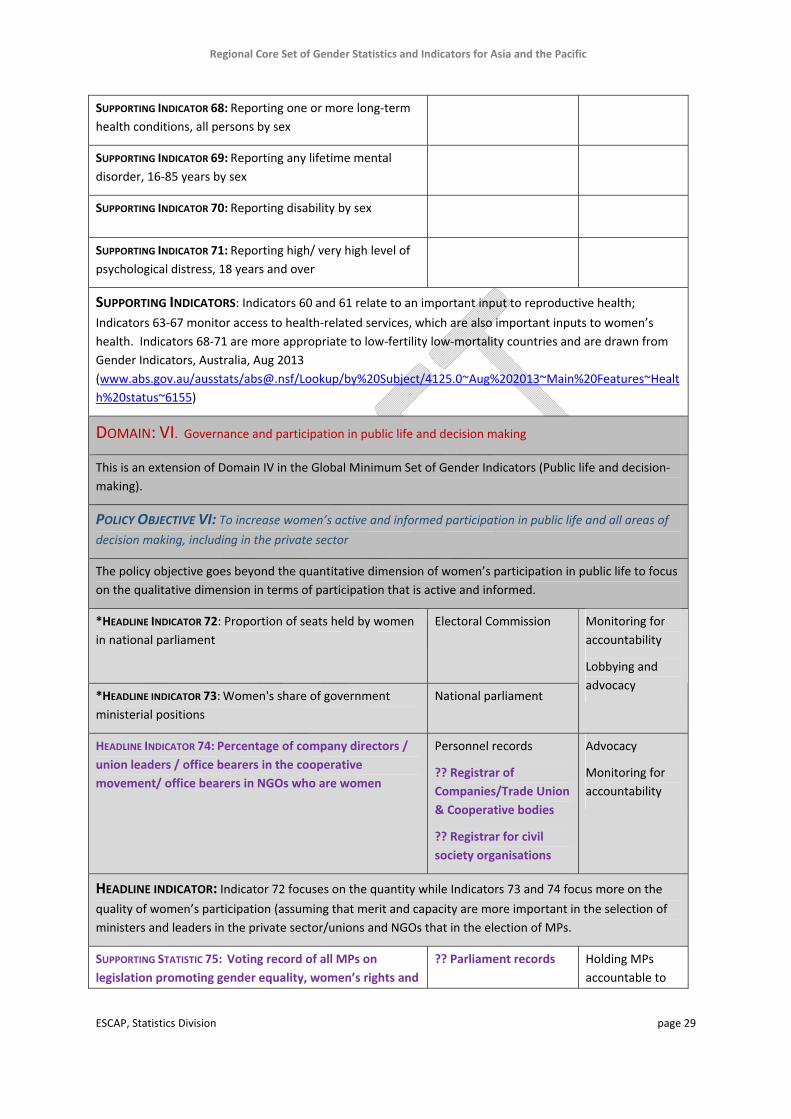
Regional Core Set of Gender Statistics and Indicators for Asia and the Pacific
ESCAP, Statistics Division page 29
SUPPORTING INDICATOR 68: Reporting one or more long‐term
health conditions, all persons by sex
SUPPORTING INDICATOR 69: Reporting any lifetime mental
disorder, 16‐85 years by sex
SUPPORTING INDICATOR 70: Reporting disability by sex
SUPPORTING INDICATOR 71: Reporting high/ very high level of
psychological distress, 18 years and over
SUPPORTING INDICATORS: Indicators 60 and 61 relate to an important input to reproductive health;
Indicators 63‐67 monitor access to health‐related services, which are also important inputs to women’s
health. Indicators 68‐71 are more appropriate to low‐fertility low‐mortality countries and are drawn from
Gender Indicators, Australia, Aug 2013
(www.abs.gov.au/ausstats/[email protected]/Lookup/by%20Subject/4125.0~Aug%202013~Main%20Features~Healt
h%20status~6155)
DOMAIN: VI. Governance and participation in public life and decision making
This is an extension of Domain IV in the Global Minimum Set of Gender Indicators (Public life and decision‐
making).
POLICY OBJECTIVE VI: To increase women’s active and informed participation in public life and all areas of
decision making, including in the private sector
The policy objective goes beyond the quantitative dimension of women’s participation in public life to focus
on the qualitative dimension in terms of participation that is active and informed.
*HEADLINE INDICATOR 72: Proportion of seats held by women
in national parliament
Electoral Commission
*HEADLINE INDICATOR 73: Women's share of government
ministerial positions
National parliament
Monitoring for
accountability
Lobbying and
advocacy
HEADLINE INDICATOR 74: Percentage of company directors /
union leaders / office bearers in the cooperative
movement/ office bearers in NGOs who are women
Personnel records
?? Registrar of
Companies/Trade Union
& Cooperative bodies
?? Registrar for civil
society organisations
Advocacy
Monitoring for
accountability
HEADLINE INDICATOR: Indicator 72 focuses on the quantity while Indicators 73 and 74 focus more on the
quality of women’s participation (assuming that merit and capacity are more important in the selection of
ministers and leaders in the private sector/unions and NGOs that in the election of MPs.
SUPPORTING STATISTIC 75: Voting record of all MPs on
legislation promoting gender equality, women’s rights and
?? Parliament records Holding MPs
accountable to
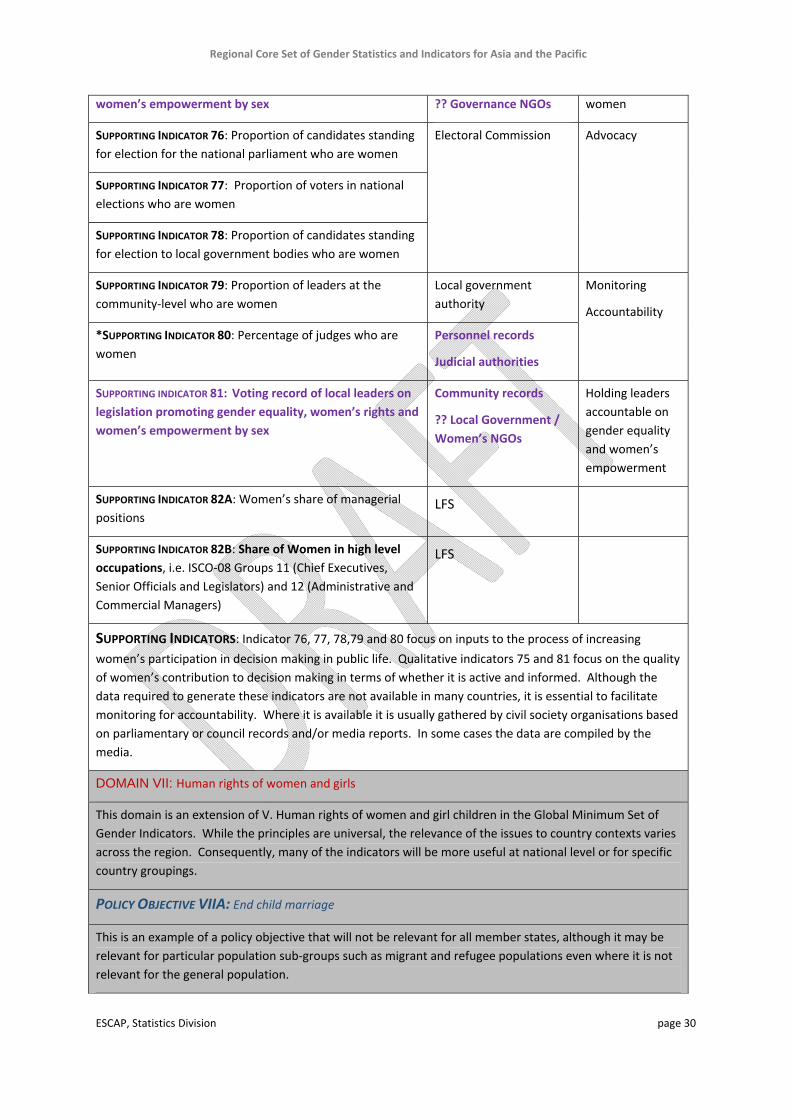
Regional Core Set of Gender Statistics and Indicators for Asia and the Pacific
ESCAP, Statistics Division page 30
women’s empowerment by sex ?? Governance NGOs women
SUPPORTING INDICATOR 76: Proportion of candidates standing
for election for the national parliament who are women
SUPPORTING INDICATOR 77: Proportion of voters in national
elections who are women
SUPPORTING INDICATOR 78: Proportion of candidates standing
for election to local government bodies who are women
Electoral Commission Advocacy
SUPPORTING INDICATOR 79: Proportion of leaders at the
community‐level who are women
Local government
authority
*SUPPORTING INDICATOR 80: Percentage of judges who are
women
Personnel records
Judicial authorities
Monitoring
Accountability
SUPPORTING INDICATOR 81: Voting record of local leaders on
legislation promoting gender equality, women’s rights and
women’s empowerment by sex
Community records
?? Local Government /
Women’s NGOs
Holding leaders
accountable on
gender equality
and women’s
empowerment
SUPPORTING INDICATOR 82A: Women’s share of managerial
positions LFS
SUPPORTING INDICATOR 82B: Share of Women in high level
occupations, i.e. ISCO‐08 Groups 11 (Chief Executives,
Senior Officials and Legislators) and 12 (Administrative and
Commercial Managers)
LFS
SUPPORTING INDICATORS: Indicator 76, 77, 78,79 and 80 focus on inputs to the process of increasing women’s participation in decision making in public life. Qualitative indicators 75 and 81 focus on the quality
of women’s contribution to decision making in terms of whether it is active and informed. Although the
data required to generate these indicators are not available in many countries, it is essential to facilitate
monitoring for accountability. Where it is available it is usually gathered by civil society organisations based
on parliamentary or council records and/or media reports. In some cases the data are compiled by the
media.
DOMAIN VII: Human rights of women and girls
This domain is an extension of V. Human rights of women and girl children in the Global Minimum Set of
Gender Indicators. While the principles are universal, the relevance of the issues to country contexts varies
across the region. Consequently, many of the indicators will be more useful at national level or for specific
country groupings.
POLICY OBJECTIVE VIIA: End child marriage
This is an example of a policy objective that will not be relevant for all member states, although it may be
relevant for particular population sub‐groups such as migrant and refugee populations even where it is not
relevant for the general population.
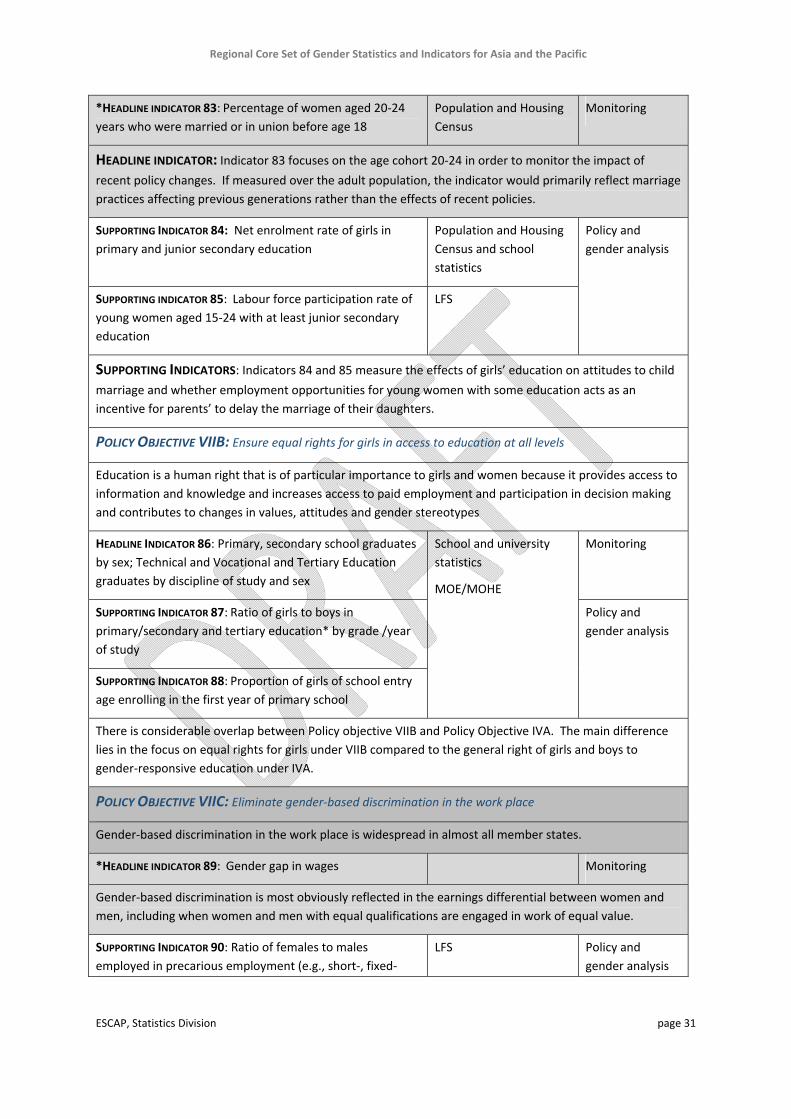
Regional Core Set of Gender Statistics and Indicators for Asia and the Pacific
ESCAP, Statistics Division page 31
*HEADLINE INDICATOR 83: Percentage of women aged 20‐24
years who were married or in union before age 18
Population and Housing
Census
Monitoring
HEADLINE INDICATOR: Indicator 83 focuses on the age cohort 20‐24 in order to monitor the impact of
recent policy changes. If measured over the adult population, the indicator would primarily reflect marriage
practices affecting previous generations rather than the effects of recent policies.
SUPPORTING INDICATOR 84: Net enrolment rate of girls in
primary and junior secondary education
Population and Housing
Census and school
statistics
SUPPORTING INDICATOR 85: Labour force participation rate of
young women aged 15‐24 with at least junior secondary
education
LFS
Policy and
gender analysis
SUPPORTING INDICATORS: Indicators 84 and 85 measure the effects of girls’ education on attitudes to child
marriage and whether employment opportunities for young women with some education acts as an
incentive for parents’ to delay the marriage of their daughters.
POLICY OBJECTIVE VIIB: Ensure equal rights for girls in access to education at all levels
Education is a human right that is of particular importance to girls and women because it provides access to
information and knowledge and increases access to paid employment and participation in decision making
and contributes to changes in values, attitudes and gender stereotypes
HEADLINE INDICATOR 86: Primary, secondary school graduates
by sex; Technical and Vocational and Tertiary Education
graduates by discipline of study and sex
Monitoring
SUPPORTING INDICATOR 87: Ratio of girls to boys in
primary/secondary and tertiary education* by grade /year
of study
SUPPORTING INDICATOR 88: Proportion of girls of school entry
age enrolling in the first year of primary school
School and university
statistics
MOE/MOHE
Policy and
gender analysis
There is considerable overlap between Policy objective VIIB and Policy Objective IVA. The main difference
lies in the focus on equal rights for girls under VIIB compared to the general right of girls and boys to
gender‐responsive education under IVA.
POLICY OBJECTIVE VIIC: Eliminate gender‐based discrimination in the work place
Gender‐based discrimination in the work place is widespread in almost all member states.
*HEADLINE INDICATOR 89: Gender gap in wages Monitoring
Gender‐based discrimination is most obviously reflected in the earnings differential between women and
men, including when women and men with equal qualifications are engaged in work of equal value.
SUPPORTING INDICATOR 90: Ratio of females to males
employed in precarious employment (e.g., short‐, fixed‐
LFS Policy and
gender analysis
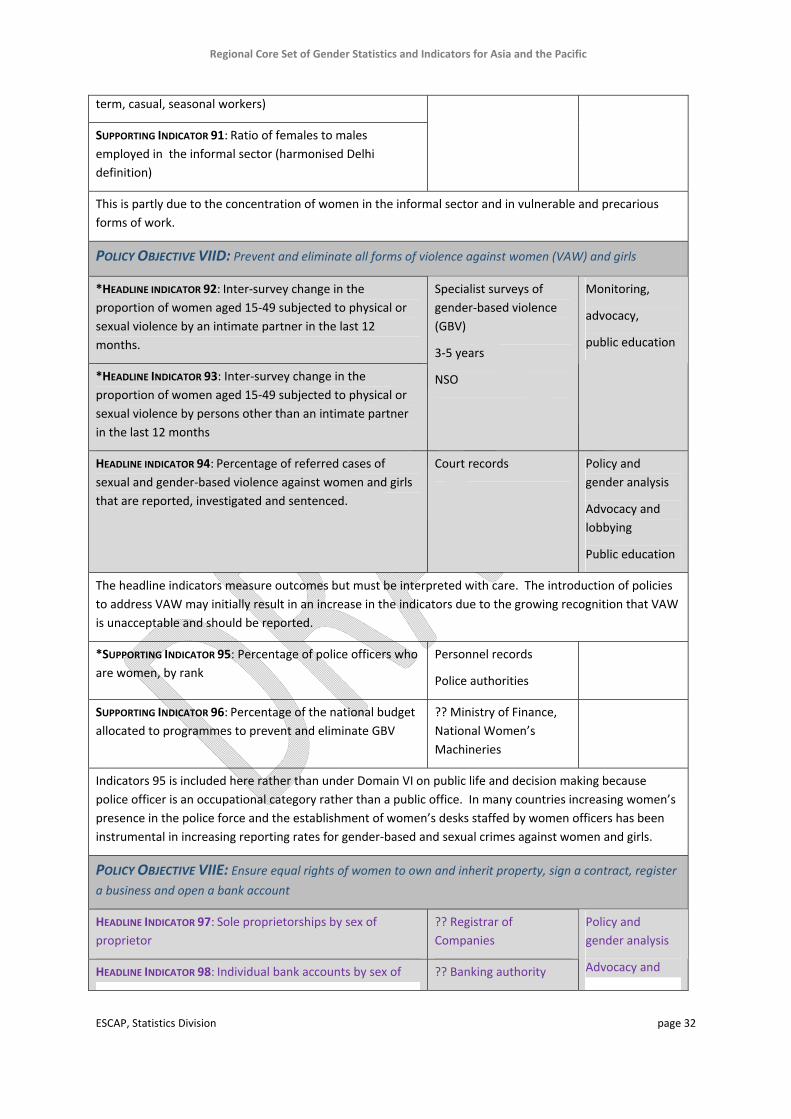
Regional Core Set of Gender Statistics and Indicators for Asia and the Pacific
ESCAP, Statistics Division page 32
term, casual, seasonal workers)
SUPPORTING INDICATOR 91: Ratio of females to males
employed in the informal sector (harmonised Delhi
definition)
This is partly due to the concentration of women in the informal sector and in vulnerable and precarious
forms of work.
POLICY OBJECTIVE VIID: Prevent and eliminate all forms of violence against women (VAW) and girls
*HEADLINE INDICATOR 92: Inter‐survey change in the
proportion of women aged 15‐49 subjected to physical or
sexual violence by an intimate partner in the last 12
months.
*HEADLINE INDICATOR 93: Inter‐survey change in the
proportion of women aged 15‐49 subjected to physical or
sexual violence by persons other than an intimate partner
in the last 12 months
Specialist surveys of
gender‐based violence
(GBV)
3‐5 years
NSO
Monitoring,
advocacy,
public education
HEADLINE INDICATOR 94: Percentage of referred cases of
sexual and gender‐based violence against women and girls
that are reported, investigated and sentenced.
Court records Policy and
gender analysis
Advocacy and
lobbying
Public education
The headline indicators measure outcomes but must be interpreted with care. The introduction of policies
to address VAW may initially result in an increase in the indicators due to the growing recognition that VAW
is unacceptable and should be reported.
*SUPPORTING INDICATOR 95: Percentage of police officers who
are women, by rank
Personnel records
Police authorities
SUPPORTING INDICATOR 96: Percentage of the national budget
allocated to programmes to prevent and eliminate GBV
?? Ministry of Finance,
National Women’s
Machineries
Indicators 95 is included here rather than under Domain VI on public life and decision making because
police officer is an occupational category rather than a public office. In many countries increasing women’s
presence in the police force and the establishment of women’s desks staffed by women officers has been
instrumental in increasing reporting rates for gender‐based and sexual crimes against women and girls.
POLICY OBJECTIVE VIIE: Ensure equal rights of women to own and inherit property, sign a contract, register
a business and open a bank account
HEADLINE INDICATOR 97: Sole proprietorships by sex of
proprietor
?? Registrar of
Companies
HEADLINE INDICATOR 98: Individual bank accounts by sex of ?? Banking authority
Policy and
gender analysis
Advocacy and
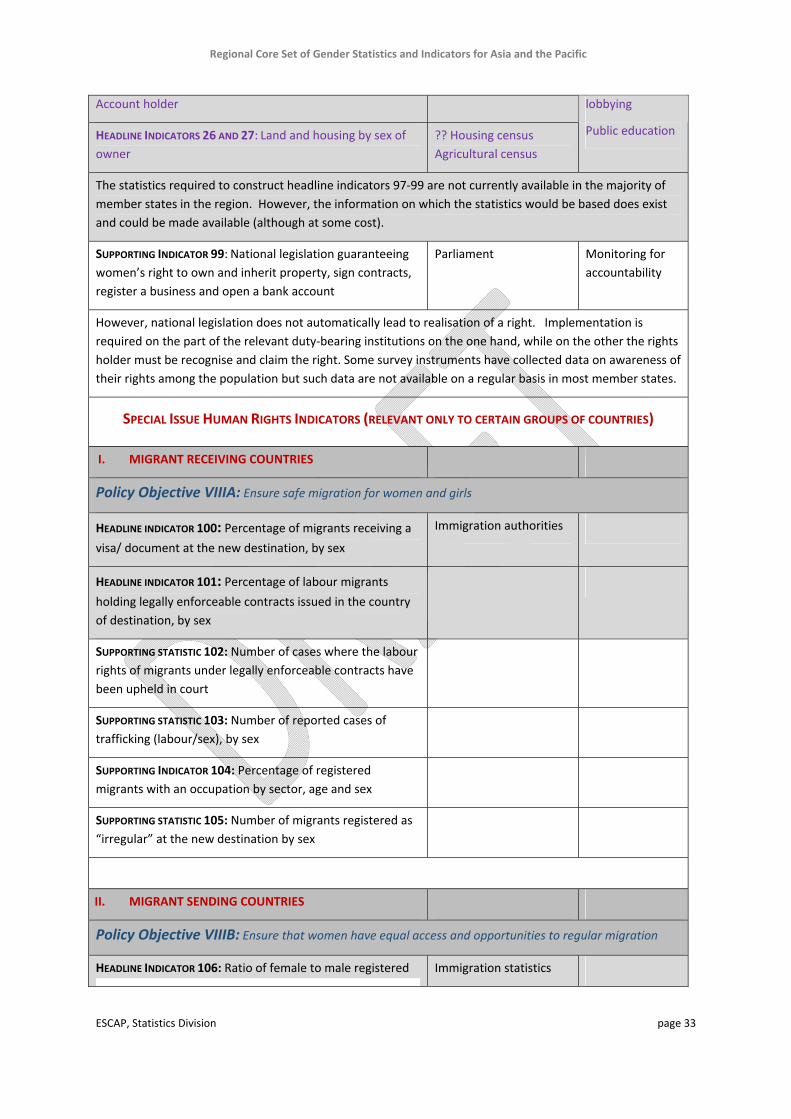
Regional Core Set of Gender Statistics and Indicators for Asia and the Pacific
ESCAP, Statistics Division page 33
Account holder
HEADLINE INDICATORS 26 AND 27: Land and housing by sex of
owner
?? Housing census
Agricultural census
lobbying
Public education
The statistics required to construct headline indicators 97‐99 are not currently available in the majority of
member states in the region. However, the information on which the statistics would be based does exist
and could be made available (although at some cost).
SUPPORTING INDICATOR 99: National legislation guaranteeing
women’s right to own and inherit property, sign contracts,
register a business and open a bank account
Parliament Monitoring for
accountability
However, national legislation does not automatically lead to realisation of a right. Implementation is
required on the part of the relevant duty‐bearing institutions on the one hand, while on the other the rights
holder must be recognise and claim the right. Some survey instruments have collected data on awareness of
their rights among the population but such data are not available on a regular basis in most member states.
SPECIAL ISSUE HUMAN RIGHTS INDICATORS (RELEVANT ONLY TO CERTAIN GROUPS OF COUNTRIES)
I. MIGRANT RECEIVING COUNTRIES
Policy Objective VIIIA: Ensure safe migration for women and girls
HEADLINE INDICATOR 100: Percentage of migrants receiving a
visa/ document at the new destination, by sex
Immigration authorities
HEADLINE INDICATOR 101: Percentage of labour migrants
holding legally enforceable contracts issued in the country
of destination, by sex
SUPPORTING STATISTIC 102: Number of cases where the labour
rights of migrants under legally enforceable contracts have
been upheld in court
SUPPORTING STATISTIC 103: Number of reported cases of
trafficking (labour/sex), by sex
SUPPORTING INDICATOR 104: Percentage of registered
migrants with an occupation by sector, age and sex
SUPPORTING STATISTIC 105: Number of migrants registered as
“irregular” at the new destination by sex
II. MIGRANT SENDING COUNTRIES
Policy Objective VIIIB: Ensure that women have equal access and opportunities to regular migration
HEADLINE INDICATOR 106: Ratio of female to male registered Immigration statistics

Regional Core Set of Gender Statistics and Indicators for Asia and the Pacific
ESCAP, Statistics Division page 34
international migrants
Most countries of origin of international labour migrants find it difficult to provide data on the
characteristics or conditions of their migrants in destination countries. The Philippines provides an
interesting model of how such data can be collected, particularly in countries where the majority of
migrants leave and return by air. Strong incentives combined with legislative requirements for registration
of migrants and surveys of departing and returning migrants provide a comprehensive migration database,
as illustrated by the following sample statistics:
Percentage distribution of Overseas Filipino Workers by Occupation, Year and Sex.
Average Cash Remittance of Overseas Filipino Workers by Place of Work, Sex and Year.
Percentage distribution of Overseas Filipino Workers by Place of Work (destination country), Year and
Sex.
SUPPORTING INDICATOR 107: Proportion of registered labour
migrants receiving pre‐departure/orientation training by
sex
SUPPORTING INDICATOR 108: Percentage of immigration
officers receiving training on common migration issues
(including trafficking and smuggling) in previous 12 months
Immigration human
resource data
SUPPORTING INDICATOR 109: Percentage of migrant workers
holding legally enforceable contracts issued before
departure, by sex
SUPPORTING INDICATOR 110: Ratio of remittances remitted, by
sex
Available for the
Philippines, source is the
Survey of Overseas
Filipinos (SOF), NSO
(2013 survey is currently
being implemented)
To account for the number of overseas Filipino workers, the National Statistics Office (NSO) conducts the
Survey on Overseas Filipinos (SOF) to gather information on the number of Filipino citizens who leave the
country to seek work abroad, their remittances (cash and in‐kind), mode of remittances, their occupation
and place of work abroad. (http://www.nscb.gov.ph/panguna.asp#page=t1 24 October 2013)
A global survey in 2008‐09 of 114 central banks worldwide (33 in Africa) on cross‐border remittance flows
found that the majority of both sending and receiving countries collect data on remittances, and 43 percent
of receiving countries estimate informal remittances. However, such institutional data are not
disaggregated by sex.
III. REFUGEES
Policy Objective VIIIC: PROTECT THE RIGHTS OF WOMEN AND GIRLS WHO ARE REFUGEES AND IDPS
HEADLINE INDICATOR 111: Ratio of female to male persons
affected by a conflict/ natural disaster who received
assistance
UNHCR
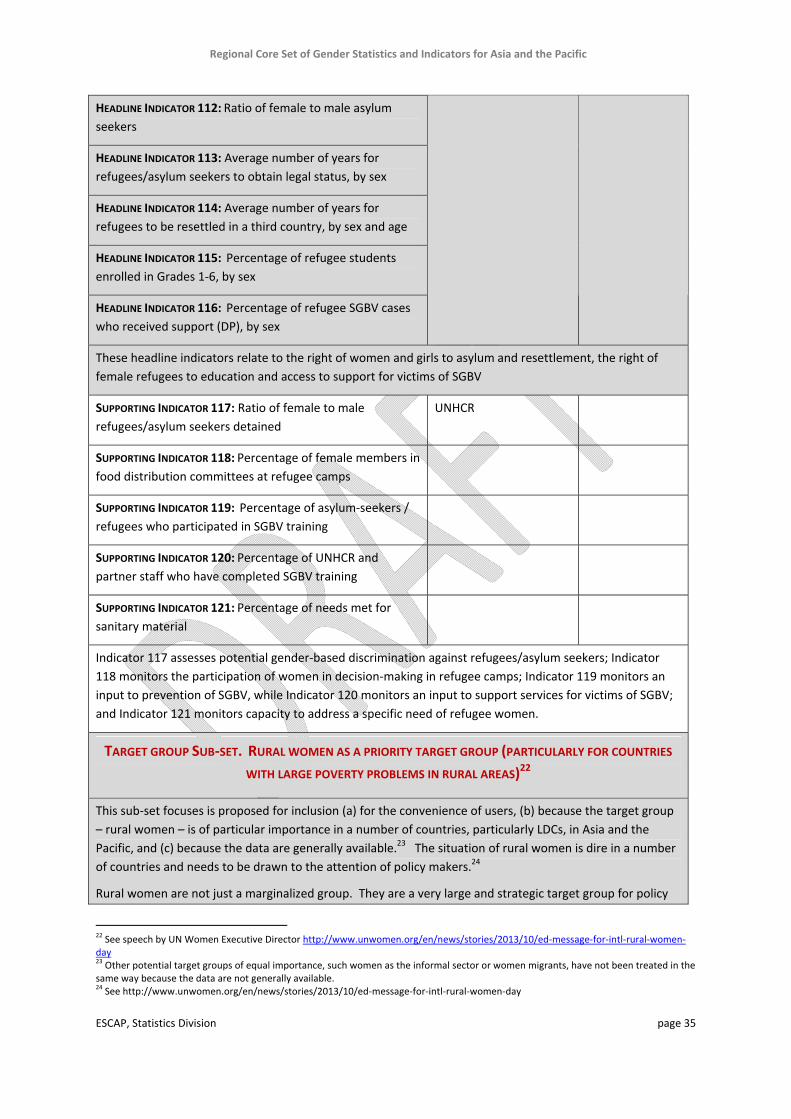
Regional Core Set of Gender Statistics and Indicators for Asia and the Pacific
ESCAP, Statistics Division page 35
HEADLINE INDICATOR 112: Ratio of female to male asylum
seekers
HEADLINE INDICATOR 113: Average number of years for
refugees/asylum seekers to obtain legal status, by sex
HEADLINE INDICATOR 114: Average number of years for
refugees to be resettled in a third country, by sex and age
HEADLINE INDICATOR 115: Percentage of refugee students
enrolled in Grades 1‐6, by sex
HEADLINE INDICATOR 116: Percentage of refugee SGBV cases
who received support (DP), by sex
These headline indicators relate to the right of women and girls to asylum and resettlement, the right of
female refugees to education and access to support for victims of SGBV
SUPPORTING INDICATOR 117: Ratio of female to male
refugees/asylum seekers detained
UNHCR
SUPPORTING INDICATOR 118: Percentage of female members in
food distribution committees at refugee camps
SUPPORTING INDICATOR 119: Percentage of asylum‐seekers /
refugees who participated in SGBV training
SUPPORTING INDICATOR 120: Percentage of UNHCR and
partner staff who have completed SGBV training
SUPPORTING INDICATOR 121: Percentage of needs met for
sanitary material
Indicator 117 assesses potential gender‐based discrimination against refugees/asylum seekers; Indicator
118 monitors the participation of women in decision‐making in refugee camps; Indicator 119 monitors an
input to prevention of SGBV, while Indicator 120 monitors an input to support services for victims of SGBV;
and Indicator 121 monitors capacity to address a specific need of refugee women.
TARGET GROUP SUB‐SET. RURAL WOMEN AS A PRIORITY TARGET GROUP (PARTICULARLY FOR COUNTRIES
WITH LARGE POVERTY PROBLEMS IN RURAL AREAS)22
This sub‐set focuses is proposed for inclusion (a) for the convenience of users, (b) because the target group
– rural women – is of particular importance in a number of countries, particularly LDCs, in Asia and the
Pacific, and (c) because the data are generally available.23 The situation of rural women is dire in a number
of countries and needs to be drawn to the attention of policy makers.24
Rural women are not just a marginalized group. They are a very large and strategic target group for policy
22 See speech by UN Women Executive Director http://www.unwomen.org/en/news/stories/2013/10/ed‐message‐for‐intl‐rural‐women‐
day 23 Other potential target groups of equal importance, such women as the informal sector or women migrants, have not been treated in the
same way because the data are not generally available. 24 See http://www.unwomen.org/en/news/stories/2013/10/ed‐message‐for‐intl‐rural‐women‐day
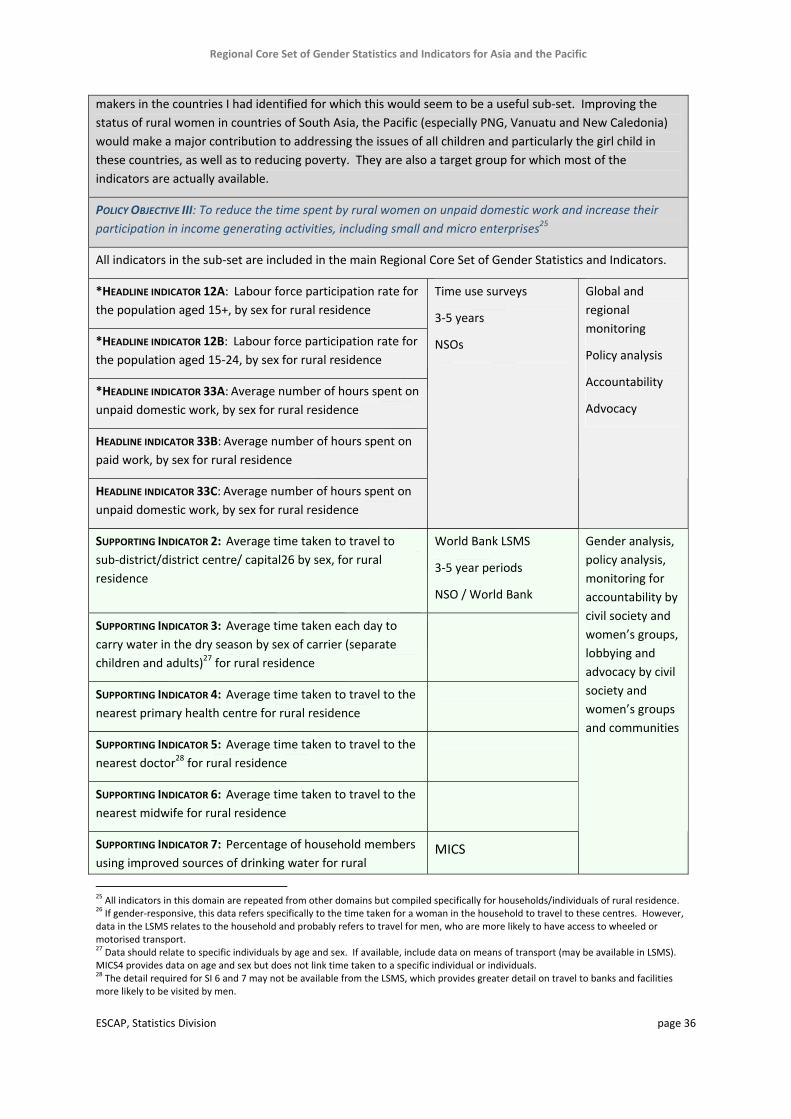
Regional Core Set of Gender Statistics and Indicators for Asia and the Pacific
ESCAP, Statistics Division page 36
makers in the countries I had identified for which this would seem to be a useful sub‐set. Improving the
status of rural women in countries of South Asia, the Pacific (especially PNG, Vanuatu and New Caledonia)
would make a major contribution to addressing the issues of all children and particularly the girl child in
these countries, as well as to reducing poverty. They are also a target group for which most of the
indicators are actually available.
POLICY OBJECTIVE III: To reduce the time spent by rural women on unpaid domestic work and increase their
participation in income generating activities, including small and micro enterprises25
All indicators in the sub‐set are included in the main Regional Core Set of Gender Statistics and Indicators.
*HEADLINE INDICATOR 12A: Labour force participation rate for
the population aged 15+, by sex for rural residence
*HEADLINE INDICATOR 12B: Labour force participation rate for
the population aged 15‐24, by sex for rural residence
*HEADLINE INDICATOR 33A: Average number of hours spent on
unpaid domestic work, by sex for rural residence
HEADLINE INDICATOR 33B: Average number of hours spent on
paid work, by sex for rural residence
HEADLINE INDICATOR 33C: Average number of hours spent on
unpaid domestic work, by sex for rural residence
Time use surveys
3‐5 years
NSOs
Global and
regional
monitoring
Policy analysis
Accountability
Advocacy
SUPPORTING INDICATOR 2: Average time taken to travel to
sub‐district/district centre/ capital26 by sex, for rural
residence
World Bank LSMS
3‐5 year periods
NSO / World Bank
SUPPORTING INDICATOR 3: Average time taken each day to
carry water in the dry season by sex of carrier (separate
children and adults)27 for rural residence
SUPPORTING INDICATOR 4: Average time taken to travel to the
nearest primary health centre for rural residence
SUPPORTING INDICATOR 5: Average time taken to travel to the
nearest doctor28 for rural residence
SUPPORTING INDICATOR 6: Average time taken to travel to the
nearest midwife for rural residence
SUPPORTING INDICATOR 7: Percentage of household members
using improved sources of drinking water for rural MICS
Gender analysis,
policy analysis,
monitoring for
accountability by
civil society and
women’s groups,
lobbying and
advocacy by civil
society and
women’s groups
and communities
25 All indicators in this domain are repeated from other domains but compiled specifically for households/individuals of rural residence.
26 If gender‐responsive, this data refers specifically to the time taken for a woman in the household to travel to these centres. However,
data in the LSMS relates to the household and probably refers to travel for men, who are more likely to have access to wheeled or motorised transport. 27 Data should relate to specific individuals by age and sex. If available, include data on means of transport (may be available in LSMS).
MICS4 provides data on age and sex but does not link time taken to a specific individual or individuals. 28 The detail required for SI 6 and 7 may not be available from the LSMS, which provides greater detail on travel to banks and facilities
more likely to be visited by men.
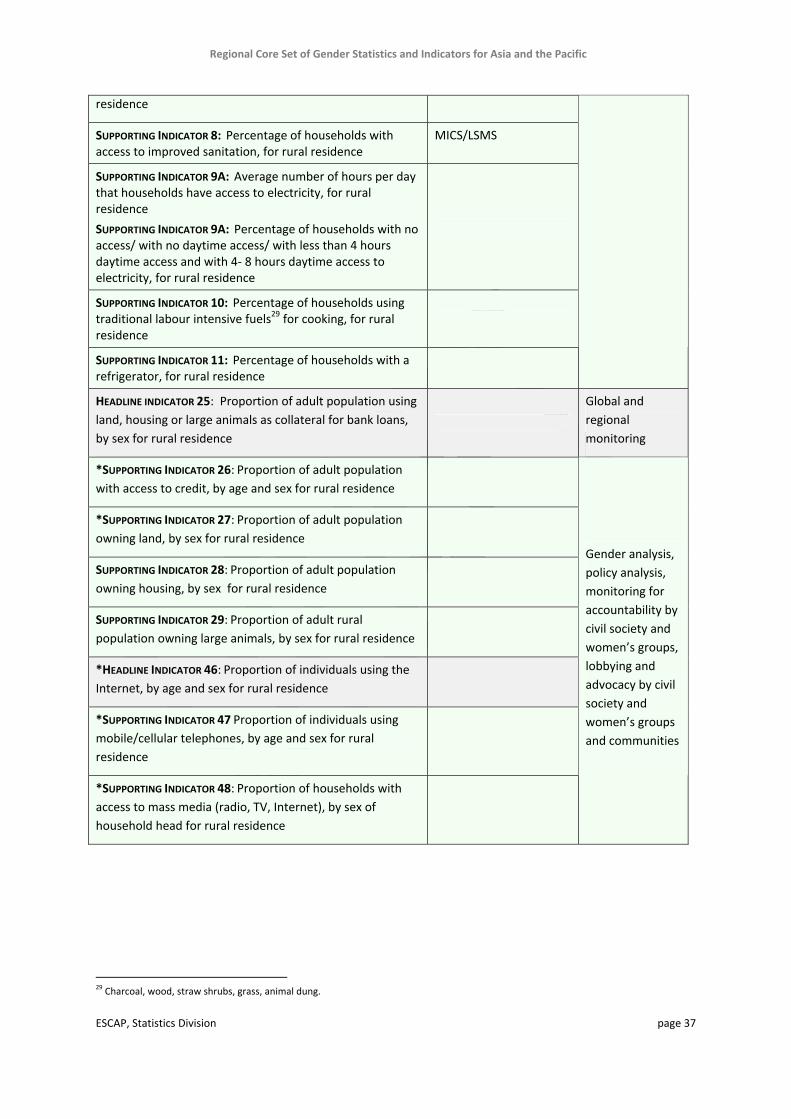
Regional Core Set of Gender Statistics and Indicators for Asia and the Pacific
ESCAP, Statistics Division page 37
residence
SUPPORTING INDICATOR 8: Percentage of households with access to improved sanitation, for rural residence
MICS/LSMS
SUPPORTING INDICATOR 9A: Average number of hours per day that households have access to electricity, for rural residence
SUPPORTING INDICATOR 9A: Percentage of households with no access/ with no daytime access/ with less than 4 hours daytime access and with 4‐ 8 hours daytime access to electricity, for rural residence
SUPPORTING INDICATOR 10: Percentage of households using traditional labour intensive fuels29 for cooking, for rural residence
SUPPORTING INDICATOR 11: Percentage of households with a refrigerator, for rural residence
HEADLINE INDICATOR 25: Proportion of adult population using
land, housing or large animals as collateral for bank loans,
by sex for rural residence
Global and
regional
monitoring
*SUPPORTING INDICATOR 26: Proportion of adult population
with access to credit, by age and sex for rural residence
*SUPPORTING INDICATOR 27: Proportion of adult population
owning land, by sex for rural residence
SUPPORTING INDICATOR 28: Proportion of adult population
owning housing, by sex for rural residence
SUPPORTING INDICATOR 29: Proportion of adult rural
population owning large animals, by sex for rural residence
*HEADLINE INDICATOR 46: Proportion of individuals using the
Internet, by age and sex for rural residence
*SUPPORTING INDICATOR 47 Proportion of individuals using
mobile/cellular telephones, by age and sex for rural
residence
*SUPPORTING INDICATOR 48: Proportion of households with
access to mass media (radio, TV, Internet), by sex of
household head for rural residence
Gender analysis,
policy analysis,
monitoring for
accountability by
civil society and
women’s groups,
lobbying and
advocacy by civil
society and
women’s groups
and communities
29 Charcoal, wood, straw shrubs, grass, animal dung.
Regional Core Set of Gender Statistics and Indicators for Asia and the Pacific
ESCAP, Statistics Division page 38
V. List of References
Acharya, Dr Meena and Dr Rafiqul Chaudhury, 2013. Genderizing The Census. Strategic approaches
to capturing the gender realities of a population, UNFPA.
Alcala, Maria Jose, 2006. ‘A user’s perspective on key gaps in gender statistics and gender analysis’,
paper prepared for the Inter‐Agency and Expert Group Meeting on the Development of
Gender Statistics 12‐14 December 2006 United Nations, New York UNITED NATIONS
SECRETARIAT ESA/STAT/AC.122/10 Department of Economic and Social Affairs
December.
Bhagat, R.B., 2005. Census Categories and Gender Construction in India,
iussp2005.princeton.edu/papers/50263
Corner, Lorraine, 2003. From Margins to Mainstream. From Gender Statistics to Engendering
Statistical Systems. UNIFEM in Asia‐Pacific & Arab States. www1.aucegypt.edu/.../
Margins2Mainstreamgengerstatistics.pdf
Hedman, Birgitta, Francesca Perucci and Pehr Sundström, 1996. Engendering Statistics. A Tool for
Change. Statistics Sweden.
Sicat, Marie, 2009. “Promoting Gender Equality and Women’s Empowerment in the Asia‐Pacific
Gender and Development Indicators: Synergies between Beijing, CEDAW and the
MDGs,” paper presented to Closing the Gap: Strategies to Combat and Monitor
Exclusion in Asia and the Pacific 29 September‐1 October, Gender Equality and
Empowerment Section Division for Social Development UN Economic and Social
Commission for Asia and the Pacific Bangkok, Thailand.
United Nations, 2006. The World’s Women 2005. Progress in Statistics. DESA, United Nations
Statistics Division, New York.
United Nations, 2009. Report of the Second Global Forum on Gender Statistics, Global Forum on
Gender Statistics. Accra, Ghana 26‐28 January, Department of Economic and Social
Affairs United Nations Statistics Division.
United Nations, 2013. Gender Statistics Manual. Integrating a Gender Perspective into Statistics.
DESA, 2013 http://unstats.un.org/unsd/genderstatmanual/
United Nations, 2013. Gender statistics, Report of the Secretary‐General. Statistical Commission,
Forty‐fourth session 26 February‐1 March 2013, Item 3 (i) of the provisional agenda.
Items for discussion and decision: gender statistics and Annex II Minimum set of
gender indicators, by domain. (E/CN.3/2013/10).
United Nations Inter‐agency and expert group meeting 2011. “Gender statistics: a minimum set of
indicators” (revision 21 September 2011). Prepared by Subgroup on minimum set of
Regional Core Set of Gender Statistics and Indicators for Asia and the Pacific
ESCAP, Statistics Division page 39
indicators for gender statistics of the Advisory Group on Gender Statistics Database and
Indicators. ESA/STAT/AC.242/5, 4‐6 October, New York, NY
Azcona, Ginette, 2013. Global Gender Statistics Programme and EDGE project, UN Women Research
and Data Section. www.inegi.org.mx/eventos/2013/Encuentro_Genero2013/doc/
EDGE...
United Nations, UNFPA and DESA, 2012. Guide on Gender Analysis of Census Data, Full Draft of 6
December 2012, unstats.un.org/unsd/.../meetings/.../P9.5%20‐
%20UNFPA%20Manual.docx
United Nations Economic and Social Commission for Asia and the Pacific 2003. Gender indicators
for monitoring the implementation of the Beijing Platform for Action on women in the
ESCAP region. ST/ESCAP/2294.
__________ 2007. Gender Equality and Empowerment: A Statistical Profile of the ESCAP region,
Statistics Division 2005.
__________ 2007a. ‘Promoting Gender Equality and Women’s Empowerment in the Asia‐Pacific:
Linking the Millennium Development Goals with the CEDAW and Beijing Indicators,’
Gender and Development Discussion Paper Series No. 20, Paper presented to an Expert
Group Meeting on Developing Supplementary Indicators on Social Inclusion, Population,
Gender Equality and Health Promotion in the MDG Process, Bangkok, Thailand 13‐15
November.
__________ 2010. Report, Consultative Meeting to Develop a Regional Programme on Gender
Statistics in Asia and the Pacific, 22‐23 September.