gender wage gap of utah workforce and post-secondary graduates
TRANSCRIPT
Gender Wage Gap of Utah Workforce and Post-secondary GraduatesKaren Tao and Skylar ScottSeptember 2021
AbstractThe gender wage gap has narrowed significantly from the late 1970s to the 1990s; progress to close the gap has been relatively stagnant since then. Vertical segregation, horizontal segregation, legislative challenges, educational segregation, and societal norms contribute to the stagnation of the gender wage gap. This study aims to investigate the gender wage gap experienced by Utahns. Using the American Community Survey (ACS) data, a comparison of Utah’s gender wage gap and the national gap demonstrates that Utah consistently falls behind between 2005 and 2018. This study then combines wage data obtained from the Utah Department of Workforce Services (DWS) with graduates who received a degree from a technical college or a degree-granting institution from the Utah System of Higher Education (USHE) for cohorts from 2012 to 2014. The gender wage gap experienced by these graduates is decomposed by the highest educational attainment, age group, and Classification of Instructional Program (CIP) studied. The wage gap is between 61% and 78% for workers with strong attachment to the workforce from all three cohorts. Furthermore, the difference-in-differences models illustrate that men experience higher wage gains from one year to five years post-graduation. The differences in wage gains are statistically significant for all educational attainments and each cohort year. Finally, with Blinder-Oaxaca decomposition, this research breaks down the wage differences into explained and unexplained portions. Higher wages can partially be explained by having more work experience before graduation. However, human capital measures for all cohorts cannot explain over 70% of the difference. Overall, this study suggests a widening gender wage gap as more time is spent in the workforce. The gap cannot be explained entirely by prior work experience, age, or highest educational attainment.
Keywordsgender wage gap, wage bias, human capital, Utah System of Higher Education, State of Utah, Utah Department of Workforce Services
In classical economics, wage is determined by the market theory of wage determination. Like other inputs, wage is influenced by supply and demand factors (Borjas, 2020). Alongside these factors is the output a laborer can produce (productivity). In some sectors, such as manufacturing, this output is easy to measure. With other fields, such as service, output becomes more difficult to measure. Human capital measures aid in determining the value of an individual’s labor. Some of these measures include educational attainment, skill, and experience (Miller, 2018). With all other variables remaining constant, if output between men and women are equal, expected wage should likewise be equal. However, this expected equal wage is not the case. Wage inequality between genders has been a subject of socio-economic study and activism since the 1940s when women supported the war effort on the factory lines. In 1942, the National War Labor board supported policy endorsing equal pay for women factory workers. In 1945, the Women’s Equal Pay Act was introduced but ultimately failed to pass. Efforts continued after the war, which led to the passage of the Equal Pay Act of 1963. This act made wage discrimination illegal in the United States (Sha, 2019). Since that time, Utah has consistently ranked with one of the widest gender wage gaps in the nation. The gender wage gap is generally defined as the average (either median or mean) difference between men’s and women’s wages. This difference can also be expressed as an earnings ratio, where women’s wages are represented as a percentage of men’s. Most recently, Utah ranked 48th (tied with Rhode Island) in pay inequality as a dollar figure in income, and 50th for the largest gap in hours worked between men and women (Jacobs, 2020). Wage inequality presents a problem from a normative perspective under the concept that equal pay should be given for equal work; it can also create inefficiencies in the labor market.In neo-classical labor market theory, equilibrium wage is paid to individuals where labor supplied is equal to the labor demanded. Shifts and movements along the demand curve are influenced by education, knowledge, technology, government policy, the price of inputs, available labor, and the number of companies competing in the labor market, among other factors. Individuals are then faced with the choice of competing interests where companies are willing to pay them enough to outweigh the opportunity costs of other activities such as leisure (Borjas, 2020).
1 | Introduction One assumption of the labor market model is that bias does not exist within the market and that employers hire based on human capital measures. If this assumption is violated, firms without selection bias have an advantage over firms that base employment decisions on factors outside of human capital. Furthermore, those subjected to selection bias are limited to which employers they choose to earn wages from (Goldin, 1992). One such issue in employment and wage selection is gender bias.Pay inequality between genders presents both ethical and economic problems that can be addressed by policy changes. This study examines the gender wage gap in Utah one- and five-years following graduation from a USHE institution. The research objectives address the following questions: 1) What is the historical progression or retrogression of the gender wage gap in Utah over time? 2) What predictors or explanatory variables contribute to the gender wage gap? 3) What changes and differences in wage occur over time between men and women in Utah? 4) To what degree do human capital measures explain the gender wage gap compared to possible gender wage bias?Understanding the history, predictors, and changes in the gender wage gap can lead to data informed policy changes in the public and private sectors.
1.2 | Literature Review
1.1 | Background
A considerable amount of literature has been published on the gender wage gap (Mandel, 2014; Semyonov, 2014). Researchers from multiple academic disciplines have investigated the gap using economics, social psychology, and public policy approaches, among others. The purpose of this review is to provide a historical and social science perspective of the gender wage gap and to provide context for the methodology and analysis of wage data for this report.
2
1.3 | Historical Methodologies
In his book The Economics of Discrimination, economist Gary Becker (1957) introduced a taste-based model of discrimination. He argued that employers, workers, and customers may have a “taste for discrimination.” This taste affects preferences for hiring, working with, or conducting business with a particular group of individuals. With the neo-classical assumption that all tastes are exogenous to economic models, Becker viewed the “taste for discrimination” to be determined outside of the market. Those who have a “taste for discrimination” are willing to pay a premium in order to discriminate; while those who belong in the less desirable group are willing to produce more to compensate their employers or to accept a lower wage for equivalent productivity. Becker further
suggested wage discrimination cannot persist as an equilibrium phenomenon in competitive labor markets (Becker, 1957). Classical studies on gender wage inequality (Oaxaca, 1973; Blinder, 1973) use separate regressions for men and women with the natural logarithm of hourly wage as the dependent variable, while the independent variables include education, occupation, on-the-job training, region, and others. The regression coefficients serve as estimates of how wages change with respect to one unit of change in the independent variables. The raw difference in wages between men and women can then be decomposed into a portion that can be attributed to differences in the independent variables, a part that can be attributed to differences in the coefficients, and an unexplained portion of the difference. The wage difference due to differences in independent variables is called “endowment,” or differences in skills; conversely, the remaining wage difference is called “wage discrimination” in classical literature, representing the portion of difference that cannot be explained.Economist Jacob Mincer (1974) formalized the human capital model, which views human capital as investments and wages earned as return on investment. Education and work experience are seen as capitals that could potentially increase productivity, and therefore increase wages earned, a summary statistic for economic output. Mincer proposed the Mincer earnings function, which models the logarithm of wage income as a function of education and a quadratic function of work experience for a given individual. It is important to note that Mincer implied the assumption that men and women had the same freedom to choose their education and employment opportunities. Men and women are assumed to participate in the labor market under equal conditions without biases or prejudice. Because so many variables influence the labor market’s composition, methodologies to define gender bias and the gender wage gap vary tremendously. Simple methods generalize wages into summary statistics of median or mean wage and calculate the difference between the genders. More commonly, reports decompose and group individuals by industry, hours worked, educational attainment, and experience. By decomposing the labor market with human capital measures, this approach seeks to explain the gender wage gap by differences in employment investment rather than biases faced by individuals. According to Claudia Goldin, one of the leading scholars on the gender wage gap, this method in large part (but not in all cases) explains the majority of the gender wage gap in the United States (Goldin, 2014).
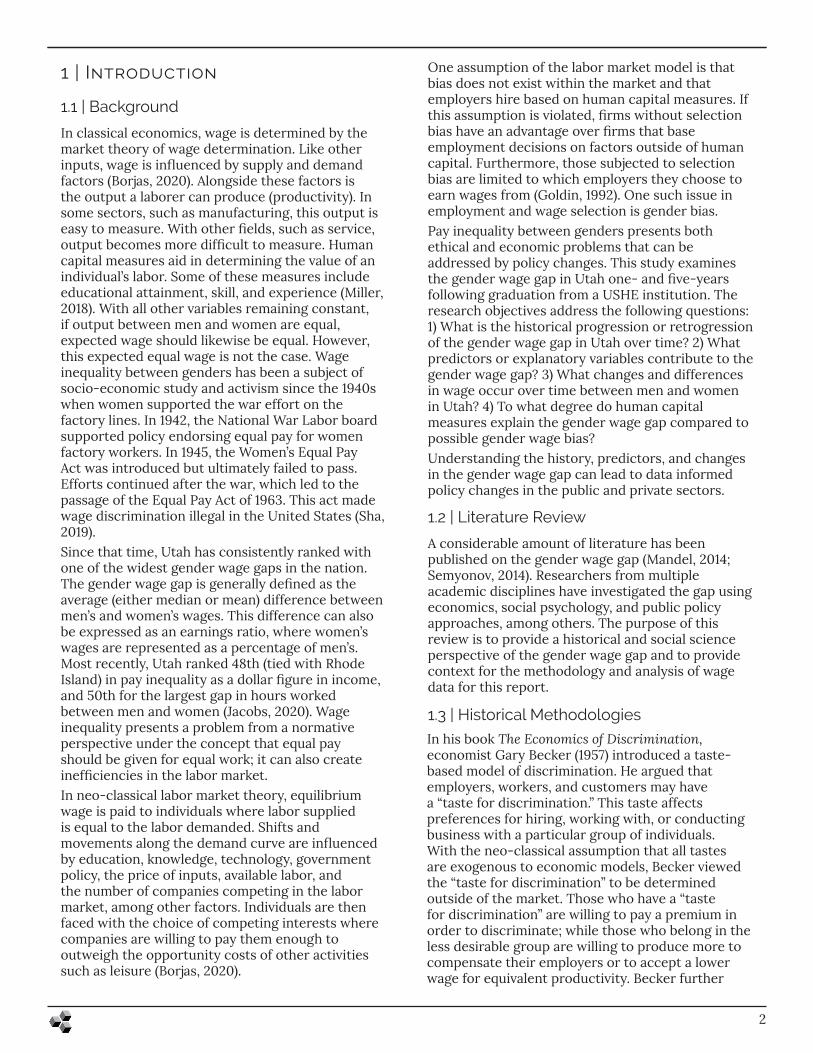
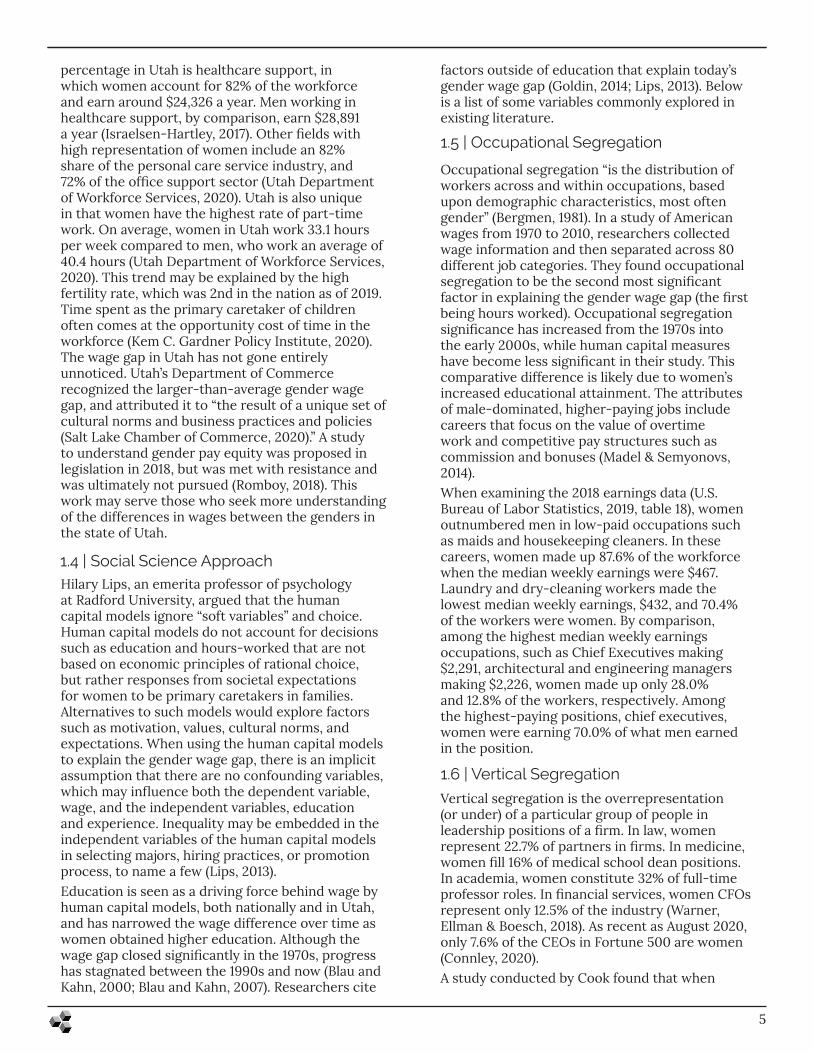
To fully understand the variables that lead to the gender wage gap, a historical study of wage differences between men and women is imperative, and insightful. Before the industrial revolution, agrarian occupation dominated much of the workforce. The physical demands of farm work gave men an advantage in efficiency and output. Societal norms directed women to occupations that required less physical strength and increased temporal flexibility to care for children (Humpries, 2009). As the labor market shifted in the early 18th century to manufacturing, women often found work in textile mills or as seamstresses. When roles were shared with men, it was estimated that they made one-third to one-half of men’s earnings. Men often took on higher-paying jobs and supervisory positions (Berg, 1991).Following World War II, when data became more accessible, many of the perceptions from past generations regarding women in the workforce influenced gender wage structures. When comparing wages of full-time, year-round employees from 1955-1970, the gender wage gap was approximately 36 – 40%. Progress since that time, using the same metric, has shrunk the wage gap to less than 20% today. Blau and Khan, prominent researchers of the history of the gender wage gap, noted a significant narrowing of the gender wage gap in the late 1970s; however, the convergence slowed in the 1990s. It has since stagnated between 75% and 79% without notable progress (Blau and Kahn 2000, Blau and Kahn 2007). Progress of gender pay equity (1979– 2018) is seen in Figure 1 below, in which women’s earnings are represented as an earnings ratio.
3
Figure 1: Women’s earnings as a percentage of men’s, median usual weekly earnings of full-time wage and salary workers, 1979-2018 (Bureau of Labor Statistics, 2018)
As a percentage of men’s wages, the minimum of women’s earnings came in 1979, where women made 62.3% of men’s wages. By comparison, the maximum came in 2014, when women earned 82.5% of men’s wages.
0%
20%
40%
60%
80%
100%
201820152010200520001995199019851979
Men’s Wages
Year
Wom
en’s
Wag
e as
a P
erce
nt o
f Men
’s W
age
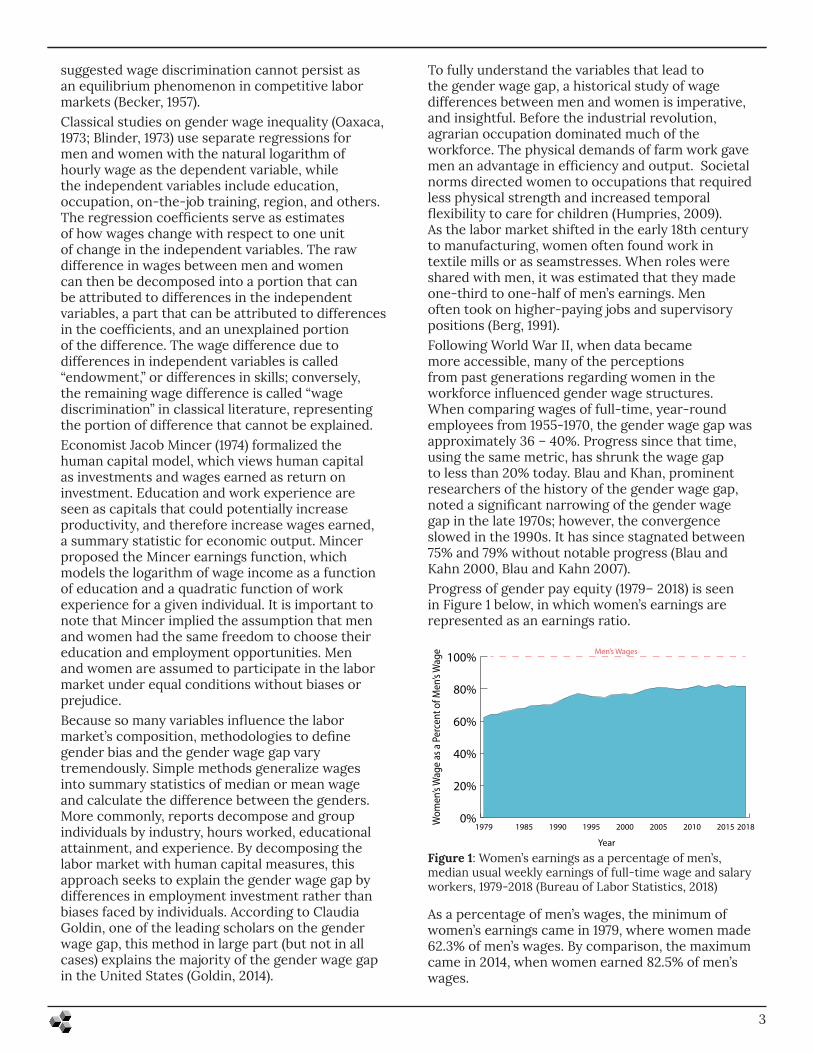
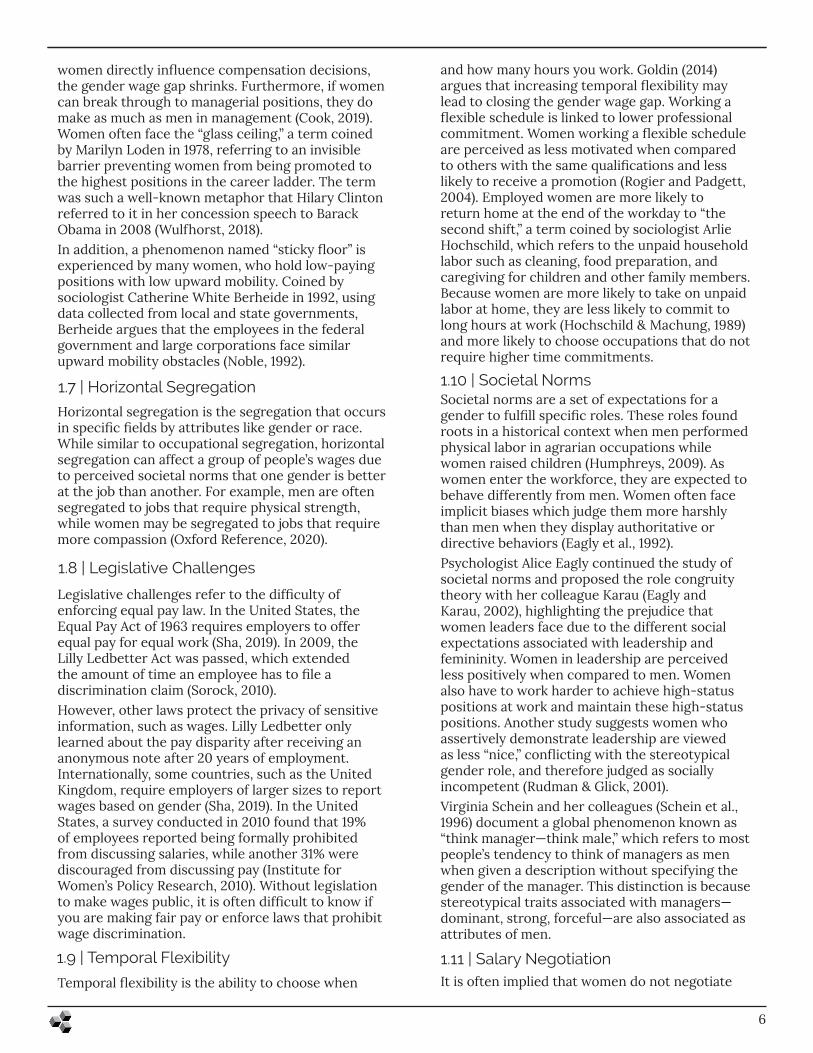
This literature review will not attempt to capture every variable leading to the progression of pay equality; however, educational opportunities and attainment contribute to the rise of women’s wages. In 1974, the Women’s Education Equity Act was passed, which “promote[d] educational equity for girls and women” (Women’s Education Equity Act, 1974). The act has since been expanded to include publicly funded primary, secondary, and post-secondary education programs. Since the 1981 – 82 academic year, more women in the United States have earned bachelor’s degrees than men (NCES, 2020). Women surpassed men in the number of individuals holding a master’s degree or higher in 2011 (U.S. Census Bureau, 2011). Progression of women’s bachelor’s degree attainment as a percentage of the labor force (ages 25 -64) longitudinally is seen in Figure 2 below (Bureau of Labor Statistics, 2019). The methodology for this measure changed in 1992. Before 1992, bachelor’s degrees were defined as four years of college or more; the definition was changed after 1992 to a bachelor’s degree or higher.
4
Figure 2: Percent of women in the workforce aged 25 - 64 who hold a bachelor’s degree and higher, 1979 – 2018 (Bureau of Labor Statistics, 2018)
The lowest percentage of women with a bachelor’s degree or higher came in 1979, the first year available, with 17.8%. The highest was in 2018 (the last year available at the time of this study), with 43.8% women with a bachelor’s degree or higher. This figure compares to men in 2018, where 37.5% have a bachelor’s degree or higher. Despite educational attainment and wage progression, gender pay inequality persists as an issue often making headlines and garnering new studies. The figure of today’s gender wage gap can vary substantially depending on which methodology is used and the variables chosen for decomposition. When using general techniques without accounting for part-time or full- time work, (aged 16 and older) women’s wage is 80% of men’s on average (IWPC, 2019). Pew Research used age parameters to
estimate the gap in pay for the workforce 16 and older, as well as the workforce ages 25-34. Using data for both part- and full-time workers, they found that women 16 and older made 85% of what men earned. Controlling for ages 25-34, women made 89% of what men earned (Graf, Brown, and Patten, 2019). Investigating the gender pay-gap by race reveals larger pay inequality between men and women in Asian and white communities than in Black and Hispanic communities (International Women’s Policy Center, 2019).The gap can widen by filtering to individuals with a Ph.D., in which women make 24% less than men with doctorate degrees (Gender Pay Persists, 2018). However, filtering for women who do not take on any caretaking responsibilities, the gap shrinks to just 5%. In many industry-specific studies, applying the filter of no caretaking responsibility removes the gap altogether (Waldfogel, 1997). While the number can fluctuate, in most cases, a gap still exists. Historically, Utah has lagged behind the progress made by the United States. Using equal parameters, the International Women’s Policy Center found women made 20% less than men in the United States. Women in Utah, by comparison, made 31.2% less. In terms of dollars, women made $36,300 annually in Utah compared to the $40,000 national average. This difference in wages is especially striking as women in Utah tend to earn lower wages than the national average, while men in Utah tend to make more. Men in Utah with less education often earn more than women with higher levels of educational attainment. In 2012, when comparing median annual earnings for full-time, year-round workers aged 25 and older, Utah men with some college or an associate degree earned more than women with bachelor’s degrees. Furthermore, men with a bachelor’s degree earned more than women with graduate degrees. This wage gap exists despite women nationally making up a higher percentage of bachelors, masters, and doctorate degrees (NCES, 2020).Since 2015, the gender wage gap in Utah has grown worse (IWPC, 2019). This retrogression is especially concerning as Utah has experienced significant economic growth during that time period, combined with women’s high labor force participation rate of 60% (Utah Department of Workforce Services, 2019). Unemployment in 2019 was at a nation-leading low of 2.6% (FRED Unemployment Rate in Utah, 2020) and gross domestic product growth was $10.4 billion (FRED Total Gross Domestic Product in Utah, 2020). Utah has the seventh highest median household income and is 38th in per capita income (Kem C. Gardner Policy Institute, 2020).The field where women account for the largest
0%
20%
40%
60%
80%
100%
201820152010200520001995199019851979
Year
Perce
nt of
wor
king w
omen
with
a Ba
chelo
r’s de
gree
or hi
gher
percentage in Utah is healthcare support, in which women account for 82% of the workforce and earn around $24,326 a year. Men working in healthcare support, by comparison, earn $28,891 a year (Israelsen-Hartley, 2017). Other fields with high representation of women include an 82% share of the personal care service industry, and 72% of the office support sector (Utah Department of Workforce Services, 2020). Utah is also unique in that women have the highest rate of part-time work. On average, women in Utah work 33.1 hours per week compared to men, who work an average of 40.4 hours (Utah Department of Workforce Services, 2020). This trend may be explained by the high fertility rate, which was 2nd in the nation as of 2019. Time spent as the primary caretaker of children often comes at the opportunity cost of time in the workforce (Kem C. Gardner Policy Institute, 2020).The wage gap in Utah has not gone entirely unnoticed. Utah’s Department of Commerce recognized the larger-than-average gender wage gap, and attributed it to “the result of a unique set of cultural norms and business practices and policies (Salt Lake Chamber of Commerce, 2020).” A study to understand gender pay equity was proposed in legislation in 2018, but was met with resistance and was ultimately not pursued (Romboy, 2018). This work may serve those who seek more understanding of the differences in wages between the genders in the state of Utah.
5
1.4 | Social Science ApproachHilary Lips, an emerita professor of psychology at Radford University, argued that the human capital models ignore “soft variables” and choice. Human capital models do not account for decisions such as education and hours-worked that are not based on economic principles of rational choice, but rather responses from societal expectations for women to be primary caretakers in families. Alternatives to such models would explore factors such as motivation, values, cultural norms, and expectations. When using the human capital models to explain the gender wage gap, there is an implicit assumption that there are no confounding variables, which may influence both the dependent variable, wage, and the independent variables, education and experience. Inequality may be embedded in the independent variables of the human capital models in selecting majors, hiring practices, or promotion process, to name a few (Lips, 2013). Education is seen as a driving force behind wage by human capital models, both nationally and in Utah, and has narrowed the wage difference over time as women obtained higher education. Although the wage gap closed significantly in the 1970s, progress has stagnated between the 1990s and now (Blau and Kahn, 2000; Blau and Kahn, 2007). Researchers cite
factors outside of education that explain today’s gender wage gap (Goldin, 2014; Lips, 2013). Below is a list of some variables commonly explored in existing literature.
1.5 | Occupational Segregation
Occupational segregation “is the distribution of workers across and within occupations, based upon demographic characteristics, most often gender” (Bergmen, 1981). In a study of American wages from 1970 to 2010, researchers collected wage information and then separated across 80 different job categories. They found occupational segregation to be the second most significant factor in explaining the gender wage gap (the first being hours worked). Occupational segregation significance has increased from the 1970s into the early 2000s, while human capital measures have become less significant in their study. This comparative difference is likely due to women’s increased educational attainment. The attributes of male-dominated, higher-paying jobs include careers that focus on the value of overtime work and competitive pay structures such as commission and bonuses (Madel & Semyonovs, 2014).When examining the 2018 earnings data (U.S. Bureau of Labor Statistics, 2019, table 18), women outnumbered men in low-paid occupations such as maids and housekeeping cleaners. In these careers, women made up 87.6% of the workforce when the median weekly earnings were $467. Laundry and dry-cleaning workers made the lowest median weekly earnings, $432, and 70.4% of the workers were women. By comparison, among the highest median weekly earnings occupations, such as Chief Executives making $2,291, architectural and engineering managers making $2,226, women made up only 28.0% and 12.8% of the workers, respectively. Among the highest-paying positions, chief executives, women were earning 70.0% of what men earned in the position.
1.6 | Vertical Segregation
Vertical segregation is the overrepresentation (or under) of a particular group of people in leadership positions of a firm. In law, women represent 22.7% of partners in firms. In medicine, women fill 16% of medical school dean positions. In academia, women constitute 32% of full-time professor roles. In financial services, women CFOs represent only 12.5% of the industry (Warner, Ellman & Boesch, 2018). As recent as August 2020, only 7.6% of the CEOs in Fortune 500 are women (Connley, 2020).A study conducted by Cook found that when
6
1.8 | Legislative Challenges
Legislative challenges refer to the difficulty of enforcing equal pay law. In the United States, the Equal Pay Act of 1963 requires employers to offer equal pay for equal work (Sha, 2019). In 2009, the Lilly Ledbetter Act was passed, which extended the amount of time an employee has to file a discrimination claim (Sorock, 2010).However, other laws protect the privacy of sensitive information, such as wages. Lilly Ledbetter only learned about the pay disparity after receiving an anonymous note after 20 years of employment. Internationally, some countries, such as the United Kingdom, require employers of larger sizes to report wages based on gender (Sha, 2019). In the United States, a survey conducted in 2010 found that 19% of employees reported being formally prohibited from discussing salaries, while another 31% were discouraged from discussing pay (Institute for Women’s Policy Research, 2010). Without legislation to make wages public, it is often difficult to know if you are making fair pay or enforce laws that prohibit wage discrimination.
1.10 | Societal NormsSocietal norms are a set of expectations for a gender to fulfill specific roles. These roles found roots in a historical context when men performed physical labor in agrarian occupations while women raised children (Humphreys, 2009). As women enter the workforce, they are expected to behave differently from men. Women often face implicit biases which judge them more harshly than men when they display authoritative or directive behaviors (Eagly et al., 1992). Psychologist Alice Eagly continued the study of societal norms and proposed the role congruity theory with her colleague Karau (Eagly and Karau, 2002), highlighting the prejudice that women leaders face due to the different social expectations associated with leadership and femininity. Women in leadership are perceived less positively when compared to men. Women also have to work harder to achieve high-status positions at work and maintain these high-status positions. Another study suggests women who assertively demonstrate leadership are viewed as less “nice,” conflicting with the stereotypical gender role, and therefore judged as socially incompetent (Rudman & Glick, 2001). Virginia Schein and her colleagues (Schein et al., 1996) document a global phenomenon known as “think manager—think male,” which refers to most people’s tendency to think of managers as men when given a description without specifying the gender of the manager. This distinction is because stereotypical traits associated with managers—dominant, strong, forceful—are also associated as attributes of men.
1.11 | Salary Negotiation
women directly influence compensation decisions, the gender wage gap shrinks. Furthermore, if women can break through to managerial positions, they do make as much as men in management (Cook, 2019). Women often face the “glass ceiling,” a term coined by Marilyn Loden in 1978, referring to an invisible barrier preventing women from being promoted to the highest positions in the career ladder. The term was such a well-known metaphor that Hilary Clinton referred to it in her concession speech to Barack Obama in 2008 (Wulfhorst, 2018). In addition, a phenomenon named “sticky floor” is experienced by many women, who hold low-paying positions with low upward mobility. Coined by sociologist Catherine White Berheide in 1992, using data collected from local and state governments, Berheide argues that the employees in the federal government and large corporations face similar upward mobility obstacles (Noble, 1992).
1.7 | Horizontal Segregation
Horizontal segregation is the segregation that occurs in specific fields by attributes like gender or race. While similar to occupational segregation, horizontal segregation can affect a group of people’s wages due to perceived societal norms that one gender is better at the job than another. For example, men are often segregated to jobs that require physical strength, while women may be segregated to jobs that require more compassion (Oxford Reference, 2020).
1.9 | Temporal Flexibility
Temporal flexibility is the ability to choose when
and how many hours you work. Goldin (2014) argues that increasing temporal flexibility may lead to closing the gender wage gap. Working a flexible schedule is linked to lower professional commitment. Women working a flexible schedule are perceived as less motivated when compared to others with the same qualifications and less likely to receive a promotion (Rogier and Padgett, 2004). Employed women are more likely to return home at the end of the workday to “the second shift,” a term coined by sociologist Arlie Hochschild, which refers to the unpaid household labor such as cleaning, food preparation, and caregiving for children and other family members. Because women are more likely to take on unpaid labor at home, they are less likely to commit to long hours at work (Hochschild & Machung, 1989) and more likely to choose occupations that do not require higher time commitments.
It is often implied that women do not negotiate
7
1.12 | Caretaking
Caretaking is related to societal norms, or perhaps biology, where women are expected to be the primary caretakers for families. This caretaking extends to both motherhood and caring for elderly parents (Goldin, 2016). These expectations often steer women away from higher-paying fields that would not allow them to fulfill this responsibility (Schnieder, 2016). Due to the cost of family care, having a stay-at-home parent makes financial sense for some families. In her book, The Price of Motherhood, author Ann Crittenden coined the term “mommy tax” and states that an average college-educated woman loses over a million dollars in lifetime income if she has just one child. She argues that mothers are the producers and caregivers of children who will become “human capital” for future economic growth. Yet mothers receive a penalty for raising children. Longitudinal studies (Waldfogel, 1997; Budig & England 2001) found a wage penalty of 6% for women with one child and 13% for women with two or more children, or approximately 7% per child. Another study (Miller, 2009) found that delaying motherhood by one year leads to an increase of 9% in earnings for women.
wages as often or as effectively as men. In a survey of recent graduates, one-half of male MBA students stated they negotiated their wage when offered a job, compared to just one-eighth of women (Small, 2007). Societal norms have steered women to not ask for higher wages as “they have learned that they may ultimately lose more than they gain (Wade, 2001).” As women begin their careers at a lower starting wage, the gap balloons as more time is spent in the workforce. Women within all levels of educational attainment are less likely to negotiate their first job offer than men. Even when women do negotiate, they are still likely to receive less than men (Babcock & Laschever, 2009). Women were also more often penalized for initiating negotiations. Those who negotiate are perceived as socially incompetent, as they are perceived as demanding (Bowles et al., 2006).
1.13 | Educational Segregation
Education is often cited as an attribute related to a difference in pay due to the notion that higher educational attainment leads to higher wage. The education gap in the United States is closed and now favors women achieving post-secondary education more than men (U.S. Bureau of Labor Statistics, 2019). However, some studies still show more men in high paying jobs in science, technology, engineering, and math (STEM) fields. Women represent only 28% of the STEM workforce, resulting in an important aspect of the gender wage gap as these fields tend to offer higher wage (U.S. National Science Foundation,
2018).A classic psychology experiment in the 1960s found that teachers’ expectations can highly influence students’ performance when the teachers set their own expectations based on randomly assigned test score (Rosenthal & Jacobson, 1968). As an example of the self-fulfilling prophecy, when teachers expect a student to do well, the student in turn does better than his or her peers. A more recent study (Moss-Racusin et al., 2012) highlights the biases against female students at science faculty from research-intensive universities. Female students make up a disproportionally low share of STEM majors. Not only do female students face prejudice that male students do not in STEM disciplines, but women with STEM degrees are also less likely to enter a STEM career after graduating. They are more likely to leave their STEM career even if they hold a STEM degree. Multiple studies have cited reasons such as hostile environment, a lack of female role models, and gender stereotyping as reasons for women leaving STEM related work (Hewlett et al., 2008; Beede et al., 2011).Explanatory variables from many studies illustrate the complexity of the gender wage gap. Individuals’ choices and the biases they face are intricately intertwined. This study seeks to add to current literature by researching the causes that may explain why Utah’s gender wage gap might be higher than the national average. The objective of the study is to build an understanding of Utah’s history and progression of the gender wage gap. Afterward, data is then decomposed, modeled, and statistically evaluated to understand which variables may best explain this gap after graduation from a public post-secondary institution in Utah.By understanding the progression and reasons behind differences in pay between the genders, policymakers in education, business, and legislation can make data-informed decisions to assist in the progression toward equal pay between genders.
2 | Methods2.1 | SoftwareAnalyses and visualizations for this study were performed in Python (v 3.7) with libraries including pandas (v0.25.1), NumPy (v1.16.5), seaborn (v0.9.0), and Matplotlib (v3.1.1). The R software environment 3.6.1 (R Core Team, 2013) was also utilized, along with the following libraries: dplyr (v0.8.3, Wickham, Francois, Henry, & Müller, 2015), magrittr (v1.5, Bache & Wickham, 2014), readr (v1.3.1, Wickham, Hester, & Francois, 2017), and Oaxaca (v0.1.4, Hlavac, 2014).
8
the previous year and ends the Spring semester calendar year. For technical institutions, cohort years begin July 1st of the previous year and end on July 30th of the calendar year. The sample size from academic institutions included 67,013 graduates, while 35,190 were women and 31,823 were men. The sample size from technical colleges included 10,788 graduates, while 5,713 were women and 5,075 were men. Records from the Utah DWS were matched with USHE graduates’ one- and five-calendar years post-graduation. Wage records were collected from the Unemployment Insurance (UI) program, a division of the Utah DWS. Employers across the state of Utah are required to report wages for employees quarterly. If an individual has wages from multiple employers in any given quarter, these wages were summed to compute individuals’ quarterly wages. These quarterly wages were then summed to produce the annual wage.For this study, only the highest educational attainment for a given student was considered. If a student obtained a technical degree, followed by a bachelor’s degree, this student’s educational attainment was classified as a bachelor’s degree. If a student completed a degree but returned to an academic institution or technical college, they were excluded from the study. The five groups of educational attainment from the lowest to highest are the following: technical certificate, associate degree, bachelor’s degree, master’s degree, or higher. Additionally, if a student took a course at an academic or technical institution after their graduating academic year, they were excluded from the study. Students who reported “general education” as CIP were excluded as they were likely to have continued with their academic career. If a student obtained multiple degrees with the same educational attainment on the same day from different CIP code families (commonly known as “double majors”), the area studied was coded to be “multiple.” Although all students were recent graduates, students’ ages at graduation were used as a proxy for work experience and time in the workforce before graduating. The first workforce quarter available for this study is 2001.Graduation records were matched with wage data from the Utah DWS. As opposed to the academic year, the calendar year is used to match wage records one- and five-years after graduating. Because number of hours worked for each individual is not available in wage records, a 40-hour work week full-time status for the graduates are not available. To overcome this limitation, calculations from wages and quarters worked were used to indicate workers who were strongly attached to the workforce. A worker who is strongly attached to the workforce is defined as
2.2 | DataTo provide a more detailed background on the history of the gender wage gap in Utah, data from the American Community Survey (ACS) is used. The U.S. Bureau of Labor Statistics (BLS) conducts the ACS annually. The survey complements the work conducted decennially by the U.S. Census Bureau and is sent to 295,000 households each month. Questions about race, ethnicity, educational attainment, migration, and disability are recorded. Weights are then applied to each respondent group to be representative of the population in their area. At the time of this study, ACS data was immediately available from 2005 – 2018. The one-year ACS data is used for both Utah and national metrics. ACS uses a standard confidence interval of 90% (U.S. Census Bureau, 2019). Wage data is used from this survey for Utah and is compared to the national average.As the survey includes all working individuals, including working children, wages were filtered to exclude those under age 18. Those with no reportable wages are also excluded from each annual sample. National metrics are used in coordination with Utah metrics to contextualize how wages in the state compare to the national average. The number of housing units interview respondents each year nationally was approximately 2,200,000, while the number of Utah housing units interview respondents was approximately 17,000 annually. The ACS weights were applied, both nationally and statewide, to be representative of the working population. Objective one of this report is divided into three parts: all adult wages including part-time workers, wages of only full-time workers, and wages separated by educational attainment. Median wage figures are then divided with women’s wages as the numerator, and men’s wages as the denominator, to calculate the earnings ratio that women earn compared to men. To calculate the gender wage gap, this figure can be subtracted from one. From the Utah Data Research Center (UDRC) data warehouse, graduation records from USHE for cohort years 2012 to 2014 were obtained. The Utah System of Higher Education recently merged with the Utah System of Technical Colleges. To differentiate the two, universities and community colleges in USHE are referred to as academic institutions throughout the study. Institutions formerly associated with the Utah System of Technical Colleges are referred to as technical colleges. Please see appendix Supplementary Information One for complete lists of academic institutions and technical colleges of the USHE. The academic cohort years are used to be in better conformity with research conducted by USHE. Cohort years follow the USHE academic calendar, which begins during the Summer semester of
9
The ACS is a cross-sectional study weighted to represent the labor force each year. As such, results from this section of the study should not be used to observe the progression of wages of one group or cohort, as different individuals were surveyed each year. Respondents of the ACS are residents of the state at the time of the survey. They may have received education outside of the USHE.Data used in objectives two, three, and four only include graduates from the USHE. Wage information for high school graduates cannot be obtained for the Utah State Board of Education (USBE) graduates. They do not have variables available to match with Workforce Services’ UI records. Included cohorts of the study are limited to the 2012 – 2014 cohort years. Education obtained before 2011 is not considered in this study. In some cases, graduates before 2011 may have enrolled in a new program. The prior degree, in this case, would not be considered. Data were not available for individuals obtaining education outside of the state of Utah or the USHE. Exclusions include some post-secondary institutions in Utah, such as Brigham Young University, Westminster College, and Western Governors University. Therefore, data are only generalizable to graduates of USHE institutions. Those with some college but no degree are not considered in these objectives, only those with a technical certificate or degree are considered. These individuals may be attached to employment, where the gender wage gap is different than those with a USHE degree. This study includes wage data one- and five-years post-graduation. Due to timeline requirements, the most recent graduation cohort was 2014, while the oldest complete graduation data available to the
UDRC were from the 2012 academic year. Wage data are not complete for the 2020 calendar year at the time of this study. The 2014 cohort was the most recent with five-year post-graduation wage data available, resulting in a distribution of data skewing to the younger age groups. As age was used as a proxy for work experience, results for older graduates were often not publishable in accordance with the methodological requirement of 30 individuals in an age bin and the UDRC disclosure protocol to preserve the identities of all individuals in research. Number of quarters worked while an individual is strongly attached to the workforce before graduation is also used as a proxy for experience. Prior work experience may not apply to the field of occupation following graduation. UI records stored at the UDRC begin in the first quarter of 2001. Any wage records before 2001 are not considered in this study. The exclusion of wages prior to 2001 may inadvertently result in a lack to demonstrate the decades-long cumulative effect of applicable industry experience on wage. A wider gap for those with experience could be related to women not negotiating as frequently as men, women tend to prioritize schedule flexibility over monetary gains to allow for caregiving, or other factors. Wage data from UI records do not capture all income by graduates. For example, income from self-employment, federal agencies, black market transactions, non-profit employment, and agriculture may not be subject to UI wage reporting requirements. Income derived outside of the workforce (dividends, real estate, etc.) is not recorded in wage records. Any income earned outside of the state of Utah is also not available. While results drawn from DWS data may not be generalized to all income, the U.S. BLS (2018) indicates that over 90% of workers are included in UI records. The findings from this research are significant.UI wage records provide no detail on hours worked. Seasonal workers may also be excluded from the consideration of attachment to the workforce due to not having met the wage criteria for all four quarters. Further research would be required to gain more insight into hourly wages for those in the same industry, as employers report quarterly UI wages only. In certain high-earning occupations, workers may be classified as strongly attached to the workforce in this study even when workforce participation is less than 40 hours a week. In addition, hourly pay would paint a more accurate picture of the monetary reward difference between men and women for the same unit of labor. Though CIP codes are used to organize fields of study and program completions, they do not denote the field or occupation that a graduate enters. As a result,
2.3 | Data Limitations
a graduate who has UI wages no less than wages for individuals working 40 hours a week, earning at least the federal minimum wage of $7.25 per hour for all four quarters of the calendar year. An individual is considered “strongly attached to the workforce” if all four quarterly wages exceed this full-time threshold. For example, if an individual has more than $15,080 (7.25*40*52) annual wages reported for a given year, but one of the quarters shows less than $3,770 (7.25*40*52/4) in wages, this individual would not be considered strongly attached to the workforce for this calendar year in this study. An individual’s wages at one- and five-years post-graduation are snapshots of the individual’s earning, and does not capture continuous work history. For this research, the earnings ratio is defined as the ratio between female graduates’ annual median income and the male graduates’ annual median income. Earnings ratios were calculated one year and five years after graduation.
10
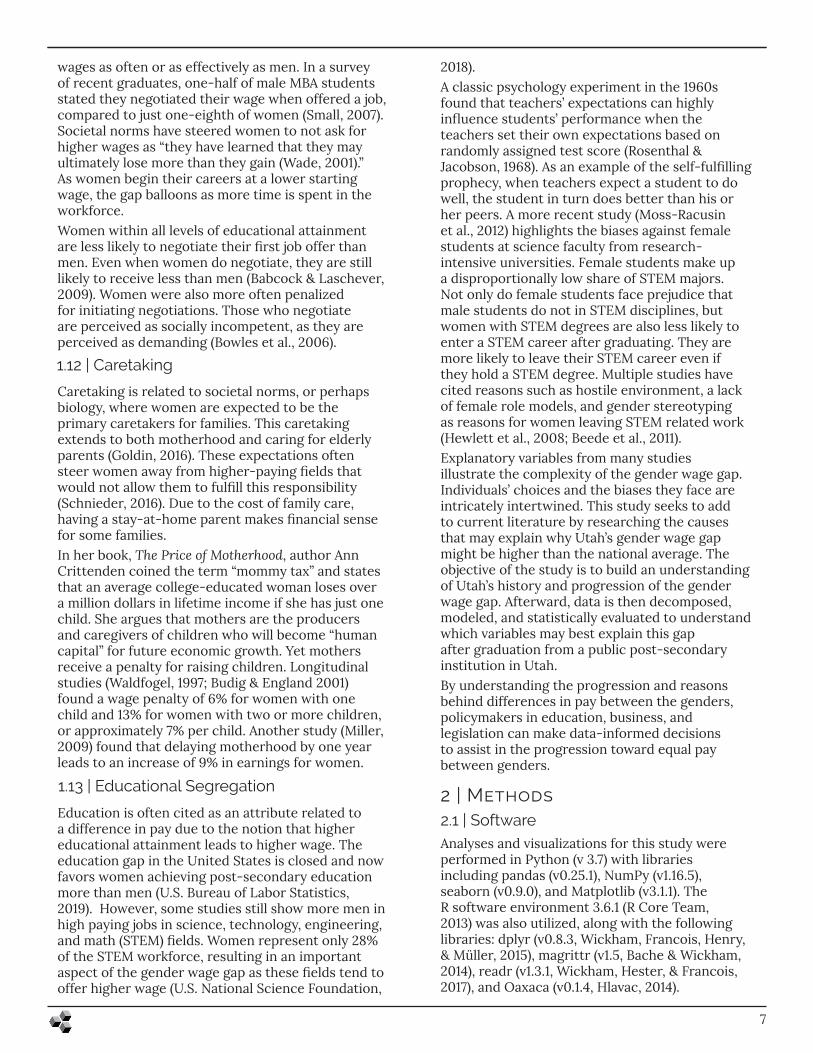
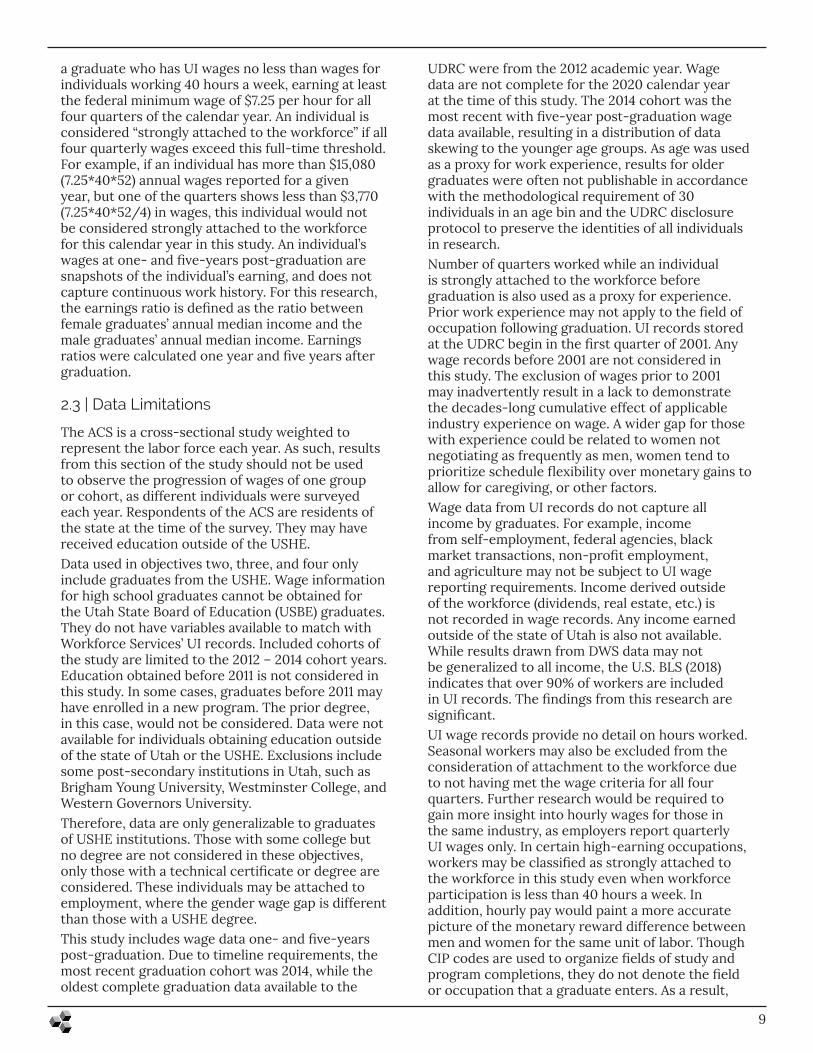
To understand income differences and trends between men and women, historical wage records will be compared using data from sampled households from the ACS. This survey was used to better represent the labor force of Utah as a whole. The survey receives responses from heads of households of all ages, unlike graduation data used later in the study that is more biased toward younger individuals who are likely at the beginning of their careers. Data is immediately available from the BLS online from 2005 – 2018, and all available years are used for this research. Median wage is examined by decomposing ACS data nationally and for Utah in three parts. Wage is then divided (women’s wage / men’s wage) to present an earnings ratio so different years can be compared without inflation adjustment. The first decomposition investigates all adults (18 years or greater) with wages greater than 0, the second decomposition excludes adults that typically work less than 35 hours a week, and the last decomposition groups these individuals by their highest level of educational attainment. To better understand the general workforce wage, both part-time and full-time workers are included prior to any decomposition or grouping. This sample is meant as the baseline for wages and can be used to better understand the impact of later decompositions. The group does not include working non-adults or those who had no wages. Women typically occupy more part-time work than men, especially in Utah (Kem C. Gardner Policy Institute, 2020), so a higher wage gap is expected. As shown in Figure 3, the median wage is used as the measure as it is less sensitive to outliers. In addition, the mean, median,
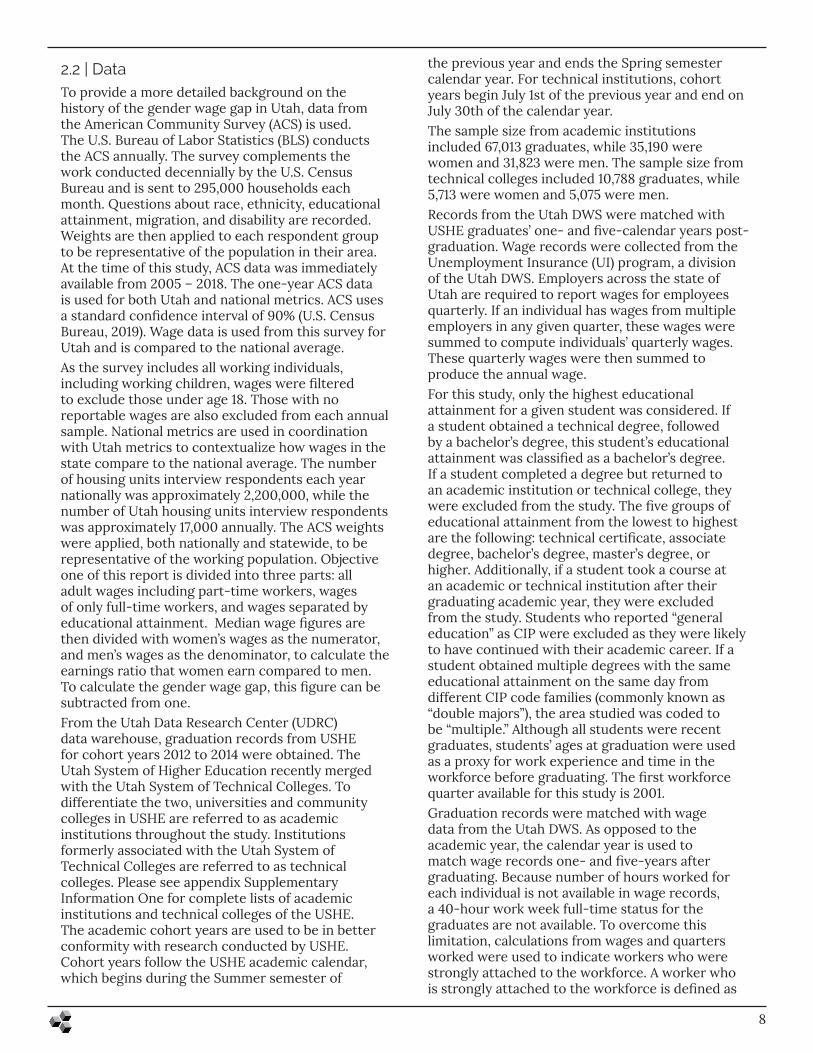
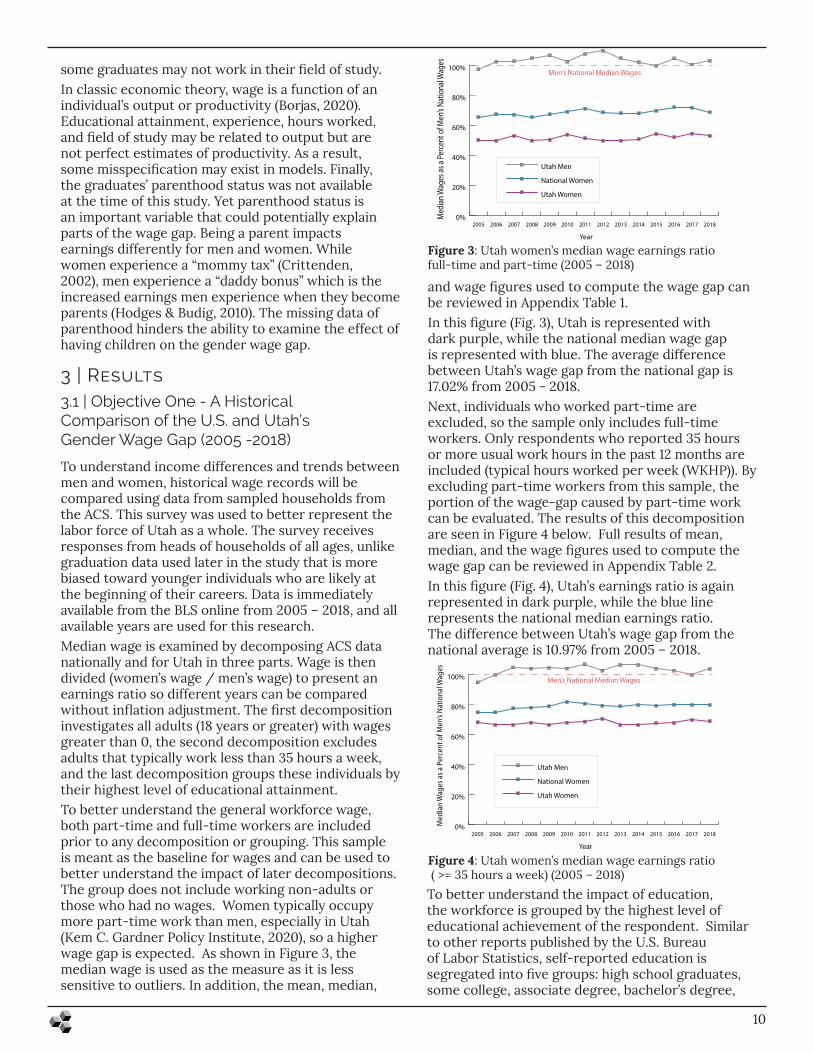
and wage figures used to compute the wage gap can be reviewed in Appendix Table 1.In this figure (Fig. 3), Utah is represented with dark purple, while the national median wage gap is represented with blue. The average difference between Utah’s wage gap from the national gap is 17.02% from 2005 - 2018. Next, individuals who worked part-time are excluded, so the sample only includes full-time workers. Only respondents who reported 35 hours or more usual work hours in the past 12 months are included (typical hours worked per week (WKHP)). By excluding part-time workers from this sample, the portion of the wage-gap caused by part-time work can be evaluated. The results of this decomposition are seen in Figure 4 below. Full results of mean, median, and the wage figures used to compute the wage gap can be reviewed in Appendix Table 2. In this figure (Fig. 4), Utah’s earnings ratio is again represented in dark purple, while the blue line represents the national median earnings ratio. The difference between Utah’s wage gap from the national average is 10.97% from 2005 – 2018.
3 | Results
Figure 3: Utah women’s median wage earnings ratio full-time and part-time (2005 – 2018)
3.1 | Objective One - A Historical Comparison of the U.S. and Utah’s Gender Wage Gap (2005 -2018)
some graduates may not work in their field of study. In classic economic theory, wage is a function of an individual’s output or productivity (Borjas, 2020). Educational attainment, experience, hours worked, and field of study may be related to output but are not perfect estimates of productivity. As a result, some misspecification may exist in models. Finally, the graduates’ parenthood status was not available at the time of this study. Yet parenthood status is an important variable that could potentially explain parts of the wage gap. Being a parent impacts earnings differently for men and women. While women experience a “mommy tax” (Crittenden, 2002), men experience a “daddy bonus” which is the increased earnings men experience when they become parents (Hodges & Budig, 2010). The missing data of parenthood hinders the ability to examine the effect of having children on the gender wage gap.
Figure 4: Utah women’s median wage earnings ratio ( >= 35 hours a week) (2005 – 2018)To better understand the impact of education, the workforce is grouped by the highest level of educational achievement of the respondent. Similar to other reports published by the U.S. Bureau of Labor Statistics, self-reported education is segregated into five groups: high school graduates, some college, associate degree, bachelor’s degree,
0%
20%
40%
60%
80%
100%
Utah Men
National Women
Utah Women
20182017201620152014201320122011201020092008200720062005
Year
Med
ian W
ages
as a
Perc
ent o
f Men
’s Na
tiona
l Wag
es
Men’s National Median Wages
0%
20%
40%
60%
80%
100%
Utah Men
National Women
Utah Women
20182017201620152014201320122011201020092008200720062005
Year
Med
ian
Wag
es a
s a P
erce
nt o
f Men
’s N
atio
nal W
ages
Men’s National Median Wages
11
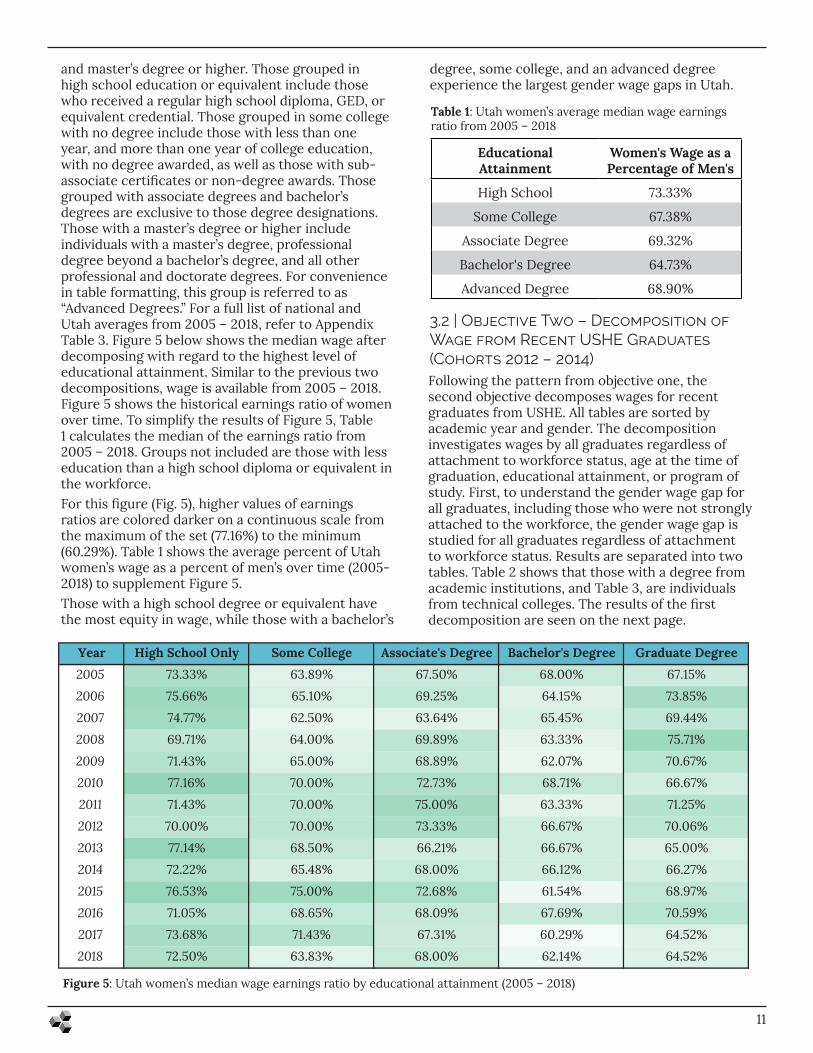
Figure 5: Utah women’s median wage earnings ratio by educational attainment (2005 – 2018)
Table 1: Utah women’s average median wage earnings ratio from 2005 – 2018
Educational Attainment
Women's Wage as a Percentage of Men's
High School 73.33%
Some College 67.38%
Associate Degree 69.32%
Bachelor's Degree 64.73%
Advanced Degree 68.90%
Year High School Only Some College Associate's Degree Bachelor's Degree Graduate Degree2005 73.33% 63.89% 67.50% 68.00% 67.15%2006 75.66% 65.10% 69.25% 64.15% 73.85%2007 74.77% 62.50% 63.64% 65.45% 69.44%2008 69.71% 64.00% 69.89% 63.33% 75.71%2009 71.43% 65.00% 68.89% 62.07% 70.67%2010 77.16% 70.00% 72.73% 68.71% 66.67%2011 71.43% 70.00% 75.00% 63.33% 71.25%2012 70.00% 70.00% 73.33% 66.67% 70.06%2013 77.14% 68.50% 66.21% 66.67% 65.00%2014 72.22% 65.48% 68.00% 66.12% 66.27%2015 76.53% 75.00% 72.68% 61.54% 68.97%2016 71.05% 68.65% 68.09% 67.69% 70.59%2017 73.68% 71.43% 67.31% 60.29% 64.52%2018 72.50% 63.83% 68.00% 62.14% 64.52%
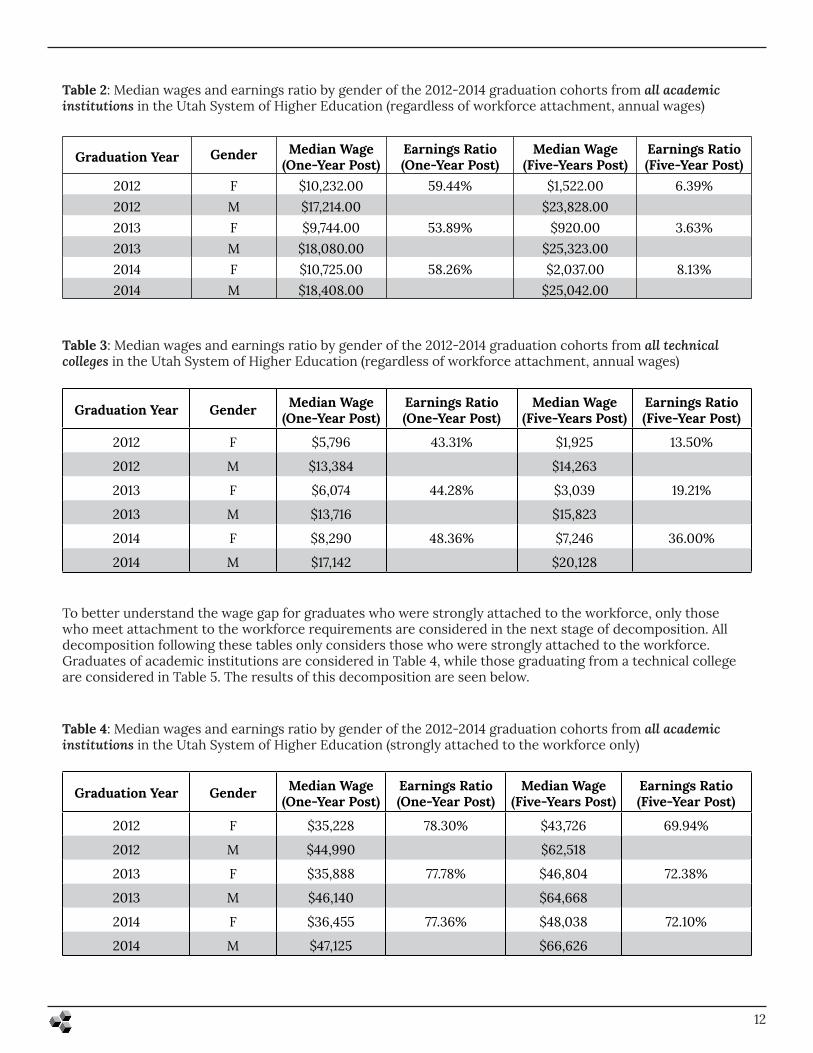
Following the pattern from objective one, the second objective decomposes wages for recent graduates from USHE. All tables are sorted by academic year and gender. The decomposition investigates wages by all graduates regardless of attachment to workforce status, age at the time of graduation, educational attainment, or program of study. First, to understand the gender wage gap for all graduates, including those who were not strongly attached to the workforce, the gender wage gap is studied for all graduates regardless of attachment to workforce status. Results are separated into two tables. Table 2 shows that those with a degree from academic institutions, and Table 3, are individuals from technical colleges. The results of the first decomposition are seen on the next page.
3.2 | Objective Two – Decomposition of Wage from Recent USHE Graduates (Cohorts 2012 – 2014)
and master’s degree or higher. Those grouped in high school education or equivalent include those who received a regular high school diploma, GED, or equivalent credential. Those grouped in some college with no degree include those with less than one year, and more than one year of college education, with no degree awarded, as well as those with sub-associate certificates or non-degree awards. Those grouped with associate degrees and bachelor’s degrees are exclusive to those degree designations. Those with a master’s degree or higher include individuals with a master’s degree, professional degree beyond a bachelor’s degree, and all other professional and doctorate degrees. For convenience in table formatting, this group is referred to as “Advanced Degrees.” For a full list of national and Utah averages from 2005 – 2018, refer to Appendix Table 3. Figure 5 below shows the median wage after decomposing with regard to the highest level of educational attainment. Similar to the previous two decompositions, wage is available from 2005 – 2018. Figure 5 shows the historical earnings ratio of women over time. To simplify the results of Figure 5, Table 1 calculates the median of the earnings ratio from 2005 – 2018. Groups not included are those with less education than a high school diploma or equivalent in the workforce. For this figure (Fig. 5), higher values of earnings ratios are colored darker on a continuous scale from the maximum of the set (77.16%) to the minimum (60.29%). Table 1 shows the average percent of Utah women’s wage as a percent of men’s over time (2005-2018) to supplement Figure 5.Those with a high school degree or equivalent have the most equity in wage, while those with a bachelor’s
degree, some college, and an advanced degree experience the largest gender wage gaps in Utah.
12
Table 2: Median wages and earnings ratio by gender of the 2012-2014 graduation cohorts from all academic institutions in the Utah System of Higher Education (regardless of workforce attachment, annual wages)
Table 3: Median wages and earnings ratio by gender of the 2012-2014 graduation cohorts from all technical colleges in the Utah System of Higher Education (regardless of workforce attachment, annual wages)
Table 4: Median wages and earnings ratio by gender of the 2012-2014 graduation cohorts from all academic institutions in the Utah System of Higher Education (strongly attached to the workforce only)
To better understand the wage gap for graduates who were strongly attached to the workforce, only those who meet attachment to the workforce requirements are considered in the next stage of decomposition. All decomposition following these tables only considers those who were strongly attached to the workforce. Graduates of academic institutions are considered in Table 4, while those graduating from a technical college are considered in Table 5. The results of this decomposition are seen below.
Graduation Year Gender Median Wage (One-Year Post)
Earnings Ratio (One-Year Post)
Median Wage (Five-Years Post)
Earnings Ratio (Five-Year Post)
2012 F $10,232.00 59.44% $1,522.00 6.39%2012 M $17,214.00 $23,828.002013 F $9,744.00 53.89% $920.00 3.63%2013 M $18,080.00 $25,323.002014 F $10,725.00 58.26% $2,037.00 8.13%2014 M $18,408.00 $25,042.00
Graduation Year Gender Median Wage (One-Year Post)
Earnings Ratio (One-Year Post)
Median Wage (Five-Years Post)
Earnings Ratio (Five-Year Post)
2012 F $5,796 43.31% $1,925 13.50%
2012 M $13,384 $14,263
2013 F $6,074 44.28% $3,039 19.21%
2013 M $13,716 $15,823
2014 F $8,290 48.36% $7,246 36.00%
2014 M $17,142 $20,128
Graduation Year Gender Median Wage (One-Year Post)
Earnings Ratio (One-Year Post)
Median Wage (Five-Years Post)
Earnings Ratio (Five-Year Post)
2012 F $35,228 78.30% $43,726 69.94%
2012 M $44,990 $62,518
2013 F $35,888 77.78% $46,804 72.38%
2013 M $46,140 $64,668
2014 F $36,455 77.36% $48,038 72.10%
2014 M $47,125 $66,626
13
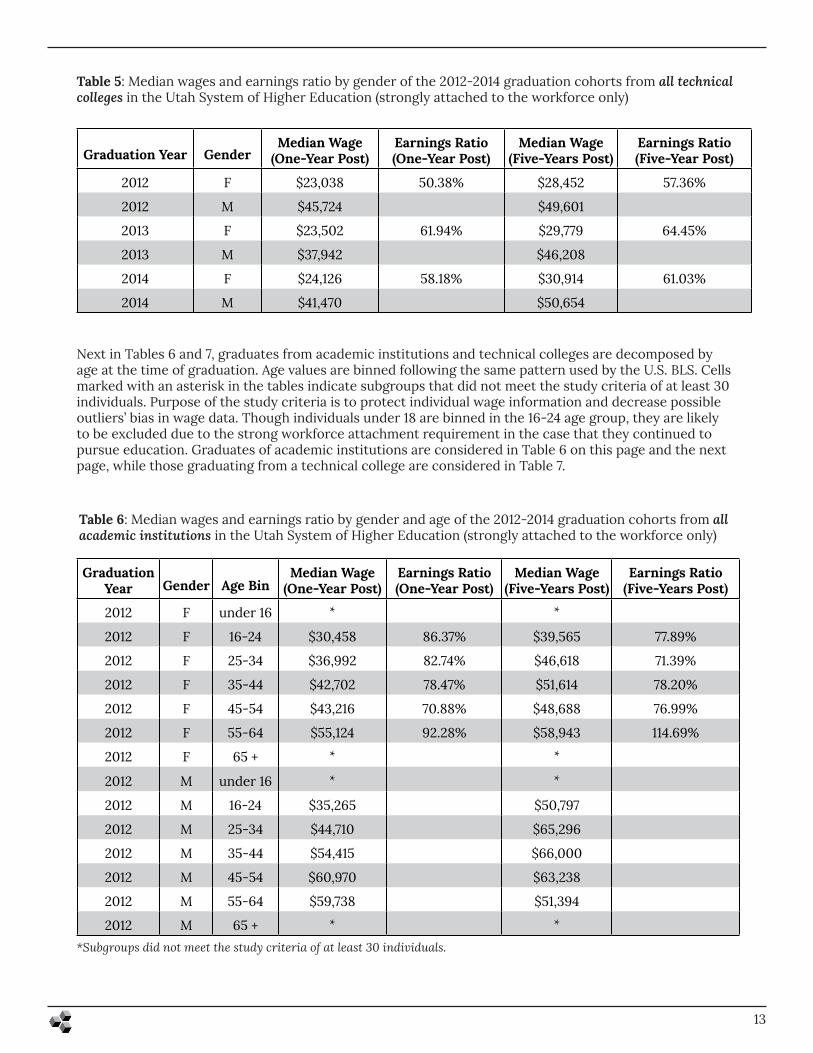
Table 5: Median wages and earnings ratio by gender of the 2012-2014 graduation cohorts from all technical colleges in the Utah System of Higher Education (strongly attached to the workforce only)
Table 6: Median wages and earnings ratio by gender and age of the 2012-2014 graduation cohorts from all academic institutions in the Utah System of Higher Education (strongly attached to the workforce only)
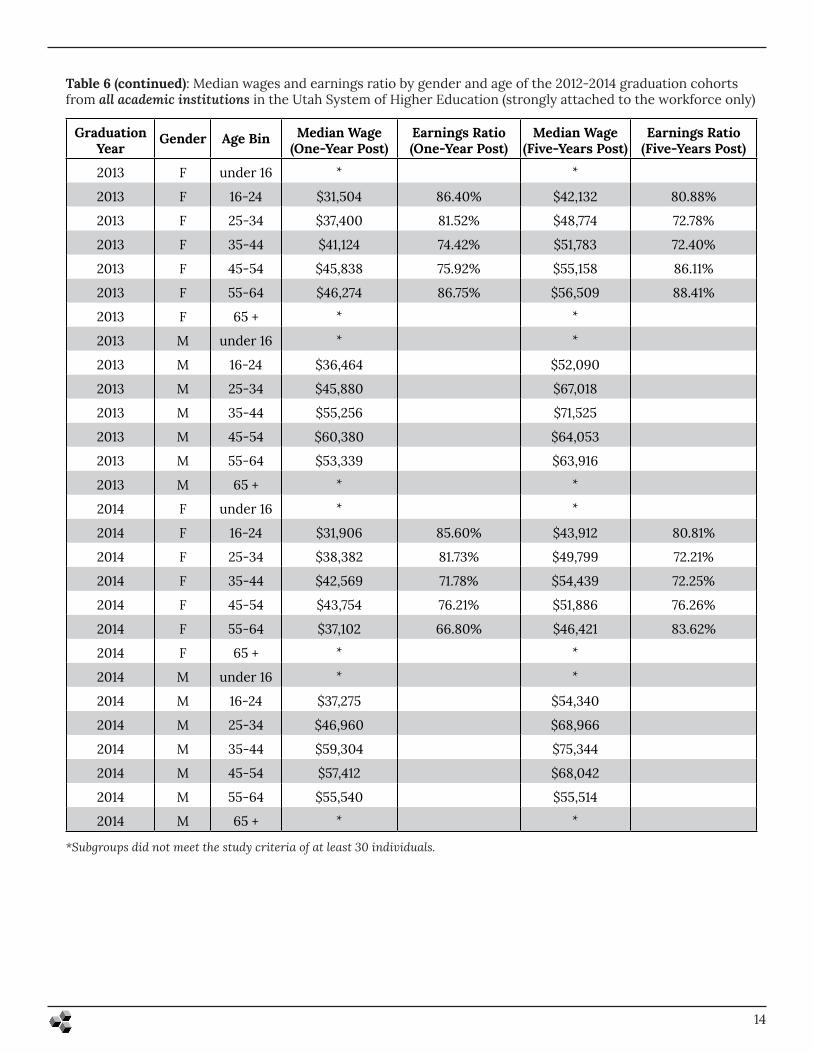
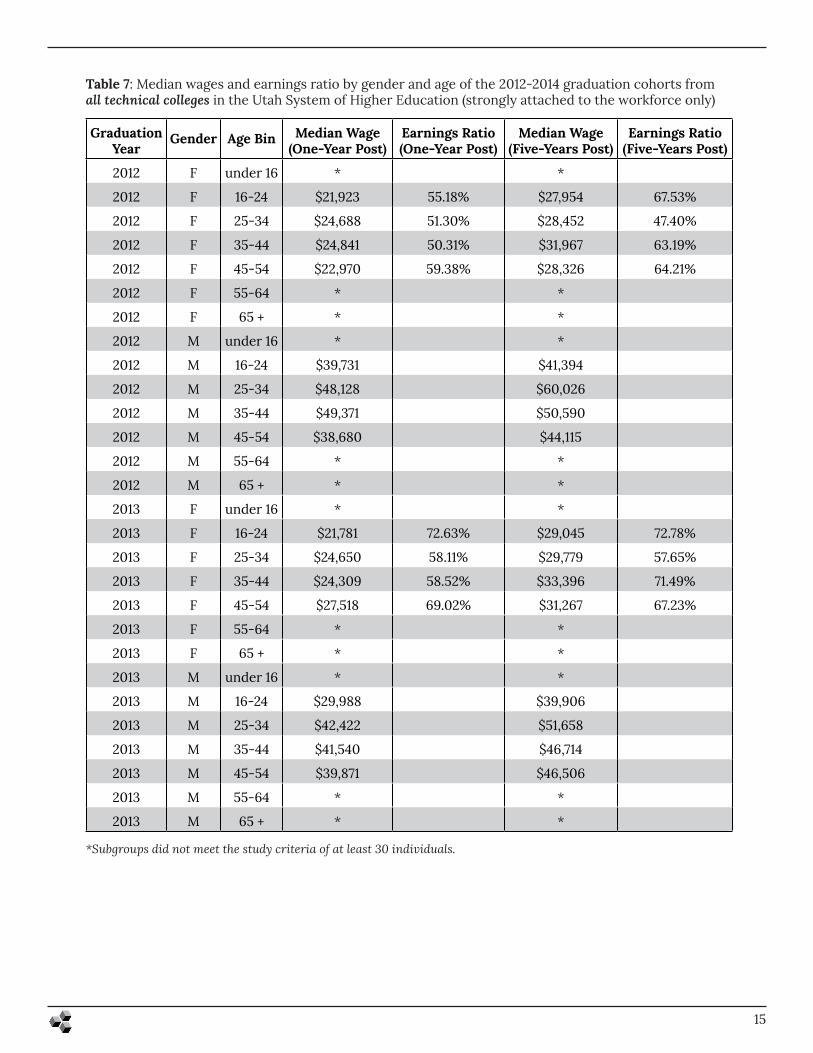
Next in Tables 6 and 7, graduates from academic institutions and technical colleges are decomposed by age at the time of graduation. Age values are binned following the same pattern used by the U.S. BLS. Cells marked with an asterisk in the tables indicate subgroups that did not meet the study criteria of at least 30 individuals. Purpose of the study criteria is to protect individual wage information and decrease possible outliers’ bias in wage data. Though individuals under 18 are binned in the 16-24 age group, they are likely to be excluded due to the strong workforce attachment requirement in the case that they continued to pursue education. Graduates of academic institutions are considered in Table 6 on this page and the next page, while those graduating from a technical college are considered in Table 7.
Graduation Year GenderMedian Wage
(One-Year Post)Earnings Ratio (One-Year Post)
Median Wage (Five-Years Post)
Earnings Ratio (Five-Year Post)
2012 F $23,038 50.38% $28,452 57.36%
2012 M $45,724 $49,601
2013 F $23,502 61.94% $29,779 64.45%
2013 M $37,942 $46,208
2014 F $24,126 58.18% $30,914 61.03%
2014 M $41,470 $50,654
Graduation Year Gender Age Bin
Median Wage (One-Year Post)
Earnings Ratio (One-Year Post)
Median Wage (Five-Years Post)
Earnings Ratio (Five-Years Post)
2012 F under 16 * *2012 F 16-24 $30,458 86.37% $39,565 77.89%
2012 F 25-34 $36,992 82.74% $46,618 71.39%
2012 F 35-44 $42,702 78.47% $51,614 78.20%
2012 F 45-54 $43,216 70.88% $48,688 76.99%
2012 F 55-64 $55,124 92.28% $58,943 114.69%
2012 F 65 + * *2012 M under 16 * *2012 M 16-24 $35,265 $50,797
2012 M 25-34 $44,710 $65,296
2012 M 35-44 $54,415 $66,000
2012 M 45-54 $60,970 $63,238
2012 M 55-64 $59,738 $51,394
2012 M 65 + * **Subgroups did not meet the study criteria of at least 30 individuals.
14
Graduation Year
Gender Age Bin Median Wage (One-Year Post)
Earnings Ratio (One-Year Post)
Median Wage (Five-Years Post)
Earnings Ratio (Five-Years Post)
2013 F under 16 * *2013 F 16-24 $31,504 86.40% $42,132 80.88%
2013 F 25-34 $37,400 81.52% $48,774 72.78%
2013 F 35-44 $41,124 74.42% $51,783 72.40%
2013 F 45-54 $45,838 75.92% $55,158 86.11%
2013 F 55-64 $46,274 86.75% $56,509 88.41%
2013 F 65 + * *2013 M under 16 * *2013 M 16-24 $36,464 $52,090
2013 M 25-34 $45,880 $67,018
2013 M 35-44 $55,256 $71,525
2013 M 45-54 $60,380 $64,053
2013 M 55-64 $53,339 $63,916
2013 M 65 + * *2014 F under 16 * *2014 F 16-24 $31,906 85.60% $43,912 80.81%
2014 F 25-34 $38,382 81.73% $49,799 72.21%
2014 F 35-44 $42,569 71.78% $54,439 72.25%
2014 F 45-54 $43,754 76.21% $51,886 76.26%
2014 F 55-64 $37,102 66.80% $46,421 83.62%
2014 F 65 + * *2014 M under 16 * *2014 M 16-24 $37,275 $54,340
2014 M 25-34 $46,960 $68,966
2014 M 35-44 $59,304 $75,344
2014 M 45-54 $57,412 $68,042
2014 M 55-64 $55,540 $55,514
2014 M 65 + * *
Table 6 (continued): Median wages and earnings ratio by gender and age of the 2012-2014 graduation cohorts from all academic institutions in the Utah System of Higher Education (strongly attached to the workforce only)
*Subgroups did not meet the study criteria of at least 30 individuals.
15
Table 7: Median wages and earnings ratio by gender and age of the 2012-2014 graduation cohorts from all technical colleges in the Utah System of Higher Education (strongly attached to the workforce only)
Graduation Year
Gender Age Bin Median Wage (One-Year Post)
Earnings Ratio (One-Year Post)
Median Wage (Five-Years Post)
Earnings Ratio (Five-Years Post)
2012 F under 16 * *
2012 F 16-24 $21,923 55.18% $27,954 67.53%
2012 F 25-34 $24,688 51.30% $28,452 47.40%
2012 F 35-44 $24,841 50.31% $31,967 63.19%
2012 F 45-54 $22,970 59.38% $28,326 64.21%
2012 F 55-64 * *
2012 F 65 + * *
2012 M under 16 * *
2012 M 16-24 $39,731 $41,394
2012 M 25-34 $48,128 $60,026
2012 M 35-44 $49,371 $50,590
2012 M 45-54 $38,680 $44,115
2012 M 55-64 * *
2012 M 65 + * *
2013 F under 16 * *
2013 F 16-24 $21,781 72.63% $29,045 72.78%
2013 F 25-34 $24,650 58.11% $29,779 57.65%
2013 F 35-44 $24,309 58.52% $33,396 71.49%
2013 F 45-54 $27,518 69.02% $31,267 67.23%
2013 F 55-64 * *
2013 F 65 + * *
2013 M under 16 * *
2013 M 16-24 $29,988 $39,906
2013 M 25-34 $42,422 $51,658
2013 M 35-44 $41,540 $46,714
2013 M 45-54 $39,871 $46,506
2013 M 55-64 * *
2013 M 65 + * *
*Subgroups did not meet the study criteria of at least 30 individuals.
16
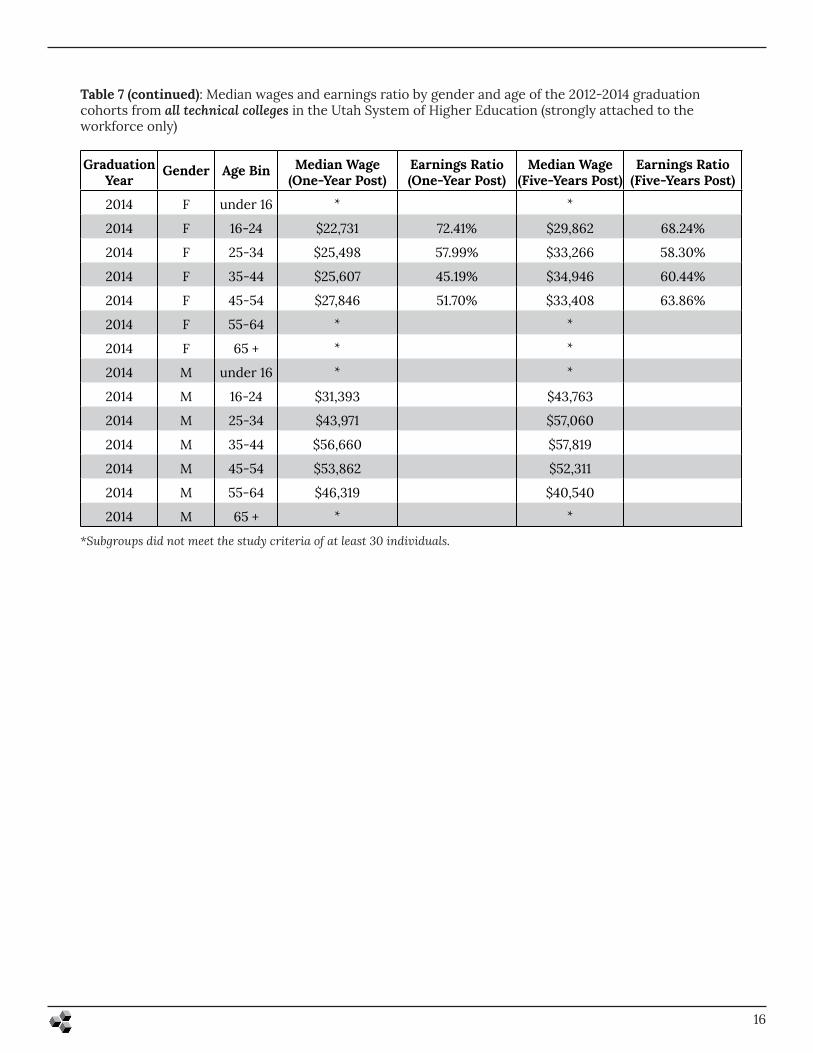
Table 7 (continued): Median wages and earnings ratio by gender and age of the 2012-2014 graduation cohorts from all technical colleges in the Utah System of Higher Education (strongly attached to the workforce only)
Graduation Year
Gender Age Bin Median Wage (One-Year Post)
Earnings Ratio (One-Year Post)
Median Wage (Five-Years Post)
Earnings Ratio (Five-Years Post)
2014 F under 16 * *2014 F 16-24 $22,731 72.41% $29,862 68.24%
2014 F 25-34 $25,498 57.99% $33,266 58.30%
2014 F 35-44 $25,607 45.19% $34,946 60.44%
2014 F 45-54 $27,846 51.70% $33,408 63.86%
2014 F 55-64 * *2014 F 65 + * *2014 M under 16 * *2014 M 16-24 $31,393 $43,763
2014 M 25-34 $43,971 $57,060
2014 M 35-44 $56,660 $57,819
2014 M 45-54 $53,862 $52,311
2014 M 55-64 $46,319 $40,540
2014 M 65 + * **Subgroups did not meet the study criteria of at least 30 individuals.
17
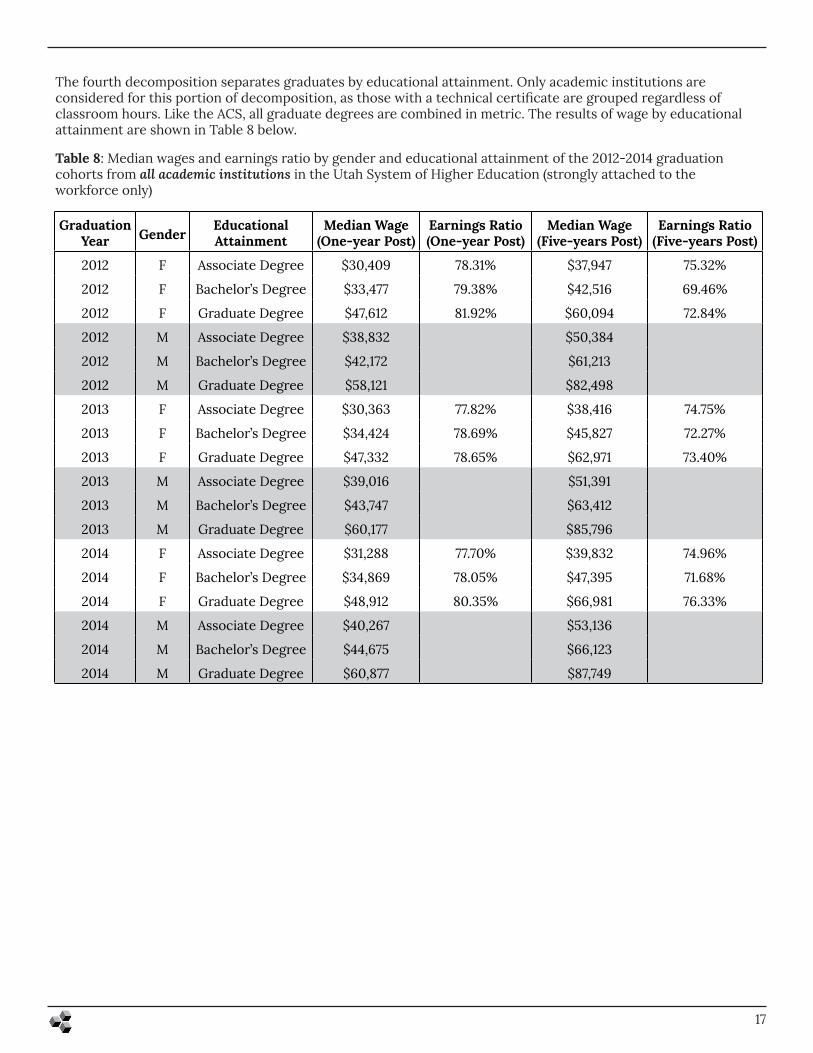
Table 8: Median wages and earnings ratio by gender and educational attainment of the 2012-2014 graduation cohorts from all academic institutions in the Utah System of Higher Education (strongly attached to the workforce only)
Graduation Year Gender Educational
AttainmentMedian Wage
(One-year Post)Earnings Ratio (One-year Post)
Median Wage (Five-years Post)
Earnings Ratio (Five-years Post)
2012 F Associate Degree $30,409 78.31% $37,947 75.32%
2012 F Bachelor’s Degree $33,477 79.38% $42,516 69.46%
2012 F Graduate Degree $47,612 81.92% $60,094 72.84%
2012 M Associate Degree $38,832 $50,384
2012 M Bachelor’s Degree $42,172 $61,213
2012 M Graduate Degree $58,121 $82,498
2013 F Associate Degree $30,363 77.82% $38,416 74.75%
2013 F Bachelor’s Degree $34,424 78.69% $45,827 72.27%
2013 F Graduate Degree $47,332 78.65% $62,971 73.40%
2013 M Associate Degree $39,016 $51,391
2013 M Bachelor’s Degree $43,747 $63,412
2013 M Graduate Degree $60,177 $85,796
2014 F Associate Degree $31,288 77.70% $39,832 74.96%
2014 F Bachelor’s Degree $34,869 78.05% $47,395 71.68%
2014 F Graduate Degree $48,912 80.35% $66,981 76.33%
2014 M Associate Degree $40,267 $53,136
2014 M Bachelor’s Degree $44,675 $66,123
2014 M Graduate Degree $60,877 $87,749
The fourth decomposition separates graduates by educational attainment. Only academic institutions are considered for this portion of decomposition, as those with a technical certificate are grouped regardless of classroom hours. Like the ACS, all graduate degrees are combined in metric. The results of wage by educational attainment are shown in Table 8 below.
18
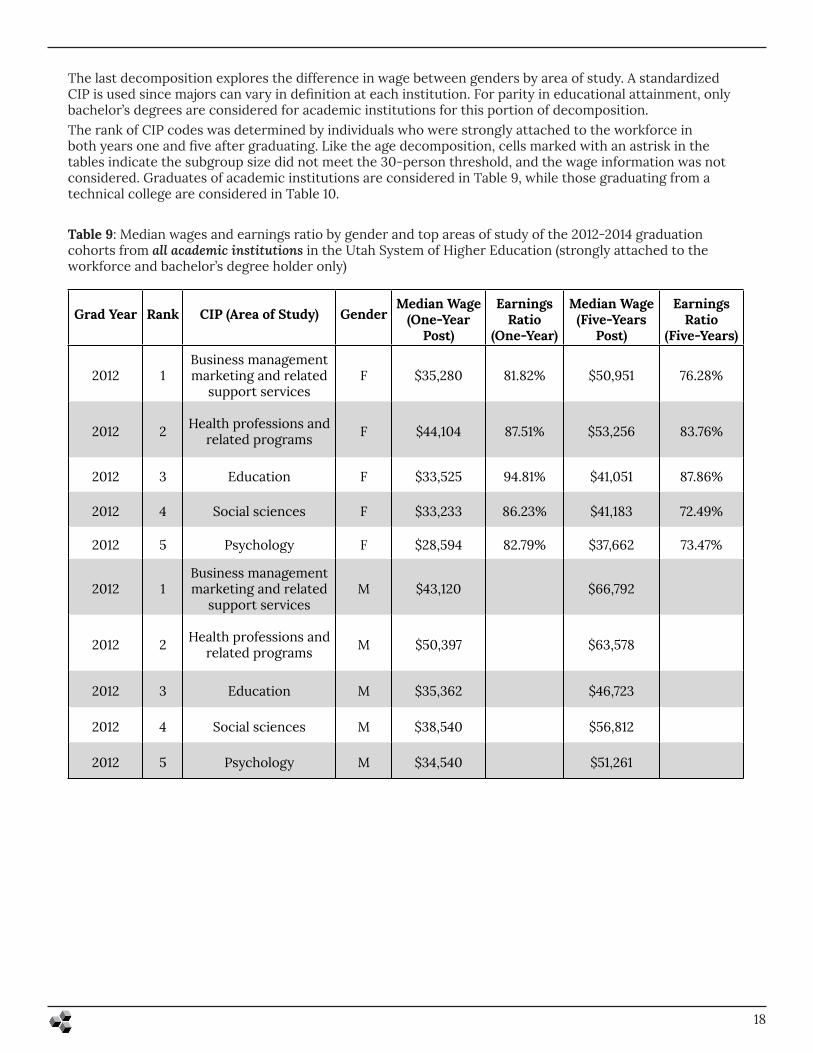
Table 9: Median wages and earnings ratio by gender and top areas of study of the 2012-2014 graduation cohorts from all academic institutions in the Utah System of Higher Education (strongly attached to the workforce and bachelor’s degree holder only)
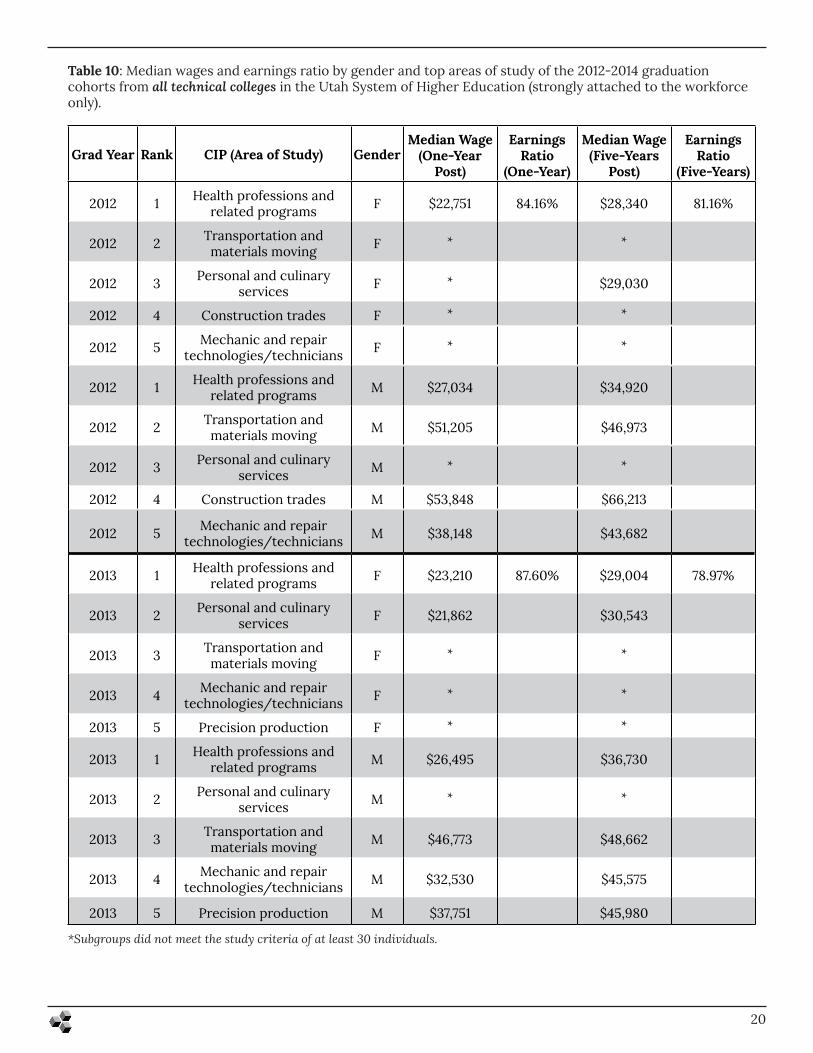
The last decomposition explores the difference in wage between genders by area of study. A standardized CIP is used since majors can vary in definition at each institution. For parity in educational attainment, only bachelor’s degrees are considered for academic institutions for this portion of decomposition. The rank of CIP codes was determined by individuals who were strongly attached to the workforce in both years one and five after graduating. Like the age decomposition, cells marked with an astrisk in the tables indicate the subgroup size did not meet the 30-person threshold, and the wage information was not considered. Graduates of academic institutions are considered in Table 9, while those graduating from a technical college are considered in Table 10.
Grad Year Rank CIP (Area of Study) GenderMedian Wage
(One-Year Post)
Earnings Ratio
(One-Year)
Median Wage (Five-Years
Post)
Earnings Ratio
(Five-Years)
2012 1Business management marketing and related
support servicesF $35,280 81.82% $50,951 76.28%
2012 2 Health professions and related programs F $44,104 87.51% $53,256 83.76%
2012 3 Education F $33,525 94.81% $41,051 87.86%
2012 4 Social sciences F $33,233 86.23% $41,183 72.49%
2012 5 Psychology F $28,594 82.79% $37,662 73.47%
2012 1Business management marketing and related
support servicesM $43,120 $66,792
2012 2 Health professions and related programs M $50,397 $63,578
2012 3 Education M $35,362 $46,723
2012 4 Social sciences M $38,540 $56,812
2012 5 Psychology M $34,540 $51,261
19
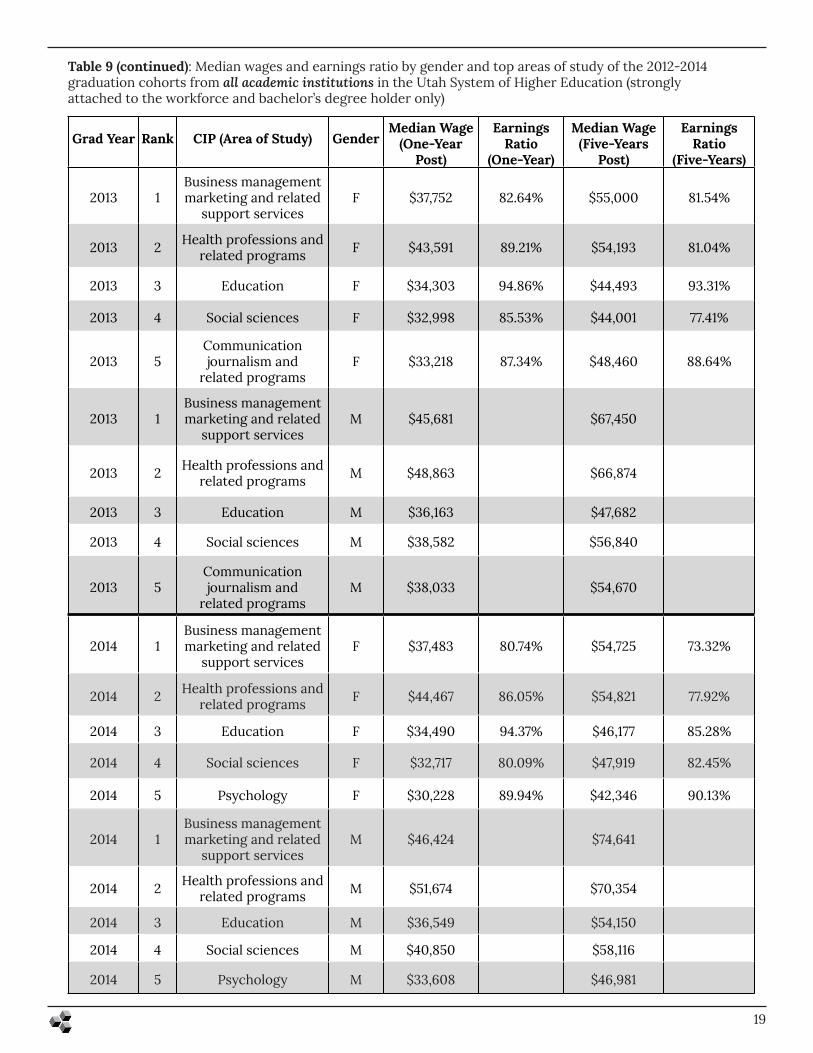
Table 9 (continued): Median wages and earnings ratio by gender and top areas of study of the 2012-2014 graduation cohorts from all academic institutions in the Utah System of Higher Education (strongly attached to the workforce and bachelor’s degree holder only)
Grad Year Rank CIP (Area of Study) GenderMedian Wage
(One-Year Post)
Earnings Ratio
(One-Year)
Median Wage (Five-Years
Post)
Earnings Ratio
(Five-Years)
2013 1Business management marketing and related
support servicesF $37,752 82.64% $55,000 81.54%
2013 2 Health professions and related programs F $43,591 89.21% $54,193 81.04%
2013 3 Education F $34,303 94.86% $44,493 93.31%
2013 4 Social sciences F $32,998 85.53% $44,001 77.41%
2013 5Communication journalism and
related programsF $33,218 87.34% $48,460 88.64%
2013 1Business management marketing and related
support servicesM $45,681 $67,450
2013 2 Health professions and related programs M $48,863 $66,874
2013 3 Education M $36,163 $47,682
2013 4 Social sciences M $38,582 $56,840
2013 5Communication journalism and
related programsM $38,033 $54,670
2014 1Business management marketing and related
support servicesF $37,483 80.74% $54,725 73.32%
2014 2 Health professions and related programs F $44,467 86.05% $54,821 77.92%
2014 3 Education F $34,490 94.37% $46,177 85.28%
2014 4 Social sciences F $32,717 80.09% $47,919 82.45%
2014 5 Psychology F $30,228 89.94% $42,346 90.13%
2014 1Business management marketing and related
support servicesM $46,424 $74,641
2014 2 Health professions and related programs M $51,674 $70,354
2014 3 Education M $36,549 $54,150
2014 4 Social sciences M $40,850 $58,116
2014 5 Psychology M $33,608 $46,981
20
Table 10: Median wages and earnings ratio by gender and top areas of study of the 2012-2014 graduation cohorts from all technical colleges in the Utah System of Higher Education (strongly attached to the workforce only).
Grad Year Rank CIP (Area of Study) GenderMedian Wage
(One-Year Post)
Earnings Ratio
(One-Year)
Median Wage (Five-Years
Post)
Earnings Ratio
(Five-Years)
2012 1 Health professions and related programs F $22,751 84.16% $28,340 81.16%
2012 2 Transportation and materials moving F * *
2012 3 Personal and culinary services F * $29,030
2012 4 Construction trades F * *
2012 5 Mechanic and repair technologies/technicians F * *
2012 1 Health professions and related programs M $27,034 $34,920
2012 2 Transportation and materials moving M $51,205 $46,973
2012 3 Personal and culinary services M * *
2012 4 Construction trades M $53,848 $66,213
2012 5 Mechanic and repair technologies/technicians M $38,148 $43,682
2013 1 Health professions and related programs F $23,210 87.60% $29,004 78.97%
2013 2 Personal and culinary services F $21,862 $30,543
2013 3 Transportation and materials moving F * *
2013 4 Mechanic and repair technologies/technicians F * *
2013 5 Precision production F * *
2013 1 Health professions and related programs M $26,495 $36,730
2013 2 Personal and culinary services M * *
2013 3 Transportation and materials moving M $46,773 $48,662
2013 4 Mechanic and repair technologies/technicians M $32,530 $45,575
2013 5 Precision production M $37,751 $45,980
*Subgroups did not meet the study criteria of at least 30 individuals.
21
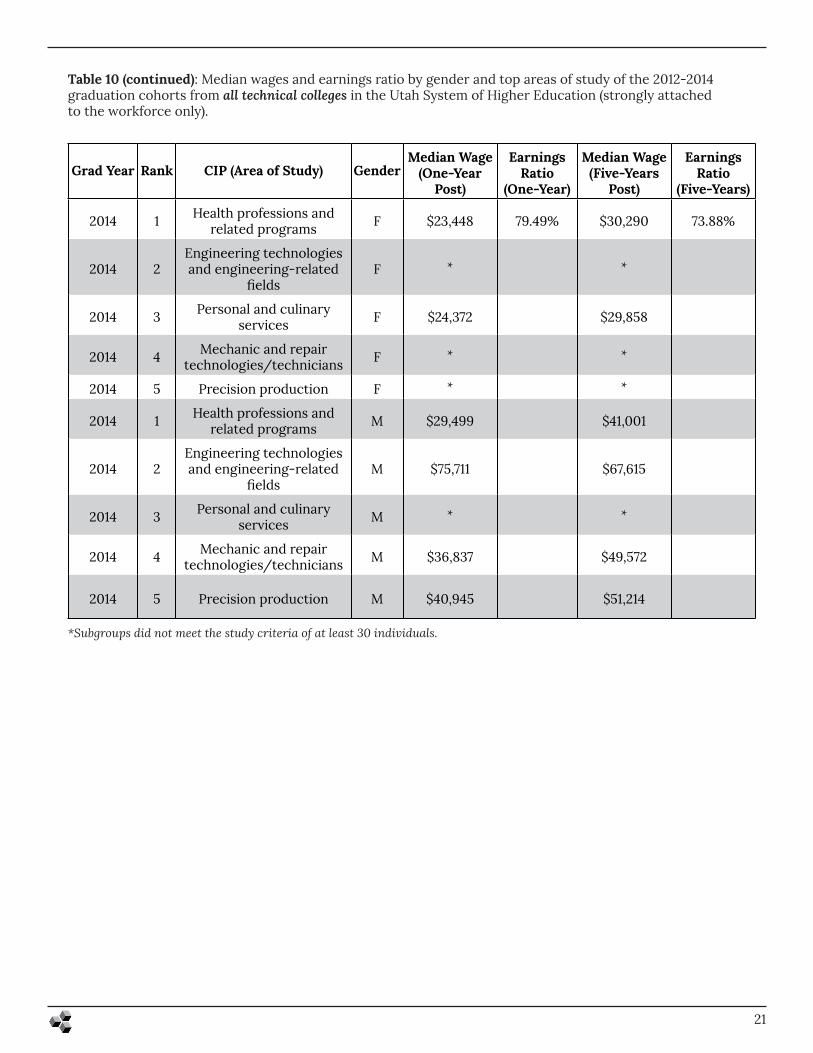
Table 10 (continued): Median wages and earnings ratio by gender and top areas of study of the 2012-2014 graduation cohorts from all technical colleges in the Utah System of Higher Education (strongly attached to the workforce only).
Grad Year Rank CIP (Area of Study) GenderMedian Wage
(One-Year Post)
Earnings Ratio
(One-Year)
Median Wage (Five-Years
Post)
Earnings Ratio
(Five-Years)
2014 1 Health professions and related programs F $23,448 79.49% $30,290 73.88%
2014 2Engineering technologies and engineering-related
fieldsF * *
2014 3 Personal and culinary services F $24,372 $29,858
2014 4 Mechanic and repair technologies/technicians F * *
2014 5 Precision production F * *
2014 1 Health professions and related programs M $29,499 $41,001
2014 2Engineering technologies and engineering-related
fieldsM $75,711 $67,615
2014 3 Personal and culinary services M * *
2014 4 Mechanic and repair technologies/technicians M $36,837 $49,572
2014 5 Precision production M $40,945 $51,214
*Subgroups did not meet the study criteria of at least 30 individuals.
22
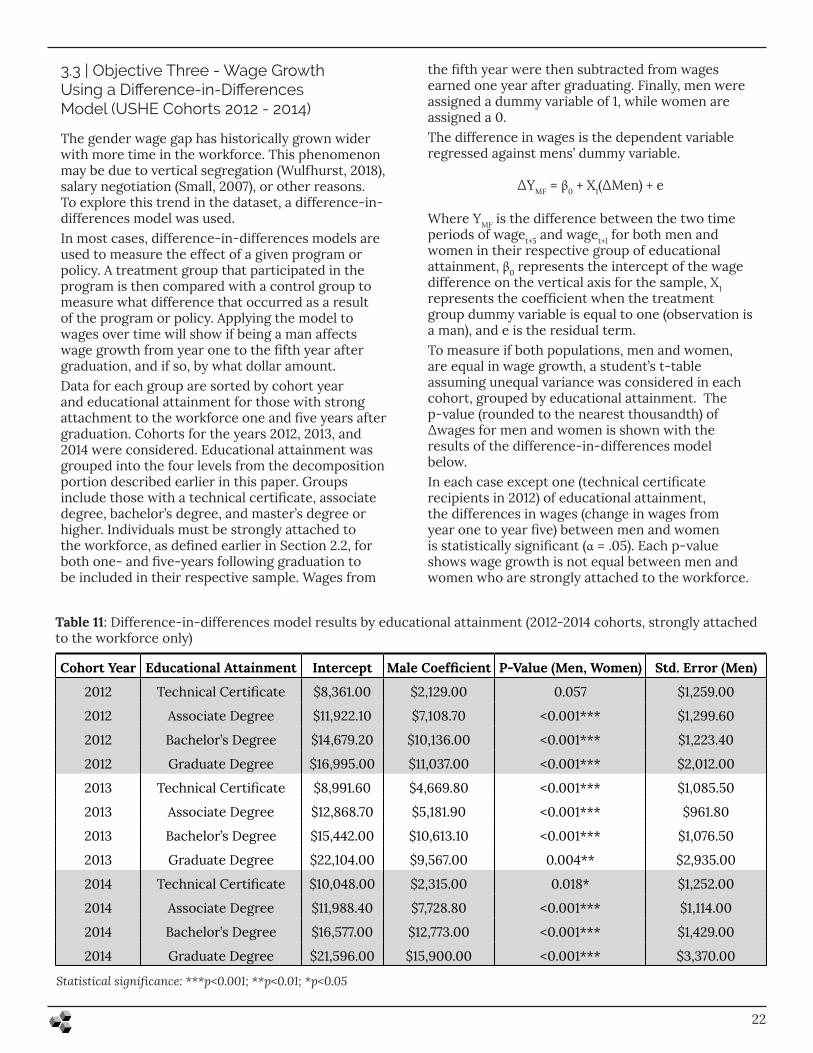
The gender wage gap has historically grown wider with more time in the workforce. This phenomenon may be due to vertical segregation (Wulfhurst, 2018), salary negotiation (Small, 2007), or other reasons. To explore this trend in the dataset, a difference-in-differences model was used.In most cases, difference-in-differences models are used to measure the effect of a given program or policy. A treatment group that participated in the program is then compared with a control group to measure what difference that occurred as a result of the program or policy. Applying the model to wages over time will show if being a man affects wage growth from year one to the fifth year after graduation, and if so, by what dollar amount. Data for each group are sorted by cohort year and educational attainment for those with strong attachment to the workforce one and five years after graduation. Cohorts for the years 2012, 2013, and 2014 were considered. Educational attainment was grouped into the four levels from the decomposition portion described earlier in this paper. Groups include those with a technical certificate, associate degree, bachelor’s degree, and master’s degree or higher. Individuals must be strongly attached to the workforce, as defined earlier in Section 2.2, for both one- and five-years following graduation to be included in their respective sample. Wages from
the fifth year were then subtracted from wages earned one year after graduating. Finally, men were assigned a dummy variable of 1, while women are assigned a 0.The difference in wages is the dependent variable regressed against mens’ dummy variable.
ΔYMF = β0 + X1(ΔMen) + e
Where YMF is the difference between the two time periods of waget+5 and waget+1 for both men and women in their respective group of educational attainment, β0 represents the intercept of the wage difference on the vertical axis for the sample, X1 represents the coefficient when the treatment group dummy variable is equal to one (observation is a man), and e is the residual term. To measure if both populations, men and women, are equal in wage growth, a student’s t-table assuming unequal variance was considered in each cohort, grouped by educational attainment. The p-value (rounded to the nearest thousandth) of Δwages for men and women is shown with the results of the difference-in-differences model below.In each case except one (technical certificate recipients in 2012) of educational attainment, the differences in wages (change in wages from year one to year five) between men and women is statistically significant (α = .05). Each p-value shows wage growth is not equal between men and women who are strongly attached to the workforce.
3.3 | Objective Three - Wage Growth Using a Difference-in-Differences Model (USHE Cohorts 2012 - 2014)
Table 11: Difference-in-differences model results by educational attainment (2012-2014 cohorts, strongly attached to the workforce only)
Cohort Year Educational Attainment Intercept Male Coefficient P-Value (Men, Women) Std. Error (Men)
2012 Technical Certificate $8,361.00 $2,129.00 0.057 $1,259.00
2012 Associate Degree $11,922.10 $7,108.70 <0.001*** $1,299.60
2012 Bachelor’s Degree $14,679.20 $10,136.00 <0.001*** $1,223.40
2012 Graduate Degree $16,995.00 $11,037.00 <0.001*** $2,012.00
2013 Technical Certificate $8,991.60 $4,669.80 <0.001*** $1,085.50
2013 Associate Degree $12,868.70 $5,181.90 <0.001*** $961.80
2013 Bachelor’s Degree $15,442.00 $10,613.10 <0.001*** $1,076.50
2013 Graduate Degree $22,104.00 $9,567.00 0.004** $2,935.00
2014 Technical Certificate $10,048.00 $2,315.00 0.018* $1,252.00
2014 Associate Degree $11,988.40 $7,728.80 <0.001*** $1,114.00
2014 Bachelor’s Degree $16,577.00 $12,773.00 <0.001*** $1,429.00
2014 Graduate Degree $21,596.00 $15,900.00 <0.001*** $3,370.00
Statistical significance: ***p<0.001; **p<0.01; *p<0.05
23
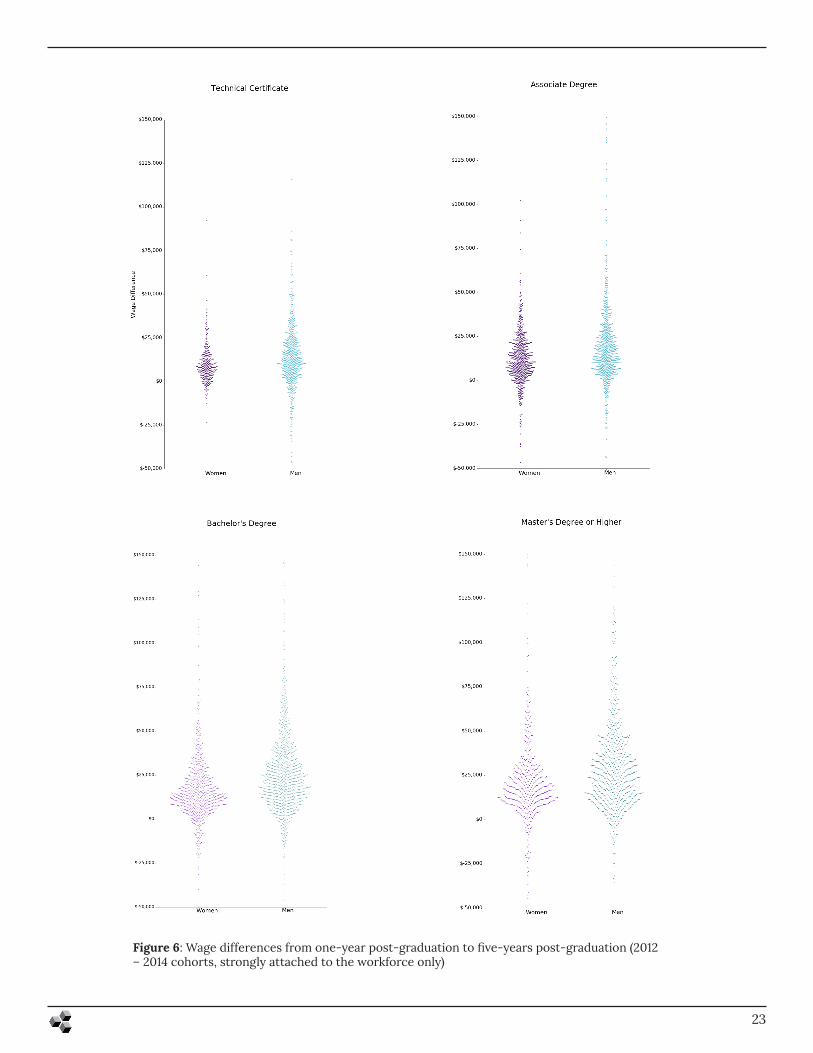
Figure 6: Wage differences from one-year post-graduation to five-years post-graduation (2012 – 2014 cohorts, strongly attached to the workforce only)
24
The coefficient of being a man in each case is also positive from one year after graduating to five years. To visualize these changes, results from the most recent cohort year (2014) were plotted in a swarm plot. A swarm plot is useful as it shows the relative size, distribution, and outliers for each level of educational attainment. To accommodate for the large number of graduates with a bachelor’s degree, the point size was reduced by 43.3%. The scale for this visualization is limited to -$50,000 to $150,000. The y-axis represents the change in wage from one year after graduation to five years after graduation. The x-axis separates women in purple and men in teal and can be seen in Figure 6 on the previous page.
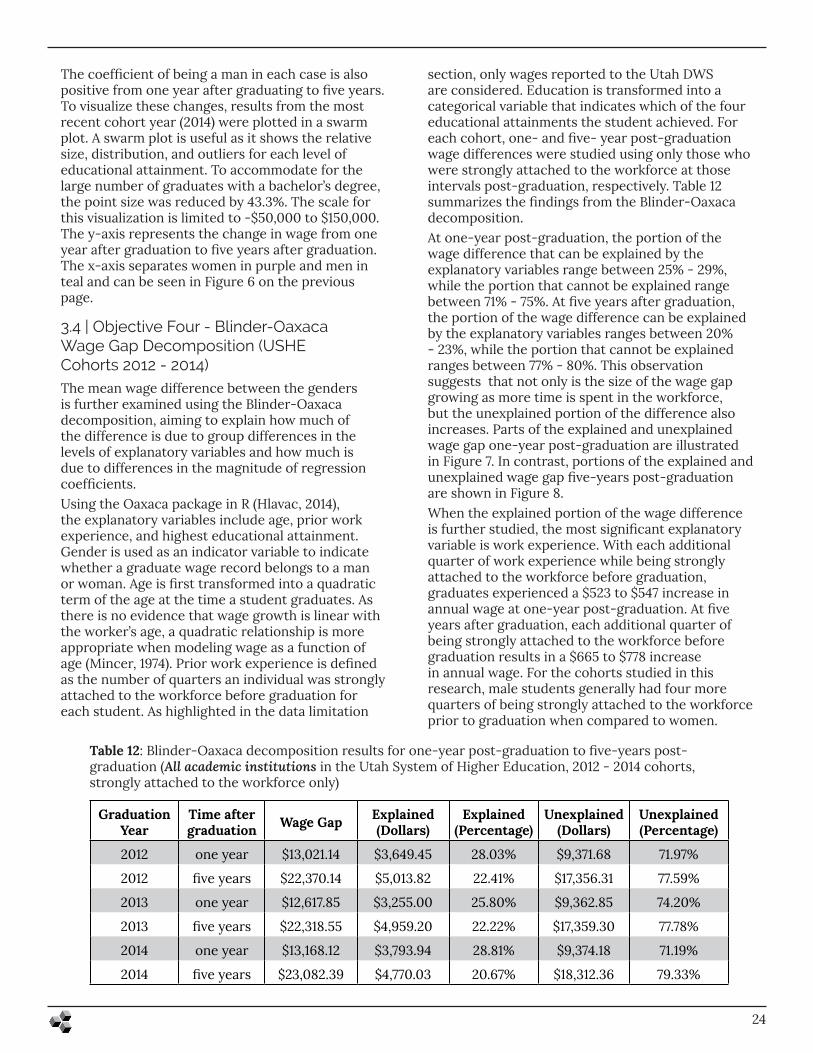
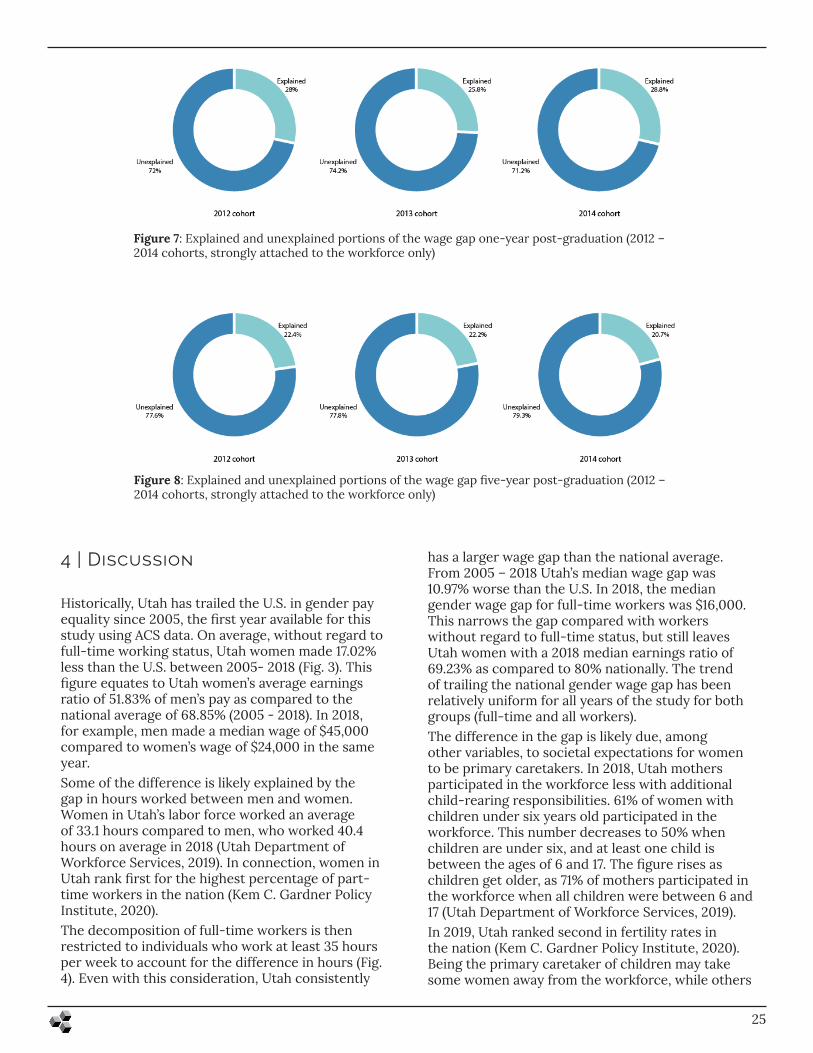
section, only wages reported to the Utah DWS are considered. Education is transformed into a categorical variable that indicates which of the four educational attainments the student achieved. For each cohort, one- and five- year post-graduation wage differences were studied using only those who were strongly attached to the workforce at those intervals post-graduation, respectively. Table 12 summarizes the findings from the Blinder-Oaxaca decomposition.At one-year post-graduation, the portion of the wage difference that can be explained by the explanatory variables range between 25% - 29%, while the portion that cannot be explained range between 71% - 75%. At five years after graduation, the portion of the wage difference can be explained by the explanatory variables ranges between 20% - 23%, while the portion that cannot be explained ranges between 77% - 80%. This observation suggests that not only is the size of the wage gap growing as more time is spent in the workforce, but the unexplained portion of the difference also increases. Parts of the explained and unexplained wage gap one-year post-graduation are illustrated in Figure 7. In contrast, portions of the explained and unexplained wage gap five-years post-graduation are shown in Figure 8.When the explained portion of the wage difference is further studied, the most significant explanatory variable is work experience. With each additional quarter of work experience while being strongly attached to the workforce before graduation, graduates experienced a $523 to $547 increase in annual wage at one-year post-graduation. At five years after graduation, each additional quarter of being strongly attached to the workforce before graduation results in a $665 to $778 increase in annual wage. For the cohorts studied in this research, male students generally had four more quarters of being strongly attached to the workforce prior to graduation when compared to women.
3.4 | Objective Four - Blinder-Oaxaca Wage Gap Decomposition (USHE Cohorts 2012 - 2014)The mean wage difference between the genders is further examined using the Blinder-Oaxaca decomposition, aiming to explain how much of the difference is due to group differences in the levels of explanatory variables and how much is due to differences in the magnitude of regression coefficients. Using the Oaxaca package in R (Hlavac, 2014), the explanatory variables include age, prior work experience, and highest educational attainment. Gender is used as an indicator variable to indicate whether a graduate wage record belongs to a man or woman. Age is first transformed into a quadratic term of the age at the time a student graduates. As there is no evidence that wage growth is linear with the worker’s age, a quadratic relationship is more appropriate when modeling wage as a function of age (Mincer, 1974). Prior work experience is defined as the number of quarters an individual was strongly attached to the workforce before graduation for each student. As highlighted in the data limitation
Graduation Year
Time after graduation Wage Gap Explained
(Dollars)Explained
(Percentage)Unexplained
(Dollars)Unexplained (Percentage)
2012 one year $13,021.14 $3,649.45 28.03% $9,371.68 71.97%
2012 five years $22,370.14 $5,013.82 22.41% $17,356.31 77.59%
2013 one year $12,617.85 $3,255.00 25.80% $9,362.85 74.20%
2013 five years $22,318.55 $4,959.20 22.22% $17,359.30 77.78%
2014 one year $13,168.12 $3,793.94 28.81% $9,374.18 71.19%
2014 five years $23,082.39 $4,770.03 20.67% $18,312.36 79.33%
Table 12: Blinder-Oaxaca decomposition results for one-year post-graduation to five-years post-graduation (All academic institutions in the Utah System of Higher Education, 2012 - 2014 cohorts, strongly attached to the workforce only)
25
has a larger wage gap than the national average. From 2005 – 2018 Utah’s median wage gap was 10.97% worse than the U.S. In 2018, the median gender wage gap for full-time workers was $16,000. This narrows the gap compared with workers without regard to full-time status, but still leaves Utah women with a 2018 median earnings ratio of 69.23% as compared to 80% nationally. The trend of trailing the national gender wage gap has been relatively uniform for all years of the study for both groups (full-time and all workers).The difference in the gap is likely due, among other variables, to societal expectations for women to be primary caretakers. In 2018, Utah mothers participated in the workforce less with additional child-rearing responsibilities. 61% of women with children under six years old participated in the workforce. This number decreases to 50% when children are under six, and at least one child is between the ages of 6 and 17. The figure rises as children get older, as 71% of mothers participated in the workforce when all children were between 6 and 17 (Utah Department of Workforce Services, 2019). In 2019, Utah ranked second in fertility rates in the nation (Kem C. Gardner Policy Institute, 2020). Being the primary caretaker of children may take some women away from the workforce, while others
4 | Discussion
Historically, Utah has trailed the U.S. in gender pay equality since 2005, the first year available for this study using ACS data. On average, without regard to full-time working status, Utah women made 17.02% less than the U.S. between 2005- 2018 (Fig. 3). This figure equates to Utah women’s average earnings ratio of 51.83% of men’s pay as compared to the national average of 68.85% (2005 - 2018). In 2018, for example, men made a median wage of $45,000 compared to women’s wage of $24,000 in the same year. Some of the difference is likely explained by the gap in hours worked between men and women. Women in Utah’s labor force worked an average of 33.1 hours compared to men, who worked 40.4 hours on average in 2018 (Utah Department of Workforce Services, 2019). In connection, women in Utah rank first for the highest percentage of part-time workers in the nation (Kem C. Gardner Policy Institute, 2020). The decomposition of full-time workers is then restricted to individuals who work at least 35 hours per week to account for the difference in hours (Fig. 4). Even with this consideration, Utah consistently
Figure 8: Explained and unexplained portions of the wage gap five-year post-graduation (2012 – 2014 cohorts, strongly attached to the workforce only)
Figure 7: Explained and unexplained portions of the wage gap one-year post-graduation (2012 – 2014 cohorts, strongly attached to the workforce only)
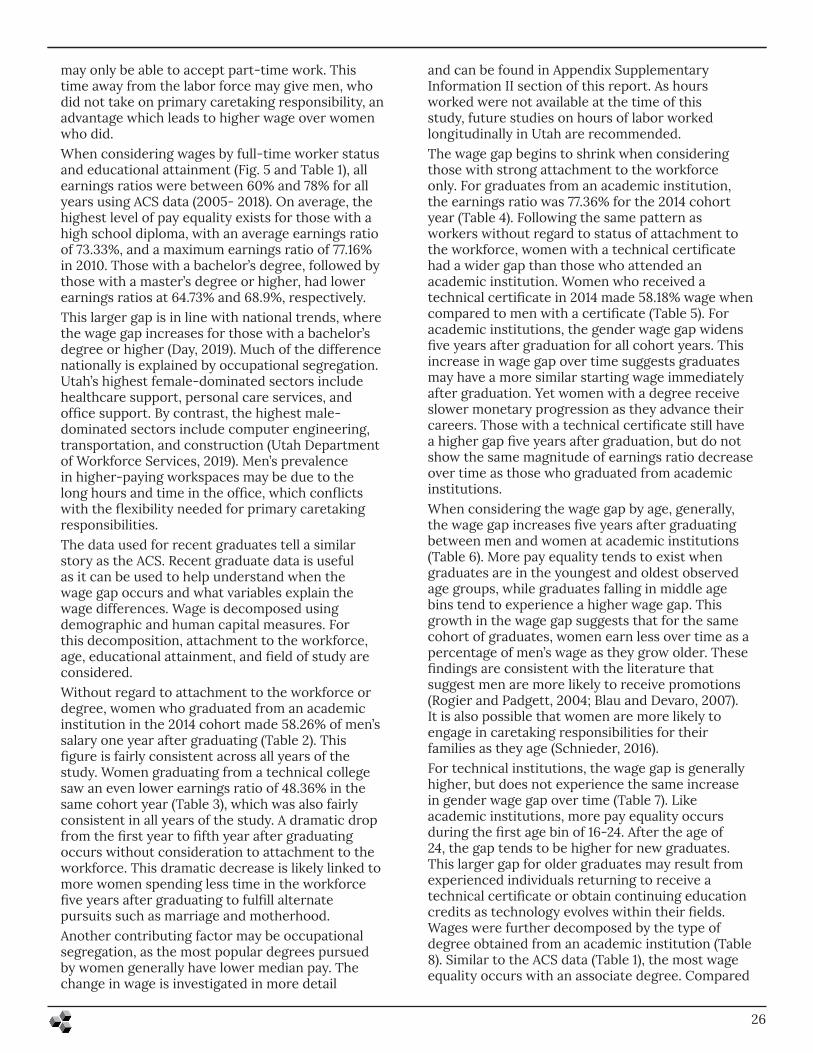
may only be able to accept part-time work. This time away from the labor force may give men, who did not take on primary caretaking responsibility, an advantage which leads to higher wage over women who did.When considering wages by full-time worker status and educational attainment (Fig. 5 and Table 1), all earnings ratios were between 60% and 78% for all years using ACS data (2005- 2018). On average, the highest level of pay equality exists for those with a high school diploma, with an average earnings ratio of 73.33%, and a maximum earnings ratio of 77.16% in 2010. Those with a bachelor’s degree, followed by those with a master’s degree or higher, had lower earnings ratios at 64.73% and 68.9%, respectively. This larger gap is in line with national trends, where the wage gap increases for those with a bachelor’s degree or higher (Day, 2019). Much of the difference nationally is explained by occupational segregation. Utah’s highest female-dominated sectors include healthcare support, personal care services, and office support. By contrast, the highest male-dominated sectors include computer engineering, transportation, and construction (Utah Department of Workforce Services, 2019). Men’s prevalence in higher-paying workspaces may be due to the long hours and time in the office, which conflicts with the flexibility needed for primary caretaking responsibilities.The data used for recent graduates tell a similar story as the ACS. Recent graduate data is useful as it can be used to help understand when the wage gap occurs and what variables explain the wage differences. Wage is decomposed using demographic and human capital measures. For this decomposition, attachment to the workforce, age, educational attainment, and field of study are considered.Without regard to attachment to the workforce or degree, women who graduated from an academic institution in the 2014 cohort made 58.26% of men’s salary one year after graduating (Table 2). This figure is fairly consistent across all years of the study. Women graduating from a technical college saw an even lower earnings ratio of 48.36% in the same cohort year (Table 3), which was also fairly consistent in all years of the study. A dramatic drop from the first year to fifth year after graduating occurs without consideration to attachment to the workforce. This dramatic decrease is likely linked to more women spending less time in the workforce five years after graduating to fulfill alternate pursuits such as marriage and motherhood. Another contributing factor may be occupational segregation, as the most popular degrees pursued by women generally have lower median pay. The change in wage is investigated in more detail
and can be found in Appendix Supplementary Information II section of this report. As hours worked were not available at the time of this study, future studies on hours of labor worked longitudinally in Utah are recommended.The wage gap begins to shrink when considering those with strong attachment to the workforce only. For graduates from an academic institution, the earnings ratio was 77.36% for the 2014 cohort year (Table 4). Following the same pattern as workers without regard to status of attachment to the workforce, women with a technical certificate had a wider gap than those who attended an academic institution. Women who received a technical certificate in 2014 made 58.18% wage when compared to men with a certificate (Table 5). For academic institutions, the gender wage gap widens five years after graduation for all cohort years. This increase in wage gap over time suggests graduates may have a more similar starting wage immediately after graduation. Yet women with a degree receive slower monetary progression as they advance their careers. Those with a technical certificate still have a higher gap five years after graduation, but do not show the same magnitude of earnings ratio decrease over time as those who graduated from academic institutions. When considering the wage gap by age, generally, the wage gap increases five years after graduating between men and women at academic institutions (Table 6). More pay equality tends to exist when graduates are in the youngest and oldest observed age groups, while graduates falling in middle age bins tend to experience a higher wage gap. This growth in the wage gap suggests that for the same cohort of graduates, women earn less over time as a percentage of men’s wage as they grow older. These findings are consistent with the literature that suggest men are more likely to receive promotions (Rogier and Padgett, 2004; Blau and Devaro, 2007). It is also possible that women are more likely to engage in caretaking responsibilities for their families as they age (Schnieder, 2016).For technical institutions, the wage gap is generally higher, but does not experience the same increase in gender wage gap over time (Table 7). Like academic institutions, more pay equality occurs during the first age bin of 16-24. After the age of 24, the gap tends to be higher for new graduates. This larger gap for older graduates may result from experienced individuals returning to receive a technical certificate or obtain continuing education credits as technology evolves within their fields. Wages were further decomposed by the type of degree obtained from an academic institution (Table 8). Similar to the ACS data (Table 1), the most wage equality occurs with an associate degree. Compared
26
with graduate and bachelor’s degrees, the gap is on average 1.56% less one year after graduation and 2.35% less after five years. The highest average wage gap observed was from bachelor’s degree recipients. Those with bachelor’s degrees and advanced degrees experience a larger wage gap than those with a high school diploma or associate degree. This trend is consistent with national studies conducted by the U.S. Census Bureau, which found “more education leads to higher earnings, but the gender wage gap is wider among men and women with a bachelor’s degree than among those without.” (Day, 2019).Finally, the gender wage gap was decomposed by the five most popular CIP families for academic institutions and technical colleges. Across all fields of study for academic institutions, the same general trend of a loss in income equality occurred over time (Table 9). The most equality occurs in education, where women made on average 94.68% of men’s wage after one year in the workforce, while after five years that figure dwindled to 88.82%. The field with the highest pay inequality was business management, where women made 81.73% of men’s wage one year after graduating and 77.05% after five years. Business management typically values long hours of work and does not offer as much temporal flexibility as other career paths. When examining the CIP families for technical education, many fields did not meet the study requirement of 30 observations for each CIP (Table 10). This trend shows occupational segregation within technical and career training. Men tended to be attracted to fields like mechanical work, transportation, and construction. Women were more likely to choose fields like healthcare and personal culinary services. However, enough data for the healthcare profession were observed and showed similar trends in academic education where less wage equality occurs five years after graduating. Additional study on occupational segregation in technical education is suggested. Using the data from decomposition, a difference-in-differences model was implemented to measure wage growth over time (Table 11). The model illustrates statistically significant unequal wage growth for men and women with strong attachment to the workforce for all three cohorts and all degree types. The largest average growth over all cohorts in dollar figures is attributed to men graduating with a graduate degree or higher. The coefficient for men is lowest for graduates completing a technical certificate and associate degree. Generally, as education went up, the coefficient for men also increased. This increase may illustrate more career advancement experienced by men over time. Alternatively, it is possible that women are more
likely than men to prioritize family or caretaking responsibilities five years after graduation. When the wage difference between one- and five- years post-graduation is illustrated using a swarm plot (Figure 6), a smoother shape for men is visible as the wage difference increases along the y-axis. This shape is especially apparent when looking at the wage difference bachelor’s and graduate degrees. When compared to women’s wage gain, the shape tends to bottleneck as wage change increases. This illustrative difference may suggest that women experience a “glass ceiling” with wage growth compared to men. The gender wage gap experienced by the graduates was also modeled using Blinder-Oaxaca decomposition (Table 12). This model split the gender wage gap into a difference in endowments and a difference in coefficients. Given the same endowments, or skills, the difference in coefficients or wage difference is unexplained. With age, prior experience, highest educational attainment being the same, wage differences between men and women are observed and unexplained by the model. Not only does the gap grow wider from one-year post-graduation to five-years post-graduation, the unexplained portion also grows as those with strong attachment to the workforce continue their professional life. Even at one-year post-graduation, the unexplained difference accounts for over 70% of the wage gap (Fig. 7 and 8). This may reflect the deeply embedded biases and societal expectations for men and women in the workforce. Human capital models, like those used in this work, are efficient tools to examine wage as a function of variables such as age, education, prior work experience, and industry. It is important to reiterate that not all explanatory variables, such as worker skills or characteristics, were included or considered in this study. Soft variables are much harder to measure than human capital variables. Furthermore, endogeneity of the explanatory variables must be examined. A graduate’s ability to obtain strong attachment to the workforce before graduation may be endogenous to the highest degree obtained rather than exogenous. It is also possible that societal bias serves as a cofounding variable that affects one’s selection of major, ability to maintain prior work experience, as well as highest educational attainment.Substantial research has documented that women tend to enter occupations that offer lower earnings; however, evidence was also found that as more women enter traditionally masculine occupations, those occupations’ earnings declined (England et al., 2007). This practice may reflect an erroneous perception in society that a woman’s labor is inherently worth less than a man’s. Hence,
27
the selection of occupation or industry may have less effect on the gender wage gap than assumed. Nonetheless, college-aged students may be motivated by societal expectations or advisors to choose certain majors or programs to pursue their career paths. Though generally well-intended, gender biases may be hidden behind the encouragement from family members or advisors. In addition, the role of employee engagement on the gender wage gap is not explicitly studied. Those who violate the advice received may later suffer a penalty for not conforming to societal norms. In addition, those who are engaged at work are more productive. Women who perceive that they are not being paid equal wages for equal work as men may become detached from their work life. These explanations among others demonstrate the inextricably intertwined relationship between societal expectations and individuals functioning in society.
28
4.1 | Future Research
Should additional wage data and birth data become available, research should focus on parenthood impacts on the gender wage gap and workforce outcomes for mothers in Utah, considering the high fertility rate in Utah. Women are more likely to be the caretaker in the family or choose to stay home after giving birth. Women’s split roles at home and work impact the number of hours they are likely to participate in the workforce. Future research should also examine long-term effects from the COVID-19 pandemic in 2020 on the gender wage gap. Women are more likely to leave employment when children stay home from school or camps (Collins et al., 2020). The industries women tend to work in were also affected more severely by the pandemic (Alon et al., 2020). A recent study found that jobs in occupations held by Utah women declined at more than twice the rate of Utah men from 2019 to 2020 (Kem C. Gardner Policy Institute, 2021). Future research could investigate the ramifications women face as a result of the pandemic.Lastly, future studies could investigate the gender wage gap between companies with family-friendly policies compared to those without. The availability of on-site daycare or paternity leave of individual companies were not examined in this study. Paternity leave enables fathers to play a bigger role in childcare and share the responsibility of childcare with mothers. The ability to attain affordable childcare may also play a role in womens’ decisions about their careers when they become mothers. Further exploration could provide valuable insights to inform future policy decisions.
5 | ConclusionUtah has generally trailed the United States in pay equality between men and women. On average, from 2005 – 2018, the difference in pay equality is 10.97% less equitable in Utah than in the U.S. for full-time workers. This difference in pay begins immediately when new graduates enter the workforce. Women made less than men even after decomposing human capital and demographic considerations such as educational attainment, field of study, experience proxies, and age. Measures that reduced the wage gap in this study included consideration for attachment to the workforce, education, and selected field of study. After graduation, the wage gap grows significantly worse from the first year of graduation to the fifth year. Each level of educational attainment showed a statistically significant difference in how wage changes over time between genders. The largest pay difference occurs from those with a bachelor’s degrees or higher. The smallest change occurred from those with a technical certificate. The difference in wages for recent graduates in Utah cannot be explained by human capital measures alone. Although this study did not have measures such as output or hours worked available, over 70% of the wage gap of recent graduates cannot be explained by education, experience and age. This study illustrates that women in Utah consistently make less than men regardless of decomposition, educational attainment, or field of study. It is the hope of both authors that this research can be used to drive policy toward equal pay between men and women in the state.
Data Partners
29
ReferencesAlon, T. M., Doepke, M., Olmstead-Rumsey, J., & Tertilt, M. (2020).
The impact of COVID-19 on gender equality (No. w26947). National Bureau of Economic Research.
Arlie Hochschild & Anne Machung, The Second Shift: Working Families and the Revolution at Home (New York: Viking Books, 1989).
Babcock, L., & Laschever, S. (2009). Women don’t ask: Negotiation and the gender divide. Princeton University Press.
Bache, S. M., & Wickham, H. (2014). magrittr: a forward-pipe operator for R. R package version, 1(1).
Becker, G. S. (1957). The economics of discrimination. University of Chicago press.
Beede, D. N., Julian, T. A., Langdon, D., McKittrick, G., Khan, B., & Doms, M. E. (2011). Women in STEM: A gender gap to innovation. Economics and Statistics Administration Issue Brief, (04-11).
Berg, Maxine Dr. “Women’s Work and the Industrial Revolution.” ReFresh, no.12 (1991): 1-4
Bergmann, B.R. (1981). “The Economic Risks of Being a Housewife”. The American Economic Review (71): 81–6.
Blau, F. D., & DeVaro, J. (2007). New evidence on gender differences in promotion rates: An empirical analysis of a sample of new hires. Industrial Relations: A Journal of Economy and Society, 46(3), 511-550.
Blau, F. D., & Kahn, L. M. (2000). Gender differences in pay. Journal of Economic perspectives, 14(4), 75-99.
Blau, F. D., & Kahn, L. M. (2007). The gender pay gap: Have women gone as far as they can?. Academy of Management Perspectives, 21(1), 7-23.
Blinder, A. S. (1973). Wage discrimination: reduced form and structural estimates. Journal of Human resources, 436-455.
Borjas, G. J. (2020). Labor economics 8th Edition. Boston: McGraw-Hill/Irwin
Bowles, H. R., Babcock, L., & Lai, L. (2007). Social incentives for gender differences in the propensity to initiate negotiations: Sometimes it does hurt to ask. Organizational Behavior and human decision Processes, 103(1), 84-103.
Budig, M. J., & England, P. (2001). The wage penalty for motherhood. American sociological review, 204-225.
Bureau of Labor Statistics “A look at women’s education and earnings since the 1970s” (2018) https://www.bls.gov/opub/ted/2017/a-look-at-womens-education-and-earnings-since-the-1970s.htm
Bureau of Labor Statistics “Women in the labor force: a databook” (2019) https://www.bls.gov/opub/reports/womens-databook/2019/home.htm
Collins, C., Landivar, L. C., Ruppanner, L., & Scarborough, W. J. (2020). COVID‐19 and the gender gap in work hours. Gender, Work & Organization.
Connley, Courtney. (2020, August 03). Clorox names Linda Rendle as its next CEO, bringing the number of Fortune 500 women leaders to a record 38. Retrieved August 13, 2020, from https://www.cnbc.com/2020/08/03/cloroxs-new-ceo-will-increase-the-number-of-fortune-500-women-to-38.html
Crittenden, A. (2002). The price of motherhood: Why the most important job in the world is still the least valued. Macmillan.
Eagly, A. H., Makhijani, M. G., & Klonsky, B. G. (1992). Gender and the evaluation of leaders: A meta-analysis. Psychological bulletin, 111(1), 3.
Eagly. A. H., & Karau, S. J. (2002) Role congruity theory of prejudice toward female leaders. Psychological Review, 109, 573–598.
Goldin, C. (2014). A grand gender convergence: Its last chapter. American Economic Review, 104(4), 1091-1119.
Goldin, Claudia Understanding the Gender Gap: An Economic History of American Women. Oxford University Press, USA (February 13, 1992)
Graf, Niki, Brown, Anna, and Patten, Eileen “The narrowing,
but persistent, gender gap in pay” March 22, 2019. Pew Research Center. https://www.pewresearch.org/fact-tank/2019/03/22/gender-pay-gap-facts/
Hewlett, S. A., Luce, C. B., Servon, L. J., Sherbin, L., Shiller, P., Sosnovich, E., & Sumberg, K. (2008). The Athena factor: Reversing the brain drain in science, engineering, and technology. Harvard Business Review Research Report, 10094, 1-100.
Hlavac, M. (2014). oaxaca: Blinder-Oaxaca decomposition in R. Available at SSRN 2528391.
Hodges, M. J., & Budig, M. J. (2010). Who gets the daddy bonus? Organizational hegemonic masculinity and the impact of fatherhood on earnings. Gender & Society, 24(6), 717-745.
Humphries, J. (2009). The Gender Gap in Wages: Productivity or Prejudice or Market Power in Pursuit of Profits. Social Science History, 33(4), 481-488. doi:10.2307/40587328
Institute for Women’s Policy Research. 2010. “Pay Secrecy and Paycheck Fairness: New Data Shows Pay Transparence Needed.” November 15, 2010.
Kem C. Gardner Policy Institute. “COVID-19 Impacts by Gender” Updated March 2021. https://gardner.utah.edu/wp-content/uploads/C19Impacts-FS-Mar2021.pdf
Mandel, H., Semyonov, M. Gender Pay Gap and Employment Sector: Sources of Earnings Disparities in the United States, 1970–2010. Demography 51, 1597–1618 (2014). https://doi.org/10.1007/s13524-014-0320-
Mandel, Hades, & Semyonov, Moshe (2014) Gender Pay Gap and Employment Sector: Sources of Earnings Disparities in the United States, 1970–2010. Population Association of America.
Miller, A. R. (2011). The effects of motherhood timing on career path. Journal of population economics, 24(3), 1071-1100.
Miller, Stephen “Transparency Shrinks Gender Pay Gap” SHRM. Published Feb. 11, 2020. https://www.shrm.org/resourcesandtools/hr-topics/compensation/pages/transparency-shrinks-gender-pay-gap.aspx
Mincer, J. (1974). Schooling, Experience, and Earnings. Human Behavior & Social Institutions No. 2.
Moss-Racusin, C. A., Dovidio, J. F., Brescoll, V. L., Graham, M. J., & Handelsman, J. (2012). Science faculty’s subtle gender biases favor male students. Proceedings of the national academy of sciences, 109(41), 16474-16479. Gender Pay Gap and Employment Sector: Sources
National Center for Education Statistics, Digest of Education Statistics Degrees conferred by degree-granting institutions, by level of degree and sex of student: Selected years, 1869-70 through 2021-22 https://nces.ed.gov/programs/digest/d12/tables/dt12_310.asp
National Science Foundation “Science and Engineering Indicators 2018” https://nsf.gov/statistics/2018/nsb20181/
Noble, B. (1992, November 22). At Work; And Now the ‘Sticky Floor’. Retrieved August 13, 2020, from https://www.nytimes.com/1992/11/22/business/at-work-and-now-the-sticky-floor.html
Oaxaca, R. (1973). Male-female wage differentials in urban labor markets. International economic review, 693-709.
Rogier, S. A., & Padgett, M. Y. (2004). The impact of utilizing a flexible work schedule on the perceived career advancement potential of women. Human resource development quarterly, 15(1), 89-106.
Rosenthal, R., & Jacobson, L. (1968). Pygmalion in the classroom. The urban review, 3(1), 16-20.
Rudman, L. A., & Glick, P. (2001). Prescriptive gender stereotypes and backlash toward agentic women. Journal of Social Issues, 57, 743-762
Schein, V. E., Mueller, R., Lituchy, T., & Liu, J. (1996). Think manager—think male: A global phenomenon?. Journal of organizational behavior, 17(1), 33-41.
30
Sha, Rebecca “The Persisting Gender Pay Gap: Recent Developments in the Law That Address Gender Pay Disparities” American Bar Association. May 16, 2019 https://www.americanbar.org/groups/litigation/committees/diversity-inclusion/articles/2019/spring2019-gender-pay-gap-recent-developments/
Shnieder, Jessica & Gould, Elise “Womens Work and the Gender Pay Gap” Economic Policy Institute (2016) https://www.epi.org/files/pdf/110304.pdf
Small, D. A., Gelfand, M., Babcock, L., & Gettman, H. (2007). Who goes to the bargaining table? The influence of gender and framing on the initiation of negotiation. Journal of Personality and Social Psychology, 93(4), 600–613. https://doi.org/10.1037/0022-3514.93.4.600
Sorock, Carolyn E. “Closing the Gap Legislatively: Consequences of the Lilly Ledbetter Fair Pay Act.” Chicago-Kent Law Review 85.3 (2010): 1216. Web.
Team, R. C. (2013). R: A language and environment for statistical computing.
Utah Department of Workforce Services. “Women in the Workforce” Updated March 2020. https://jobs.utah.gov/wi/data/library/laborforce/womeninwf.html
Wade, M. E. (2001). Women and Salary Negotiation: The Costs of Self-Advocacy. Psychology of Women Quarterly, 25(1), 65–76. https://doi.org/10.1111/1471-6402.00008
Waldfogel, J. (1997). The effect of children on women’s wages. American sociological review, 209-217.
Warner, Judith, Ellman, Nora, Boesch, Diana “The Womens Leadership Gap” November 20, 2018. Center for American Progress. https://www.americanprogress.org/issues/women/reports/2018/11/20/461273/womens-leadership-gap-2/
Wickham, H., Francois, R., Henry, L., & Müller, K. (2015). dplyr: A grammar of data manipulation. R package version 0.4, 3.
Wickham, H., Hester, J., & Francois, R. (2017). Readr: Read rectangular text data. R package version, 1(1), 1.
Women’s Educational Equity Act (1974) Section 513 of PL 93-380Woodhams, C., Lupton, B. & Cowling, M. The Presence of
Ethnic Minority and Disabled men in Feminised Work: Intersectionality, Vertical Segregation and the Glass Escalator. Sex Roles 72, 277–293 (2015). https://doi.org/10.1007/s11199-014-0427-z
Wulfhorst, E. (2018, March 05). Woman who coined ‘glass ceiling’ frustrated by slow progress. Retrieved August 13, 2020, from https://www.reuters.com/article/us-women-sexualdiscrimination-glassceili/woman-who-coined-glass-ceiling-frustrated-by-slow-progress-idUSKBN1GH0HX
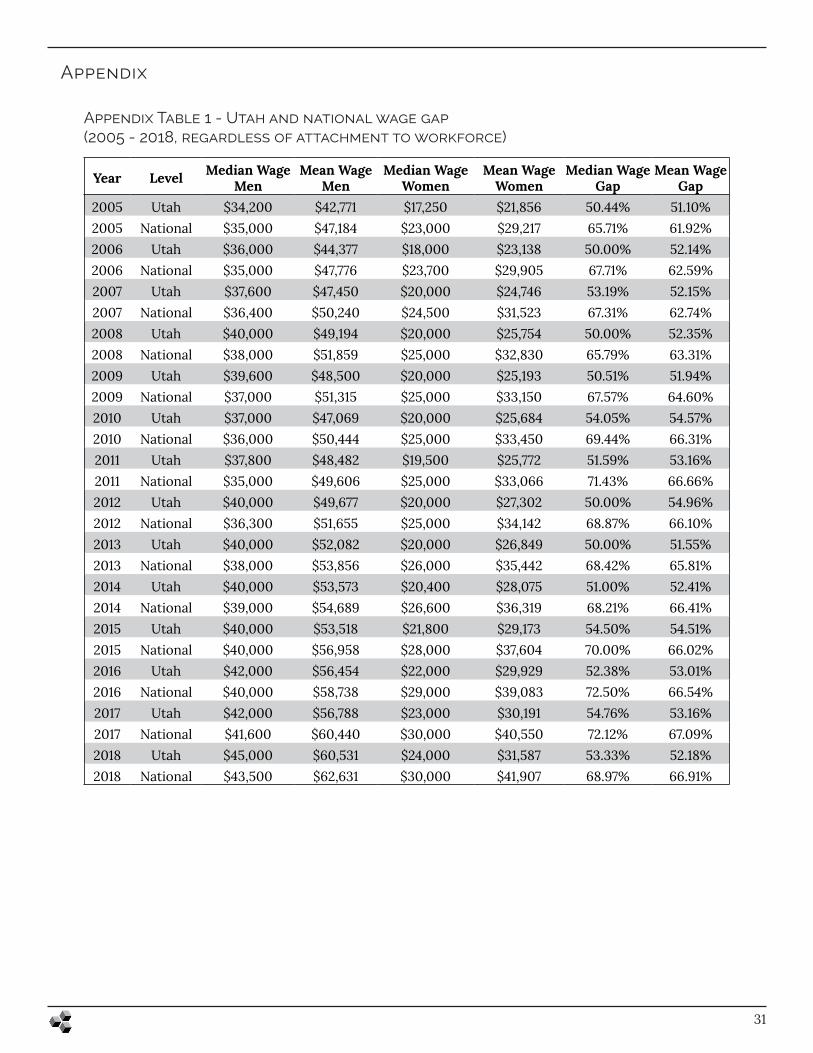
Appendix
31
Appendix Table 1 - Utah and national wage gap (2005 - 2018, regardless of attachment to workforce)
Year Level Median Wage Men
Mean Wage Men
Median Wage Women
Mean Wage Women
Median Wage Gap
Mean Wage Gap
2005 Utah $34,200 $42,771 $17,250 $21,856 50.44% 51.10%2005 National $35,000 $47,184 $23,000 $29,217 65.71% 61.92%2006 Utah $36,000 $44,377 $18,000 $23,138 50.00% 52.14%2006 National $35,000 $47,776 $23,700 $29,905 67.71% 62.59%2007 Utah $37,600 $47,450 $20,000 $24,746 53.19% 52.15%2007 National $36,400 $50,240 $24,500 $31,523 67.31% 62.74%2008 Utah $40,000 $49,194 $20,000 $25,754 50.00% 52.35%2008 National $38,000 $51,859 $25,000 $32,830 65.79% 63.31%2009 Utah $39,600 $48,500 $20,000 $25,193 50.51% 51.94%2009 National $37,000 $51,315 $25,000 $33,150 67.57% 64.60%2010 Utah $37,000 $47,069 $20,000 $25,684 54.05% 54.57%2010 National $36,000 $50,444 $25,000 $33,450 69.44% 66.31%2011 Utah $37,800 $48,482 $19,500 $25,772 51.59% 53.16%2011 National $35,000 $49,606 $25,000 $33,066 71.43% 66.66%2012 Utah $40,000 $49,677 $20,000 $27,302 50.00% 54.96%2012 National $36,300 $51,655 $25,000 $34,142 68.87% 66.10%2013 Utah $40,000 $52,082 $20,000 $26,849 50.00% 51.55%2013 National $38,000 $53,856 $26,000 $35,442 68.42% 65.81%2014 Utah $40,000 $53,573 $20,400 $28,075 51.00% 52.41%2014 National $39,000 $54,689 $26,600 $36,319 68.21% 66.41%2015 Utah $40,000 $53,518 $21,800 $29,173 54.50% 54.51%2015 National $40,000 $56,958 $28,000 $37,604 70.00% 66.02%2016 Utah $42,000 $56,454 $22,000 $29,929 52.38% 53.01%2016 National $40,000 $58,738 $29,000 $39,083 72.50% 66.54%2017 Utah $42,000 $56,788 $23,000 $30,191 54.76% 53.16%2017 National $41,600 $60,440 $30,000 $40,550 72.12% 67.09%2018 Utah $45,000 $60,531 $24,000 $31,587 53.33% 52.18%2018 National $43,500 $62,631 $30,000 $41,907 68.97% 66.91%
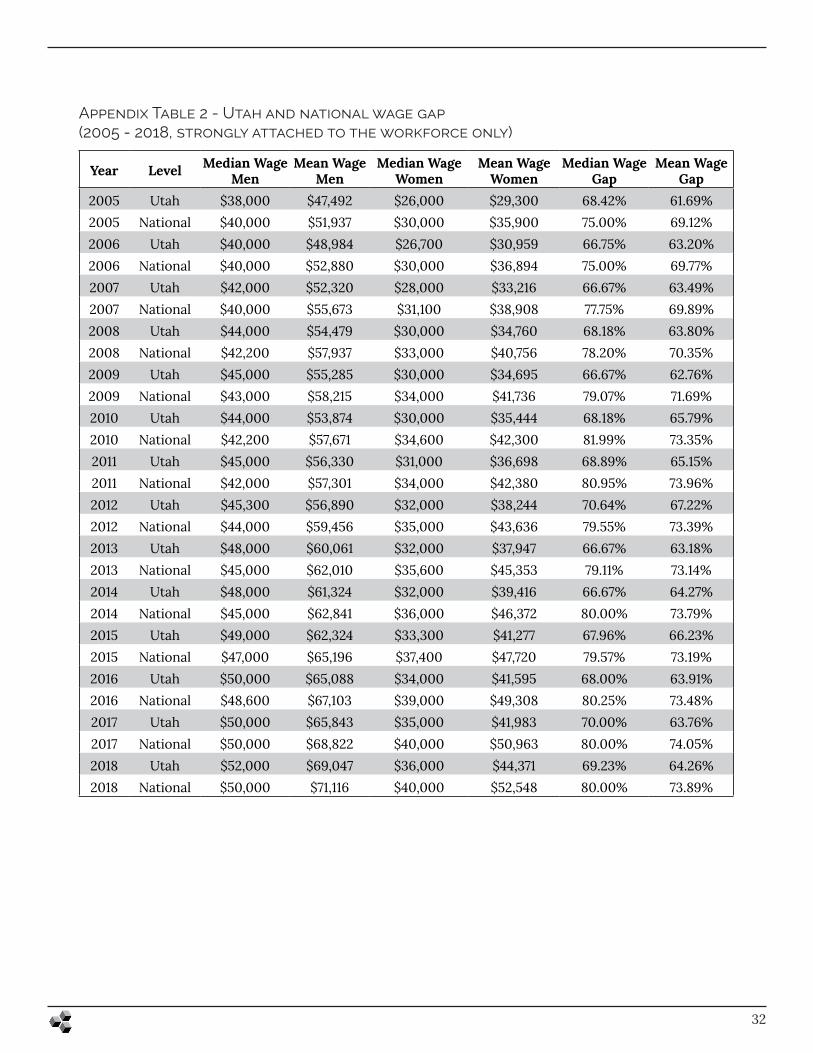
32
Appendix Table 2 - Utah and national wage gap (2005 - 2018, strongly attached to the workforce only)
Year Level Median Wage Men
Mean Wage Men
Median Wage Women
Mean Wage Women
Median Wage Gap
Mean Wage Gap
2005 Utah $38,000 $47,492 $26,000 $29,300 68.42% 61.69%2005 National $40,000 $51,937 $30,000 $35,900 75.00% 69.12%2006 Utah $40,000 $48,984 $26,700 $30,959 66.75% 63.20%2006 National $40,000 $52,880 $30,000 $36,894 75.00% 69.77%2007 Utah $42,000 $52,320 $28,000 $33,216 66.67% 63.49%2007 National $40,000 $55,673 $31,100 $38,908 77.75% 69.89%2008 Utah $44,000 $54,479 $30,000 $34,760 68.18% 63.80%2008 National $42,200 $57,937 $33,000 $40,756 78.20% 70.35%2009 Utah $45,000 $55,285 $30,000 $34,695 66.67% 62.76%2009 National $43,000 $58,215 $34,000 $41,736 79.07% 71.69%2010 Utah $44,000 $53,874 $30,000 $35,444 68.18% 65.79%2010 National $42,200 $57,671 $34,600 $42,300 81.99% 73.35%2011 Utah $45,000 $56,330 $31,000 $36,698 68.89% 65.15%2011 National $42,000 $57,301 $34,000 $42,380 80.95% 73.96%2012 Utah $45,300 $56,890 $32,000 $38,244 70.64% 67.22%2012 National $44,000 $59,456 $35,000 $43,636 79.55% 73.39%2013 Utah $48,000 $60,061 $32,000 $37,947 66.67% 63.18%2013 National $45,000 $62,010 $35,600 $45,353 79.11% 73.14%2014 Utah $48,000 $61,324 $32,000 $39,416 66.67% 64.27%2014 National $45,000 $62,841 $36,000 $46,372 80.00% 73.79%2015 Utah $49,000 $62,324 $33,300 $41,277 67.96% 66.23%2015 National $47,000 $65,196 $37,400 $47,720 79.57% 73.19%2016 Utah $50,000 $65,088 $34,000 $41,595 68.00% 63.91%2016 National $48,600 $67,103 $39,000 $49,308 80.25% 73.48%2017 Utah $50,000 $65,843 $35,000 $41,983 70.00% 63.76%2017 National $50,000 $68,822 $40,000 $50,963 80.00% 74.05%2018 Utah $52,000 $69,047 $36,000 $44,371 69.23% 64.26%2018 National $50,000 $71,116 $40,000 $52,548 80.00% 73.89%
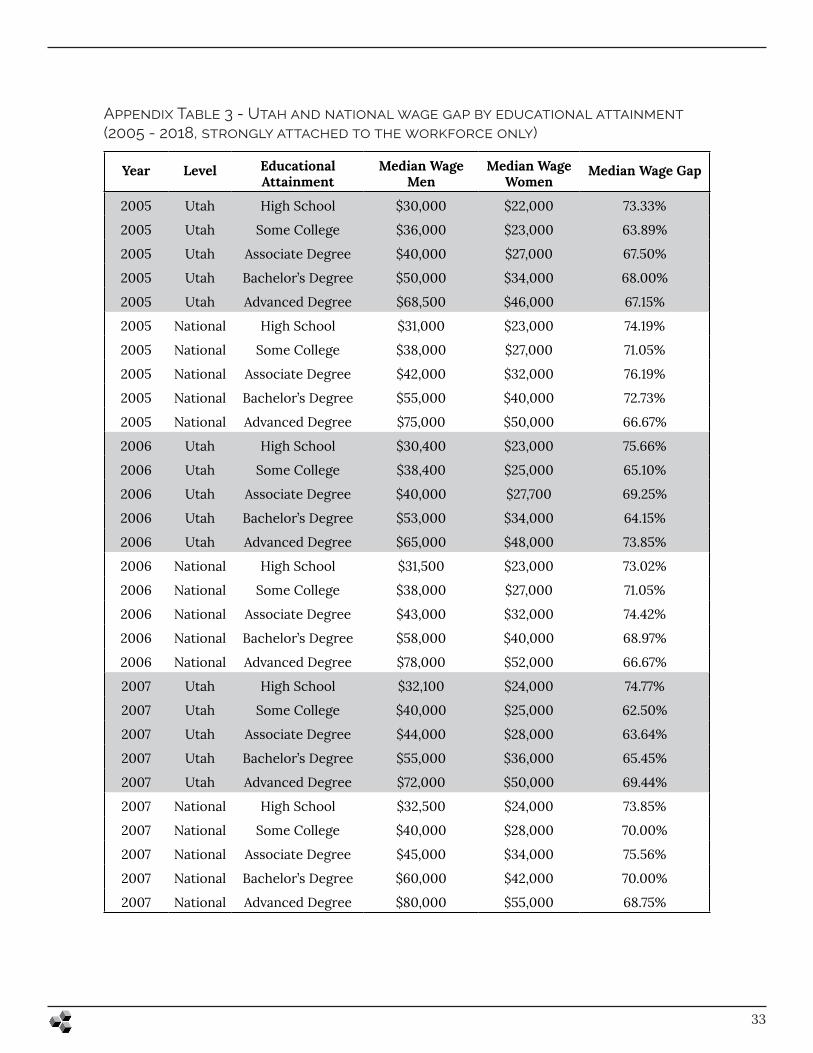
33
Appendix Table 3 - Utah and national wage gap by educational attainment (2005 - 2018, strongly attached to the workforce only)
Year Level Educational Attainment
Median Wage Men
Median Wage Women
Median Wage Gap
2005 Utah High School $30,000 $22,000 73.33%
2005 Utah Some College $36,000 $23,000 63.89%
2005 Utah Associate Degree $40,000 $27,000 67.50%
2005 Utah Bachelor’s Degree $50,000 $34,000 68.00%
2005 Utah Advanced Degree $68,500 $46,000 67.15%
2005 National High School $31,000 $23,000 74.19%
2005 National Some College $38,000 $27,000 71.05%
2005 National Associate Degree $42,000 $32,000 76.19%
2005 National Bachelor’s Degree $55,000 $40,000 72.73%
2005 National Advanced Degree $75,000 $50,000 66.67%
2006 Utah High School $30,400 $23,000 75.66%
2006 Utah Some College $38,400 $25,000 65.10%
2006 Utah Associate Degree $40,000 $27,700 69.25%
2006 Utah Bachelor’s Degree $53,000 $34,000 64.15%
2006 Utah Advanced Degree $65,000 $48,000 73.85%
2006 National High School $31,500 $23,000 73.02%
2006 National Some College $38,000 $27,000 71.05%
2006 National Associate Degree $43,000 $32,000 74.42%
2006 National Bachelor’s Degree $58,000 $40,000 68.97%
2006 National Advanced Degree $78,000 $52,000 66.67%
2007 Utah High School $32,100 $24,000 74.77%
2007 Utah Some College $40,000 $25,000 62.50%
2007 Utah Associate Degree $44,000 $28,000 63.64%
2007 Utah Bachelor’s Degree $55,000 $36,000 65.45%
2007 Utah Advanced Degree $72,000 $50,000 69.44%
2007 National High School $32,500 $24,000 73.85%
2007 National Some College $40,000 $28,000 70.00%
2007 National Associate Degree $45,000 $34,000 75.56%
2007 National Bachelor’s Degree $60,000 $42,000 70.00%
2007 National Advanced Degree $80,000 $55,000 68.75%
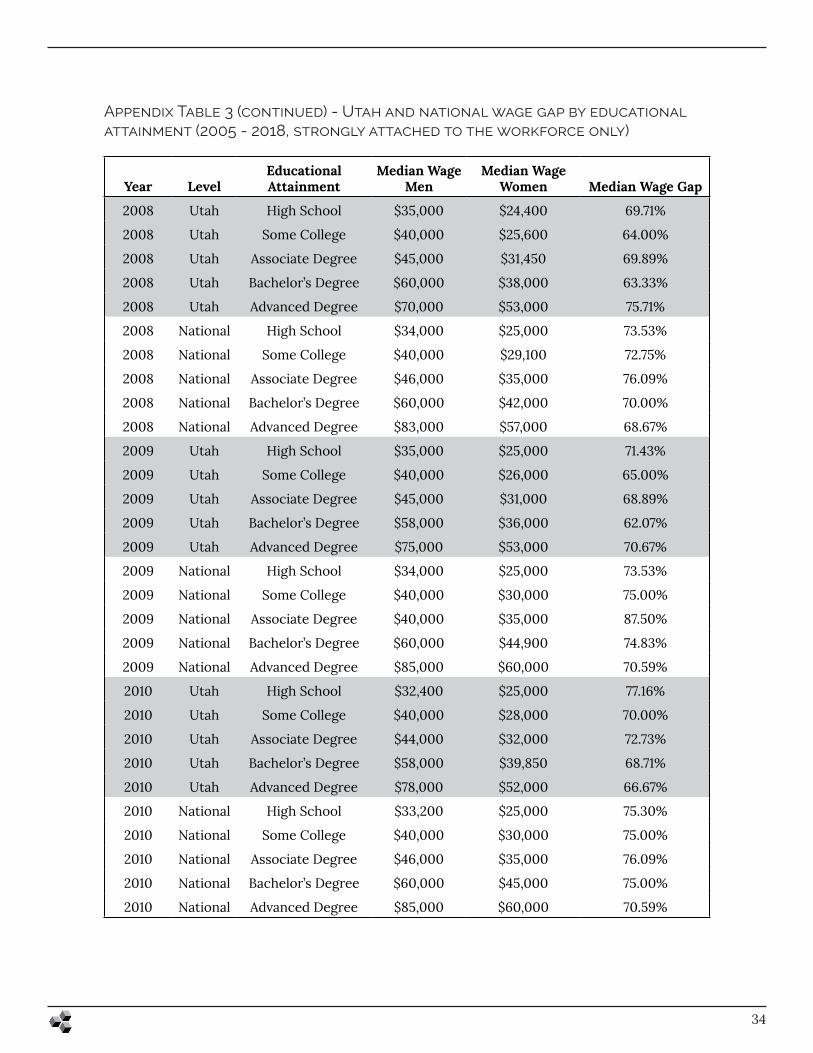
34
Appendix Table 3 (continued) - Utah and national wage gap by educational attainment (2005 - 2018, strongly attached to the workforce only)
Year LevelEducational Attainment
Median Wage Men
Median Wage Women Median Wage Gap
2008 Utah High School $35,000 $24,400 69.71%
2008 Utah Some College $40,000 $25,600 64.00%
2008 Utah Associate Degree $45,000 $31,450 69.89%
2008 Utah Bachelor’s Degree $60,000 $38,000 63.33%
2008 Utah Advanced Degree $70,000 $53,000 75.71%
2008 National High School $34,000 $25,000 73.53%
2008 National Some College $40,000 $29,100 72.75%
2008 National Associate Degree $46,000 $35,000 76.09%
2008 National Bachelor’s Degree $60,000 $42,000 70.00%
2008 National Advanced Degree $83,000 $57,000 68.67%
2009 Utah High School $35,000 $25,000 71.43%
2009 Utah Some College $40,000 $26,000 65.00%
2009 Utah Associate Degree $45,000 $31,000 68.89%
2009 Utah Bachelor’s Degree $58,000 $36,000 62.07%
2009 Utah Advanced Degree $75,000 $53,000 70.67%
2009 National High School $34,000 $25,000 73.53%
2009 National Some College $40,000 $30,000 75.00%
2009 National Associate Degree $40,000 $35,000 87.50%
2009 National Bachelor’s Degree $60,000 $44,900 74.83%
2009 National Advanced Degree $85,000 $60,000 70.59%
2010 Utah High School $32,400 $25,000 77.16%
2010 Utah Some College $40,000 $28,000 70.00%
2010 Utah Associate Degree $44,000 $32,000 72.73%
2010 Utah Bachelor’s Degree $58,000 $39,850 68.71%
2010 Utah Advanced Degree $78,000 $52,000 66.67%
2010 National High School $33,200 $25,000 75.30%
2010 National Some College $40,000 $30,000 75.00%
2010 National Associate Degree $46,000 $35,000 76.09%
2010 National Bachelor’s Degree $60,000 $45,000 75.00%
2010 National Advanced Degree $85,000 $60,000 70.59%
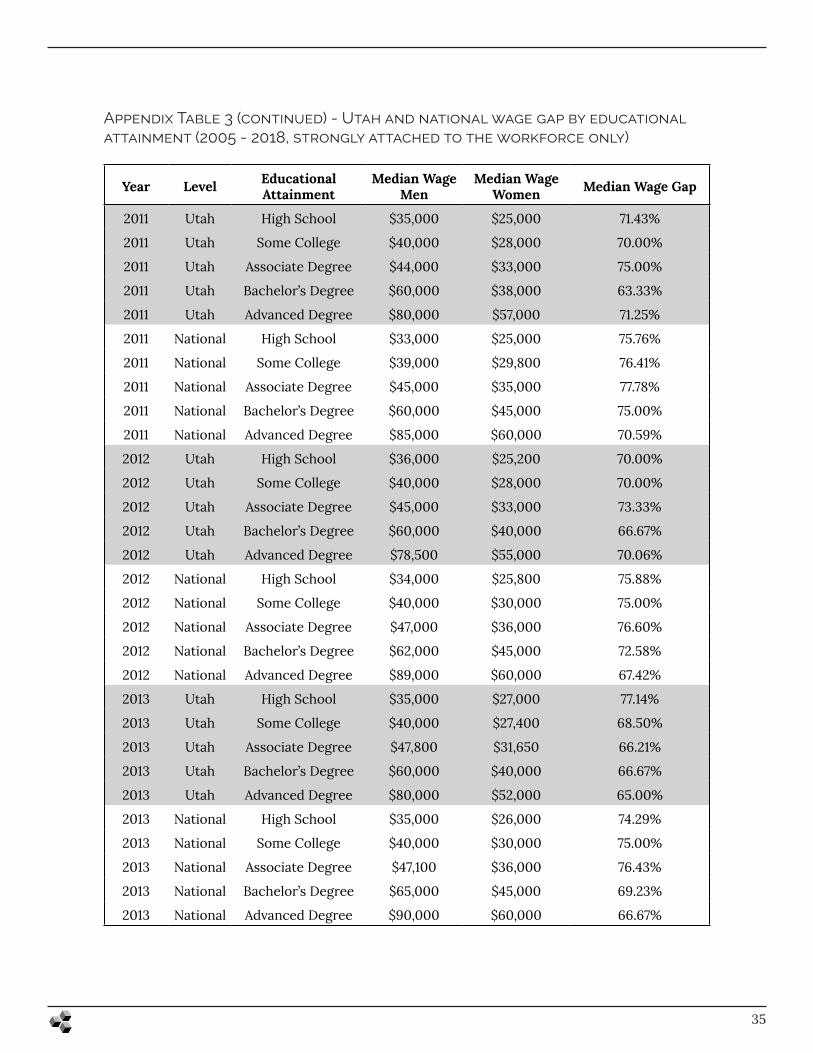
35
Appendix Table 3 (continued) - Utah and national wage gap by educational attainment (2005 - 2018, strongly attached to the workforce only)
Year Level Educational Attainment
Median Wage Men
Median Wage Women Median Wage Gap
2011 Utah High School $35,000 $25,000 71.43%
2011 Utah Some College $40,000 $28,000 70.00%
2011 Utah Associate Degree $44,000 $33,000 75.00%
2011 Utah Bachelor’s Degree $60,000 $38,000 63.33%
2011 Utah Advanced Degree $80,000 $57,000 71.25%
2011 National High School $33,000 $25,000 75.76%
2011 National Some College $39,000 $29,800 76.41%
2011 National Associate Degree $45,000 $35,000 77.78%
2011 National Bachelor’s Degree $60,000 $45,000 75.00%
2011 National Advanced Degree $85,000 $60,000 70.59%
2012 Utah High School $36,000 $25,200 70.00%
2012 Utah Some College $40,000 $28,000 70.00%
2012 Utah Associate Degree $45,000 $33,000 73.33%
2012 Utah Bachelor’s Degree $60,000 $40,000 66.67%
2012 Utah Advanced Degree $78,500 $55,000 70.06%
2012 National High School $34,000 $25,800 75.88%
2012 National Some College $40,000 $30,000 75.00%
2012 National Associate Degree $47,000 $36,000 76.60%
2012 National Bachelor’s Degree $62,000 $45,000 72.58%
2012 National Advanced Degree $89,000 $60,000 67.42%
2013 Utah High School $35,000 $27,000 77.14%
2013 Utah Some College $40,000 $27,400 68.50%
2013 Utah Associate Degree $47,800 $31,650 66.21%
2013 Utah Bachelor’s Degree $60,000 $40,000 66.67%
2013 Utah Advanced Degree $80,000 $52,000 65.00%
2013 National High School $35,000 $26,000 74.29%
2013 National Some College $40,000 $30,000 75.00%
2013 National Associate Degree $47,100 $36,000 76.43%
2013 National Bachelor’s Degree $65,000 $45,000 69.23%
2013 National Advanced Degree $90,000 $60,000 66.67%
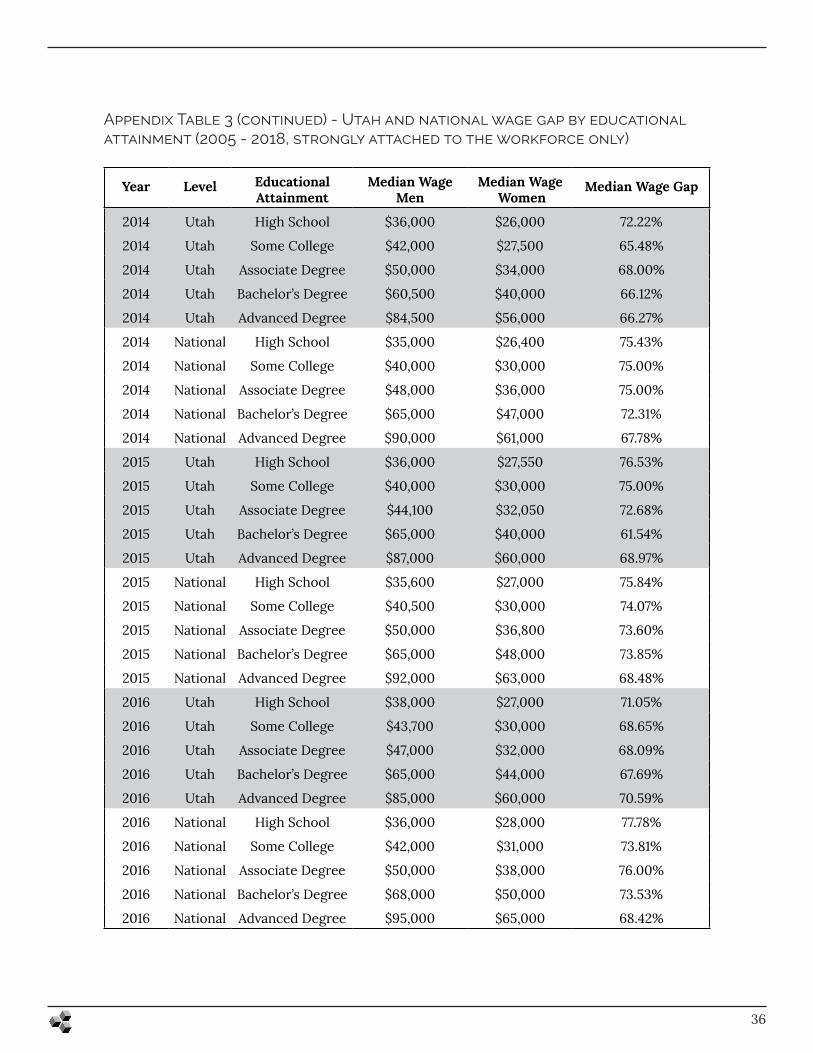
36
Appendix Table 3 (continued) - Utah and national wage gap by educational attainment (2005 - 2018, strongly attached to the workforce only)
Year Level Educational Attainment
Median Wage Men
Median Wage Women
Median Wage Gap
2014 Utah High School $36,000 $26,000 72.22%
2014 Utah Some College $42,000 $27,500 65.48%
2014 Utah Associate Degree $50,000 $34,000 68.00%
2014 Utah Bachelor’s Degree $60,500 $40,000 66.12%
2014 Utah Advanced Degree $84,500 $56,000 66.27%
2014 National High School $35,000 $26,400 75.43%
2014 National Some College $40,000 $30,000 75.00%
2014 National Associate Degree $48,000 $36,000 75.00%
2014 National Bachelor’s Degree $65,000 $47,000 72.31%
2014 National Advanced Degree $90,000 $61,000 67.78%
2015 Utah High School $36,000 $27,550 76.53%
2015 Utah Some College $40,000 $30,000 75.00%
2015 Utah Associate Degree $44,100 $32,050 72.68%
2015 Utah Bachelor’s Degree $65,000 $40,000 61.54%
2015 Utah Advanced Degree $87,000 $60,000 68.97%
2015 National High School $35,600 $27,000 75.84%
2015 National Some College $40,500 $30,000 74.07%
2015 National Associate Degree $50,000 $36,800 73.60%
2015 National Bachelor’s Degree $65,000 $48,000 73.85%
2015 National Advanced Degree $92,000 $63,000 68.48%
2016 Utah High School $38,000 $27,000 71.05%
2016 Utah Some College $43,700 $30,000 68.65%
2016 Utah Associate Degree $47,000 $32,000 68.09%
2016 Utah Bachelor’s Degree $65,000 $44,000 67.69%
2016 Utah Advanced Degree $85,000 $60,000 70.59%
2016 National High School $36,000 $28,000 77.78%
2016 National Some College $42,000 $31,000 73.81%
2016 National Associate Degree $50,000 $38,000 76.00%
2016 National Bachelor’s Degree $68,000 $50,000 73.53%
2016 National Advanced Degree $95,000 $65,000 68.42%
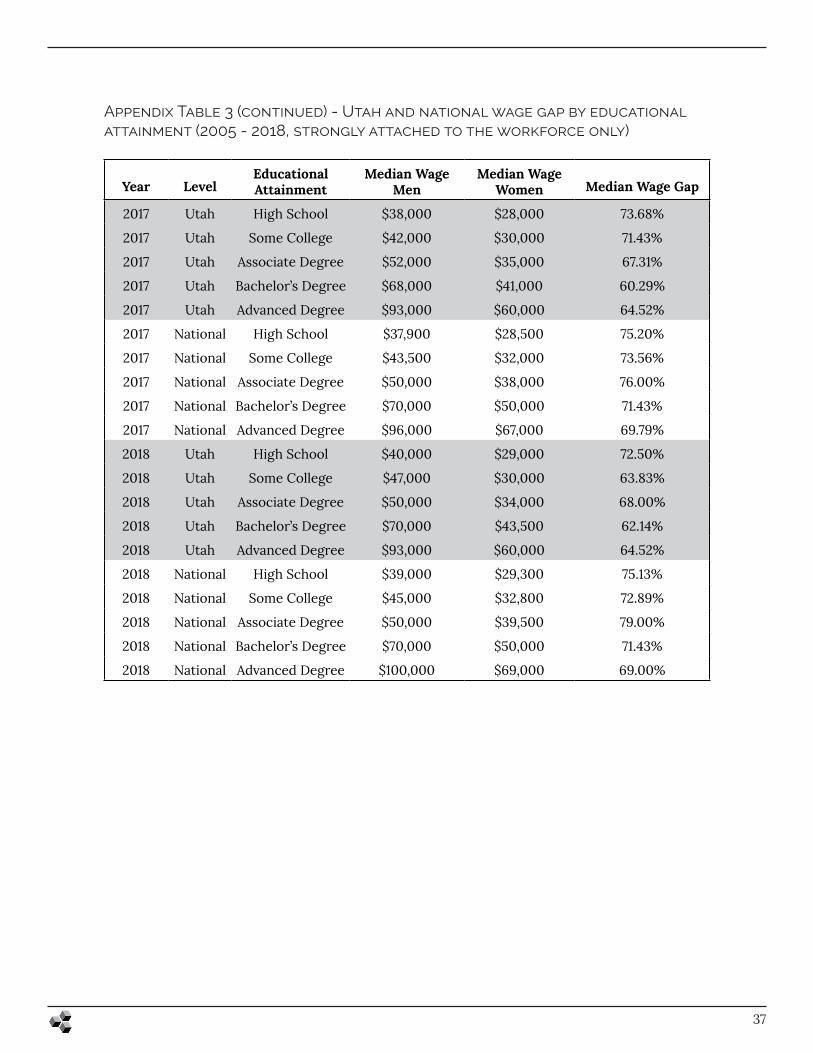
37
Appendix Table 3 (continued) - Utah and national wage gap by educational attainment (2005 - 2018, strongly attached to the workforce only)
Year LevelEducational Attainment
Median Wage Men
Median Wage Women Median Wage Gap
2017 Utah High School $38,000 $28,000 73.68%
2017 Utah Some College $42,000 $30,000 71.43%
2017 Utah Associate Degree $52,000 $35,000 67.31%
2017 Utah Bachelor’s Degree $68,000 $41,000 60.29%
2017 Utah Advanced Degree $93,000 $60,000 64.52%
2017 National High School $37,900 $28,500 75.20%
2017 National Some College $43,500 $32,000 73.56%
2017 National Associate Degree $50,000 $38,000 76.00%
2017 National Bachelor’s Degree $70,000 $50,000 71.43%
2017 National Advanced Degree $96,000 $67,000 69.79%
2018 Utah High School $40,000 $29,000 72.50%
2018 Utah Some College $47,000 $30,000 63.83%
2018 Utah Associate Degree $50,000 $34,000 68.00%
2018 Utah Bachelor’s Degree $70,000 $43,500 62.14%
2018 Utah Advanced Degree $93,000 $60,000 64.52%
2018 National High School $39,000 $29,300 75.13%
2018 National Some College $45,000 $32,800 72.89%
2018 National Associate Degree $50,000 $39,500 79.00%
2018 National Bachelor’s Degree $70,000 $50,000 71.43%
2018 National Advanced Degree $100,000 $69,000 69.00%
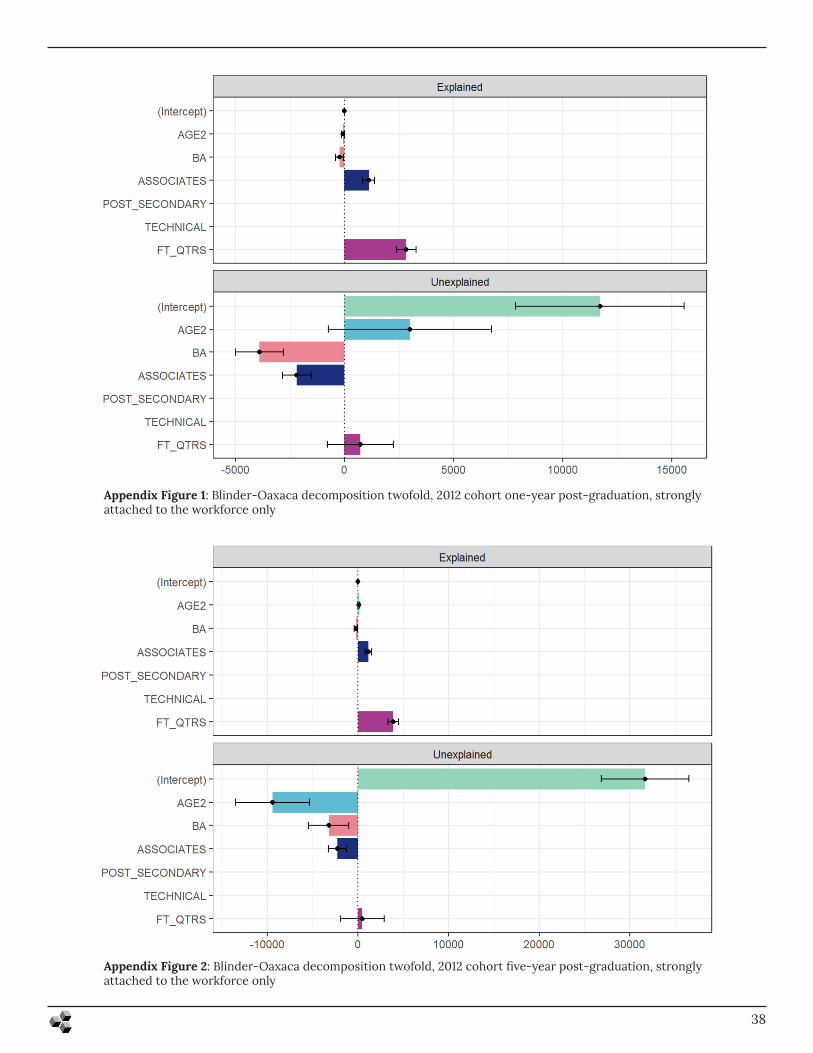
38
Appendix Figure 1: Blinder-Oaxaca decomposition twofold, 2012 cohort one-year post-graduation, strongly attached to the workforce only
Appendix Figure 2: Blinder-Oaxaca decomposition twofold, 2012 cohort five-year post-graduation, strongly attached to the workforce only
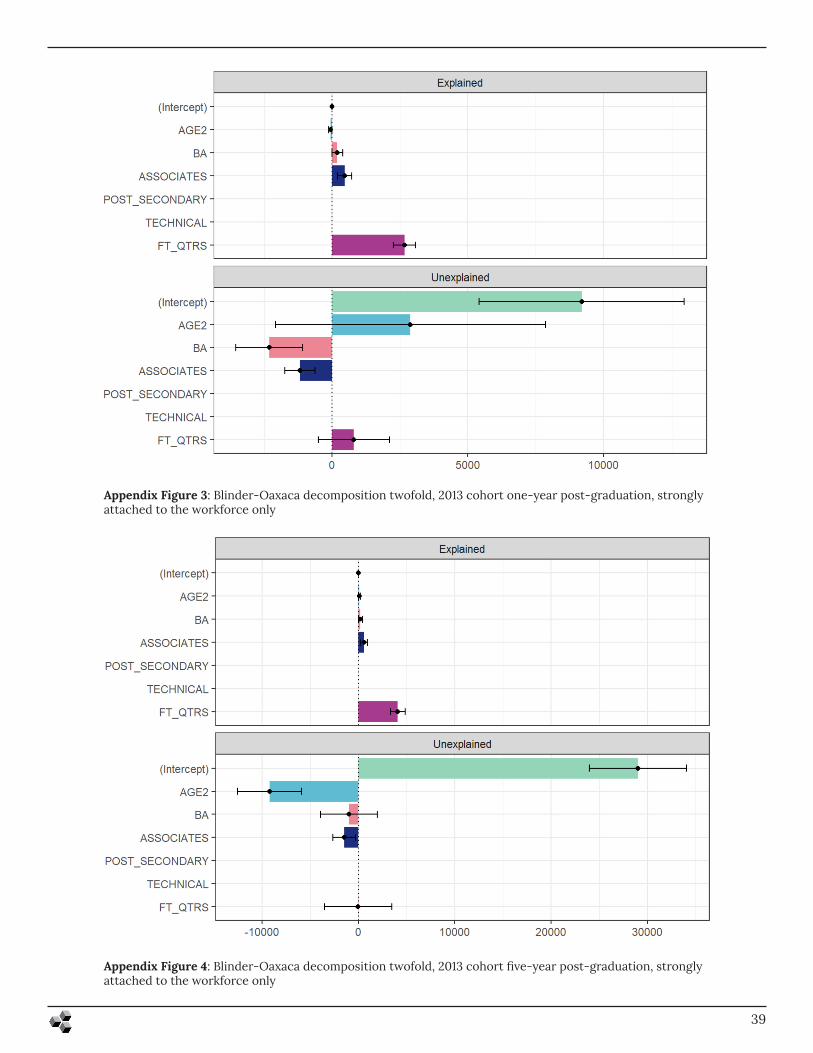
39
Appendix Figure 3: Blinder-Oaxaca decomposition twofold, 2013 cohort one-year post-graduation, strongly attached to the workforce only
Appendix Figure 4: Blinder-Oaxaca decomposition twofold, 2013 cohort five-year post-graduation, strongly attached to the workforce only
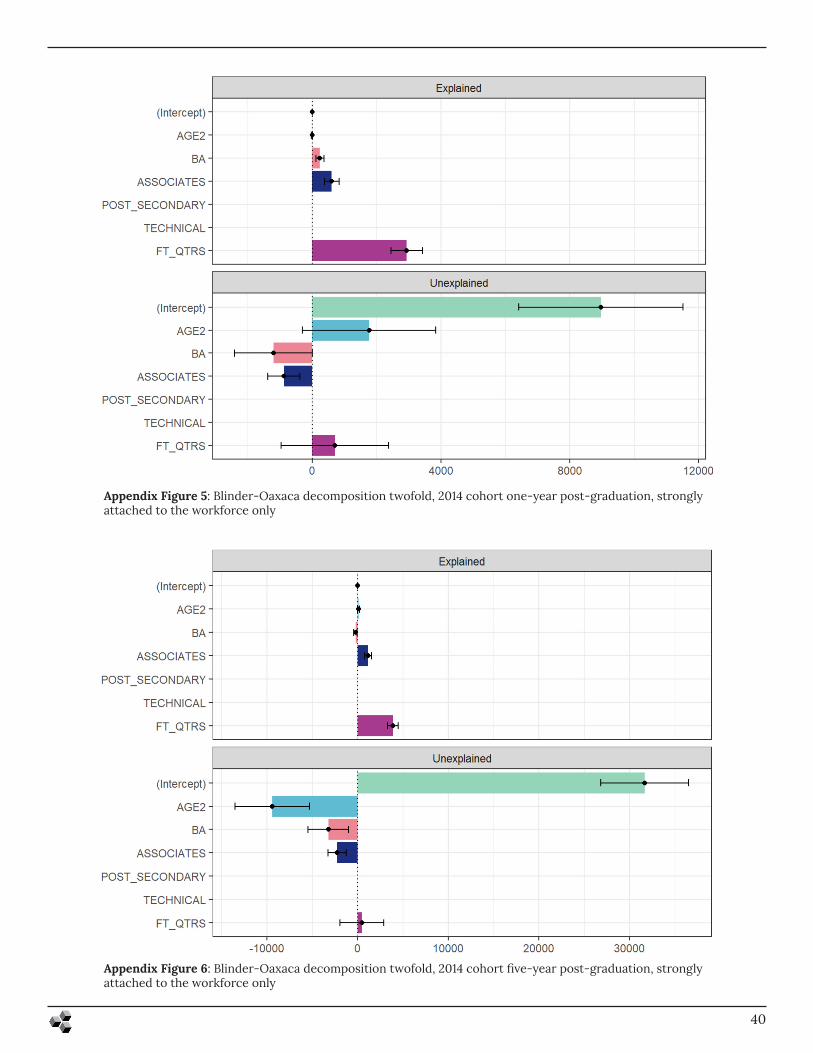
40
Appendix Figure 6: Blinder-Oaxaca decomposition twofold, 2014 cohort five-year post-graduation, strongly attached to the workforce only
Appendix Figure 5: Blinder-Oaxaca decomposition twofold, 2014 cohort one-year post-graduation, strongly attached to the workforce only
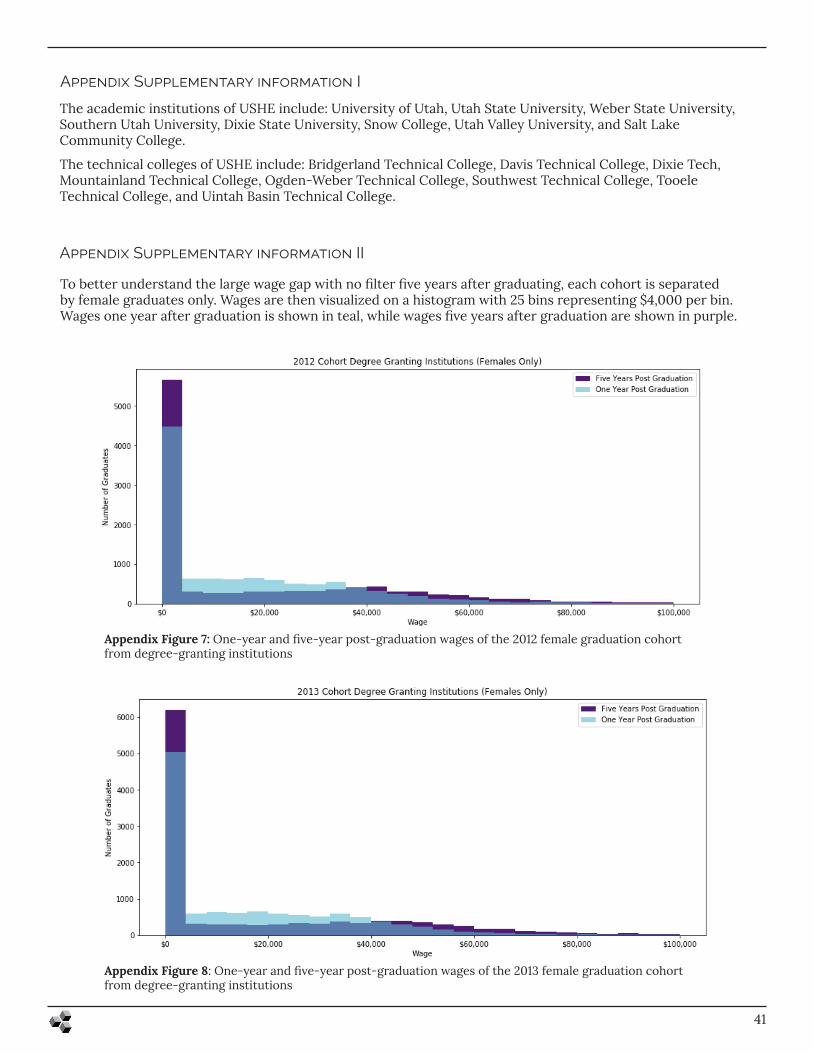
The academic institutions of USHE include: University of Utah, Utah State University, Weber State University, Southern Utah University, Dixie State University, Snow College, Utah Valley University, and Salt Lake Community College.
The technical colleges of USHE include: Bridgerland Technical College, Davis Technical College, Dixie Tech, Mountainland Technical College, Ogden-Weber Technical College, Southwest Technical College, Tooele Technical College, and Uintah Basin Technical College.
41
Appendix Supplementary information I
To better understand the large wage gap with no filter five years after graduating, each cohort is separated by female graduates only. Wages are then visualized on a histogram with 25 bins representing $4,000 per bin. Wages one year after graduation is shown in teal, while wages five years after graduation are shown in purple.
Appendix Supplementary information II
Appendix Figure 7: One-year and five-year post-graduation wages of the 2012 female graduation cohort from degree-granting institutions
Appendix Figure 8: One-year and five-year post-graduation wages of the 2013 female graduation cohort from degree-granting institutions
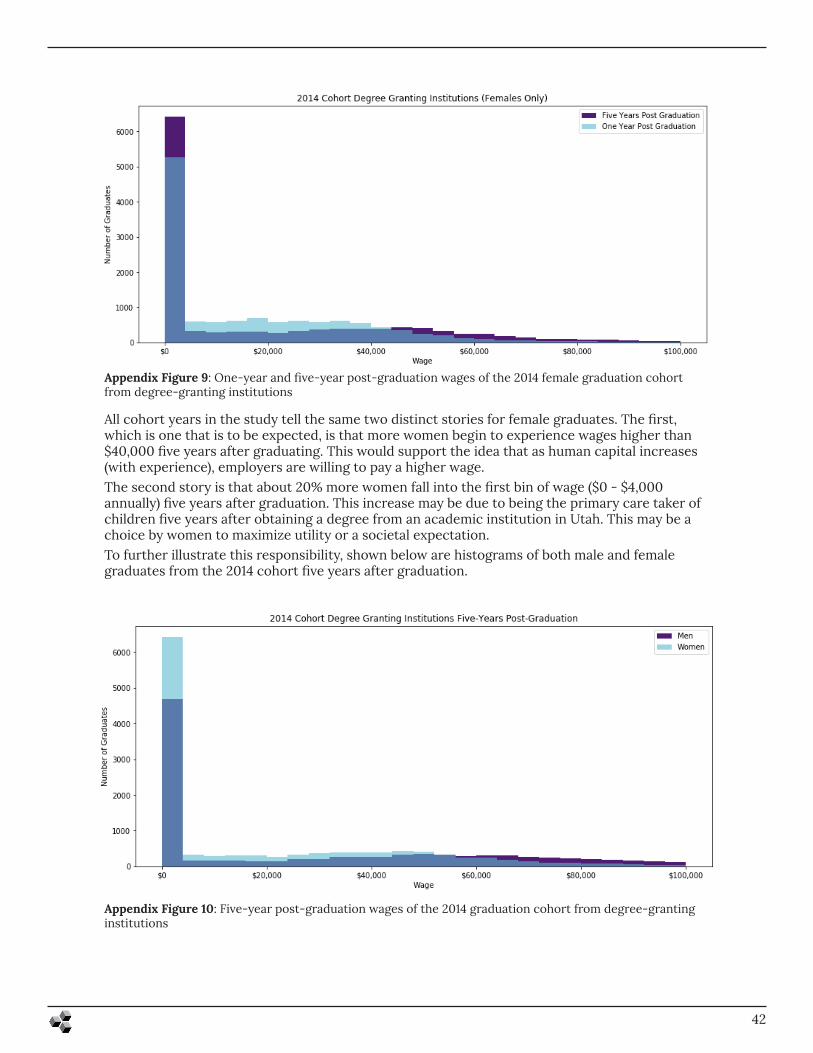
42
Appendix Figure 9: One-year and five-year post-graduation wages of the 2014 female graduation cohort from degree-granting institutions
All cohort years in the study tell the same two distinct stories for female graduates. The first, which is one that is to be expected, is that more women begin to experience wages higher than $40,000 five years after graduating. This would support the idea that as human capital increases (with experience), employers are willing to pay a higher wage. The second story is that about 20% more women fall into the first bin of wage ($0 - $4,000 annually) five years after graduation. This increase may be due to being the primary care taker of children five years after obtaining a degree from an academic institution in Utah. This may be a choice by women to maximize utility or a societal expectation. To further illustrate this responsibility, shown below are histograms of both male and female graduates from the 2014 cohort five years after graduation.
Appendix Figure 10: Five-year post-graduation wages of the 2014 graduation cohort from degree-granting institutions
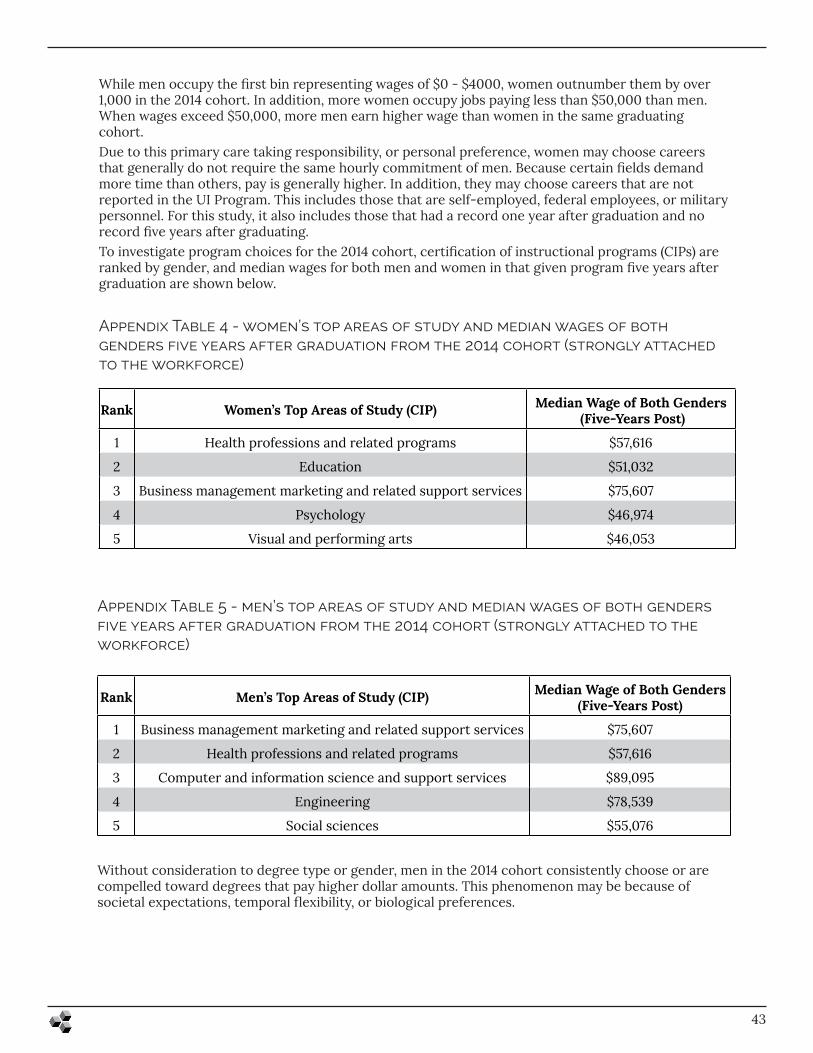
43
While men occupy the first bin representing wages of $0 - $4000, women outnumber them by over 1,000 in the 2014 cohort. In addition, more women occupy jobs paying less than $50,000 than men. When wages exceed $50,000, more men earn higher wage than women in the same graduating cohort. Due to this primary care taking responsibility, or personal preference, women may choose careers that generally do not require the same hourly commitment of men. Because certain fields demand more time than others, pay is generally higher. In addition, they may choose careers that are not reported in the UI Program. This includes those that are self-employed, federal employees, or military personnel. For this study, it also includes those that had a record one year after graduation and no record five years after graduating. To investigate program choices for the 2014 cohort, certification of instructional programs (CIPs) are ranked by gender, and median wages for both men and women in that given program five years after graduation are shown below.
Rank Women’s Top Areas of Study (CIP) Median Wage of Both Genders (Five-Years Post)
1 Health professions and related programs $57,616
2 Education $51,032
3 Business management marketing and related support services $75,607
4 Psychology $46,974
5 Visual and performing arts $46,053
Appendix Table 4 - women’s top areas of study and median wages of both genders five years after graduation from the 2014 cohort (strongly attached to the workforce)
Rank Men’s Top Areas of Study (CIP) Median Wage of Both Genders (Five-Years Post)
1 Business management marketing and related support services $75,607
2 Health professions and related programs $57,616
3 Computer and information science and support services $89,095
4 Engineering $78,539
5 Social sciences $55,076
Appendix Table 5 - men’s top areas of study and median wages of both genders five years after graduation from the 2014 cohort (strongly attached to the workforce)
Without consideration to degree type or gender, men in the 2014 cohort consistently choose or are compelled toward degrees that pay higher dollar amounts. This phenomenon may be because of societal expectations, temporal flexibility, or biological preferences.