genders and eas using gestation periods to control population dynamics cameron johnson
Post on 22-Dec-2015
220 views
TRANSCRIPT
Genders and EAs
Using Gestation Periods to Control Population Dynamics
Cameron Johnson
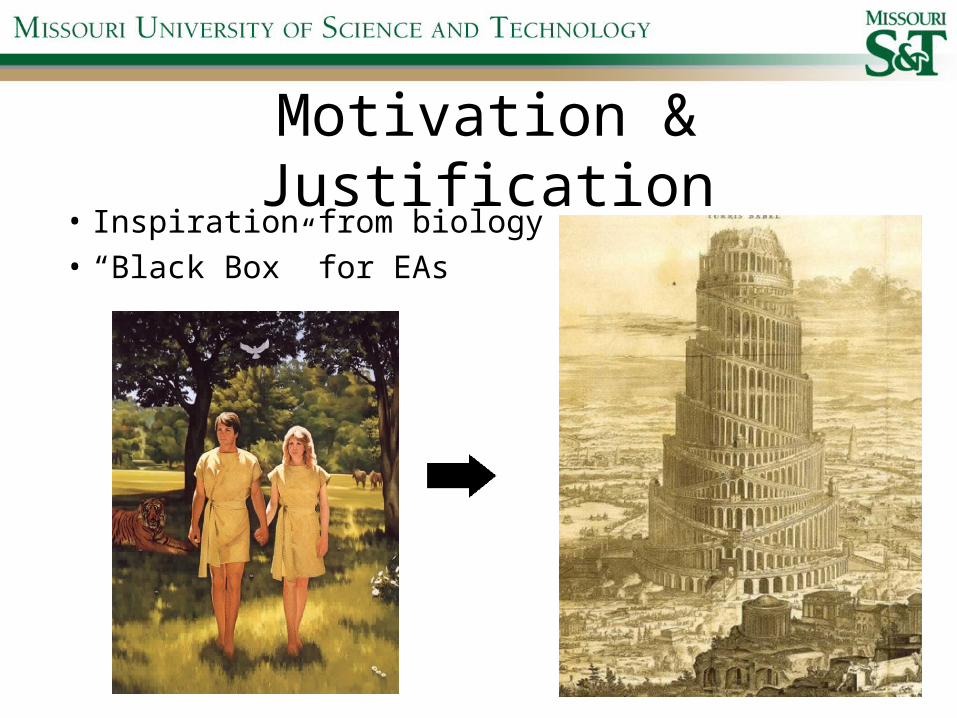
Motivation & Justification• Inspiration from biology
• “Black Box” for EAs
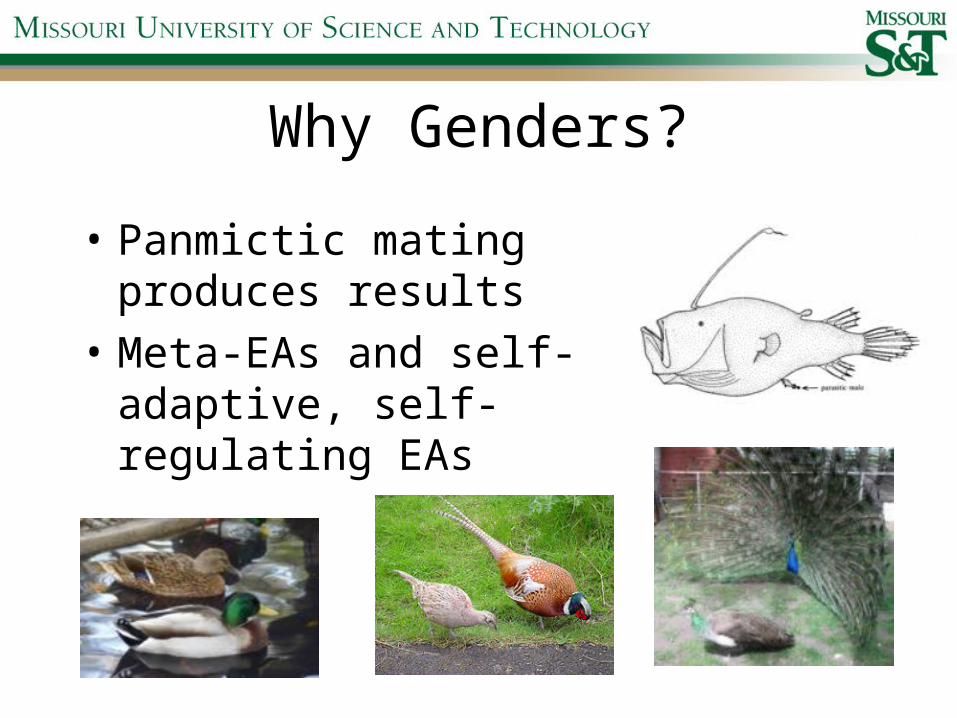
Why Genders?
• Panmictic mating produces results
• Meta-EAs and self-adaptive, self-regulating EAs
Methods• Algorithm basics
– Fitness used as mate-selection algorithm– Gestation period
• Population size-control• Restriction on reproductive speed
– Child Support• Balance between own survival and offspring survival
• Behavioral Genes– Male and female child support %– Male and female faithfulness (expressed as %)– Male and female mutation rates (expressed as %)– Sex allele – male or female?
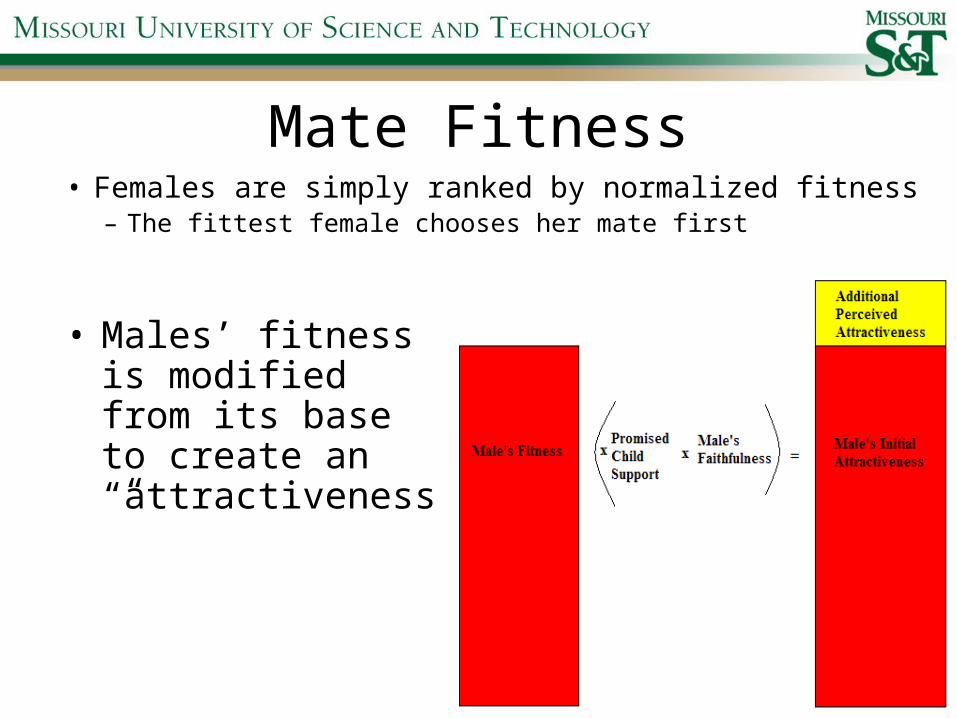
Mate Fitness• Females are simply ranked by normalized fitness
– The fittest female chooses her mate first
• Males’ fitness is modified from its base to create an “attractiveness”
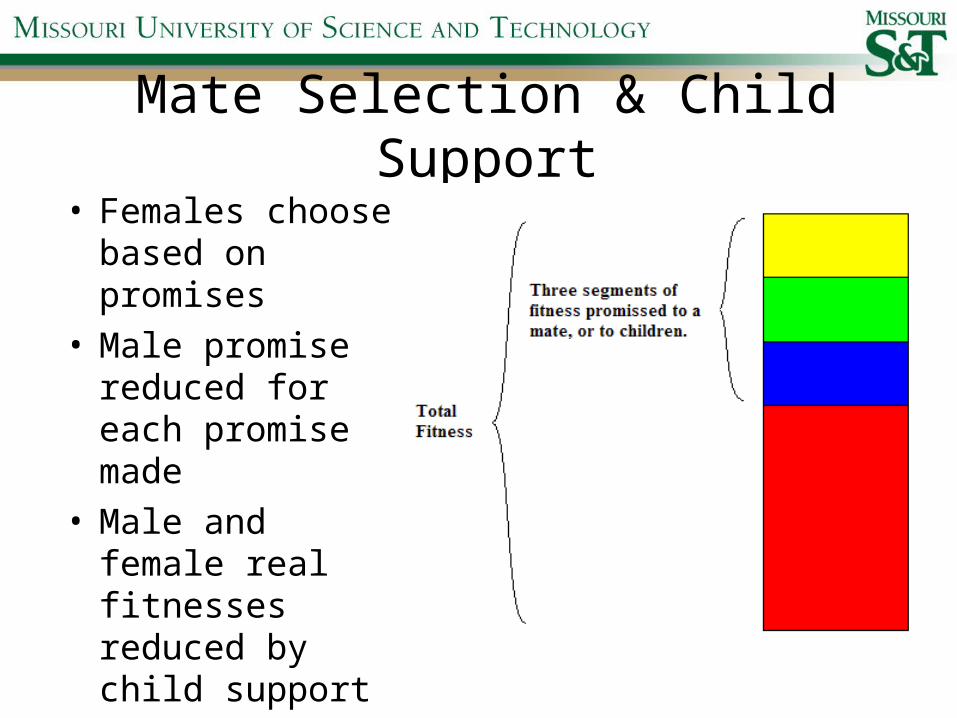
Mate Selection & Child Support
• Females choose based on promises
• Male promise reduced for each promise made
• Male and female real fitnesses reduced by child support

Factors to Keep Track of
• Is the individual alive?
• Who are his parents (father & mother)?
• Is the individual pregnant?
• With whom did the individual last mate?
• How many children does the individual have?
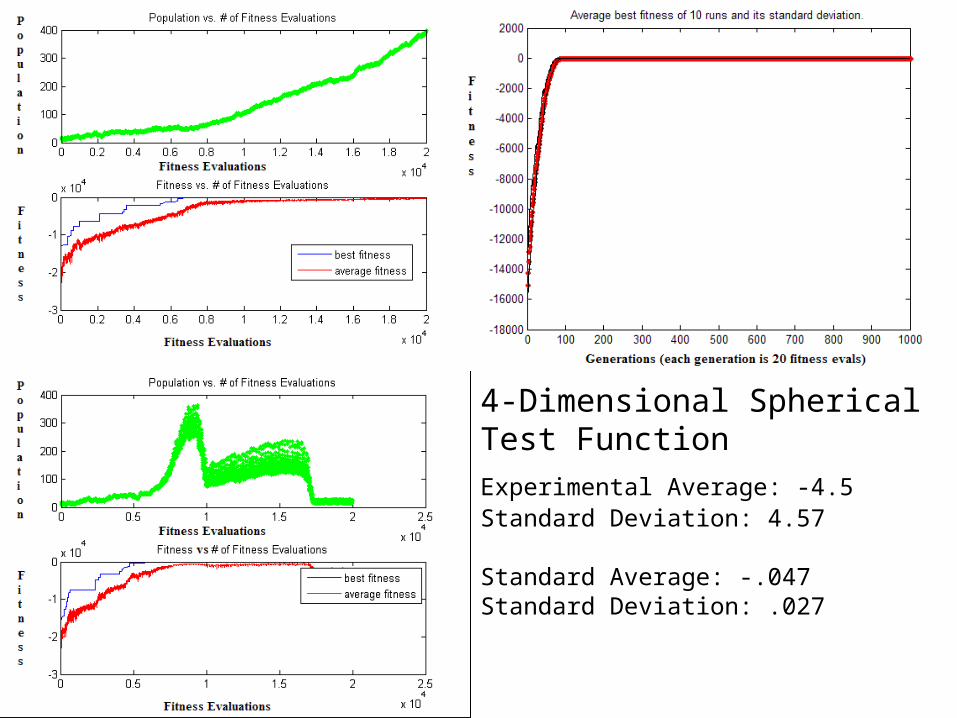
4-Dimensional Spherical Test Function
Experimental Average: -4.5 Standard Deviation: 4.57
Standard Average: -.047Standard Deviation: .027
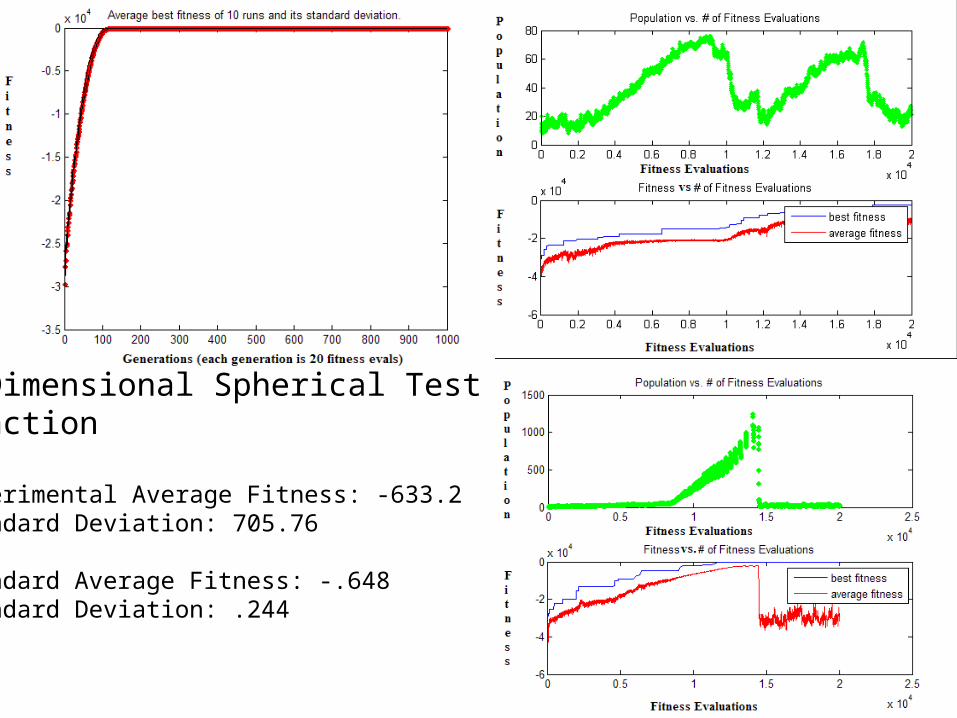
7-Dimensional Spherical Test Function
Experimental Average Fitness: -633.2Standard Deviation: 705.76
Standard Average Fitness: -.648Standard Deviation: .244
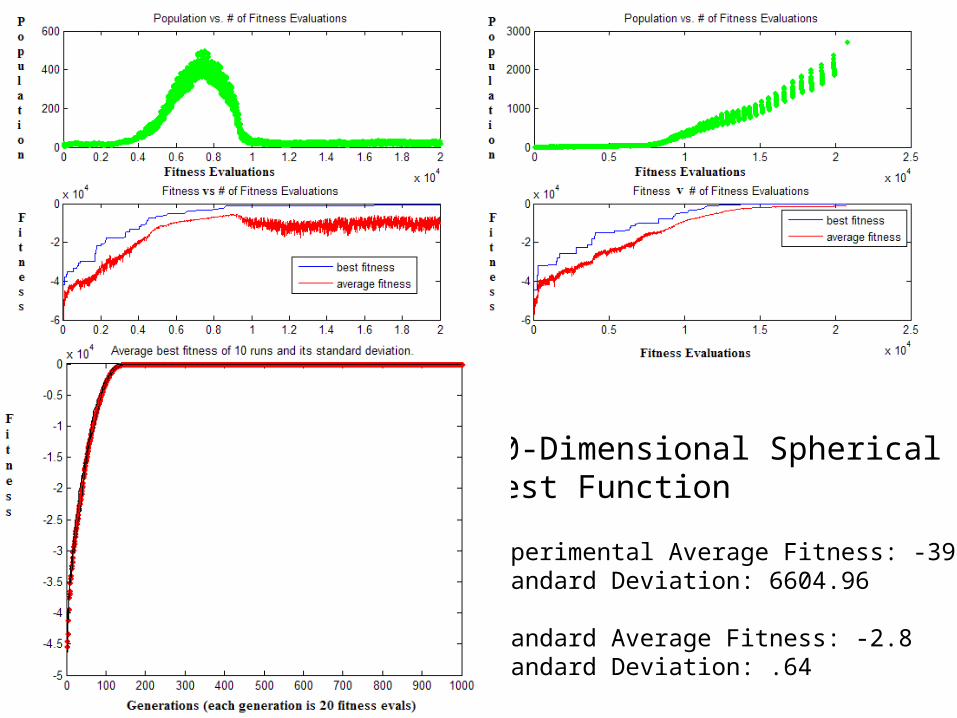
10-Dimensional Spherical Test Function
Experimental Average Fitness: -3946Standard Deviation: 6604.96
Standard Average Fitness: -2.8Standard Deviation: .64

Conclusions
• Performance is disappointing– Accuracy cannot keep up with standard algorithm
even on a simple problem
• Population cannot always recover from collapse due to premature convergence– Likely due to loss of genetic diversity
• Population dynamics are self-adaptive, so promise is shown, but not yet achieved
Future Work
• Rebuilding with a more efficient implementation for quicker data-taking
• Experiment with different mate-selection parameters for genetic diversity
• Try hard-set and heuristic-adjusted mutation rates
• Generally, continued analysis of causes for sub-optimal performance

Questions?
• “A man pushes a car up to a hotel and tells the owner he is bankrupt. Why?”
• “A man lies dead next to the rock that killed him. Why is his underwear visible?”
• “Fred and Gertrude lie dead amidst a puddle of water. Shards of broken glass are scattered everywhere. What killed them?”
• “Who is the greater inventor: Darwin for evolution, or Al Gore for the Internet?”

Answers!
• Now that would be telling, wouldn’t it?

4 Dimensions, First Run
0 0.5 1 1.5 2 2.5
x 104
0
1000
2000
3000
4000Population vs. # of Fitness Evaluations
0 0.5 1 1.5 2 2.5
x 104
-3
-2
-1
0x 10
4 Fitness fs. # of Fitness Evaluations
best fitness
average fitness
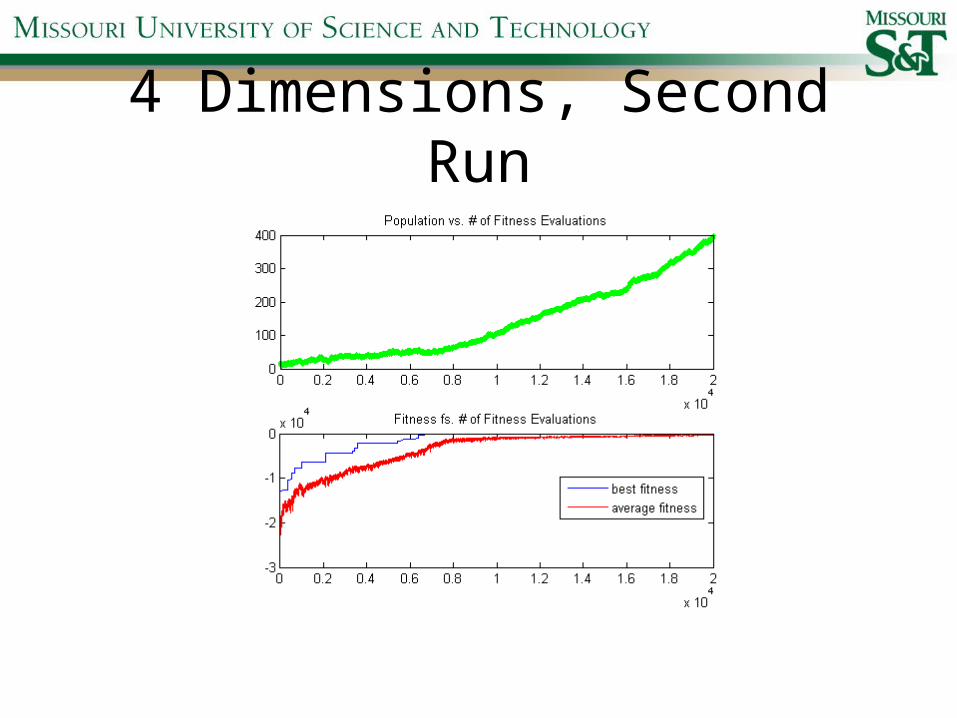
4 Dimensions, Second Run
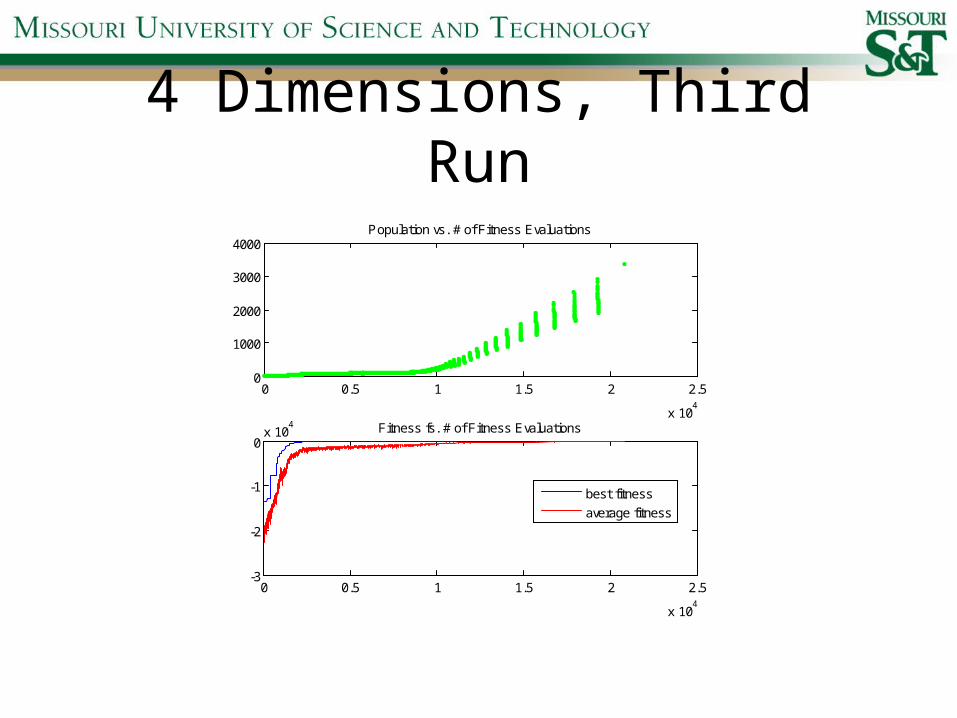
4 Dimensions, Third Run
0 0.5 1 1.5 2 2.5
x 104
0
1000
2000
3000
4000Population vs. # of Fitness Evaluations
0 0.5 1 1.5 2 2.5
x 104
-3
-2
-1
0x 10
4 Fitness fs. # of Fitness Evaluations
best fitness
average fitness
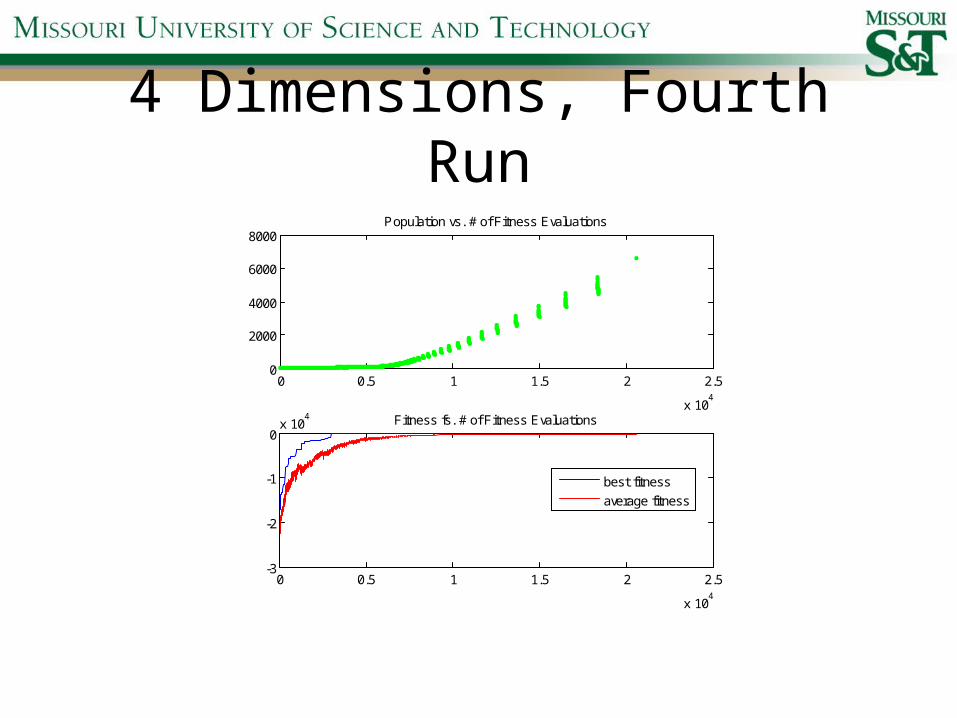
4 Dimensions, Fourth Run
0 0.5 1 1.5 2 2.5
x 104
0
2000
4000
6000
8000Population vs. # of Fitness Evaluations
0 0.5 1 1.5 2 2.5
x 104
-3
-2
-1
0x 10
4 Fitness fs. # of Fitness Evaluations
best fitness
average fitness

4 Dimensions, Fifth Run
0 0.2 0.4 0.6 0.8 1 1.2 1.4 1.6 1.8 2
x 104
0
200
400
600Population vs. # of Fitness Evaluations
0 0.2 0.4 0.6 0.8 1 1.2 1.4 1.6 1.8 2
x 104
-3
-2
-1
0x 10
4 Fitness fs. # of Fitness Evaluations
best fitness
average fitness
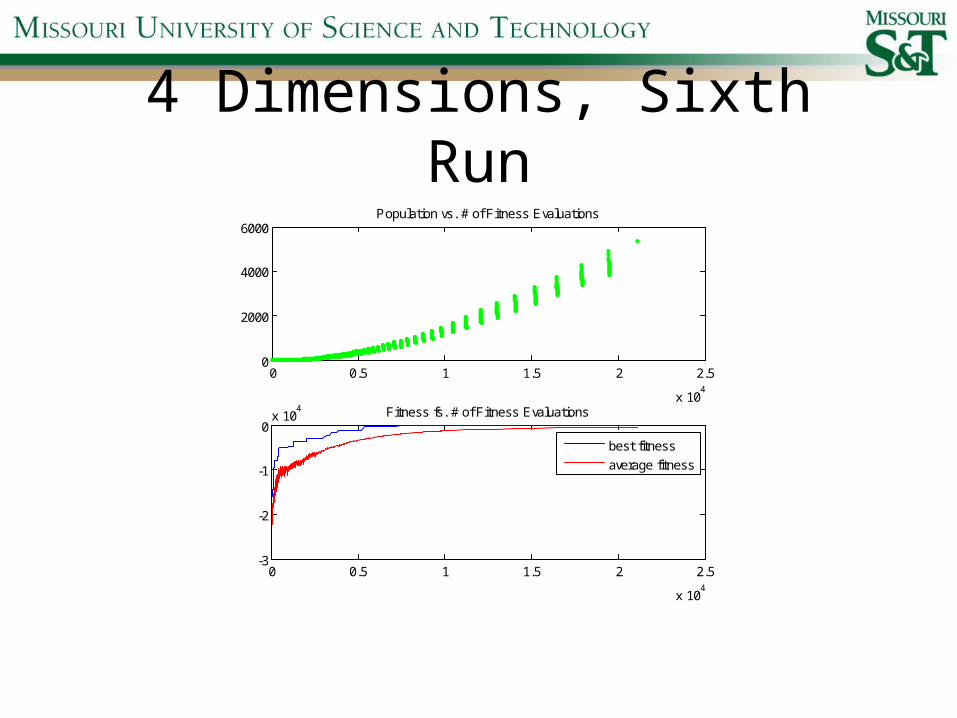
4 Dimensions, Sixth Run
0 0.5 1 1.5 2 2.5
x 104
0
2000
4000
6000Population vs. # of Fitness Evaluations
0 0.5 1 1.5 2 2.5
x 104
-3
-2
-1
0x 10
4 Fitness fs. # of Fitness Evaluations
best fitness
average fitness
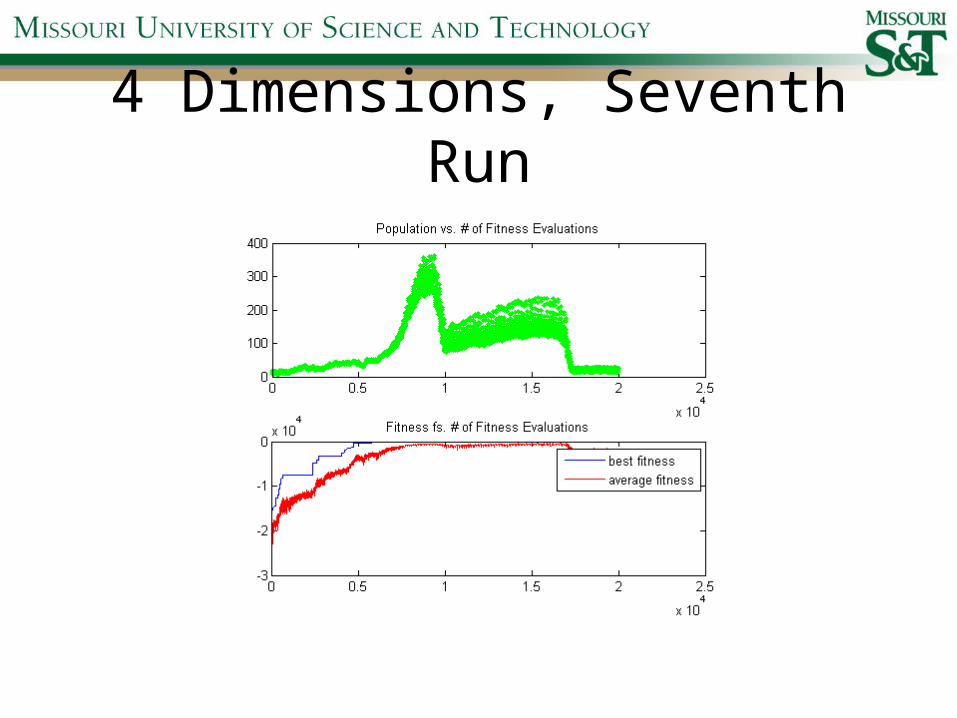
4 Dimensions, Seventh Run

4 Dimensions, Eighth Run
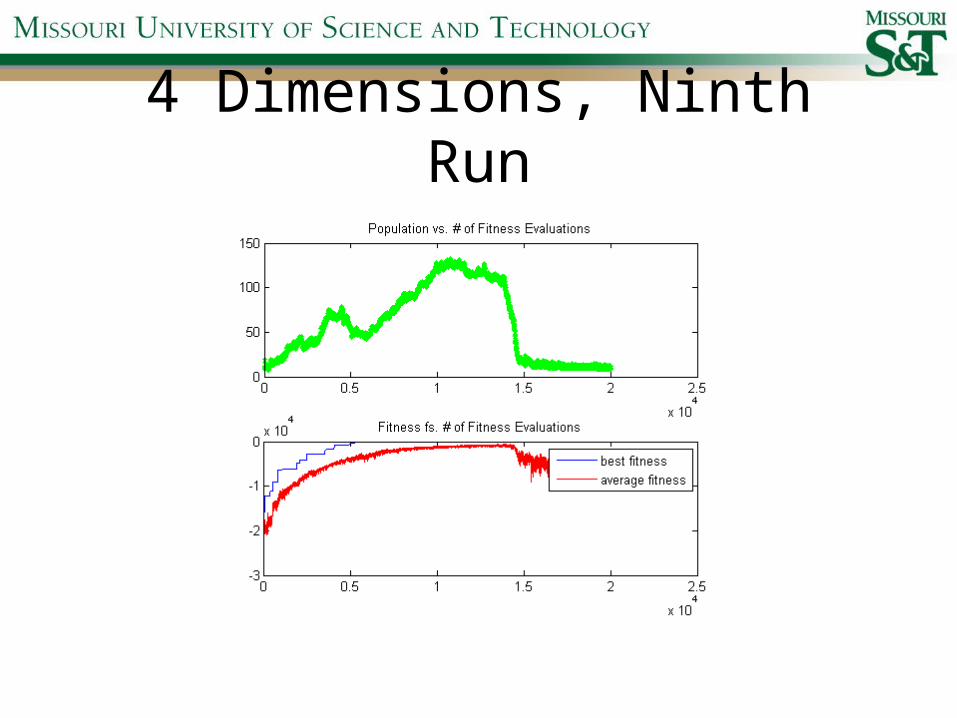
4 Dimensions, Ninth Run
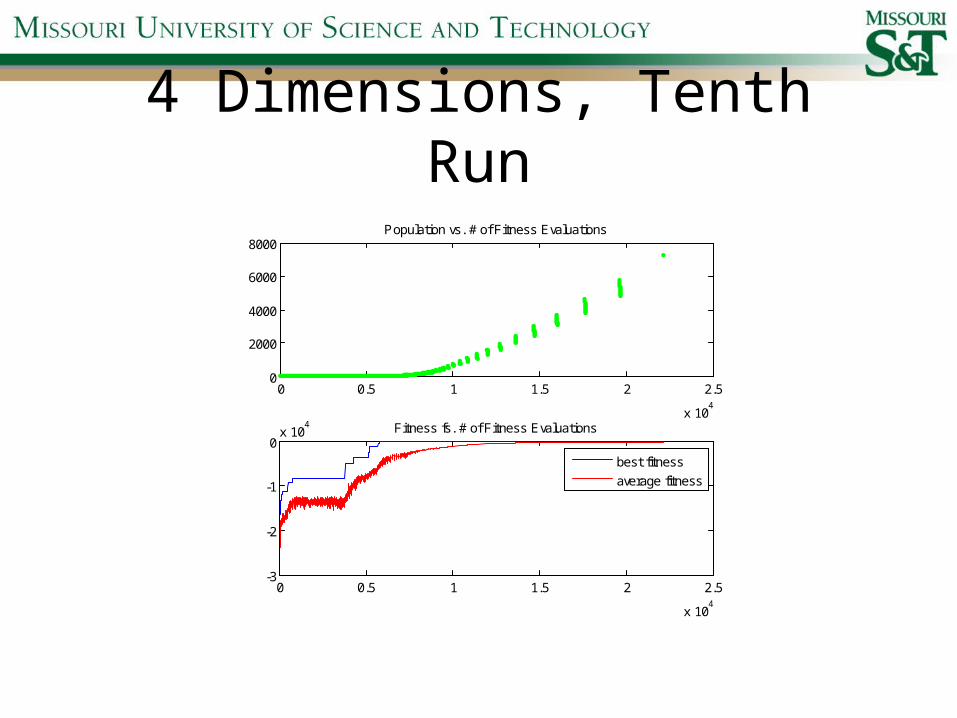
4 Dimensions, Tenth Run
0 0.5 1 1.5 2 2.5
x 104
0
2000
4000
6000
8000Population vs. # of Fitness Evaluations
0 0.5 1 1.5 2 2.5
x 104
-3
-2
-1
0x 10
4 Fitness fs. # of Fitness Evaluations
best fitness
average fitness
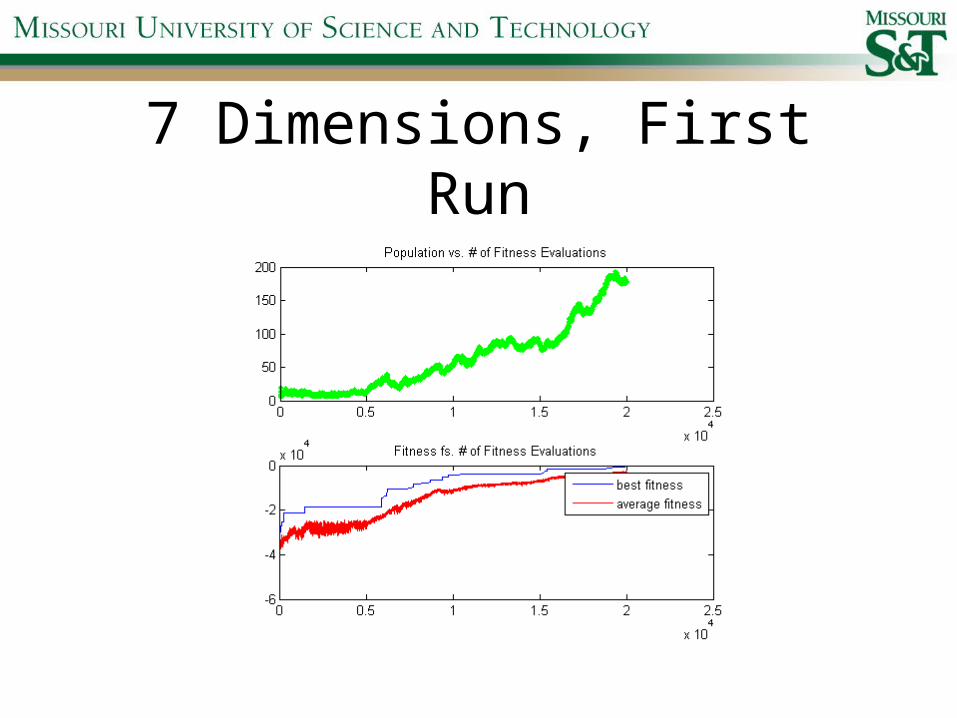
7 Dimensions, First Run
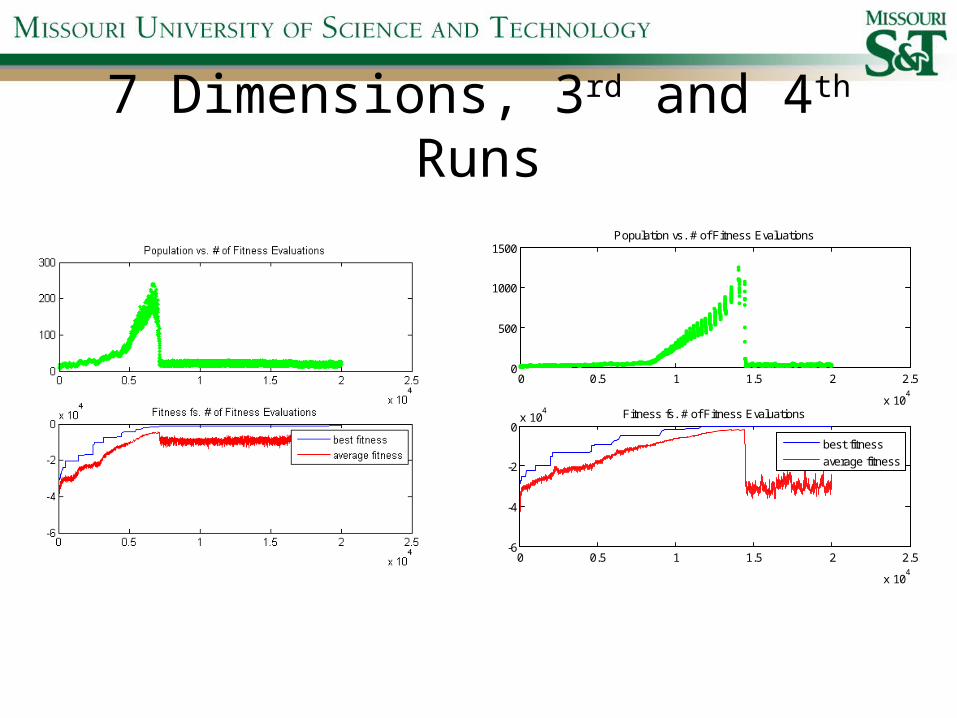
7 Dimensions, 3rd and 4th Runs
0 0.5 1 1.5 2 2.5
x 104
0
500
1000
1500Population vs. # of Fitness Evaluations
0 0.5 1 1.5 2 2.5
x 104
-6
-4
-2
0x 10
4 Fitness fs. # of Fitness Evaluations
best fitness
average fitness
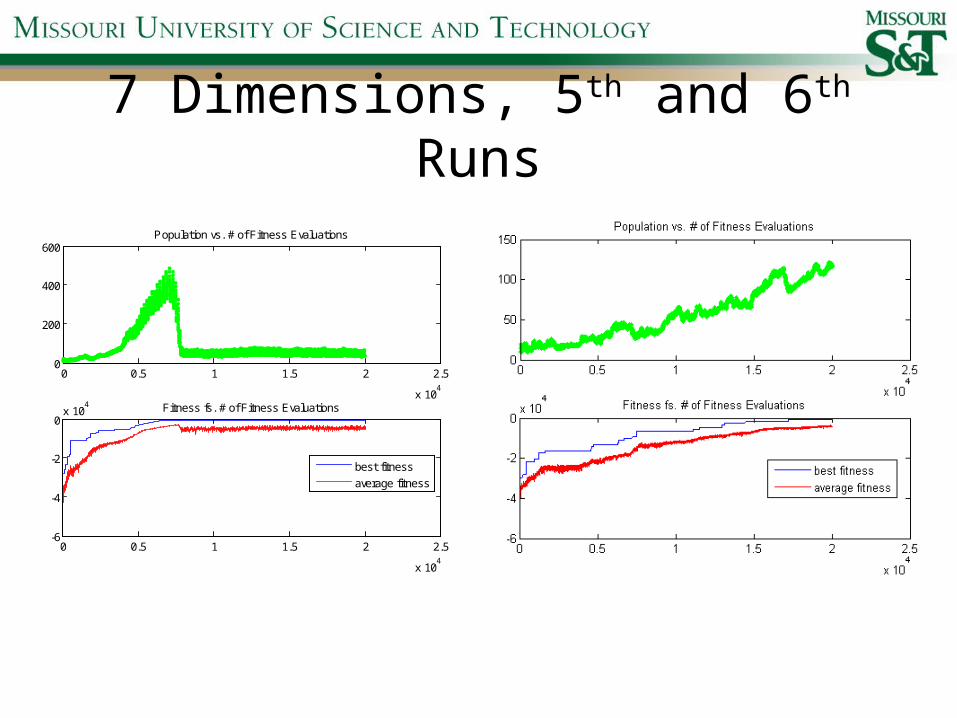
7 Dimensions, 5th and 6th Runs
0 0.5 1 1.5 2 2.5
x 104
0
200
400
600Population vs. # of Fitness Evaluations
0 0.5 1 1.5 2 2.5
x 104
-6
-4
-2
0x 10
4 Fitness fs. # of Fitness Evaluations
best fitness
average fitness
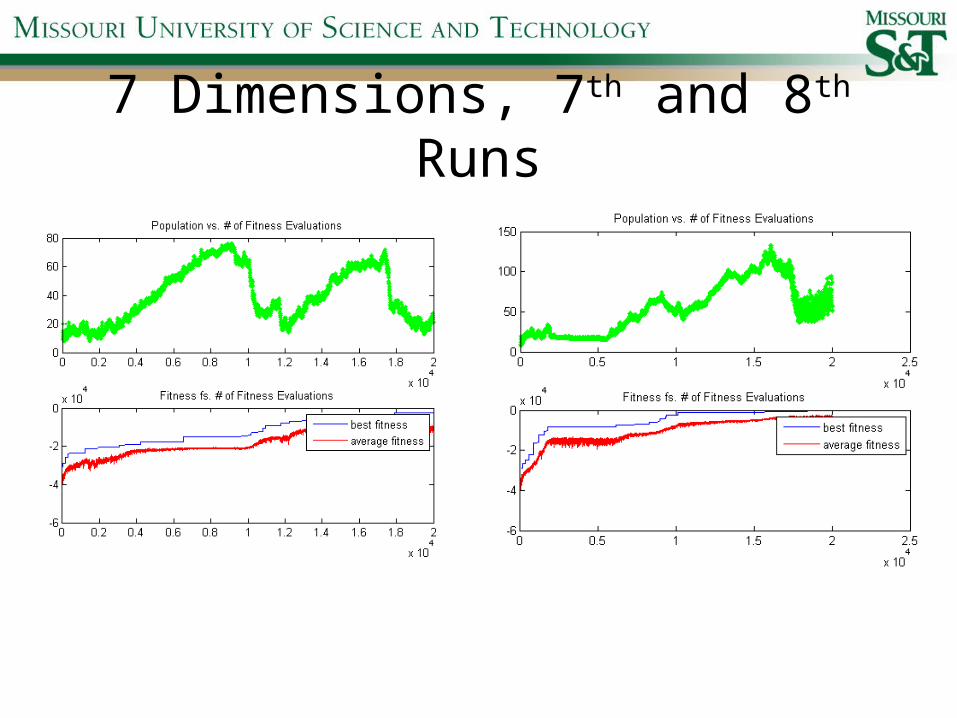
7 Dimensions, 7th and 8th Runs
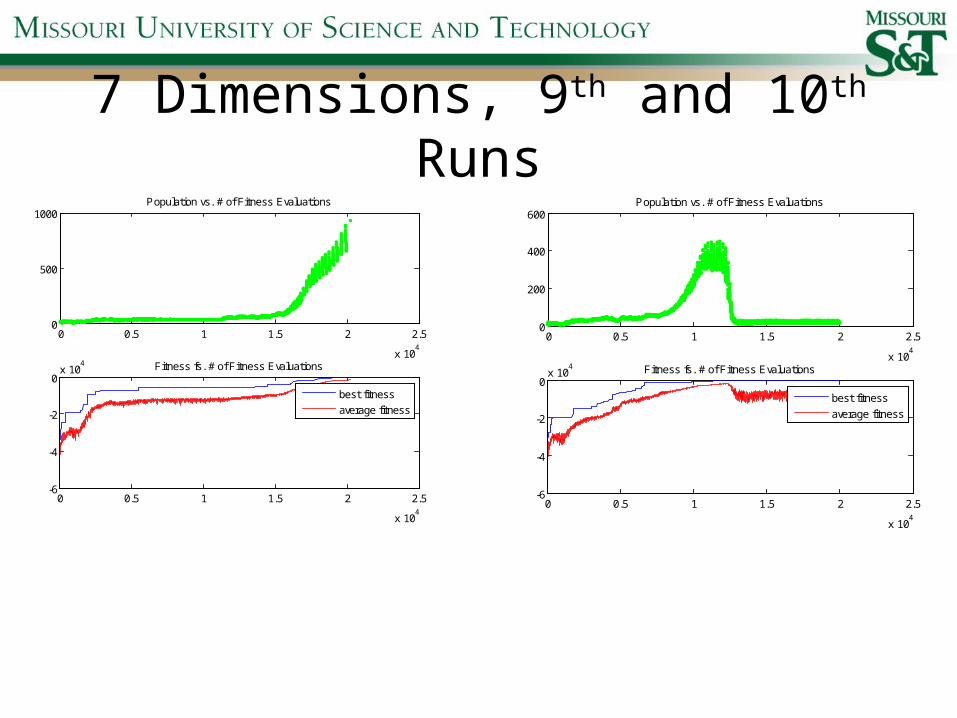
7 Dimensions, 9th and 10th Runs
0 0.5 1 1.5 2 2.5
x 104
0
500
1000Population vs. # of Fitness Evaluations
0 0.5 1 1.5 2 2.5
x 104
-6
-4
-2
0x 10
4 Fitness fs. # of Fitness Evaluations
best fitness
average fitness
0 0.5 1 1.5 2 2.5
x 104
0
200
400
600Population vs. # of Fitness Evaluations
0 0.5 1 1.5 2 2.5
x 104
-6
-4
-2
0x 10
4 Fitness fs. # of Fitness Evaluations
best fitness
average fitness

10 Dimensions, 1st and 2nd Runs
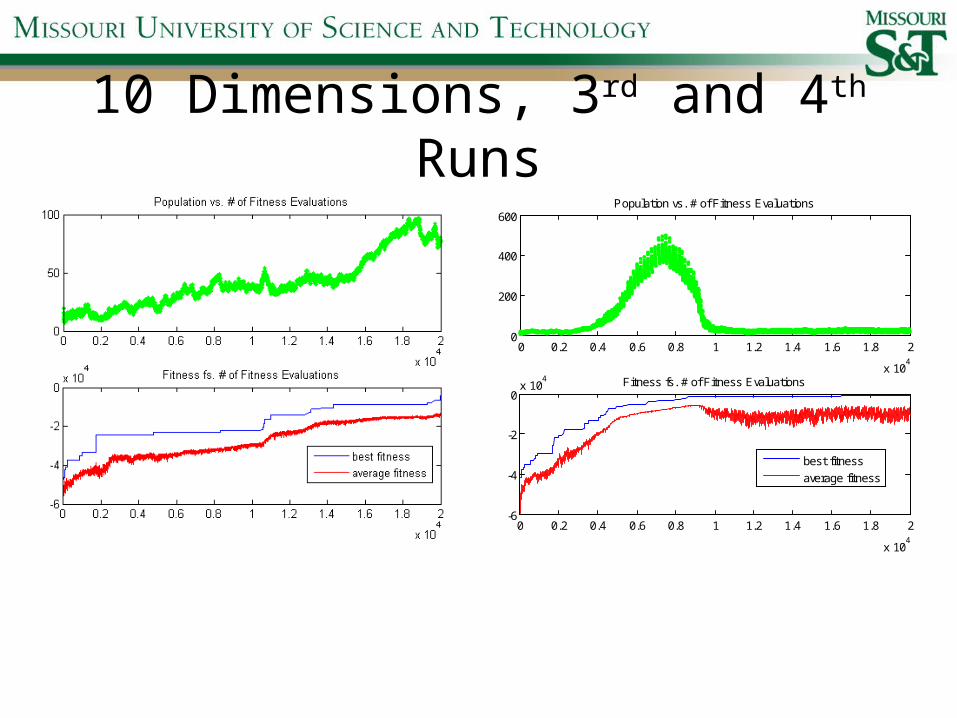
10 Dimensions, 3rd and 4th Runs
0 0.2 0.4 0.6 0.8 1 1.2 1.4 1.6 1.8 2
x 104
0
200
400
600Population vs. # of Fitness Evaluations
0 0.2 0.4 0.6 0.8 1 1.2 1.4 1.6 1.8 2
x 104
-6
-4
-2
0x 10
4 Fitness fs. # of Fitness Evaluations
best fitness
average fitness
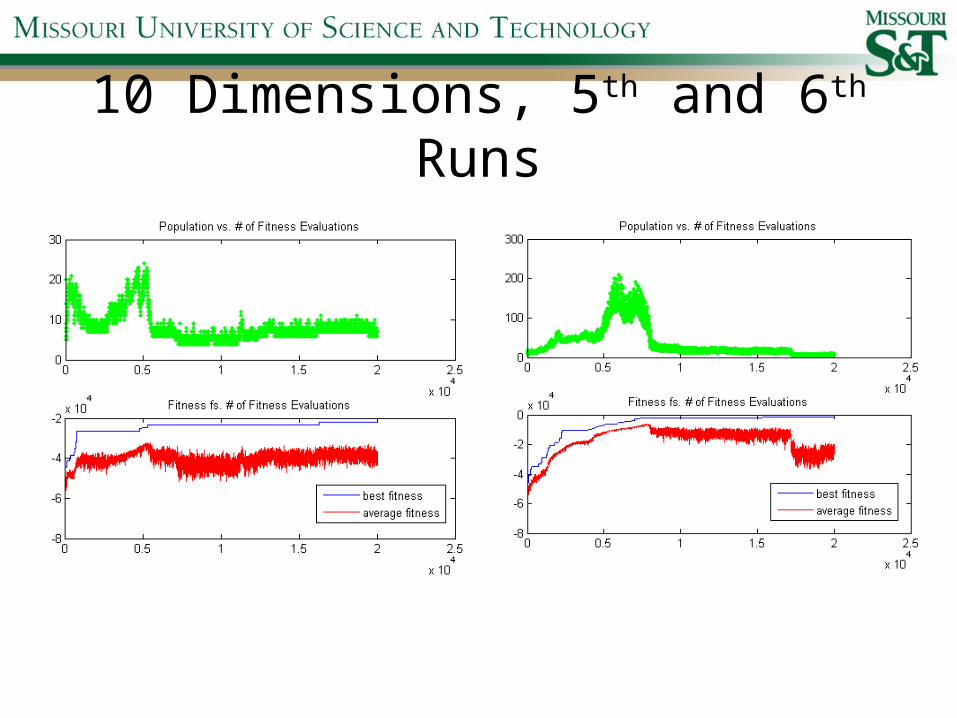
10 Dimensions, 5th and 6th Runs

10 Dimensions, 7th and 8th Runs
0 0.5 1 1.5 2 2.5
x 104
0
500
1000Population vs. # of Fitness Evaluations
0 0.5 1 1.5 2 2.5
x 104
-6
-4
-2
0x 10
4 Fitness fs. # of Fitness Evaluations
best fitness
average fitness
0 0.2 0.4 0.6 0.8 1 1.2 1.4 1.6 1.8 2
x 104
0
200
400
600Population vs. # of Fitness Evaluations
0 0.2 0.4 0.6 0.8 1 1.2 1.4 1.6 1.8 2
x 104
-8
-6
-4
-2
0x 10
4 Fitness fs. # of Fitness Evaluations
best fitness
average fitness

10 Dimensions, 9th and 10th Runs
0 0.5 1 1.5 2 2.5
x 104
0
1000
2000
3000Population vs. # of Fitness Evaluations
0 0.5 1 1.5 2 2.5
x 104
-6
-4
-2
0x 10
4 Fitness fs. # of Fitness Evaluations
best fitness
average fitness