gene ontology, david and over- representation analysis …_david_and_ora_-_lab.pdf · gene...
TRANSCRIPT
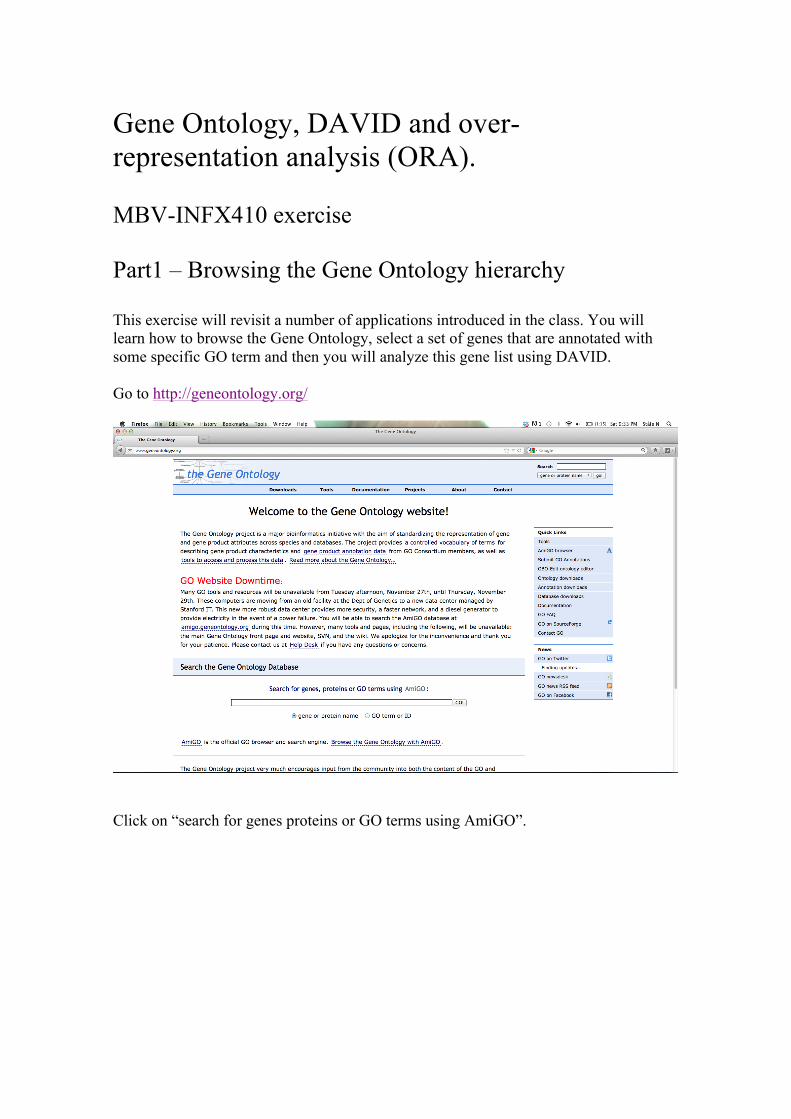
Gene Ontology, DAVID and over-representation analysis (ORA). MBV-INFX410 exercise Part1 – Browsing the Gene Ontology hierarchy This exercise will revisit a number of applications introduced in the class. You will learn how to browse the Gene Ontology, select a set of genes that are annotated with some specific GO term and then you will analyze this gene list using DAVID. Go to http://geneontology.org/
Click on “search for genes proteins or GO terms using AmiGO”.

Spend some time browsing through each of the three GO Ontologies. Look for terms that you are familiar with and see how they relate to terms above (parent terms) and below (child terms) in the GO.
Try to make your way to the term that describes “nuclear part” without directly searching for it. Instead, start by expanding the cellular_component “root node” (GO:0005755) by clicking on the + beside it. Look for the next closest thing to “nucleus” in the expanded list and then click on that. If you want to look at the definition of any given term, just click on it. If you cant find the term entry for “nucleus”, use the next page as a hint or search for nucleus in the “Search GO” box at the top of the interface.

Once you make it to the “nucleus”, keep navigating down the tree to chromatin assembly complex (GO:0005678). This term is actually used to refer to a number of complexes (try expanding the term). What are these complexes? Note that all of them are “leaf” nodes (you cant expand them any further).
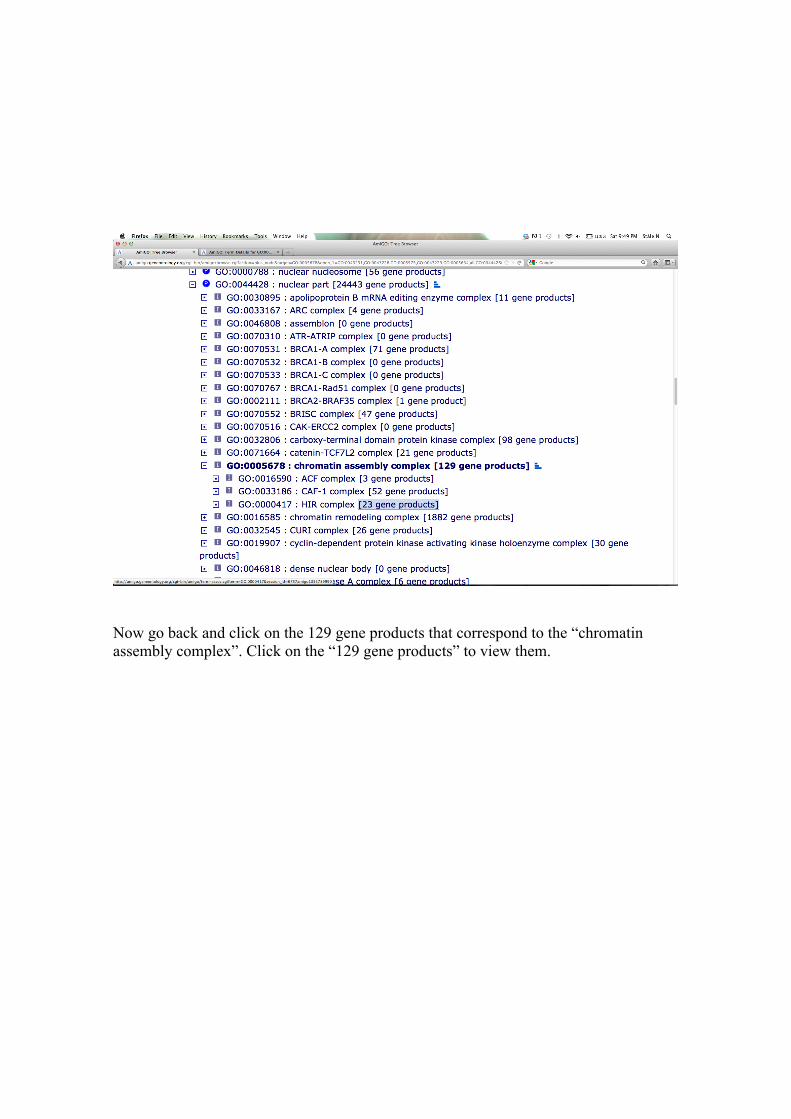
Now go back and click on the 129 gene products that correspond to the “chromatin assembly complex”. Click on the “129 gene products” to view them.

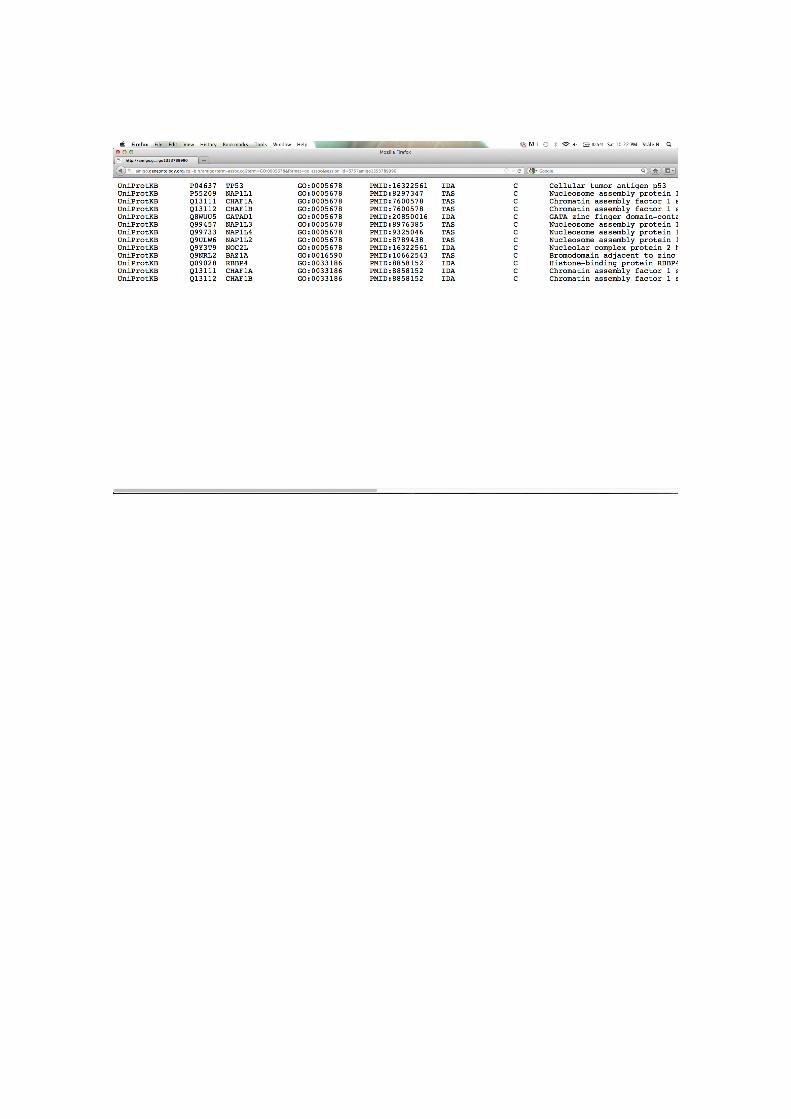
Spend some time browsing the links from this page (or just hovering over them). Scroll down. Genes annotated with each of the three leaf terms are grouped separately on the page. What kinds of evidence are provided for these assignments. What kinds might you be cautious of (less likely to believe) or more likely to believe? Who assigns these GO terms to the genes? Try filtering the list using the filters at the top. Make selections from the menus (Gene Product Type, Data source, Species and Evidence code and then click “Set filters”. Next, try to export your results for all genes from all data sources from human (Homo sapiens) that have any evidence code. Set filters and then click on “Download all association information in gene association format”.

Part 2 – Overrepresentation analysis using DAVID Go to http://david.abcc.ncifcrf.gov/home.jsp and click on “Functional annotation”
Paste the list of differentially expressed genes from the microarray exercise, stored in the file” bcr_abl-‐vs-‐normal-‐diff-‐genes.txt”:

Then tell DAVID that you have entered official gene symbols. Like this:
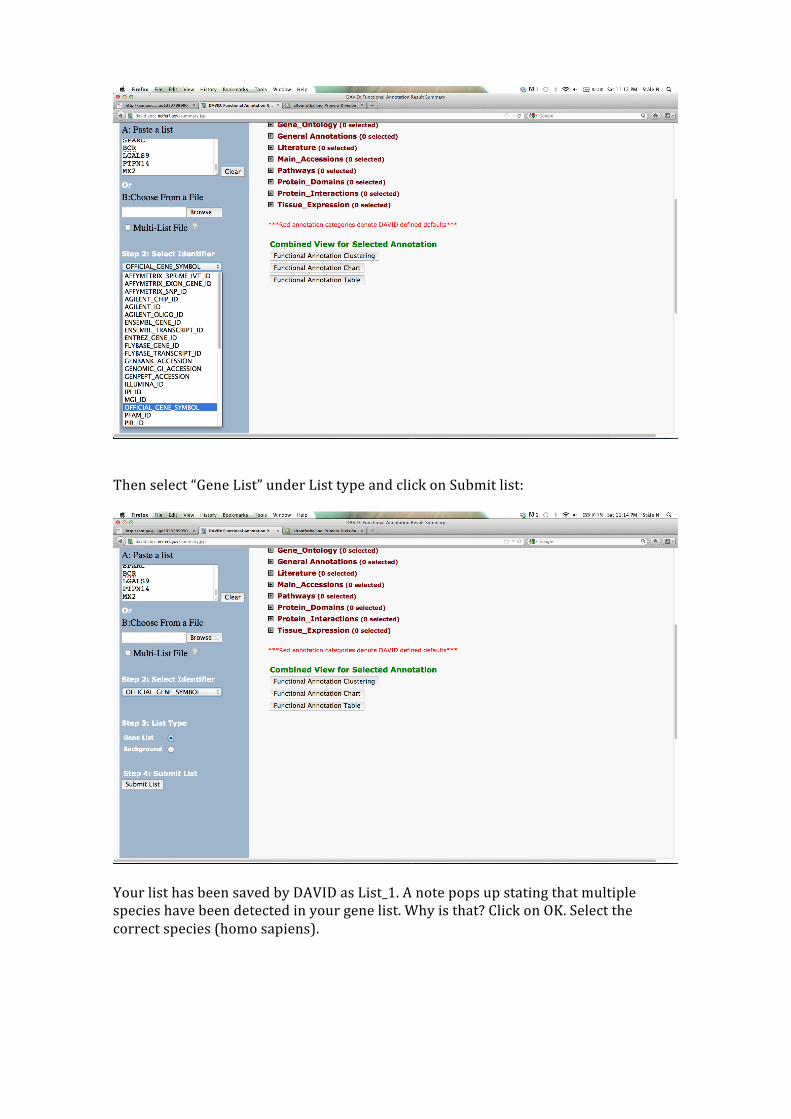
Then select “Gene List” under List type and click on Submit list:
Your list has been saved by DAVID as List_1. A note pops up stating that multiple species have been detected in your gene list. Why is that? Click on OK. Select the correct species (homo sapiens).
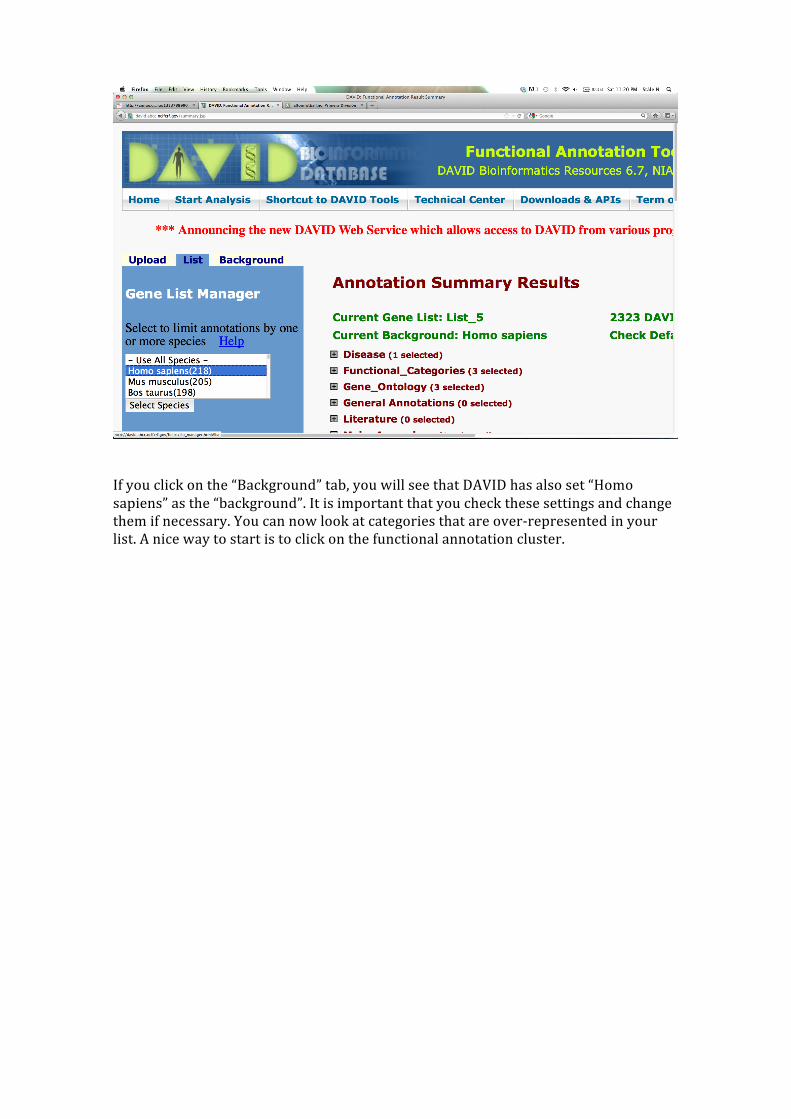
If you click on the “Background” tab, you will see that DAVID has also set “Homo sapiens” as the “background”. It is important that you check these settings and change them if necessary. You can now look at categories that are over-‐represented in your list. A nice way to start is to click on the functional annotation cluster.

Try to interpret the different functional clusters. Explore the results a little: Find the (differentially expressed) genes within various functional categories. Find a KEGG pathway (e.g. apoptosis). A nice feature is that the genes in your list (the differentially expressed genes) are highlighted (with red stars) in the pathway representation:
