genentech business · pdf filegenentech business development ... pharmaceuticals, for...
TRANSCRIPT
G E N E N T E C H B U S I N E S S D E V E L O P M E N T
A third component of
Genentech’s four-point
strategy for growth is to
continue to accelerate the
pace of forming strategic
alliances. Significant new
alliances made in 1996
and early 1997, and key
progress made within ear-
lier alliances, show how
well planned partnerships
with the right fit can con-
tribute significantly to
Genentech’s success.

35
From new technologies, to new products, to new avenues for Genentech
science, Genentech’s partners in business build on the company’s
existing strengths
Genentech’s strategy for business development is to access partners’ resources that
build on Genentech’s strengths. Genentech has a clear, three-pronged approach:
First, the company seeks to license late-stage products that can augment its product
portfolio and contribute to rev-
enues near term. An example is
Genentech’s collaboration with
IDEC to develop IDEC’s C2B8
antibody. Another is the agree-
ment with Roche for Genentech
to promote Roferon-A in the
United States for its approved
cancer indications.
Second, Genentech partners with
companies to access emerging
technologies. Genentech’s
relationship with Incyte
Pharmaceuticals, for example, provides access to a powerful DNA sequence and gene
expression database. And a relationship with Baxter Healthcare Corporation combines
Genentech’s understanding of Factor VIII* with Baxter’s experience in cellular therapy.
Third, Genentech seeks partnerships to realize the value of its own promising prod-
ucts it chooses not to develop itself. With the wealth of products from Genentech’s
discovery research efforts, these relationships are essential to help keep Genentech
scientists motivated and ensure promising new medicines are developed. Two exam-
ples are Genentech’s anti-CD11a antibody (hu1124), for which XOMA is developing
the manufacturing process necessary to support development and is conducting
clinical trials, and the anti-CD18 antibody, for which Roche is conducting clinical trials,
each in collaboration with Genentech. Through such relationships, Genentech mini-
mizes the impact on its clinical resources yet maintains significant product rights.
P a r t n e r i n g f o r S u c c e s s
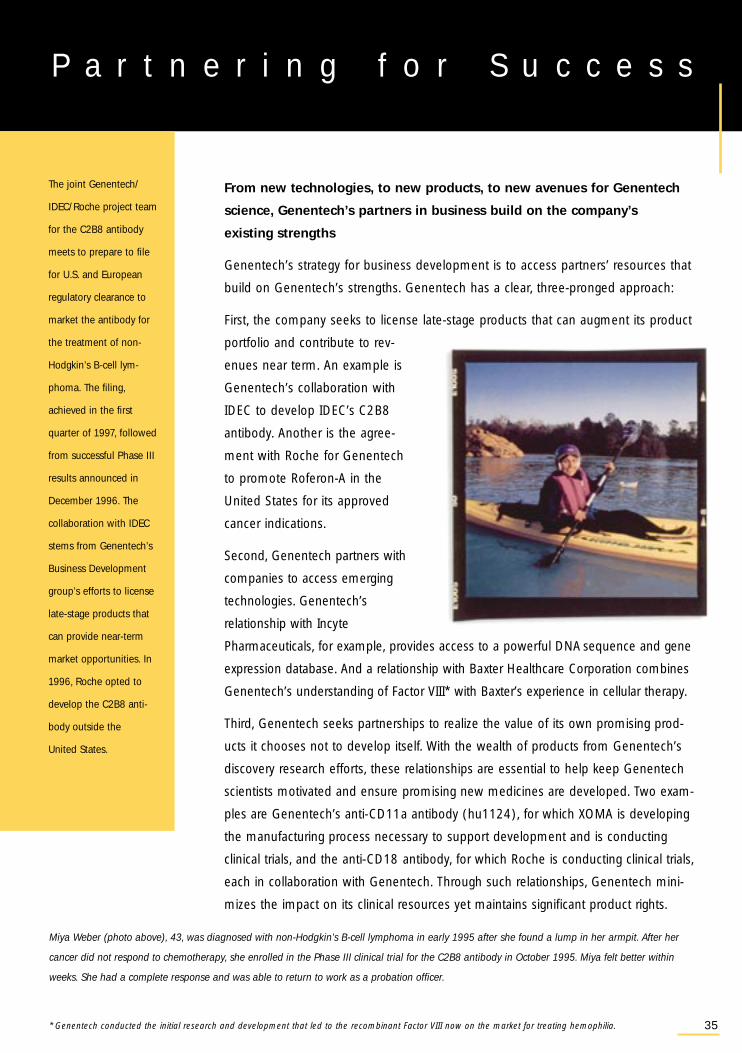
Miya Weber (photo above), 43, was diagnosed with non-Hodgkin’s B-cell lymphoma in early 1995 after she found a lump in her armpit. After her
cancer did not respond to chemotherapy, she enrolled in the Phase III clinical trial for the C2B8 antibody in October 1995. Miya felt better within
weeks. She had a complete response and was able to return to work as a probation officer.
* Genentech conducted the initial research and development that led to the recombinant Factor VIII now on the market for treating hemophilia.
The joint Genentech/
IDEC/Roche project team
for the C2B8 antibody
meets to prepare to file
for U.S. and European
regulatory clearance to
market the antibody for
the treatment of non-
Hodgkin’s B-cell lym-
phoma. The filing,
achieved in the first
quarter of 1997, followed
from successful Phase III
results announced in
December 1996. The
collaboration with IDEC
stems from Genentech’s
Business Development
group’s efforts to license
late-stage products that
can provide near-term
market opportunities. In
1996, Roche opted to
develop the C2B8 anti-
body outside the
United States.

36
Alkermes — collaboration involving the development
of a sustained release formulation of Genentech’s
human growth hormone.
Baxter — collaboration to jointly develop encapsu-
lated cell therapy for hemophilia A.
Boehringer Ingelheim — collaboration to jointly
develop TNK for treatment of acute myocardial
infarction.
Cambridge Antibody Technology — collaborative
research agreement based on CAT antibody
engineering technology.
Connective Therapeutics — agreements for
Connective to develop relaxin for the treatment of
connective tissue disorders and other indications,
and to develop interferon gamma to treat certain
dermatological diseases.
CytoTherapeutics — collaborative agreement to
develop neurotrophic factors in CytoTherapeutics’ cell
encapsulation technology to treat certain neurodegen-
erative diseases.
Genetics Institute — agreement to provide
Genentech with access to the DiscoverEase™ library
of secreted proteins.
Hoechst AG — collaboration to develop small
molecule vitronectin receptor antagonists for treat-
ment of chronic bone disorders.
IDEC Pharmaceuticals — collaboration to jointly
develop IDEC’s anti-CD20 monoclonal antibodies for
the treatment of non-Hodgkin’s B-cell lymphomas.
Immunex — exclusive license to Genentech for the
LERK proteins for neurobiology uses.
Incyte Pharmaceuticals — agreement providing
Genentech access to Incyte’s LifeSeq® DNA sequence
and gene expression database.
Massachusetts General Hospital — collaborative
research agreement for basic developmental research
conducted at the hospital’s Cardiovascular Research
Center through studies of zebrafish.
Novartis/Tanox — agreement to develop and
commercialize anti-IgE monoclonal antibodies.
Roche — collaborations include: promoting of
Roferon®-A for oncology indications, developing
Genentech’s anti-CD18 monoclonal antibody for
treatment of hemorrhagic shock, manufacturing a
TNF-receptor fusion protein being studied by Roche,
and small molecule discovery collaborations focusing
on antagonists to IIb/IIIa, LFA/ICAM, VLA 4/VCA M,
and certain coagulation targets.
Scios — collaboration agreement for the development
of Auriculin® anaritide for the treatment of oliguric
acute renal failure.
Sensus — agreement for Sensus to develop growth hor-
mone antagonists for treating certain growth disorders.
Tularik — agreement for Tularik to develop novel
human therapeutics based on transcription factors.
VaxGen (formerly GenenVax) — agreement for
VaxGen to develop gp120, a potential prophylactic
AIDS vaccine.
Washington University — exclusive licensing
agreement for neurturin, a protein which is believed
to promote nerve cell growth and protect certain
nerve cells against damage.
Xenova — joint discovery and development program
for small molecules in the cardiovascular, growth
control, inflammation and autoimmune disease areas.
XOMA — collaborative agreement to jointly develop
Genentech’s anti-CD11a monoclonal antibody for
treatment of psoriasis and organ transplant rejection.
G e n e n t e c h ’ s P a r t n e r s
Genentech’s collaborations include:
5
GEN ENTECH B US I N ESS H IGH L IGHTSI N 1996 AN D EAR LY 1997
Corporate
• 1996 earnings: $118.3 million, or 96 cents
per share. 1996 revenues: $968.6 million.
• A Delaware Chancery Court approved the
settlement of a consolidated stockholder
class action lawsuit filed following the
1995 announcement of an extended buy-
out option by Roche, which stockholders
approved in October 1995. In the settle-
ment, Roche agreed to an increase in the
redemption prices for Genentech’s stock
by 50 cents each quarter, with a final
redemption price of $82.50 in the quarter
ending June 30, 1999, if Roche causes the
redemption of the remaining Genentech
stock under the extended buyout option.
• Celebrated 20th anniversary since
Genentech’s founding by Herbert W.
Boyer, Ph.D. and Robert A. Swanson.
• Roche exercised its options, per
Genentech’s 1995 arrangement with
Roche, to develop the following
Genentech development products outside
the United States: IDEC’s C2B8 mono-
clonal antibody, insulin-like growth factor-I
(IGF-I), and nerve growth factor (NGF).
• Completed a new 42,000-square-foot
building to provide three floors of
research labs and offices for Cell
Culture/Fermentation R&D groups.
• Named J. Richard Munro as chairman of
the board of directors following cofounder
Robert A. Swanson’s retirement as
chairman and from the board.
• Filed an amended complaint alleging that
Novo-Nordisk infringes five Genentech
patents in the manufacture and sale of
Novo’s recombinant human insulin prod-
uct, Novolin®, in the United States.
Marketed Products
Activase® (Alteplase, recombinant)
• 1996 Activase sales: $284.1 million.
• Reached a record thrombolytic market
share of approximately 80 percent.
• Received U.S. regulatory clearance to mar-
ket Activase for the treatment of eligible
adult patients with acute ischemic stroke
within three hours of symptom onset.
• The American Heart Association, the
American Academy of Neurology and the
National Institutes of Health issued guide-
lines or proposed standards identifying
stroke as a medical emergency and
recommending that eligible patients—
following appropriate screening—be treat-
ed with Activase to enhance their chances
of recovering with no or minimal disability.
B u s i n e s s H i g h l i g h t s

• Filed a patent infringement suit against
Boehringer Mannheim in the United
States and Germany that alleges its
thrombolytic agent, Reteplase, infringes
several Genentech patents.
• Reached an out-of-court settlement with
Sumitomo Pharmaceuticals in Japan on a
seven-year patent dispute over t-PA, for
which Sumitomo agreed to halt the man-
ufacturing and marketing of the drug in
exchange for Genentech foregoing
demands related to damages.
Protropin® (somatrem for injection),
Nutropin® [somatropin (rDNA origin)
for injection] and Nutropin AQ™
[somatropin (rDNA origin) injection]
growth hormones
• 1996 growth hormone sales: $218.2 million.
• Maintained a two-thirds market share in
growth hormone market despite new
competition.
• Received U.S. regulatory clearance to market
Nutropin for the treatment of short stature
associated with Turner syndrome.
• Received Canadian regulatory approval to
market Nutropin for the treatment of growth
hormone inadequacy in children and growth
failure resulting from chronic renal insuffi-
ciency. Roche has the right to market
Nutropin in Canada.
• Filed for U.S. regulatory clearance to market
Nutropin for the treatment of growth hor-
mone inadequacy in adults.
Pulmozyme®
(dornase alfa) Inhalation Solution
• 1996 Pulmozyme sales: $76.0 million.
• Received U.S. regulatory clearance to
market Pulmozyme for the management
of cystic fibrosis patients with advanced
disease.
Actimmune® (Interferon gamma-1b)
• 1996 Actimmune sales: $4.5 million.
• Discontinued pursuing Actimmune for
renal cell carcinoma after analysis of
Phase III clinical data showed no signifi-
cant benefit of the product for this
targeted indication.
Business Development
• Entered into an agreement with Roche
under which Genentech will promote
Roche’s Roferon®-A (Interferon alfa-2a,
recombinant) in the United States for its
approved oncology indications.
• With Tanox Biosystems, Inc. and Novartis
Pharmaceuticals Corporation, settled law-
suits related to the development of anti-
IgE antibodies. Also, reached an agree-
ment under which Genentech and
Tanox/Novartis combined their existing
anti-IgE antibody programs under a
cross-licensing program in a cooperative
development effort.
6
7
• Expanded collaborative agreement with
IDEC to include the clinical development
and commercialization of the Y2B8 anti-
body, currently in Phase I/II clinical trials,
as a potential complementary treatment
for non-Hodgkin’s B-cell lymphoma.
• Agreed with CytoTherapeutics, Inc. to
develop treatments for various neuro-
degenerative diseases using
CytoTherapeutics’ encapsulated cell
technology to deliver several of
Genentech’s proprietary growth factors.
• Agreed with XOMA Corporation for XOMA
to develop Genentech’s anti-CD11a anti-
body (hu1124) for the treatment of
psoriasis and organ transplant rejection.
• Agreed with the Biotech Group of Baxter
Healthcare Corporation to jointly develop
a cellular therapy for hemophilia A.
• Agreed to invest in VaxGen, Inc. (formerly
Genenvax), created to expand develop-
ment of gp120, Genentech’s potential
vaccine for the prevention of HIV-1 infec-
tion. Genentech provided VaxGen exclu-
sive rights to gp120.
• Entered into an agreement with
Genetics Institute, Inc. to gain access to
its DiscoverEase™ protein development
platform.
• Entered into an agreement with Incyte
Pharmaceuticals, Inc. to gain access to its
LifeSeq® DNA sequence and gene expres-
sion database.
• Entered a collaborative agreement with
Massachusetts General Hospital for basic
developmental research conducted at the
hospital’s Cardiovascular Research Center
through studies of zebrafish.
Research and Development
• Genentech’s partner, IDEC
Pharmaceuticals, completed Phase III
clinical trials of the C2B8 antibody for the
treatment of non-Hodgkin’s B-cell lymph-
oma and submitted regulatory filings
seeking marketing clearance in the first
quarter of 1997.
• Completed Phase II trials of NGF for dia-
betic peripheral neuropathy, which sug-
gested initial safety and efficacy. Began
planning for approval-directed Phase III
clinical trials anticipated to begin in the
first half of 1997.
• Completed Phase II clinical trials utilizing
IGF-I as an adjunct to insulin therapy in
patients with Type I and Type II diabetes.
• Completed a Phase II clinical trial with an
oral IIb/IIIa antagonist, designed in collab-
oration with Roche, in patients with acute
coronary syndrome. Preparing for pivotal
Phase III trials.
• In collaboration with Alkermes, Inc., began
Phase I/II clinical trials of ProLease®
human growth hormone, a sustained-
release growth hormone product, in chil-
dren with growth hormone inadequacy.

8
• Began Phase I clinical trials of vascular
endothelial growth factor (VEGF) for the
treatment of coronary arterial disease.
• Filed an investigational new drug applica-
tion (IND) and began preparations for a
Phase I trial of an anti-VEGF antibody for
the treatment of several types of cancer.
• Roche began a Phase I trial to investigate
Genentech’s anti-CD18 antibody for the
treatment of hemorrhagic shock.
• XOMA began a Phase I safety trial of
Genentech’s anti-CD11a antibody
(hu1124) in patients with psoriasis and
filed an IND to test this antibody in the
clinic in renal transplant patients to pre-
vent rejection of the grafted kidney.
Corporate Responsibility
• Provided more than $23 million worth of
pharmaceuticals free of charge in 1996
through various programs for un- or under-
insured patients in the United States.
• Decided to continue to fund Access
Excellence—a nationwide electronic forum
for high school biology teachers.
• Funded the independent Genentech
Foundation for Growth and Development,
which supports research in the area of
human growth and development.
• Donated approximately $7 million for
scientific research through medical and
academic research organizations and
hospital groups.
• For the seventh time, Genentech was
named one of the top 100 companies
for working mothers by Working Mother
magazine.

Herbert W. Boyer, Ph.D.Retired Professor of Biochemistryand Biophysics,University of California,San Francisco
Jürgen Drews, M.D.President of Global Researchand a member of theExecutive Committee,the Roche Group,a research-basedhealth care company
Franz B. Humer, Ph.D.Chief Operating Officerand Head of thePharmaceuticals Divisionand a member of theExecutive Committee,F. Hoffmann-La Roche, Ltd.,a research-basedhealth care company
Arthur D. Levinson, Ph.D.Presidentand Chief Executive Officer,Genentech, Inc.
Linda Fayne LevinsonPresidentFayne Levinson Associates,a general managementconsulting firm
J. Richard MunroChairman of the Board,Genentech, Inc.,and a member of the Board,Time-Warner, Inc., a mediaand entertainment company
Donald L. MurfinGeneral Partner,Chemicals & MaterialsEnterprise Associates, L.P.,a venture capital firm
John T. Potts, Jr., M.D.Distinguished Jackson Professorof Clinical Medicine andDirector of Research,Massachusetts General Hospital
C. Thomas Smith, Jr.Presidentand Chief Executive Officer,VHA, Inc., a national alliancerepresenting more than 1,400health care organizations
David S. Tappan, Jr.Retired Chairmanand Chief Executive Officer,Fluor Corporation,an international engineeringand construction company
Philip W. Berman, Ph.D.Process Sciences
Thomas A. Bewley, Ph.D.Process Sciences
Tim Gregory, Ph.D.Process Sciences
Robert D. Hershberg, Ph.D.Process Sciences
Andrew J. S. Jones, D. Phil.Process Sciences
Anthony A. Kossiakoff, Ph.D.Research
Laurence A. Lasky, Ph.D.Research
Jennie P. Mather, Ph.D.Research
Arnon Rosenthal, Ph.D.Research
Timothy A. Stewart, Ph.D.Research
James R. Swartz, D.Sc.Process Sciences
Gordon A. Vehar, Ph.D.Research
James A. Wells, Ph.D.Research
William I. Wood, Ph.D.Research
B O A R D O F D I R E C TO R S S TA F F S C I E N T I S TS
Actimmune, Activase, Nutropin, Protropin and Pulmozyme are registered trademarks and Nutropin AQis a trademark of Genentech, Inc. Auriculin is a registered trademark of Scios Inc. DiscoverEase is aregistered trademark of Genetics Institute, Inc. LifeSeq is a registered trademark of IncytePharmaceuticals, Inc. Novolin is a registered trademark of Novo-Nordisk A/S. ProLease is a registeredtrademark of Alkermes, Inc. Roferon is a registered trademark of Hoffmann-La Roche, Inc.

Copyright 1997, Genentech, Inc.
C This report is printed on recycled paper.
Arthur D. Levinson, Ph.D.*President andChief Executive Officer
John P. McLaughlin*Executive Vice Presidentand Secretary
William D. Young*Executive Vice President
Judy Heyboer*Senior Vice President—Human Resources
Louis J. Lavigne, Jr.*Senior Vice Presidentand Chief Financial Officer
David Roche*Senior Vice President—Sales and Marketing
Robert ArathoonVice President—Process Sciences
Joffre B. Baker, Ph.D.Vice President—Research Discovery
Gregory BairdVice President—Corporate Communications
David W. BeierVice President—Government Affairs
Robert Garnick, Ph.D.Vice President—Quality
Marty GlickVice President—Finance—Tax and Treasury
Bradford S. GoodwinVice President—Finance and Controller
Susan D. Hellmann, M.D., M.P.H.*Vice President—Medical Affairs and Chief Medical Officer
Dennis J. Henner, Ph.D.*Vice President—Research
Paul F. HohenschuhVice President—Manufacturing
Paula Jardieu, Ph.D.Vice President—Pharmacological Sciences
Edmon R. JenningsVice President—Corporate Development
Stephen JuelsgaardVice President, General Counseland Assistant Secretary
Cynthia J. LaddVice President—Corporate Law
Ted W. Love, M.D.Vice President—Product Development
M. David MacFarlane, Ph.D.Vice President—Regulatory Affairs
Polly Moore, Ph.D.Vice President—Information Resources
James P. PanekVice President—Engineering and Facilities
Kim PopovitsVice President—Sales
Nicholas J. SimonVice President—Business andCorporate Development
David C. Stump, M.D.Vice President—Clinical Researchand Genentech Fellow
Daniel SpiegelmanTreasurer
O F F I C E R S
Arthur D. Levinson, Ph.D.
John P. McLaughlin
William D. Young
Judy Heyboer
Louis J. Lavigne, Jr.
David Roche
Susan D. Hellmann, M.D., M.P.H.
Dennis J. Henner, Ph.D.* Member of Executive Committee
Des
igne
d an
d pr
oduc
ed b
y Sp
erlin
g Sa
mps
on W
est.
P
rinte
d in
the
Uni
ted
Stat
es b
y G
eorg
e Ri
ce &
Son
s.
G E N E N T E C H F I N A N C I A L S
Genentech’s fourth key
strategy for growth is to
improve financial returns.
As late-stage products
progress out of the
pipeline, Genentech’s goal
is for its investment in
research and development
to decline in dollar terms;
revenues to increase; and,
as a percentage, R&D
spending to approach 25
to 30 percent of revenues
at the turn of the century.
This statement is a forward-looking statement and the Company’s actual results may differ materially. For a discussion of the risk factors which may affect future R&D expenditures, pleasesee page 47, “R&D Expenses,” and for a discussion of the risk factors which may affect future revenues, please see page 46, “Total Product Sales” and “Activase Sales,” page 47, “GrowthHormone Sales,” “Pulmozyme Sales,” and “Royalty and Contract Revenues,” and page 48,“Successful Development of Products,” “Uncertainties Surrounding Proprietary Rights,” and“Market Potential/Risk.”

4040
F I N A N C I A L C O N T E N T S
Financial Review . . . . . . . . . . . . . . . . . . . . . .41
Report of Management . . . . . . . . . . . . . . . . .50
Consolidated Statements of Income . . . . . . .51
Consolidated Statements of Cash Flows . . . .52
Consolidated Balance Sheets . . . . . . . . . . . .53
Consolidated Statements of
Stockholders’ Equity . . . . . . . . . . . . . . . . . . .54
Notes to Consolidated
Financial Statements . . . . . . . . . . . . . . . . . . .55
Report of Ernst & Young LLP,
Independent Auditors . . . . . . . . . . . . . . . . . .75
Quarterly Financial Data . . . . . . . . . . . . . . . . .75
11-Year Financial Summary . . . . . . . . . . . . . .76
Stock Information . . . . . . . . . . . . . . . . . . . . .78
Stockholder Information . . . . . . . . . . . . . . . .79
CONTRACT, INTEREST &OTHER
ROYALTIES
PRODUCT SALES
REVENUES (millions)
$969$918
$795
19951994
With the transfer of inter-national product sales toHLR and HLR’s exercise of development options for certain projects,Royalties and ContractRevenues continue to play an important role in Genentech’s revenues.
NET INCOME PER SHARE
$0.96
$1.21
$1.04
199619951994
Net Income Per Share reflects Genentech’s dedicationto aggressive Research & Development spending to ensurefuture revenue growth.
RESEARCH & DEVELOPMENT EXPENSESAND TOTAL REVENUES (millions)
$969$918
$795
19951994
Genentech continues to make a majorinvestment in its futurethrough Research & Development.
TOTAL REVENUES
RESEARCH &DEVELOPMENTEXPENSES
1996
1996

R E L A T I O N S H I P W I T H R O C H E H O L D I N G S , I N C .
On October 25, 1995, Genentech, Inc. (the Company) and Roche Holdings, Inc. (Roche) entered into a new
agreement (the Agreement) to extend until June 30, 1999, Roche’s option to cause the Company to redeem (call)
the outstanding callable putable common stock (special common stock) of the Company at predetermined prices.
Should the call be exercised, Roche will concurrently purchase from the Company a like number of common
shares for a price equal to the Company’s cost to redeem the special common stock. If Roche does not cause the
redemption as of June 30, 1999, the Company’s stockholders will have the option to cause the Company to
redeem none, some, or all of their shares of special common stock (and Roche will concurrently provide the nec-
essary redemption funds to the Company by purchasing a like number of shares of common stock) within thirty
business days commencing July 1, 1999. See the “Relationship with Roche Holdings, Inc.” note in the “Notes to
Consolidated Financial Statements” for further information.
In conjunction with the Agreement, F. Hoffmann-La Roche Ltd (HLR) was granted an option for ten years
for licenses to use and sell certain of the Company’s products in non-United States (U.S.) markets. As a result of
the Agreement, in 1996 the Company’s total product sales decreased, while contract and royalty revenue
increased. Cost of sales as a percentage of product sales also increased due to the Agreement. See below for
further discussion.
R E S U L T S O F O P E R A T I O N S
(dollars in millions)
Annual % Change
Revenues 1996 1995 1994 96/95 95/94
Revenues $ 968.6 $ 917.8 $ 795.4 6% 15%
The increase in revenues in 1996 resulted primarily from higher contract and royalty revenue partly offset by
lower product sales. The 1995 increase resulted primarily from higher royalty income and product sales. Product
sales to HLR in conjunction with the Agreement were $13.2 million in 1996 and $1.8 million in 1995.
Annual % Change
Product Sales 1996 1995 1994 96/95 95/94
Activase $ 284.1 $ 301.0 $ 280.9 (6)% 7%Protropin and Nutropin 218.2 219.4 225.4 (1) (3)Pulmozyme 76.0 111.3 88.3 (32) 26Actimmune 4.5 3.6 6.4 25 (44)
Total product sales $ 582.8 $ 635.3 $ 601.0 (8)% 6%% of revenues 60% 69% 76%
41
F I N A N C I A L R E V I E W
(dollars in millions, except per share amounts)

Total product sales decreased in 1996 compared to 1995 primarily as a result of the Agreement with Roche. On
a pro forma basis that includes sales to HLR in 1996 and the fourth quarter of 1995, and excludes Canadian and
European customer sales in 1995, sales increased to $582.8 million in 1996 from $578.7 million in 1995.
Activase: Total net sales of Activase® in 1996 decreased compared to 1995 primarily due to the impact of not
having Canadian customer sales in 1996 as a result of the Agreement with Roche and the increased use of
angioplasty (see below). Activase sales to Canadian customers were $12.7 million in 1995. Sales to U.S. cus-
tomers decreased slightly in 1996 due to a decline in the market size. Although Activase’s market share grew to
approximately 80% in 1996 from approximately 75% in 1995, the overall size of the thrombolytic market at year
end 1996 declined from 1995 by approximately 6%. The decline in the market size was the result of the increas-
ing use of angioplasty rather than thrombolytic therapy, as well as from patients receiving therapy through
ongoing clinical trials. On a pro forma basis, Activase sales were $284.1 million in 1996 versus $288.3 million in
1995, with the slight decrease due to lower U.S. sales and lower bulk product sales to Japan licensees. In June
1996, the Company received clearance from the U.S. Food and Drug Administration (FDA) to market Activase for
the treatment of acute ischemic stroke or brain attack. Activase is the first therapy to be indicated for the man-
agement of stroke. The increase in Activase sales in 1995 over 1994 was attributable to growth in market share
and an increase in the number of patients receiving thrombolytic therapy in the United States.
Protropin and Nutropin: Net sales of Protropin® and Nutropin® (together, growth hormone) were essentially
flat in 1996 compared to 1995. On a pro forma basis, growth hormone sales in 1996 were $218.2 million com-
pared to $216.7 million in 1995. The Company continues to face increased competition in the growth hormone
market. Three companies in 1995, and a fourth company in 1996, received FDA approval to market their growth
hormone products for treatment of growth hormone inadequacy in children, although one of those companies
has been preliminarily enjoined from selling its product. Two competitors have received approval to market their
existing human growth hormone products for additional indications. Growth hormone sales decreased in 1995
compared to 1994 due to a slight volume increase in sales being more than offset by the impact of pricing pro-
grams for distribution channels and for the managed care sector. In December 1996, the Company received
clearance from the FDA to market Nutropin for the treatment of growth failure associated with Turner syndrome.
Pulmozyme: Net sales of Pulmozyme® in 1996 decreased compared to 1995 primarily in conjunction with the
Agreement with Roche. Pulmozyme sales to customers in Europe and Canada totaled $41.3 million in 1995.
In 1996, sales in these territories were made by Roche for the full year, and the Company received royalties on
Roche’s sales. On a pro forma basis, Pulmozyme sales were $76.0 million in 1996 compared to $70.0 million in
1995. Pulmozyme sales in 1995 increased over 1994 due to market launches in additional European countries
and continued adoption of the product by physicians to treat cystic fibrosis patients. In December 1996,
Pulmozyme was cleared for marketing by the FDA for the management of cystic fibrosis patients with advanced
disease, a condition that affects approximately 500 patients in the United States.
F I N A N C I A L R E V I E W
( C O N T I N U E D )
42

Annual % ChangeRoyalties, Contract and Other,and Interest Income 1996 1995 1994 96/95 95/94
Royalties $ 214.7 $ 190.8 $ 126.0 13% 51%Contract and other 107.0 31.2 25.6 243 22Interest income 64.1 60.5 42.8 6 42
The Company receives royalty payments from HLR from its sales of the Company’s products outside of the U.S.
under the Agreement, and receives royalties from other licensees and HLR from the sales of various other
health care products. Total royalties in 1996 increased over 1995 primarily due to new royalties from HLR in
conjunction with the Agreement, as well as higher income from existing licensees due to increased licensee
sales. Royalty revenue under the Agreement was $17.0 million in 1996 and $1.9 million in 1995. All other
royalty revenue from HLR in 1996, 1995 and 1994, totaled $9.2 million, $10.6 million and $7.9 million, respec-
tively. The increase in 1995 compared to 1994 was attributable to increases in product sales by various
licensees and new royalty arrangements. In 1995, the largest dollar increase was attributable to the receipt and
recognition of $30.0 million of royalty revenue relating to the December 1994 settlement with Eli Lilly and
Company (Lilly) regarding certain of the Company’s patents. Under the December 1994 settlement agreement
with Lilly, royalties of $30.0 million per year are payable, subject to possible offsets and contingent upon
Humulin® continuing to be marketed in the U.S., to the Company through 1998, at which time such royalty
obligations expire. Under a prior license agreement with Lilly, the Company receives royalties from Lilly’s sales
of its human insulin product. These royalty obligations expire in August of 1998. Cash flows from royalty income
include non-dollar denominated revenues. The Company currently purchases simple foreign currency put option
contracts (options) and enters into foreign currency forward exchange contracts (forward contracts) to hedge
these cash flows. All options expire within the next four years. The Company has forward contracts of various
durations that will expire by the end of 1997.
Contract and other revenues increased in 1996 due to contract revenue from HLR for the exercises of
their options under the Agreement with respect to the development of three projects—IDEC-C2B8, insulin-like
growth factor (IGF-1) and nerve growth factor (NGF). The Company recorded non-recurring contract revenues of
$58.2 million relating to these option exercises in 1996. All other contract revenue from HLR, including reim-
bursement for ongoing development expenses after the option exercise date, totaled $37.1 million in 1996,
$13.4 million in 1995 and $17.1 million in 1994. The increase in 1995 compared to 1994 was attributable to $6.4
million of gains recorded from sales of biotechnology equity securities. Contract and other revenues will contin-
ue to fluctuate due to variations in the timing of contract benchmark achievements; the initiation of new con-
tractual arrangements, including the potential exercise of product options by HLR; and the conclusion of existing
arrangements.
Interest income increased in 1996 compared to 1995 due to a larger investment portfolio. The increase in
1995 compared to 1994 was attributable to a larger investment portfolio and a higher average portfolio yield.
The Company enters into interest rate swaps as part of its overall strategy of managing the duration of its
investment portfolio. See the “Financial Instruments” note in the “Notes to Consolidated Financial Statements”
for further information.
43
Annual % Change
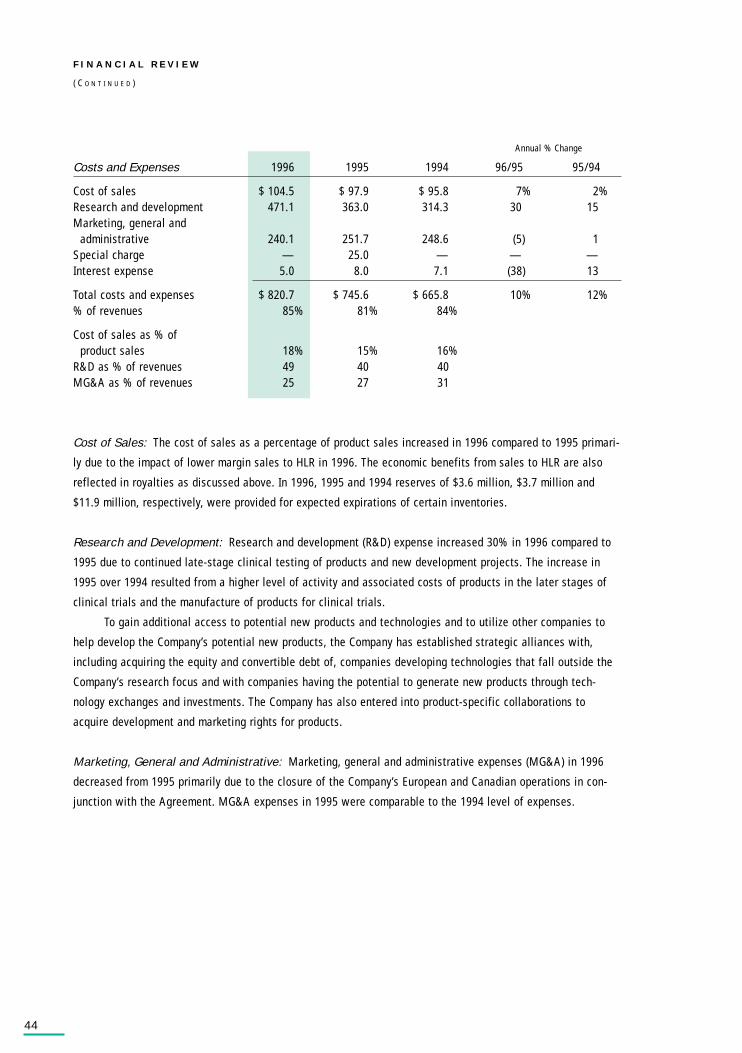
Costs and Expenses 1996 1995 1994 96/95 95/94
Cost of sales $ 104.5 $ 97.9 $ 95.8 7% 2%Research and development 471.1 363.0 314.3 30 15Marketing, general and
administrative 240.1 251.7 248.6 (5) 1Special charge — 25.0 — — —Interest expense 5.0 8.0 7.1 (38) 13
Total costs and expenses $ 820.7 $ 745.6 $ 665.8 10% 12%% of revenues 85% 81% 84%
Cost of sales as % ofproduct sales 18% 15% 16%
R&D as % of revenues 49 40 40MG&A as % of revenues 25 27 31
Cost of Sales: The cost of sales as a percentage of product sales increased in 1996 compared to 1995 primari-
ly due to the impact of lower margin sales to HLR in 1996. The economic benefits from sales to HLR are also
reflected in royalties as discussed above. In 1996, 1995 and 1994 reserves of $3.6 million, $3.7 million and
$11.9 million, respectively, were provided for expected expirations of certain inventories.
Research and Development: Research and development (R&D) expense increased 30% in 1996 compared to
1995 due to continued late-stage clinical testing of products and new development projects. The increase in
1995 over 1994 resulted from a higher level of activity and associated costs of products in the later stages of
clinical trials and the manufacture of products for clinical trials.
To gain additional access to potential new products and technologies and to utilize other companies to
help develop the Company’s potential new products, the Company has established strategic alliances with,
including acquiring the equity and convertible debt of, companies developing technologies that fall outside the
Company’s research focus and with companies having the potential to generate new products through tech-
nology exchanges and investments. The Company has also entered into product-specific collaborations to
acquire development and marketing rights for products.
Marketing, General and Administrative: Marketing, general and administrative expenses (MG&A) in 1996
decreased from 1995 primarily due to the closure of the Company’s European and Canadian operations in con-
junction with the Agreement. MG&A expenses in 1995 were comparable to the 1994 level of expenses.
F I N A N C I A L R E V I E W
( C O N T I N U E D )
44

Special Charge: The Company recorded a special charge of $25.0 million in 1995, which included $21.0 mil-
lion related to the Agreement with Roche and $4.0 million associated with the resignation of the Company’s for-
mer President and Chief Executive Officer. The merger expenses included investment banking fees, legal
expenses, filing fees and other costs related to the Agreement, as well as charges associated with the settle-
ment of stockholder lawsuits filed after the transaction was announced.
Interest Expense: Interest expense in 1996, 1995 and 1994, net of amounts capitalized, relates primarily to
interest on the Company’s 5% convertible subordinated debentures. In 1995, it also included interest on a
$25.0 million borrowing arrangement which commenced in February 1995 and was paid in December of that year.
Income Before Taxes and Income Taxes 1996 1995 1994
Income before taxes $ 147.9 $ 172.2 $ 129.6 Income tax provision 29.6 25.8 5.2Effective tax rate 20% 15% 4%
The increase in the effective tax rate to 20% in 1996 from 15% in 1995 is due to the recognition of a greater
amount of tax credit carryforwards in 1995 than in 1996. The net increase in the rate from 1994 to 1995 was
primarily related to limitations on the utilization of existing carryforwards related to the U.S. alternative mini-
mum tax.
Annual % Change
Net Income 1996 1995 1994 96/95 95/94
Net income $ 118.3 $ 146.4 $ 124.4 (19)% 18%Net income per share $ 0.96 $ 1.21 $ 1.04
Net income in 1996 decreased compared to 1995 primarily due to higher R&D expenses and lower product sales,
partly offset by increased contract and royalty revenue. Net income in 1995 increased over 1994 due to higher
revenue from all sources, partly offset by higher expenses, primarily R&D and special charges.
45

Liquidity and Capital Resources 1996 1995 1994
Cash, cash equivalents, short-term investmentsand long-term marketable debt and equity securities $ 1,159.1 $ 1,096.8 $ 920.9
Working capital 705.1 812.0 776.6Cash provided by (used in):
Operating activities 139.7 133.9 200.4Investing activities (141.7) (117.7) (322.3)Financing activities 72.2 54.1 71.2
Capital expenditures(included in investing activities above) (141.8) (70.2) (82.8)
Current ratio 3.8:1 4.5:1 4.5:1
Cash generated from operations, the maturity of investments and stock issuances were used to purchase mar-
ketable securities and make capital additions in 1996.
Capital expenditures in 1996 primarily include building and land purchases and improvements to existing
manufacturing and office facilities. In 1995, the Company entered into an arrangement with a lessor for a new
manufacturing facility which qualifies as an operating lease and is expected to become operational in 1998.
F O R W A R D - L O O K I N G S T A T E M E N T S
The following section contains forward-looking statements that are based on the Company’s current expecta-
tions. Because the Company’s actual results may differ materially from any forward-looking statements made
by or on behalf of the Company, this section also includes a discussion of important factors that could affect
the Company’s actual future results, including its product sales, royalties, contract revenues, expenses and
net income.
Total Product Sales: The Company anticipates that total reported quarterly product sales in 1997 will be
comparable to 1996; however, product sales will be dependent on the overall competitive environment. Other
factors affecting the Company’s total product sales include, but are not limited to, the amount and timing of the
Company’s sales to HLR, the amount of sales to customers in the U.S., increased competition in the growth
hormone and thrombolytic markets, the timing and amount of bulk shipments to licensees, and the possibility of
the introduction of a new product in late 1997.
Activase Sales: The Company faces new competition in the thrombolytic market. The Company is aware that
one company received FDA approval in October 1996 to market its product for the treatment of acute myocardial
infarction (AMI) in the U.S. The Company has brought suit against that company for patent infringement. In
addition, there is an increasing use of angioplasty in the treatment of AMI patients in lieu of the use of throm-
bolytic therapy. Depending on the extent and type of new competition, the Company’s total Activase sales could
be materially affected. Other factors affecting the Company’s Activase sales include, but are not limited to, the
timing of FDA approval, if any, of additional competitive products, pricing decisions made by the Company, the
outcome of litigation against Boehringer Mannheim GmbH and Boehringer Mannheim Corporation involving the
Company’s patents for tissue plasminogen activator and processes related to its production and formulation, the
F I N A N C I A L R E V I E W
( C O N T I N U E D )
46
increasing use of other therapies such as angioplasty techniques for the treatment of AMI, and the impact of
the FDA’s recent clearance for the Company to market Activase for the treatment of acute ischemic stroke.
Growth Hormone Sales: The Company continues to face the possibility of increased competition in the
growth hormone market. Three companies received FDA approval in 1995, and a fourth company received FDA
approval in October 1996, to market their growth hormone products for treatment of growth hormone inadequa-
cy in children, although one of those companies has been preliminarily enjoined from selling its product. Two of
the Company’s competitors have received approval to market their existing human growth hormone products for
additional indications. The Company expects such competition to have an adverse effect on its sales of
Protropin and Nutropin which, depending on the extent and type of competition, could be material. Other factors
affecting the Company’s growth hormone sales include, but are not limited to, the timing of FDA approval, if
any, of other new competitive products, the outcome of litigation involving the Company’s patents for human
growth hormone and related processes, pricing decisions made by the Company, the availability of third-party
reimbursement for the cost of growth hormone therapy, and the impact of Nutropin as a treatment for growth
failure associated with Turner syndrome.
Pulmozyme Sales: Factors that may influence the future sales of Pulmozyme include, but are not limited to,
physician perception of the number and kinds of patients who will benefit from such therapy, the availability of
third-party reimbursement for the costs of therapy, the timing of the development of alternative therapies for
the treatment and care of cystic fibrosis, whether and when additional indications are approved, and the cost
of therapy.
Royalty and Contract Revenues: Royalty and contract revenues in future periods could vary significantly from
1996 levels. Major factors affecting these revenues include, but are not limited to: HLR’s decisions to exercise
or not to exercise its option to develop and sell the Company’s future products in non-U.S. markets and the tim-
ing and amount of related development cost reimbursement, if any; variations in HLR’s sales of Genentech prod-
ucts and other licensees’ sales of licensed products; the expiration of royalties from Lilly in 1998; fluctuations
in foreign currency exchange rates; the timing of non-U.S. approvals, if any, for products licensed to HLR;
whether and when contract benchmarks are achieved; the initiation of other new contractual arrangements; and
the conclusion of existing arrangements with other companies and HLR.
R&D Expenses: The Company intends to continue its commitment to aggressive investment in R&D. As it con-
tinues late-stage clinical testing of products, the Company anticipates that its R&D expenses will continue at a
high percentage of revenues over the short-term. Over the long-term, however, R&D as a percent of revenues
should decrease, although in dollar terms R&D spending is generally expected to rise as revenues rise. Factors
affecting the Company’s R&D expenses include, but are not limited to: the outcome of clinical trials currently
being conducted; the number of products entering into development from late-stage research; future levels of
the Company’s product sales (including the impact of competition), royalty and contract revenues; the possibility
of competition with respect to products or technologies under development; and decisions by HLR to exercise or
not to exercise its option to develop and sell potential products of the Company in non-U.S. markets and the
timing of such decisions.
47

Income Tax Provision: The Company expects that its effective tax rate will increase from the current rate of
20% to approximately 35% in 1997, and continue at or near 35% for the next several years dependent upon
several factors. These factors include, but are not limited to, changes in tax laws and rates, future levels of
R&D spending, the outcome of clinical trials of certain development products, the Company’s success in com-
mercializing such products, and potential competition regarding the products.
Successful Development of Products: The Company intends to continue to develop new products. Successful
pharmaceutical product development is highly uncertain and is dependent on numerous factors, many of which
are beyond the Company’s control. Products that appear promising in the early phases of development may fail to
reach the market for numerous reasons. They may be found to be ineffective or to have harmful side effects in
preclinical or clinical testing, may fail to receive necessary regulatory approvals, may turn out to be uneconomi-
cal because of manufacturing costs or other factors, or may be precluded from commercialization by the propri-
etary rights of others or by competing products or technologies for the same indication. Success in preclinical
and early clinical trials does not ensure that large-scale clinical trials will be successful. Clinical results are
frequently susceptible to varying interpretations which may delay, limit or prevent regulatory approvals. The
length of time necessary to complete clinical trials and to submit an application for marketing approval for a
final decision by a regulatory authority varies significantly and may be difficult to predict.
Uncertainties Surrounding Proprietary Rights: The patent positions of pharmaceutical and biotechnology
companies can be highly uncertain and involve complex legal and factual questions. Accordingly, the breadth of
claims allowed in such companies’ patents cannot be predicted. Patent disputes are frequent and can preclude
commercialization of products. The Company, as in the past, may be involved in future material patent litigation.
Such litigation is costly in its own right and could subject the Company to significant liabilities to third parties
and, if decided adversely, the Company may need to obtain third-party licenses or cease using the technology or
product in dispute. The presence of patents or other proprietary rights belonging to other parties may lead to
the termination of research and development of a particular product. The Company believes it has strong patent
protection or the potential for strong patent protection for a number of its products that generate sales and
royalty revenue or that the Company is developing; however, the courts will determine the ultimate strength of
patent protection of the Company’s products and those on which the Company earns royalties.
Liquidity: The Company believes that its cash, cash equivalents, and short-term investments, together with
funds provided by operations and leasing arrangements, will be sufficient to meet its foreseeable operating
cash requirements. Factors affecting the Company’s cash position include, but are not limited to, future levels
of the Company’s product sales, royalty and contract revenues, expenses and capital expenditures.
Market Potential/Risk: Over the longer term, the Company’s (and its partners’) ability to successfully market cur-
rent products, expand their usage, and bring new products to the marketplace will depend on many factors, includ-
ing, but not limited to, the effectiveness and safety of the products, FDA and foreign regulatory agencies’ approvals
for new products and new indications, and the degree of patent protection afforded to particular products.
Roche Holdings, Inc.: At December 31, 1996, Roche held approximately 66.0% of the Company’s outstanding
common equity. In January and February 1997, Roche purchased additional shares of the Company’s common
F I N A N C I A L R E V I E W
( C O N T I N U E D )
48

equity increasing Roche’s holdings to 68.0%. The Company expects to continue to have material transactions
with Roche, including royalty and contract development revenues, product sales and joint product development.
Foreign Exchange: The Company receives royalty revenues from countries throughout the world. As a result,
the Company’s financial results could be significantly affected by factors such as changes in foreign currency
exchange rates or weak economic conditions in the foreign markets in which the Company’s products are sold.
The Company is exposed to changes in exchange rates in Europe, Asia and Canada. When the U.S. dollar
strengthens against the currencies in these countries, the U.S. dollar value of non-U.S. dollar-based revenue
decreases; when the U.S. dollar weakens, the U.S. dollar value of the non-U.S. dollar-based revenues increases.
Accordingly, changes in exchange rates, and in particular a strengthening of the U.S. dollar, may adversely
affect the Company’s royalty revenues as expressed in U.S. dollars.
To mitigate this risk, the Company hedges certain of these anticipated revenues by purchasing options
with expiration dates and amounts of currency that are based on a portion of probable revenues so that the
adverse impact of movements in currency exchange rates on the non-dollar denominated revenues will be at
least partly offset by an associated increase in the value of the option. The Company also enters into forward
contracts to lock in the dollar value of a portion of these anticipated revenues.
Interest Rates: The Company’s interest income is sensitive to changes in the general level of U.S. interest
rates. In this regard, changes in U.S. interest rates affect the interest earned on the Company’s cash equivalents,
short-term investments and long-term investments. To mitigate the impact of fluctuations in U.S. interest rates,
the Company enters into interest rate swap transactions which generally involve the receipt of fixed rate interest
and the payment of floating rate interest without the exchange of the underlying principal. These agreements
have the effect of locking in rates for longer periods of time than the duration of short-term investments.
Equity Securities: As part of its strategic alliance efforts, the Company invests in equity instruments that are
subject to fluctuations from market value changes in stock prices. To mitigate this risk, certain equity securities
are hedged with costless collars. A costless collar is a purchased put option and a written call option in which
the cost of the purchased put and the proceeds of the written call offset each other; therefore, there is no ini-
tial cost or cash outflow for these instruments at the time of purchase. The purchased put protects the Company
from a decline in the market value of the security below a certain minimum level (the put “strike” level); while
the call effectively limits the Company’s potential to benefit from an increase in the market value of the securi-
ty above a certain maximum level (the call “strike” level).
Credit Risk of Counterparties: The Company could be exposed to losses related to the above financial instru-
ments should one of its counterparties default. This risk is mitigated through credit monitoring procedures.
Legal Proceedings: The Company is a party to various legal proceedings including patent infringement cases
and various cases involving product liability and other matters. See the “Leases, Commitments and
Contingencies” note in the “Notes to Consolidated Financial Statements” for further information.
49
Genentech, Inc. is responsible for the preparation, integrity and fair presentation of its published financial
statements. The Company has prepared the financial statements, presented on pages 51 to 74, in accordance
with generally accepted accounting principles. As such, the statements include amounts based on judgments
and estimates made by management. The Company also prepared the other information included in the annual
report and is responsible for its accuracy and consistency with the financial statements.
The financial statements have been audited by the independent auditing firm, Ernst & Young LLP, which
was given unrestricted access to all financial records and related data, including minutes of all meetings of
stockholders, the Board of Directors and committees of the Board. The Company believes that all representa-
tions made to the independent auditors during their audit were valid and appropriate. Ernst & Young LLP’s audit
report appears on page 75.
Systems of internal accounting controls, applied by operating and financial management, are designed to
provide reasonable assurance as to the integrity and reliability of the financial statements and reasonable, but
not absolute, assurance that assets are safeguarded from unauthorized use or disposition, and that transactions
are recorded according to management’s policies and procedures. The Company continually reviews and modi-
fies these systems, where appropriate, to maintain such assurance. Through the Company’s general audit activi-
ties, the adequacy and effectiveness of the systems and controls are reviewed and the resultant findings are
communicated to management and the Audit Committee of the Board of Directors.
The selection of Ernst & Young LLP as the Company’s independent auditors has been approved by the
Company’s Board of Directors and ratified by the stockholders. An Audit Committee of the Board of Directors,
composed of four non-management directors, meets regularly with, and reviews the activities of, corporate
financial management, the general audit function and the independent auditors to ascertain that each is
properly discharging its responsibilities. The independent auditors and general auditor meet with the Audit
Committee, with and without management present, to discuss the results of their work, the adequacy of
internal accounting controls and the quality of financial reporting.
ARTHUR D. LEVINSON, PH.D. LOUIS J. LAVIGNE, JR. BRADFORD S. GOODWIN
President and Senior Vice President and Vice President—FinanceChief Executive Officer Chief Financial Officer and Controller
R E P O R T O F M A N A G E M E N T
50
/s/ Arthur D. Levinson /s/ Louis J. Lavigne, Jr. /s/ Bradford S. Goodwin
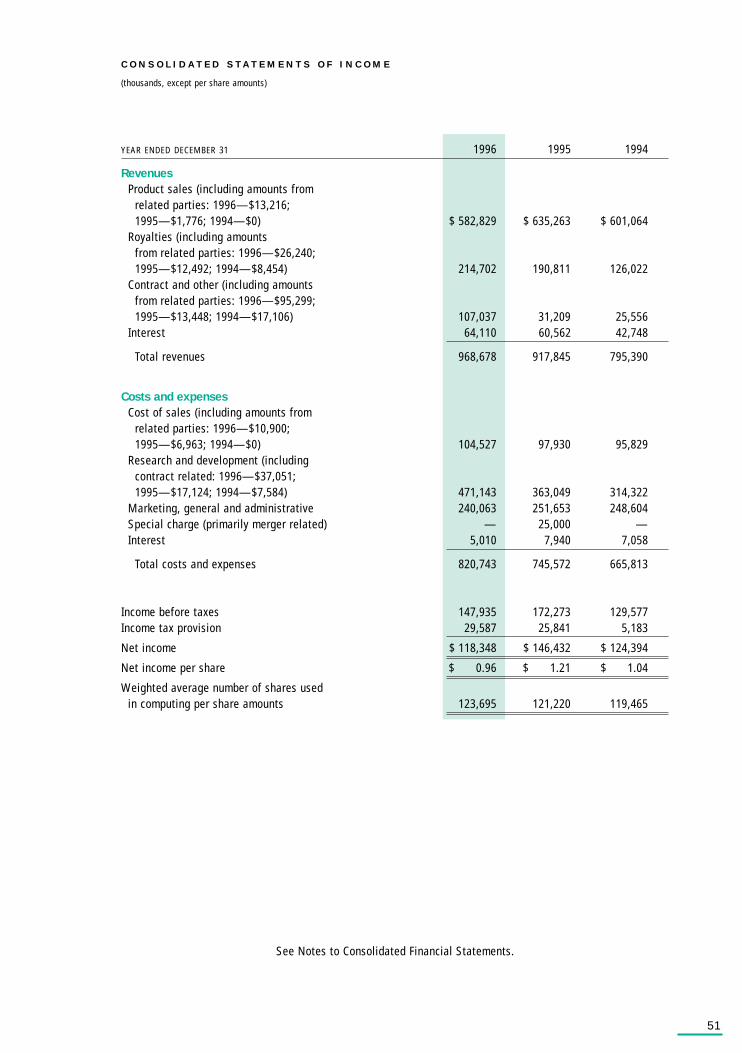
YEAR ENDED DECEMBER 31 1996 1995 1994
RevenuesProduct sales (including amounts from
related parties: 1996—$13,216;1995—$1,776; 1994—$0) $ 582,829 $ 635,263 $ 601,064
Royalties (including amountsfrom related parties: 1996—$26,240;1995—$12,492; 1994—$8,454) 214,702 190,811 126,022
Contract and other (including amountsfrom related parties: 1996—$95,299;1995—$13,448; 1994—$17,106) 107,037 31,209 25,556
Interest 64,110 60,562 42,748
Total revenues 968,678 917,845 795,390
Costs and expensesCost of sales (including amounts from
related parties: 1996—$10,900;1995—$6,963; 1994—$0) 104,527 97,930 95,829
Research and development (includingcontract related: 1996—$37,051;1995—$17,124; 1994—$7,584) 471,143 363,049 314,322
Marketing, general and administrative 240,063 251,653 248,604Special charge (primarily merger related) — 25,000 —Interest 5,010 7,940 7,058
Total costs and expenses 820,743 745,572 665,813
Income before taxes 147,935 172,273 129,577Income tax provision 29,587 25,841 5,183
Net income $ 118,348 $ 146,432 $ 124,394
Net income per share $ 0.96 $ 1.21 $ 1.04
Weighted average number of shares usedin computing per share amounts 123,695 121,220 119,465
See Notes to Consolidated Financial Statements.
51
C O N S O L I D A T E D S T A T E M E N T S O F I N C O M E
(thousands, except per share amounts)

Increase (Decrease) in Cash and Cash Equivalents
YEAR ENDED DECEMBER 31 1996 1995 1994
Cash flows from operating activities:Net income $ 118,348 $ 146,432 $ 124,394 Adjustments to reconcile net income to
net cash provided by operating activities: Depreciation and amortization 62,124 58,421 53,452Writedown of securities available-for-sale — 6,609 12,590Gain on sales of securities available-for-sale (347) (7,432) —Deferred income taxes (34,021) (22,655) (34,193)Loss on fixed asset dispositions
(including merger-related in 1995) 5,309 1,032 5,510Other — (234) 748
Changes in assets and liabilities:Net cash flow from trading securities (8,184) (50,014) (4,634)Receivables and other current assets (30,416) (28,446) (11,937)Inventories 1,705 9,552 (18,475)Accounts payable, other current liabilities
and other long-term liabilities 25,153 20,682 72,901
Net cash provided by operating activities 139,671 133,947 200,356
Cash flows from investing activities: Purchases of securities held-to-maturity (634,124) (682,396) (1,088,737)Proceeds from maturities of securities
held-to-maturity 772,922 924,345 877,139Purchases of securities available-for-sale (304,806) (353,118) (22,644)Proceeds from sales of securities available-for-sale 182,564 101,591 —Purchases of non-marketable equity securities (9,323) — (4,000)Capital expenditures (141,837) (70,166) (82,837)Change in other assets (7,046) (37,948) (1,198)
Net cash used in investing activities (141,650) (117,692) (322,277)
Cash flows from financing activities:Stock issuances 72,558 54,946 71,955Reduction in long-term debt,
including current portion (358) (871) (794)
Net cash provided by financing activities 72,200 54,075 71,161
Increase (decrease) in cash and cash equivalents 70,221 70,330 (50,760)
Cash and cash equivalents at beginning of year 137,043 66,713 117,473
Cash and cash equivalents at end of year $ 207,264 $ 137,043 $ 66,713
Supplemental cash flow data:Cash paid during the year for:
Interest, net of portion capitalized $ 5,010 $ 7,917 $ 7,058Income taxes 52,243 44,699 4,099
See Notes to Consolidated Financial Statements.
C O N S O L I D A T E D S T A T E M E N T S O F C A S H F L O W S
(thousands)
52
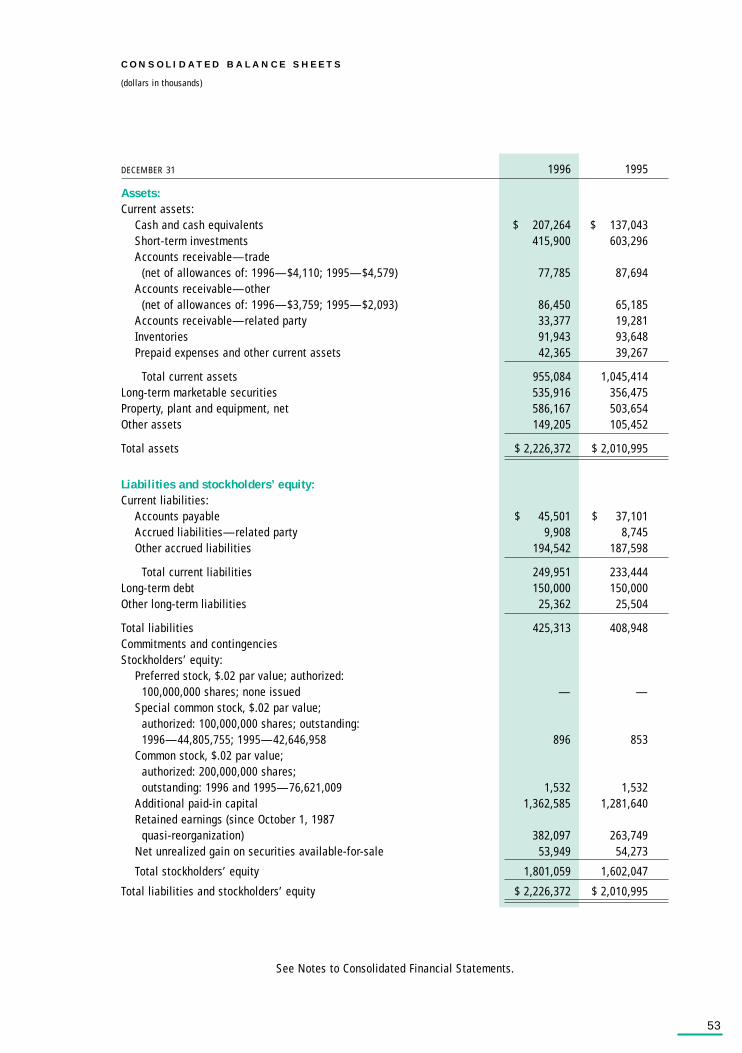
DECEMBER 31 1996 1995
Assets:Current assets:
Cash and cash equivalents $ 207,264 $ 137,043Short-term investments 415,900 603,296Accounts receivable—trade
(net of allowances of: 1996—$4,110; 1995—$4,579) 77,785 87,694Accounts receivable—other
(net of allowances of: 1996—$3,759; 1995—$2,093) 86,450 65,185Accounts receivable—related party 33,377 19,281Inventories 91,943 93,648Prepaid expenses and other current assets 42,365 39,267
Total current assets 955,084 1,045,414Long-term marketable securities 535,916 356,475Property, plant and equipment, net 586,167 503,654Other assets 149,205 105,452
Total assets $ 2,226,372 $ 2,010,995
Liabilities and stockholders’ equity:Current liabilities:
Accounts payable $ 45,501 $ 37,101Accrued liabilities—related party 9,908 8,745Other accrued liabilities 194,542 187,598
Total current liabilities 249,951 233,444Long-term debt 150,000 150,000Other long-term liabilities 25,362 25,504
Total liabilities 425,313 408,948Commitments and contingenciesStockholders’ equity:
Preferred stock, $.02 par value; authorized:100,000,000 shares; none issued — —
Special common stock, $.02 par value;authorized: 100,000,000 shares; outstanding:1996—44,805,755; 1995—42,646,958 896 853
Common stock, $.02 par value;authorized: 200,000,000 shares;outstanding: 1996 and 1995—76,621,009 1,532 1,532
Additional paid-in capital 1,362,585 1,281,640Retained earnings (since October 1, 1987
quasi-reorganization) 382,097 263,749Net unrealized gain on securities available-for-sale 53,949 54,273
Total stockholders’ equity 1,801,059 1,602,047
Total liabilities and stockholders’ equity $ 2,226,372 $ 2,010,995
See Notes to Consolidated Financial Statements.
53
C O N S O L I D A T E D B A L A N C E S H E E T S
(dollars in thousands)
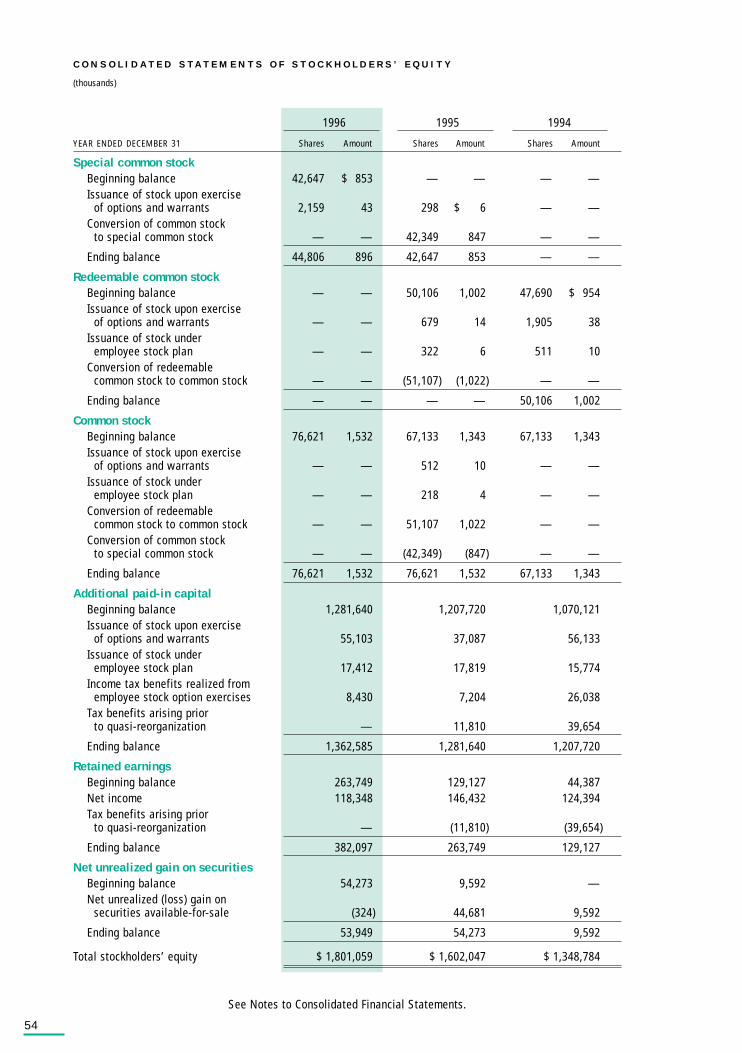
1996 1995 1994
YEAR ENDED DECEMBER 31 Shares Amount Shares Amount Shares Amount
Special common stockBeginning balance 42,647 $ 853 — — — —Issuance of stock upon exercise
of options and warrants 2,159 43 298 $ 6 — —Conversion of common stock
to special common stock — — 42,349 847 — —
Ending balance 44,806 896 42,647 853 — —
Redeemable common stockBeginning balance — — 50,106 1,002 47,690 $ 954Issuance of stock upon exercise
of options and warrants — — 679 14 1,905 38Issuance of stock under
employee stock plan — — 322 6 511 10Conversion of redeemable
common stock to common stock — — (51,107) (1,022) — —
Ending balance — — — — 50,106 1,002
Common stockBeginning balance 76,621 1,532 67,133 1,343 67,133 1,343Issuance of stock upon exercise
of options and warrants — — 512 10 — —Issuance of stock under
employee stock plan — — 218 4 — —Conversion of redeemable
common stock to common stock — — 51,107 1,022 — —Conversion of common stock
to special common stock — — (42,349) (847) — —
Ending balance 76,621 1,532 76,621 1,532 67,133 1,343
Additional paid-in capital Beginning balance 1,281,640 1,207,720 1,070,121Issuance of stock upon exercise
of options and warrants 55,103 37,087 56,133Issuance of stock under
employee stock plan 17,412 17,819 15,774Income tax benefits realized from
employee stock option exercises 8,430 7,204 26,038Tax benefits arising prior
to quasi-reorganization — 11,810 39,654
Ending balance 1,362,585 1,281,640 1,207,720
Retained earnings Beginning balance 263,749 129,127 44,387Net income 118,348 146,432 124,394Tax benefits arising prior
to quasi-reorganization — (11,810) (39,654)
Ending balance 382,097 263,749 129,127
Net unrealized gain on securitiesBeginning balance 54,273 9,592 —Net unrealized (loss) gain on
securities available-for-sale (324) 44,681 9,592
Ending balance 53,949 54,273 9,592
Total stockholders’ equity $ 1,801,059 $ 1,602,047 $ 1,348,784
See Notes to Consolidated Financial Statements.
C O N S O L I D A T E D S T A T E M E N T S O F S T O C K H O L D E R S ’ E Q U I T Y
(thousands)
54
D E S C R I P T I O N O F B U S I N E S S A N D S I G N I F I C A N T A C C O U N T I N G P O L I C I E S
Description of Business: Genentech, Inc. (the Company) is a biotechnology company that discovers, develops,
manufactures and markets human pharmaceuticals produced by recombinant DNA technology for significant
unmet medical needs. The Company manufactures and markets six products directly in the United States (U.S.)
and sells these products to F. Hoffmann-La Roche Ltd (HLR) for HLR to sell outside of the United States. Of these
six products, HLR has the right to sell five in Canada and one in a number of countries. In addition, the Company
receives royalties from HLR’s sales of these products and receives royalties from HLR and other licensees from
sales of five other products which originated from the Company’s technology.
Principles of Consolidation: The consolidated financial statements include the accounts of the Company and
all significant subsidiaries and collaborations. Material intercompany balances and transactions are eliminated.
Use of Estimates: The preparation of financial statements in conformity with generally accepted accounting
principles requires management to make estimates and assumptions that affect the amounts reported in the
financial statements and accompanying notes. Actual results could differ from those estimates.
Cash and Cash Equivalents: The Company considers all highly liquid debt instruments purchased with an
original maturity of three months or less to be cash equivalents.
Short-term Investments and Long-term Marketable Securities: The Company invests its excess cash bal-
ances in short-term and long-term marketable securities, primarily corporate notes, certificates of deposit and
treasury notes. As part of its strategic alliance efforts, the Company also invests in equity securities and con-
vertible debt of other biotechnology companies.
Investment securities are classified into one of three categories: held-to-maturity, available-for-sale, or
trading. Securities are considered held-to-maturity when the Company has the positive intent and ability to hold
the securities to maturity. These securities are recorded as either short-term investments or long-term
marketable securities on the balance sheet depending upon their contractual maturity dates. Held-to-maturity
securities are stated at amortized cost, including adjustment for amortization of premiums and accretion of
discounts. Securities are considered trading when bought principally for the purpose of selling in the near term.
These securities are recorded as short-term investments and are carried at market value. Unrealized holding
gains and losses on trading securities are included in interest income. Securities not classified as held-to-
maturity or as trading are considered available-for-sale. These securities are recorded as either short-term
investments or long-term marketable securities and are carried at market value with unrealized gains and losses
included in stockholders’ equity. If a decline in fair value below cost is considered other than temporary, such
securities are written down to estimated fair value with a charge to marketing, general and administrative
expenses. The cost of all securities sold is based on the specific identification method.
Property, Plant and Equipment: The costs of buildings and equipment are depreciated using the straight-line
method over the following estimated useful lives of the assets: buildings—25 years; certain manufacturing
equipment—15 years; other equipment—4 or 8 years; leasehold improvements—length of applicable lease. The
costs of repairs and maintenance are expensed as incurred. Repairs and maintenance expenses for the years
ended December 31, 1996, 1995 and 1994, were $28.8 million, $22.1 million and $19.2 million, respectively.
55
N O T E S T O C O N S O L I D A T E D F I N A N C I A L S T A T E M E N T S
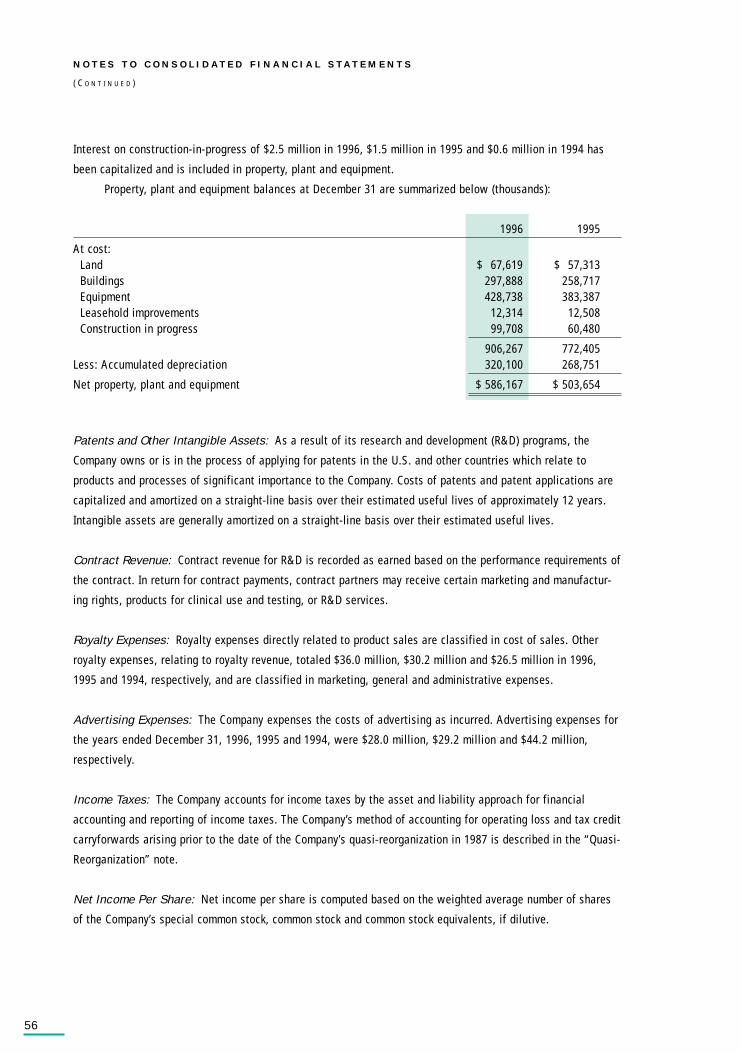
Interest on construction-in-progress of $2.5 million in 1996, $1.5 million in 1995 and $0.6 million in 1994 has
been capitalized and is included in property, plant and equipment.
Property, plant and equipment balances at December 31 are summarized below (thousands):
1996 1995
At cost:Land $ 67,619 $ 57,313Buildings 297,888 258,717Equipment 428,738 383,387Leasehold improvements 12,314 12,508Construction in progress 99,708 60,480
906,267 772,405 Less: Accumulated depreciation 320,100 268,751
Net property, plant and equipment $ 586,167 $ 503,654
Patents and Other Intangible Assets: As a result of its research and development (R&D) programs, the
Company owns or is in the process of applying for patents in the U.S. and other countries which relate to
products and processes of significant importance to the Company. Costs of patents and patent applications are
capitalized and amortized on a straight-line basis over their estimated useful lives of approximately 12 years.
Intangible assets are generally amortized on a straight-line basis over their estimated useful lives.
Contract Revenue: Contract revenue for R&D is recorded as earned based on the performance requirements of
the contract. In return for contract payments, contract partners may receive certain marketing and manufactur-
ing rights, products for clinical use and testing, or R&D services.
Royalty Expenses: Royalty expenses directly related to product sales are classified in cost of sales. Other
royalty expenses, relating to royalty revenue, totaled $36.0 million, $30.2 million and $26.5 million in 1996,
1995 and 1994, respectively, and are classified in marketing, general and administrative expenses.
Advertising Expenses: The Company expenses the costs of advertising as incurred. Advertising expenses for
the years ended December 31, 1996, 1995 and 1994, were $28.0 million, $29.2 million and $44.2 million,
respectively.
Income Taxes: The Company accounts for income taxes by the asset and liability approach for financial
accounting and reporting of income taxes. The Company’s method of accounting for operating loss and tax credit
carryforwards arising prior to the date of the Company’s quasi-reorganization in 1987 is described in the “Quasi-
Reorganization” note.
Net Income Per Share: Net income per share is computed based on the weighted average number of shares
of the Company’s special common stock, common stock and common stock equivalents, if dilutive.
N O T E S T O C O N S O L I D A T E D F I N A N C I A L S T A T E M E N T S
( C O N T I N U E D )
56

Financial Instruments: The Company purchases simple foreign currency put options (options) with expiration
dates and amounts of currency that are based on a portion of probable non-dollar revenues so that the potential
adverse impact of movements in currency exchange rates on the non-dollar denominated revenues will be
at least partially offset by an associated increase in the value of the options. See the “Financial Instruments”
note for further discussion. At the time the options are purchased they have little or no intrinsic value. Realized
and unrealized gains related to the options are deferred until the designated hedged revenues are recorded. The
associated costs, which are deferred and classified as other current assets, are amortized over the term of the
options and recorded as a reduction of the hedged revenues. Realized gains and losses are recorded in the
income statement with the related hedged revenues. The Company also enters into foreign currency forward
contracts (forward contracts) as hedging instruments. Forward contracts are recorded at fair value, and any
gains and losses from these forward contracts are recorded in the income statement with the related hedged
revenues. Financial instruments, such as forward contracts, not qualifying as hedges under generally accepted
accounting principles are marked to market with gains or losses recorded in income as they occur.
Interest rate swaps have been used and may be used in the future to adjust the duration of the invest-
ment portfolio in order to meet duration targets. Interest rate swaps are contracts in which two parties agree
to swap future streams of payments over a specified period. See the “Financial Instruments” note for further
discussion. Net payments made or received on swaps are included in interest income as adjustments to the
interest received on invested cash. Amounts deferred on terminated swaps are classified as other assets and
are amortized to interest income over the original contractual term of the swaps by a method that approximates
the level-yield method.
The Company’s marketable equity portfolio consists primarily of biotechnology companies whose risk of
market fluctuations is greater than the stock market in general. To manage this risk, the Company enters into
certain costless collar instruments to hedge certain equity securities against changes in market value. See the
“Financial Instruments” note for further discussion. Gains and losses on these instruments are recorded as an
adjustment to unrealized gains and losses on marketable securities with a corresponding receivable or payable
recorded in long-term other assets or long-term liabilities.
401(k) Plan: The Company’s 401(k) plan (Plan) covers substantially all of its U.S. employees. Under the Plan,
eligible employees may contribute up to 15% of their eligible compensation, subject to certain Internal Revenue
Service restrictions. The Company matches a portion of employee contributions, up to a maximum of 4% of each
employee’s eligible compensation. The match is effective December 31 of each year and is fully vested when
made. During 1996, 1995 and 1994, the Company provided $6.1 million, $5.6 million and $5.2 million, respec-
tively, for the Company match under the Plan.
57
New Accounting Standards: On January 1, 1996, the Company adopted Statement of Financial Accounting
Standards (FAS) 121, “Accounting for the Impairment of Long-Lived Assets and for Long-Lived Assets to Be
Disposed Of,” which requires the Company to review for impairment of long-lived assets, certain identifiable
intangibles, and goodwill related to those assets whenever events or changes in circumstances indicate that
the carrying amount of an asset may not be recoverable. In certain situations, an impairment loss would be rec-
ognized. The adoption of FAS 121 did not have a material impact on the financial position, results of operations
or cash flows of the Company.
In 1996, the Company also implemented the disclosure requirements of FAS 123 “Accounting for Stock-
Based Compensation” (FAS 123). Under FAS 123, the Company will continue to account for stock-based employee
compensation arrangements under the intrinsic value method prescribed by Accounting Principles Board
Opinion 25 “Accounting for Stock Issued to Employees” (APB 25), and will provide pro forma disclosures of net
income and earnings per share as if the fair value basis method prescribed by FAS 123 had been applied in
measuring employee compensation expense. See the “Capital Stock” note for such disclosure.
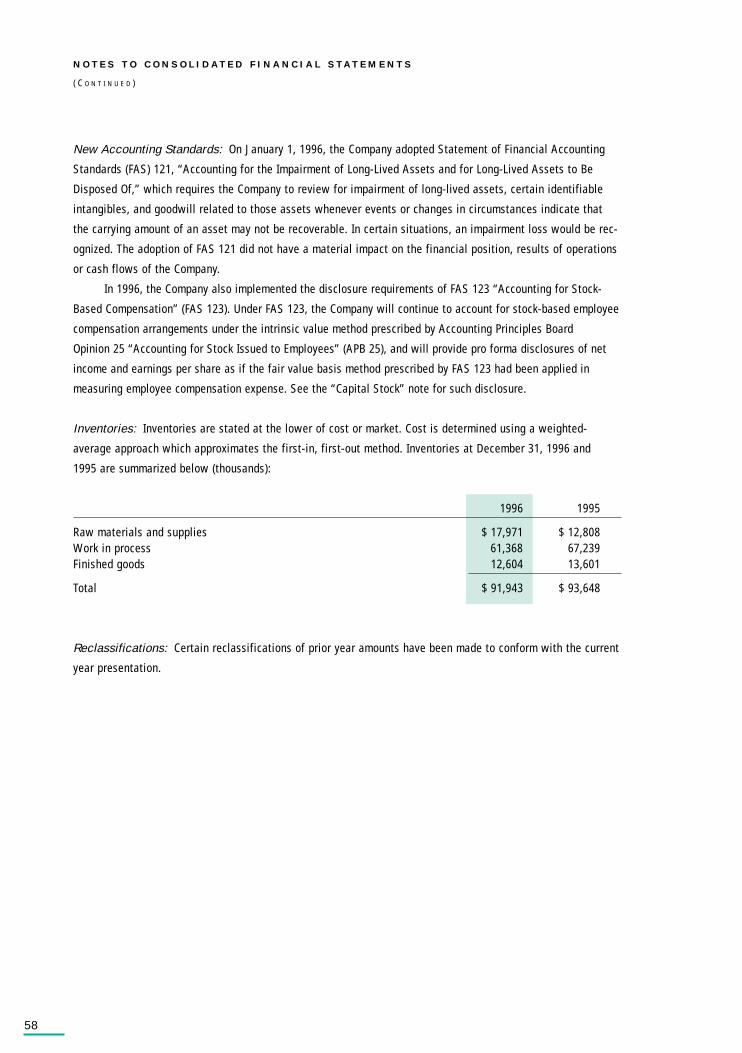
Inventories: Inventories are stated at the lower of cost or market. Cost is determined using a weighted-
average approach which approximates the first-in, first-out method. Inventories at December 31, 1996 and
1995 are summarized below (thousands):
1996 1995
Raw materials and supplies $ 17,971 $ 12,808Work in process 61,368 67,239Finished goods 12,604 13,601
Total $ 91,943 $ 93,648
Reclassifications: Certain reclassifications of prior year amounts have been made to conform with the current
year presentation.
N O T E S T O C O N S O L I D A T E D F I N A N C I A L S T A T E M E N T S
( C O N T I N U E D )
58

S I G N I F I C A N T C U S T O M E R A N D G E O G R A P H I C I N F O R M A T I O N
HLR contributed approximately 14% of the Company’s total revenues in 1996, and contributed less than 10% in
1995 and 1994. See the “Related Party Transactions” note below for further information. Two major customers,
Caremark, Inc. and Bergen Brunswig, contributed 10% or more of the Company’s total revenues. Caremark, Inc.,
which accounted for 15%, 18% and 21% of total revenues in 1996, 1995 and 1994, respectively, distributes
Protropin, Nutropin, Pulmozyme and Actimmune through its extensive branch network and is then reimbursed
through a variety of sources. Bergen Brunswig, a wholesale distributor of all of the Company’s products, con-
tributed 10% of revenues in 1996 and 11% in each of the years 1995 and 1994.
Approximate foreign sources of revenues were as follows (millions):
1996 1995 1994
Europe $ 146.4 $ 112.0 $ 81.8Asia 17.8 23.6 19.5Canada 11.1 25.0 9.7
The Company currently sells primarily to distributors and hospitals throughout the U.S., performs ongoing credit
evaluations of its customers’ financial condition and generally requires no collateral. In 1996, 1995 and 1994, the
Company did not record any material additions to, or losses against, its provision for doubtful accounts.
R E S E A R C H A N D D E V E L O P M E N T A R R A N G E M E N T S
To gain access to potential new products and technologies and to utilize other companies to help develop the
Company’s potential new products, the Company has established strategic alliances with, including the acquisi-
tion of both marketable and non-marketable equity investments and convertible debt in, companies developing
technologies that fall outside the Company’s research focus and with companies having the potential to gener-
ate new products through technology exchanges and investments. Potential future payments may be due to cer-
tain collaborative partners if the partners achieve certain benchmarks as defined in the collaborative agree-
ments. The Company has also entered into product-specific collaborations to acquire development and market-
ing rights for products.
S P E C I A L C H A R G E
The $25.0 million special charge in 1995 includes $21.0 million related to the merger agreement (the
Agreement) with Roche Holdings, Inc. (Roche), discussed in the note “Relationship with Roche Holdings, Inc.,”
and $4.0 million of charges associated with the resignation of the Company’s former President and Chief
Executive Officer. The merger expenses include legal expenses, investment banking fees, filing fees and other
costs related to the Agreement with Roche, as well as charges associated with the settlement of stockholder
lawsuits filed after the transaction was announced.
59
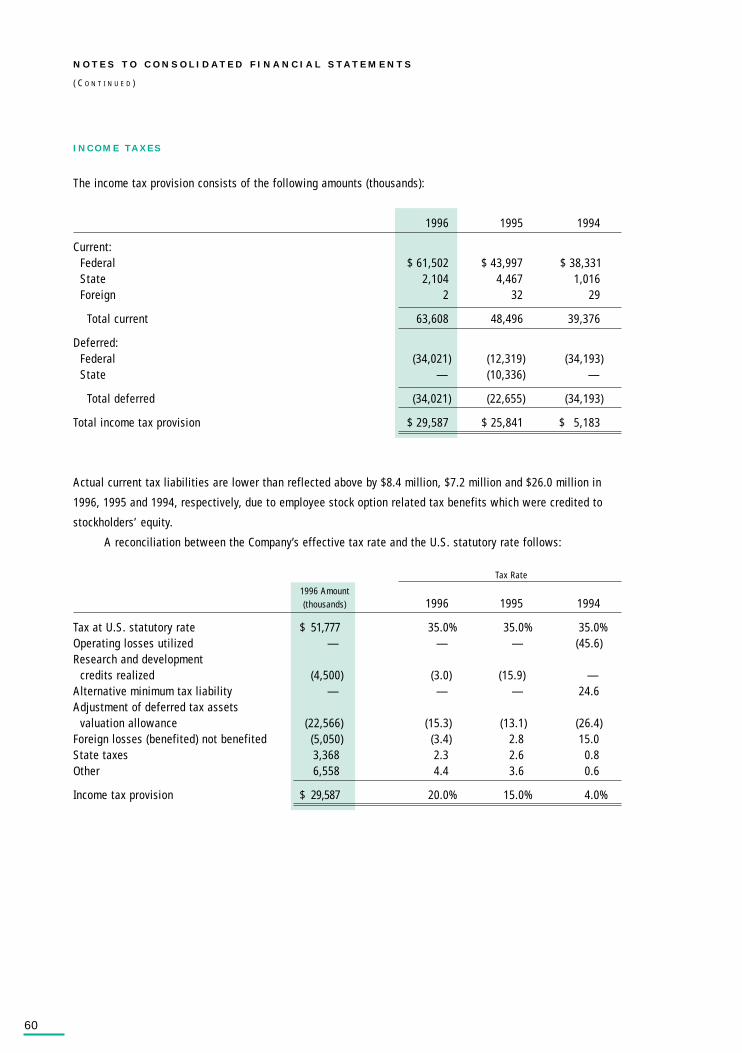
I N C O M E T A X E S
The income tax provision consists of the following amounts (thousands):
1996 1995 1994
Current:Federal $ 61,502 $ 43,997 $ 38,331State 2,104 4,467 1,016Foreign 2 32 29
Total current 63,608 48,496 39,376
Deferred:Federal (34,021) (12,319) (34,193)State — (10,336) —
Total deferred (34,021) (22,655) (34,193)
Total income tax provision $ 29,587 $ 25,841 $ 5,183
Actual current tax liabilities are lower than reflected above by $8.4 million, $7.2 million and $26.0 million in
1996, 1995 and 1994, respectively, due to employee stock option related tax benefits which were credited to
stockholders’ equity.
A reconciliation between the Company’s effective tax rate and the U.S. statutory rate follows:
Tax Rate
1996 Amount(thousands) 1996 1995 1994
Tax at U.S. statutory rate $ 51,777 35.0% 35.0% 35.0%Operating losses utilized — — — (45.6)Research and development
credits realized (4,500) (3.0) (15.9) —Alternative minimum tax liability — — — 24.6Adjustment of deferred tax assets
valuation allowance (22,566) (15.3) (13.1) (26.4)Foreign losses (benefited) not benefited (5,050) (3.4) 2.8 15.0State taxes 3,368 2.3 2.6 0.8Other 6,558 4.4 3.6 0.6
Income tax provision $ 29,587 20.0% 15.0% 4.0%
N O T E S T O C O N S O L I D A T E D F I N A N C I A L S T A T E M E N T S
( C O N T I N U E D )
60
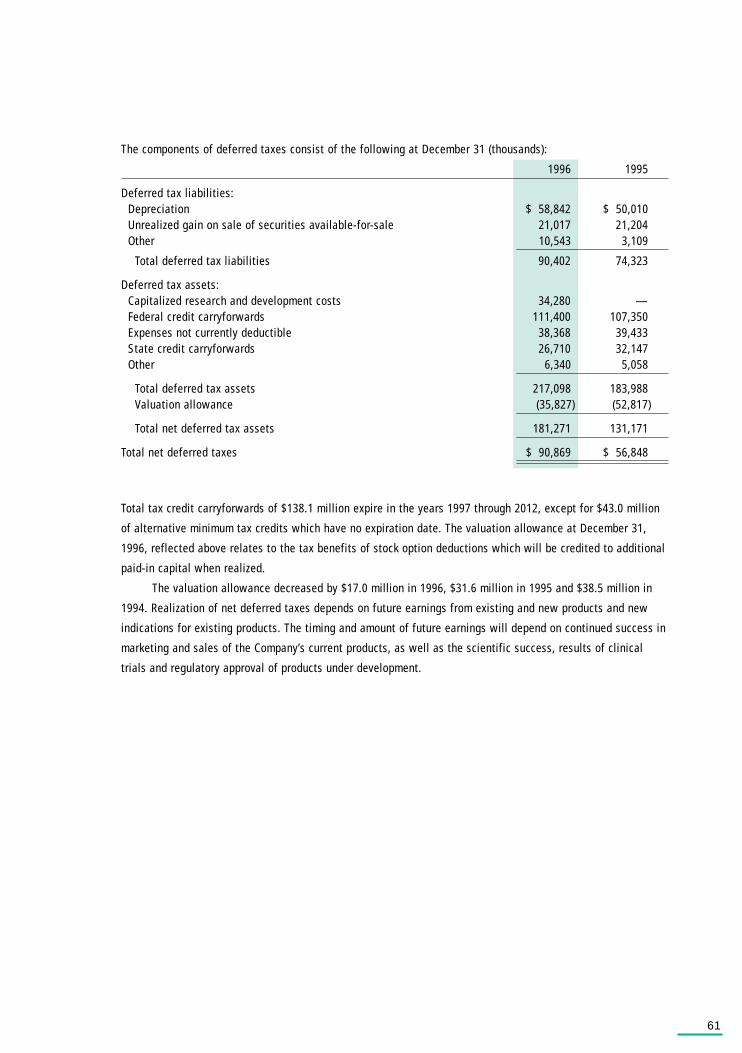
The components of deferred taxes consist of the following at December 31 (thousands):
1996 1995
Deferred tax liabilities:Depreciation $ 58,842 $ 50,010Unrealized gain on sale of securities available-for-sale 21,017 21,204Other 10,543 3,109
Total deferred tax liabilities 90,402 74,323
Deferred tax assets:Capitalized research and development costs 34,280 —Federal credit carryforwards 111,400 107,350Expenses not currently deductible 38,368 39,433State credit carryforwards 26,710 32,147Other 6,340 5,058
Total deferred tax assets 217,098 183,988Valuation allowance (35,827) (52,817)
Total net deferred tax assets 181,271 131,171
Total net deferred taxes $ 90,869 $ 56,848
Total tax credit carryforwards of $138.1 million expire in the years 1997 through 2012, except for $43.0 million
of alternative minimum tax credits which have no expiration date. The valuation allowance at December 31,
1996, reflected above relates to the tax benefits of stock option deductions which will be credited to additional
paid-in capital when realized.
The valuation allowance decreased by $17.0 million in 1996, $31.6 million in 1995 and $38.5 million in
1994. Realization of net deferred taxes depends on future earnings from existing and new products and new
indications for existing products. The timing and amount of future earnings will depend on continued success in
marketing and sales of the Company’s current products, as well as the scientific success, results of clinical
trials and regulatory approval of products under development.
61
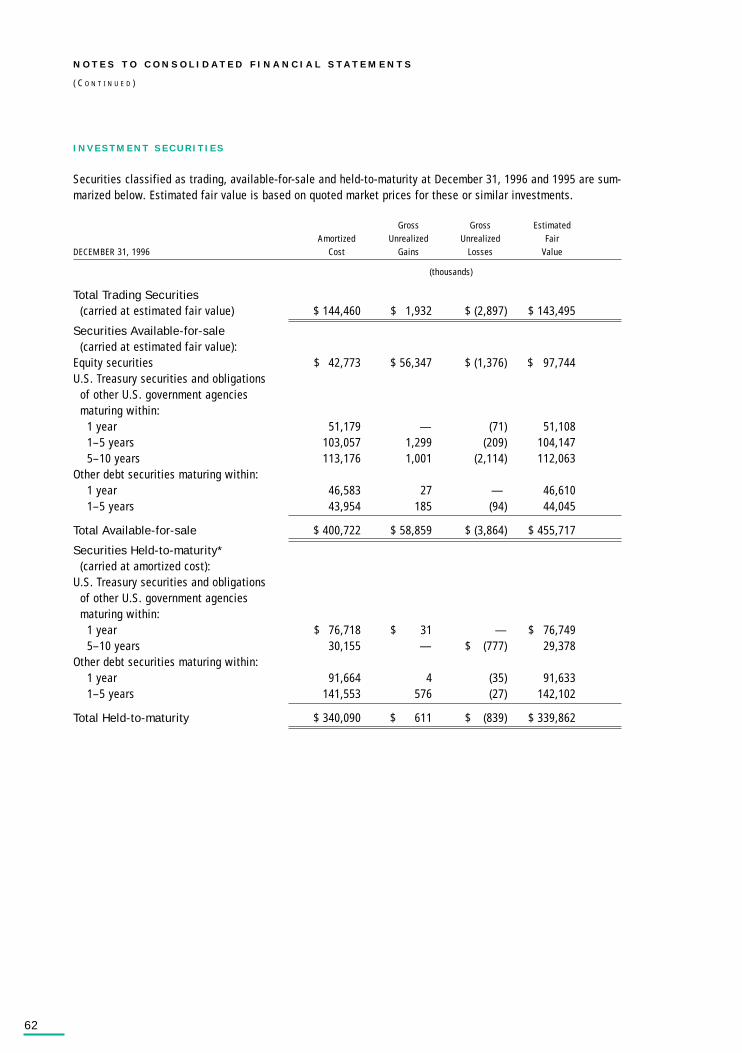
I N V E S T M E N T S E C U R I T I E S
Securities classified as trading, available-for-sale and held-to-maturity at December 31, 1996 and 1995 are sum-marized below. Estimated fair value is based on quoted market prices for these or similar investments.
Gross Gross EstimatedAmortized Unrealized Unrealized Fair
DECEMBER 31, 1996 Cost Gains Losses Value
(thousands)
Total Trading Securities(carried at estimated fair value) $ 144,460 $ 1,932 $ (2,897) $ 143,495
Securities Available-for-sale(carried at estimated fair value):
Equity securities $ 42,773 $ 56,347 $ (1,376) $ 97,744U.S. Treasury securities and obligations
of other U.S. government agencies maturing within:
1 year 51,179 — (71) 51,1081–5 years 103,057 1,299 (209) 104,147 5–10 years 113,176 1,001 (2,114) 112,063
Other debt securities maturing within:1 year 46,583 27 — 46,6101–5 years 43,954 185 (94) 44,045
Total Available-for-sale $ 400,722 $ 58,859 $ (3,864) $ 455,717
Securities Held-to-maturity*(carried at amortized cost):
U.S. Treasury securities and obligationsof other U.S. government agenciesmaturing within:
1 year $ 76,718 $ 31 — $ 76,7495–10 years 30,155 — $ (777) 29,378
Other debt securities maturing within:1 year 91,664 4 (35) 91,6331–5 years 141,553 576 (27) 142,102
Total Held-to-maturity $ 340,090 $ 611 $ (839) $ 339,862
N O T E S T O C O N S O L I D A T E D F I N A N C I A L S T A T E M E N T S
( C O N T I N U E D )
62
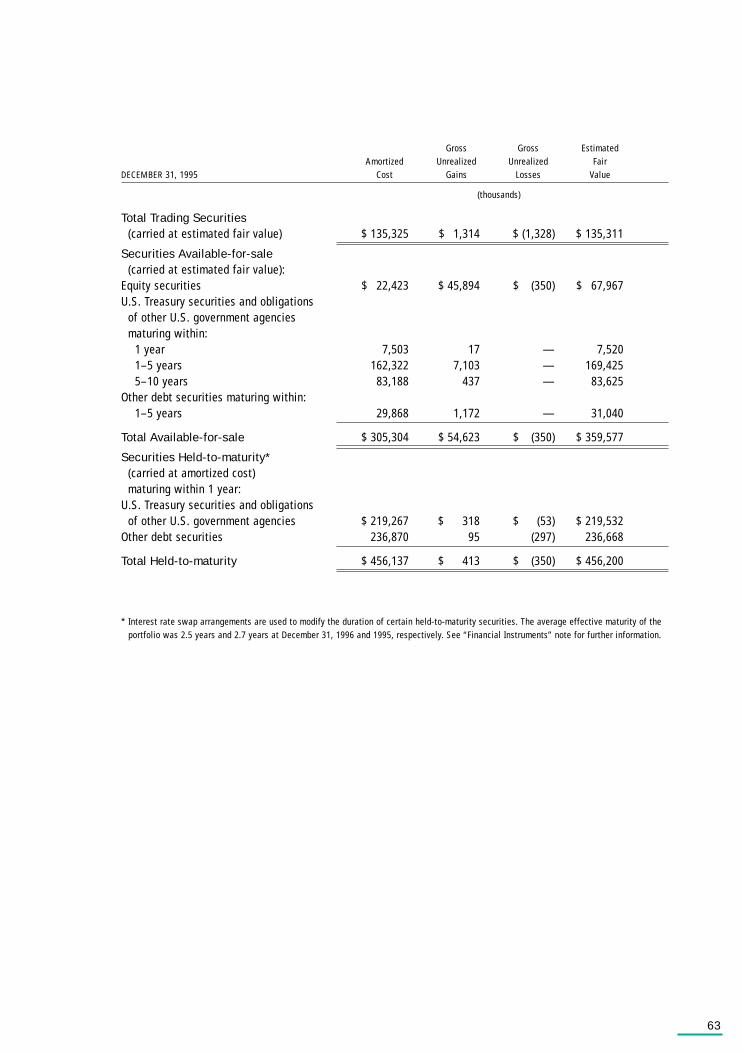
Gross Gross EstimatedAmortized Unrealized Unrealized Fair
DECEMBER 31, 1995 Cost Gains Losses Value
(thousands)
Total Trading Securities(carried at estimated fair value) $ 135,325 $ 1,314 $ (1,328) $ 135,311
Securities Available-for-sale(carried at estimated fair value):
Equity securities $ 22,423 $ 45,894 $ (350) $ 67,967U.S. Treasury securities and obligations
of other U.S. government agenciesmaturing within:
1 year 7,503 17 — 7,5201–5 years 162,322 7,103 — 169,4255–10 years 83,188 437 — 83,625
Other debt securities maturing within:1–5 years 29,868 1,172 — 31,040
Total Available-for-sale $ 305,304 $ 54,623 $ (350) $ 359,577
Securities Held-to-maturity*(carried at amortized cost)maturing within 1 year:
U.S. Treasury securities and obligationsof other U.S. government agencies $ 219,267 $ 318 $ (53) $ 219,532
Other debt securities 236,870 95 (297) 236,668
Total Held-to-maturity $ 456,137 $ 413 $ (350) $ 456,200
* Interest rate swap arrangements are used to modify the duration of certain held-to-maturity securities. The average effective maturity of theportfolio was 2.5 years and 2.7 years at December 31, 1996 and 1995, respectively. See “Financial Instruments” note for further information.
63
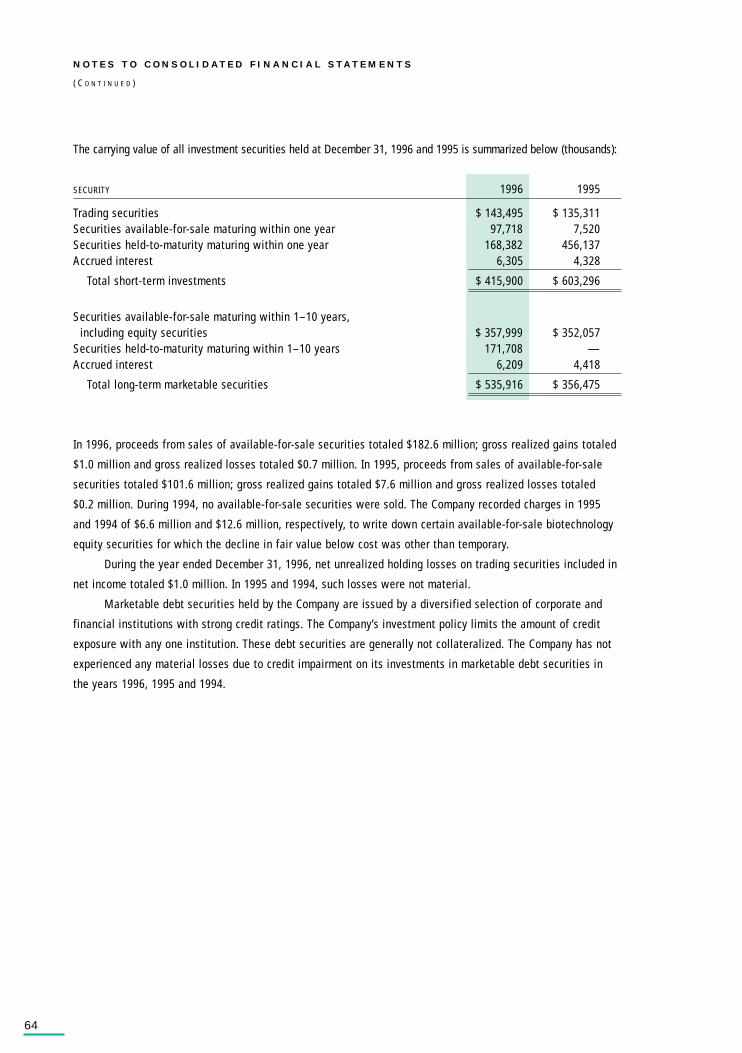
The carrying value of all investment securities held at December 31, 1996 and 1995 is summarized below (thousands):
SECURITY 1996 1995
Trading securities $ 143,495 $ 135,311Securities available-for-sale maturing within one year 97,718 7,520Securities held-to-maturity maturing within one year 168,382 456,137Accrued interest 6,305 4,328
Total short-term investments $ 415,900 $ 603,296
Securities available-for-sale maturing within 1–10 years,including equity securities $ 357,999 $ 352,057
Securities held-to-maturity maturing within 1–10 years 171,708 —Accrued interest 6,209 4,418
Total long-term marketable securities $ 535,916 $ 356,475
In 1996, proceeds from sales of available-for-sale securities totaled $182.6 million; gross realized gains totaled
$1.0 million and gross realized losses totaled $0.7 million. In 1995, proceeds from sales of available-for-sale
securities totaled $101.6 million; gross realized gains totaled $7.6 million and gross realized losses totaled
$0.2 million. During 1994, no available-for-sale securities were sold. The Company recorded charges in 1995
and 1994 of $6.6 million and $12.6 million, respectively, to write down certain available-for-sale biotechnology
equity securities for which the decline in fair value below cost was other than temporary.
During the year ended December 31, 1996, net unrealized holding losses on trading securities included in
net income totaled $1.0 million. In 1995 and 1994, such losses were not material.
Marketable debt securities held by the Company are issued by a diversified selection of corporate and
financial institutions with strong credit ratings. The Company’s investment policy limits the amount of credit
exposure with any one institution. These debt securities are generally not collateralized. The Company has not
experienced any material losses due to credit impairment on its investments in marketable debt securities in
the years 1996, 1995 and 1994.
N O T E S T O C O N S O L I D A T E D F I N A N C I A L S T A T E M E N T S
( C O N T I N U E D )
64
F I N A N C I A L I N S T R U M E N T S
Foreign Currency Instruments: Certain of the Company’s revenues are earned outside of the United States.
Moreover, the Company’s foreign currency denominated revenues exceed its foreign currency denominated
expenses; therefore, risk exists that net income may be impacted by changes in the exchange rates between the
U.S. dollar and foreign currencies. To hedge anticipated non-dollar denominated net revenues, the Company
currently purchases options and enters into forward contracts. At December 31, 1996, the Company had hedged
approximately 90% of probable net foreign revenues anticipated within 12 months and between 20% and 45%
of its probable net foreign revenues through 2000. At December 31, 1996 and 1995, the notional amount of the
options totaled $100.3 million and $72.8 million, respectively, and consisted of the following currencies:
Australian dollars, Canadian dollars, German marks, Spanish pesetas, French francs, British pounds, Italian lire,
Japanese yen, and Swedish krona. All option contracts mature within the next four years. The fair value of the
options, which is based on exchange rates and market conditions at December 31, 1996 and 1995, totaled
$7.3 million and $6.3 million, respectively. At December 31, 1996 and 1995, the U.S. dollar equivalent of the
notional amount of the forward sell contracts was $34.3 million and $6.0 million, respectively, and the forward
buy contracts totaled $0.4 million and $6.2 million, respectively.
Credit exposure is limited to the unrealized gains on these contracts. All agreements are with a diversi-
fied selection of institutions with strong credit ratings which minimizes risk of loss due to nonpayment from
the counterparty. The Company has not experienced any losses due to credit impairment of its foreign currency
instruments.
Interest Rate Swaps: Interest income is subject to fluctuations as U.S. interest rates change. To manage
this risk, the Company periodically establishes duration targets for its investment portfolio that reflect its
anticipated use of cash and fluctuations in market rates of interest. The Company enters into interest rate
swaps (swaps) as part of its overall strategy of managing the duration of its cash portfolio. For each swap, the
Company receives interest based on fixed rates and pays interest to counterparties based on floating rates
(three- or six-month London Inter-Bank Offered Rate (LIBOR)) on a notional principal amount. By designating a
swap with a pool of short-term securities equal in size to the notional amount of the swap, an instrument with
an effective interest rate and maturity equal to the term of the swap is created. Increases (decreases) in swap
variable payments caused by rising (falling) interest rates will be essentially offset by increased (reduced) inter-
est income on the related short-term investments, while the fixed rate payments received from the swap coun-
terparty establish the Company’s interest income. LIBOR payments received on swaps are highly correlated to
interest collections on short-term investments. The use of swaps in this manner generates net interest income
on the swap and the associated pool of short-term securities equivalent to interest income that would be
earned from a high-grade corporate security of the same maturity as the swap, while reducing credit risk (there
is no principal invested in a swap). The Company’s credit exposure on swaps is limited to the value of the inter-
est rate swaps that have become favorable to the Company and any net interest earned but not yet received.
The Company’s swap counterparties have strong credit ratings which minimize the risk of non-performance on
the swaps. The Company has not experienced any material losses due to credit impairment. The Company’s
credit exposure on swaps as of December 31, 1996 and 1995, was $6.8 million and $24.1 million, respectively.
The net carrying amount of the swaps, which reflects the net interest accrued for such swaps, totaled $2.1
million and $7.2 million at December 31, 1996 and 1995, respectively, and is included in accounts receivable.
65
The Company targets the average maturity of its investment portfolio (including cash, cash equivalents,
short-term and long-term investments, swaps, and excluding equity securities) based on its anticipated use of
cash and fluctuations in the market rates of interest. The maturity of the investment portfolio (including swaps)
ranges from overnight funds used for near-term working capital purposes to investments maturing within the next
one to ten years for future working capital, capital expenditures, strategic investments and debt repayment.
The notional amount of each swap is equal to the amount of designated high-quality short-term invest-
ments which are expected to be invested in during the life of the swap. The anticipated investments include
U.S. Treasury securities, U.S. government agency securities, commercial paper and corporate debt obligations.
Swaps are used to extend the maturity of the investment portfolio.
For the years ended December 31, 1996 and 1995, the weighted average rate received on swaps was
6.71% and 7.29%, respectively, and the weighted average rate paid on swaps was 5.68% and 6.56%, respec-
tively. Net interest income (loss) from swaps, including amortization of net losses on terminated swaps, totaled
$2.5 million in 1996 and ($0.7) million in 1995.
During 1995, to reduce the average effective maturity of its portfolio, the Company terminated certain
swap agreements prior to maturity and is amortizing the realized gains and losses over the original contractual
term of the swaps as a reduction to interest income. At December 31, 1996, net losses of $0.7 million remained
unamortized; $0.5 million will be recognized in 1997 and $0.2 million will be recognized in 1998.
Equity Collar Instruments: To hedge against fluctuations in the market value of a portion of the marketable
equity portfolio, the Company has entered into costless collar instruments, a form of equity collar instrument,
that expire in 1998 and 1999 and will require settlement in equity securities or cash. A costless collar instru-
ment is a purchased put option and a written call option on a specific equity security such that the cost of the
purchased put and the proceeds of the written call offset each other; therefore, there is no initial cost or cash
outflow for these instruments. The fair value of the purchased puts and the written calls were determined
based on quoted market prices at year end. At December 31, 1996, the notional amount of the put and call
options were $17.2 million and $27.5 million, respectively.
N O T E S T O C O N S O L I D A T E D F I N A N C I A L S T A T E M E N T S
( C O N T I N U E D )
66
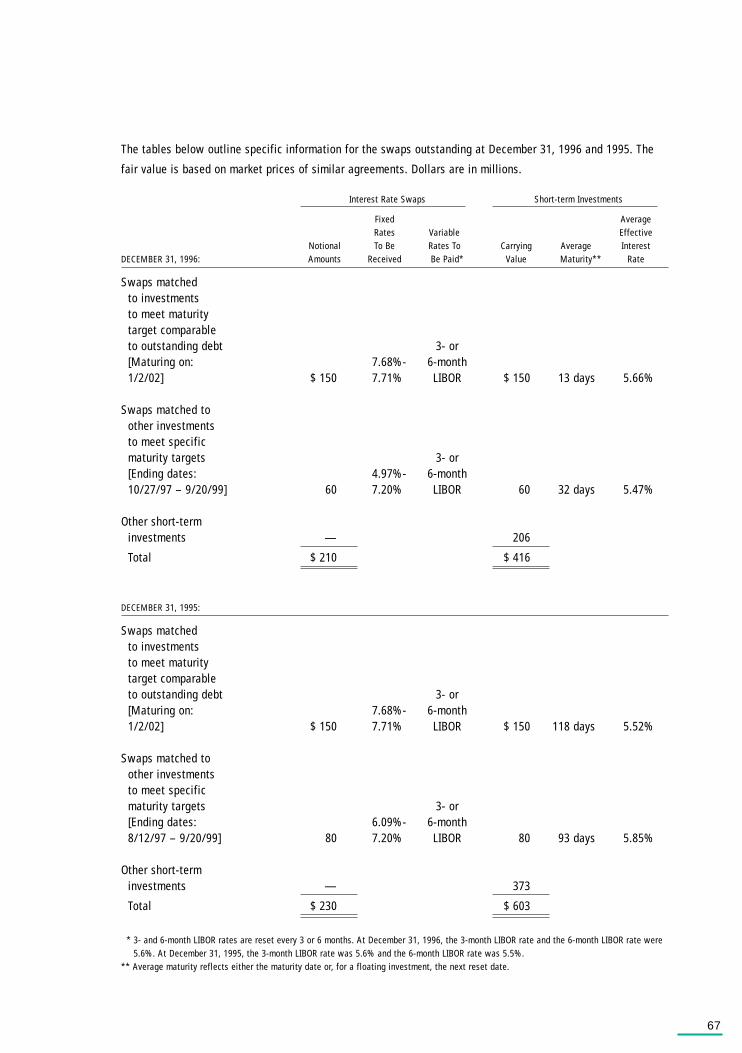
67
The tables below outline specific information for the swaps outstanding at December 31, 1996 and 1995. The
fair value is based on market prices of similar agreements. Dollars are in millions.
Interest Rate Swaps Short-term Investments
Fixed AverageRates Variable Effective
Notional To Be Rates To Carrying Average InterestDECEMBER 31, 1996: Amounts Received Be Paid* Value Maturity** Rate
Swaps matchedto investmentsto meet maturity target comparableto outstanding debt 3- or[Maturing on: 7.68%- 6-month1/2/02] $ 150 7.71% LIBOR $ 150 13 days 5.66%
Swaps matched toother investmentsto meet specificmaturity targets 3- or[Ending dates: 4.97%- 6-month10/27/97 – 9/20/99] 60 7.20% LIBOR 60 32 days 5.47%
Other short-term investments — 206
Total $ 210 $ 416
DECEMBER 31, 1995:
Swaps matchedto investmentsto meet maturity target comparableto outstanding debt 3- or[Maturing on: 7.68%- 6-month1/2/02] $ 150 7.71% LIBOR $ 150 118 days 5.52%
Swaps matched toother investmentsto meet specificmaturity targets 3- or[Ending dates: 6.09%- 6-month8/12/97 – 9/20/99] 80 7.20% LIBOR 80 93 days 5.85%
Other short-terminvestments — 373
Total $ 230 $ 603
* 3- and 6-month LIBOR rates are reset every 3 or 6 months. At December 31, 1996, the 3-month LIBOR rate and the 6-month LIBOR rate were5.6%. At December 31, 1995, the 3-month LIBOR rate was 5.6% and the 6-month LIBOR rate was 5.5%.
** Average maturity reflects either the maturity date or, for a floating investment, the next reset date.

68
Financial Instruments Held for Trading Purposes: As part of its overall investment strategy, the Company
has contracted with two external money managers to manage part of its investment portfolio. One portfolio,
which had a carrying value of $37.2 million at December 31, 1996, and $34.9 million at December 31, 1995,
consisted of primarily non-dollar denominated investments. To hedge the non-dollar denominated investments,
the money manager enters into forward contracts. The fair value at December 31, 1996 and 1995, of the forward
contracts totaled $0.8 million and $0.1 million, respectively. The average fair value during 1996 and 1995
totaled $0.3 million and $0.1 million, respectively. Net realized and unrealized trading gains on the portfolio
totaled approximately $2.4 million in 1996 and $3.8 million in 1995, and are included in interest income.
Counterparties have strong credit ratings which minimize the risk of non-performance from the counterparties.
Summary of Fair Values: The table below summarizes the carrying value and fair value at December 31, 1996
and 1995, of the Company’s financial instruments. The fair value of the long-term debt was estimated based on
the quoted market price at year end.
1996 1995Carrying Fair Carrying Fair
FINANCIAL INSTRUMENT Value Value Value Value
(thousands)
Assets:Investment securities
(including accrued interest and traded forward contracts) $ 951,816 $ 951,588 $ 959,771 $ 959,834
Purchased foreign exchange put options 4,616 7,273 2,345 6,300Outstanding interest rate swaps (net) 2,122 11,555 7,194 23,940
Liabilities:Short-term and long-term debt 150,000 139,500 150,358 147,750Equity collars 1,222 4,892 — —Foreign exchange forward contracts 138 138 237 237
O T H E R A C C R U E D L I A B I L I T I E S
Other accrued liabilities at December 31 are as follows (thousands):
1996 1995
Accrued compensation $ 42,716 $ 36,945Accrued clinical and other studies 39,981 27,290Accrued royalties 25,098 23,159Accrued marketing and promotion costs 11,889 18,863Income taxes payable 18,530 14,329Other 56,328 67,012
Total other accrued liabilities $ 194,542 $ 187,598
N O T E S T O C O N S O L I D A T E D F I N A N C I A L S T A T E M E N T S
( C O N T I N U E D )
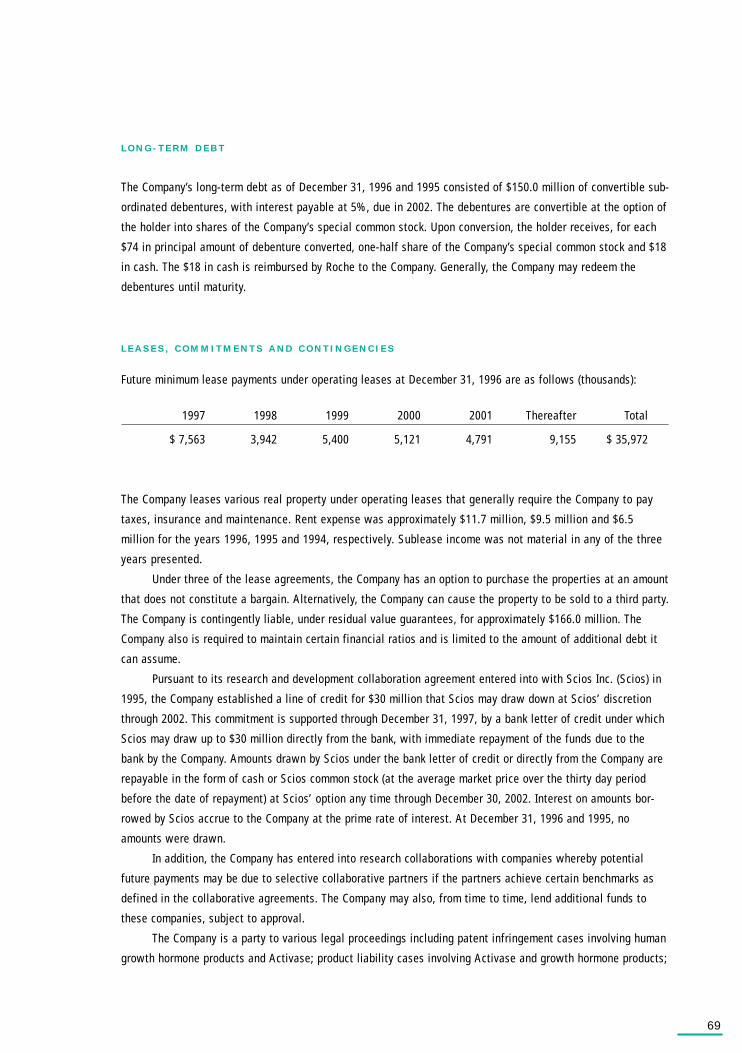
L O N G - T E R M D E B T
The Company’s long-term debt as of December 31, 1996 and 1995 consisted of $150.0 million of convertible sub-
ordinated debentures, with interest payable at 5%, due in 2002. The debentures are convertible at the option of
the holder into shares of the Company’s special common stock. Upon conversion, the holder receives, for each
$74 in principal amount of debenture converted, one-half share of the Company’s special common stock and $18
in cash. The $18 in cash is reimbursed by Roche to the Company. Generally, the Company may redeem the
debentures until maturity.
L E A S E S , C O M M I T M E N T S A N D C O N T I N G E N C I E S
Future minimum lease payments under operating leases at December 31, 1996 are as follows (thousands):
1997 1998 1999 2000 2001 Thereafter Total
$ 7,563 3,942 5,400 5,121 4,791 9,155 $ 35,972
The Company leases various real property under operating leases that generally require the Company to pay
taxes, insurance and maintenance. Rent expense was approximately $11.7 million, $9.5 million and $6.5
million for the years 1996, 1995 and 1994, respectively. Sublease income was not material in any of the three
years presented.
Under three of the lease agreements, the Company has an option to purchase the properties at an amount
that does not constitute a bargain. Alternatively, the Company can cause the property to be sold to a third party.
The Company is contingently liable, under residual value guarantees, for approximately $166.0 million. The
Company also is required to maintain certain financial ratios and is limited to the amount of additional debt it
can assume.
Pursuant to its research and development collaboration agreement entered into with Scios Inc. (Scios) in
1995, the Company established a line of credit for $30 million that Scios may draw down at Scios’ discretion
through 2002. This commitment is supported through December 31, 1997, by a bank letter of credit under which
Scios may draw up to $30 million directly from the bank, with immediate repayment of the funds due to the
bank by the Company. Amounts drawn by Scios under the bank letter of credit or directly from the Company are
repayable in the form of cash or Scios common stock (at the average market price over the thirty day period
before the date of repayment) at Scios’ option any time through December 30, 2002. Interest on amounts bor-
rowed by Scios accrue to the Company at the prime rate of interest. At December 31, 1996 and 1995, no
amounts were drawn.
In addition, the Company has entered into research collaborations with companies whereby potential
future payments may be due to selective collaborative partners if the partners achieve certain benchmarks as
defined in the collaborative agreements. The Company may also, from time to time, lend additional funds to
these companies, subject to approval.
The Company is a party to various legal proceedings including patent infringement cases involving human
growth hormone products and Activase; product liability cases involving Activase and growth hormone products;
69

and class action lawsuits regarding Protropin. In addition, in 1995 the Company received and responded to
grand jury document subpoenas from the United States District Court for the Northern District of California for
documents relating to the Company’s clinical, sales and marketing activities associated with human growth
hormone. In February 1997, the Company received another grand jury document subpoena from the same court
related to the same subject matter. Based upon the nature of the claims made and the investigations completed
to date by the Company and its counsel, the Company believes the outcome of these actions will not have a
material adverse effect on the financial position, results of operations or cash flows of the Company. However,
were an unfavorable ruling to occur in any quarterly period, there exists the possibility of a material impact on
the net income of that period.
R E L A T I O N S H I P W I T H R O C H E H O L D I N G S , I N C .
On October 25, 1995, the Company and Roche entered into a new agreement (the Agreement). Each share of the
Company’s common stock not held by Roche or its affiliates on that date automatically converted to one share of
callable putable common stock (special common stock). The Agreement extends until June 30, 1999, Roche’s
option to cause the Company to redeem (call) the outstanding special common stock of the Company at predeter-
mined prices. Should the call be exercised, Roche will concurrently purchase from the Company a like number of
common shares for a price equal to the Company’s cost to redeem the special common stock. During the quarter
beginning January 1, 1997, the call price is $69.25 per share; it increases by $1.25 in the following quarter, then
increases by $1.50 per share each quarter through the end of the option period on June 30, 1999, on which date
the price is $82.50 per share. If Roche does not cause the redemption as of June 30, 1999, the Company ’s
stockholders will have the option (the put) to cause the Company to redeem none, some, or all of their shares of
special common stock at $60.00 per share (and Roche will concurrently provide the necessary redemption funds
to the Company by purchasing a like number of shares of common stock at $60.00 per share) within thirty busi-
ness days commencing July 1, 1999. Roche Holding Ltd, a Swiss corporation, has guaranteed Roche’s obligation
under the put.
In conjunction with the Agreement, HLR was granted an option for ten years for licenses to use and sell
certain of the Company’s products in non-U.S. markets. As a general matter, such option for a Genentech product
must be exercised at, or prior to if the Company mutually agrees, the conclusion of phase II clinical trials for each
product. In general, for each product for which HLR exercises its option, the Company and HLR will share equally
all development expenses incurred by the Company through the option exercise date and prospectively with
respect to the development of the product in the United States. HLR will pay all non-U.S. development expenses.
At the Company’s election, and with HLR’s consent, HLR may reimburse the Company for HLR’s share of develop-
ment costs incurred prior to HLR’s option exercise date, either by payment of such costs at the time of the option
exercise or by making payments prospectively until HLR’s share has been fully reimbursed to the Company.
In general, HLR pays a royalty of 12.5% until a product reaches $100 million in aggregate sales outside of
the U.S., at which time the royalty rate increases to 15%. In addition, HLR has exclusive rights to, and pays the
Company 20% royalties on, Canadian sales of the Company’s existing products and European sales of
Pulmozyme. Consequently, in the fourth quarter of 1995, the Company transferred to HLR the rights to its
Canadian product sales and European sales of Pulmozyme, and commenced recording royalty revenue from HLR
on such sales. The Company supplies its products to HLR, and has agreed to supply products for which HLR has
exercised its option, for sales outside of the U.S. at cost plus 20%.
N O T E S T O C O N S O L I D A T E D F I N A N C I A L S T A T E M E N T S
( C O N T I N U E D )
70
Under the Agreement, independent of its right to cause the Company to redeem the special common stock, Roche
may increase its ownership of the Company up to 79.9% by making purchases on the open market. Roche holds approxi-
mately 66.0% of the outstanding common equity of the Company as of December 31, 1996. In January and February
1997, Roche purchased additional shares of the Company’s common equity increasing Roche’s holdings to 68.0%.
R E L A T E D P A R T Y T R A N S A C T I O N S
The Company has transactions with Roche, HLR (a wholly owned subsidiary of Roche, with two officers on the
Company’s Board of Directors), and its affiliates in the ordinary course of business. In 1996, HLR exercised its
option under the Agreement with respect to the development of three projects—IDEC-C2B8, insulin-like growth
factor (IGF-1) and nerve growth factor (NGF). The Company recorded non-recurring contract revenues of
$58.2 million relating to the option exercises. Other contract revenue from HLR, including reimbursement for
ongoing development expenses after the option exercise date for the three projects, totaled $37.1 million in
1996, $13.4 million in 1995 and $17.1 million in 1994. All other revenue from Roche, HLR and their affiliates,
principally royalties under previous product licensing agreements, and royalties and product sales under the
Agreement, totaled $39.5 million in 1996, $14.3 million in 1995 and $8.5 million in 1994. During the three years,
the Company has collaborated with HLR on other projects.
C A P I T A L S T O C K
Common Stock, Special Common Stock and Redeemable Common Stock
After the close of business on June 30, 1995, each share of the Company’s redeemable common stock automati-
cally converted to one share of Genentech common stock, in accordance with the terms of the redeemable
common stock put in place at the time of its issuance in 1990 and as described in Genentech’s Certificate of
Incorporation. On October 25, 1995, pursuant to the Agreement with Roche, each share of the Company’s com-
mon stock not held by Roche or its affiliates automatically converted to one share of callable putable common
stock (special common stock). See the “Relationship with Roche Holdings, Inc.” note above for a discussion of
these transactions.
Stock Award Plans
The Company has stock option plans adopted in 1996, 1994, 1990 and 1984, which variously allow for the granting
of non-qualified stock options, incentive stock options and stock appreciation rights to employees, and the
granting of non-qualified stock options to directors and consultants of the Company. Generally, non-qualified
options have a maximum term of 20 years and incentive options have a maximum term of 10 years. In general,
options vest in increments over four years from the date of grant, although the Company may grant options with
different vesting terms from time to time. No stock appreciation rights have been granted to date.
The Company adopted the 1991 Employee Stock Plan (1991 Plan) on December 4, 1990, and amended it
during 1993 and 1995. All full-time employees of the Company are eligible to participate in the 1991 Plan. Of the
3,800,000 shares of special common stock reserved for issuance under the 1991 Plan, 2,865,196 shares have been
issued as of December 31, 1996. During 1996, 2,487 of the eligible employees participated in the 1991 Plan.
71
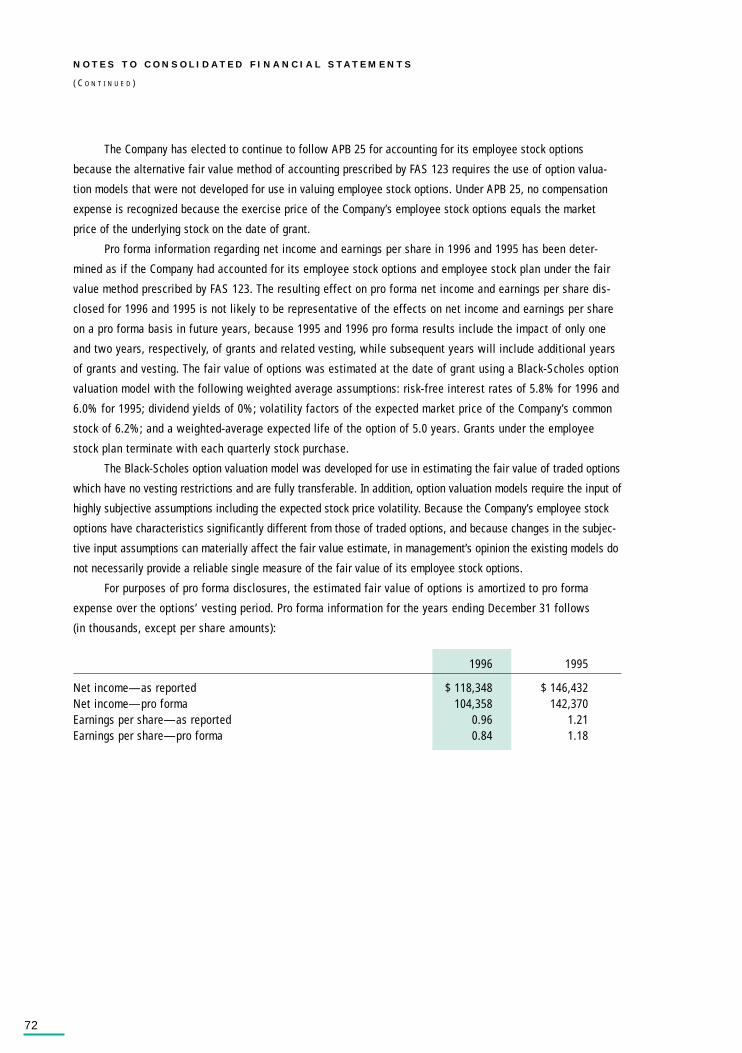
The Company has elected to continue to follow APB 25 for accounting for its employee stock options
because the alternative fair value method of accounting prescribed by FAS 123 requires the use of option valua-
tion models that were not developed for use in valuing employee stock options. Under APB 25, no compensation
expense is recognized because the exercise price of the Company’s employee stock options equals the market
price of the underlying stock on the date of grant.
Pro forma information regarding net income and earnings per share in 1996 and 1995 has been deter-
mined as if the Company had accounted for its employee stock options and employee stock plan under the fair
value method prescribed by FAS 123. The resulting effect on pro forma net income and earnings per share dis-
closed for 1996 and 1995 is not likely to be representative of the effects on net income and earnings per share
on a pro forma basis in future years, because 1995 and 1996 pro forma results include the impact of only one
and two years, respectively, of grants and related vesting, while subsequent years will include additional years
of grants and vesting. The fair value of options was estimated at the date of grant using a Black-Scholes option
valuation model with the following weighted average assumptions: risk-free interest rates of 5.8% for 1996 and
6.0% for 1995; dividend yields of 0%; volatility factors of the expected market price of the Company’s common
stock of 6.2%; and a weighted-average expected life of the option of 5.0 years. Grants under the employee
stock plan terminate with each quarterly stock purchase.
The Black-Scholes option valuation model was developed for use in estimating the fair value of traded options
which have no vesting restrictions and are fully transferable. In addition, option valuation models require the input of
highly subjective assumptions including the expected stock price volatility. Because the Company’s employee stock
options have characteristics significantly different from those of traded options, and because changes in the subjec-
tive input assumptions can materially affect the fair value estimate, in management’s opinion the existing models do
not necessarily provide a reliable single measure of the fair value of its employee stock options.
For purposes of pro forma disclosures, the estimated fair value of options is amortized to pro forma
expense over the options’ vesting period. Pro forma information for the years ending December 31 follows
(in thousands, except per share amounts):
1996 1995
Net income—as reported $ 118,348 $ 146,432Net income—pro forma 104,358 142,370Earnings per share—as reported 0.96 1.21Earnings per share—pro forma 0.84 1.18
N O T E S T O C O N S O L I D A T E D F I N A N C I A L S T A T E M E N T S
( C O N T I N U E D )
72
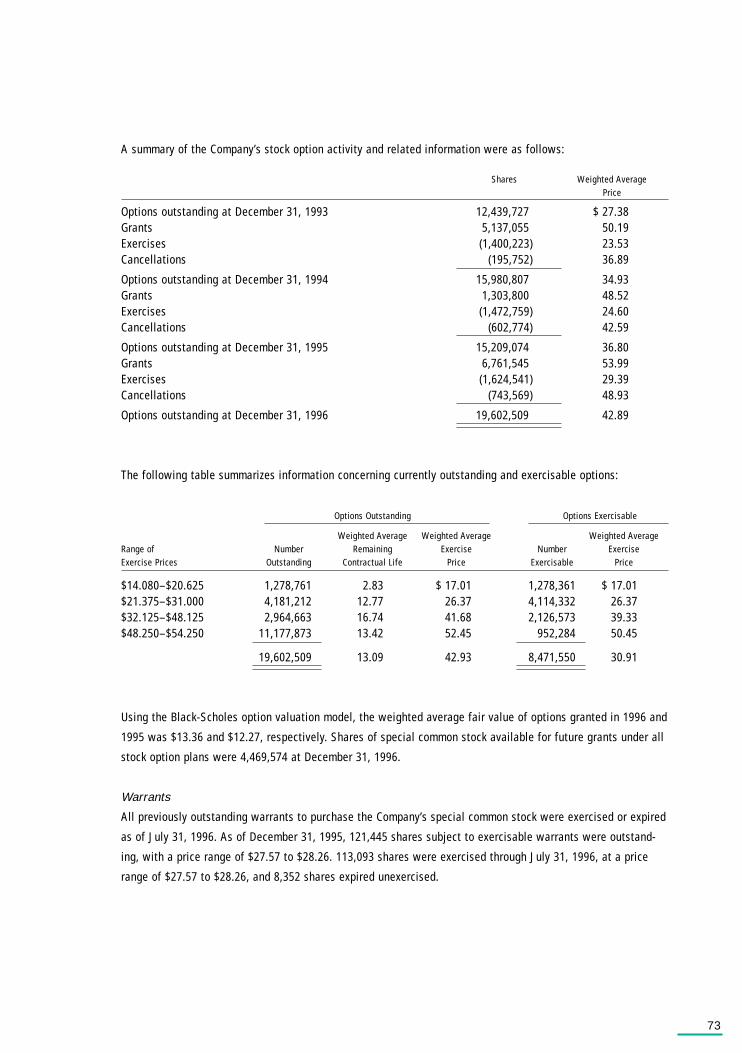
A summary of the Company’s stock option activity and related information were as follows:
Shares Weighted AveragePrice
Options outstanding at December 31, 1993 12,439,727 $ 27.38Grants 5,137,055 50.19Exercises (1,400,223) 23.53Cancellations (195,752) 36.89
Options outstanding at December 31, 1994 15,980,807 34.93Grants 1,303,800 48.52Exercises (1,472,759) 24.60Cancellations (602,774) 42.59
Options outstanding at December 31, 1995 15,209,074 36.80Grants 6,761,545 53.99Exercises (1,624,541) 29.39Cancellations (743,569) 48.93
Options outstanding at December 31, 1996 19,602,509 42.89
The following table summarizes information concerning currently outstanding and exercisable options:
Options Outstanding Options Exercisable
Weighted Average Weighted Average Weighted AverageRange of Number Remaining Exercise Number ExerciseExercise Prices Outstanding Contractual Life Price Exercisable Price
$14.080–$20.625 1,278,761 2.83 $ 17.01 1,278,361 $ 17.01$21.375–$31.000 4,181,212 12.77 26.37 4,114,332 26.37$32.125–$48.125 2,964,663 16.74 41.68 2,126,573 39.33$48.250–$54.250 11,177,873 13.42 52.45 952,284 50.45
19,602,509 13.09 42.93 8,471,550 30.91
Using the Black-Scholes option valuation model, the weighted average fair value of options granted in 1996 and
1995 was $13.36 and $12.27, respectively. Shares of special common stock available for future grants under all
stock option plans were 4,469,574 at December 31, 1996.
Warrants
All previously outstanding warrants to purchase the Company’s special common stock were exercised or expired
as of July 31, 1996. As of December 31, 1995, 121,445 shares subject to exercisable warrants were outstand-
ing, with a price range of $27.57 to $28.26. 113,093 shares were exercised through July 31, 1996, at a price
range of $27.57 to $28.26, and 8,352 shares expired unexercised.
73
Q U A S I - R E O R G A N I Z A T I O N
On October 1, 1987, the Company eliminated its accumulated deficit through an accounting reorganization of its
stockholders’ equity accounts (a quasi-reorganization) that did not involve any revaluation of assets or liabili-
ties. An accumulated deficit of $329.5 million was eliminated by a transfer from additional paid-in capital in an
amount equal to the accumulated deficit.
The Company has been recording, in income, the recognition of operating loss and tax credit carryforward
items arising prior to the quasi-reorganization due to the Company’s adoption of its quasi-reorganization in the
context of the accounting and quasi-reorganization literature existing at the date the quasi-reorganization was
effected. If the provisions of the subsequently issued Staff Accounting Bulletin 86 (SAB 86) had been applied,
net income in 1995 would have been reduced by $11.8 million or $.10 per share, and 1994 net income would
have been reduced by $39.7 million or $.33 per share, because SAB 86 would require that the tax benefits of
prior operating loss and tax credit carryforwards be reported as a direct addition to additional paid-in capital
rather than being recorded in the income statement. The Securities and Exchange Commission staff has indi-
cated that it would not object to the Company’s accounting for such tax benefits. As of June 30, 1995, the oper-
ating loss and tax credit carryforwards arising prior to the quasi-reorganization had been fully utilized, therefore
there was no impact on earnings in 1996.
N O T E S T O C O N S O L I D A T E D F I N A N C I A L S T A T E M E N T S
( C O N T I N U E D )
74

The Board of Directors and Stockholders of Genentech, Inc.
We have audited the accompanying consolidated balance sheets of Genentech, Inc. as of December 31, 1996 and
1995, and the related consolidated statements of income, stockholders’ equity, and cash flows for each of the three
years in the period ended December 31, 1996. These financial statements are the responsibility of the Company’s
management. Our responsibility is to express an opinion on these financial statements based on our audits.
We conducted our audits in accordance with generally accepted auditing standards. Those standards require
that we plan and perform the audit to obtain reasonable assurance about whether the financial statements are free
of material misstatement. An audit includes examining, on a test basis, evidence supporting the amounts and dis-
closures in the financial statements. An audit also includes assessing the accounting principles used and signifi-
cant estimates made by management, as well as evaluating the overall financial statement presentation. We
believe that our audits provide a reasonable basis for our opinion.
In our opinion, the financial statements referred to above present fairly, in all material respects, the consoli-
dated financial position of Genentech, Inc. at December 31, 1996 and 1995, and the consolidated results of its oper-
ations and its cash flows for each of the three years in the period ended December 31, 1996, in conformity with
generally accepted accounting principles.
San Jose, CaliforniaJanuary 17, 1997
Q U A R T E R L Y F I N A N C I A L D A T A ( U N A U D I T E D )
(thousands, except per share amounts)
1996 Quarter Ended
December 31 September 30 June 30 March 31
Total revenues $ 230,325 $ 251,707 $ 243,762 $ 242,884Product sales 139,724 142,463 148,305 152,337Gross margin from product sales 113,065 117,627 121,152 126,458 Net income 7,470 50,942 21,719 38,217Net income per share .06 .41 .18 .31
1995 Quarter Ended
December 31 September 30 June 30 March 31
Total revenues $ 221,914 $ 223,911 $ 233,053 $ 238,967Product sales 153,482 158,478 161,236 162,067Gross margin from product sales 130,983 134,109 136,924 135,317Net income 25,636 40,229 37,163 43,404Net income per share .21 .33 .31 .36
Total revenues were higher in the first three quarters of 1996 compared to the fourth quarter due primarily tocontract revenue from HLR for the exercises of its options under the Agreement (see the “Related PartyTransactions” note in the “Notes to Consolidated Financial Statements” for more information) in each of the firstthree quarters. Net income was lower in the fourth quarter due to lower revenues and higher expenses, primarilyresearch and development.
75
R E P O R T O F E R N S T & Y O U N G L L P , I N D E P E N D E N T A U D I T O R S
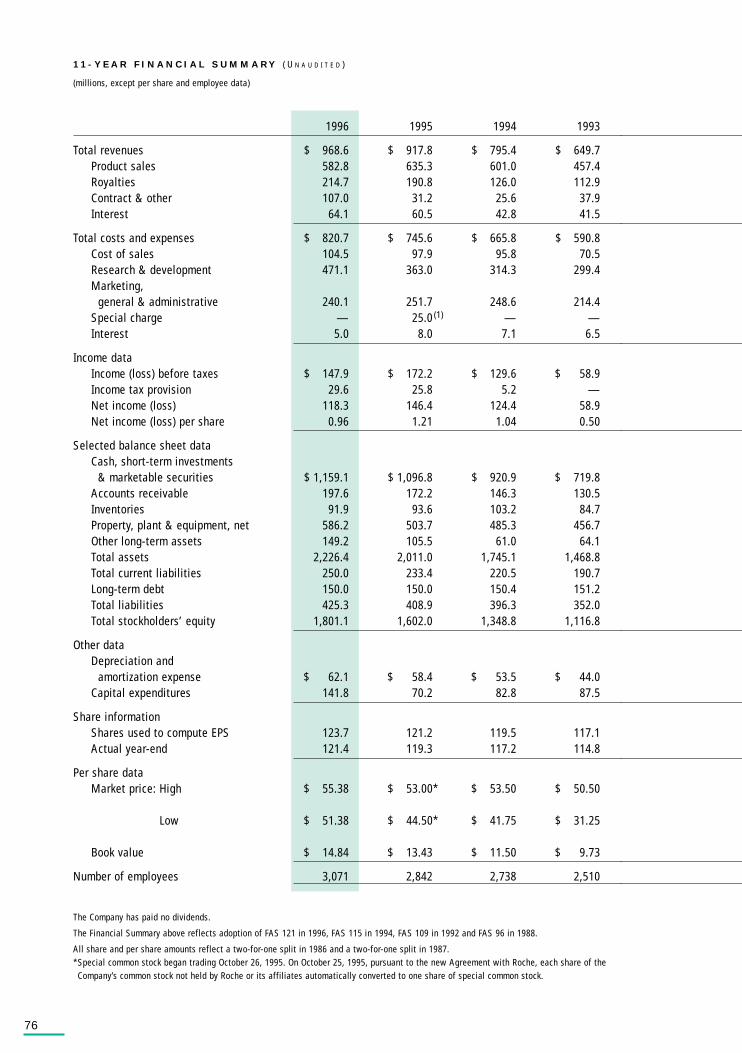
76
1996 1995 1994 1993
Total revenues $ 968.6 $ 917.8 $ 795.4 $ 649.7Product sales 582.8 635.3 601.0 457.4Royalties 214.7 190.8 126.0 112.9Contract & other 107.0 31.2 25.6 37.9Interest 64.1 60.5 42.8 41.5
Total costs and expenses $ 820.7 $ 745.6 $ 665.8 $ 590.8Cost of sales 104.5 97.9 95.8 70.5Research & development 471.1 363.0 314.3 299.4Marketing,
general & administrative 240.1 251.7 248.6 214.4Special charge — 25.0 (1) — —Interest 5.0 8.0 7.1 6.5
Income dataIncome (loss) before taxes $ 147.9 $ 172.2 $ 129.6 $ 58.9Income tax provision 29.6 25.8 5.2 —Net income (loss) 118.3 146.4 124.4 58.9Net income (loss) per share 0.96 1.21 1.04 0.50
Selected balance sheet dataCash, short-term investments
& marketable securities $ 1,159.1 $ 1,096.8 $ 920.9 $ 719.8Accounts receivable 197.6 172.2 146.3 130.5Inventories 91.9 93.6 103.2 84.7Property, plant & equipment, net 586.2 503.7 485.3 456.7Other long-term assets 149.2 105.5 61.0 64.1Total assets 2,226.4 2,011.0 1,745.1 1,468.8Total current liabilities 250.0 233.4 220.5 190.7Long-term debt 150.0 150.0 150.4 151.2Total liabilities 425.3 408.9 396.3 352.0Total stockholders’ equity 1,801.1 1,602.0 1,348.8 1,116.8
Other dataDepreciation and
amortization expense $ 62.1 $ 58.4 $ 53.5 $ 44.0Capital expenditures 141.8 70.2 82.8 87.5
Share informationShares used to compute EPS 123.7 121.2 119.5 117.1Actual year-end 121.4 119.3 117.2 114.8
Per share dataMarket price: High $ 55.38 $ 53.00* $ 53.50 $ 50.50
Low $ 51.38 $ 44.50* $ 41.75 $ 31.25
Book value $ 14.84 $ 13.43 $ 11.50 $ 9.73
Number of employees 3,071 2,842 2,738 2,510
The Company has paid no dividends.
The Financial Summary above reflects adoption of FAS 121 in 1996, FAS 115 in 1994, FAS 109 in 1992 and FAS 96 in 1988.
All share and per share amounts reflect a two-for-one split in 1986 and a two-for-one split in 1987.*Special common stock began trading October 26, 1995. On October 25, 1995, pursuant to the new Agreement with Roche, each share of the
Company’s common stock not held by Roche or its affiliates automatically converted to one share of special common stock.
1 1 - Y E A R F I N A N C I A L S U M M A R Y ( U N A U D I T E D )
(millions, except per share and employee data)
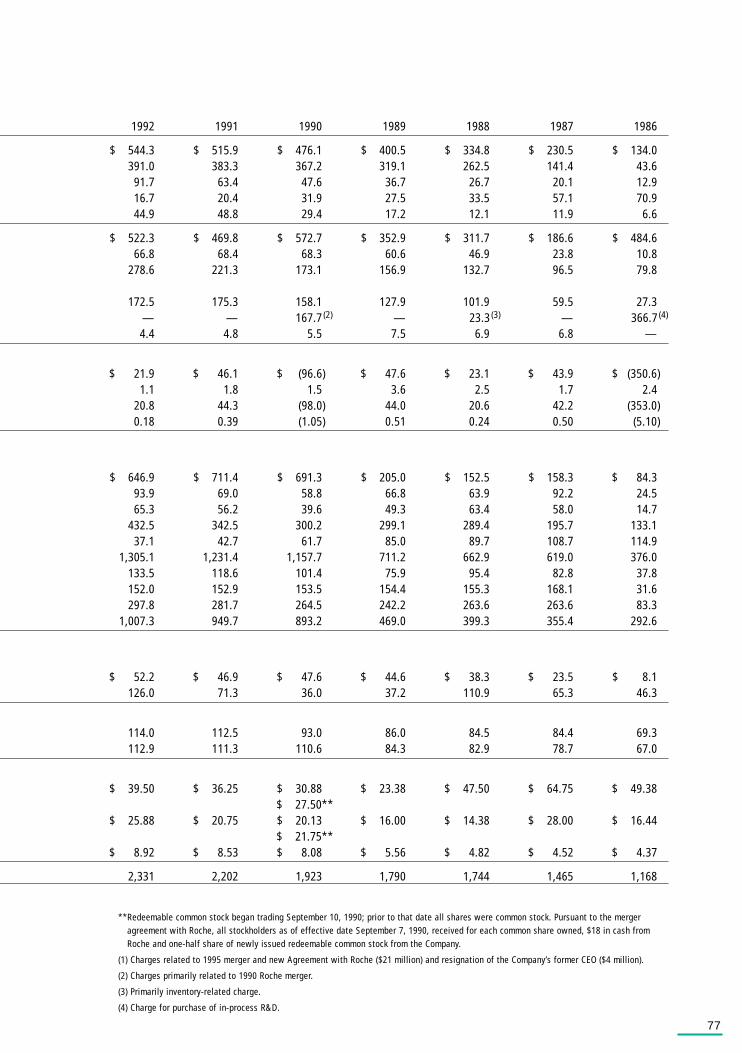
77
1992 1991 1990 1989 1988 1987 1986
$ 544.3 $ 515.9 $ 476.1 $ 400.5 $ 334.8 $ 230.5 $ 134.0391.0 383.3 367.2 319.1 262.5 141.4 43.6
91.7 63.4 47.6 36.7 26.7 20.1 12.916.7 20.4 31.9 27.5 33.5 57.1 70.944.9 48.8 29.4 17.2 12.1 11.9 6.6
$ 522.3 $ 469.8 $ 572.7 $ 352.9 $ 311.7 $ 186.6 $ 484.666.8 68.4 68.3 60.6 46.9 23.8 10.8
278.6 221.3 173.1 156.9 132.7 96.5 79.8
172.5 175.3 158.1 127.9 101.9 59.5 27.3— — 167.7 (2) — 23.3 (3) — 366.7 (4)
4.4 4.8 5.5 7.5 6.9 6.8 —
$ 21.9 $ 46.1 $ (96.6) $ 47.6 $ 23.1 $ 43.9 $ (350.6)1.1 1.8 1.5 3.6 2.5 1.7 2.4
20.8 44.3 (98.0) 44.0 20.6 42.2 (353.0)0.18 0.39 (1.05) 0.51 0.24 0.50 (5.10)
$ 646.9 $ 711.4 $ 691.3 $ 205.0 $ 152.5 $ 158.3 $ 84.393.9 69.0 58.8 66.8 63.9 92.2 24.565.3 56.2 39.6 49.3 63.4 58.0 14.7
432.5 342.5 300.2 299.1 289.4 195.7 133.137.1 42.7 61.7 85.0 89.7 108.7 114.9
1,305.1 1,231.4 1,157.7 711.2 662.9 619.0 376.0133.5 118.6 101.4 75.9 95.4 82.8 37.8152.0 152.9 153.5 154.4 155.3 168.1 31.6297.8 281.7 264.5 242.2 263.6 263.6 83.3
1,007.3 949.7 893.2 469.0 399.3 355.4 292.6
$ 52.2 $ 46.9 $ 47.6 $ 44.6 $ 38.3 $ 23.5 $ 8.1 126.0 71.3 36.0 37.2 110.9 65.3 46.3
114.0 112.5 93.0 86.0 84.5 84.4 69.3 112.9 111.3 110.6 84.3 82.9 78.7 67.0
$ 39.50 $ 36.25 $ 30.88 $ 23.38 $ 47.50 $ 64.75 $ 49.38$ 27.50**
$ 25.88 $ 20.75 $ 20.13 $ 16.00 $ 14.38 $ 28.00 $ 16.44$ 21.75**
$ 8.92 $ 8.53 $ 8.08 $ 5.56 $ 4.82 $ 4.52 $ 4.37
2,331 2,202 1,923 1,790 1,744 1,465 1,168
**Redeemable common stock began trading September 10, 1990; prior to that date all shares were common stock. Pursuant to the mergeragreement with Roche, all stockholders as of effective date September 7, 1990, received for each common share owned, $18 in cash fromRoche and one-half share of newly issued redeemable common stock from the Company.
(1) Charges related to 1995 merger and new Agreement with Roche ($21 million) and resignation of the Company’s former CEO ($4 million).
(2) Charges primarily related to 1990 Roche merger.
(3) Primarily inventory-related charge.
(4) Charge for purchase of in-process R&D.

S T O C K T R A D I N G S Y M B O L GNE
S T O C K E X C H A N G E L I S T I N G S
The Company’s callable putable common stock (special common stock) has traded on the New York Stock
Exchange and the Pacific Stock Exchange under the symbol GNE since October 26, 1995. On October 25, 1995,
the Company’s non-Roche stockholders approved a new agreement (the Agreement) with Roche Holdings, Inc.
(Roche). Pursuant to the Agreement, each share of the Company’s common stock not held by Roche or its
affiliates automatically converted to one share of special common stock. From July 3, 1995 through October 25,
1995, the Company’s common stock was traded under the symbol GNE. After the close of business on June 30,
1995, each share of the Company’s redeemable common stock automatically converted to one share of the
Company’s common stock. The conversion was in accordance with the terms of the redeemable common stock
put in place at the time of its issuance on September 7, 1990, when the Company’s merger with a wholly owned
subsidiary of Roche was consummated. The redeemable common stock of the Company traded under the symbol
GNE from September 10, 1990 to June 30, 1995. The Company’s common stock was traded on the New York
Stock Exchange under the symbol GNE from March 2, 1988, until September 7, 1990, and on the Pacific Stock
Exchange under the symbol GNE from April 12, 1988, until September 7, 1990. The Company’s common stock
was previously traded in the NASDAQ National Market System under the symbol GENE. No dividends have been
paid on the common stock, special common stock or redeemable common stock. The Company currently intends
to retain all future income for use in the operation of its business and, therefore, does not anticipate paying any
cash dividends in the foreseeable future. See the “Relationship with Roche Holdings, Inc.” note in the “Notes to
Consolidated Financial Statements” for a further description of the Agreement with Roche.
S P E C I A L C O M M O N S T O C K H O L D E R S
As of December 31, 1996, there were approximately 16,748 stockholders of record of the Company’s special
common stock.
S T O C K P R I C E S
Special Common/Redeemable Common/Common Stock
1996 1995
High Low High Low
4th Quarter $ 54 3/8 $ 52 3/4 $ 53 $ 47 7/8
3rd Quarter 53 1/4 51 3/8 49 1/4 46 5/8
2nd Quarter 53 3/8 51 7/8 52 46 3/8
1st Quarter 55 3/8 52 1/2 51 44 1/2
C O M M O N S T O C K , S P E C I A L C O M M O N S T O C K A N D
R E D E E M A B L E C O M M O N S T O C K I N F O R M A T I O N
78

H E A D Q U A R T E R S
Genentech, Inc.460 Point San Bruno BoulevardSouth San Francisco, California 94080-4990(415) 225-1000http://www.gene.com
S T O C K L I S T I N G S
Genentech, Inc. is listed on the New York and Pacific Stock Exchanges under the symbol GNE.
T R A N S F E R A G E N T
Communications concerning transfer requirements, lost certificates and change of address should be directed toGenentech’s transfer agent:
Boston EquiServeStockholder Services DivisionPost Office Box 644M/S 45-02-09Boston, MA 02102-0644Telephone (617) 575-3400
A N N U A L M E E T I N G
The annual meeting of stockholders will be held at 10:00 a.m. on Thursday April 10, 1997 at the Westin Hotel,1 Old Bayshore Highway, Millbrae, California. Detailed information about the meeting is contained in the Noticeof Annual Meeting and Proxy Statement sent with a copy of the Annual Report to each stockholder of record asof February 20, 1997.
A D D I T I O N A L I N F O R M A T I O N
If you need additional assistance or information regarding the company, or would like to receivea free copy of Genentech’s Form 10-K and 10-Q reports filed with the Securities and ExchangeCommission, contact the Investor Relations Department at Genentech’s corporate offices at(415) 225-1599 or send an e-mail message to [email protected]. Or direct requests forliterature to Genentech’s literature request line at (800) 488-6519. You can also visit Genentech’s site onthe World Wide Web at http://www.gene.com.
I N V E S T O R R E L A T I O N S
Genentech invites security analysts and representatives of portfolio management firms to contact:
Susan BentleyDirector, Investor RelationsGenentech, Inc.460 Point San Bruno BoulevardSouth San Francisco, California 94080-4990Telephone: (415) 225-1034e-mail: [email protected]
I N D E P E N D E N T A U D I T O R S
Ernst & Young LLPSan Jose, California
79
S T O C K H O L D E R I N F O R M A T I O N
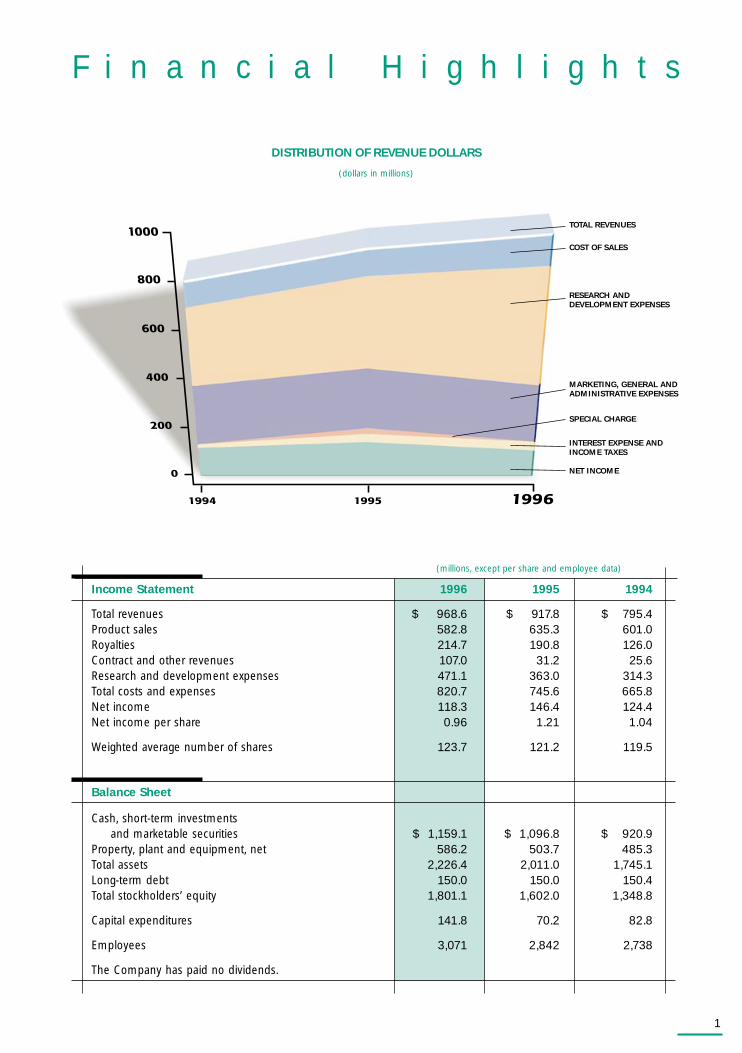
TOTAL REVENUES
COST OF SALES
RESEARCH ANDDEVELOPMENT EXPENSES
MARKETING, GENERAL ANDADMINISTRATIVE EXPENSES
SPECIAL CHARGE
INTEREST EXPENSE ANDINCOME TAXES
NET INCOME
1
Income Statement 1996 1995 1994
Total revenues $ 968.6 $ 917.8 $ 795.4Product sales 582.8 635.3 601.0Royalties 214.7 190.8 126.0Contract and other revenues 107.0 31.2 25.6Research and development expenses 471.1 363.0 314.3Total costs and expenses 820.7 745.6 665.8Net income 118.3 146.4 124.4Net income per share 0.96 1.21 1.04
Weighted average number of shares 123.7 121.2 119.5
Balance Sheet
Cash, short-term investmentsand marketable securities $ 1,159.1 $ 1,096.8 $ 920.9
Property, plant and equipment, net 586.2 503.7 485.3Total assets 2,226.4 2,011.0 1,745.1Long-term debt 150.0 150.0 150.4Total stockholders’ equity 1,801.1 1,602.0 1,348.8
Capital expenditures 141.8 70.2 82.8
Employees 3,071 2,842 2,738
The Company has paid no dividends.
F i n a n c i a l H i g h l i g h t s
(millions, except per share and employee data)
DISTRIBUTION OF REVENUE DOLLARS
(dollars in millions)

B U I L D I N G F O R T H E F U T U R E
As Genentech moves
products through its
development pipeline, it
has to plan ahead to
ensure it will have the
capacity to manufacture
them in quantities suffi-
cient to supply large, late-
stage clinical trials and,
ultimately, the market.
Significant physical expan-
sion of the company’s
facilities in 1996 will help
meet this need.

38
Making room for Genentech’s products
Since its founding Genentech has led the industry in the manufacture of biopharmaceuti-
cal products. Genentech scientists pioneered the large-scale production of recombinant
proteins. Since then Genentech has consistently manufactured enough pure, active pro-
tein to supply aggressive clinical schedules and, upon regulatory clearance, the market.
Today Genentech continues to innovate biopharmaceutical manufacturing processes, and
it intends to continue to adequately supply its development efforts and its markets with
the highest quality products.
In anticipation of the many products moving through its development pipeline,
Genentech is actively expanding its manufacturing operations. Besides continuing with a
major project to develop a completely new manufacturing facility in Vacaville, California,
Genentech is investing in current manufacturing operations to expand their capability to
produce proteins for both clinical development and commercial purposes.
In 1996, Genentech completed the expansion of an existing building to house a $23 mil-
lion cell-culture production suite. This facility adds to the com-
pany’s flexibility by providing large-scale cell culture capacity to
manufacture products entering late-stage clinical development.
Genentech also initiated construction on a $26 million expan-
sion to its purification facilities, where proteins produced
either by bacterial fermentation or cell culture are purified.
And the company initiated construction on a $31 million
expansion to its pharmaceutical manufacturing facilities,
where sterile medicines are vialed. All this facilities growth
will help ensure Genentech’s manufacturing operations keep
pace with its pipeline.
M a n u f a c t u r i n g G r o w t h
In 1996 Genentech completed a new $21 million, 42,000-square-foot building extension to provide three floors
of research labs and offices for its Cell Culture/Fermentation R&D groups. Genentech engineers with experience
in developing specialized facilities initiate and supervise these unique and challenging expansion projects. The
Genentech groups occupying this building develop the most cost-efficient way to manufacture—at high quality—
Genentech’s products on the large scale needed for late-stage clinical development and marketing.

Genentech manufactures and
markets six pharmaceutical
products in the United States
for several serious medical
conditions and promotes a
seventh for various cancer
indications. The first compo-
nent of Genentech’s strategy
for growth is to maximize
sales of its marketed products
by protecting and increasing
market share or market size
and by leveraging new indica-
tions for the products. In 1996,
Genentech received regulatory
clearances for new indications
for three of its products. In
early 1997, through an agree-
ment with Roche, Genentech
added Roferon-A for various
cancer indications to its
product portfolio.
P R O D U C T S A N D A P P R O V E D I N D I C A T I O N S :
Protropin (somatrem for injection) growth hormone
• Growth hormone inadequacy (GHI) in children
Nutropin [somatropin (rDNA origin) for injection] growth hormone
• GHI in children
• Growth failure from chronic renal insufficiency up to
the time of renal transplantation
• Short stature from Turner syndrome*
Nutropin AQ [somatropin (rDNA origin) injection] liquid
formulation growth hormone
• GHI in children
• Growth failure from chronic renal insufficiency up to
the time of renal transplantation
Pulmozyme (dornase alfa) Inhalation Solution
• Cystic fibrosis patients with moderate and
advanced* disease
Activase (Alteplase, recombinant), a tissue-plasminogen activator
• Acute myocardial infarction
• Acute massive pulmonary embolism
• Acute ischemic stroke*
Actimmune (Interferon gamma-1b)
• Chronic granulomatous disease
Roferon-A* (Interferon alfa-2a, recombinant)
• Several types of cancer
* New indication or new to portfolio
G E N E N T E C H M A R K E T E D P R O D U C T S

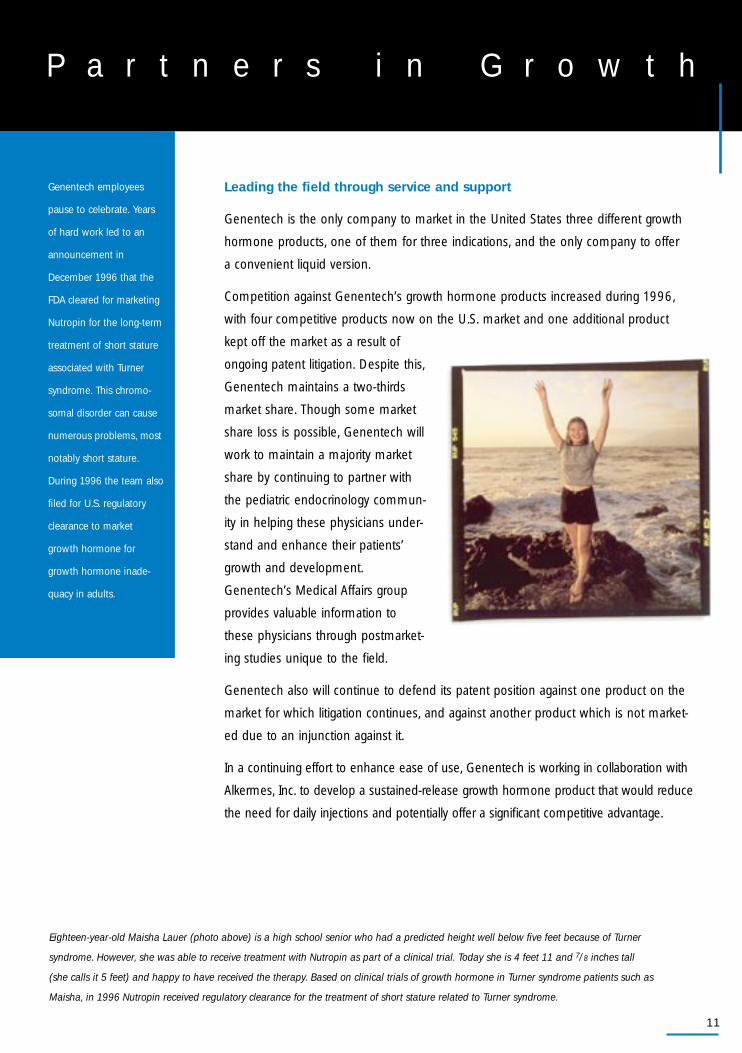
11
Eighteen-year-old Maisha Lauer (photo above) is a high school senior who had a predicted height well below five feet because of Turner
syndrome. However, she was able to receive treatment with Nutropin as part of a clinical trial. Today she is 4 feet 11 and 7/8 inches tall
(she calls it 5 feet) and happy to have received the therapy. Based on clinical trials of growth hormone in Turner syndrome patients such as
Maisha, in 1996 Nutropin received regulatory clearance for the treatment of short stature related to Turner syndrome.
Leading the field through service and support
Genentech is the only company to market in the United States three different growth
hormone products, one of them for three indications, and the only company to offer
a convenient liquid version.
Competition against Genentech’s growth hormone products increased during 1996,
with four competitive products now on the U.S. market and one additional product
kept off the market as a result of
ongoing patent litigation. Despite this,
Genentech maintains a two-thirds
market share. Though some market
share loss is possible, Genentech will
work to maintain a majority market
share by continuing to partner with
the pediatric endocrinology commun-
ity in helping these physicians under-
stand and enhance their patients’
growth and development.
Genentech’s Medical Affairs group
provides valuable information to
these physicians through postmarket-
ing studies unique to the field.
Genentech also will continue to defend its patent position against one product on the
market for which litigation continues, and against another product which is not market-
ed due to an injunction against it.
In a continuing effort to enhance ease of use, Genentech is working in collaboration with
Alkermes, Inc. to develop a sustained-release growth hormone product that would reduce
the need for daily injections and potentially offer a significant competitive advantage.
P a r t n e r s i n G r o w t h
Genentech employees
pause to celebrate. Years
of hard work led to an
announcement in
December 1996 that the
FDA cleared for marketing
Nutropin for the long-term
treatment of short stature
associated with Turner
syndrome. This chromo-
somal disorder can cause
numerous problems, most
notably short stature.
During 1996 the team also
filed for U.S. regulatory
clearance to market
growth hormone for
growth hormone inade-
quacy in adults.


Twenty-eight-year-old Stacy Hawes (photo above) is on “beeper status” for a lung transplant as a result of the cystic fibrosis with which she
was diagnosed at age two. As the disease has progressed, Stacy has experienced increasingly frequent hospitalizations, lately about every six
months. While she waits, Pulmozyme treatment helps keep her healthy enough to work full-time in the cable television industry and to qualify
for a lung transplant. In 1996, Pulmozyme received regulatory clearance for the treatment of patients, like Stacy, with advanced cystic fibrosis.
Working to help the full spectrum of cystic fibrosis patients
Cystic fibrosis is a genetically inherited, progressive disease that can begin with no
or mild symptoms when the patient is very young. Over time, patients’ health can
deteriorate so that normal breathing becomes increasingly difficult and hospitalizations
become more and more frequent. Ultimately, cystic fibrosis can progress to death,
usually by age 30.
In 1994, Genentech received
regulatory approval to market
Pulmozyme for the management
of cystic fibrosis patients from age
five with mild to moderate disease.
While this patient population
benefited greatly from the medicine,
Pulmozyme was not approved for
management of very sick patients
whose disease had progressed to a
point where breathing is routinely
compromised and infections are
frequent. Genentech continued to
study the medicine in these patients
and in 1996 received clearance to market Pulmozyme for patients with advanced dis-
ease. This indication is especially beneficial to help keep patients healthy as they await
lung transplants.
The question remained whether early intervention with Pulmozyme can benefit young
patients with preserved lung function. Genentech is currently planning a clinical trial, to
begin in 1997, to determine if it can. Through such continued study, Genentech’s goal
is to help all cystic fibrosis patients lead fuller, healthier lives.
B r e a t h i n g E a s i e r
Genentech’s Pulmozyme
Core Team plans an Early
Intervention Trial to deter-
mine the long-term two-
year effectiveness of
Pulmozyme in young
cystic fibrosis patients with
preserved lung function.
The team used data
accumulated through both
clinical studies and
Genentech’s
Epidemiological Study of
Cystic Fibrosis to plan this
trial. It is scheduled to
begin in 1997.
13


15
When 67-year-old Rosetta Bolander (photo above) experienced the symptoms of a stroke in September, 1996, she and her family knew to
seek treatment quickly because of reports on Activase they had seen on television. Rosetta improved within half an hour of being treated
with Activase and recovered with no signs of damage, much to the delight of her six children, 17 grandchildren and two great grandchildren.
New indication for Activase gives hope to acute stroke patients
Activase received regulatory clearance for the treatment of acute ischemic stroke
within three hours of symptom onset in June 1996. As a result, stroke—currently the
country’s leading cause of adult disability—joined heart attacks and trauma as med-
ical conditions for which emergency treatment may reduce the risk of permanent
disability. The approval was based upon data from a nationwide clinical trial, which
showed that eligible patients treated with Activase within three hours were at least
33 percent more likely to recover
with minimal or no disability than
those treated with placebo.
Following the approval, Genentech
worked closely with the National
Institute of Neurological Disorders
and Stroke, which, with more than
50 professional medical organizations
from several health care fields, devel-
oped a blueprint for a national plan
for rapid stroke treatment. The goal
of this watershed effort is to help
the medical community to quickly
mobilize hospital teams and patients for optimal treatment of acute ischemic stroke.
Genentech is also involved with the American Academy of Neurology’s national
consumer and professional education campaign, the Stroke Awareness Response
Treatment (StART) Initiative. Besides further educating the medical community, this
program focuses on public education with this key message: Know the symptoms
of stroke, and seek treatment fast.
T h e M e s s a g e I s U r g e n c y
Genentech representative
Tim Yarnik has been working
with Drs. Douglas Kabbes
and Narinder Arora at Saint
Anthony’s Hospital in
Effingham, Illinois, to help
the hospital develop an
urgent protocol for treating
acute ischemic stroke with
Activase, in an effort to
improve outcomes of the
hospital’s ischemic stroke
patients. The protocol
involves predetermined
steps: quick assessment;
immediate paging of special-
ists needed to make a formal
diagnosis if stroke is suspect-
ed; and fast administration of
Activase within three hours
of symptom onset if acute
ischemic stroke is confirmed
and the patient or patient’s
family agrees to the treat-
ment. With the new protocol,
these steps happen within
one hour. Though still being
fine-tuned at the time of her
stroke, the hospital’s stroke
treatment protocol was
essential to the successful
treatment of Rosetta
Bolander (opposite).
The
Symptoms
of Stroke
• Weakness/
numbness in the
face, arm or leg,
especially on one
side of the body
• Sudden
dimness, blurred
or decreased
vision, particularly
in one eye
• Difficulty
speaking or
understanding
speech
• Unexplained
dizziness, loss
of coordination,
or sudden falls
• Sudden
or severe
headaches
with no
known cause

16
Leader for heart attack treatment
Activase currently leads the thrombolytic market in the United States. In 1996, Activase’s
market share climbed to approximately 80 percent from approximately 75 percent at the
end of 1995.
Activase as a heart attack treatment faces challenges to its share of the thrombolytic mar-
ket and to the size of that market. Genentech is vigorously facing these challenges.
In 1996, Boehringer Mannheim announced that the FDA licensed its heart attack drug,
Reteplase (brand name Retavase®). Genentech believes Reteplase infringes Genentech
patents and has filed a patent infringement action against Boehringer Mannheim.
Genentech also is currently developing in Phase II clinical
trials a second-generation t-PA, called TNK, which is poten-
tially more effective and faster to administer than t-PA.
Despite Activase’s strong market share, the overall size
of the thrombolytic therapy market during 1996 has
declined by about 6.5 percent compared to 1995 as a
result of some heart attack patients receiving angioplasty
rather than thrombolytic therapy and others receiving
therapy through ongoing large-scale clinical trials. This
decreased market size has led to a 1996 decline in
sales from 1995. However, a study reported in the
New England Journal of Medicine in October 1996
demonstrated no significant mortality difference between primary angioplasty and
thrombolytic therapy, but that rates of procedures and costs were lower for patients
who received thrombolytic therapy. In addition, angioplasty is an invasive procedure
requiring specialized equipment and facilities and is currently available at a limited
number of hospitals in the United States.
When what he thought was early morning indigestion persisted and worsened, 48-year-old Dalvinder Matharu (photo above) called his
local hospital, who advised him to call 911. He was transported to the hospital, and was diagnosed as having an acute myocardial
infarct—a heart attack. After physicians quickly treated him with Activase, he felt relief within minutes. Since his heart attack, Dalvinder
has adopted a heart-healthy lifestyle, with a healthy diet and consistent exercise schedule.
The
Symptoms
of Heart Attack
• Uncomfortable pressure,
fullness, squeezing or
pain in the center of
the chest lasting for
two minutes or more
• Pain spreading to
the shoulders, neck,
jaw, arms or back
• Dizziness, fainting,
sweating, nausea
and/or shortness
of breath
A C T I VA S E C O N T I N U E D

17
A c t i m m u n e
R o f e r o n - A
Keeping healthy, despite CGD
Patients with chronic granulomatous disease (CGD) have a defect in their immune
system that leaves them vulnerable to repeated, severe infections, which often
require hospitalization and can cause death. Actimmune reduces approximately
threefold the frequency of serious infections requiring hospitalizations. Of the approxi-
mately 400 patients in the United States with this very rare, inherited disease, most
are children. Actimmune helps these patients stay healthy so they can lead a more
normal life.
It was not until after his brother died of chronic granulomatous
disease in 1994 that 8-year-old Ronald McFarland (photo at right)
was diagnosed with the same inherited disease. Ronald’s mom, Kim,
says that before the diagnosis, Ronald was sick and hospitalized
often with mold pneumonia and bladder problems. Since he started
treatment with Actimmune two years ago, Ronald has not been
hospitalized and rarely misses school.
Roferon-A paves the way into the oncology market
Through a 1997 agreement with Roche, Genentech now promotes Roche’s Roferon-A
in the United States for its approved oncology indications, including hairy-cell leukemia,
AIDS-related Kaposi’s sarcoma and Ph-positive chronic myelogenous leukemia. As
Genentech builds an oncology business, the experience it gains through promoting
Roferon-A will provide significant benefit.
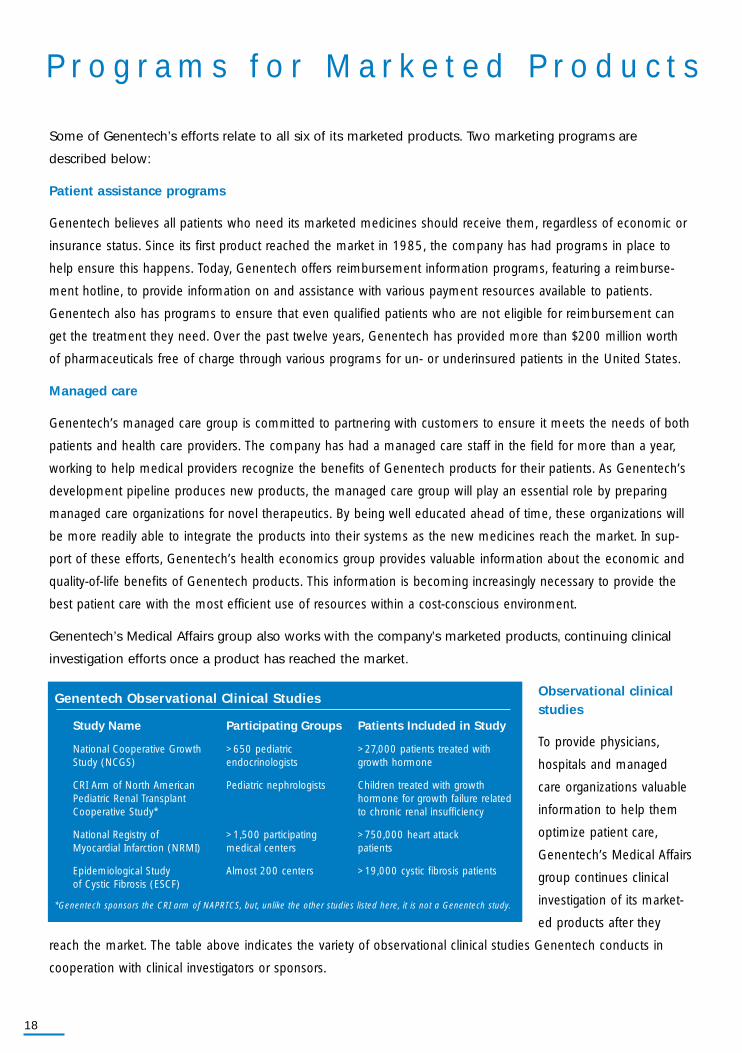
P r o g r a m s f o r M a r k e t e d P r o d u c t s
18
Some of Genentech’s efforts relate to all six of its marketed products. Two marketing programs are
described below:
Patient assistance programs
Genentech believes all patients who need its marketed medicines should receive them, regardless of economic or
insurance status. Since its first product reached the market in 1985, the company has had programs in place to
help ensure this happens. Today, Genentech offers reimbursement information programs, featuring a reimburse-
ment hotline, to provide information on and assistance with various payment resources available to patients.
Genentech also has programs to ensure that even qualified patients who are not eligible for reimbursement can
get the treatment they need. Over the past twelve years, Genentech has provided more than $200 million worth
of pharmaceuticals free of charge through various programs for un- or underinsured patients in the United States.
Managed care
Genentech’s managed care group is committed to partnering with customers to ensure it meets the needs of both
patients and health care providers. The company has had a managed care staff in the field for more than a year,
working to help medical providers recognize the benefits of Genentech products for their patients. As Genentech’s
development pipeline produces new products, the managed care group will play an essential role by preparing
managed care organizations for novel therapeutics. By being well educated ahead of time, these organizations will
be more readily able to integrate the products into their systems as the new medicines reach the market. In sup-
port of these efforts, Genentech’s health economics group provides valuable information about the economic and
quality-of-life benefits of Genentech products. This information is becoming increasingly necessary to provide the
best patient care with the most efficient use of resources within a cost-conscious environment.
Genentech’s Medical Affairs group also works with the company’s marketed products, continuing clinical
investigation efforts once a product has reached the market.
Observational clinicalstudies
To provide physicians,
hospitals and managed
care organizations valuable
information to help them
optimize patient care,
Genentech’s Medical Affairs
group continues clinical
investigation of its market-
ed products after they
reach the market. The table above indicates the variety of observational clinical studies Genentech conducts in
cooperation with clinical investigators or sponsors.
Genentech Observational Clinical Studies
Study Name Participating Groups Patients Included in Study
National Cooperative Growth >650 pediatric >27,000 patients treated with Study (NCGS) endocrinologists growth hormone
CRI Arm of North American Pediatric nephrologists Children treated with growthPediatric Renal Transplant hormone for growth failure relatedCooperative Study* to chronic renal insufficiency
National Registry of >1,500 participating >750,000 heart attackMyocardial Infarction (NRMI) medical centers patients
Epidemiological Study Almost 200 centers >19,000 cystic fibrosis patientsof Cystic Fibrosis (ESCF)
*Genentech sponsors the CRI arm of NAPRTCS, but, unlike the other studies listed here, it is not a Genentech study.

R E S E A R C H A N D D E V E L O P M E N T
From its founding,
Genentech’s success has
been grounded in excel-
lent science—science that
has led to more than
3,000 patents worldwide
with another 2,000 pend-
ing, and more than 250
published papers in
peer-reviewed scientific
publications each year.
More tangibly, Genentech
science has led to 11 of
the marketed products of
biotechnology, six of
which Genentech markets.
Today, the company’s dis-
covery research continues
to fuel its development
pipeline. The third compo-
nent to Genentech’s
strategy for growth is to
accelerate and expand
development of its
pipeline products. The
challenge is to focus on
those products that will
deliver the most benefit,
both medically and
financially.

20
C A R D I O V A S C U L A R P O R T F O L I O
* Genentech and Roche are currently preparing for Phase III clinical trials for this indication.
21
Genentech contributed to a revolution in the treatment of heart attack with the introduction
of Activase in 1987. 1996 brought a similar revolution to the treatment of acute ischemic
stroke. The scientific expertise and strong relationships Genentech has built over the years are
of tremendous value to the company’s efforts with the new potential cardiovascular products
in its pipeline. Relationships with the cardiovascular medical community, with medical groups
such as the American Heart Association, and with cardiovascular experts within the FDA all
help ensure that Genentech is able to design and conduct clinical trials in a manner that will
most quickly lead to regulatory clearance, if a drug is effective.
Genentech is working to expand and make more competi-
tive its thrombolytic portfolio with a potentially safer and
more effective second-generation t-PA—called TNK—
scheduled to begin Phase III trials in 1997 if Phase II trials
suggest it is effective. The company is also seeking to
expand the treatment window for patients with acute
ischemic stroke by studying the use of Activase in these
patients between three and five hours of symptom onset.
Genentech is also pursuing other avenues of cardiovascu-
lar medicine. In 1996, in collaboration with Roche,
Genentech completed a Phase II clinical trial with an oral
IIb/IIIa antagonist to investigate its pharmacokinetics,
pharmacodynamics and safety in patients with acute coronary syndrome. This molecule was
designed specifically to bind to the IIb/IIIa receptor on the surface of platelets to inhibit their
ability to aggregate.
Discussed in more detail on page 24, vascular endothelial growth factor (VEGF) offers an
exciting new avenue for treating coronary arterial disease.
Auriculin® anaritide, which is being developed by Scios Inc., seeks to treat the acute renal
failure brought on by a sudden loss of blood flow to the kidneys, as in severe trauma.
A Phase III trial suggested it is effective in a subset of these patients with low urine output,
or oliguria, and a second Phase III trial is seeking to confirm efficacy in these patients.
Genentech’s anti-CD18 antibody, being developed in collaboration with Roche, also seeks to
address problems related to loss of blood flow, as in trauma. When patients are given blood
transfusions to treat blood loss, a type of shock—hemorrhagic shock—often develops, which
can result in organ failure and even death. The anti-CD18 antibody is designed to block the
receptors in blood vessels that lead to this dangerous response.
C a r d i o v a s c u l a r M e d i c i n e
GENENTECH IS WORKING
TO EXPAND AND MAKE
MORE COMPETITIVE ITS
THROMBOLYTIC PORTFOLIO

22
O N C O L O G Y P O R T F O L I O
* Genentech is currently preparing for Phase I clinical trials for this indication.

23
Oncology—cancer biology—represents a new area in which Genentech is building strength.
Genentech has brought experts in the field in house and is collaborating with academic and
clinical leaders outside the company. An Oncology Advisory Board of leading oncologists
helps Genentech scientists plan the development of potential cancer therapies.
Genentech’s promoted cancer product is Roche’s Roferon-A, which Genentech is promoting
for its approved oncology indications in the United States through a 1997 agreement with
Roche. Roferon-A has come full circle: Genentech licensed patents and know-how for
Roferon-A to Roche in 1980. Promoting Roferon-A will give Genentech the opportunity to
enhance its knowledge of the oncology market as it moves
its oncology pipeline products through development.
Genentech’s two oncology products in late-stage develop-
ment have the benefit of showing minimal toxicity, espe-
cially compared to standard chemotherapy. The C2B8
antibody is being developed in collaboration with IDEC
Pharmaceuticals, and IDEC has filed for regulatory clear-
ance to market the antibody for non-Hodgkin’s B-cell
lymphoma. Phase III trials of the antibody as a single
agent therapy for non-Hodgkin’s B-cell lymphoma showed
an overall response rate of 50 percent (6 percent com-
plete response rate in evaluable patients and 44 percent
partial response rate). In 1997 Genentech will complete
enrollment of a pivotal Phase III clinical trial for its anti-HER2 antibody for the treatment of
breast cancer. If the Phase III results confirm the positive Phase II findings, Genentech plans
to file for regulatory clearance for this indication in 1998.
Genentech also has two potential oncology products in earlier clinical development.
Thrombopoietin is a blood cell growth factor that promotes the production of the blood-
clotting cells, platelets. Patients undergoing blood stem cell transplantation or cancer
chemotherapy may suffer from thrombocytopenia, a deficiency of platelets. Genentech is
studying recombinant human thrombopoietin in Phase II clinical trials to determine if this
agent can ameliorate severe thrombocytopenia, which is often associated with these treat-
ment options. And Genentech filed an IND to begin a Phase I clinical trial of the anti-VEGF
antibody, discussed beginning on the next page.
O n c o l o g y
GENENTECH’S TWO ONCOLOGY
PRODUCTS IN LATE-STAGE
DEVELOPMENT HAVE THE
BENEFIT OF SHOWING
MINIMAL TOXICITY,
ESPECIALLY COMPARED TO
STANDARD CHEMOTHERAPY

24
Research into one molecule reveals two potential therapies
Vascular endothelial growth factor (VEGF) is a protein that ischemic tissues—tissues
lacking in oxygen—secrete. It binds to receptors on nearby blood vessels and causes
angiogenesis—the formation of new blood vessels.
Genentech’s discovery research with VEGF has led to two different potential therapies. One
relies on the angiogenetic effects of VEGF, and the other
attempts to block those effects.
VEGF as a treatment forcoronary arterial diseaseVEGF could potentially benefit patients who have a heart
that is functioning but has a blocked blood supply due to
atherosclerotic coronary artery disease. Current therapies for
patients with coronary ischemia include angioplasty and
coronary artery by-pass surgery. Patients with coronary arter-
ial disease who are not optimal candidates for such proce-
dures represent an unmet medical need for which VEGF may be useful. Any patient, how-
ever, with a functioning but underperfused heart could potentially benefit from therapeutic
angiogenesis with VEGF.
With the potential formation of new blood vessels into previously ischemic areas of the
heart, benefits that might result include improved blood flow to the heart, improved heart
function, improved exercise ability, fewer clinical symptoms of angina, quality of life
improvement, and reduced mortality due to heart attacks. Genentech is currently investi-
gating VEGF for the treatment of coronary ischemia in Phase I clinical trials.
T w o F a c e s
GENENTECH’S DISCOVERY
RESEARCH WITH VEGF
HAS LED TO TWO DIFFERENT
POTENTIAL THERAPIES

25
The anti-VEGF antibody as a treatment for cancerThe second potential therapy resulting from Genentech’s research with VEGF is the use
of an anti-VEGF antibody developed by Genentech scientists to treat cancer. This
approach stems from VEGF’s apparent involvement in angiogenesis during tumor growth.
Despite significant advances over the past 15 years in the use of chemotherapeutic
agents in the treatment of solid tumors, many of these tumors continue to be relatively
unresponsive to even the most active agents. Cancerous tumors start off small with no
blood supply of their own, and they cannot grow large or spread until they develop one.
Angiogenesis has been shown to play an important role in both tumor growth and
metastasis. In fact, the extent of tumor vascularization is considered an independent
prognostic indicator, correlating strongly with relapse and survival. The greater the blood
supply into the tumor, the worse the prognosis.
In preclinical studies in disease models, the anti-VEGF antibody resulted in decreased vas-
cularization and a decline in growth and metastasis of a variety of tumors. Genentech has
filed an IND to investigate its anti-VEGF antibody in a Phase I clinical trial as a potential
therapy against solid tumors.
Genentech scientists (photos above) studied VEGF and identified some activities that were beneficial and some that play a role in cancer.
Based on the discovery efforts of these scientists, Genentech is now seeking to harness and amplify the beneficial effects of VEGF in the
treatment of coronary arterial disease and block the cancer-related effects of VEGF with an anti-VEGF antibody in the treatment of cancer.
o f V E G F
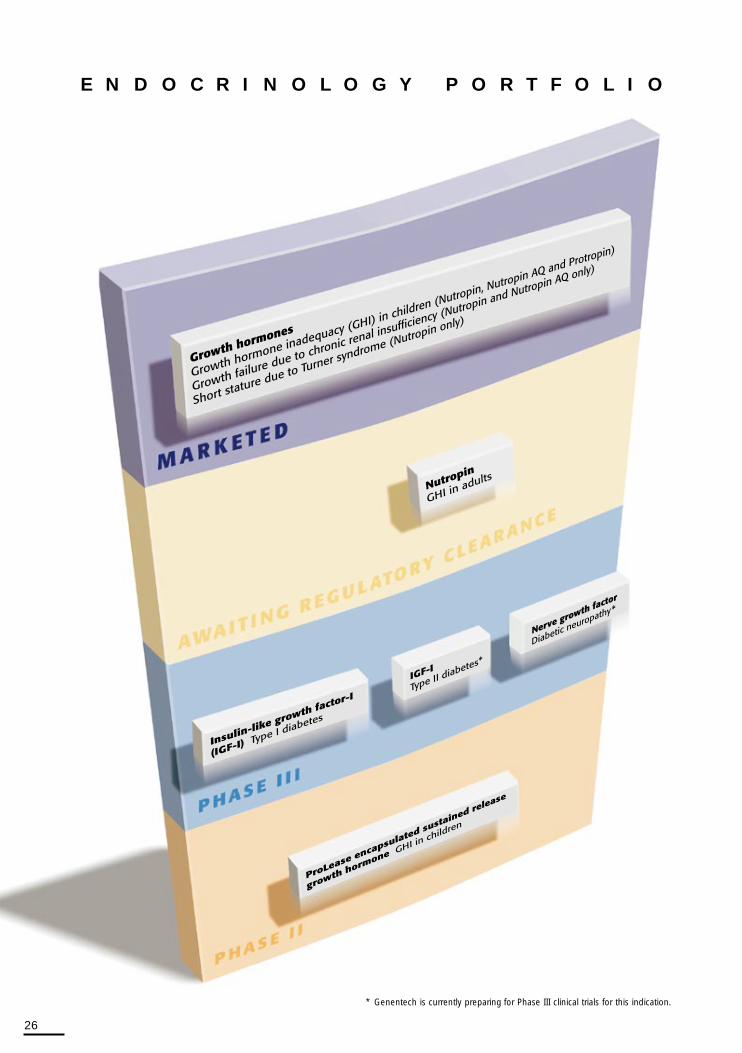
26
E N D O C R I N O L O G Y P O R T F O L I O
* Genentech is currently preparing for Phase III clinical trials for this indication.
26
27
Since the development and introduction in 1985 of recombinant growth hormone,
Genentech has established significant clinical and marketing expertise in the area of
endocrinology. Since the launch of growth hormone, in collaboration with pediatric endocrin-
ologists around the United States, Genentech has conducted the National Cooperative
Growth Study, which has continuously helped increase the knowledge of experts, both
external and internal. Genentech is the only company with three growth hormone products
on the market and the only one with a liquid formulation available to simplify administration.
Genentech continues to apply its expertise in the area of human growth and development.
In 1996 it received clearance for a new indication for
growth hormone—Turner syndrome—and applied for regula-
tory clearance for another—growth hormone inadequacy in
adults. In addition, Genentech is working in collaboration
with Alkermes, Inc. to develop a sustained-release formula-
tion of human growth hormone. Currently in Phase I/II
clinical trials, this formulation is designed to free patients
receiving growth hormone therapy from the need for daily
injections. It does so by encapsulating the drug in
biodegradable microspheres that slowly release the growth
hormone over a period of weeks. If successful, this sus-
tained release formulation will provide a significant competi-
tive advantage in an increasingly competitive market.
Genentech has also turned its expertise in the area of endocrinology to diabetes, with two
significant products in late-stage clinical testing. These potential medicines—insulin-like growth
factor and nerve growth factor—are profiled beginning on the next page. As is Genentech’s
characteristic approach, the company is developing a team of diabetes experts internally and
building relationships with external leaders in diabetes treatment and research to ensure its
clinical development plans are the best they can be.
E n d o c r i n o l o g y
GENENTECH CONTINUES TO
APPLY ITS EXPERTISE IN THE
AREA OF HUMAN GROWTH
AND DEVELOPMENT
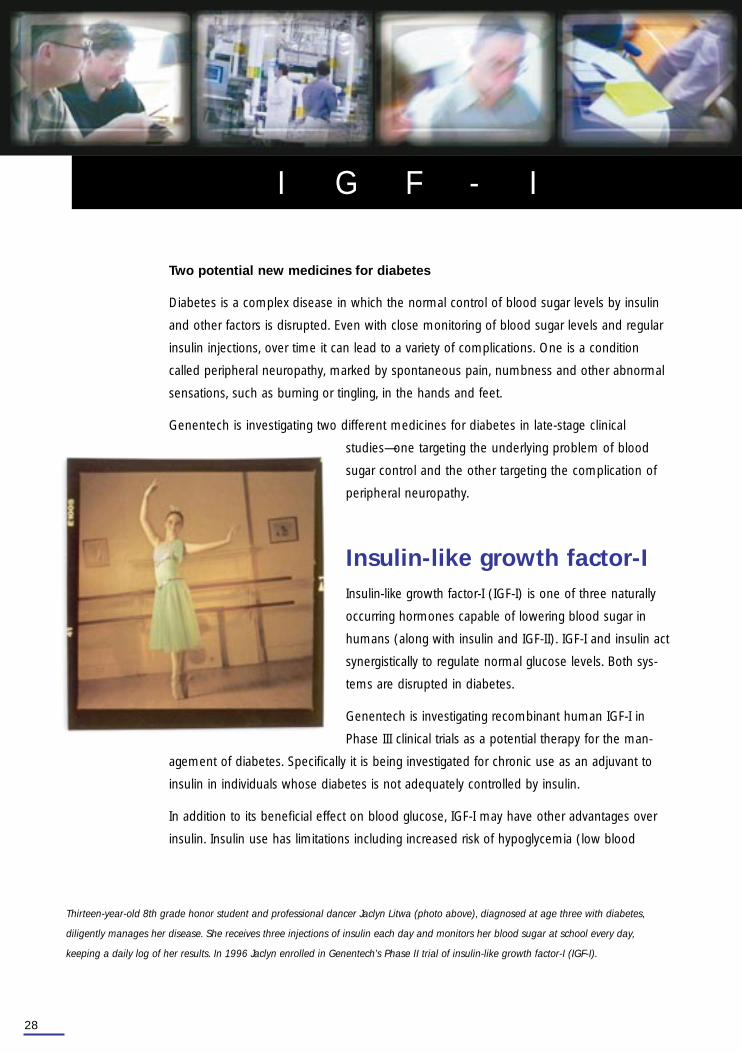
28
Two potential new medicines for diabetes
Diabetes is a complex disease in which the normal control of blood sugar levels by insulin
and other factors is disrupted. Even with close monitoring of blood sugar levels and regular
insulin injections, over time it can lead to a variety of complications. One is a condition
called peripheral neuropathy, marked by spontaneous pain, numbness and other abnormal
sensations, such as burning or tingling, in the hands and feet.
Genentech is investigating two different medicines for diabetes in late-stage clinical
studies—one targeting the underlying problem of blood
sugar control and the other targeting the complication of
peripheral neuropathy.
Insulin-like growth factor-IInsulin-like growth factor-I (IGF-I) is one of three naturally
occurring hormones capable of lowering blood sugar in
humans (along with insulin and IGF-II). IGF-I and insulin act
synergistically to regulate normal glucose levels. Both sys-
tems are disrupted in diabetes.
Genentech is investigating recombinant human IGF-I in
Phase III clinical trials as a potential therapy for the man-
agement of diabetes. Specifically it is being investigated for chronic use as an adjuvant to
insulin in individuals whose diabetes is not adequately controlled by insulin.
In addition to its beneficial effect on blood glucose, IGF-I may have other advantages over
insulin. Insulin use has limitations including increased risk of hypoglycemia (low blood
I G F - I
Thirteen-year-old 8th grade honor student and professional dancer Jaclyn Litwa (photo above), diagnosed at age three with diabetes,
diligently manages her disease. She receives three injections of insulin each day and monitors her blood sugar at school every day,
keeping a daily log of her results. In 1996 Jaclyn enrolled in Genentech’s Phase II trial of insulin-like growth factor-I (IGF-I).
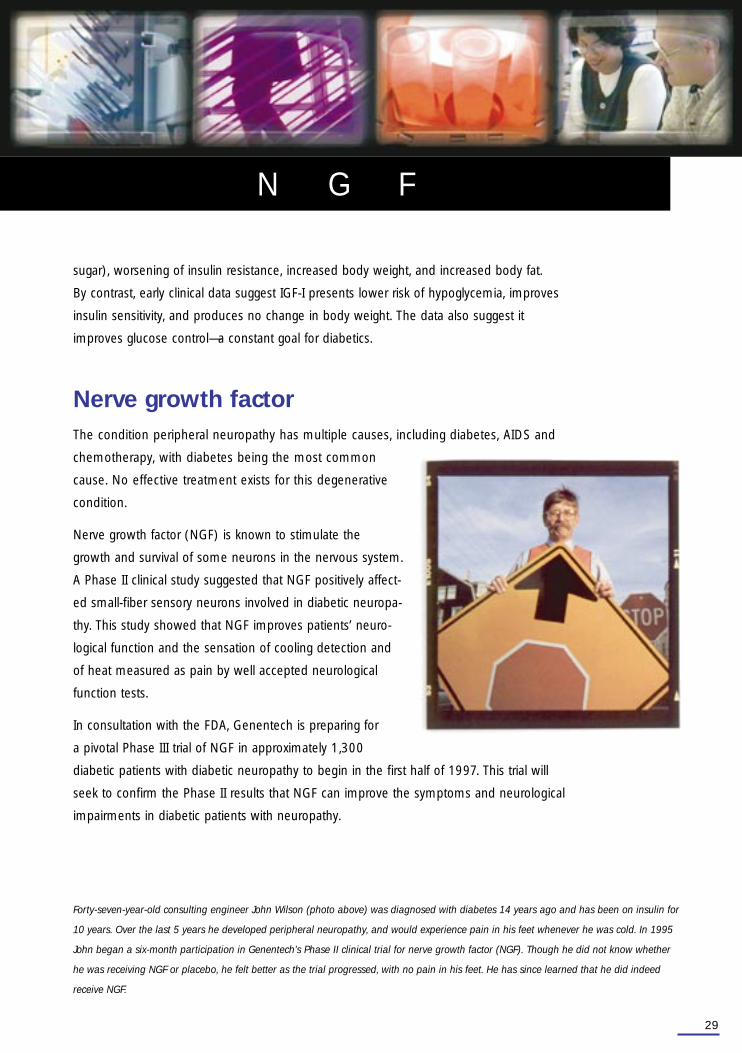
29
Forty-seven-year-old consulting engineer John Wilson (photo above) was diagnosed with diabetes 14 years ago and has been on insulin for
10 years. Over the last 5 years he developed peripheral neuropathy, and would experience pain in his feet whenever he was cold. In 1995
John began a six-month participation in Genentech’s Phase II clinical trial for nerve growth factor (NGF). Though he did not know whether
he was receiving NGF or placebo, he felt better as the trial progressed, with no pain in his feet. He has since learned that he did indeed
receive NGF.
sugar), worsening of insulin resistance, increased body weight, and increased body fat.
By contrast, early clinical data suggest IGF-I presents lower risk of hypoglycemia, improves
insulin sensitivity, and produces no change in body weight. The data also suggest it
improves glucose control—a constant goal for diabetics.
Nerve growth factorThe condition peripheral neuropathy has multiple causes, including diabetes, AIDS and
chemotherapy, with diabetes being the most common
cause. No effective treatment exists for this degenerative
condition.
Nerve growth factor (NGF) is known to stimulate the
growth and survival of some neurons in the nervous system.
A Phase II clinical study suggested that NGF positively affect-
ed small-fiber sensory neurons involved in diabetic neuropa-
thy. This study showed that NGF improves patients’ neuro-
logical function and the sensation of cooling detection and
of heat measured as pain by well accepted neurological
function tests.
In consultation with the FDA, Genentech is preparing for
a pivotal Phase III trial of NGF in approximately 1,300
diabetic patients with diabetic neuropathy to begin in the first half of 1997. This trial will
seek to confirm the Phase II results that NGF can improve the symptoms and neurological
impairments in diabetic patients with neuropathy.
N G F
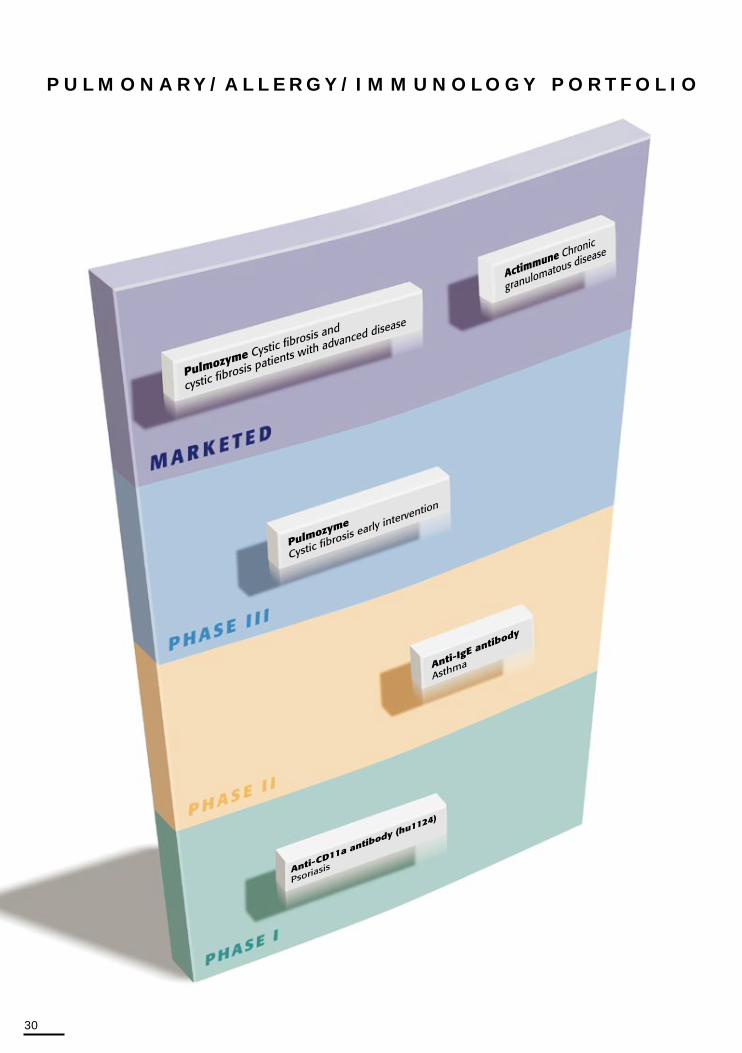
30
P U L M O N A R Y / A L L E R G Y / I M M U N O L O G Y P O R T F O L I O

31
In 1991, after years of preclinical and clinical research, Genentech entered the field of
immunology with the introduction of Actimmune to manage the rare immune disorder
chronic granulomatous disease. In 1994 Genentech entered the pulmonary arena with
Pulmozyme, the first new medicine for use in cystic fibrosis in 30 years.
Genentech has continued to build on its expertise in these areas. For instance, the company
is working to broaden the range of cystic fibrosis patients who can benefit from Pulmozyme
therapy, as described on page 13.
In addition, Genentech has combined an understanding of
pulmonary medicine with an expertise in immunology and
allergy to work on its anti-IgE antibody. In collaboration
with Tanox and Novartis, Genentech is investigating a cus-
tom anti-IgE antibody in Phase II clinical trials as a poten-
tial treatment for asthma. The antibody is designed to
interfere early in the body’s complex immune cascade that
leads to an allergic response that can trigger asthma.
Phase I clinical trials showed that this humanized antibody
is well tolerated. Genentech anticipates completing Phase
II trials in the first half of 1997.
Third, through a collaboration with XOMA Corporation,
Genentech is tackling the immune disorder psoriasis, which leaves patients with itchy, scaly,
red patches on their skin, often covering large areas of the body. XOMA is conducting Phase I
clinical trials of Genentech’s anti-CD11a antibody, called hu1124. This antibody is designed
to curb the immune cells, called T-cells, that are over-active in psoriasis. Preclinical studies
suggest it also may be useful to inhibit these same immune cells after an organ transplant,
thus preventing rejection of the transplant. If the Phase I trials demonstrate safety, XOMA will
take the anti-CD11a antibody through Phase II clinical testing, initially for psoriasis, and also
for organ transplant rejection.
P u l m o n a r y / A l l e r g y / I m m u n o l o g y
GENENTECH HAS COMBINED
AN UNDERSTANDING OF
PULMONARY MEDICINE
WITH AN EXPERTISE IN
IMMUNOLOGY AND ALLERGY
TO WORK ON ITS
ANTI-IgE ANTIBODY
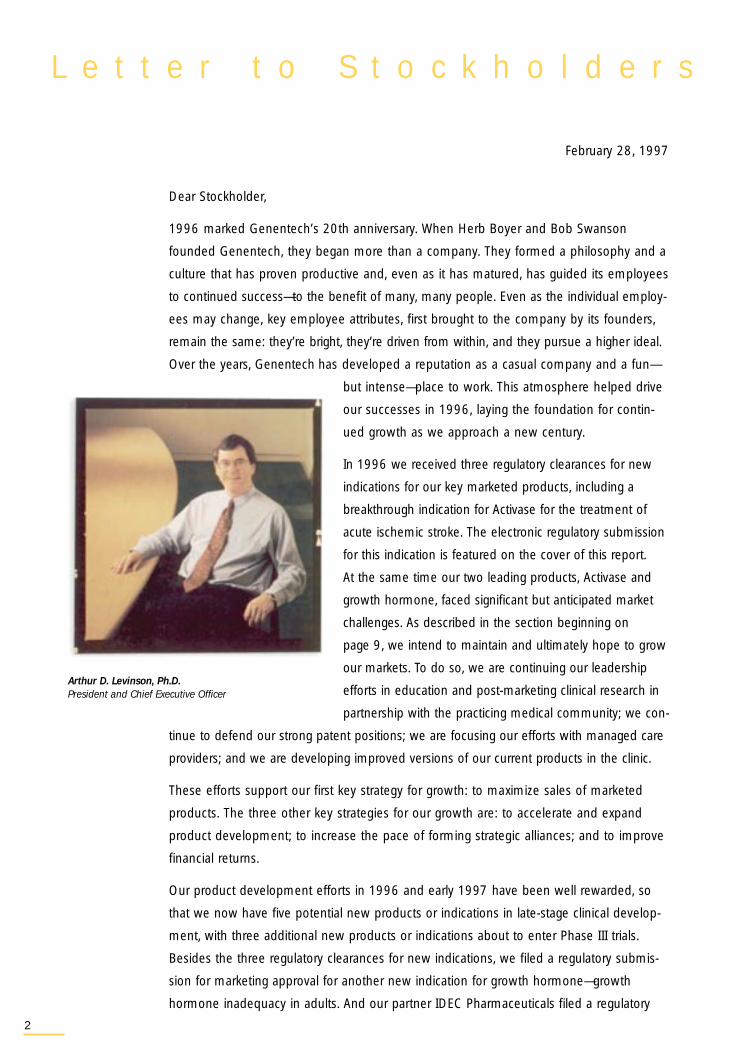
2
February 28, 1997
Dear Stockholder,
1996 marked Genentech’s 20th anniversary. When Herb Boyer and Bob Swanson
founded Genentech, they began more than a company. They formed a philosophy and a
culture that has proven productive and, even as it has matured, has guided its employees
to continued success—to the benefit of many, many people. Even as the individual employ-
ees may change, key employee attributes, first brought to the company by its founders,
remain the same: they’re bright, they’re driven from within, and they pursue a higher ideal.
Over the years, Genentech has developed a reputation as a casual company and a fun—
but intense—place to work. This atmosphere helped drive
our successes in 1996, laying the foundation for contin-
ued growth as we approach a new century.
In 1996 we received three regulatory clearances for new
indications for our key marketed products, including a
breakthrough indication for Activase for the treatment of
acute ischemic stroke. The electronic regulatory submission
for this indication is featured on the cover of this report.
At the same time our two leading products, Activase and
growth hormone, faced significant but anticipated market
challenges. As described in the section beginning on
page 9, we intend to maintain and ultimately hope to grow
our markets. To do so, we are continuing our leadership
efforts in education and post-marketing clinical research in
partnership with the practicing medical community; we con-
tinue to defend our strong patent positions; we are focusing our efforts with managed care
providers; and we are developing improved versions of our current products in the clinic.
These efforts support our first key strategy for growth: to maximize sales of marketed
products. The three other key strategies for our growth are: to accelerate and expand
product development; to increase the pace of forming strategic alliances; and to improve
financial returns.
Our product development efforts in 1996 and early 1997 have been well rewarded, so
that we now have five potential new products or indications in late-stage clinical develop-
ment, with three additional new products or indications about to enter Phase III trials.
Besides the three regulatory clearances for new indications, we filed a regulatory submis-
sion for marketing approval for another new indication for growth hormone—growth
hormone inadequacy in adults. And our partner IDEC Pharmaceuticals filed a regulatory
L e t t e r t o S t o c k h o l d e r s
Arthur D. Levinson, Ph.D.President and Chief Executive Officer
3
submission for marketing clearance for a potential new treatment for non-Hodgkin’s B-cell
lymphoma. The Phase III trials for this C2B8 antibody, which IDEC completed in 1996,
showed a 50 percent response rate in evaluable patients, with minimal toxicity—which is
very promising for the very sick patient population studied. It is especially so when you
consider that it lacks the considerable side effects of traditional chemotherapy (a benefit,
also, of our anti-HER2 antibody for breast cancer, which is in Phase III clinical trials). We
completed Phase II trials of nerve growth factor in patients with diabetic peripheral
neuropathy, with good results, so that we are now preparing for pivotal Phase III trials.
And we are poised to begin Phase III trials of an oral IIb/IIIa antagonist in acute coronary
syndrome. We also moved four new products into clinical development.
In line with our third strategy, we formed important new
strategic alliances in 1996 and early 1997, and made sub-
stantial progress on earlier alliances. Most significantly, our
relationship with our majority stockholder Roche has moved
in several positive directions. First, through an earlier collabo-
rative agreement, Roche began Phase I clinical trials of our
anti-CD18 antibody for the treatment of hemorrhagic shock.
Second, Roche exercised its options (per our 1995
arrangement with Roche) to develop three pipeline products
outside the United States: the C2B8 antibody, insulin-like
growth factor-I, and nerve growth factor. This provided impor-
tant contract revenue to Genentech and serves as tangible
validation for the medical potential of these products on a
global scale.
Third, Roche agreed to have us promote its Roferon-A in the United States for its
approved oncology indications. I am excited about this arrangement for two reasons:
it provides us with an initial product for our growing oncology franchise; and it allows
Genentech to promote yet another product that resulted from Genentech science, as we
licensed patents and know-how for this product to Roche in 1980.
To name just two alliances Genentech has formed with other companies: we agreed with
XOMA Corporation for XOMA to develop Genentech’s anti-CD11a antibody, called hu1124,
for the treatment of psoriasis and organ transplant rejection (XOMA has begun Phase I
clinical trials in the former indication and filed an investigational new drug application
(IND) in the latter); and we agreed with CytoTherapeutics, Inc. to work to develop
treatments for Huntington’s disease, Parkinson’s disease and amyotrophic lateral sclerosis
(ALS) using CytoTherapeutic’s encapsulated cell technology to deliver several of
Genentech’s proprietary growth factors.
“A PROM ISE TO
REMAI N TRU E TO OU R
ENTREPREN EU RIAL
SP I R IT”
4
As expected, our fourth strategy for growth, improve financial returns, had the least visible
results in 1996. Our earnings declined to $118.3 million from $146.4 million in 1995
as a result of strong investment to pursue the promise of our development pipeline.
However, this strategy follows from the success of the first three, and should move into
place over the longer term. Over the short term, earnings are restrained as we invest
aggressively in R&D, which—at $471.1 million—was at a level of almost 50 percent of rev-
enues in 1996, compared to—at $363.0 million—40 percent of revenues in 1995. As
late-stage products progress through the pipeline, our goal is for R&D expenses to decline
in absolute terms. As new products reach the market, revenues should increase. With
the combination of these two factors, as we approach the turn of the century, our goal is
for R&D expenditures to level off at approximately 25 to 30 percent of revenues. And I
anticipate we will realize our fourth strategy. I hope you agree it will have been worth our
aggressive investment in R&D today. Certainly the patients who stand to benefit from our
new medicines would believe so.
As Genentech reached its 20th year, one of our cofounders stepped down to pursue new
interests. Bob Swanson’s retirement as chairman and from the board serves to remind us
how much he has contributed to Genentech, to the biotechnology industry that his and Herb
Boyer’s vision began, and to the many patients who have benefited from our medicines.
Though he has large shoes to fill, eight-year board veteran Dick Munro, our new chairman,
will, I know, do the job admirably. He brings a tremendous wealth of experience as both
a former chief executive officer of Time Warner, Inc. and as a member of the board of
several of America’s premier companies.
I know our success will continue, because the original philosophy for what Genentech
should be continues today. This report is dedicated to those hard-working, jeans-clad
employees who emphasize that philosophy, including those first two, Herb and Bob. It is
also dedicated to all Genentech stockholders. To you we make a promise to remain true
to our entrepreneurial spirit, as we strive to bring both important new medicines to
patients and an attractive return to our investors.
Sincerely,
Arthur D. Levinson, Ph.D.
President and Chief Executive Officer
This letter contains several forward-looking statements relating to future R&D expenses and revenues. The Company’s actualresults may differ materially. For a discussion of the risk factors which may affect future R&D expenditures, please see page 47,“R&D Expenses,” and for a discussion of the risk factors which may affect future revenues, please see page 46, “Total ProductSales” and “Activase Sales,” page 47, “Growth Hormone Sales,” “Pulmozyme Sales,” and “Royalty and Contract Revenues,” andpage 48, “Successful Development of Products,” “Uncertainties Surrounding Proprietary Rights,” and “Market Potential/Risk.”
/s/ Arthur D. Levinson