general agreement on restricted … roughly the same quantities as lasr veer. stimulated by higher...
TRANSCRIPT

GENERAL AGREEMENT ON
TARIFFS AND TRADE
RESTRICTED
IMC/W/62/Add.127 November 1987
Special Distribution
International Meat CouncilSeventeenth Meeting10 and 11 December 1987
SITUATION AND OUTLOOK IN THE INTERNATIONAL MEAT MARKETS
Note by the Secretariat
Addendum
This addendum includes the summary of the bovine meat situation andoutlook in countries not signatories of the Arrangement Regarding BovineMeat, but which provided data to the secretariat and summaries of thesituation and outlook for pigmeat, poultry meat and sheepmeat.
87-1935

IMC/W/62/Add.1Page 2
I. SUMMARY OF THE BOVINE MEAT SITUATION AND OUTLOOK IN CERTAIN COUNTRIESNOT SIGNATORIES OF THE ARRANGEMENT REGARDING BOVINE MEAT
Chile
Revised cattle numbers indicating a 5.2 per cent drop for 1986,showed that the herd liquidation initiated in 1983 continued during 1986.Nevertheless, data for the beginning of 1987 suggest an upturn of 1.1 percent to 3,257,000 head. A similar increase is expected in 1988. Beefproduction is projected at 187,200 tons in 1987, tup by 1.6 per cent, and afurther rise is expected for 1988. Veal production, which declined in 1985and 1986, recovered somewhat in 1987. All the meat produced is consumeddomestically and per capita consumption (around 15.4 kg. in 1987) havingdeclined since 1984, is anticipated to recover as from 1988. Imports offresh, chilled and frozen beef and veal, largely from Argentina, continuedto fall in 1987, down by some 37.4 per cent on year earlier (and by 70 percent on the 1985 level) and are expected to drop further in 1988.
186 Estimates %Change Forecast %Change1986 1987 1987/86 1988 1988/87
Cattle and1oalfnumbers:- 3,222 3,257 +1.1. 3,300 +1.3
21Bovine meat:-
Production 184 187 +1.6 194 +3.9
Consumption 187 189 +1.0 196 +3.7
Imports-/ 2.9 1.8 -37.4 1.5 -16.7
L' 000 tons -3 1'roduct weight
After five ears of herd liquidation, cattle numbers in Moroccoamounted to 2,851,000 head in 1986 (+14 per cent), continuing the herdexpansion initiated in 1.985. Beef and veal production, which fell alongwith cattle numbers, reached 513,241 tons 6.3, up by 14 per cent fromyear earlier. Morocco imports certain quantcices of beef regularly. Inl986 these Imports totalled close to 5,500 tons, Up by 32 per cent. on yearearlier. Morocco also imports significant quantities of live cattle andcalves which, in 1986, reached the record level of 20,770 head, almost fourtimes higher than in 1985. Available data for the first five months of theyear suggest that imTports of both bovine meat and live cattle could risefurther in 1987.
/'000 head
Morocco

IMC/W/62/Add.1Page 3
1984 1985 %Change 1986 %Change1984 1985 1984/85 1986/85
Cattle and calfnumbers:- 2,363 2,501 +5.8 2,851 +14.0
2/Beef and veal:2/
Production 425 480 +12.9 513 +6.9
Imports 5.2 4.4 -15.4 6.0 +36.4
1/,000 head 2/000 tolls
Papua New Guinea
Beef and veal production in 1987 is expected to increase by 11 percent to 2,950 tons. There has also been a rise, albeit slower, in totalbeef and veal consumption (+5.9 per cent), while per capita intakeincreased by 5.3 per cent. Papua New Guinea is far from beingself-sufficient in bovine ineat (in 1987 only some 37 per cent of the meatconsumed was domestically produced) and has been importing on average 10 to12 thousand tons of beef and veal per year over the last decade. It isestimated that in 1987, imports dropped by some 7.2 per cent on yearearlier, reaching 10,950 tons.
1985 1986 %Change Estimates %Change1986/85 1987 1987/86
Cattle and calfnumbers: ... ...
Beef and veal:-/
Production 2.2 2.7 +22.7 3.0 +11.1
Consumption 6.9 7.5 +8.7 7.9 +5.3
Imports 16.0 11.8 -26.3 11.0 -6.8
1/ 000 tons
IMC/W/62/Add.1Page 4
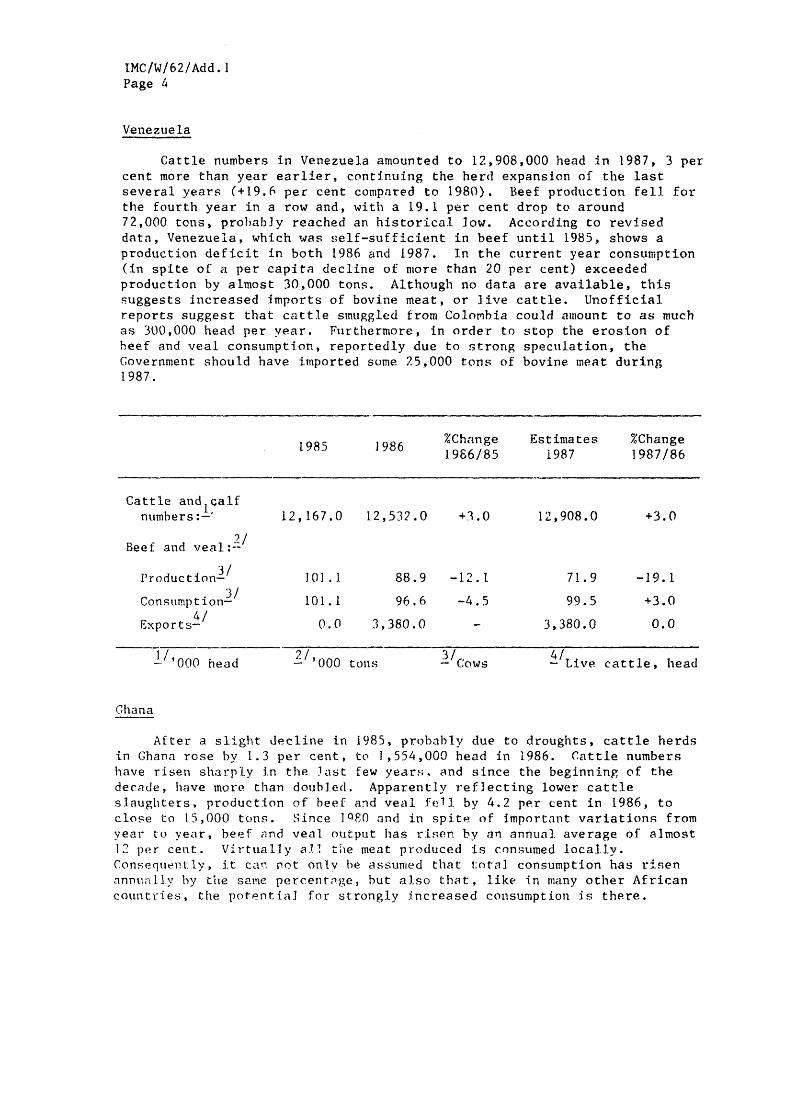
Venezuela
Cattle numbers in Venezuela amounted to 12,908,000 head in 1987, 3 per
cent more than year earlier, continuing the herd expansion of the lastseveral years (+19.6 per cent compared to 1980). Beef production fell forthe fourth year in a row and, with a 19.1 per cent drop to around72,000 tons, probably reached an historical low. According to reviseddata, Venezuela, which was self-sufficient in beef until 1985, shows a
production deficit in both 1986 and 1987. In the current year consumption(in spite of a per capita decline of more than 20 per cent) exceededproduction by almost 30,000 tons. Although no data are available, thissuggests increased imports of bovine meat, or live cattle. Unofficialreports suggest that cattle smuggled from Colombia could amount to as muchas 300,000 head per vear. Furthermore, in order to stop the erosion ofbeef and veal consumption, reportedly due to strong speculation, theGovernment should have imported some 25,000 tons of bovine meat during1987.
1985 1986 %Change Estimates %Change1985 1986 1986/85 1987 1987/86
Cattle and cQalfnumbers:-' 12,167.0 12,532.0 +3.0 12,908.0 +3.0
9/Beef and veal:-
Production-i 10].1 88.9 -12.1 71.9 -19.1
Consumption3/ 101.1 96.6 -4.5 99.5 +3.0
Exports4/ 0.0 3,380.0 - 3,380.0 0.0
I '000head 2/, ~~3/ 4/--/onohead 2O-0 ton.s Cows - Live cattle, head
Ghana
After a slight decline in 1985, probably due to droughts, cattle herdsin Ghana rose by 1.3 per cent, to 1,554,000 head in 1986. Cattle numbershave risen sharply in the last few years. and since the beginning of thedecade, have more than doubled. Apparently reflecting lower cattleslaughters, production of beef and veal fell by 4.2 per cent in 1986, toclose to 15,000 tons. Since IQPO and in spite of important variations fromyear to year, beef and veal output has risen by an annual. average of almost12 per cent. Virtually ail the meat produced is consumed locally.Consequeitly, i.t can. not onlv he assumed that total consumption has risenannually by the same percentr-ge, but also that, like in many other Africancountries, the potential for strongly increased consumption is there.

IMC/W/62/Add.1Page 5
Indeed, it can be estimated that per capita consumption of beef and vealscarcely exceeds 1 kg. Ghana has imported 1,000 to 1,600 live animals peryear over the last four to five years, and declining quantities of bovinemeat (around 5,000 tons in 1982 and no more than some 90 tons in 1984). In1986 there were no imports at all. (Ghana reports surprisingly high bovinemeat stock levels which would have averaged more than 200,000 tons in thelast few years and would be as high as 248,000 tons in 1986. Taking intoaccount production, consumption and trade levels, this appears to be astatistical error).
1984; 1985 %Change 1986 %Change1984 1985 ~1985/84 1986/85
Cattle and1oalfnumbers:- 1,543.0 1,533.6 -0.6 1,554.0 1.3
2/Beef and veal:-
Production 14,344.0 15,300.0 6.7 14,663.0 -4.2
Consumption 14,344.0 15,300.0 6.7 14,663.0 -4.2
Imports 88.7 0.0 -100.0 0.0 0.0
2/,000 tons- 000 head

IMC/W/62/Add. 1Page 6
II. SITUATION AND) OUTLOOK IN THE INTERNATIONAL PIGMEAT SECTOR
Estimates by the secretariat suggest that world production of pigmeat,after rising by more than earlier expected last year (+3 per cent), hasfallen by around 1 per cent in 1987 to some 56,200 tons. This was by andlarge due to an estimated 6 per cent drop in the production of the world'slargest producer of pigmeat: China. At close to 17 million tons, roughly30 per cent of the world's total output, Chinese production was about1 million tons below last year's level. The reasons for this decline werebasically feedgrain shortages (partly provoked by strong corn exports) andconsequently strongly increased prices (reportedly, 70 per cent offeedgrains are now sold on the free market, at higher prices than thoseoffered by the Government). As a result, an increasing number of farmerswould be shifting from pig to more profitable cattle or sheep raising. Pignumbers fell and sow slaughter increased markedly from the end of last yearup to, and during, recent months. However, official reports indicate thatsow slaughter is easing and measures introduced by the Government areexpected to alleviate the pressure on feedgrain prices. Chinese output ofpigmeat is thus projected to recover as from next year.
In 1987, and with the possible exception of the USSR (fourth worldproducer with an estimated 5,850 million tons, or 10 per cent of the worldtotal), production has increased in virtually all other major producingcountries or areas. In the European Community, the world's second producerwith a 22 per cent share, it should show a 1.4 per cent rise, to12,320,000 tons. In the United States (third world producer with an 11 percent share) it grew to 6,420,000 tons (+0.7 per cent) and in Japan by anestimated 1.6 per cent, to 1,575 million tons. The reason for theseincreases has generally been lower production costs provoked by lowfeedgrain prices. With practically all. these countries projecting higherproduction levels and the above-mentioned increase in China, the world'spigmeat output should rise by 4-5 per cent, to some 58,600 million tons in1988.
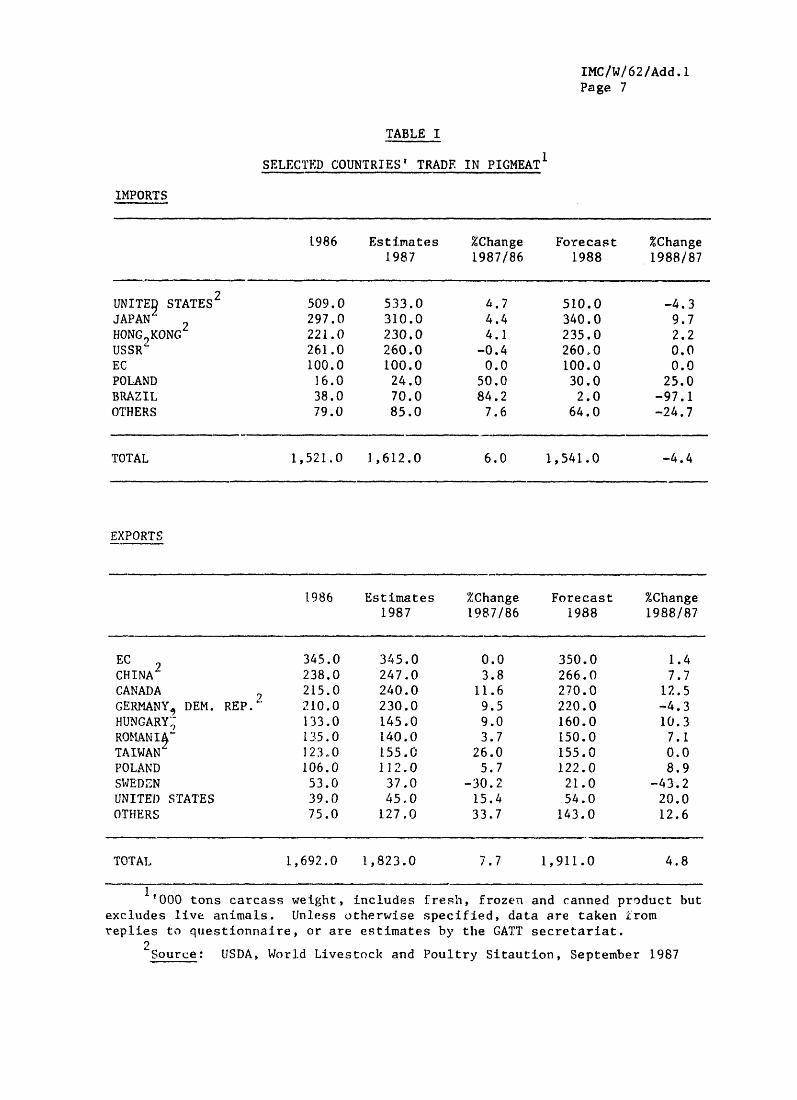
World trade of pigment, which represents only some 3 per cent ofproduction, seems to have risen by some 7-8 per cent in 1987. Worldexports would have ttalled slightly more than 1.800 million tons and therise was essentially due to higher exports hy a number of eastern Europeancountries (D)emocratic Republic of Germany, Poland and Romania), Yugoslavi.aand Taiwan. Exports were also up in Canada, while the EC, which introducedstorage aid last January, andl is faced with increasing stocks, should haveexported roughly the same quantities as lasr veer. Stimulated by higherconsulmMPtion, especially in Japan, imports are estimated to have risen inthe Uni ted States, Japnn and Hong Kong by 4-5 per cent, while they shouldhave remained stable in the TUSSR. The projected production rise for 1988should occur not only in some inajor exporting countries, but also in somemajor importing ones. (onseqL[Cntlytr, it can he expected that next. year,internationally trade i.n pigmneat willS1hrink and will be faced with stronglyincreased competition.
IMC/W/62/Add.1Page 7
TABLE I
SELECTED COUNTRIES' TRADE IN PIGMEAT'
IMPORTS
1986 Estimates %Change Forecast %Change1987 1987/86 1988 1988/87
2UNITES STATES 509.0 533.0 4.7 510.0 -4.3JAPAN 2 297.0 310.0 4.4 340.0 9.7HONG KONG 221.0 230.0 4.1 235.0 2.2USSR' 261.0 260.0 -0.4 260,0 0.0EC 100.0 100.0 0.0 100.0 0.0POLAND 16.0 24.0 50.0 30.0 25.0BRAZIL 38.0 70.0 84.2 2.0 -97.1OTHERS 79.0 85.0 7.6 64.0 -24.7
TOTAL 1,521.0 1,612.0 6.0 1,541.0 -4.4
EXPORTS
1986 Estimates %Change Forecast %Change1987 1987/86 1988 1988/87
EC 2 345.0 345.0 0.0 350.0 1.4CHINA 238.0 247.0 3.8 266.0 7.7CANADA ? 215.0 240.0 11.6 270.0 12.5GERMANY, DEM. REP. 210.0 230.0 9.5 220.0 -4.3HUNGARY'- 133.0 145.0 9.0 160.0 10.3ROMtANIf 135.0 140.0 3.7 150.0 7.1TAIWAN 123.0 155.0 26.0 155.0 0.0POLAND 106.0 112.0 5.7 122.0 8.9SWEDEN 53.0 37.0 -30.2 21.0 -43.2UNITED STATES 39.0 45.0 15.4 54.0 20.0OTHERS 75.0 127.0 33.7 143.0 12.6
TOTAL 1,692.0 1,823.0 7.7 1,911.0 4.8
'000 tons carcass weight, includes fresh, frozen and canned product butexcludes live animals. Unless otherwise specified, data are taken fromreplies to questionnaire, or are estimates by the GATT secretariat.
2Source: USDA, World Livestock and Poultry Sitaution, September 1987

IMC/W/62/Add.1Page 8
III. SITUATION AND OUTLOOK IN THE INTERNATIONAL POULTRY MEAT SECTOR
Boosted by low feedgrain prices (especially over the last few years),increased demand and a well integrated industry in a rising number ofcountries, world production of poultry meat has risen by around 30 per centsince the beginning of the decade. In 1987, and compared to a year ago, theincrease c:an be estimated at around 6 per cent, to slightly more than29 million tons. This is the strongest rate of increase of the last fewyears, and (although once again it reflects higher production for mostcountries for which data are available) was largely due to a 10 per cent risein the United States. By far the world's leading producer of poultry meat(around 30 per cent of world production), this country produced more than9 million. tons of poultry meat in 1987. With production costs sharply down,largely due to depressed feedgrain prices, lower beef supplies and anexpanding demand for poultry meat, conditions are set for output to continueto rise. Indeed, consumption is expected to increase by almost 9 per cent,to more than 8.5 million tons, reflecting not only low retail prices, butalso the supply of a large variety of products. Although prices continue tos. 4- dodn, and profitabili;tv margins shrink, there still seems to be roomfor her production rises and indeed, current estimates suggest a 5 percent Increase for 1988.
In tile European Community, the world's second largest producer ofpoultry meat with a .20 per cent share, poultry meat production was expectedto increase by 1.3 per cent (to 5,550,000 tons), a lower rate of increasethan vear earlier. However, following higher than expected placings ofbroiler chicks, production of broilers in the first eight months of the yearis estimated to have risen by close to 7 per cent. As a result, totalpoultry meat output should increase by significantly more than expected. Asin the United States (and indeed in many other countries), production costsare down and, even though prices are depressed, they are still profitable andsupported by strong and rising demand. While the o1utput growth in the USSRis estimated to have accelerated (+7 per cent, to 3.1] million tons), inBrazil and as in 1986, production was boosted by strong domestic demandresulting from the low availabilities of red meat. The increase is estimatedat 13 per cent, to 1,920, 00( tons.
World trade of poultry meat is estimated to have expanded markedly in1987. Exports may have been around 1.4 million tons, 8 per cent more thanlast year. The United States alone accounted for some 85 per cent of theincrease (up by 90,0()0 tons on last year), largely as a result of theExport Enhancement Programme (IIFPl). ITlhe EE1P foer poultry meat is targetedat Egypt, the Canary Tslands, Iraq and the Dominican Islands, and thequantity available under the progr-Imme for export to these countries is,for trhe 1986/1t(88 fiscal years, 1.40,500 tolls. Apart from Hungary andRomania, both reported to have raised their exports, the two other majorworld exporters have seen their sales abroad decl ine.
See also1z 2ge12 , paragraph 35. of IMC/W/62

IMC/W/62/Add.1Page 9
The European Community, world export leader for many years, projecteda drop in exports of almost 3 per cent to an estimated 320,000 tons in thecurrent year. Even if this projection appears now somewhat outdated andexports to the Middle East (where the Community retains the largest marketshare) may show some increase by the year end, total exports are stillexpected to fall. In 1987, the United States probably became the first worldexporter of poultry meat. Reflecting strong domestic demand, Brazilianexports are estimated to fall by 2.5 per cent. In order to overcome thisshortage of export availabilities, the authorities implemented a feedgrainprice support for the production of poultry meat aimed at the export markets.Thailand has emerged as a major exporting country in recent years and, withmore than 90,000 tons sold this year, should rank fifth world exporter. Itsmajor market is Japan.
Import demand continued to decline in the Middle Fast (the increase intotal imports there is solely due to the United States sales to Irak underthe EEP), and especially in Saudi Arabia where a 25 per cent drop in importsis expected. Poultry meat output, supported by strongly growing demand, hasrisen steadily ir these countries in the last few years as the result ofefforts to increase self-sufficiency. However, some sources suggest thatconsumption of poultry meat is now reaching its saturation level in most ofthis region s countries. Without a doubt, the best market opportunitiesdeveloped during 1987 were in the region of Asia. Japanese imports (whichaccounted for more than 80 per cent of the region's import rise) went up by15 per cent, due to sharply increased consumption and a strong yen. ImportsHy other countries, such as Hong Kong were also higher. At this stage, it isdifficult to make projections for the short to medium term. However, poultrymeat trade is expected to decline somewhat in 1988.

IMC/W/62/Add. 1Page 10
TABLE II
SELECTED COUNTRIES' TRADE IN POULTRY MEAT'
IMPORTS
1986 Estimates %Change Forecast %Change1987 1987/86 1988 1988/87
MIDDE EAST2 249.0 270.0 8.4 225.0 -16.7USSR 2 175.0 155.0 -11.& 1';50.0 -3.2HONG KONG 123.0 128.0 4.1 130.0 1.6JAPAN9 175.0 201.0 14,9 206.0 2.5EGYPT 50.0 65.0 30.0 85.0 30.8EC 72.,0 80.0 11.1 77.0 -3.8OTHERS 147.0 151.0 2.7 137.0 -9.3
TOTAL 991.0 1,050.0 6.0 1,010.0 -3.8
EXPORTS
1986 Estimates 0Chalnge Forecast %Change1.987 1987/86 1.988 1988/87
UNITED STATES2ECBRAZIL 9HUNGARY'THAILANLIROMAN JA'3ULGARIAOTHERS
TOTAL
1,000 tons, re cv--tOw-c(:)) abasis. Unless otherwise specified, data are
taken from replies to questionnaire, or are estim ates by the (ATTsecretariat.
2Source: USDA, World livestock and Poultry Situation. September 1987.
276 .0329. 0236.(0181.076.060.029.0109.0
365.0320.0230.0210.091 .0-O.020.094.(0
32.2-2 .7-2 . 516.019.716.7
-31.0-1 3. 8
318.0310.0250. 0210.0100.080.020.0
105 . 0
-12. 9-3. 18.70.09.9
14.30.011.7
8.0 1, 393.0 -0. 5I , 1996.0 1 II-0O. 0

IMC/W/62/Add. 1Page 11
TV. SITUATION AND OUTLOOK IN THE INTERNATIONAL SHFEPMEAT SECTOR
Depending on the sources, worldJ production of sheepmeat is estimated ataround 5.4 to 6.2 million tons annually. Available data suggest a productionlevel of 5,470,000 tons for 1987, us by some 1 per cent from year earlier.This was by and large due to a 7-8 per cent rise (to 940,000 tons) in theEuropean Community wnich, when Spain and Portugal joined, became the firstworld producer of sheepmeat, followed by the USSR. In New Zealand, theworld's leading exporter of sheepmeat (more than 50 per cent of world trade),production fell by 1.2 per cent in the season ending last September. Muttonproduction increased sharply (24.4 per cent) reflecting the carry-overprovoked by the 1986 strikes, but lamb output fell by almost 13 per cent dueto low producer prices and strongly reduced carcass weights. In the currentseason, however, lamb production is recovering, while that of mutton shoulddecline. Overall sheepmeat production is expected to go up by close to1 per cent. In Australia, the sheep industry profitability continues toexpand as a consequence of rising prices for wool, skins and meat. In the1986/87 season, sheepmeat output followed the same trends as in New Zealandand rose by 1 per cent. Mutton production rose by 12 per cent, while thatof lamb fell by 8 per cerit. In the current season, mutton output isprojected to decline by 7/ per cent reflecting flock expansion, while lambproduction is expected to rise by 5 per cent.
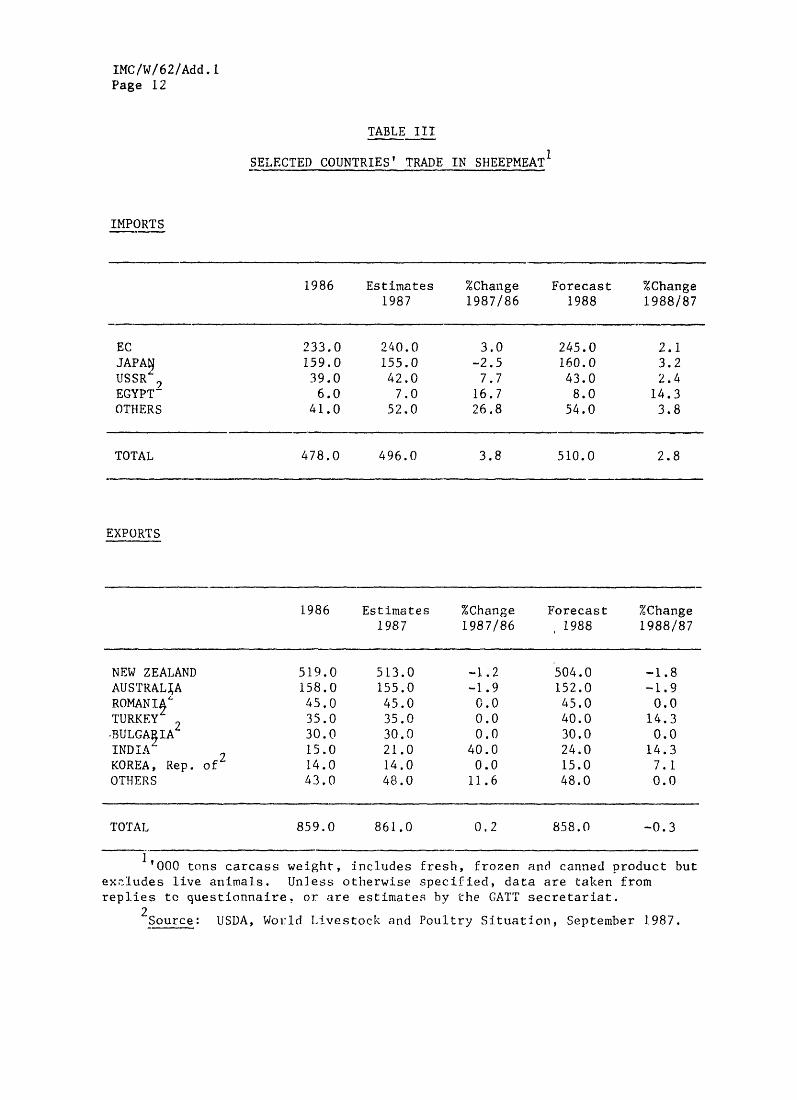
Provoked by the strikes of early in the year and the withdrawal ofsupport schemes, New Zealand exports of sheepmeat feil by 11 per cent in1986, to 519,000 tons. In the current year, and although there has been areturn to more normal conditions, exports may still have fallen by around1 per cent. Australian sheepmeat exports rose by 35 per cent to 158,000 tonsin 1986, benefiting from the difficult supply situation in New Zealand.During the first eight months of 1987, exports fell by 0.7 per cent, and areestimated to fall by 2 per cent by the year end. Although not muchinformation is availbble, market conditions reportedly remain interesting dueto strong import demand in the Middle East, Japan and North America, but thiswill probably not impede exports by both countries from declining further in1988.
IMC/W/62/Add.1Page 12
TABLE III
SELECTED COUNTRIES' TRADE IN SHEEPMEATI
IMPORTS
1986 Estimates %Change Forecast %Change1987 1987/86 1988 1988/87
EC 233.0 240.0 3.0 245.0 2.1JAPAN 159.0 155.0 -2.5 160.0 3.2USSR' 39.0 42.0 7.7 43.0 2.4EGYPT 6.0 7.0 16.7 8.0 14.3OTHERS 41.0 52.0 26.8 54.0 3.8
TOTAL 478.0 496.0 3.8 510.0 2.8
EXPORTS
1986 Estimates %Change Forecast %Change1987 1987/86 1988 1988/87
NEW ZEALAND 519.0 513.0 -1.2 504.0 -1.8AUSTRALIA 158.0 155.0 -1.9 152.0 -1.9ROMANIA- 45.0 45.0 0.0 45.0 0.0TURKEY 2 35.0 35.0 0.0 40.0 14.3-BULGA IA 30.0 30.0 0.0 30.0 0.0INDIA 2 15.0 21.0 40.0 24.0 14.3KOREA, Rep. of 14.0 14.0 0.0 15.0 7.1OTHERS 43.0 48.0 11.6 48.0 0.0
TOTAL 859.0 861.0 0.2 858.0 -0.3
1'000 tons carcassexziudes live animals.
weight, includesUnless otherwise
fresh, frozen and canned product butspecified, data are taken from
replies to questionnaire. or are estimates by che GATT secretariat.
Source: USDA, World livestock and Poultry Situation, September 1987.